
Submitted:
19 November 2025
Posted:
20 November 2025
You are already at the latest version
Abstract
Conventional weather station data often fails to capture the microclimatic variability within plant tissues, which strongly influences crop physiology and disease dynamics. This study characterized the thermal dynamics of xylem and soil-root interface in almond and olive orchards under Mediterranea field conditions in Southern Spain. Twenty-seven thermocouples were embedded at 1- and 4-cm depths within branch and trunk xylem tissues of three trees per species, and four sensors were placed at 20-cm depth in sunlit and shaded soil-root interface. Empirical regression models were developed to quantify the relationships between air temperature with those recorded within xylem and soil-root interface, accounting for seasonal, sensor and tree positional effects. Significant differences were detected between air and those recorded within xylem tissues and the soil-root system. Branch xylem temperatures closely tracked air temperatures, whereas trunk and soil-root temperatures were significantly lower than air temperature during spring and summer, but higher during autumn and winter. These results demonstrate a marked buffering effect of both woody tissues and the soil-root system against external thermal extremes. Such thermal buffering likely provides a more favorable environment for the survival, infection or overwintering of vascular pathogens under Mediterranean conditions. Understanding these internal thermal dynamics is therefore crucial for improving epidemiological models and risk assessments of vascular diseases affecting woody crops.
Keywords:
crop modelling
; epidemiology
; xylem tissues
; risk assessment
; Mediterranean crops
1. Introduction
Olive (Olea europaea L.) and almond (Prunus dulcis L.) are two of the most representative tree crops in the Mediterranean Basin, covering 9.91 million and 482,212 hectares, respectively [1]. Spain leads in their acreage within this region. Beyond their economic, cultural and social relevance, olive and almond orchards play crucial roles in maintaining the integrity of Mediterranean ecosystems and rural landscapes [2]. Both tree species share similar structural traits (perennial woody crops with deep roots and high xylem conductance) and are affected by similar vascular pathogens, making them ideal models for comparative thermal studies.
Crops are exposed to several abiotic and biotic stresses that can significantly reduce and limit their productivity [3]. Among the primary abiotic environmental factors impacting plant growth there are light, water, carbon dioxide, oxygen, soil nutrient content and availability, heavy metals, salts, and temperature [4]. Any deviations from optimal conditions in these abiotic factors can lead to adverse biochemical and physiological effects on plants, ultimately affecting their growth and development [3,4]. Among these factors, temperature is particularly relevant because it directly modulates physiological activity and pathogen development in time scales from hours to season.
Temperature is a critical factor that affects plant developmental rates [5] and contributes to the shaping of metabolic processes [6,7], the transport of water and photosynthates [8,9] and the transition from vegetative to reproductive states. For olive and almond trees, which are crops well-adapted to arid conditions, air temperature is a determinant factor that affects critical processes such as flowering and pollen release, ultimately impacting quantity and quality of crop yields [10]. The determinant effect of air temperature on crop development is expected to significantly alter plant phenostages in the context of anticipated climate change, in particular in the Mediterranean region [11]. However, despite the central role of air temperature in phenological models, little is known about the actual temperatures experienced inside olive and almond tissues throughout the year.
Soil temperature also plays a pivotal role in diverse plant growth and development processes, including root growth and distribution, nutrient uptake, root respiration, and microbial activity, among others. Variations in soil temperature, which is correlated with soil moisture [12], significantly contribute to the energy balance of crops, functioning as a heat reservoir that stores heat during the day and releases it during the night. Similar energy exchange patterns occur on an annual basis, collectively determining soil temperature dynamics [4]. These soil thermal regimes are also relevant for soilborne pathogens and root infections, as temperature governs microbial activity and pathogen persistence near the root zone [12].
Air temperature measurements are widely used in phenology and crop modelling [13]. However, relying solely on air temperature data from conventional weather stations may introduce biases and uncertainties in predicting plant development [14], given that such data may not precisely reflect the heat distribution within the plant tissues [15]. Thus, temperature patterns in xylem tissues, particularly in woody plants, can markedly differ from the standard recorded air temperature [6,16]. These differences are mainly attributed to the continuous energy flux among and within trees and their surrounding soil [4]. Various environmental factors, such as air temperature, humidity, wind speed and solar radiation, have been shown to influence various thermal properties of trees and soil, including specific heat thermal conductivity, thermal diffusivity and thermal admittance [17,18]. These factors directly impact the internal temperature of the above and belowground plant tissues, including xylem tissues. Moreover, standard meteorological sensors are positioned at 1.5–2 m above ground and outside the canopy, which further limits their representativeness of internal microclimatic conditions within tree structures.
Accurate measurement and characterization of tree temperature is crucial for understanding the physiological and ecological processes occurring within tree canopies and xylem tissues [8,13]. The use of thermocouples offers precise and reliable field temperature measurements [19]. These sensors can be manufactured in very small sizes, enabling the capture of real-time temperature data at exact points with minimum disruption of the medium, thus providing valuable insights into tree thermal dynamics [20]. However, the use of thermocouples embedded in specific plant tissues under field conditions remains relatively uncommon. Previous studies have primarily focused on the physiological responses of conifers and angiosperms during winter periods and freeze–thaw events [21], behavior studies of insects [22], and the heat insulation capacity of bark from tree forests [23]. The use of thermocouples has been reported in only one woody crop species, Peña Quiñones et al. [15,24] that measured daytime temperatures within xylem tissues in grapevines at various trunk heights.
Apart from its direct influence on tree physiology and ecology, air temperature is a key factor influencing the activity of soil- and plant-associated microorganisms, including plant pathogens [25]. Air temperature has been shown to critically influence the development of vascular plant diseases [26,27,28]. For example, for vascular plant pathogens such as the bacterium Xylella fastidiosa and the soilborne fungus Verticillium dahliae the temperature within xylem tissues and soil may play a pivotal role in their survival, growth and colonization of the host plant [29,30]. Experimental studies indicate that X. fastidiosa survives between approximately 10 °C and 34 °C, with optimal growth around 28–32 °C [29], whereas V. dahliae colonization is most active at 20–25 °C but declines above 25–28 °C [30]. Moreover, soil and root temperatures are critical for these pathogens as some of them can migrate to the roots and overwinter in the soil-root system [31], ensuring their survival for subsequent seasons.
The primary objective of this study was to investigate the daily and seasonal temperature dynamics within the xylem tissues and root-soil interface of olive and almond trees under Mediterranean climate conditions. The secondary objective aimed to characterize how these temperature variations were influenced by factors such as the type of plant tissue (trunk versus branches), depth of the xylem tissue within the trunk, and the tree orientation and location within the orchard. We hypothesized that internal trunk and soil–root temperatures would exhibit thermal buffering relative to air temperature, with the magnitude of this buffering varying seasonally and by tissue depth. Our results highlight the importance of incorporating the thermal dynamics of xylem and soil-root interface of woody crops into the development of more accurate epidemiological models and risk assessment of diseases caused by vascular plant pathogens. To our knowledge, this is the first multi-year study to continuously monitor xylem and soil–root temperatures in field-grown Mediterranean woody crops.
2. Materials and Methods
2.1. Study Site
The study was carried out in two experimental olive and almond orchards located at the Alameda del Obispo experimental farm in Córdoba, Spain (37°51’37.4”N 4°47’47.0”W at 96 m of elevation), close to the Guadalquivir River (Figure 1a), which soils are classified as typical Xerofluvent with a sandy loam texture. The Region experiences a typical Mediterranean climate, with an average annual rainfall of approximately 600 mm, primarily during the autumn and spring seasons. The average annual evapotranspiration (ET0) is 1390 mm [32].
For the study, 14-year-old olive trees of cv. Picual and 10-year-old almond trees of cv. Marinada were selected. The trees ranged in height from 3 to 3.5 m, with trunk diameters of 8 to 10 cm, and were spaced at 4 × 2 m intervals for olive (Figure 1b), and at 5 x 4 m for almond (Figure 1c). The mean canopy cover was 58.4 ± 2.47% in the olive orchard and 70.7 ± 3.86% in the almond orchard. A drip irrigation system was implemented, featuring a single drip line per row with emitters spaced at 2 m intervals, each discharging 4 l h–1. Irrigation was applied only during the warm season, with an annual water supply of 308 mm and 500 mm, for olive and almond trees, respectively. Cover fertilization was performed at beginning of spring using a commercial fertilizer (N-P-K ratio of 20-5-10; Nitrophoska, Eurochem, Zug, Switzerland) following standard farming practices.
2.2. Temperature Measurements
Temperature within the xylem tissue was measured using thermocouples, with 18 installed in olive trees (six per tree), and nine in almond trees (three per tree). Sensors were placed in three trees per orchard, one at the southern border, one at the northern border, and one in the center of the orchard surrounded by other trees (Figure 1b,c). The temperature probes were manufactured at IAS-CSIC, using measurement grade type-K wire (Omega Engineering, Inc., Norwalk, CT, USA). The junctions were embedded into a 2-mm diameter stainless steel tubes, filled with thermal conductive paste, and tightly placed at the required depth in holes drilled in the xylem after disinfection with ethanol. To avoid conductive thermal drifts from the effect of direct radiation over the external cable, the first 50 cm cable near the probe was wrapped in aluminum foil, and the first 15 cm protruding from the insertion point were protected with a cap made of thermal insulation foam and aluminum foil (15-mm thick). The probes were left undisturbed during the experiment, and the insertion point was periodically checked for tissue reaction (which never appeared).
In each olive tree, sensors were oriented to the south and north and placed in various positions in the tree: within main branches, with a diameter range of about 4- to 5-cm at a height of 1.5 m and at a depth of 1 cm, and within the trunk at a height of 80 cm and at depths of 1 cm and 4 cm (Figure 1d,e). For almond trees, sensors were installed only in a branch-oriented south at depths of 1 cm, and in the trunk at depths of 1 cm and 4 cm, oriented to the north and south, respectively (Figure 1d,e).
In each orchard, one thermocouple was installed in a standard radiation shield, placed between the rows, at 1.5 m height to measure air temperature (Tair), and two thermocouples were buried at a depth of 20 cm to measure soil temperature, one in a sunny area and the other in a shaded area (Figure 1d). The area where the soil sensors were installed was cleared of adventitious plants, leaving the soil bare during the duration of the experiment. In preliminary experiments, we probed that temperatures recorded by thermocouples located in the soil at 20-cm in close proximity to the roots of olive or almond trees and inside root tissue of both tree species registered not significantly different (P≥0.05) daily temperatures (Supplementary Figure S1). Due to the difficulty in installing the thermocouples inside the roots we opted for locating the thermocouples in the soil in close proximity to the roots, assuming that the temperature recorded could be extrapolated to root temperatures (Supplementary Figure S1). All sensors were connected via multiplexer (model AM16/32, Campbell Scientific Inc., Logan, Utah, USA) to a data logger (model CR1000, Campbell Scientific Inc., Logan, Utah, USA), with temperature measurements recorded at 10-min intervals. Temperature data collection spanned two and a half years from December 2017 to June 2020 for the olive orchard and just over a year from February 2018 to March 2019 for the almond orchard. At the end of the experiment just over 133,000 measurements were obtained from each sensor for the olive trees, and nearly 55,000 for the almond trees.
2.3. Data Analyses
Ten-minute temperature time series were collected for each sensor, and the dataset was partitioned according to meteorological seasons [33]; namely winter (from December to February), spring (from March to May), summer (from June to August), and autumn (from September to November). Each tree served as an experimental unit. Maximum and minimum temperature values were extracted for each sensor on an hourly, daily and monthly basis and were used for statistical analyses.
Temporal dynamics of minimum and maximum monthly temperatures: The variation in temperature during the experimental period for each sensor was characterized based on the monthly average of minimum and maximum temperatures. For each month, data was analyzed using a standard one-way analysis of variance (ANOVA) with sensor position and orientation in the tree or soil as main factor. Pairwise comparisons of means among the main factor levels were performed using the post hoc Tukey’s honestly significant difference (HSD) test, at P<0.05.
Temporal dynamics of minimum and maximum daily temperatures: The variation of temperature over the 24-h profile for each sensor was assessed based on the monthly average of daily minimum and maximum temperatures. We conducted one-way ANOVA for each individual one-hour period with sensor position and orientation in the tree or soil as the main factor. Differences between sensor positions and orientations were evaluated using pre-hoc one-degree-of-freedom contrasts. To account for multiple comparisons, a Sidak correction was applied to adjust the P-value based on the number of contrasts performed at P<0.001.
Relationships between xylem tissues and soil-root system temperatures and air temperatures: Linear models were fitted to determine the relationships between sensor-recorded temperatures and air temperatures with season, sensor type and their interaction as covariates. Least-squares means (also known as marginal means) were estimated to interpret the main effects of these covariates on the relationship between sensor-recorded temperatures and air temperatures. Differences among sensor types and seasons were determined using the HSD post-hoc test at P<0.05 with Sidak correction.
3. Results
3.1. Temporal Dynamics of Sensor Monthly Average Temperature and Its Relationship with Air Temperature
Supplementary Figure S2 illustrates the daily temporal dynamics of minimum and maximum temperatures recorded by 31 sensors located in the olive (Supplementary Figure S2a,b) and almond orchards (Supplementary Figure S2c,d). Both crops showed similar temporal patterns despite variations in temperature reading from the air, trees and soil. In general, these variations were more pronounced at maximum temperatures, regardless of the sensor position (i.e., air, trunk, branches or soil) or the time of day, particularly during the summer months when peak air maximum temperatures occurred. Soil temperatures were higher than air temperatures during periods of minimum air temperature but fell below air temperatures during periods of maximum air temperature (Supplementary Figure S2c,d).
3.1.1. Air Temperatures
No significant differences existed between the average monthly minimum (F=2.82, P=0.09) and maximum (F=0.32, P=0.57) Tair in the olive and almond orchards (Table 1). In the olive orchard, the minimum Tair ranged from 3.2±0.36 in January to 19.6±0.22 °C in August. Similarly, in the almond orchard it ranged from 3.8±0.59 to 19.9±0.27 °C during the same months. The coldest period, characterized by average minimum Tair below 11 °C, spanned from November to April, with Tair ranging from 3.2±0.36 to 9.8±0.29 °C in the olive orchard, and from 3.8±0.59 to 10.5±0.58 °C in the almond orchard (Table 1). Minimum Tair typically occurred between 00:00 and 8:00 solar time from October to March, and between 00:00 and 07:00 from April to September, often reaching its lowest values around 07:00 and 06:00, respectively (Figure 2). In general, the absolute minimum Tair stayed above 0 °C, with a few exceptions noted during the winter (14 days in the olive orchard and 1 day in the almond orchard) (Supplementary Figure S2a,c). Freezing Tair was mainly recorded between 00:00 and 08:00 solar time, with Tair rising above 0 °C as the day progressed.
In both orchards, the maximum Tair varied seasonally (Table 1), ranging from 15.1±0.25 in January to 39.2±0.32 °C in August in the olive orchard, and from 17.4±0.33 to 37.0±0.44 °C in the almond orchard during the same period. The warmest period, with average maximum Tair above 23.5 °C, lasted from May to October (olive: 26.7±0.75 to 39.2±0.32 °C; almond: 23.8±1.01 to 37.0±0.44 °C) (Table 1). The highest monthly average maximum Tair was typically recorded between 10:00 and 17:00 from October to March, and between 09:00 and 19:00 from May to September (Figure 3).
3.1.2. Xylem Temperatures
The extremes, i.e., minimum and maximum average monthly minimum temperatures, in xylem tissue for branches and trunks were recorded in January and August, respectively (Table 1). For olive trees these temperatures ranged from 3.0±0.36 to 19.3±0.22 °C for branches and from 3.6±0.35 to 21.4±0.20 °C for trunks; whereas in almond trees they ranged from 3.1±0.60 to 19.7±0.27 °C in branches and from 3.7±0.65 to 21.5±0.27 °C in trunks (Table 1). During the coldest period, average monthly minimum temperatures for olive trees ranged from 3.0±0.36 to 9.5±0.29 °C for branches and 3.6±0.35 °C to 10.6±0.29 °C for trunks. For almond trees they ranged from 3.1±0.60 °C to 10.3±0.59 °C in branches and 3.7±0.65 to 11.0±0.60 °C in trunks (Table 1).
In both crops, the average monthly minimum temperatures recorded in branches did not differ significantly (P≥0.05) with Tair throughout the year (Table 1), averaging 0.2 to 0.4 °C higher than Tair in olive and 0.2 to 0.7 °C in almond trees, regardless of sensor orientation. For trunk sensors no significant differences (P≥0.05) were observed in minimum temperatures between sensor orientations and depths in both crops during the coldest period (Table 1). However, during the warmest months and specifically from May to August, trunk minimum temperatures were consistently higher (P<0.05) than Tair, averaging 1.0 to 1.9 °C higher in olive and 0.8 to 1.5 °C in almond trees, with no effect of sensor depth or orientation (Table 1). These results were consistent when comparing hourly temperature values, except from 00:00 to 09:00 when absolute minimum temperatures typically occurred (Figure 2).
In olive trees, extreme average monthly maximum temperatures for branches and trunks occurred in January and August and ranged from 17.6±0.32 to 42.3±0.35 °C and 14.6±0.29 to 35.9±0.16 °C, respectively (Table 1). In almond trees, these ranges were 20.0±0.39 to 37.3±0.29 °C for branches and 20.2±0.61 °C to 33.5±0.17 °C for trunks, for same period (Table 1). During the warmest period (May to October), average monthly maximum temperature ranges were from 28.5±0.78 to 42.3±0.35 °C for branches and from 24.0±0.55 to 35.9±0.16 °C for trunks in olive trees, and from 26.0±1.12 to 37.3±0.29 °C for branches and from 23.4±0.74 to 33.5±0.17 °C for trunks in almond trees (Table 1).
In olive trees, the monthly average maximum temperatures in branches were consistently higher (P<0.05) than Tair throughout the year, averaging an increase of 2.6 (1.8 to 4.2 °C) and 2.8 °C (2.3 to 3.1 °C) for North and South orientations, respectively, with no effect (P≥0.05) of sensor orientation (Table 1). In almond trees, branch temperatures were higher (P<0.05) compared to Tair in all months except summer (June to August), with increases of 1.2 to 2.8 °C from September to May (Table 1).
Conversely, trunk temperatures in olive trees were consistently lower (P<0.05) than Tair, with an average difference of 0.8 to 3.1 °C, depending on sensor orientation and depth (Table 1). For almond trees, this pattern was observed only during spring and summer, with a decrease in temperature of 2.2 °C for North-oriented trunks with sensors at 1-cm depth, and 4.5 °C lower for South-oriented 4-cm depth sensors (P<0.05). However, at winter, trunk temperatures were 4.6 to 5.1 °C higher (P<0.05) than Tair (Table 1).
Regarding sensor position, sensors in trunks at 4-cm depth recorded significantly higher (P<0.05) temperatures in winter and summer for South-oriented sensors, but only in summer for North-oriented sensors (Table 1). In almond trees, sensors at 1-cm depth in the North-oriented trunk recorded significantly higher (P<0.05) temperatures during summer (Table 1) than South-oriented sensors.
Overall, for both crops, hourly data showed that branch temperatures were higher and trunk temperatures were lower than Tair from 09:00 h to 19:00 in spring and summer, when air temperatures peaked. During these periods, branch temperatures were consistently higher (P<0.05) than trunk temperatures, regardless of the sensor’s depth in the trunk or orientation.
3.1.3. Soil Temperature
Minimum soil temperature, irrespective of the position of the sensor in the shaded or sunlit side were consistently higher (P<0.05) than Tair (Table 1). The lowest and highest monthly minimum soil temperatures were recorded in January and August, respectively. In the olive orchard, sunlit soil temperatures varied from 8.7±0.16 to 31.2±0.12 °C and from 8.4±0.14 to 28.2±0.07 °C in shaded soil. In the almond orchard, sunlit soil temperature varied from 8.2±0.36 to 30.9±0.12 °C, and shaded soil temperature from 8.5±0.30 °C to 27.3±0.11 °C (Table 1). During the coldest period (November to April) the average monthly minimum temperature in the olive orchard ranged from 8.7±0.16 to 16.2±0.20 °C in sunlit soil and 8.4±0.14 to 14.7±0.17 °C in shaded soil. Almond trees showed 8.2±0.36 to 15.9±0.41 °C in sunlit and 8.5±0.30 to 15.9±0.34 °C in shaded soil (Table 1). During these months, in the olive orchard the monthly minimum temperature in soil increased by 5.4 to 6.8 °C in sunlit soil and 4.9 to 6.1 °C in shaded soil, and in the almond orchard from 4.3 to 5.5 °C in sunlit soil and 4.7 to 5.5 °C in shaded soil. During the warmest months (May to October), the soil monthly minimum temperatures increased by 9.2 to 11.7 °C in sunlit soil and 5.9 to 8.6 °C in shaded soil in the olive orchard, and from 7.6 to 12.0 °C in sunlit soil and 6.4 to 8.6 °C in shaded soil in the almond orchard (Table 1). Both soil sensors recorded similar average minimum temperatures during the coldest period. However, the period of the year when minimum sunlit soil temperatures were highest (P<0.05) was from March to September in the olive orchard, and from May to October in the almond orchard (Table 1).
The lowest and highest monthly maximum soil temperatures were registered in January and August, respectively. In the olive orchard, maximum temperatures varied from 11.8±0.12 to 36.9±0.14 °C in sunlit soil and from 9.6±0.13 to 30.5±0.11 °C in shaded soil (Table 1). In the almond orchard, these temperatures ranged from 11.0±0.29 to 35.2±0.14 °C in sunlit soil and from 10.5±0.26 °C to 29.6±0.12 °C in shaded soil (Table 1). During the warmest months (May to October), maximum soil temperatures in the olive orchard ranged from 25.4±0.54 to 36.9±0.14 °C in sunlit soil and from 21.0±0.20 to 30.5±0.11 °C in shaded soil. In the almond orchard, these temperatures ranged from 22.1±0.71 to 35.2±0.14 °C in sunlit and from 20.3±0.55 to 29.6±0.12 °C in shaded soil (Table 1). During the coldest months, the monthly maximum soil temperatures decreased by 0.9 to 4.6 °C in sunlit soil and from 2.4 to 8.2 °C in shaded soil in the olive orchard, and from 2.4 to 7.7 °C in sunlit soil and from 2.6 to 8.3 °C in shaded soil in the almond orchard. During the warmest period, from May to October, the monthly minimum temperature in soil decreased by 0.3 to 2.2 °C in sunlit soil and from 5.2 to 9.0 °C in shaded soil in the olive orchard, and from -0.7 to 2.0 °C in sunlit soil and from 3.5 to 7.5 °C in shaded soil in the almond orchard (Table 1). Differences in monthly maximum temperatures between the soil sensor positions varied by crop species. The sunlit sensor consistently recorded the highest temperatures (P<0.05) in olive trees throughout the year, while in almond trees, this trend was noted only from May to September (Table 1). At hourly intervals, both minimum and maximum temperature recorded by soil sensors were nearly constant during the day in winter (Figure 2 and Figure 3).
3.2. Seasonal Relationships Between Air and Sensor Temperatures
Air temperature showed a positive and linear relationship with temperature measured by sensors placed at various positions on both olive and almond trees or in the soil (Figure 4, Figure 5 and Figure 6).
3.2.1. Minimum Temperatures
The regression models analyzing the relationship between Tair and sensor-recorded minimum temperatures demonstrated a strong linear trend across all seasons in both olive and almond trees (R2> 0.96) (Figure 4) and soil sensors (0.60 > R2 < 0.89) (Figure 6a–d). The slope parameter estimated from the tree sensors models ranged from 0.95 to 1.05 for olive trees and from 1.00 to 1.10 for almond trees, with most cases being significantly different from 1 (P<0.05). These slopes, which represent the rate of change in sensor-recorded temperature per unit increase in Tair, showed a consistent pattern across the different sensors and both crops, indicating a uniform thermal response to variations in minimum air temperature. In contrast, a wider range was found for the slope parameter for soil sensor models, that ranged from 0.46 to 1.03 in the olive orchard (Figure 6a,c) and from 0.55 to 1.16 in the almond orchard (Figure 6b,d).
In both olive and almond trees, the relationship between Tair and sensor-recorded minimum temperatures was modulated by season (F>194.78, P<0.0001), the position of the sensor in the tree (F>3170.12, P<0.0001) and their interaction (F>70.61, P<0.0001). However, most of the variation in the Mean Square Error (MSE) explained by the linear model was attributed to position of the sensor, accounting for 92.3% of the MSE in both olive and almond trees. Season and interaction accounted for 6.2 and 1.4% of MSE in olive trees, and 5.7 and 2.1% of MSE in almond trees, respectively (Supplementary Tables S1 and S2).
The estimated marginal means of sensor-recorded minimum temperatures for the different seasons are shown in Table 2. A consistent pattern was observed across sensors and seasons for both crops, with a few exceptions. The average sensor minimum temperature predicted by the linear model at the average Tair was significantly higher (P<0.05) in summer, decreased in spring and autumn, and was lowest (P<0.05) in winter (Table 2; Figure 4). Within each season, soil sensors recorded the highest minimum temperatures compared to tree sensors, which showed the highest value relative to the average Tair. Specifically, sunlit soil sensors registered the highest average minimum temperature, followed by shaded soil sensors. Among tree sensors, trunk sensors at 1- and 4-cm depth, and branch sensors recorded progressively lower temperatures in that order. No significant differences (P≥0.05) were found between the North- and South-oriented sensors (Table 2; Figure 4 and Figure 6).
3.2.2. Maximum Temperatures
As was found for the minimum temperatures, there was a strong linear correlation between Tair and sensor-recorded maximum temperatures across all sensor positions in both olive and almond trees or soil, across all seasons (0.70 > R2 ≤ 0.98) for 43 out of 52 models (Figure 5 and Figure 6). The slopes of the fitted models for temperatures recorded by sensors in tree branches ranged from 0.96 to 1.05 for olive trees and from 0.90 to 1.06 for almond trees, similar to the values estimated for minimum temperature. Interestingly, the slopes of the models fitted to trunk sensors were lower than 0.83 for olive trees and 0.71 for almond trees, except during the winter months when almond trees are leafless. For spring and summer, the slopes ranged from 0.51 to 0.76 for olive trees and from 0.42 to 0.71 for almond trees. For autumn and winter, the slopes ranged from 0.54 to 0.83 for olive trees and 0.58 to 1.1 for almond trees. These slopes showed a consistent pattern across different sensors and both crops, suggesting a uniform thermal response to variations in maximum Tair (Figure 5). A wider range was found for the slope in models fitted to soil sensors, varying from 0.34 to 0.84 in olive trees and from 0.35 to 0.855 in almond trees (Figure 6e–h).
Maximum temperatures showed a similar trend to that described for minimum temperatures. The relationship between Tair and sensor-recorded maximum temperatures in both olive and almond trees was influenced by the season (F>72.25, P<0.0001), the position of the sensor in the tree (F>932.67, P<0.0001) and their interaction (F>115.93, P<0.0001) (Supplementary Tables S3 and S4). However, most of the variation in MSE explained by the linear model was attributed to the sensor position, which accounted for 84.0% of MSE in olive and 75.9% of MSE in almond trees. Season and the interaction contributed 12.0 and 4.0% of MSE, respectively in olive trees (Supplementary Table S3), and 5.9 and 18.3% of MSE, respectively in almond trees (Supplementary Table S4).
The estimated marginal means of sensor-recorded maximum temperature across different seasons are presented in Table 2. A consistent response was observed across sensors for both crops throughout the seasons. The average maximum temperature recorded by the sensors, as predicted by the linear model at the average Tair was significantly higher in summer (P<0.05), decreased in autumn and spring and was lowest in winter (P<0.05) (Table 2; Figure 5 and Figure 6). An exception was noted for trunk sensors at 1- or 4-cm depth with a southern orientation, which recorded higher average maximum temperatures in winter and lower ones in spring.
For olive trees within each season, the average maximum temperatures relative to average Tair were highest in branches followed by trunk sensors at 4-cm depth, trunk sensors at 1-cm depth, and sunlit soil, with the lowest temperature recorded in shaded soil. For almond trees, during spring, summer, and autumn, branch sensors recorded significantly higher average maximum temperatures (P<0.05), followed by trunk sensors at 1-cm depth, sunlit soil, with the lowest temperatures being recorded in trunks at 4-cm depth and in shaded soil. In contrast, in winter, the lowest average maximum temperatures were recorded by both soil sensors, increasing in branches and trunk at 1-cm depth, and being highest for the trunk at 4-cm depth (Table 2, Figure 5 and Figure 6).
4. Discussion
This study provides the first comprehensive field-based analysis of seasonal and diurnal temperature dynamics within the xylem tissue and the soil-root interface of almond and olive trees under field conditions in a Mediterranean-type environment. The results show how ambient air temperature relates to microclimates within specific plant, highlighting the significant effects of sensor position within the tree and seasonal variation on temperature dynamics. In general, branch temperatures were closely coupled to air temperatures across all seasons. However, during spring and summer, trunk temperatures at 1- and 4-cm depths, as well as within the soil-root interface at 20-cm depth, remained notably lower than maximum air temperatures. In contrast, during autumn and winter, the soil-root system interface at 20-cm depth consistently exhibited higher temperatures than the surrounding air. These findings underscore the buffering capacity of both plant tissues and soil, which mitigates temperature extremes experienced by the xylem tissues and soil-root interface. This buffering is critical for understanding plant physiological responses and pathogen dynamics, as temperature fluctuations in these microenvironments can influence disease development and stress resilience.
Results from different studies measuring minimum and maximum temperatures recorded with thermocouples in branches and trunks of woody tree species have shown variable outcomes depending on factors such as species, season, solar exposure and position (height and depth) of the thermocouple within the tree, among others. For instance, Gansert et al. [38] reported that in silver birch (Betula pendula), xylem sap temperatures measured at 8-mm depth in trunks were similar to air temperature during March and April. However, in August, xylem sap temperature began to diverge from air temperature, particularly during periods of minimum and maximum temperatures. Peña Quiñones et al. [24] also found that minimum xylem temperatures recorded at 2- and 3-mm depth at various heights in grapevine trunks did not differ significantly from air temperature, while branches or thinner trunks were more prone to temperature variations induced by solar radiation due to a greater exposure to direct sunlight, smaller diameters and lower bark lignification [8,34]. These attributes are known to enhance convective heat transfer with the atmosphere compared to thicker trunks, which provide a buffering effect that moderates temperature fluctuations.
Our study demonstrated a significant temperature-buffering effect inside the tree trunk at depths of 1- and 4-cm, particularly during periods of maximum daily temperatures. This buffering effect can be primarily due to the low thermal conductivity of mature wood and the insulating properties of well-lignified bark [17,39]. For example, Edwards and Hanson [16] recorded trunk temperatures to be 6 to 8 °C lower than air temperature at a 2-cm depth in oak and red maple trees in spring; this difference was attributed to the shading effect of leaves, which reduced direct solar exposure. Furthermore, Quick [40] noted that stems near the base of shrubs and roots experience less temperature variation than upper branches, which are more exposed to solar radiation and lower air convection, while the proximity to larger wood masses near the base acts as a thermal buffer.
Our results also revealed significant temperature variation depending on sensor depth, which correlated with the temperature reached at different vascular tissue rings. In general, sensors placed deeper within the trunk recorded lower temperatures. Lindroth et al. [41] reported that trunk temperatures were 5 to 7 °C lower than air temperatures at 3- and 7-cm depths in Norway spruce and Scots pine. Similarly, Stockfors [7] reported lower trunk temperatures in Picea abies trees when measured with deeper trunk sensors. Our summer measurements in almond trees support these findings, as sensors at 4-cm depth recorded lower temperatures than those at 1-cm depth. However, in olive trees, during the same period, higher temperatures were registered at a 4-cm depth. This variation may be result from the anisotropic nature of wood, which leads to heterogeneous thermal properties [42]. Sap flow is known to influence xylem temperature, with higher sap flow associated with lower xylem temperature, likely due to a cooling effect from transpirational water uptake [43]. Variations in sap flow may explain the observed temperature patterns. For example, López-Bernal et al. [44] observed higher sap flow on the south side of olive trees at 1.3 and 2.2-cm trunk depth, which may account for the lower temperature recorded at the 1-cm depth in the olive trees in our study. If so, the cooler outer rings could be due to a larger flux of sap originating from cooler soil, assuming convective sap flux decreases with trunk depth. Reduced sap flow with increased depth has been observed in many species [45,46].
While several studies [8,16,17] have shown that tree orientation can influence trunk temperature, our model implemented in the olive orchard with sensors placed on both north and south orientations did not reveal significant temperature differences. This may be due to the fact that most studies highlighting the impact of tree orientation as those referred above were conducted in natural forests, where tree orientation leads to varying exposure to solar radiation. In contrast, orchards typically have more controlled and uniform conditions, with factors such as tree spacing and canopy management minimizing variations in solar exposure.
In our study, soil temperature measurements indicated a significant buffering effect in the soil environment for both minimum and maximum temperatures, which can extend to root tissues. Thermocouples installed within the root tissues of almond and olive trees recorded temperatures similar to those at the surrounding soil-root interface in the same orchards used in this study (Supplementary Figure S1). One key factor contributing to this buffering effect is the relatively low thermal conductivity of soil, which dampens temperature fluctuations with increasing depth [47,48]. Bertrand et al. [49] reported lower temperatures with increasing soil depth from 5 to 50 cm. Similarly, Pregitzer et al. [50] observed significant temperature fluctuations of over 10 °C between 1- and 15- or 20-cm depths, particularly during May and June. Canopy coverage also plays a role in regulating soil temperature by moderating the amount of solar radiation reaching the soil surface [48]. Our findings align are consistent with these results, as sensors placed in sunny areas exhibited greater temperature fluctuations compared to those in shaded areas.
Temperature is a critical factor influencing the behavior of plant pathogens and the development of vascular diseases [27,28]. The buffering effect observed within the xylem trunk and root-soil interface may impact on the survival and proliferation of vascular plant pathogens, such as X. fastidiosa and V. dahliae; which are major threats to olive and almond crops in the Mediterranean Basin. Our findings indicate that, under Mediterranean-type climate, the thermal environment within the trunk and root-soil interface remains within temperature ranges that support pathogen survival, as previously documented, e.g., Feil and Purcell [29], Calderón et al. [26].
Both X. fastidiosa and V. dahliae are mesophilic microorganisms capable of adapting to diverse climatic conditions worldwide. Feil and Purcell [29] demonstrated that X. fastidiosa populations in grapevine seedlings remained stable between 10 to 34 °C, with limited growth at 5 °C and undetectable at 37 °C. For V. dahliae, environmental variables such as temperature range seasonality, summer temperature, and moisture are key factors for its presence and spread in Mediterranean landscapes, thus the severity of symptoms in olive trees increases in spring when air temperatures range from 20 to 25 °C, while prolonged temperatures above 25 °C hinder pathogen colonization and symptoms development [51]. Our results showed that minimum and maximum trunk temperatures in olive and almond trees ranged from 3.6 to 21.5 °C, and 14.6 to 35.6 °C, respectively (Table 1), suggesting that xylem tissues may remain within a range conducive to slow growth and survival of both pathogens [52,53,54], particularly during extreme environmental conditions. These findings underscore the importance of understanding microclimatic conditions within the xylem and root-soil systems, as they provide thermally suitable environments for pathogen persistence and may potentially modify disease risks in Mediterranean-type climates.
In V. dahliae, soil serves as a reservoir for microsclerotia and conidia, which can remain viable for several years or months, respectively [55]. V. dahliae microsclerotia can tolerate high soil temperatures, with 80% surviving at 30 °C, and 30% at 35 °C [30]. In our study, under natural field conditions, maximum soil temperatures at 20-cm depth during the warmest month reached nearly 37 °C for sunlit sensors and slightly above 30 °C for shaded sensors. While these conditions approach the upper limit for V. dahliae survival, the insulating properties of soil likely help maintain microsclerotia viability. For X. fastidiosa, root colonization has been documented in various wood species, including grape [56], almond [57], and olive [58]. Amanifar et al. [57] reported that in a X. fastidiosa-infected almond orchard in Iran, despite air temperature dropping to -28 °C, soil temperature at 50-cm depth remained above 6 °C, allowing X. fastidiosa cells to overwinter in almond roots. Nevertheless, a significant reduction in bacterial cells and remission of symptoms occurred the following year. This phenomenon is known as “winter curing” and was first described in grapevines [59] infected by X. fastidiosa in California.
Our results suggest that the thermal buffering effect observed at root-soil interface may help pathogens persist during periods of extreme heat or cold, as observed in previous studies. As temperatures become more favorable, both vascular pathogens could migrate from the roots to the trunk, stems and leaves, or persist within trunk xylem tissues, gradually increasing their inoculum levels [31].
Our study emphasized the importance of accounting for xylem and root-soil temperature variations in woody crops when assessing pathogen survival and disease risk. Relying solely on standard weather station data may introduce biases in epidemiological models, particularly when specific plant tissues play a role in pathogen development. Further research is needed to investigate how seasonal shifts in air-xylem tissue temperature relationships and additional environmental factors, like solar radiation exposure, wind exposure or ground cover affect these thermal dynamics. By providing a better understanding of temperature-buffering effects within these two tree crops this study may contribute to the development of more accurate region-specific epidemiological models for vascular plant pathogens ultimately supporting better management strategies for olive and almond trees in the Mediterranean region.
Supplementary Materials
The following supporting information can be downloaded at the website of this paper posted on Preprints.org, Figure S1: Linear regression analysis describing the relationship between daily mean temperatures recorded by thermocouples at the root tissue or the soil-root system in the almond (a) olive (b) orchards.; Figure S2: Daily average minimum (a) and maximum (b) temperature data for xylem, air, and soil measured at different sensor positions in the olive orchard from December 2017 to July 2020. Daily average minimum (c) and maximum (d) temperature data for xylem, air and soil measured at different sensor positions in the almond orchard from February 2018 to March 2019; Table S1: Summary table of the Analysis of variance for the linear model fitted to analyze the relationship between sensor-recorded and air minimum temperature using season and sensor as covariates in olive trees; Table S2: Summary table of the Analysis of variance for the linear model fitted to analyses the relationship between sensor-recorded and air minimum temperature using season and sensor as covariates in almond trees; Table S3: Summary table of the Analysis of variance for the linear model fitted to analyze the relationship between sensor-recorded and air maximum temperature using season and sensor as covariates in olive trees; Table S4: Summary table of the Analysis of variance for the linear model fitted to analyses the relationship between sensor-recorded and air maximum temperature using season and sensor as covariates in almond trees.
Author Contributions
Conceptualization, B.B.L., L.T. and J.A.N.-C.; methodology, B.B.L., L.T. and J.A.N.-C.; validation, M.R.-É. and J.A.N.-C.; formal analysis, M.R.-É. and J.A.N.-C.; investigation, M.R.-É., L.T., B.B.L. and J.A.N.-C.; resources, B.B.L. and J.A.N.-C.; data curation, M.R.-É.; writing—original draft preparation, M.R.-É.; writing—review and editing, B.B.L., L.T. and J.A.N.-C.; visualization, M.R.-É.; supervision, B.B.L., L.T. and J.A.N.-C.; project administration, B.B.L. and J.A.N.-C.; funding acquisition, B.B.L. and J.A.N.-C. All authors have read and agreed to the published version of the manuscript.
Funding
This research was funded by the AEI-INIA Spain and the Spanish Olive Oil Interprofessional (grant E-RTA2017-00004-C06-02), XF-ACTORS project (Xylella fastidiosa Active Containment Through a Multidisciplinary-Oriented Research Strategy, grant 727987 from European Union’s Horizon 2020 Framework Research Programme); BeXyl project (Beyond Xylella, Integrated Management Strategies for Mitigating Xylella fastidiosa impact in Europe, grant ID 101060593, from European Union’s Horizon Europe ‘Food, Bioeconomy Natural Resources, Agriculture and Environment’ Programme); ITS2017-095 Project from ‘Consejería de Medio Ambiente, Agricultura y Pesca’ from the Balearic Islands, Spain; KODA-IPEC (Knowledge-based and Data-driven Agriculture tools for Irrigation of Permanent Crops) from the Programa Misiones Ciencia e Innovación 2021 from Centre for Industrial Technological Development (CDTI) cofinanced by European Union’s NextGeneration Framework Research Programme; Qualifica Project (QUAL21_023 IAS) from Junta de Andalucía, Spain; and the Thematic Interdisciplinary Platform on Xylella fastidiosa from CSIC (PTI Sol-Xyl), Spain.
Data Availability Statement
All data are provided in the manuscript and supplementary materials.
Acknowledgments
We thank to Jose Luis Trapero Casas and Guillermo León Ropero for their assistance.
Conflicts of Interest
The authors declare no conflicts of interest.
References
- FAOSTAT. Food and agriculture data: Crops and livestock products. Food and Agriculture Organization of the United Nations. 2022. Available online: http://www.fao.org/faostat/en/#data/QCL.
- De Aranzabal, I.; Schmitz, M.F.; Aguilera, P.; Pineda, F.D. Modelling of landscape changes derived from the dynamics of socio-ecological systems: A case of study in a semiarid Mediterranean landscape. Ecol. Indic. 2008, 8, 672–685. [Google Scholar] [CrossRef]
- Kochhar, S.L.; Gujral, S.K. Plant Physiology: Theory and Applications; Cambridge University Press: Cambridge, UK, 2020; ISBN 978-1-108-96347-3. [Google Scholar]
- Principles of Agronomy for Sustainable Agriculture; Villalobos, F.J.; Fereres, E., Eds.; Springer International Publishing: Cham, Switzerland, 2016; ISBN 978-3-319-46115-1.
- Hatfield, J.L.; Prueger, J.H. Temperature Extremes: Effect on plant growth and development. Weather Clim. Extrem. 2015, 10, 4–10. [Google Scholar] [CrossRef]
- Mahan, J.R.; McMichael, B.L.; Wanjura, D.F. Methods for reducing the adverse effects of temperature stress on plants: A review. Environ. Exp. Bot. 1995, 35, 251–258. [Google Scholar] [CrossRef]
- Stockfors, J. Temperature variations and distribution of living cells within tree stems: implications for stem respiration modeling and scale-up. Tree Physiol. 2000, 20, 1057–1062. [Google Scholar] [CrossRef]
- Derby, R.W.; Gates, D.M. The temperature of tree trunks-calculated and observed. Am. J. Bot. 1966, 53, 580–587. [Google Scholar] [CrossRef]
- Larcher, W. Temperature stress and survival ability of Mediterranean sclerophyllous plants. Plant Biosyst. - Int. J. Deal. Asp. Plant Biol. 2000, 134, 279–295. [Google Scholar] [CrossRef]
- Prudencio, Á.S.; Martínez-Gómez, P.; Dicenta, F. Analysis of the modulation of dormancy release in almond (Prunus dulcis) in relation to the flowering and ripening dates and production under controlled temperature conditions. Agronomy 2020, 10, 277. [Google Scholar] [CrossRef]
- Orlandi, F.; Rojo, J.; Picornell, A.; Oteros, J.; Pérez-Badia, R.; Fornaciari, M. Impact of climate change on olive crop production in Italy. Atmosphere 2020, 11, 595. [Google Scholar] [CrossRef]
- Montanaro, G.; Doupis, G.; Kourgialas, N.; Markakis, E.; Kavroulakis, N.; Psarras, G.; Koubouris, G.; Dichio, B.; Nuzzo, V. Management options influence seasonal CO2 soil emissions in Mediterranean olive ecosystems. Eur. J. Agron. 2023, 146, 126815. [Google Scholar] [CrossRef]
- Atkinson, D.; Porter, J.R. Temperature, plant development and crop yields. Trends Plant Sci. 1996, 1, 119–124. [Google Scholar] [CrossRef]
- Ritchie, J.T.; Nesmith, D.S. Temperature and crop development. In Modeling Plant and Soil Systems; John Wiley & Sons, Ltd., 1991; pp. 5–29 ISBN 978-0-89118-223-8.
- Peña Quiñones, A.J.; Hoogenboom, G.; Salazar Gutiérrez, M.R.; Stöckle, C.; Keller, M. Comparison of air temperature measured in a vineyard canopy and at a standard weather station. PLOS ONE 2020, 15, e0234436. [Google Scholar] [CrossRef]
- Edwards, N.T.; Hanson, P.J. Stem respiration in a closed-canopy upland oak forest. Tree Physiol. 1996, 16, 433–439. [Google Scholar] [CrossRef] [PubMed]
- Nicolai, V. The bark of trees: thermal properties, microclimate and fauna. Oecologia 1986, 69, 148–160. [Google Scholar] [CrossRef] [PubMed]
- Potter, B.E.; Andresen, J.A. A finite-difference model of temperatures and heat flow within a tree stem. Can. J. For. Res. 2002, 32, 548–555. [Google Scholar] [CrossRef]
- Aubrecht, D.M.; Helliker, B.R.; Goulden, M.L.; Roberts, D.A.; Still, C.J.; Richardson, A.D. Continuous, long-term, high-frequency thermal imaging of vegetation: Uncertainties and recommended best practices. Agric. For. Meteorol. 2016. [Google Scholar] [CrossRef]
- Cannon, J.; Warren, L.; Ohlson, G.; Hiers, J.; Shrestha, M.; Mitra, C.; Hill, E.; Bradfield, S.; Ocheltree, T. Applications of low-cost environmental monitoring systems for fine-scale abiotic measurements in forest ecology. Agric. For. Meteorol. 2022, 321, 108973. [Google Scholar] [CrossRef]
- Mayr, S.; Wieser, G.; Bauer, H. Xylem temperatures during winter in conifers at the alpine timberline. Agric. For. Meteorol. 2006, 137, 81–88. [Google Scholar] [CrossRef]
- Vermunt, B.; Cuddington, K.; Sobek-Swant, S.; Crosthwaite, J.C.; Barry Lyons, D.; Sinclair, B.J. Temperatures experienced by wood-boring beetles in the under-bark microclimate. For. Ecol. Manag. 2012, 269, 149–157. [Google Scholar] [CrossRef]
- Bär, A.; Mayr, S. Bark insulation: Ten Central Alpine tree species compared. For. Ecol. Manag. 2020, 474, 118361. [Google Scholar] [CrossRef]
- Peña Quiñones, A.J.; Keller, M.; Salazar Gutierrez, M.R.; Khot, L.; Hoogenboom, G. Comparison between grapevine tissue temperature and air temperature. Sci. Hortic. 2019, 247, 407–420. [Google Scholar] [CrossRef]
- Järvan, M.; Edesi, L.; Adamson, A.; Võsa, T. Soil microbial communities and dehydrogenase activity depending on farming systems. Plant Soil Environ. 2014, 60, 459–463. [Google Scholar] [CrossRef]
- Calderón, R.; Lucena, C.; Trapero-Casas, J.L.; Zarco-Tejada, P.J.; Navas-Cortés, J.A. Soil temperature determines the reaction of olive cultivars to Verticillium dahliae pathotypes. PLOS ONE 2014, 9, e110664. [Google Scholar] [CrossRef] [PubMed]
- Hunjan, M.S.; Lore, J.S. Climate change: impact on plant pathogens, diseases, and their management. In Crop Protection Under Changing Climate; Jabran, K., Florentine, S., Chauhan, B.S., Eds.; Springer International Publishing: Cham, Switzerland, 2020; ISBN 978-3-030-46111-9. [Google Scholar]
- Katan, J. Soil temperature interactions with the biotic components of vascular wilt diseases. In Vascular Wilt Diseases of Plants: Basic Studies and Control; Tjamos, E.C., Beckman, C.H., Eds.; Springer: Berlin, Heidelberg, Germany, 1989; ISBN 978-3-642-73168-6. [Google Scholar]
- Feil, H.; Purcell, A.H. Temperature-dependent growth and survival of Xylella fastidiosa in vitro and in potted grapevines. Plant Dis. 2001, 85, 1230–1234. [Google Scholar] [CrossRef] [PubMed]
- Subbarao, K. Interactive effects of broccoli residue and temperature on Verticillium dahliae microsclerotia in soil and on wilt in cauliflower. Phytopathology 1996, 86, 1303. [Google Scholar] [CrossRef]
- Henneberger, T.S.M.; Stevenson, K.L.; Britton, K.O.; Chang, C.J. Distribution of Xylella fastidiosa in sycamore associated with low temperature and host resistance. Plant Dis. 2004, 88, 951–958. [Google Scholar] [CrossRef]
- Testi, L.; Villalobos, F.J.; Orgaz, F. Evapotranspiration of a young irrigated olive orchard in southern Spain. Agric. For. Meteorol. 2004, 121, 1–18. [Google Scholar] [CrossRef]
- Trenberth, K.E. What are the seasons? Bull. Am. Meteorol. Soc. 1983, 64, 1276–1282. [Google Scholar] [CrossRef]
- R Core Team. R: A Language and Environment for Statistical Computing, Version 4.0.3; R Foundation for Statistical Computing: Vienna, Austria, 2021; Available online: https://www.R-project.org/.
- de Mendiburu, F. agricolae: Statistical Procedures for Agricultural Research, Version 1.3-7; R Package; 2023. Available online: https://CRAN.R-project.org/package=agricolae.
- Hothorn, T.; Bretz, F.; Westfall, P. Simultaneous inference in general parametric models. Biom. J. 2008, 50, 346–363. [Google Scholar] [CrossRef]
- Lenth, R.V. emmeans: Estimated Marginal Means, aka Least-Squares Means, Version 1.8. R Package, 2024. Available online: https://doi.org/10.32614/CRAN.package.emmeans. [CrossRef]
- Gansert, D.; Burgdorf, M.; Lösch, R. A novel approach to the in situ measurement of oxygen concentrations in the sapwood of woody plants. Plant Cell Environ. 2001, 24, 1055–1064. [Google Scholar] [CrossRef]
- Gartner, B.L. Patterns of xylem variation within a tree and their hydraulic and mechanical consequences. In Plant Stems; Gartner, B.L., Ed.; Physiological Ecology; Academic Press: San Diego, CA, USA, 1995; ISBN 978-0-12-276460-8. [Google Scholar]
- Quick, D.D. Continuous measurements of water status in deeply rooted Southern California chaparral shrub species; M.S. thesis, California State University, Fullerton, USA, 2016; ISBN 978-1-339-75307-2; Available online: https://scholarworks.calstate.
- Lindroth, A.; Mölder, M.; Lagergren, F. Heat Heat storage in forest biomass improves energy balance closure. Biogeosciences 2010, 7, 301–313. [Google Scholar] [CrossRef]
- Trcala, M.; Čermák, J. Nonlinear finite element analysis of thermal inertia in heat-balance sap flow measurement. Int. J. Therm. Sci. 2014, 76, 200–207. [Google Scholar] [CrossRef]
- Kunert, N.; Mercado Cárdenas, A. Effects of xylem water transport on CO2 efflux of woody tissue in a tropical tree, Amazonas State, Brazil. Hoehnea 2012, 39, 139–144. [Google Scholar] [CrossRef]
- López-Bernal, Á.; Alcántara, E.; Testi, L.; Villalobos, F.J. Spatial sap flow and xylem anatomical characteristics in olive trees under different irrigation regimes. Tree Physiol. 2010, 30, 1536–1544. [Google Scholar] [CrossRef]
- Cohen, Y.; Cohen, S.; Cantuarias-Aviles, T.; Schiller, G. Variations in the radial gradient of sap velocity in trunks of forest and fruit trees. Plant Soil 2008, 305, 49–59. [Google Scholar] [CrossRef]
- Nadezhdina, N.; Nadezhdin, V.; Ferreira, M.I.; Pitacco, A. Variability with xylem depth in sap flow in trunks and branches of mature olive trees. Tree Physiol. 2007, 27, 105–113. [Google Scholar] [CrossRef] [PubMed]
- Pavelka, M.; Acosta, M.; Marek, M.; Kutsch, W.L.; Janous, D. Dependence of the Q10 values on the depth of the soil temperature measuring point. Plant Soil 2007, 292, 171–179. [Google Scholar] [CrossRef]
- Tang, M.; Gao, X.; Zhang, C.; Zhao, X.; Wu, P. Sloping land use affects soil moisture and temperature in the Loess Hilly region of China. Agronomy 2020, 10, 774. [Google Scholar] [CrossRef]
- Bertrand, C.; González Sotelino, L.; Journée, M. Quality control of 10-min soil temperatures data at RMI. Adv. Sci. Res. 2015, 12, 23–30. [Google Scholar] [CrossRef]
- Pregitzer, K.S.; King, J.S.; Burton, A.J.; Brown, S.E. Responses of tree fine roots to temperature. New Phytol. 2000, 147, 105–115. [Google Scholar] [CrossRef]
- López-Escudero, F.J.; Mercado-Blanco, J. Verticillium wilt of olive: a case study to implement an integrated strategy to control a soil-borne pathogen. Plant Soil 2011, 344, 1–50. [Google Scholar] [CrossRef]
- Bejarano-AIcazar, J. Etiology, Importance, and distribution of Verticillium wilt of cotton in Southern Spain. Plant Dis. 1996, 80, 1233. [Google Scholar] [CrossRef]
- Román Ecija, M.; Landa, B.B.; Testi, L.; Navas Cortés, J.A. Extreme temperature differentially affects growth and survival of Xylella fastidiosa strains. In Proceedings of the 3rd European Conference on Xylella fastidiosa; 2021. [Google Scholar] [CrossRef]
- Varo, A.; Raya-Ortega, M.C.; Trapero, A. Enhanced production of microsclerotia in recalcitrant Verticillium dahliae isolates and its use for inoculation of olive plants. J. Appl. Microbiol. 2016, 121, 473–484. [Google Scholar] [CrossRef] [PubMed]
- Klosterman, S.J.; Atallah, Z.K.; Vallad, G.E.; Subbarao, K.V. Diversity, pathogenicity, and management of Verticillium species. Annu. Rev. Phytopathol. 2009, 47, 39–62. [Google Scholar] [CrossRef]
- Janse, J.D.; Obradovic, A. Xylella Fastidiosa: Its biology, diagnosis, control and risks. J. Plant Pathol. 2010, 92, S35–S48. [Google Scholar]
- Amanifar, N.; Taghavi, M.; Salehi, M. Xylella fastidiosa from almond in Iran: overwinter recovery and effects of antibiotics. Phytopathol. Mediterr. 2016, 55, 337–345. [Google Scholar]
- Saponari, M.; Boscia, D.; Altamura, G.; Loconsole, G.; Zicca, S.; D’Attoma, G.; Morelli, M.; Palmisano, F.; Saponari, A.; Tavano, D.; et al. Isolation and pathogenicity of Xylella fastidiosa associated to the olive quick decline syndrome in southern Italy. Sci. Rep. 2017, 7, 17723. [Google Scholar] [CrossRef]
- Purcell, A.H. Environmental therapy for Pierce’s disease of grapevines. Plant Dis. 1980, 64, 388–390. [Google Scholar] [CrossRef]
Figure 1.
Geographic location of the study site in the southern Iberian Peninsula (a), and location of selected olive (b) and almond (c) trees used in the study within the orchard. Scale bar = 10 m. (d) Arrangements of thermocouple sensors on each tree and near the root system in the soil. Sensors indicated by a dashed line were used only in almond trees. (e) Picture of type K thermocouples installed on the branches and trunks of olive and almond trees.
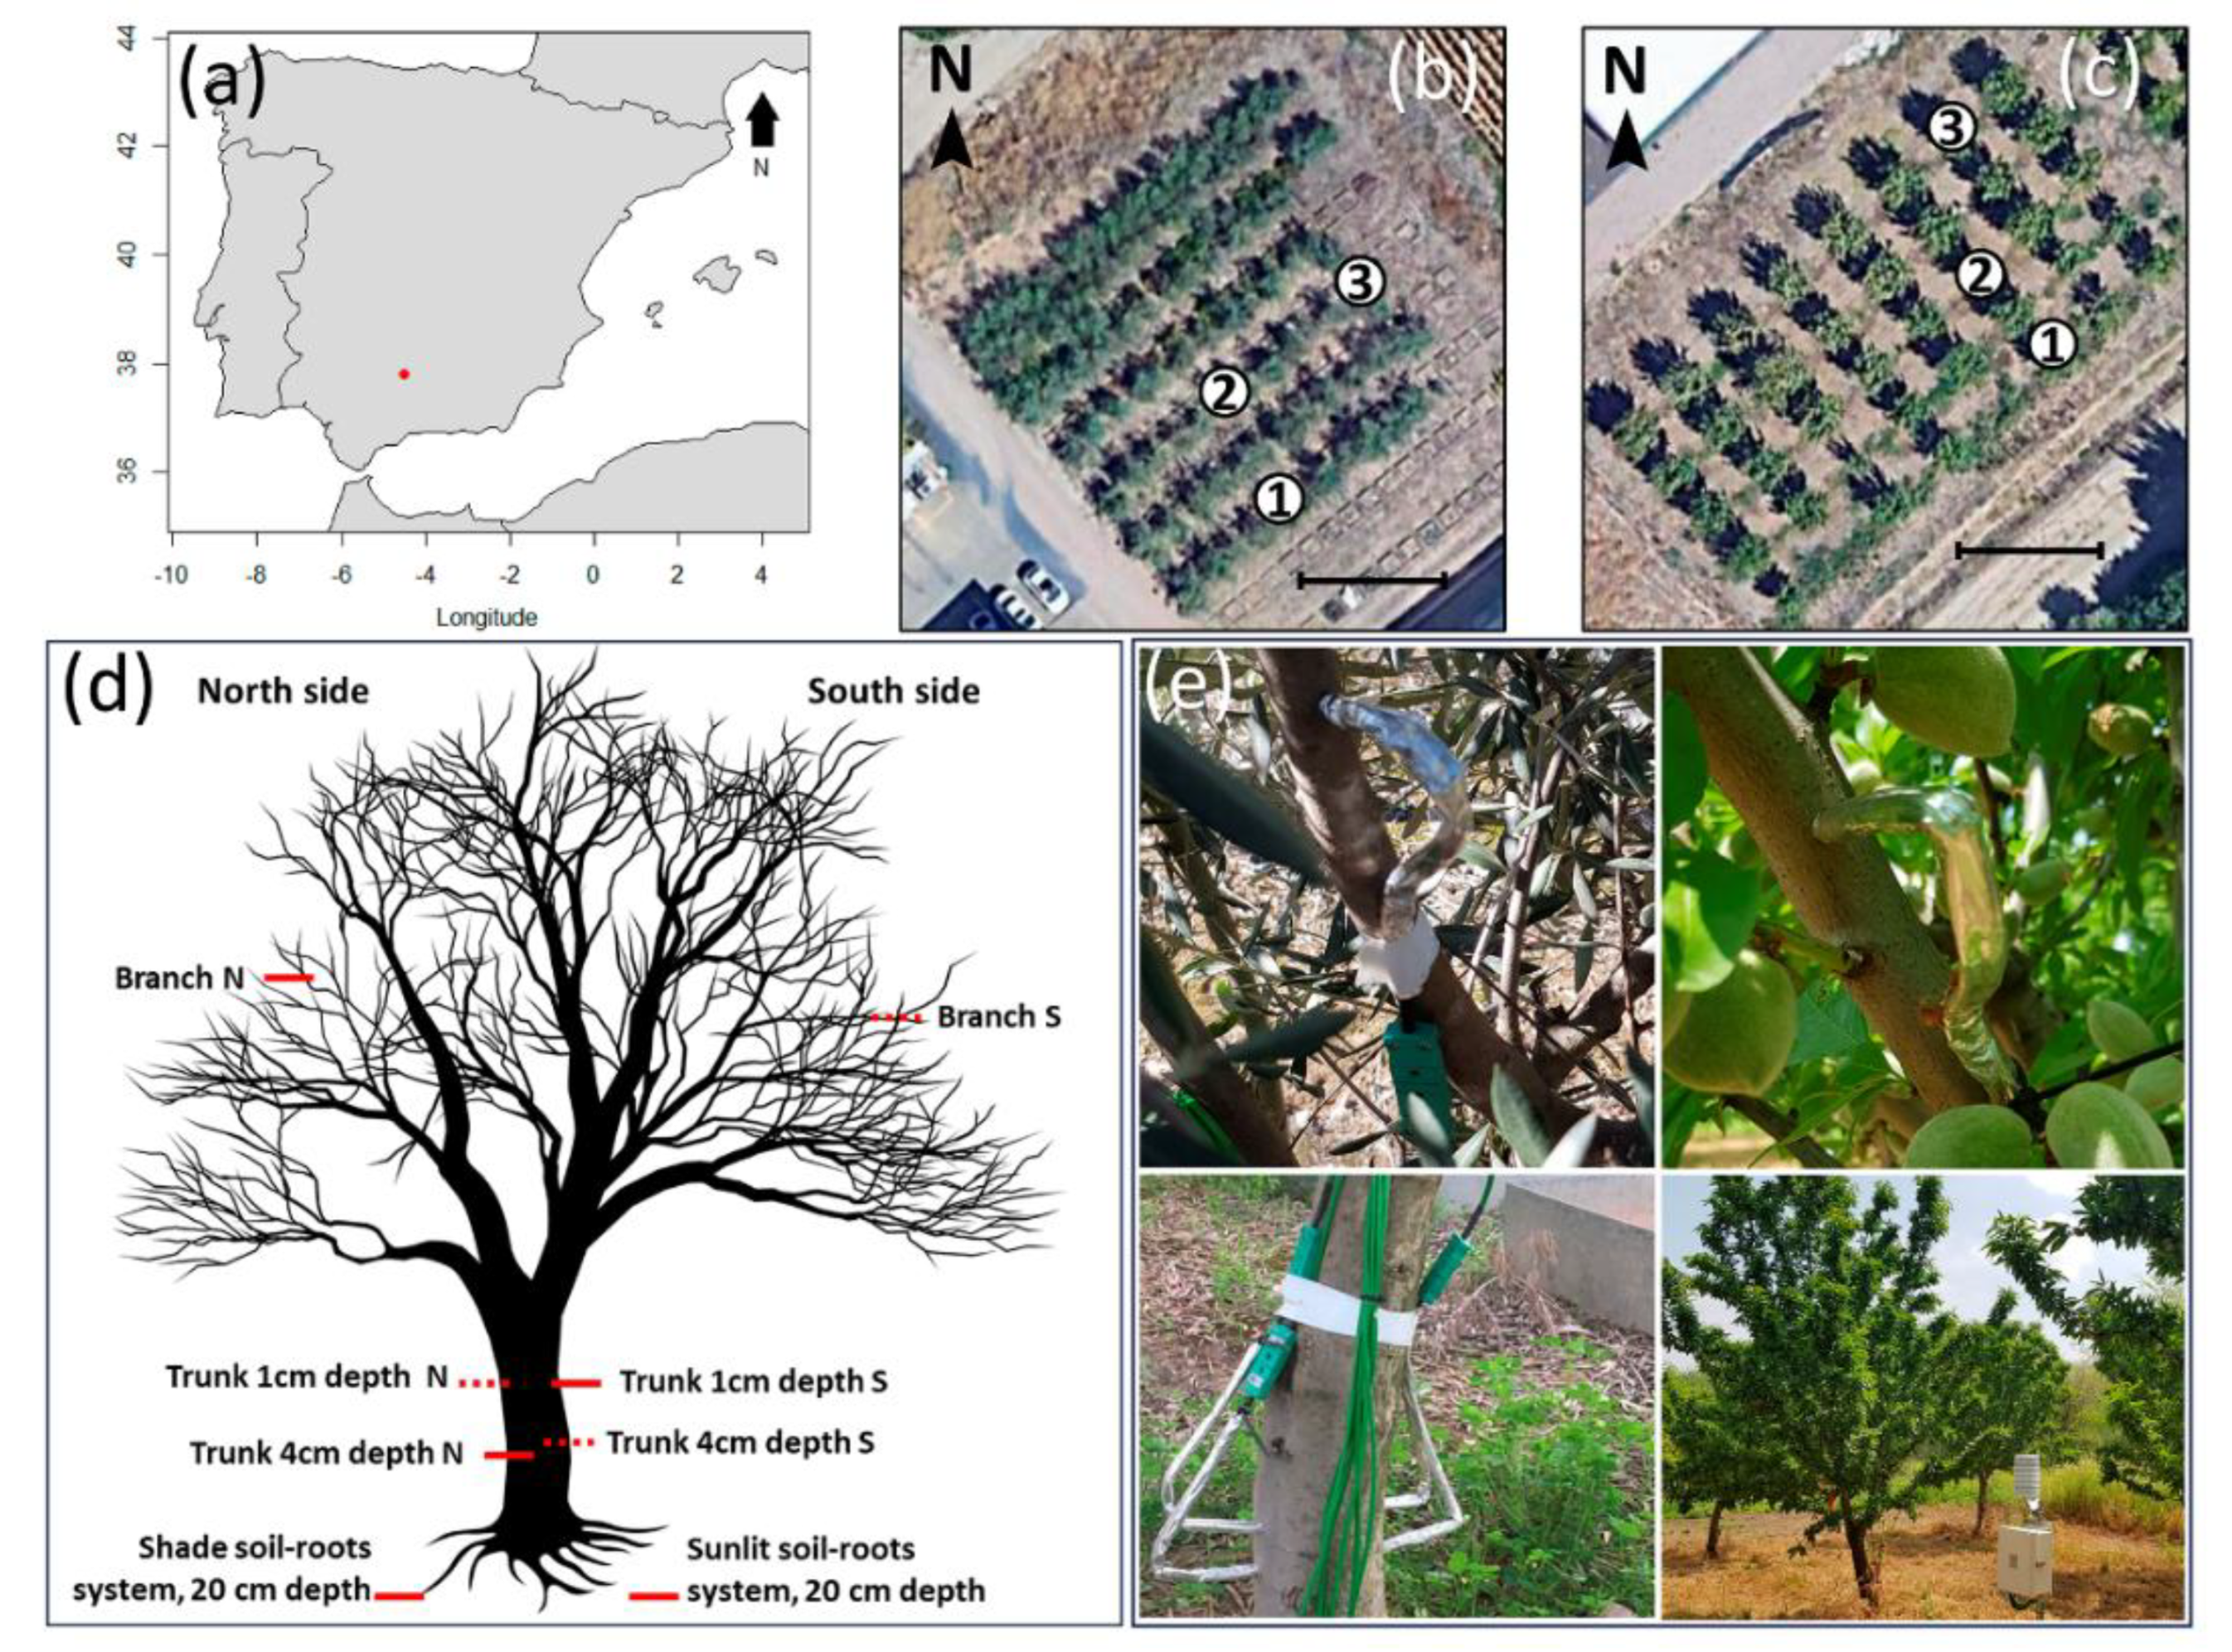
Figure 2.
Monthly average hourly minimum temperatures of xylem, air, and soil measured at different sensor positions in the olive orchard (a) and almond orchard (b). Data were recorded from December 2017 to July 2020 for the olive orchard and from February 2018 to March 2019 for the almond orchard. Sensor positions include: Branch N (north-oriented branch), Branch S (south-oriented branch), Trunk 1cm N (1-cm depth north-oriented trunk), Trunk 1cm S (1-cm depth south-oriented trunk), Trunk 4cm N (4-cm depth north-oriented trunk), Trunk 4cm S (4-cm depth north-oriented trunk), Shade soil (soil temperature at 20-cm depth in a sunny area), Sunlit soil (soil temperature at 20-cm depth in a shaded area), and Air (air temperature).
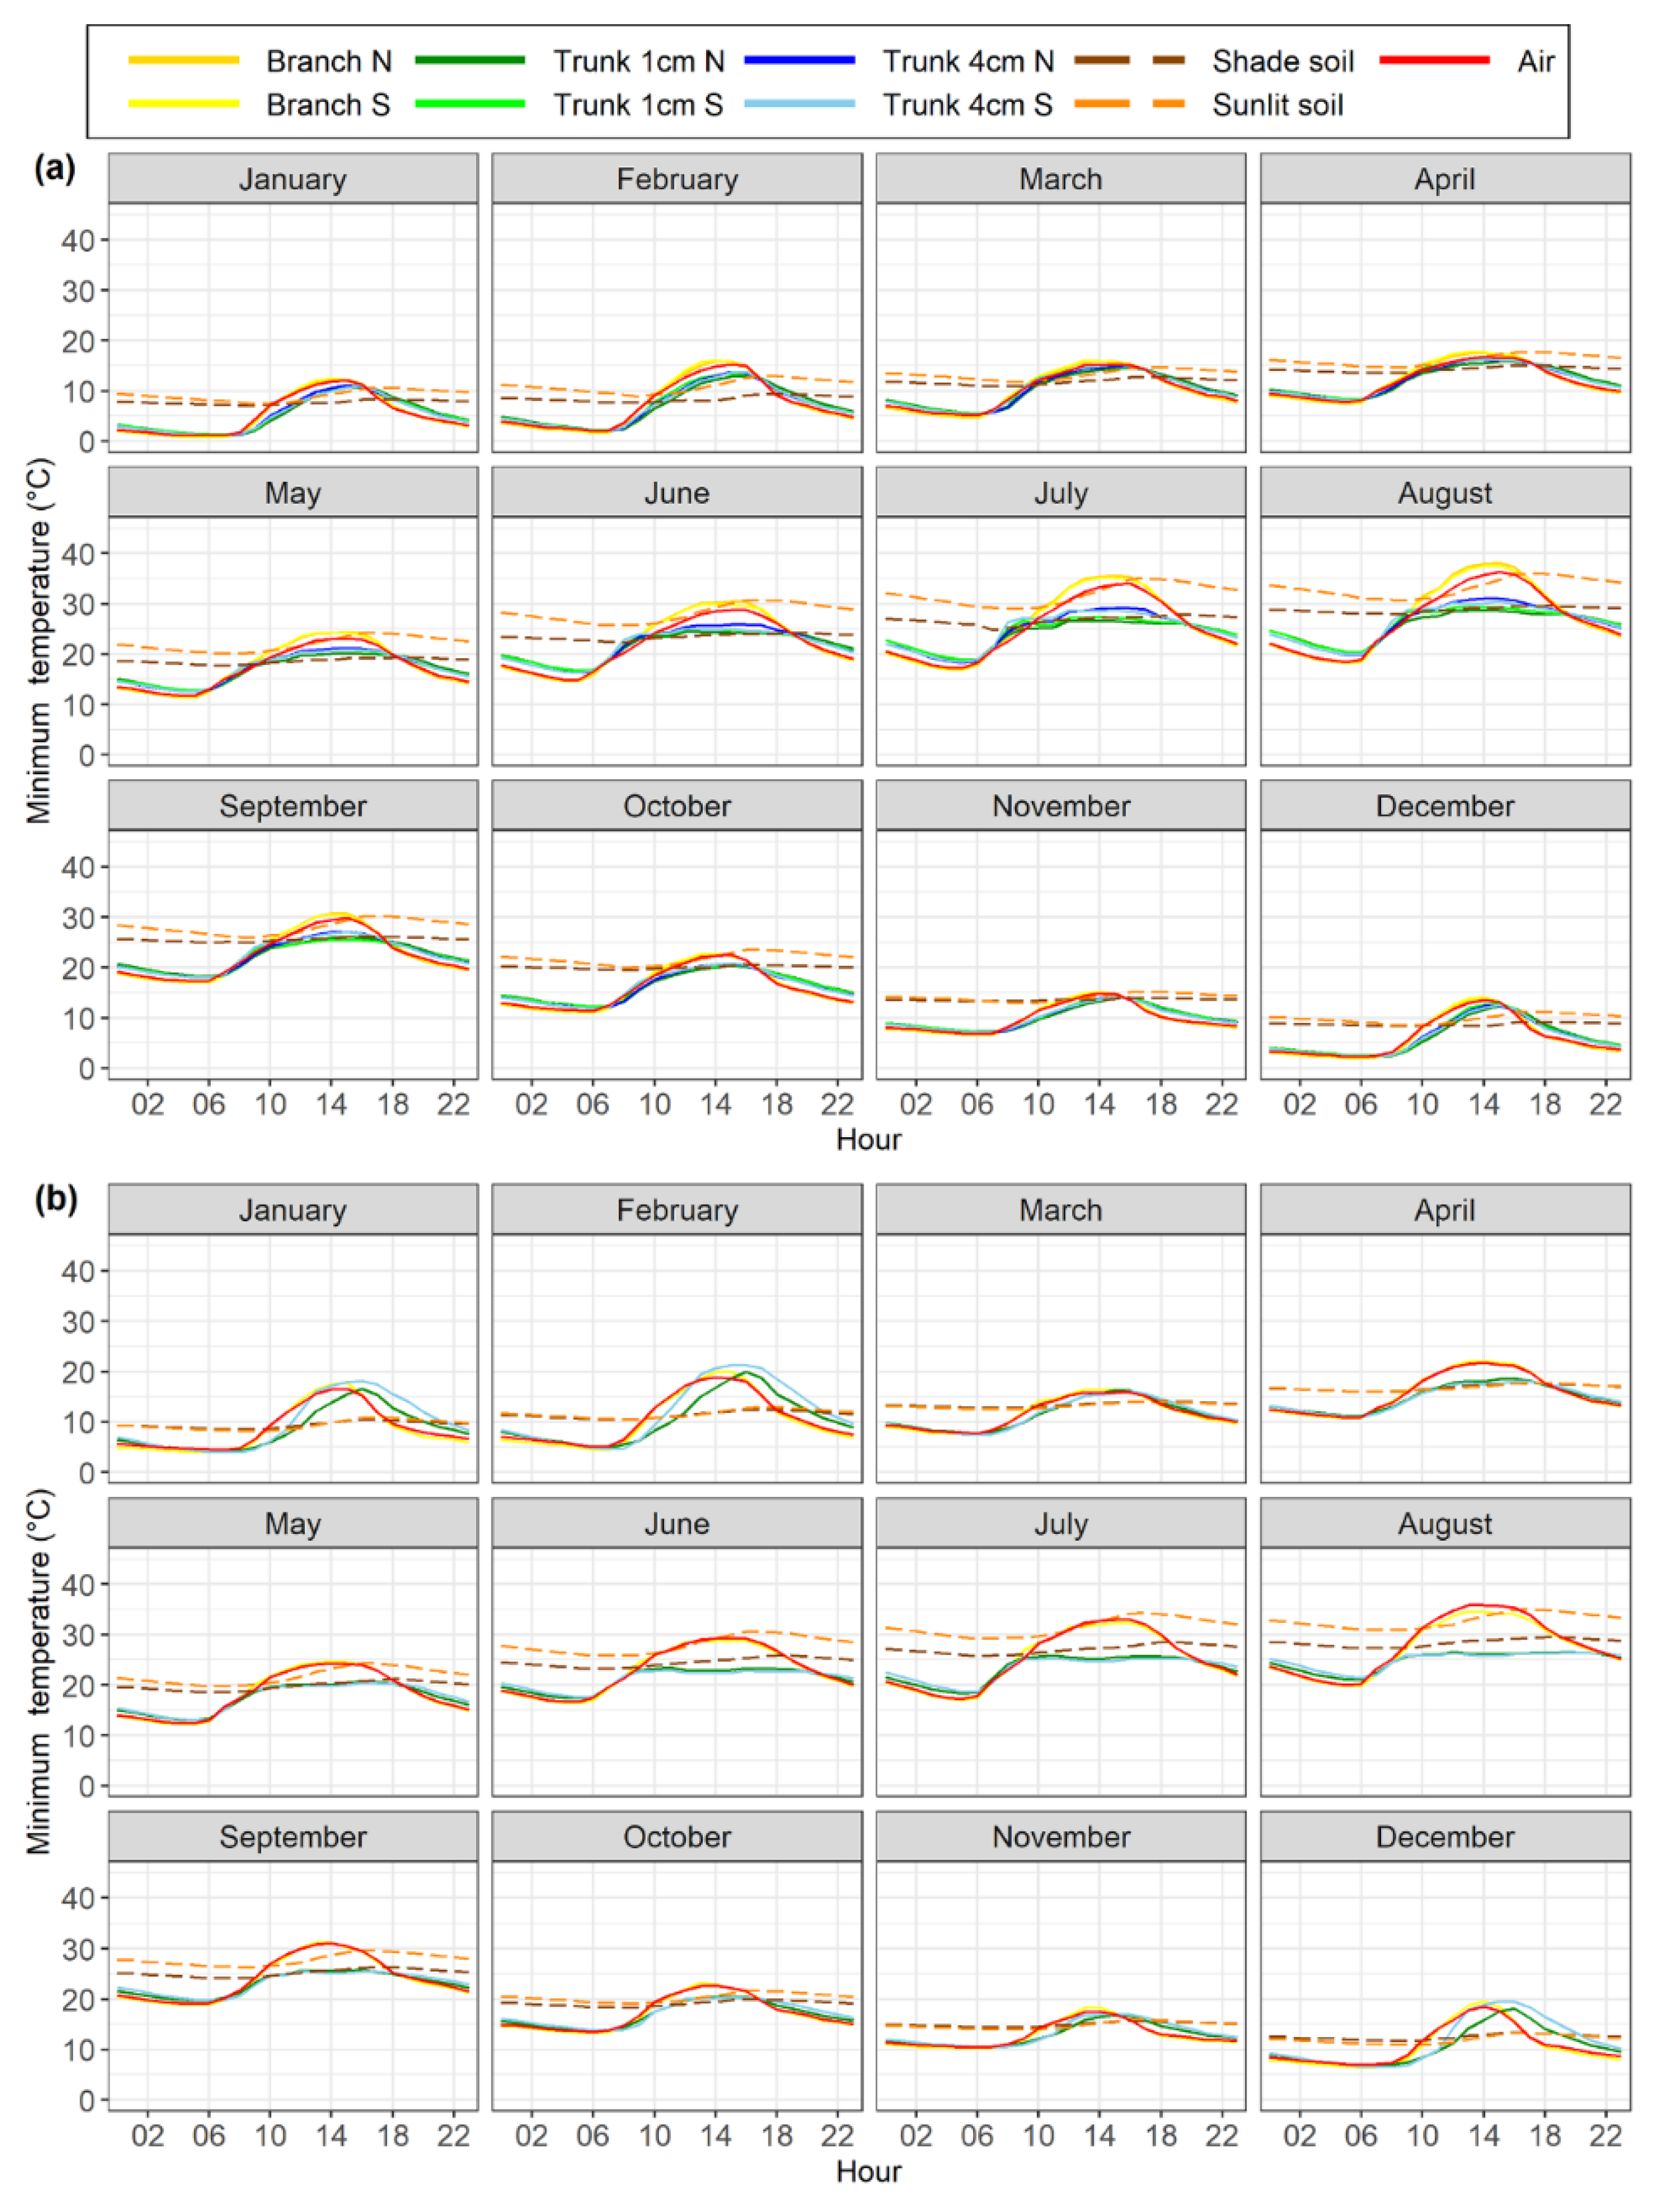
Figure 3.
Monthly average hourly maximum temperatures of xylem, air, and soil measured at different sensor positions in the olive orchard (a) and almond orchard (b). Data were recorded from December 2017 to July 2020 for the olive orchard and from February 2018 to March 2019 for the almond orchard. Sensor positions include: Branch N (north-oriented branch), Branch S (south-oriented branch), Trunk 1cm N (1-cm depth north-oriented trunk), Trunk 1cm S (1-cm depth south-oriented trunk), Trunk 4cm N (4-cm depth north-oriented trunk), Trunk 4cm S (4-cm depth north-oriented trunk), Shade soil (soil temperature at 20-cm depth in a sunny area), Sunlit soil (soil temperature at 20-cm depth in a shaded area), and Air (air temperature).
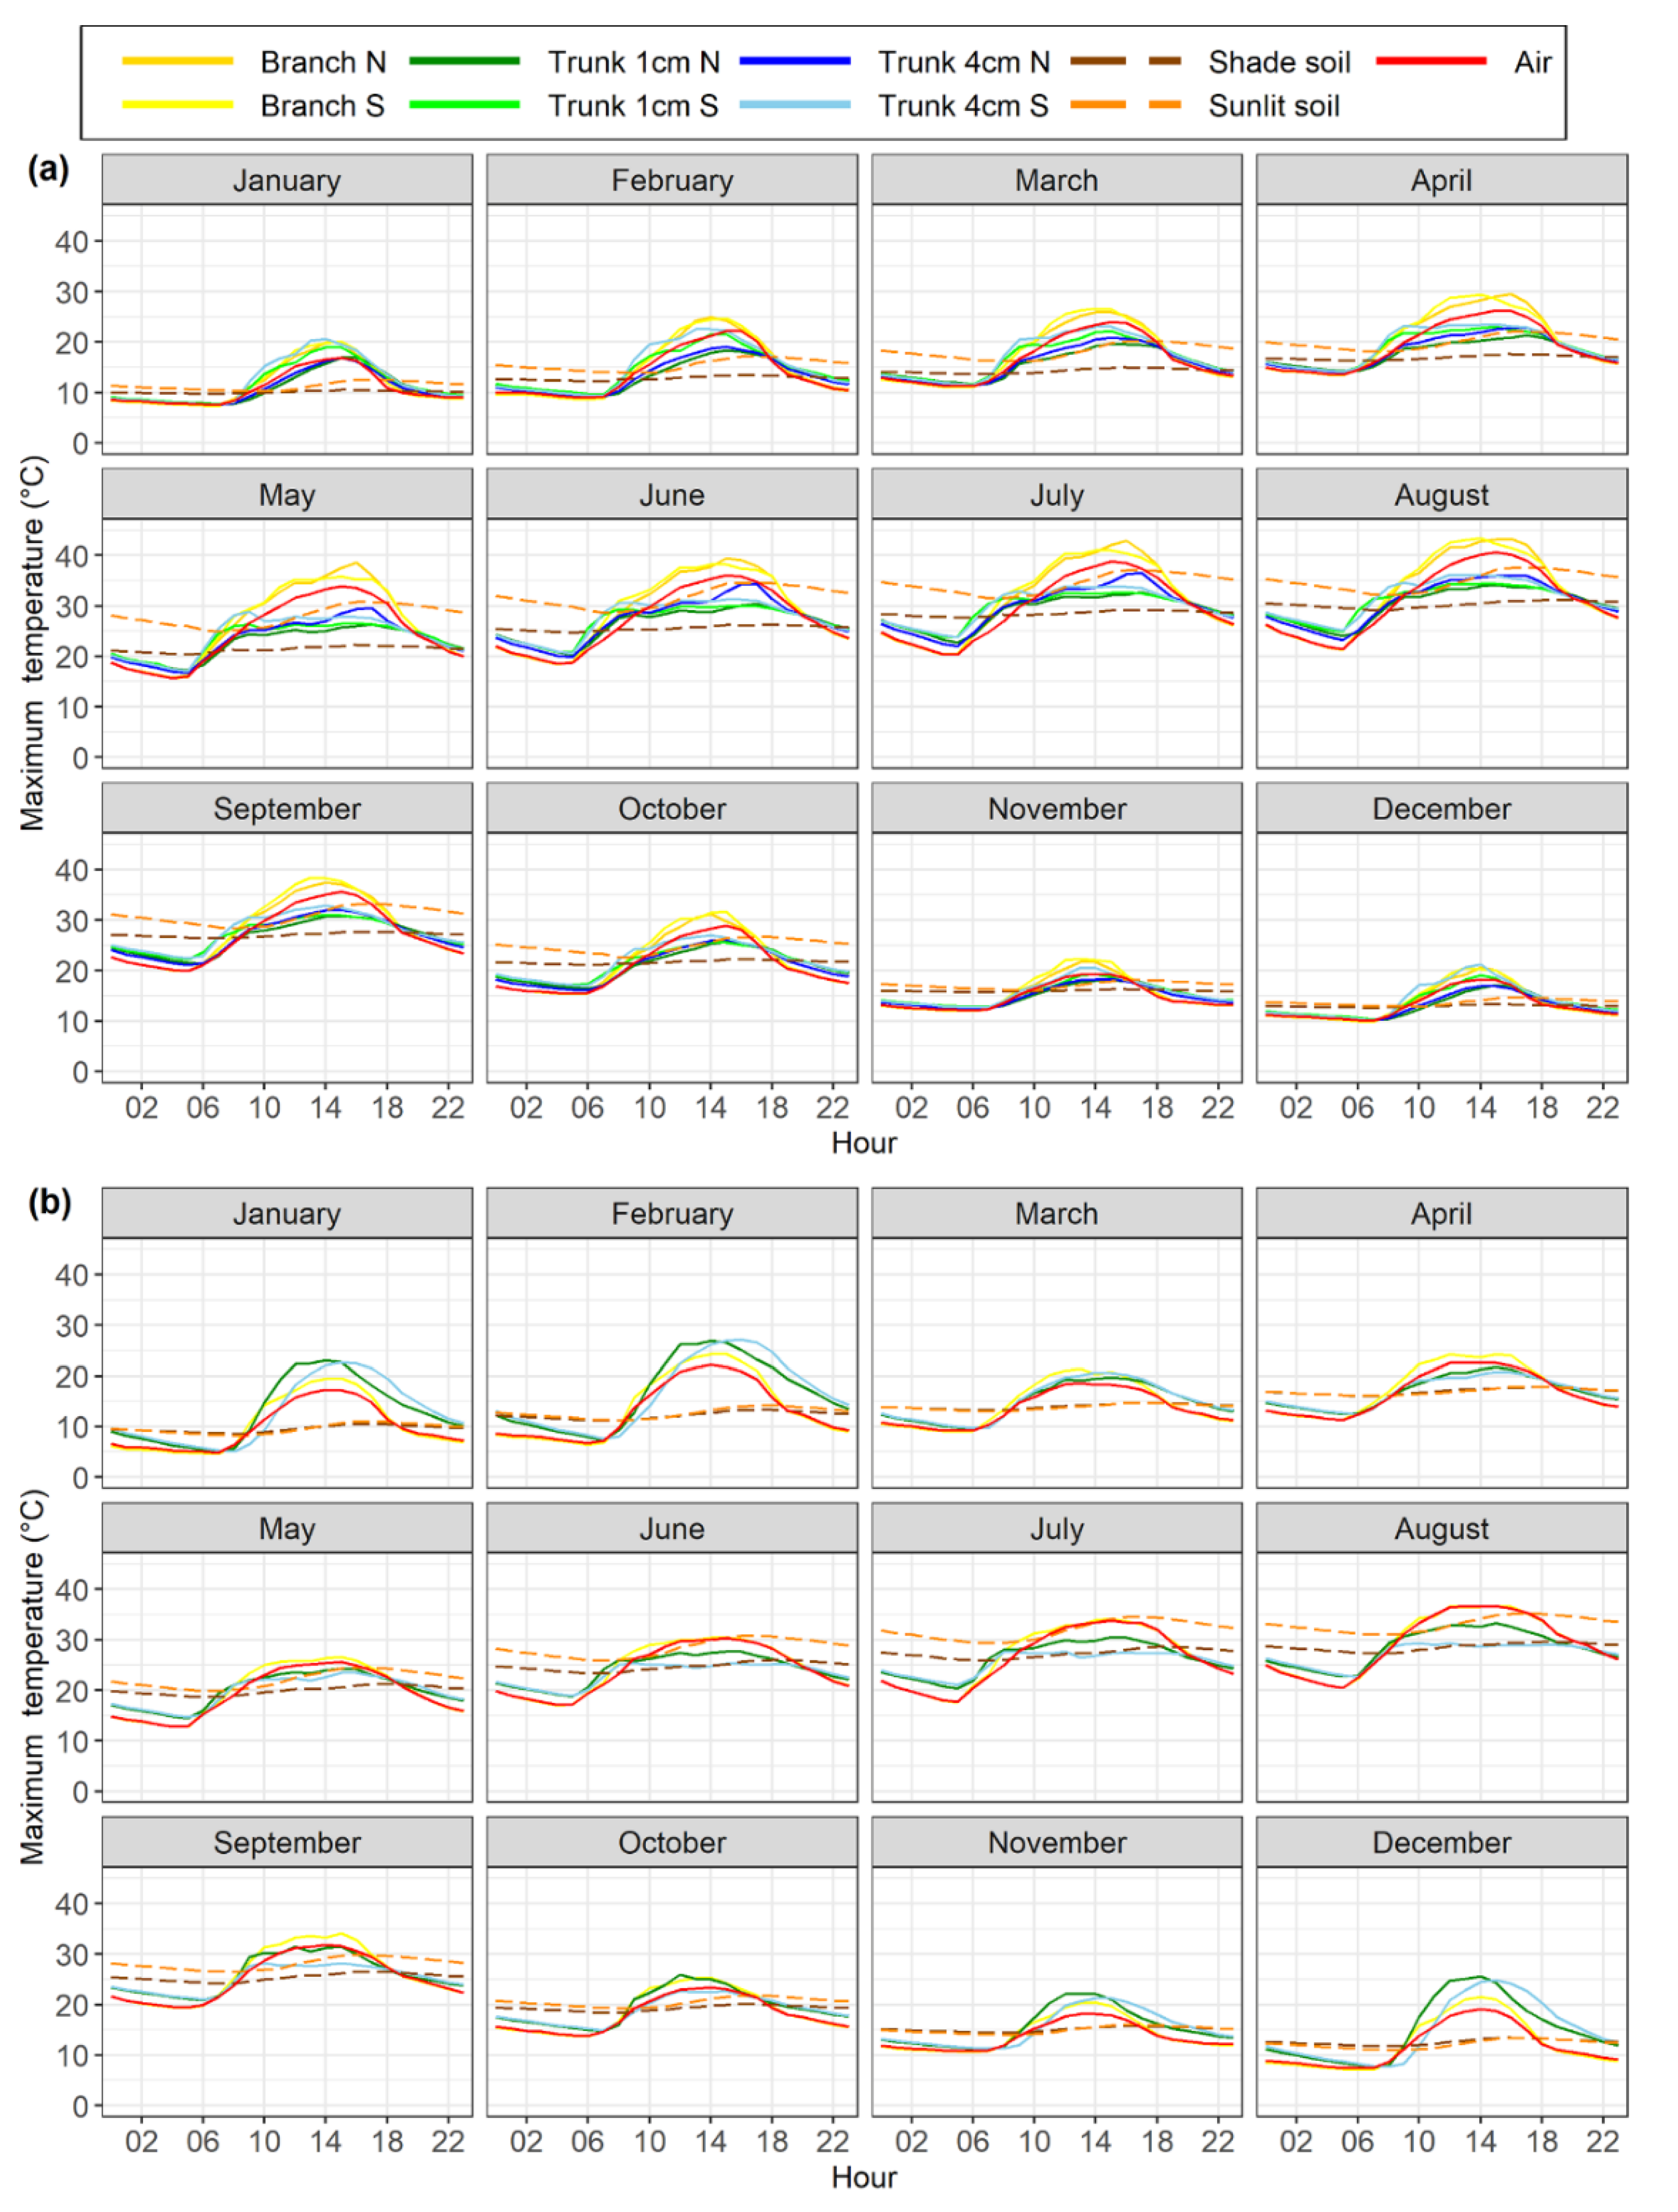
Figure 4.
Linear regression analysis describing the relationship between daily minimum temperatures recorded by different sensor types on tree branches and trunks and air temperature in the olive and almond orchards, described for each of the four seasons shown in different colours. (a) North oriented olive branch; (b)south oriented olive branch; (c) south oriented almond branch; (d) 1-cm depth north oriented olive trunk; (e) 1-cm depth south oriented olive trunk; (f) 1-cm depth north oriented almond trunk; (g) 4-cm depth north oriented olive trunk; (h) 4-cm depth south oriented olive trunk; (i) 4-cm depth south oriented almond trunk. Data were recorded from December 2017 to July 2020 for the olive orchard and from February 2018 to March 2019 for the almond orchard.
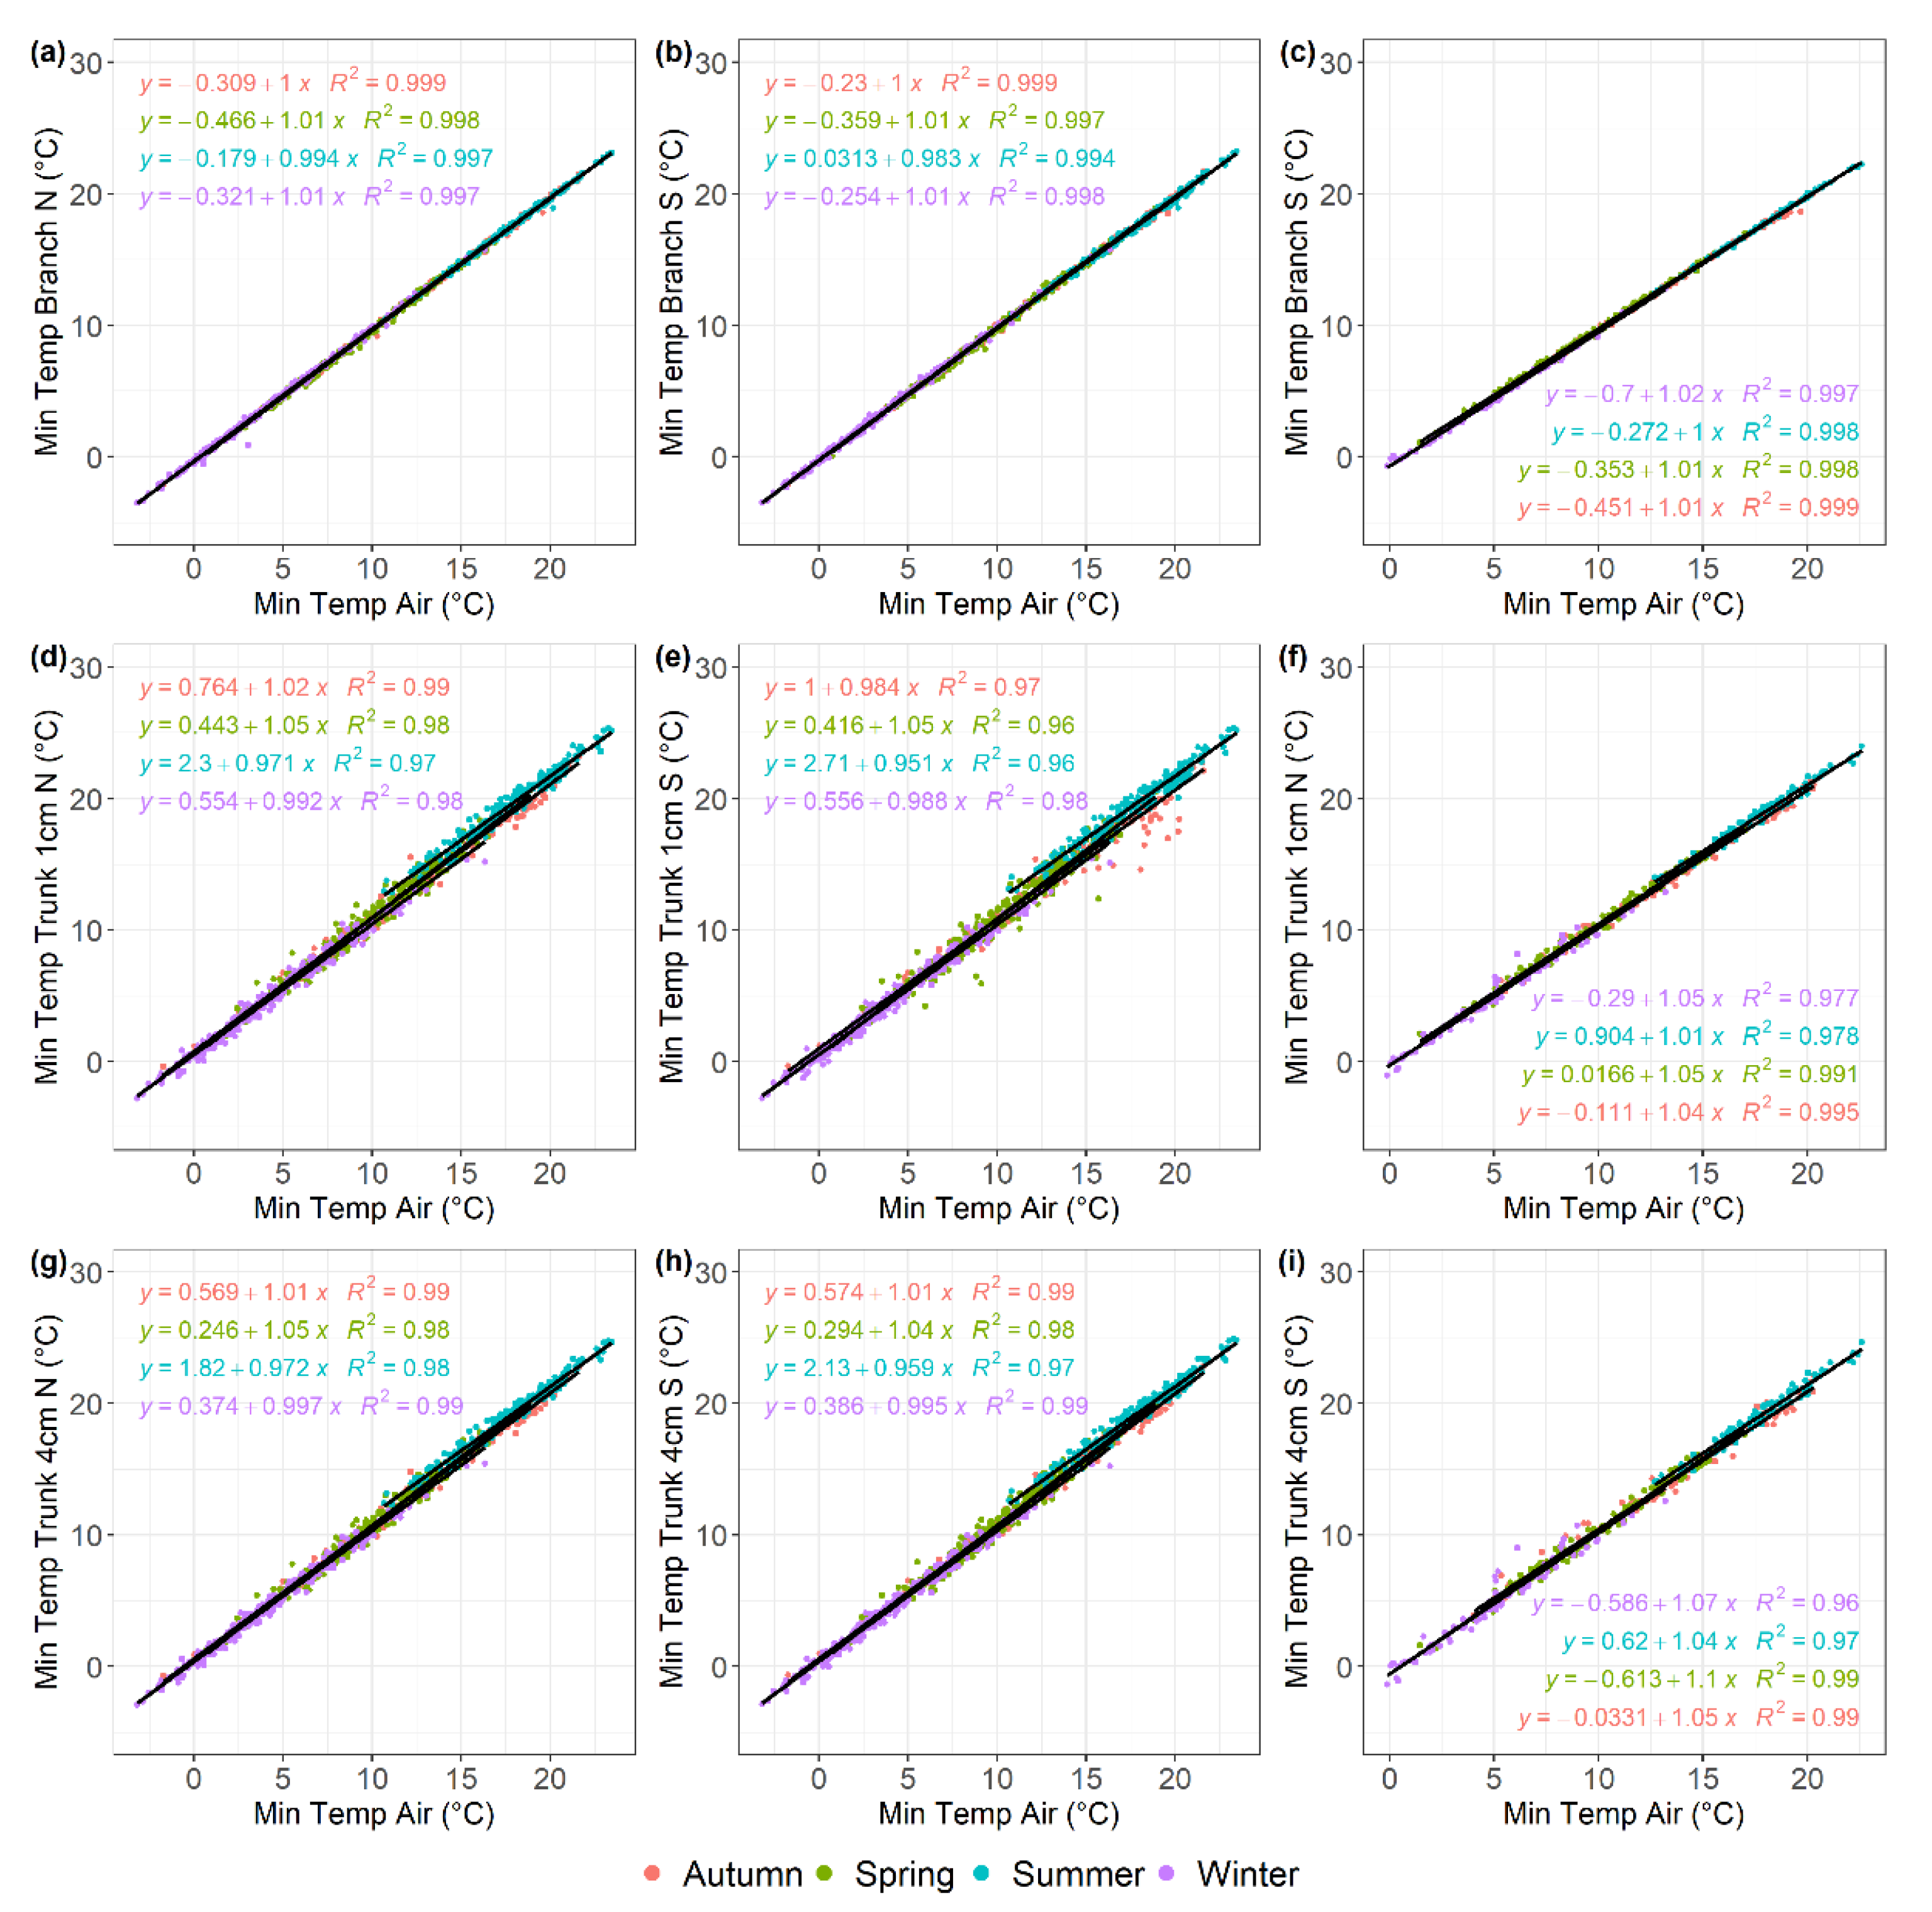
Figure 5.
Linear regression analysis describing the relationship between daily maximum temperatures recorded by different sensor types on tree branches and trunks and air temperature in the olive and almond orchards, described for each of the four seasons shown in different colours. (a) North oriented olive branch; (b)south oriented olive branch; (c) south oriented almond branch; (d) 1-cm depth north oriented olive trunk; (e)1-cm depth south oriented olive trunk; (f) 1-cm depth north oriented almond trunk; (g) 4-cm depth north oriented olive trunk; (h) 4-cm depth south oriented olive trunk; (i) 4-cm depth south oriented almond trunk. Data were recorded from December 2017 to July 2020 for the olive orchard and from February 2018 to March 2019 for the almond orchard.
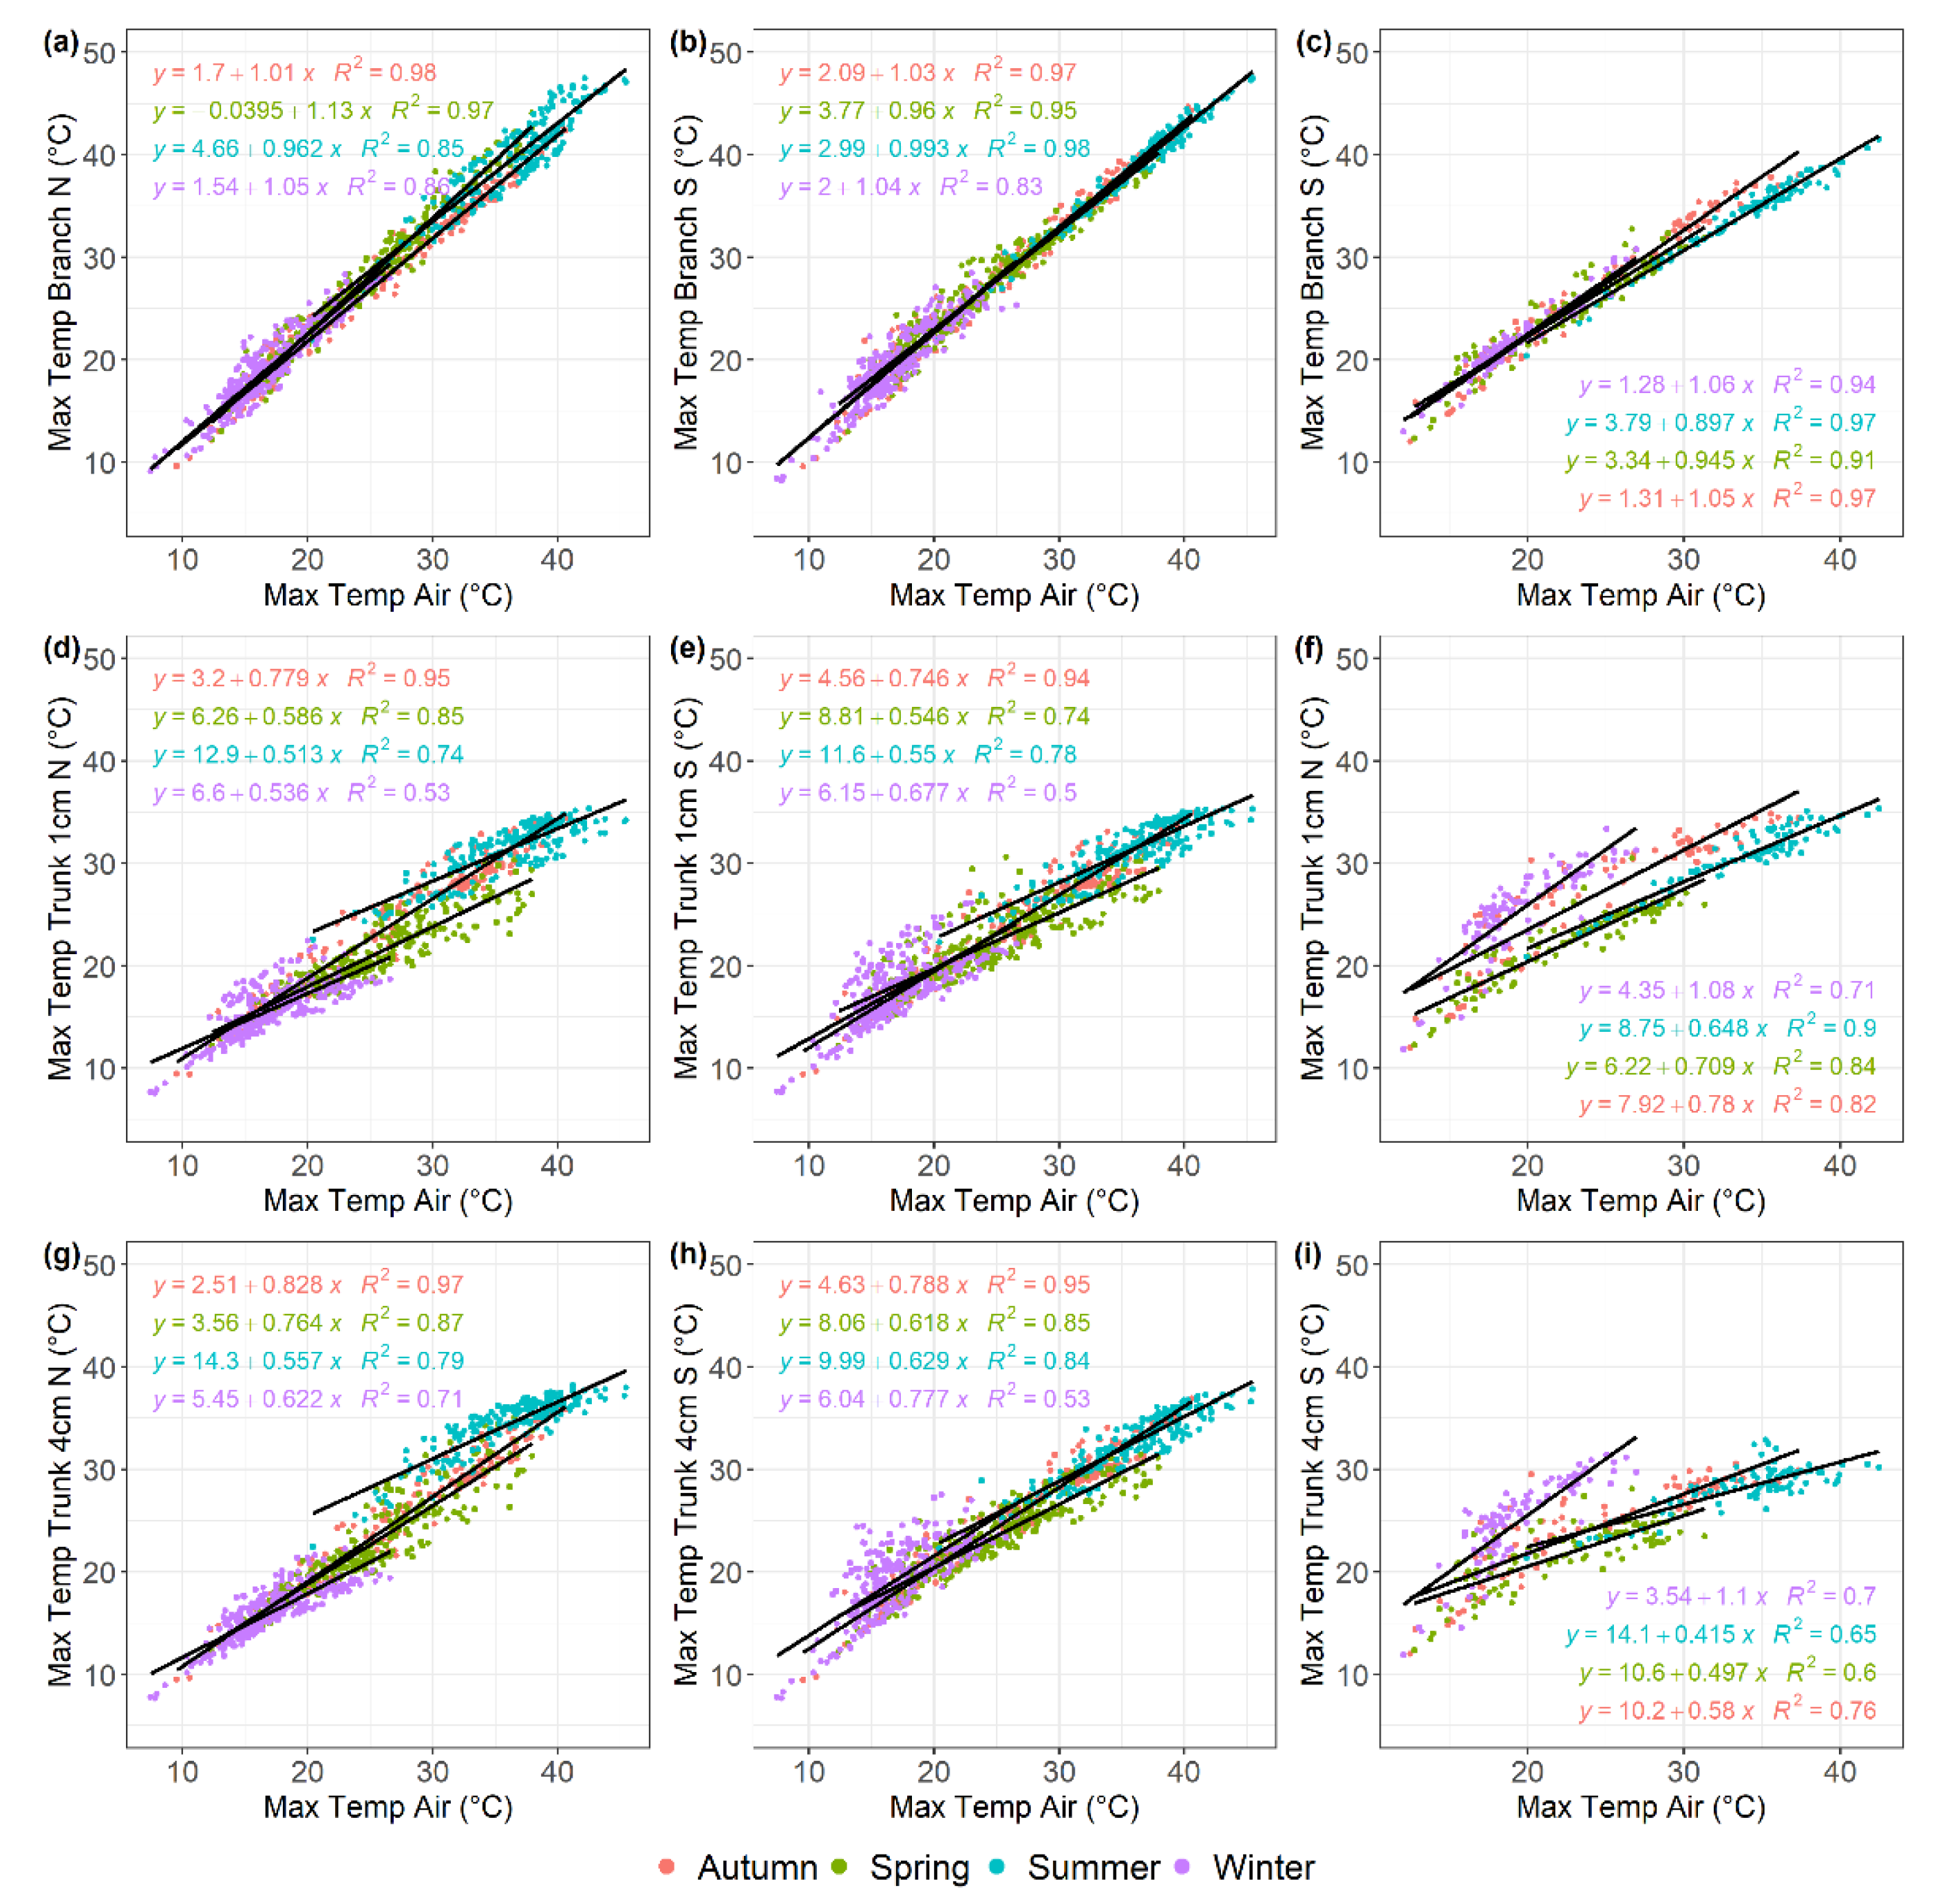
Figure 6.
Linear regression analysis describing the relationship between daily minimum and maximum temperatures recorded by soil sensors and air temperature in the olive (a-c-e-g) and almond orchard (b-d-f-h), across each of the four seasons, shown in different colours. (a-b) sunlit soil minimum temperature; (c-d) shade soil minimum temperature; (e-f) sunlit soil maximum temperature; (g-h) shade soil maximum temperature. Data were recorded from December 2017 to July 2020 for the olive orchard and from February 2018 to March 2019 for the almond orchard.
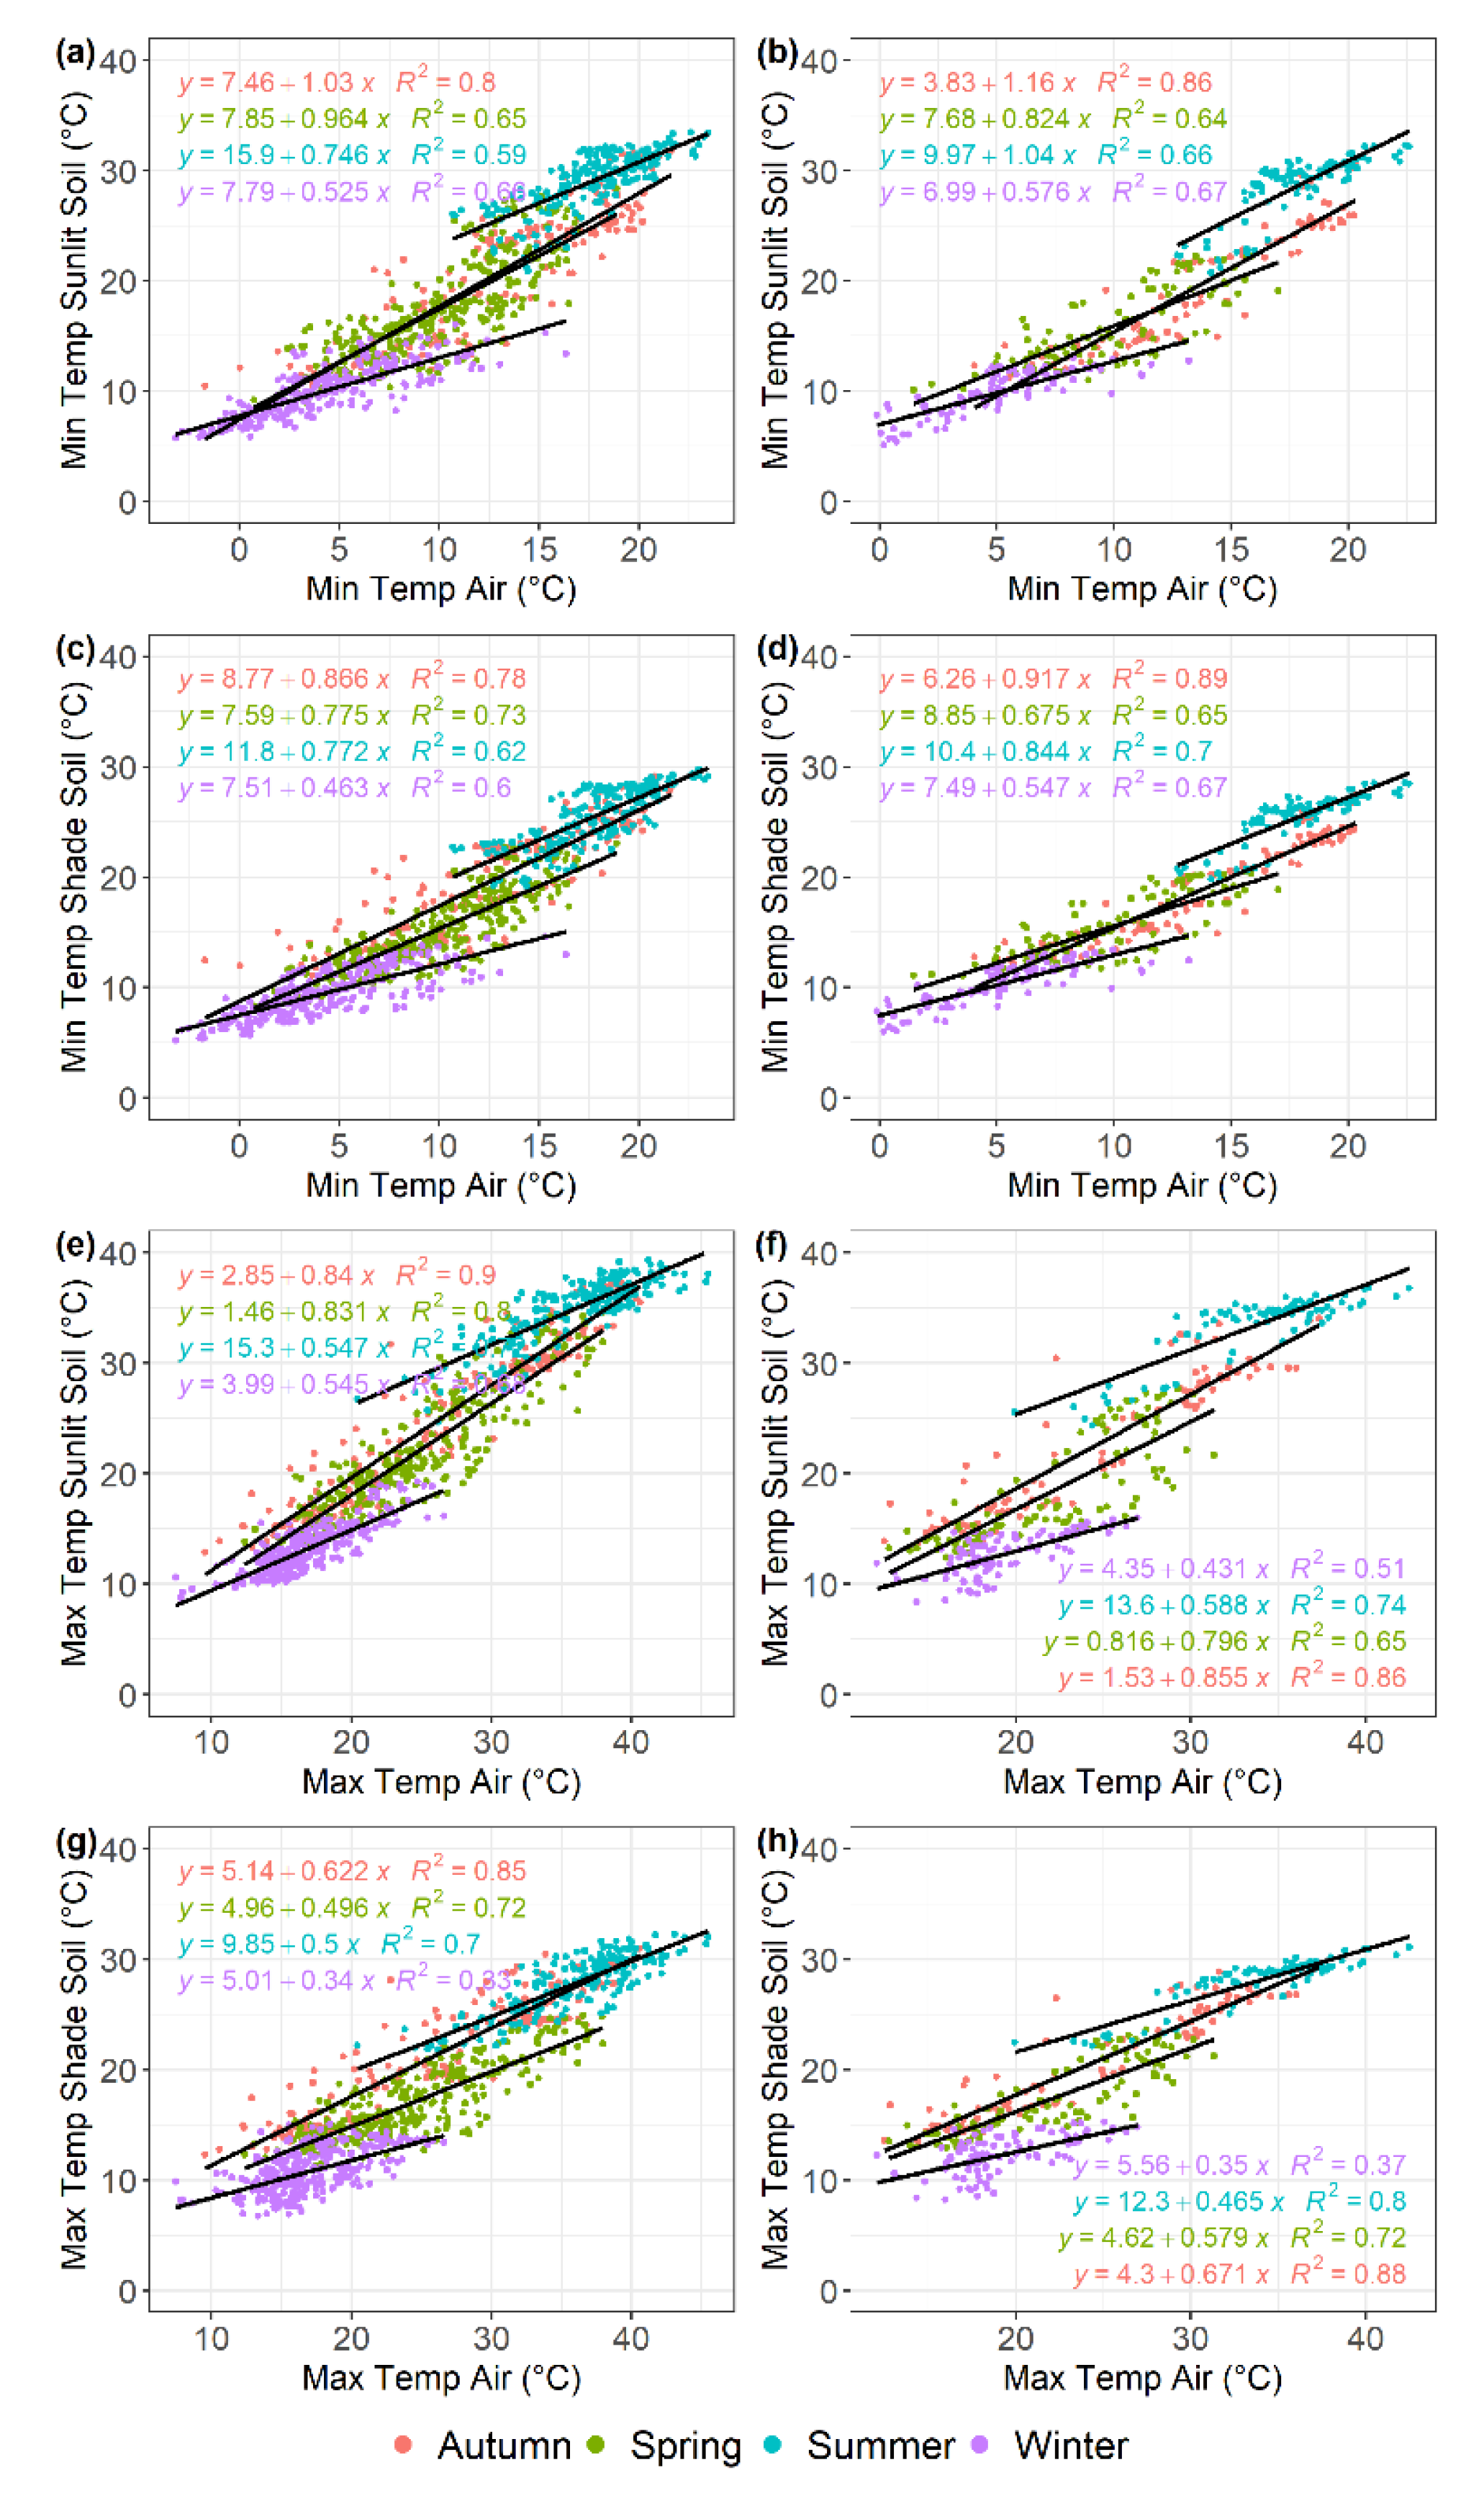

Table 1.
Average minimum and maximum temperatures (T) for air, soil, and xylem tissue measured with thermocouples at various positions in an olive and almond orcharda.
Table 1.
Average minimum and maximum temperatures (T) for air, soil, and xylem tissue measured with thermocouples at various positions in an olive and almond orcharda.
| T/ Crop/Month |
T air | T soil sunlit |
T soil shade |
T branch N |
T branch S |
T trunk 1cm N |
T trunk 1cm S | T trunk 4cm N |
T trunk 4cm S | |||||||||
|---|---|---|---|---|---|---|---|---|---|---|---|---|---|---|---|---|---|---|
| Minimum temperatures | ||||||||||||||||||
| Olive | ||||||||||||||||||
| January | 3.24 | b | 8.72 | a | 8.36 | a | 2.97 | b | 3.05 | b | 3.72 | b | 3.73 | b | 3.57 | b | 3.58 | b |
| February | 4.26 | b | 10.88 | a | 9.69 | a | 3.94 | b | 4.04 | b | 4.84 | b | 4.80 | b | 4.65 | b | 4.67 | b |
| March | 7.01 | cd | 13.84 | a | 12.21 | b | 6.62 | d | 6.75 | cd | 7.72 | c | 7.58 | cd | 7.50 | cd | 7.51 | cd |
| April | 9.80 | cd | 16.17 | a | 14.74 | b | 9.41 | d | 9.53 | d | 10.64 | c | 10.59 | c | 10.42 | cd | 10.41 | cd |
| May | 13.20 | d | 22.43 | a | 19.06 | b | 12.88 | d | 13.04 | d | 14.51 | c | 14.45 | c | 14.21 | c | 14.23 | c |
| June | 15.84 | d | 26.72 | a | 22.96 | b | 15.56 | d | 15.62 | d | 17.57 | c | 17.66 | c | 17.16 | c | 17.21 | c |
| July | 18.37 | d | 30.05 | a | 26.08 | b | 18.09 | d | 18.04 | d | 20.17 | c | 20.24 | c | 19.71 | c | 19.79 | c |
| August | 19.58 | d | 31.16 | a | 28.15 | b | 19.26 | d | 19.31 | d | 21.42 | c | 21.43 | c | 20.92 | c | 20.96 | c |
| September | 18.05 | de | 26.81 | a | 25.38 | b | 17.74 | e | 17.79 | e | 19.16 | c | 18.76 | cd | 18.85 | cd | 18.83 | cd |
| October | 12.35 | bc | 20.89 | a | 20.06 | a | 12.08 | c | 12.14 | c | 13.45 | b | 13.38 | b | 13.16 | bc | 13.11 | bc |
| November | 8.24 | b | 14.27 | a | 14.32 | a | 7.95 | b | 8.04 | b | 8.98 | b | 8.87 | b | 8.77 | b | 8.79 | b |
| December | 5.11 | b | 10.47 | a | 10.36 | a | 4.82 | b | 4.90 | b | 5.62 | b | 5.60 | b | 5.48 | b | 5.47 | b |
| Almond | ||||||||||||||||||
| January | 3.80 | b | 8.15 | a | 8.52 | a | 3.15 | b | 3.76 | b | 3.67 | b | ||||||
| February | 5.28 | b | 10.80 | a | 10.74 | a | 4.70 | b | 5.27 | b | 5.01 | b | ||||||
| March | 7.74 | b | 12.71 | a | 12.90 | a | 7.47 | b | 7.93 | b | 7.74 | b | ||||||
| April | 10.48 | b | 15.95 | a | 15.90 | a | 10.32 | b | 11.01 | b | 10.79 | b | ||||||
| May | 12.15 | d | 19.74 | a | 18.55 | b | 11.90 | d | 12.92 | c | 12.94 | c | ||||||
| June | 16.51 | d | 25.78 | a | 23.26 | b | 16.31 | d | 17.33 | c | 17.56 | c | ||||||
| July | 17.19 | d | 29.22 | a | 25.79 | b | 16.99 | d | 18.32 | c | 18.62 | c | ||||||
| August | 19.94 | d | 30.92 | a | 27.26 | b | 19.75 | d | 21.05 | c | 21.45 | c | ||||||
| September | 18.76 | d | 26.31 | a | 24.06 | b | 18.48 | d | 19.40 | c | 19.60 | c | ||||||
| October | 12.92 | cd | 18.97 | a | 18.15 | b | 12.63 | d | 13.28 | cd | 13.45 | c | ||||||
| November | 9.50 | bc | 13.86 | a | 14.35 | a | 9.16 | c | 9.78 | bc | 9.93 | b | ||||||
| December | 6.52 | cd | 10.84 | b | 11.68 | a | 5.92 | d | 6.41 | c | 6.29 | cd | ||||||
| Maximum temperatures | ||||||||||||||||||
| Olive | ||||||||||||||||||
| January | 15.11 | c | 11.76 | d | 9.59 | e | 17.62 | a | 17.83 | a | 14.58 | c | 16.29 | b | 14.77 | c | 17.80 | a |
| February | 19.52 | c | 14.93 | e | 11.30 | f | 22.07 | ab | 22.60 | a | 16.84 | d | 19.40 | c | 17.53 | d | 20.98 | b |
| March | 20.99 | b | 17.82 | d | 14.05 | e | 23.21 | a | 23.96 | a | 18.16 | cd | 20.38 | b | 19.04 | c | 21.28 | b |
| April | 22.90 | b | 20.06 | de | 16.49 | f | 25.92 | a | 25.96 | a | 19.38 | e | 20.81 | cd | 20.69 | cde | 21.70 | bc |
| May | 29.99 | c | 27.84 | d | 21.01 | g | 34.18 | a | 32.33 | b | 24.51 | f | 25.60 | ef | 27.37 | d | 26.87 | de |
| June | 32.74 | b | 32.44 | b | 25.16 | d | 36.17 | a | 35.26 | a | 28.79 | c | 28.77 | c | 32.20 | b | 29.77 | c |
| July | 37.01 | b | 36.14 | bc | 28.61 | f | 40.23 | a | 39.76 | a | 32.22 | e | 32.17 | e | 35.93 | c | 33.35 | d |
| August | 39.15 | b | 36.92 | c | 30.48 | f | 42.29 | a | 42.16 | a | 33.71 | e | 34.08 | e | 35.60 | d | 35.55 | d |
| September | 33.56 | b | 31.84 | c | 27.07 | e | 35.32 | a | 36.51 | a | 29.77 | d | 30.10 | d | 30.68 | cd | 31.44 | c |
| October | 26.73 | b | 25.36 | bc | 21.58 | d | 28.54 | a | 29.40 | a | 24.00 | c | 24.28 | c | 24.53 | c | 25.34 | bc |
| November | 17.67 | cd | 16.82 | d | 15.29 | e | 19.69 | ab | 20.55 | a | 16.60 | de | 17.44 | cd | 16.86 | d | 18.56 | bc |
| December | 16.41 | bc | 13.14 | d | 11.50 | e | 18.35 | a | 18.72 | a | 15.72 | c | 17.30 | b | 15.78 | c | 18.96 | a |
| Almond | ||||||||||||||||||
| January | 17.44 | c | 11.01 | d | 10.52 | d | 20.03 | b | 23.55 | a | 22.89 | a | ||||||
| February | 21.28 | c | 13.59 | d | 13.00 | d | 23.59 | b | 26.30 | a | 26.55 | a | ||||||
| March | 18.71 | b | 14.55 | c | 14.49 | c | 21.55 | a | 20.15 | ab | 20.71 | a | ||||||
| April | 23.27 | b | 17.85 | d | 17.79 | d | 25.39 | a | 21.92 | c | 20.95 | c | ||||||
| May | 26.14 | b | 24.56 | c | 21.25 | e | 27.29 | a | 24.72 | c | 23.75 | d | ||||||
| June | 30.73 | a | 30.84 | a | 26.03 | c | 31.00 | a | 28.03 | b | 26.15 | c | ||||||
| July | 33.86 | a | 34.52 | a | 28.62 | c | 34.24 | a | 30.63 | b | 28.75 | c | ||||||
| August | 37.05 | a | 35.17 | b | 29.58 | d | 37.26 | a | 33.48 | c | 29.70 | d | ||||||
| September | 31.91 | b | 29.89 | c | 26.54 | e | 34.57 | a | 32.00 | b | 28.64 | d | ||||||
| October | 23.78 | b | 22.05 | c | 20.28 | d | 26.05 | a | 26.64 | a | 23.36 | bc | ||||||
| November | 18.41 | c | 16.04 | d | 15.76 | d | 20.78 | b | 22.94 | a | 21.62 | ab | ||||||
| December | 19.16 | c | 13.40 | d | 13.43 | d | 21.71 | b | 25.90 | a | 24.90 | a | ||||||
a Values are the mean of the minimum and maximum temperature values for each day throughout the measured period by sensor and month. For each sensor and tree species within a month, values with a same letter are not significantly different according to the post hoc Tukey’s honestly significant difference (HSD) test, at a significance level of P<0.05.
Table 2.
Least-square adjusted means from the linear model relating minimum and maximum plant and soil-system temperatures with air minimum and maximum temperatures for each sensor type and season in olive and almond orchards.
Table 2.
Least-square adjusted means from the linear model relating minimum and maximum plant and soil-system temperatures with air minimum and maximum temperatures for each sensor type and season in olive and almond orchards.
| Temperature Crop/Sensor | Season | |||||||
|---|---|---|---|---|---|---|---|---|
| Winter | Spring | Summer | Autumn | |||||
| Minimum temperatures | ||||||||
| Olive orchard | ||||||||
| Branch N | 9.97 | C d | 10.17 | AB d | 10.60 | A e | 10.38 | BC d |
| Branch S | 10.06 | C d | 10.30 | AB d | 10.63 | A e | 10.45 | BC d |
| Trunk 1 cm N | 10.78 | C c | 11.49 | B c | 12.69 | A c | 11.65 | B c |
| Trunk 1 cm S | 10.77 | C c | 11.41 | B c | 12.74 | A c | 11.46 | B c |
| Trunk 4 cm N | 10.63 | C c | 11.24 | B c | 12.23 | A d | 11.38 | B c |
| Trunk 4 cm S | 10.63 | C c | 11.25 | B c | 12.29 | A d | 11.37 | B c |
| Shade soil | 15.53 | D b | 15.87 | C b | 18.66 | A b | 17.72 | B b |
| Sunlit soil | 16.06 | D a | 18.02 | C a | 22.25 | A a | 18.46 | B a |
| Almond orchard | ||||||||
| Branch N | 10.71 | B c | 11.24 | A c | 11.54 | A d | 11.29 | A d |
| Trunk 1 cm N | 11.27 | C b | 11.94 | B b | 12.76 | A c | 12.02 | B c |
| Trunk 4 cm S | 11.11 | C bc | 11.81 | B b | 13.07 | A c | 12.20 | B c |
| Shade soil | 16.46 | C a | 17.10 | B a | 19.30 | A b | 16.72 | BC b |
| Sunlit soil | 16.10 | C a | 17.41 | B a | 22.51 | A a | 17.59 | B a |
| Maximum temperatures | ||||||||
| Olive orchard | ||||||||
| Branch N | 25.51 | D a | 28.16 | B a | 31.02 | A a | 27.20 | C b |
| Branch S | 25.88 | C a | 27.80 | B a | 30.49 | A a | 28.17 | B a |
| Trunk 1 cm N | 21.92 | B c | 21.07 | C d | 23.07 | A d | 22.81 | A d |
| Trunk 1 cm S | 23.85 | A b | 22.65 | C c | 23.16 | B d | 23.29 | B d |
| Trunk 4 cm N | 22.22 | D c | 22.76 | C c | 26.10 | A b | 23.37 | B d |
| Trunk 4 cm S | 25.43 | A a | 23.67 | C b | 24.37 | B c | 24.46 | B c |
| Shade soil | 17.01 | D e | 17.56 | C e | 19.57 | B e | 20.66 | A e |
| Sunlit soil | 19.47 | D d | 22.30 | C c | 26.67 | A b | 24.03 | B c |
| Almond orchard | ||||||||
| Branch N | 25.94 | B b | 26.36 | C a | 27.61 | A a | 27.31 | A a |
| Trunk 1 cm N | 29.37 | B a | 23.97 | B b | 24.15 | A b | 27.37 | A a |
| Trunk 4 cm S | 28.94 | A a | 23.60 | C b | 21.64 | C c | 24.71 | B b |
| Shade soil | 16.41 | C c | 19.45 | B d | 21.51 | A c | 21.04 | A d |
| Sunlit soil | 16.78 | D c | 20.52 | C c | 26.95 | A a | 22.84 | B c |
a For each sensor type (rows), values sharing the same uppercase letter and for each season (columns), values sharing the same lowercase letter are not significantly different according to the post hoc Tukey’s honestly significant difference (HSD) test, at a significance level of P<0.05.
Disclaimer/Publisher’s Note: The statements, opinions and data contained in all publications are solely those of the individual author(s) and contributor(s) and not of MDPI and/or the editor(s). MDPI and/or the editor(s) disclaim responsibility for any injury to people or property resulting from any ideas, methods, instructions or products referred to in the content. |
© 2025 by the authors. Licensee MDPI, Basel, Switzerland. This article is an open access article distributed under the terms and conditions of the Creative Commons Attribution (CC BY) license (http://creativecommons.org/licenses/by/4.0/).
Copyright: This open access article is published under a Creative Commons CC BY 4.0 license, which permit the free download, distribution, and reuse, provided that the author and preprint are cited in any reuse.


