
Submitted:
26 September 2025
Posted:
30 September 2025
You are already at the latest version
Abstract
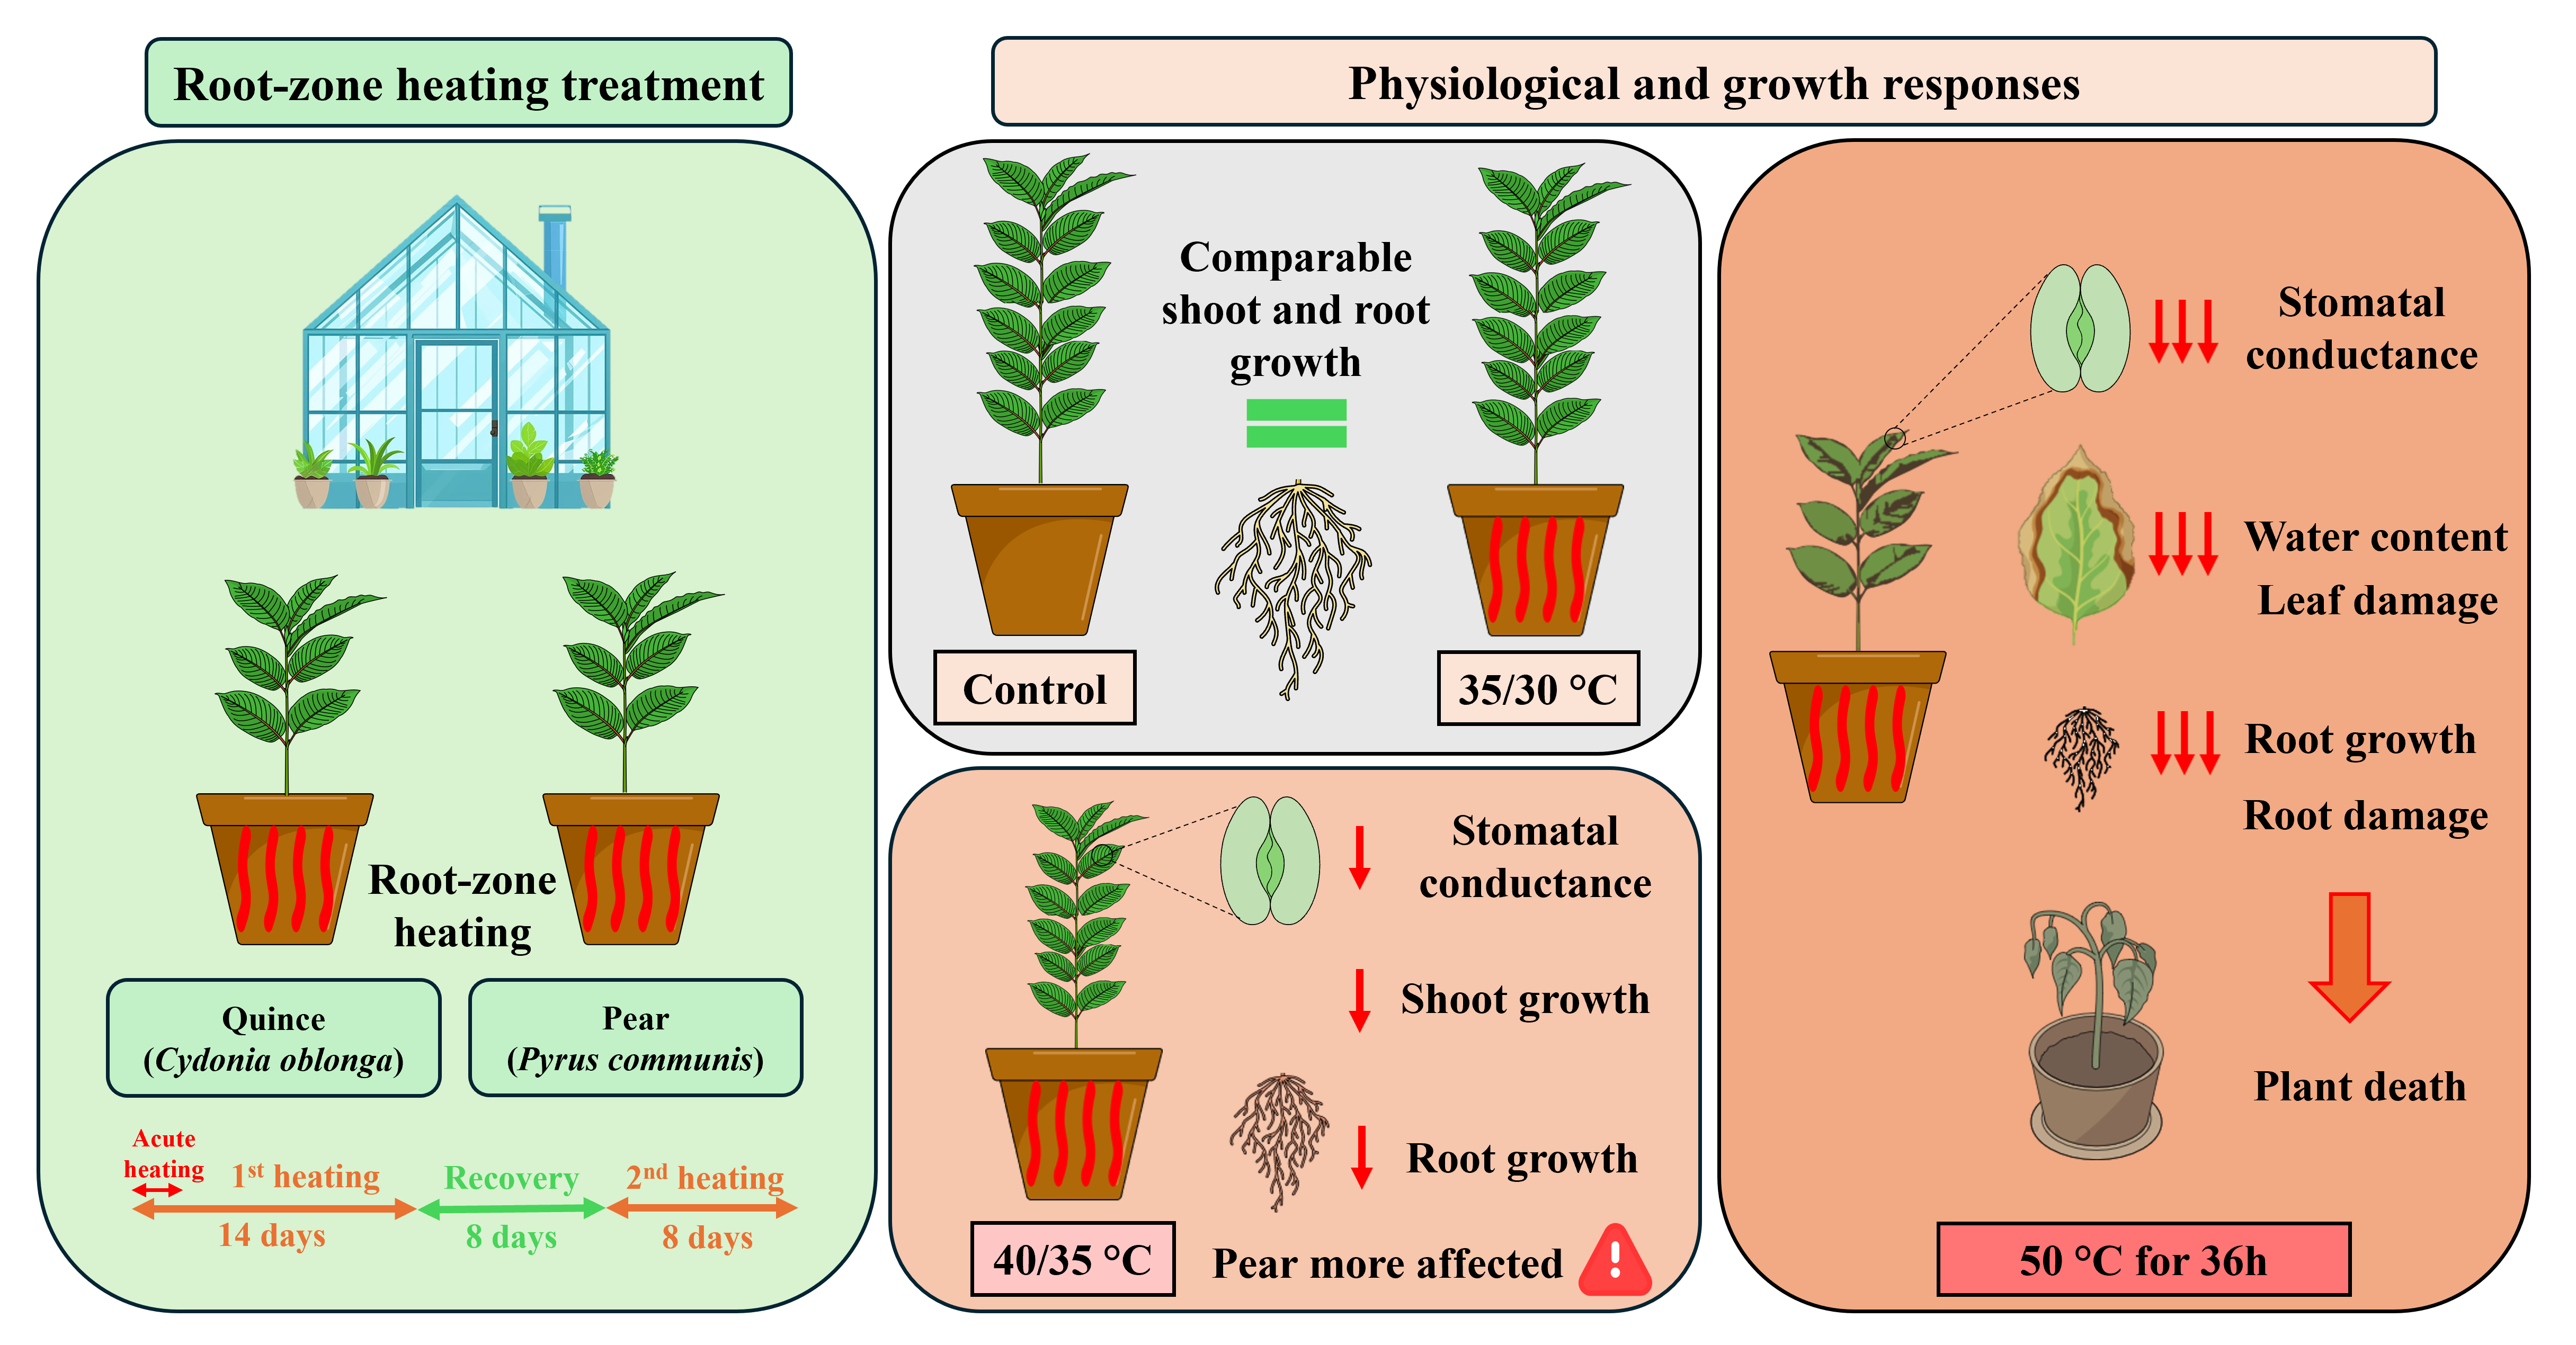
Global warming, with rising average temperatures and increasingly frequent extreme heat events, poses a major threat to fruit production systems and food security. Understanding how fruit trees respond to soil thermal stress is therefore critical for developing climate-resilient orchards. In this study, we investigated the physiological and growth responses of potted pear (Pyrus communis) and quince (Cydonia oblonga) plants to root-zone heating. Plants were exposed to different substrate heating regimes, and gas exchange, water status, chlorophyll content, shoot growth, and biomass allocation were assessed. Short-term extreme heating (50 °C for 36 h) caused immediate reductions in gas exchange, severe root and shoot damage, and rapid plant mortality in both species. By contrast, prolonged heating at 40/35 °C induced significant declines in gas exchange, shoot growth, and root biomass, with species-specific differences. Pear exhibited greater sensitivity than quince, showing lower shoot growth, root dry weight, and gas exchange. These findings highlight the vulnerability of pear trees to high root-zone temperatures and the limited contrast between the tested rootstocks. Accordingly, there is a clear need for targeted soil management practices that promote root growth and soil exploration to enhance orchard resilience under future climate scenarios.
Keywords:
heat stress
; pear
; quince
; soil
; root growth
; physiology
1. Introduction
Currently, climate change and the increasing global population and food demand are among the main challenges for sustainable crop production. The frequency and intensity of extreme weather events are rising, posing a growing threat to agriculture and food security [1]. Among abiotic drivers of climate change, high temperature is one of the most critical constraints, with negative impacts on fruit tree growth, development, and productivity, and in some cases threatening fruit yield and quality [2,3]. High temperatures often coincide with other stressors, such as drought, which can further amplify the detrimental effects of heat stress. With increasingly extreme summer conditions, the areas suitable for cultivating fruit trees are expected to diminish in the future [4].
Heat stress in fruit trees affects biological processes from the cellular to the whole-plant level [5]. Reported physiological injuries include leaf scorching, premature senescence and abscission, inhibition of shoot and root growth, and reductions in photosynthetic efficiency, which ultimately decrease tree productivity [6,7,8,9]. In addition, elevated temperatures increase evapotranspiration, thereby raising the irrigation demand of fruit orchards [10]. Even brief episodes of heat stress can significantly impair photosynthesis by damaging PSII reaction centers, inhibiting Rubisco activity, and lowering overall photosynthetic performance [11,12].
Soil temperature is a critical component of the plant-soil-atmosphere continuum, influencing both soil processes and plant physiology. Recent evidence highlights a progressive increase in soil temperature in Northern European countries, with projections suggesting even stronger trends in Southern Europe [13]. Seasonal soil warming is further amplified by reduced soil moisture in the upper layers, which decreases the soil’s thermal buffering capacity. Beyond climate, soil characteristics (texture, color, and organic matter content), management practices (tillage, irrigation, and mulching) [14], and orchard characteristics (density, canopy size, and row orientation) can significantly influence soil temperature [15].
Although most studies of heat stress in trees focus on air temperatures and canopy responses, studies on soil temperatures and the impact of heat stress on plant ecophysiology and root biology are very limited and have focused primarily on annual crops and grassland species [16].
In general, elevated soil temperatures impair photosynthetic performance by reducing carboxylation efficiency and disrupting carbon assimilation [17]. These changes are often accompanied by a decline in stomatal conductance and leaf relative water content, together with an accumulation of intercellular CO₂.
Root growth generally increases with soil temperature up to a species-specific optimum but declines beyond this threshold [18]. High soil temperatures can directly inhibit root elongation and proliferation, alter root architecture by reducing branching and fine root development, and accelerate root senescence and turnover [19,20]. Both chronic and acute root-zone heating can impair root development and function, reducing water and nutrient uptake and consequently limiting aboveground growth [21,22].
The challenges posed by high temperatures are further exacerbated in modern intensive fruit orchard systems. High-density plantings, commonly used in modern pear orchards, rely on dwarfing rootstocks to promote early production and manage canopy size [23], and are often characterized by frequent replanting conditions. These conditions may extend soil sickness, as reported for apple [24,25], because dwarf rootstocks are characterized by shallow root systems and may increase tree susceptibility to soil temperature fluctuations and water stress [26]. The vulnerability to sudden climatic extremes could accelerate senescence and shorten orchard lifespan, especially in southern European countries in the Mediterranean basin [22,27]. In this region, characterized by a warm transitional climate with xeric soil moisture regimes, precipitation is concentrated in winter while summers are dry [15].
Quince (Cydonia oblonga) is the most widely used dwarfing rootstock for the pear industry because of its strong size-control effect and compatibility with many pear cultivars [28]. However, its sensitivity to abiotic stress, particularly heat and drought, has raised concerns about its resilience under future climate scenarios [29]. In vitro-propagated pear, on the other hand, is emerging as a potential alternative rootstock [28], but its response to high soil temperature remains poorly understood.
Despite the growing importance of root-zone stress under climate change, little is known about how pear and quince root systems respond to elevated soil temperatures. To the best of our knowledge, no study has investigated the response of pear and quince to high soil temperature. Therefore, the objective of this study was to evaluate the physiological responses and the canopy and root growth of pear and quince potted plants grown in a glasshouse subjected to root-zone heating. Understanding these responses is essential to provide insights into the potential role of rootstocks in mitigating the effects of soil warming in intensive pear orchards.
2. Materials and Methods
2.1. Plant Material and Growth Conditions
One-year-old micropropagated pear plants (Pyrus communis L., cv. Williams) and bare root quince (Cydonia oblonga Mill., cv. BA29) plants were used in this study. On 30 April 2024, dormant plants (before bud break) were transplanted into 7-liter polyethylene pots filled with substrate composed of 90% lapilli and pumice mix and 10% of zeolite enriched with Leonardite. Before potting, roots were pruned, all lateral shoots were removed, and the main stems were cut to a uniform height of 40 cm above the substrate surface. Plants were grown inside the experimental glasshouse of the Department of Agriculture, Food and Environmental Sciences at the Polytechnic University of Marche, Ancona, where environmental parameters were not artificially controlled but maintained at ambient conditions (Figure 1). Roof vents opened and closed automatically to moderate temperature, and from June onward, a shading net was deployed to limit excess irradiance. During the experiment, the plants were irrigated two to three times daily with 100 mL per irrigation. All plants were fertilized equally with 10g per plant of slow-release NPK fertilizer (NPK Original Gold, COMPO EXPERT), and a standard pest control protocol was applied throughout the experiment.
2.2. Experimental Design and Treatments
After the establishment period (from planting date to 16 June 2024), a total of 60 plants were arranged in a completely randomized design. Root-zone heating treatment was applied by wrapping heating cables around each pot and regulating substrate temperature with programmable thermostats equipped with probes. To limit heat dissipation, all pots (including controls) were then surrounded by an insulating film, and the substrate surface was covered with a 20mm thick polystyrene sheet.
Treatments consisted of applying two day/night root-zone temperature regimes: 35/30 °C and 40/35 °C. The higher temperature was applied from 8 am to 6 pm and the lower from 6 pm to 8 am. Control plants were maintained at ambient substrate temperature (Figure 1). All treatments began on 17 June 2024 and lasted for 14 days, followed by an 8-day recovery at ambient substrate temperature, after which a second 8-day root-zone heating identical to the first one was imposed. In addition to these heating treatments, a short acute heating was imposed by raising substrate temperature to an average of 50 °C for 36 hours on five plants per species, after which heating ceased and the pots' substrate returned to ambient conditions.
Temperature data loggers (Elitech RC-5+; ±0.5 °C accuracy, Elitech Ltd., London, United Kingdom) equipped with probes were inserted at 8 cm depth in one pot of each treatment, and temperature was registered at 10-minute intervals. Air temperature and relative humidity inside the greenhouse were monitored and registered using a temperature data logger.
2.3. Measurements
Net photosynthetic rate (Pn, µmol CO2 m-2s-1), transpiration rate (E, mmol H2O m-2s-1), and stomatal conductance (gs, mmol H2O m-2s-1) were measured on one fully expanded leaf per plant using an ADC-LCA3 portable infrared gas analyzer (ADC Bioscientific Ltd., Hoddesdon, UK). Measurements were taken with at least five replicates per treatment. Water use efficiency (WUE) was then calculated as the ratio of Pn to E. Leaf gas exchange measurements were performed on Day 4, 12 (first heating), 22 (end of the recovery), and 31 (end of the second heating). The first two measurements were performed under natural greenhouse irradiance. The other subsequent measurements were conducted using the instrument’s artificial light source set to deliver 800 μmol m-2 s-1 at the leaf surface (Qleaf). Leaf chlorophyll content index (CCI) was assessed with a chlorophyll content meter (Apogee Instruments, North Logan, USA) on all plants, using two fully expanded leaves per plant. One reading per leaf was taken and averaged for each plant.
The leaf relative water content was determined at Day 10 (first heating) and at the end of the recovery period. Leaves were sampled and immediately weighed to obtain fresh weight (FW), then were immersed in distilled water and kept in the dark at 4 °C for 24 h, then weighed to determine the turgid weight (TW). Finally, leaves were oven-dried at 60 °C to constant weight, and dry weight (DW) was recorded. Leaf relative water content (RWC) was calculated as follows:
RWC (%) = (FW−DW) / (TW−DW) × 100
Plant growth was assessed during the experiment period by measuring the elongation of newly emerging lateral shoots using a ruler. Total shoot length was recorded at four time points: the beginning of the treatment, the end of the first heating phase, the end of the recovery period, and the end of the second heating phase. Growth increments were calculated for each phase as follows:
ΔG = final shoot length - initial shoot length
In addition, external symptom evaluation of plants was assessed to determine discoloring, burning, and wilting of the leaves. At the end of the experiment, plants were harvested. Shoot length and main stem diameter were recorded. Root and shoot were separated and oven dried at 60°C to constant weight, to determine the dry biomass.
2.4. Statistical Analysis
For all response variables, data were analyzed using a two-way factorial Analysis of Variance (ANOVA) with species (pear, quince) and treatment (Control, 35/30 °C, 40/35 °C, Acute 50 °C) as fixed factors. The experiment was conducted with 10 biological replicates per species × treatment combination, except for the 35/30 °C and 50 °C treatments, which included only 5 replicates due to space limitations. Analyses were conducted using a linear model with Type III sums of squares. When significant effects were detected, main effects were interpreted, and post hoc comparisons were conducted using Tukey’s Honest Significant Difference (HSD) test. In addition, treatment means were compared within each species using Tukey-adjusted pairwise comparisons. Differences were considered significant at P < 0.05, and results are presented as means ± standard error. All statistical analyses were performed using R software (R Core Team, 2024).
3. Results and Discussion
3.1. Morphological Responses
On pear and quince plants subjected to acute root-zone heating (substrate temperature of 50 ± 5 °C maintained for 36 h), visible foliar damage was first observed within 36 hours of treatment start (Figure 2). Early symptoms consisted of marginal leaf burn, which appeared as necrosis starting at the leaf edges. By Day 7, basal leaves progressively turned dark brown and began to wilt, while the apical foliage remained green and apparently viable. However, by Day 12, foliar damage had progressed throughout the canopy, resulting in complete desiccation and irreversible wilting. All plants exposed to the acute treatment ultimately died, while no visible symptoms were observed in any of the other treatments during the experiment. These results confirm that shoot tissues are highly sensitive to extreme heat events, particularly when the stress originates in the root zone and disrupts water balance. Similar observations have been reported in other fruit tree species [30,31]. For instance, kiwifruit seedlings exposed to 45 °C for 8 h exhibited pronounced leaf desiccation and water loss [32], while young apple trees subjected to 48 °C for 24 h showed 40% mortality even after a 48-h recovery period at moderate temperature [8].
At the end of the experiment, the root system was separated from the shoot and washed. The visual assessment revealed marked differences in root morphology among treatments (Figure 3). Plants subjected to acute 50 °C root-zone heating showed small, dark brown root systems, damaged and clearly less developed than in other treatments. In plants exposed to 40/ 35 °C temperature, roots were visibly less developed than control and 35/30 °C plants and showed dark brown discoloration indicative of heat-induced damage. By contrast, control and 35/30 °C plants developed vigorous root systems, characterized by a light brown coloration with abundant new fine root formation. Although the overall pattern of response to heating was similar in both species, quince plants consistently developed a larger and more extensive root system than pear. These results highlight that roots are highly sensitive to heat stress and that high root-zone temperatures impaired their growth. Such sensitivity is in line with previous studies where high soil temperature caused cell injury and irreversible membrane damage, and a reduction in root vitality [31,33].
3.2. Physiological Responses
On Day 4, both quince and pear plants subjected to acute root-zone heating (50 °C) showed a drastic reduction in gas exchange compared to all other treatments (Figure 4). In quince, stomatal conductance (gs) dropped from 80 ± 12.4 mmol m-2 s-1 in control to 3.33 ± 3.33 mmol m-2 s-1 in 50 °C plants, while transpiration (E) decreased from 2.43 ± 0.26 to 0.42 ± 0.06 mmol m-2s-1. Pear plants exhibited a similar response, with gs decreased from 136.66 ± 13.58 in control to 20 ± 0.0 mmol m-2 s-1 under acute 50 °C heating, and E declined from 3.38 ± 0.19 to 0.8 ± 0.07 mmol m-2 s-1. In addition, in both species, a slight increase in stomatal conductance and transpiration at 35/30 °C compared to controls and a decrease under 40/35 °C heating was observed, although not statistically significant.
Since the wilting of plants subjected to acute heating (50 °C) rapidly expanded after this first gas exchange measurement, they were excluded from further assessments.
By Day 12, the effects of root-zone heating were apparent and species-specific. Pear plants subjected to 40/35 °C regime exhibited significant reductions in stomatal conductance and transpiration rate by 57% and 43%, respectively, compared to control pear plants, and by 65% and 47%, respectively, compared to pear plants at 35/30 °C (Figure 4B,D). On Day 12, net photosynthesis declined with increasing substrate temperature in both species, but the decrease was statistically significant only in quince, where Pn of plants at 40/35 °C dropped by 73% compared to control (Figure 4E).
Following the recovery period of 8 days, quince plants subjected to 40/35 °C showed a significant reduction in stomatal conductance by 40% compared to control plants. Similarly, pear plants showed a significant reduction in stomatal conductance and net photosynthesis by 37% and 34% compared to control plants, respectively. At the end of the second heating, neither species showed a significant difference among treatments in the measured gas exchange parameters.
Factorial ANOVA revealed that species significantly influenced stomatal conductance (gs) and transpiration (E) during the first heating period, where pear plants showed significantly higher values than quince plants regardless of treatment (Table A1). However, no species effect was detected during recovery or the second heating phase. By contrast, the treatment factor had a significant effect on gs, E, and net photosynthesis (Pn) during the first heating and recovery periods, but not at the end of the second heating phase. No significant interactions between species and treatment were detected for any parameter.
Leaf relative water content (RWC) measured on Day 10 revealed that the acute 50 °C root-zone heating markedly impaired plant water status in both species. In quince, plants subjected to 50 °C treatment had significantly lower RWC than control plants, while the 35/30 °C and 40/35 °C treatments caused only slight, non-significant reductions (Figure 5). In pear, RWC in the 50 °C treatment was significantly reduced compared to all other treatments. In addition, pear plants showed significantly higher RWC than quince plants across treatments (Table A2). After the recovery period, the RWC did not differ among the compared treatments in both species. As shown in Figure 6, the chlorophyll content index (CCI) in both quince and pear leaves was generally unaffected by root-zone heating during the experiment. No significant differences were detected among treatments during the first heating or recovery phases. However, by the end of the second heating period, quince plants subjected to 35/30 °C showed significantly lower CCI values compared to those exposed to 40/35 °C. In addition, no significant differences in CCI were observed between quince and pear, regardless of treatment (Table A3).
Our results show that acute root-zone heating at 50 °C caused a rapid and drastic collapse of stomatal conductance and transpiration within days, followed by a progressive canopy desiccation and mortality. These responses indicate an impairment of water supply to the shoot due to heat-induced injury of roots. Similar responses have been reported in tree species and crops, where extreme soil or aerial temperatures rapidly reduced water uptake and stomatal conductance [8,32]. By contrast, chronic warming at 40/35 °C produced slower, species-specific declines. Pear exhibited pronounced gₛ and E reductions. These results are in line with other studies reporting severe photosynthetic decline and an increase of intercellular CO₂ under high-temperature exposure in young apple trees [8] and reduced leaf carbon assimilation following elevated root-zone temperatures [34]. Other studies have found that root-zone heat stress reduces stomatal conductance and inhibits photosynthesis primarily by decreasing Rubisco activity [35]. However, quince exhibited a larger decline in Pₙ. This pattern is consistent with a recent study showing that long-term high root-zone temperatures increased leaf oxidative-stress markers (MDA, H₂O₂), reduced chlorophyll content, inactivated the oxygen-evolving complex (with blockage at both PSII donor and acceptor sides), and markedly depressed photosynthetic capacity in grapevine [36].
The partial recovery of function (similar transpiration rate and RWC) after the 8-day period at ambient root-zone temperature indicates the capacity for recovery (Figure 4 and Figure 5). The absence of treatment differences after the second heating may reflect that this period coincided with a rise in ambient temperature (daily maximum temperature peaked at 40.9 and 39.9 °C on Day 26 and 30, respectively; Figure 1). This may have caused additional heat stress and is likely the reason for the reduction in stomatal conductance across root-zone treatments.
3.3. Growth Responses
Shoot elongation was monitored throughout the experiment at four key time points: the start of heating, the end of the first heating period, the end of the recovery phase, and the end of the second heating period.
During the first heating period, in both species, plants exposed to acute root-zone heating (50°C for 36 h) ceased shoot elongation immediately after treatment started, and no further growth was observed. In contrast, plants in the other treatments continued to grow, although shoot elongation tended to decline with increasing root-zone temperature. The highest increments in shoot length were recorded in the non-heated control plants, while growth was reduced at 35/30 °C and was the lowest at 40/35 °C. However, these differences were not statistically significant during the first heating phases (Figure 7).
At the end of the recovery period, quince and pear plants exposed previously to 40/35 °C showed limited growth, with significantly shorter cumulative shoot length compared to control plants. At the end of the second heating period, differences among treatments persisted in both species. The applied 40/35 °C root-zone temperature significantly reduced shoot elongation compared to control plants. During the recovery and second heating periods, quince plants exhibited significantly greater shoot length increment than pear plants, regardless of treatment (Table A4).
The acute 50 °C heating caused an immediate stop of shoot elongation, which is consistent with the severe root injury and consequent root water uptake collapses (Figure 3 and Figure 5). By contrast, the chronic 40/35 °C regime resulted in slower, cumulative reductions in shoot growth that became significant only after recovery and following the second heating period. Similar findings have been reported in other species, where elevated root-zone temperatures significantly reduced fine-root activity, inhibited mineral nutrient absorption, and ultimately suppressed shoot growth [36].
Since the acute root-zone high temperature resulted in growth suppression at the end of the experiment, the assessment of the effect of the treatment on growth parameters was done without considering plants subjected to acute heating (50 °C).
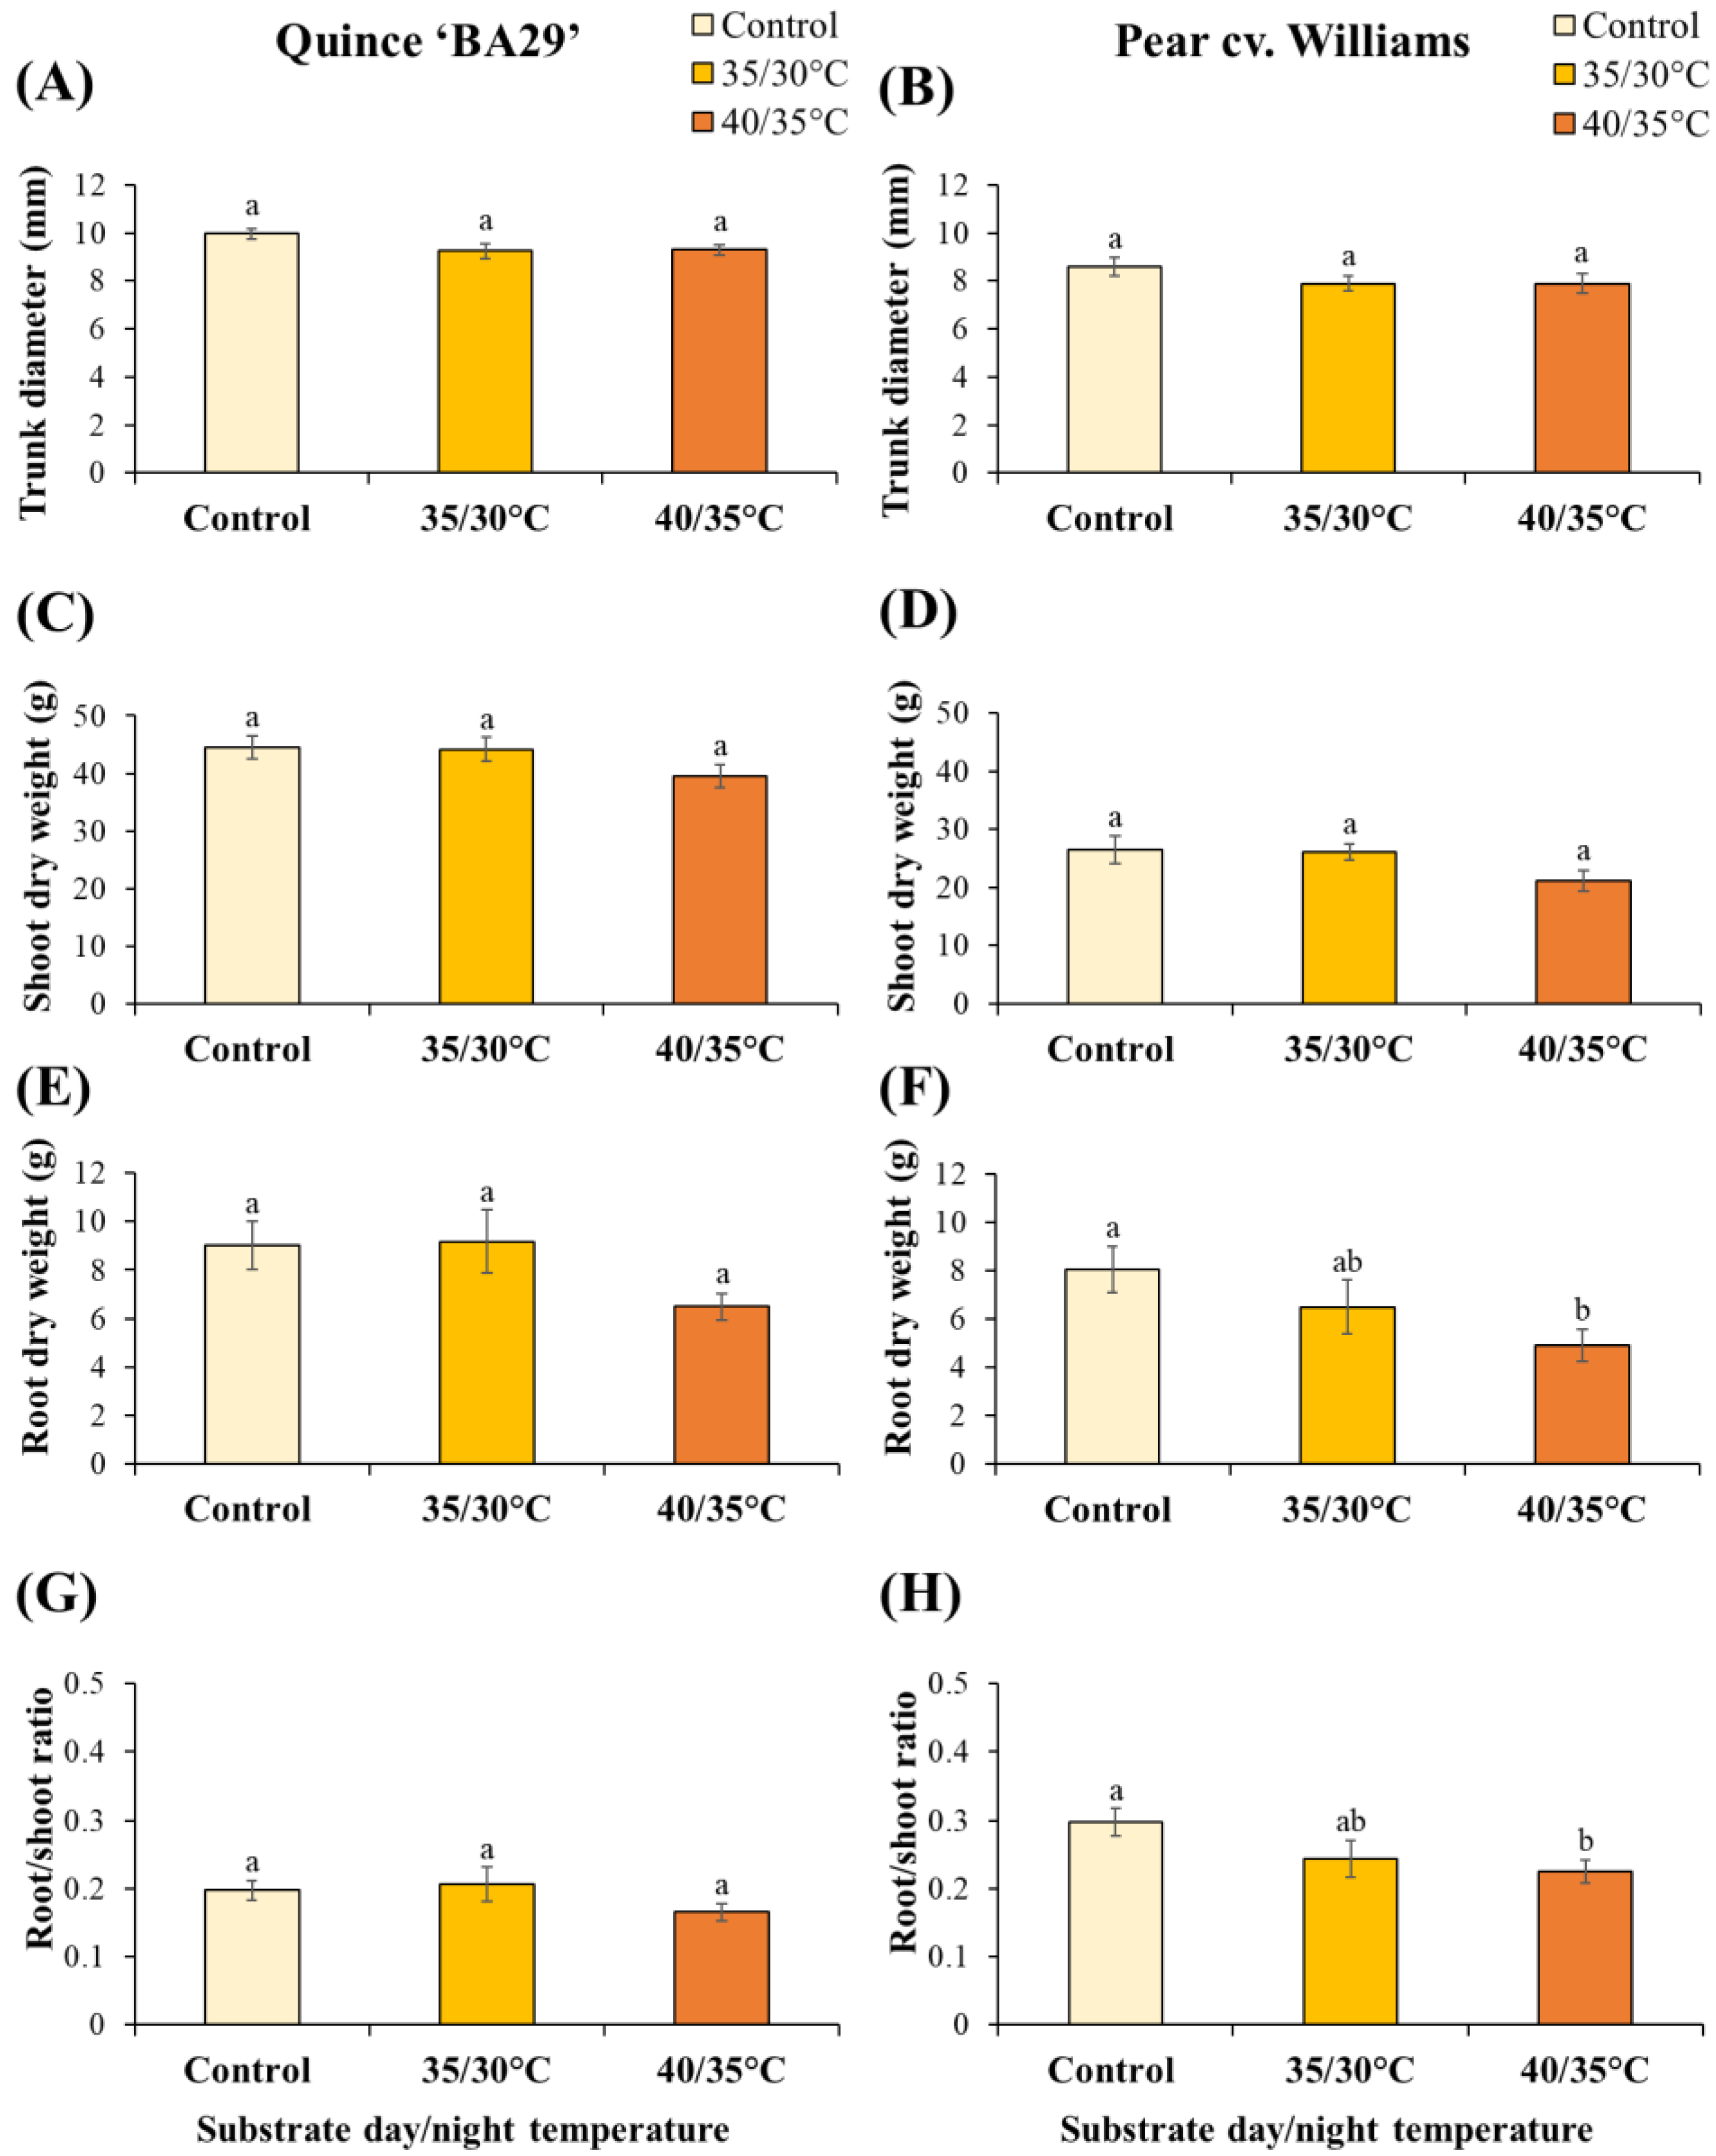
Main stem diameter was not significantly affected by root heating in either species (Figure 8A,B). Similarly, shoot dry weight of both quince and pear plants remained unaffected by different treatments (Figure 8C,D). In quince, the root dry weight did not differ significantly among treatments, although plants exposed to 40/35 °C tended to have lower root biomass than non-heated and 35/30 °C plants (Figure 8E). By contrast, pear plants were more sensitive to high root-zone temperature, where plants exposed to 40/35 °C exhibited a significant reduction in root dry weight by 39% compared to controls, while the 35/30 °C treatment had no significant effect (Figure 8F). Consistently, the root-to-shoot ratio of pear plants was significantly reduced under 40/35 °C compared to the control (Figure 8H). In quince, no significant differences in root-to-shoot ratio were detected among treatments.
The biomass results revealed clear species-specific differences in responses to elevated root-zone temperatures (Table A5). While stem diameter and shoot dry weight remained unaffected in both quince and pear, root biomass showed contrasting patterns. In quince, root dry weight was not significantly influenced by substrate temperature, while pear roots were far more sensitive. These findings suggest that under high root-zone temperatures, pear allocates proportionally less biomass to belowground structures, while quince maintains a more balanced partitioning. Our results align with previous studies highlighting the vulnerability of woody plant roots to supra-optimal temperatures of 40 °C, where increases in shoot-to-root ratios were observed [31]. Similarly, previous works demonstrated that root-zone heating at 35 °C of M9 apple rootstock led to a 57% reduction in root fresh weight compared to 25 °C. Such sensitivity has also been documented in other fruit species, where growth of peach roots was almost completely inhibited at 35 °C, and pecan roots showed near growth cessation with shoot tip dieback at 38 °C [37]. Taken together, these results reinforce the notion that while both shoots and roots are affected by heat stress, roots are generally more sensitive to elevated root-zone temperatures [21,38,39].
4. Conclusions
In intensive orchard systems, the soil under the trees is often kept bare through tillage or herbicide use, making the upper soil layers more susceptible to high temperatures caused by intense solar radiation. The results observed in our study show that short, extreme increases in root-zone temperature can cause rapid root injury and collapse of water uptake, leading to canopy loss and plant death, regardless of rootstock genotype. Sustained root-zone heating at 40 °C produced more gradual but persistent effects, including reductions in gas exchange and significant losses in root biomass. The shallow root system of dwarfing rootstocks (e.g., quince) may therefore exacerbate susceptibility to soil surface heat waves and limit the tree’s capacity to buffer transient soil temperature extremes [28]. More vigorous pear rootstocks may offer greater resilience not because of an inherent tolerance to high temperatures, but only if trees are provided sufficient time and rooting volume to develop deeper, more extensive root systems. These findings emphasize the importance of rootstock selection, together with coherent orchard management strategies, to mitigate the impacts of elevated air and soil temperatures on fruit tree performance under future climate change.
Author Contributions
Conceptualization, K.M. and D.N.; methodology, K.M., V.G. and E.M.L.; software, K.M.; validation, D.N., V.G. and E.M.L.; formal analysis, K.M.; investigation, K.M.; resources, D.N.; data curation, K.M.; writing—original draft preparation, K.M.; writing—review and editing, D.N., V.G. and E.M.L.; visualization, D.N., V.G. and E.M.L.; supervision, D.N.; project administration, D.N.; funding acquisition, D.N. All authors have read and agreed to the published version of the manuscript.
Funding
This research received no external funding.
Data Availability Statement
The original contributions presented in this study are included in the article. Further inquiries can be directed to the corresponding author.
Acknowledgments
We thank Prof. Giorgio Murri for his technical support.
Conflicts of Interest
The authors declare no conflicts of interest.
Appendix A

Table A1.
Results of two-way ANOVA testing the effect of species (S), treatment (T), and their interaction (S×T) on gas exchange parameters.
Table A1.
Results of two-way ANOVA testing the effect of species (S), treatment (T), and their interaction (S×T) on gas exchange parameters.
| Parameter | Factor | P-value | |||
|---|---|---|---|---|---|
| Day 4 | Day 12 | Day 22 | Day 31 | ||
| gs | S | < 0.001*** | < 0.001*** | 0.210 ns | 0.379 ns |
| T | < 0.001*** | < 0.001*** | < 0.001*** | 0.234 ns | |
| S × T | 0.693 ns | 0.057 ns | 0.985 ns | 0.329 ns | |
| E | S | 0.002 ** | 0.01 * | 0.305 ns | 0.310 ns |
| T | < 0.001*** | < 0.001*** | 0.014 * | 0.342 ns | |
| S × T | 0.758 ns | 0.241 ns | 0.915 ns | 0.480 ns | |
| Pn | S | 0.126 ns | 0.617 ns | 0.251 ns | 0.054 ns |
| T | 0.043 * | 0.008 ** | 0.001 ** | 0.342 ns | |
| S × T | 0.806 ns | 0.705 ns | 0.615 ns | 0.329 ns | |
| WUE | S | 0.981 ns | 0.751 ns | 0.010 * | < 0.001*** |
| T | 0.837 ns | 0.042 * | 0.582 ns | 0.167 ns | |
| S × T | 0.953 ns | 0.526 ns | 0.619 ns | 0.625 ns | |
ns = not significant; * P < 0.05; ** P < 0.01; *** P < 0.001.
Table A2.
Results of two-way ANOVA testing the effect of species (S), treatment (T), and their interaction (S×T) on leaf relative water content (RWC).
Table A2.
Results of two-way ANOVA testing the effect of species (S), treatment (T), and their interaction (S×T) on leaf relative water content (RWC).
| Factor | P-value | |
|---|---|---|
| Day 10 | Day 22 | |
| S | < 0.001*** | 0.115 ns |
| T | < 0.001*** | 0.101 ns |
| S × T | 0.851 ns | 0.895 ns |
ns = not significant; * P < 0.05; ** P < 0.01; *** P < 0.001.
Table A3.
Results of two-way ANOVA testing the effect of species (S), treatment (T), and their interaction (S×T) on leaf chlorophyll content index (CCI).
Table A3.
Results of two-way ANOVA testing the effect of species (S), treatment (T), and their interaction (S×T) on leaf chlorophyll content index (CCI).
| Factor | P-value | ||
|---|---|---|---|
| Day 8 | Day 22 | Day 31 | |
| S | 0.180 ns | 0.357 ns | 0.733 ns |
| T | 0.093 ns | 0.521 ns | 0.017 * |
| S × T | 0.872 ns | 0.310 ns | 0.479 ns |
ns = not significant; * P < 0.05; ** P < 0.01; *** P < 0.001.
Table A4.
Results of two-way ANOVA testing the effect of species (S), treatment (T) and their interaction (S×T) on shoot length increment at different experiment phases.
Table A4.
Results of two-way ANOVA testing the effect of species (S), treatment (T) and their interaction (S×T) on shoot length increment at different experiment phases.
| Factor | P-value | ||
|---|---|---|---|
| 1st Heating | Recovery | 2nd Heating | |
| S | 0.828 ns | < 0.001*** | 0.001 ** |
| T | < 0.001*** | < 0.001*** | < 0.001*** |
| S × T | 0.832 ns | 0.949 ns | 0.958 ns |
ns = not significant; * P < 0.05; ** P < 0.01; *** P < 0.001.
Table A5.
Results of two-way ANOVA testing the effect of species (S), treatment (T), and their interaction (S×T) on shoot and root growth parameters.
Table A5.
Results of two-way ANOVA testing the effect of species (S), treatment (T), and their interaction (S×T) on shoot and root growth parameters.
| Response | Factor | ||
|---|---|---|---|
| S | T | S × T | |
| Trunk diameter | <0.001 *** | 0.051 ns | 0.997 ns |
| Shoot dry weight | <0.001 *** | 0.018 * | 0.994 ns |
| Root dry weight | 0.027 * | 0.003 ** | 0.688 ns |
| Root/shoot ratio | <0.001 *** | 0.012 * | 0.414 ns |
ns = not significant; * P < 0.05; ** P < 0.01; *** P < 0.001.
References
- Allan, R.P.; Arias, P.A.; Berger, S.; Canadell, J.G.; Cassou, C.; Chen, D.; Cherchi, A.; Connors, S.L.; Coppola, E.; Cruz, F.A.; Diongue-Niang, A. Intergovernmental Panel on Climate Change (IPCC). Summary for policymakers. In Climate Change 2021: The Physical Science Basis. Contribution of Working Group I to the Sixth Assessment Report of the Intergovernmental Panel on Climate Change; Cambridge University Press: Cambridge, UK, 2023; pp. 3–32. [Google Scholar] [CrossRef]
- Bita, C.E.; Gerats, T. Plant tolerance to high temperature in a changing environment: scientific fundamentals and production of heat stress-tolerant crops. Front. Plant Sci. 2013, 4, 273. [Google Scholar] [CrossRef]
- Sharma, S.; Manjeet, M. Heat stress effects in fruit crops: A review. Agric. Rev. 2020, 41, 73–78. [Google Scholar] [CrossRef]
- Meza, F.; Darbyshire, R.; Farrell, A.; Lakso, A.; Lawson, J.; Meinke, H.; Nelson, G.; Stöckle, C. Assessing temperature-based adaptation limits to climate change of temperate perennial fruit crops. Glob. Change Biol. 2023, 29, 2557–2571. [Google Scholar] [CrossRef] [PubMed]
- Wahid, A.; Gelani, S.; Ashraf, M.; Foolad, M.R. Heat tolerance in plants: An overview. Environ. Exp. Bot. 2007, 61, 199–223. [Google Scholar] [CrossRef]
- Vollenweider, P.; Günthardt-Goerg, M.S. Diagnosis of abiotic and biotic stress factors using the visible symptoms in foliage. Environ. Pollut. 2005, 137, 455–465. [Google Scholar] [CrossRef] [PubMed]
- Glenn, D.M.; Kim, S.-H.; Ramirez-Villegas, J.; Läderach, P. Response of perennial horticultural crops to climate change. Hortic. Rev. 2014, 41, 47–130. [Google Scholar] [CrossRef]
- Dong, Q.; Duan, D.; Zheng, W.; Huang, D.; Wang, Q.; Li, X.; Mao, K.; Ma, F. MdVQ37 overexpression reduces basal thermotolerance in transgenic apple by affecting transcription factor activity and salicylic acid homeostasis. Hortic. Res. 2021, 8, 73. [Google Scholar] [CrossRef]
- Shtai, W.; Asensio, D.; Kadison, A.E.; Schwarz, M.; Raifer, B.; Andreotti, C.; Hammerle, A.; Zanotelli, D.; Haas, F.; Niedrist, G.; Wohlfahrt, G.; Tagliavini, M. Soil water availability modulates the response of grapevine leaf gas exchange and PSII traits to a simulated heat wave. Plant Soil 2024, 501, 537–554. [Google Scholar] [CrossRef]
- Zanotelli, D.; Montagnani, L.; Andreotti, C.; Tagliavini, M. Water and carbon fluxes in an apple orchard during heat waves. Eur. J. Agron. 2022, 134, 126460. [Google Scholar] [CrossRef]
- Yamada, M.; Hidaka, T.; Fukamachi, H. Heat tolerance in leaves of tropical fruit crops as measured by chlorophyll fluorescence. Sci. Hortic. 1996, 67, 39–48. [Google Scholar] [CrossRef]
- Zha, Q.; Xi, X.; He, Y.; Yin, X.; Jiang, A. Effect of short-time high-temperature treatment on the photosynthetic performance of different heat-tolerant grapevine cultivars. Photochem. Photobiol. 2021, 97, 763–769. [Google Scholar] [CrossRef]
- Schultz, H. Soil, vine, climate change; the challenge of predicting soil carbon changes and greenhouse gas emissions in vineyards and is the 4 per 1000 goal realistic? OENO One 2022, 56, 251–263. [Google Scholar] [CrossRef]
- Namaghi, M.N.; Davarynejad, G.H.; Ansary, H.; Nemati, H.; Feyzabady, A.Z. Effects of mulching on soil temperature and moisture variations, leaf nutrient status, growth and yield of pistachio trees (Pistacia vera L.). Sci. Hortic. 2018, 241, 115–123. [Google Scholar] [CrossRef]
- Costa, J.M.; Egipto, R.; Aguiar, F.C.; Marques, P.; Nogales, A.; Madeira, M. The role of soil temperature in Mediterranean vineyards in a climate change context. Front. Plant Sci. 2023, 14, 1145137. [Google Scholar] [CrossRef]
- Jagadish, S.V.K.; Way, D.A.; Sharkey, T.D. Plant heat stress: Concepts directing future research. Plant Cell Environ. 2021, 44, 1992–2005. [Google Scholar] [CrossRef]
- Nóia Júnior, R.S.; do Amaral, G.C.; Pezzopane, J.E.M.; Toledo, J.V.; Xavier, T.M.T. Ecophysiology of C3 and C4 plants in terms of responses to extreme soil temperatures. Theor. Exp. Plant Physiol. 2018, 30, 261–274. [Google Scholar] [CrossRef]
- Hasanuzzaman, M.; Nahar, K.; Alam, M.M.; Roychowdhury, R.; Fujita, M. Physiological, biochemical, and molecular mechanisms of heat stress tolerance in plants. Int. J. Mol. Sci. 2013, 14, 9643–9684. [Google Scholar] [CrossRef] [PubMed]
- McMichael, B.L.; Burke, J.J. Soil temperature and root growth. Hortic. Rev. 1998, 22, 247–293. [Google Scholar] [CrossRef]
- Karlova, R.; Boer, D.; Hayes, S.; Testerink, C. Root plasticity under abiotic stress. Plant Physiol. 2021, 187, 1057–1070. [Google Scholar] [CrossRef] [PubMed]
- Heckathorn, S.A.; Giri, A.; Mishra, S.; Bista, D. Heat stress and roots. In Climate Change and Plant Abiotic Stress Tolerance; Tuteja, N., Gill, S., Eds.; Wiley Blackwell: Weinheim, Germany, 2013; pp. 109–136. [Google Scholar]
- Giorgi, V.; Guizzardi, M.; Dradi, D.; Crescenzi, S.; Monaci, E.; Chiari, G.; Anconelli, S.; Bortolotti, P.P.; Nannini, R.; Casoli, L.; Neri, D. Root architecture affected by pear degeneration in relation to rootstock and soil characteristics. Acta Hortic. 2024, 1403, 229–236. [Google Scholar] [CrossRef]
- Neri, D.; Crescenzi, S.; Massetani, F.; Manganaris, G.A.; Giorgi, V. Current trends and future perspectives towards sustainable and economically viable peach training systems. Sci. Hortic. 2022, 305, 111348. [Google Scholar] [CrossRef]
- Polverigiani, S.; Kelderer, M.; Neri, D. Growth of ‘M9’ apple root in five Central Europe replanted soils. Plant Root 2014, 8, 55–63. [Google Scholar] [CrossRef]
- Polverigiani, S.; Franzina, M.; Neri, D. Effect of soil condition on apple root development and plant resilience in intensive orchards. Appl. Soil Ecol. 2018, 123, 787–792. [Google Scholar] [CrossRef]
- Kappel, F.; Granger, A.; Hrotkó, K.; Schuster, M. Cherry. In Fruit Breeding; Badenes, M.L., Byrne, D.H., Eds.; Springer: Boston, MA, USA, 2012; pp. 459–504. [Google Scholar] [CrossRef]
- Guizzardi, M.; Pallotti, G.; Bortolotti, P.P.; Casoli, L.; Nannini, R.; Dradi, D.; Giorgi, V.; Neri, D. Pear degeneration in Emilia Romagna Region. Acta Hortic. 2024, 1403, 279–286. [Google Scholar] [CrossRef]
- Musacchi, S.; Iglesias, I.; Neri, D. Training systems and sustainable orchard management for European pear (Pyrus communis L.) in the Mediterranean area: A review. Agronomy 2021, 11, 1765. [Google Scholar] [CrossRef]
- Dondini, L.; Sansavini, S. European Pear. In Fruit Breeding. Handbook of Plant Breeding; Badenes, M., Byrne, D., Eds.; Springer: Boston, MA, USA, 2012; Volume 8, pp. 441–478. [Google Scholar] [CrossRef]
- Smith, G.S.; Buwalda, J.G.; Green, T.G.A.; Clark, C.J. Effect of oxygen supply and temperature at the root on the physiology of kiwifruit vines. New Phytol. 1989, 113, 431–437. [Google Scholar] [CrossRef]
- Ingram, D. L.; Ruter, J. M.; Martin, C. A. Characterization and impact of supraoptimal root-zone temperatures in container-grown plants. HortScience 2015, 50, 530–539. [Google Scholar] [CrossRef]
- Liang, D.; Gao, F.; Ni, Z.; Lin, L.; Deng, Q.; Tang, Y.; Wang, X.; Luo, X.; Xia, H. Melatonin improves heat tolerance in kiwifruit seedlings through promoting antioxidant enzymatic activity and glutathione S-transferase transcription. Molecules 2018, 23, 584. [Google Scholar] [CrossRef] [PubMed]
- Xia, Z.; Gong, Y.; Yang, Y.; Wu, M.; Bai, J.; Zhang, S.; Lu, H. Effects of root-zone warming, nitrogen supply and their interactions on root-shoot growth, nitrogen uptake and photosynthetic physiological characteristics of maize. Plant Physiol. Biochem. 2024, 214, 108887. [Google Scholar] [CrossRef]
- Ramcharan, C.; Ingram, D.L.; Nell, T.A.; Barrett, J.E. Fluctuations in leaf carbon assimilation as affected by root-zone temperature and growth environment. HortScience 1991, 26, 1200–1202. [Google Scholar] [CrossRef]
- Li, H.; Ahammed, G.J.; Zhou, G.; Xia, X.; Zhou, J.; Shi, K.; Yu, J.; Zhou, Y. Unraveling main limiting sites of photosynthesis under below- and above-ground heat stress in cucumber and the alleviatory role of luffa rootstock. Front. Plant Sci. 2016, 7, 746. [Google Scholar] [CrossRef]
- Su, Y.; Li, X.; Cao, Z.; Gao, Z.; Du, Y. Effects of long-term high temperatures in the root zone on the physiological characteristics of grapevine leaves and roots: Implications for viticulture practices. Horticulturae 2024, 10, 245. [Google Scholar] [CrossRef]
- Gur, A. Effects of high temperatures at the root zone and the graft union on the development of temperate fruit trees. In Temperate Fruit Crops in Warm Climates; Springer: Dordrecht, The Netherlands, 2000; pp. 123–135. [Google Scholar]
- Huang, B.; Rachmilevitch, S.; Xu, J. Root carbon and protein metabolism associated with heat tolerance. J. Exp. Bot. 2012, 63, 3455–3465. [Google Scholar] [CrossRef] [PubMed]
- Giri, A.; Heckathorn, S.; Mishra, S.; Krause, C. Heat stress decreases levels of nutrient-uptake and-assimilation proteins in tomato roots. Plants 2017, 6, 6. [Google Scholar] [CrossRef] [PubMed]
Figure 1.
Ambient substrate (a) and air (b) temperatures inside the greenhouse during the experiment. Values are shown as daily maximum (Max), minimum (Min), and average temperatures.
Figure 1.
Ambient substrate (a) and air (b) temperatures inside the greenhouse during the experiment. Values are shown as daily maximum (Max), minimum (Min), and average temperatures.
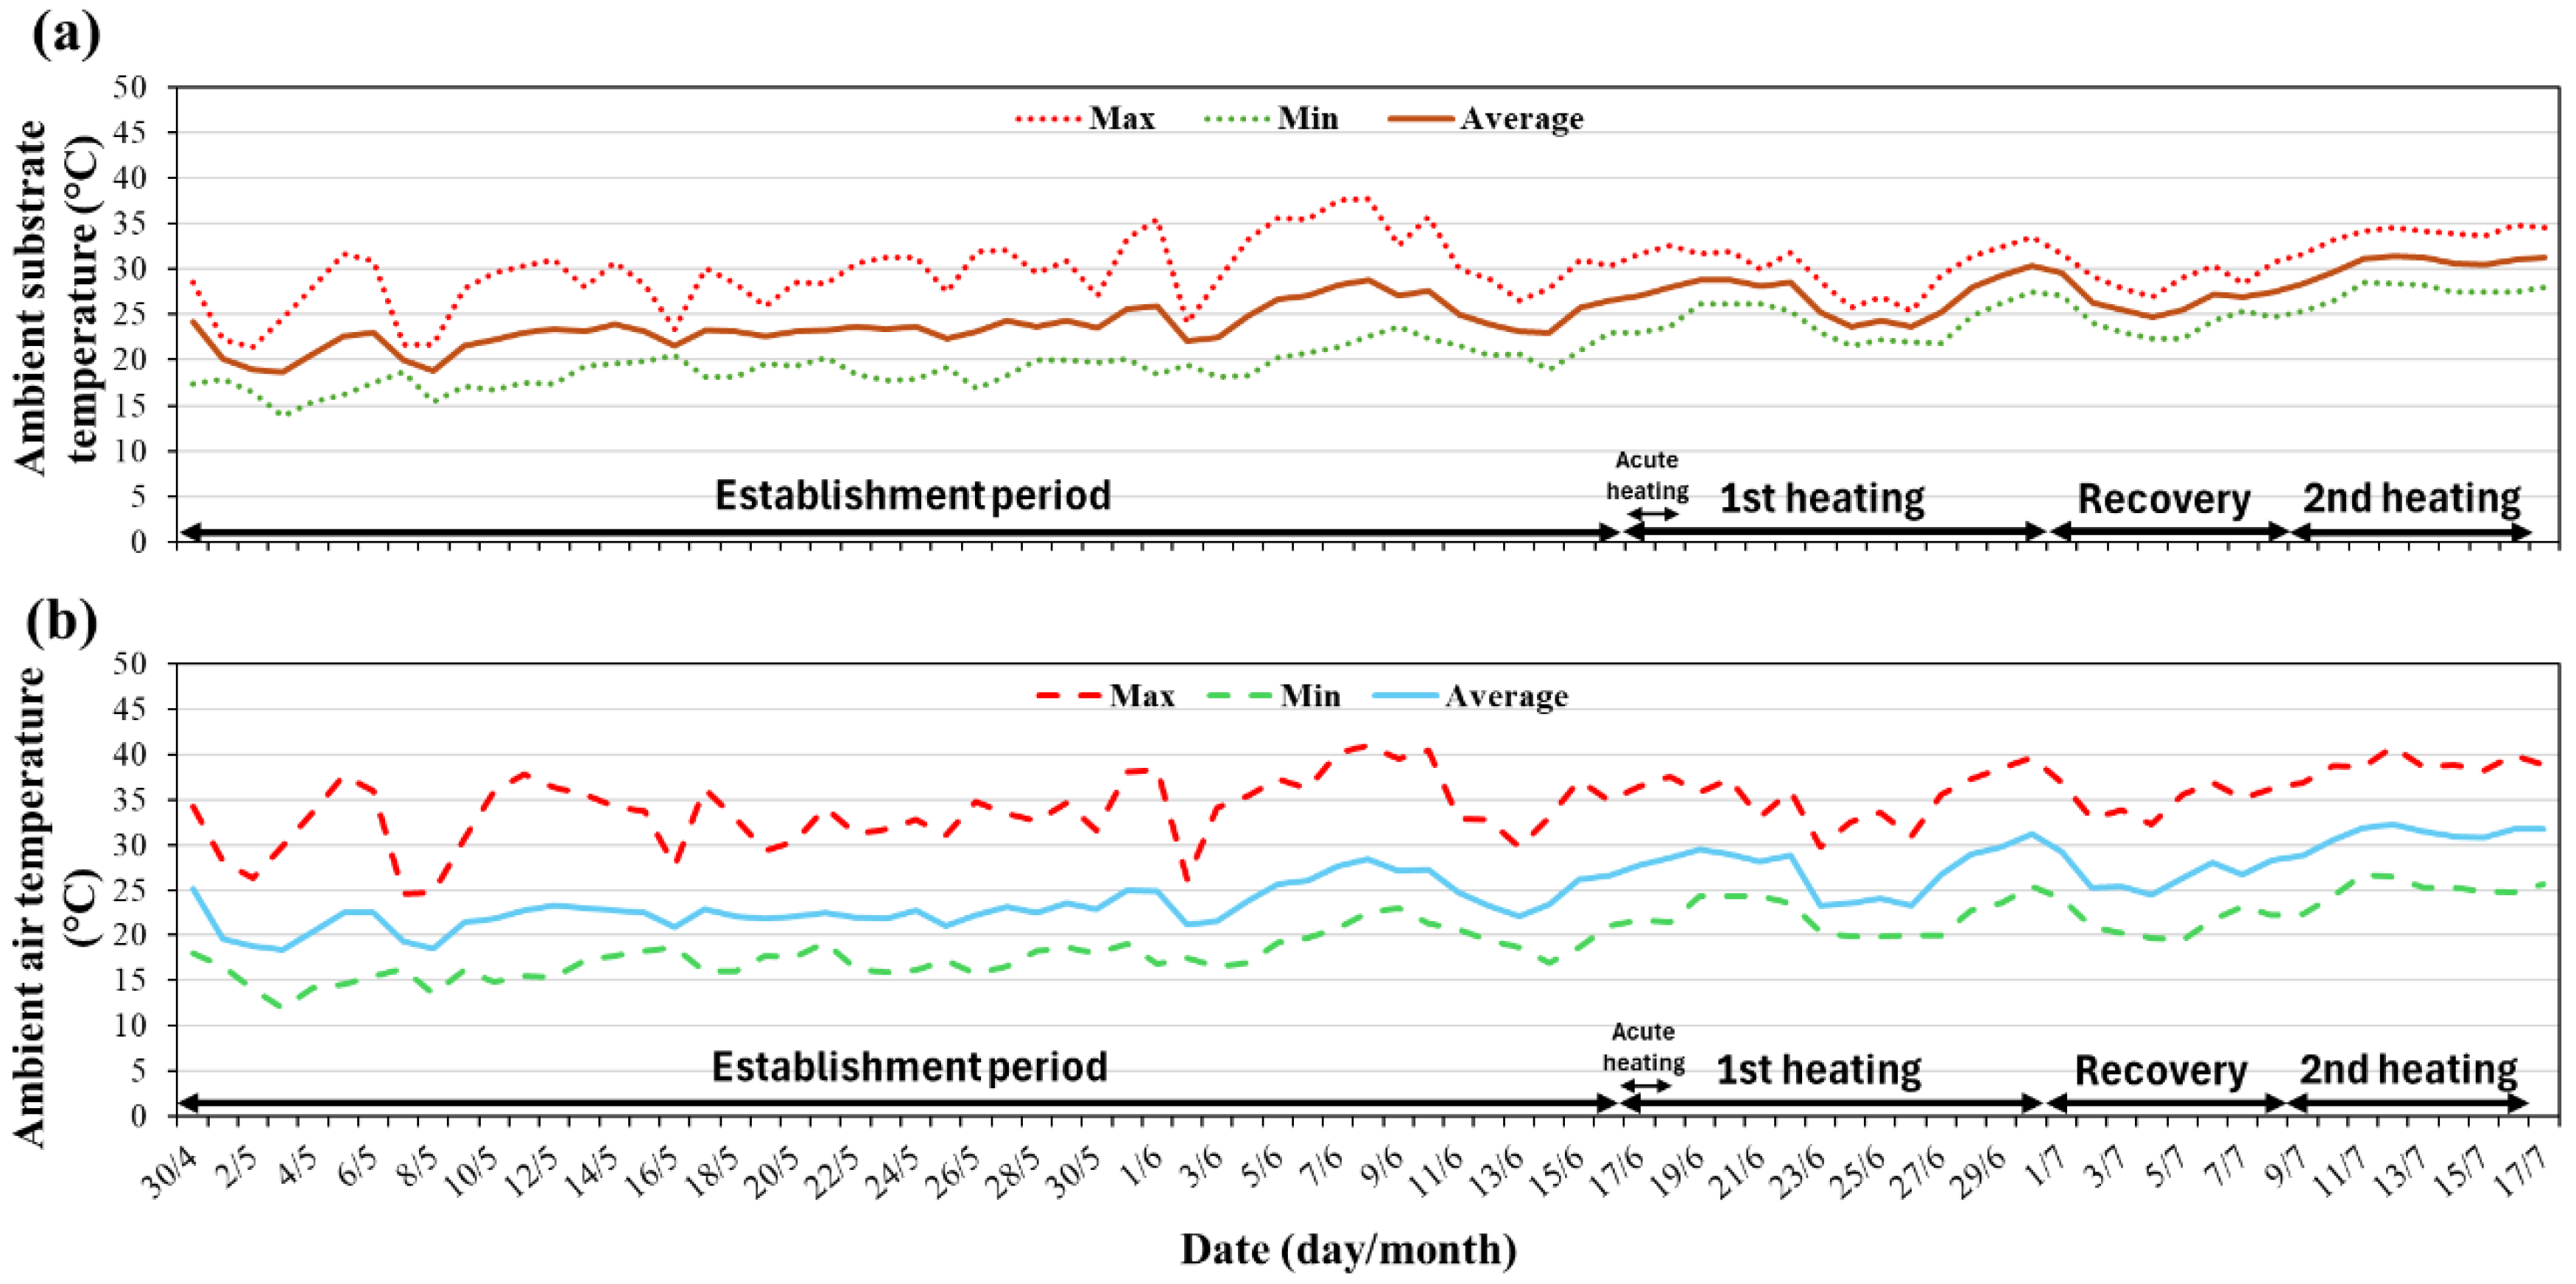
Figure 2.
Visual symptoms of quince (top) and pear (bottom) plants subjected to 36 hours of acute root-zone heating at 50 °C, photographed immediately after treatment (B, E) and on Day 7 (C, F). Control plants maintained at ambient root-zone temperature are shown in panels A and D.
Figure 2.
Visual symptoms of quince (top) and pear (bottom) plants subjected to 36 hours of acute root-zone heating at 50 °C, photographed immediately after treatment (B, E) and on Day 7 (C, F). Control plants maintained at ambient root-zone temperature are shown in panels A and D.
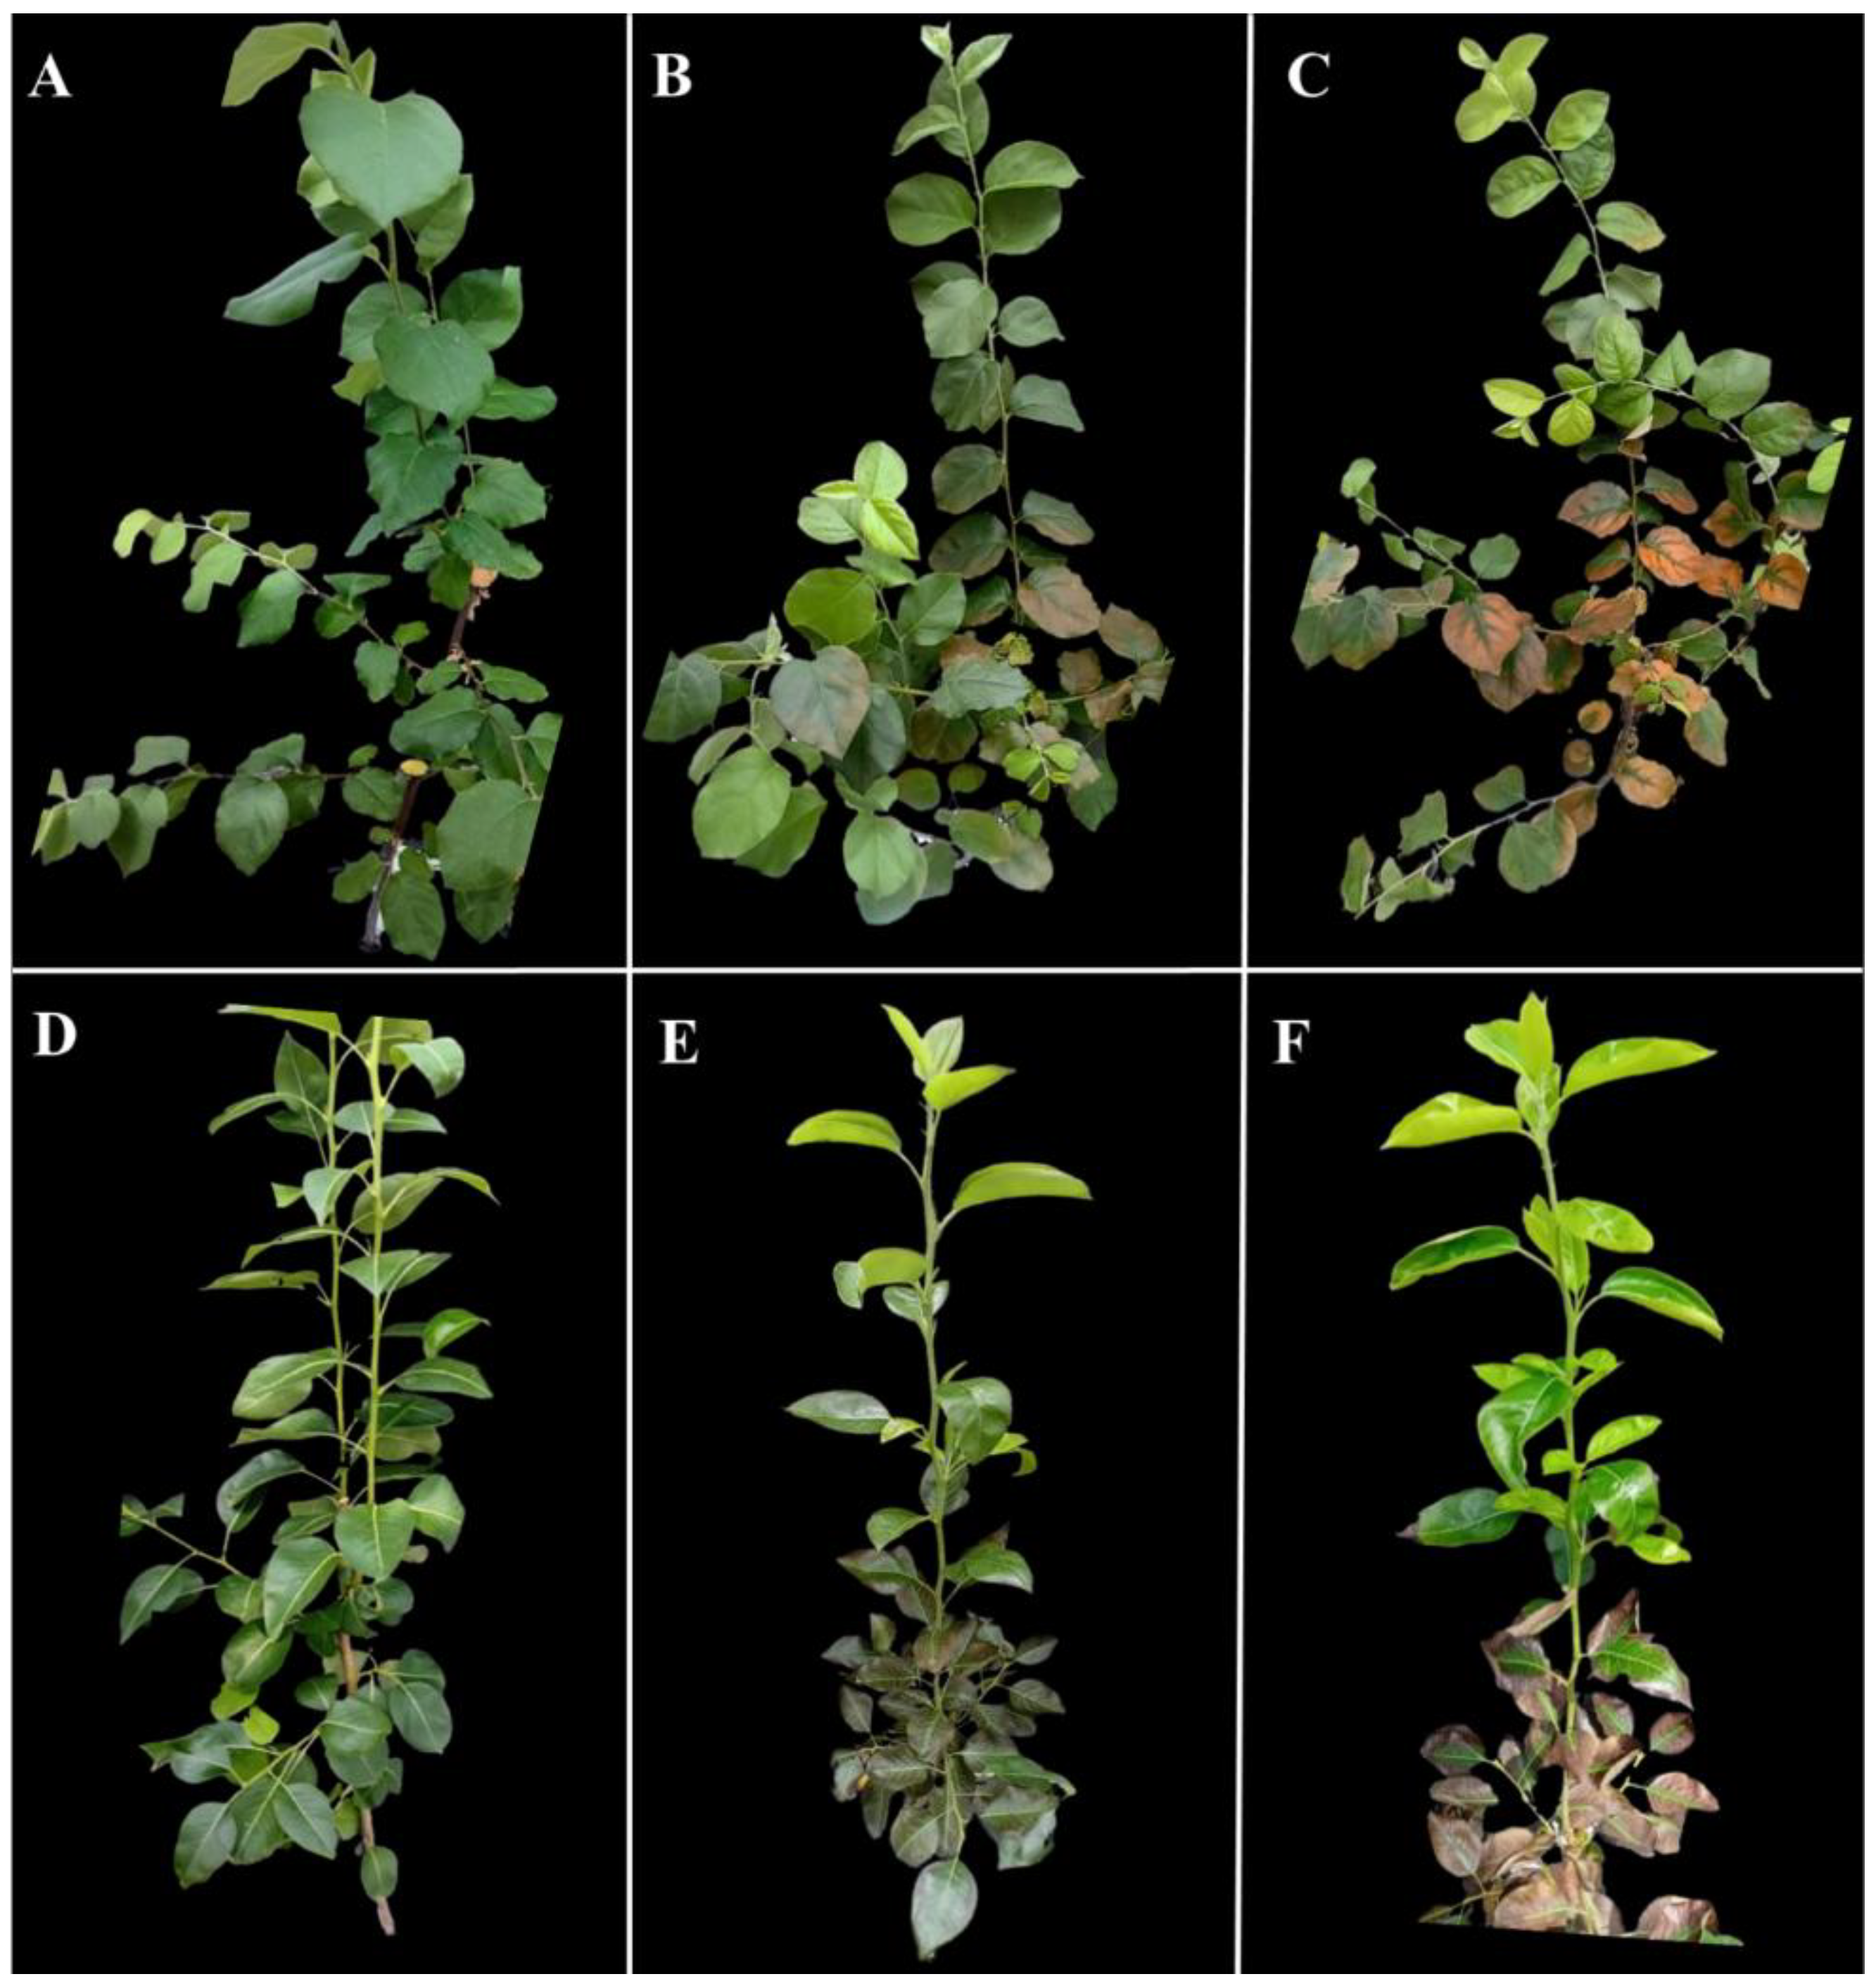
Figure 3.
Root morphology of quince (A) and pear (B) plants at the end of the experiment. For each species, representative root systems are shown for control (ambient substrate temperature), 35/30 °C, 40/35 °C, and Acute 50 °C treatments.
Figure 3.
Root morphology of quince (A) and pear (B) plants at the end of the experiment. For each species, representative root systems are shown for control (ambient substrate temperature), 35/30 °C, 40/35 °C, and Acute 50 °C treatments.
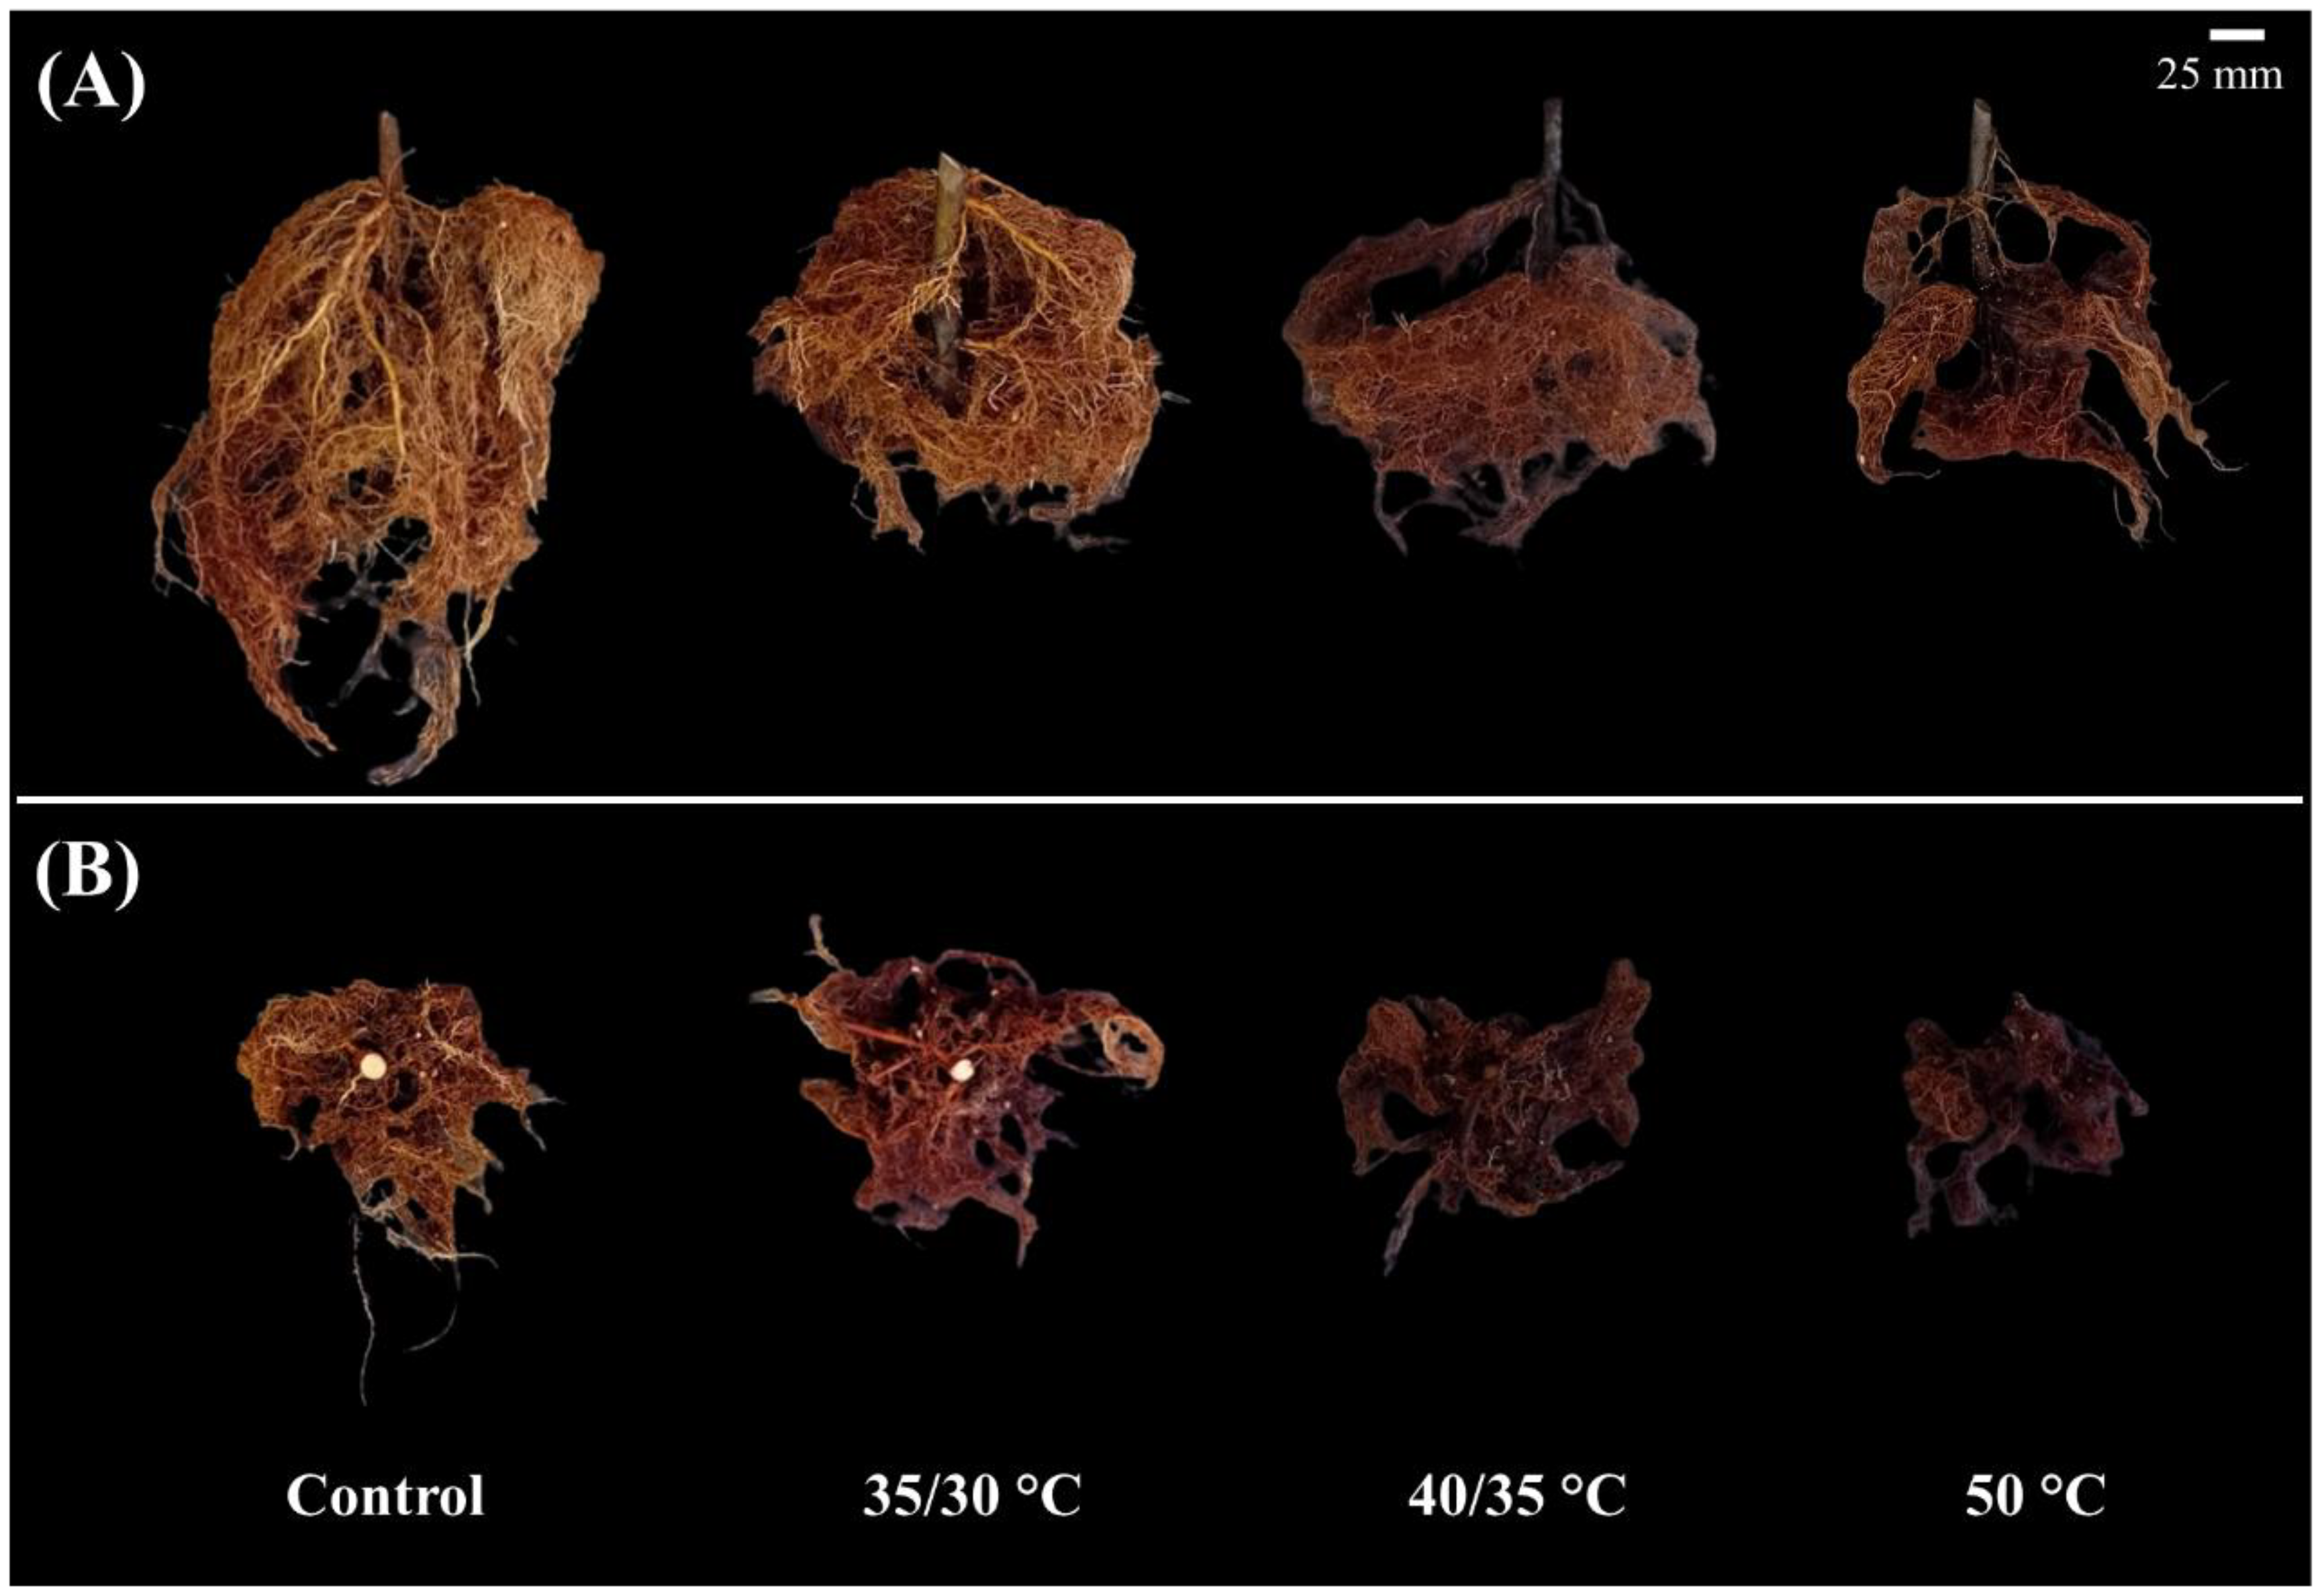
Figure 4.
Effect of different treatments on stomatal conductance (A, B), transpiration rate (C, D), Pn (E, F), and water use efficiency (G, H) of quince and pear plants, respectively, during the experiment. Data are means ± standard error (n ≥ 5 for all treatments). Different letters indicate significant differences between treatments within each day (P < 0.05).
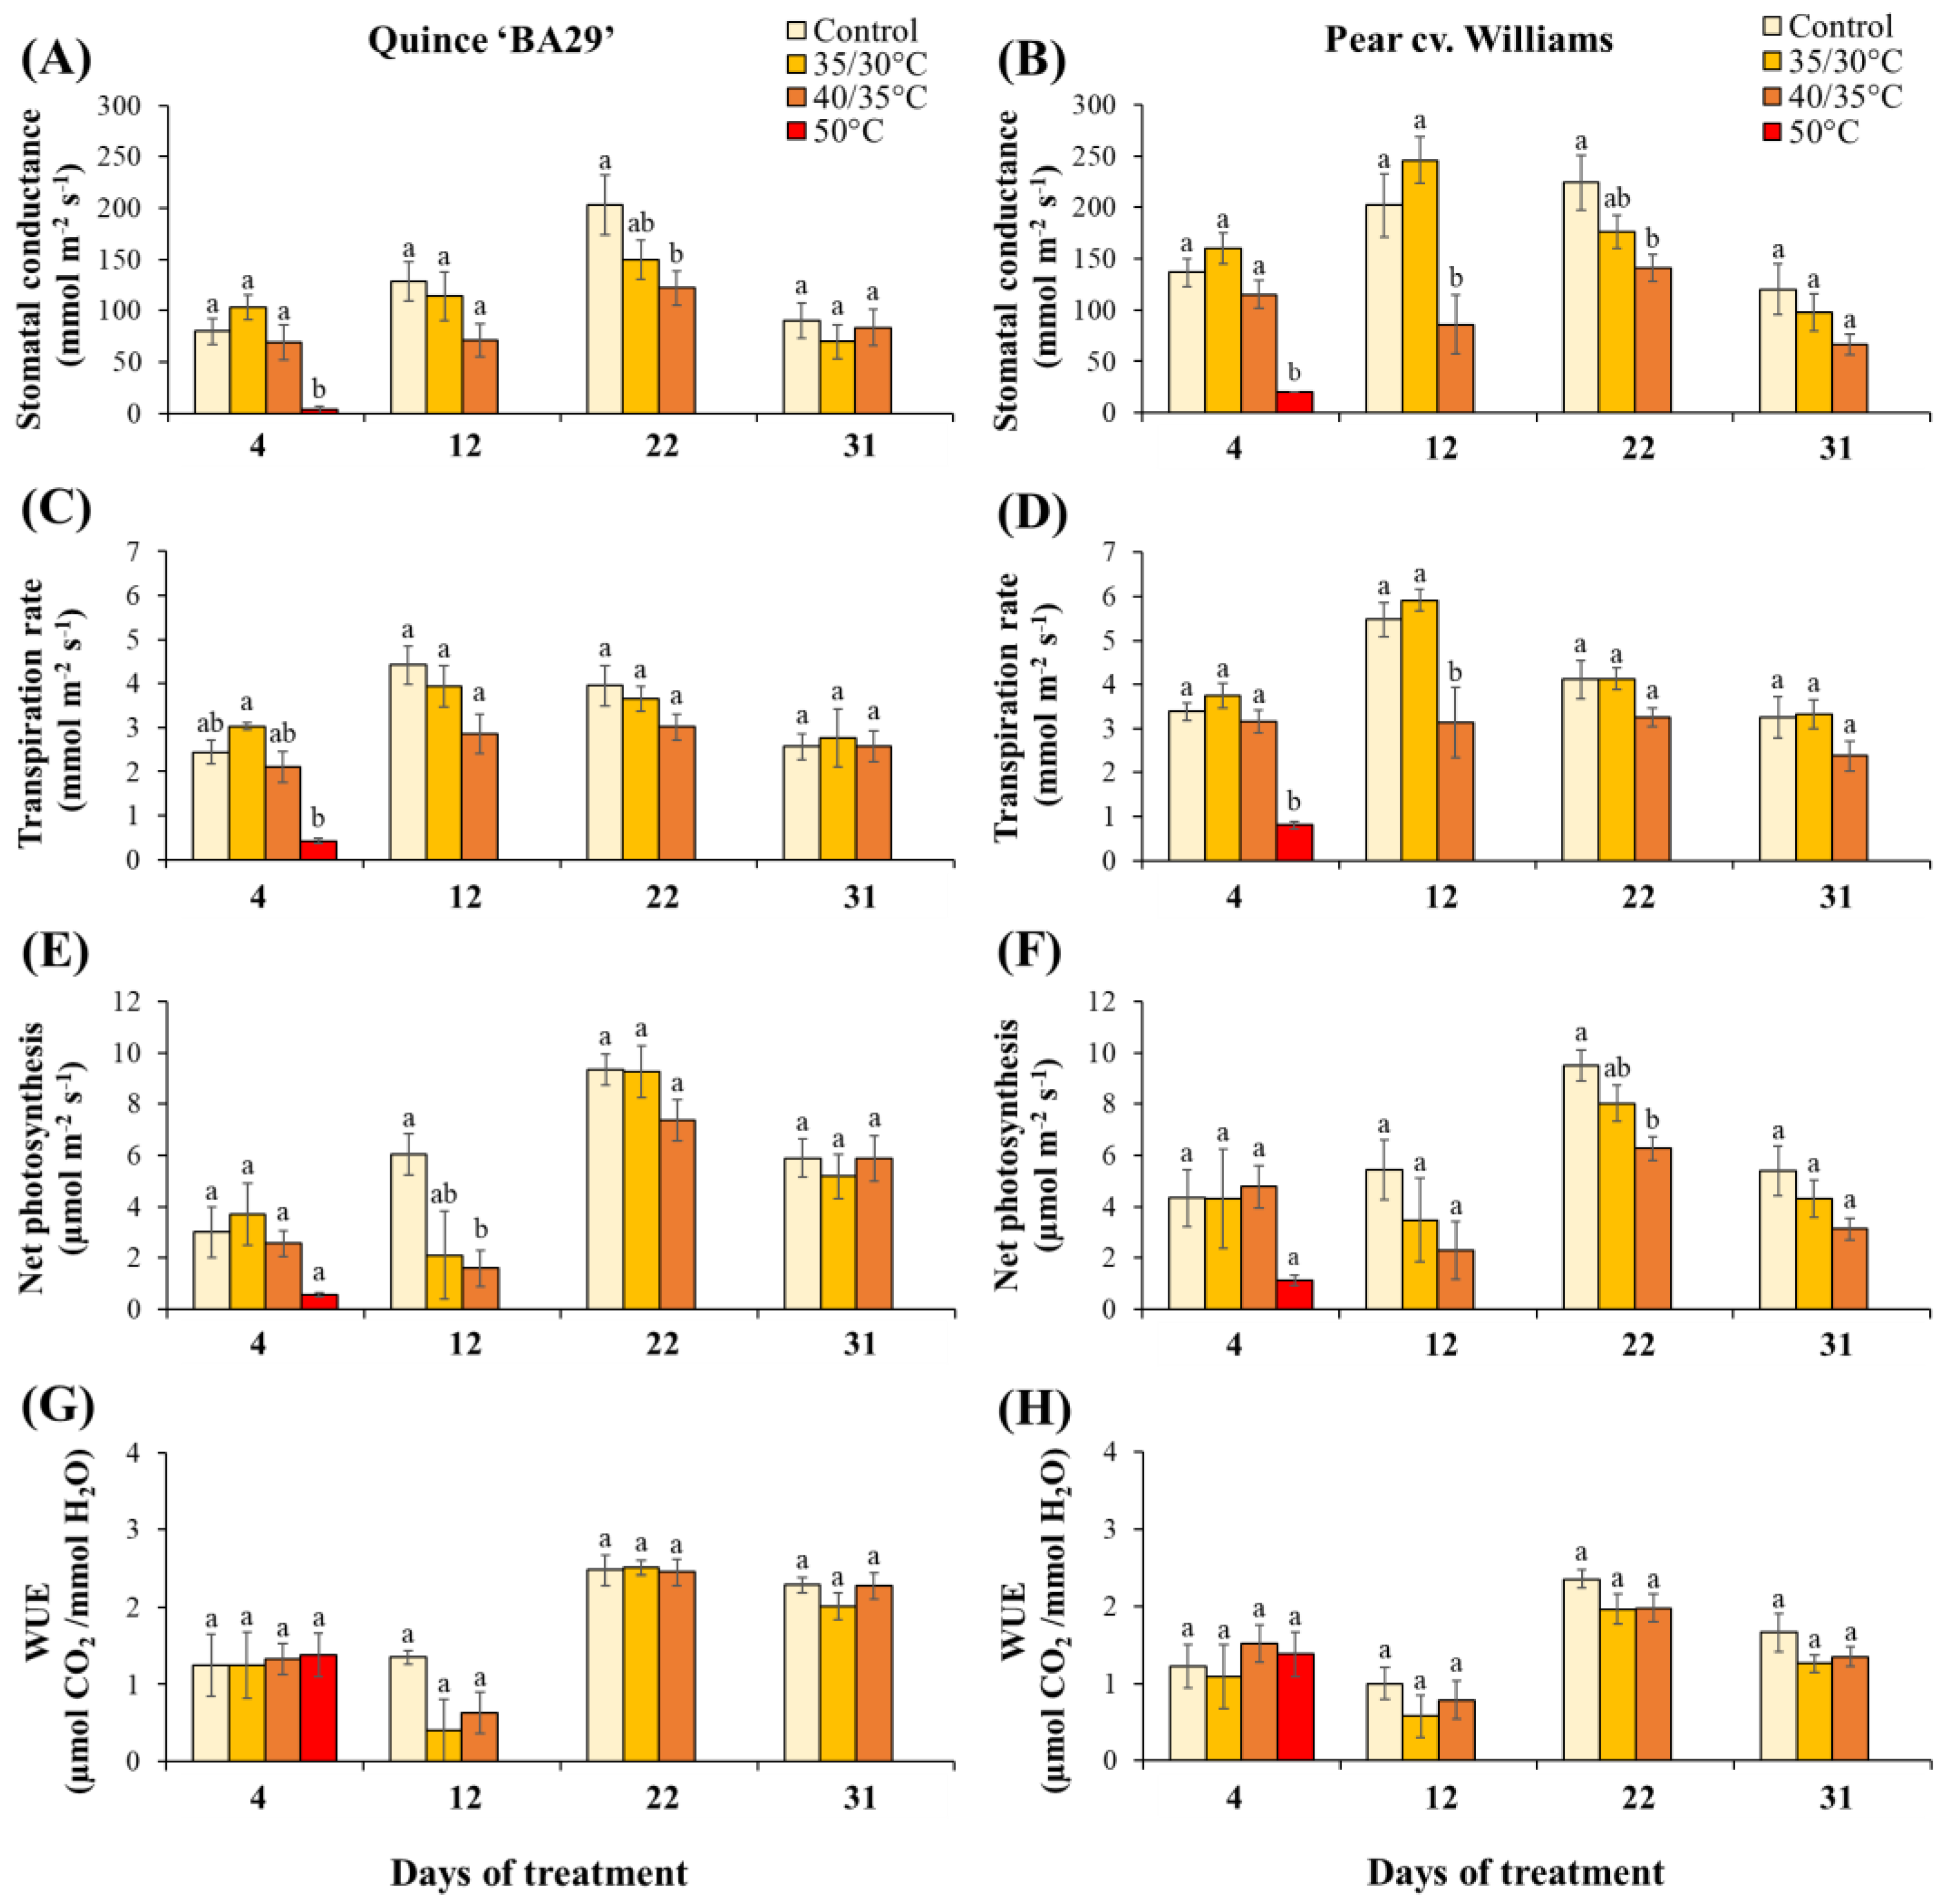
Figure 5.
Leaf relative water content (RWC) of quince (a) and pear (b) plants subjected to different substrate temperatures on Day 10 of the first heating treatment and at the end of the recovery period (Day 22). Data are means ± standard error (n = 5 for all treatments). Different letters indicate significant differences between treatments within each species and sampling date (P < 0.05).
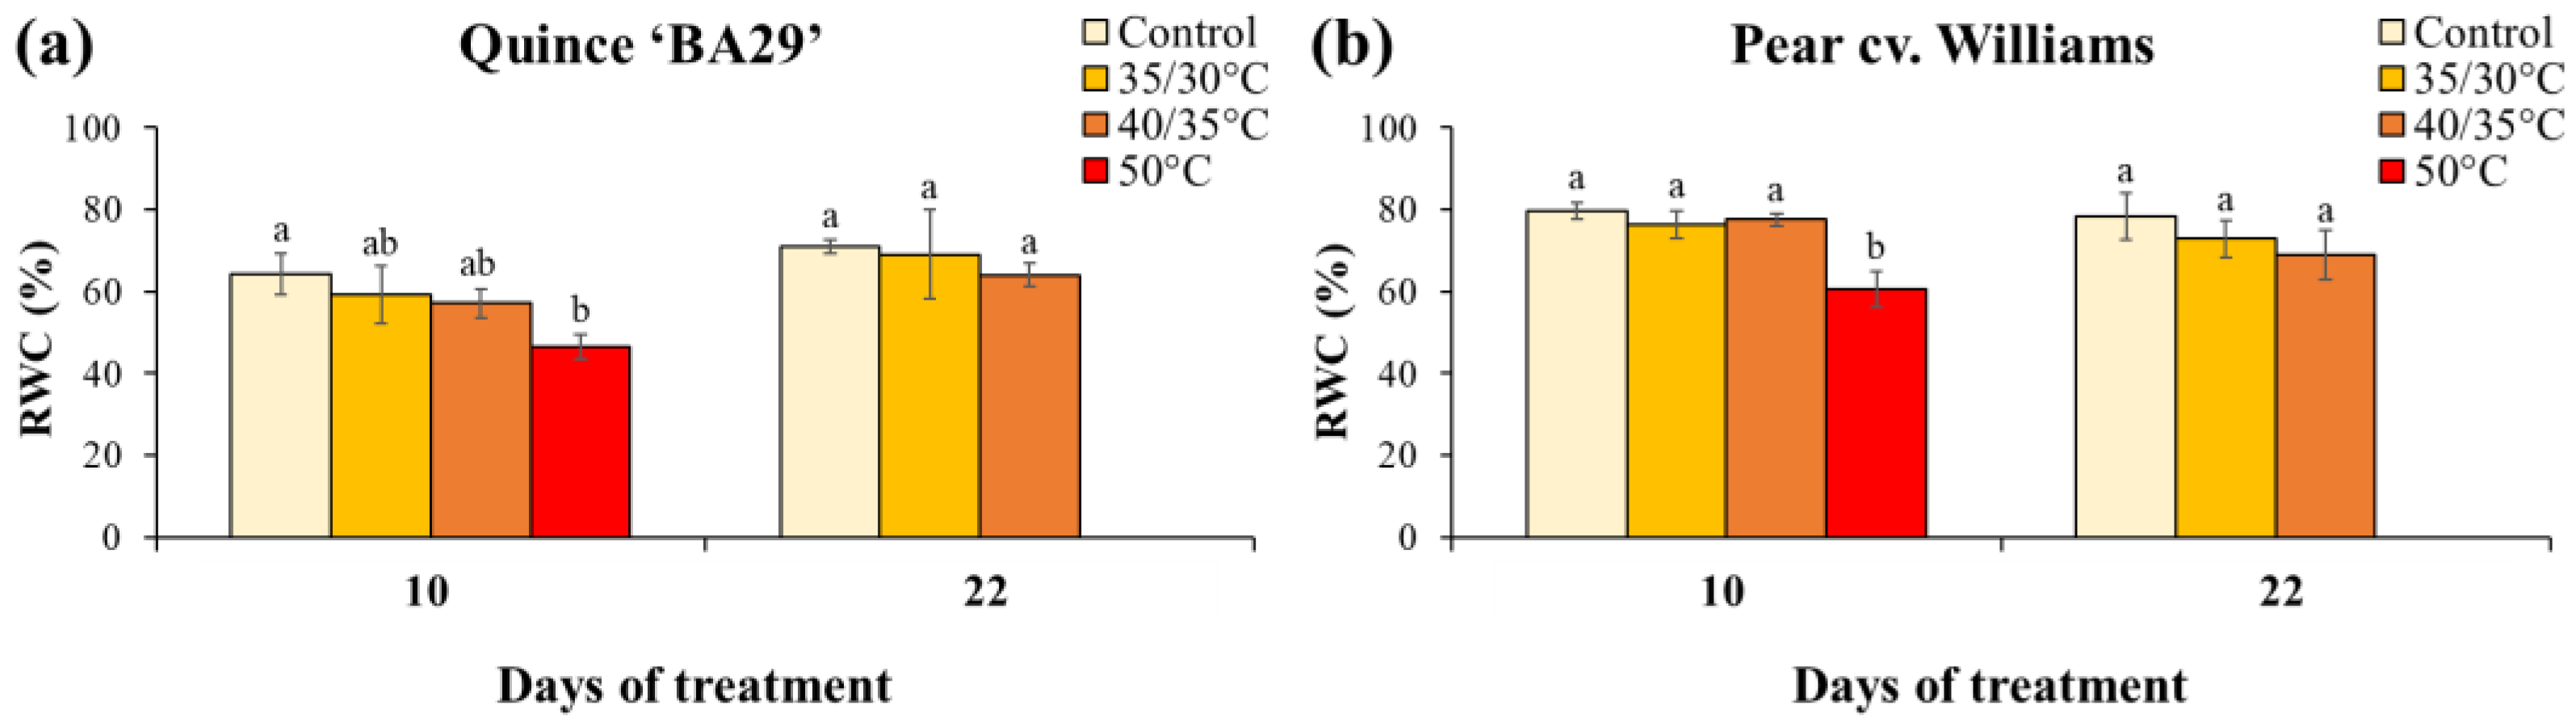
Figure 6.
Chlorophyll content index (CCI) of quince (a) and pear (b) plants subjected to different root-zone heating treatments on Day 8 of the first heating period, at the end of the recovery period (Day 22), and at the last day of the second heating phase (Day 31). Data are means ± standard error (n = 10 for control and 40/35 °C treatments; n = 5 for 35/30 °C and 50 °C treatments). Different letters indicate significant differences between treatments within each species and measurement date (P < 0.05).
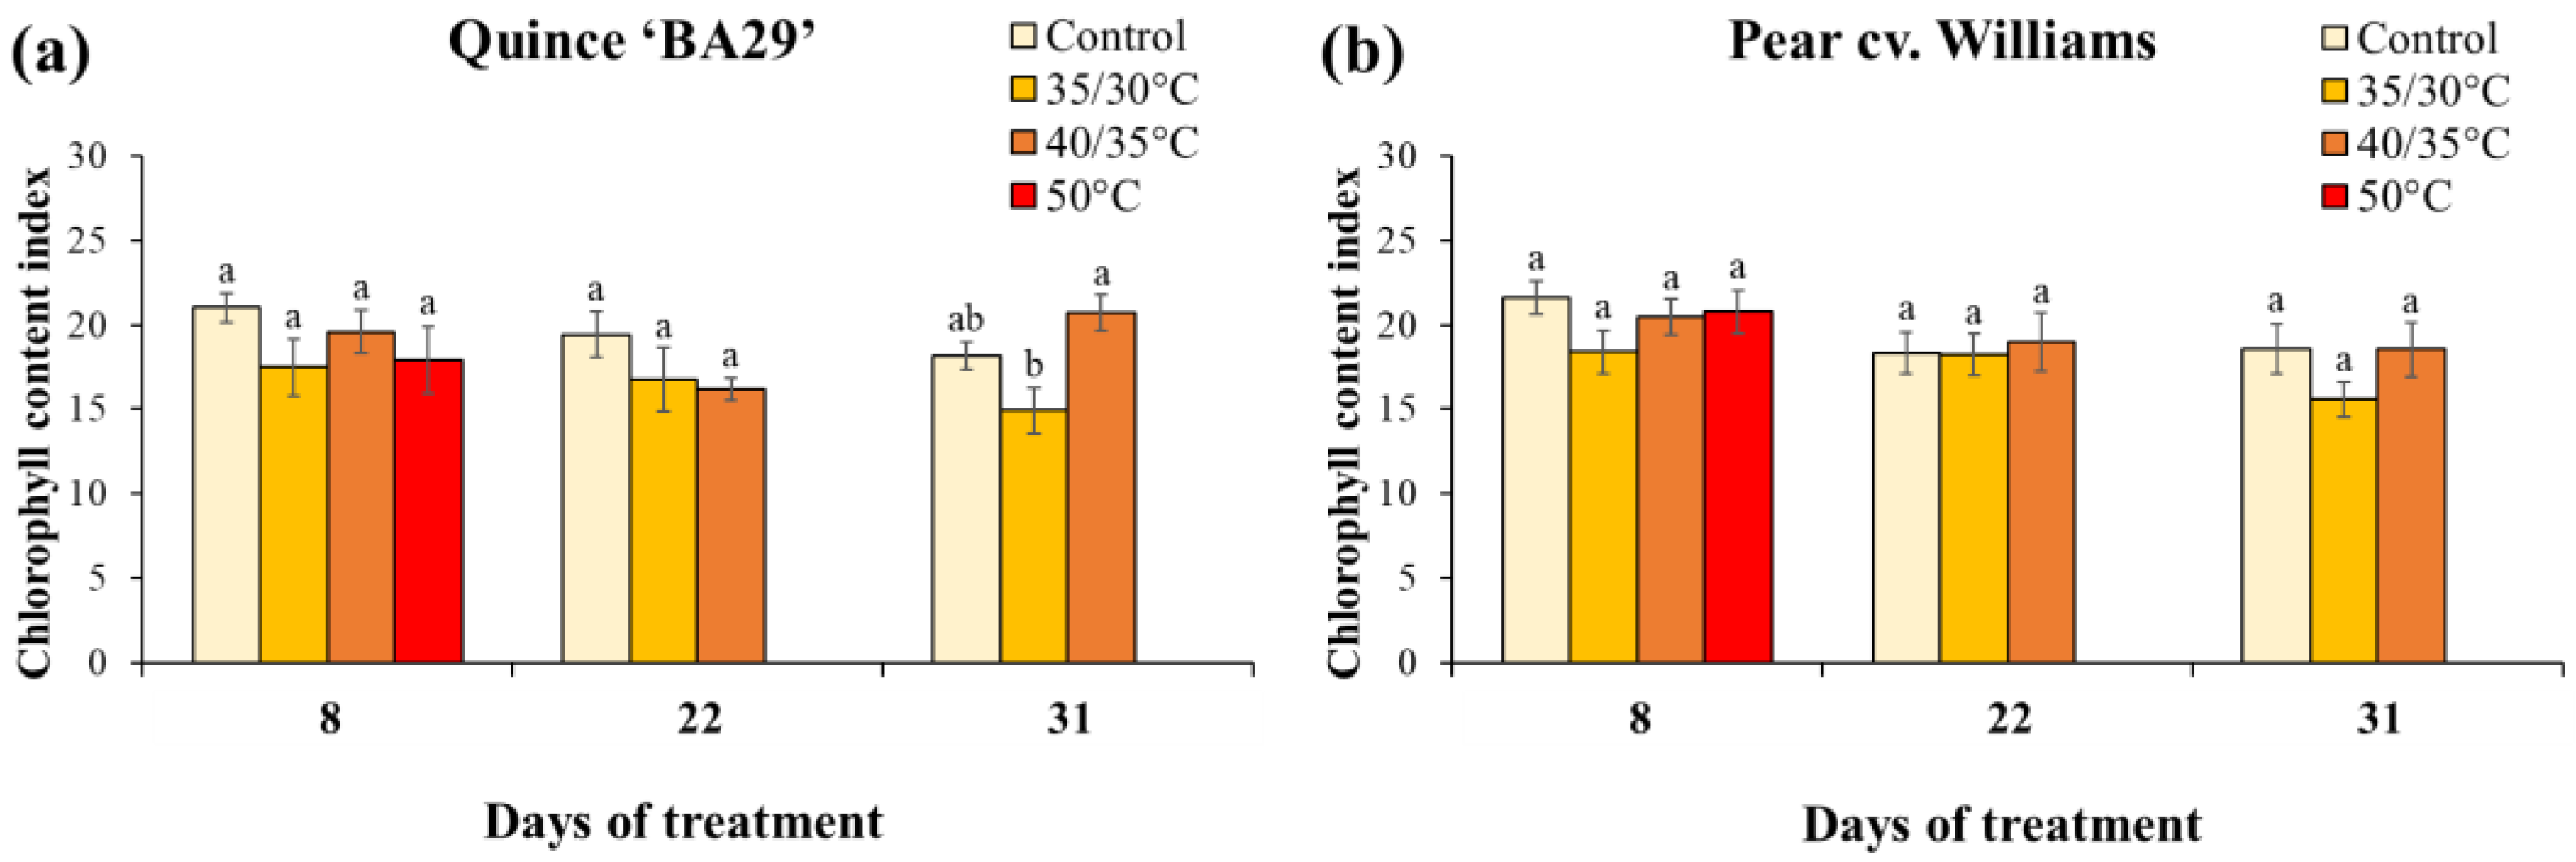
Figure 7.
Shoot length increase of quince (a) and pear (b) subjected to different substrate temperatures during the first heating period (14 days), the recovery period (8 days), and the second heating period (8 days). Data are means ± standard error (n = 10 for control and 40/35 °C treatments; n = 5 for 35/30 °C and 50 °C treatments). Different letters indicate significant differences between treatments within each species and treatment phase (P < 0.05).
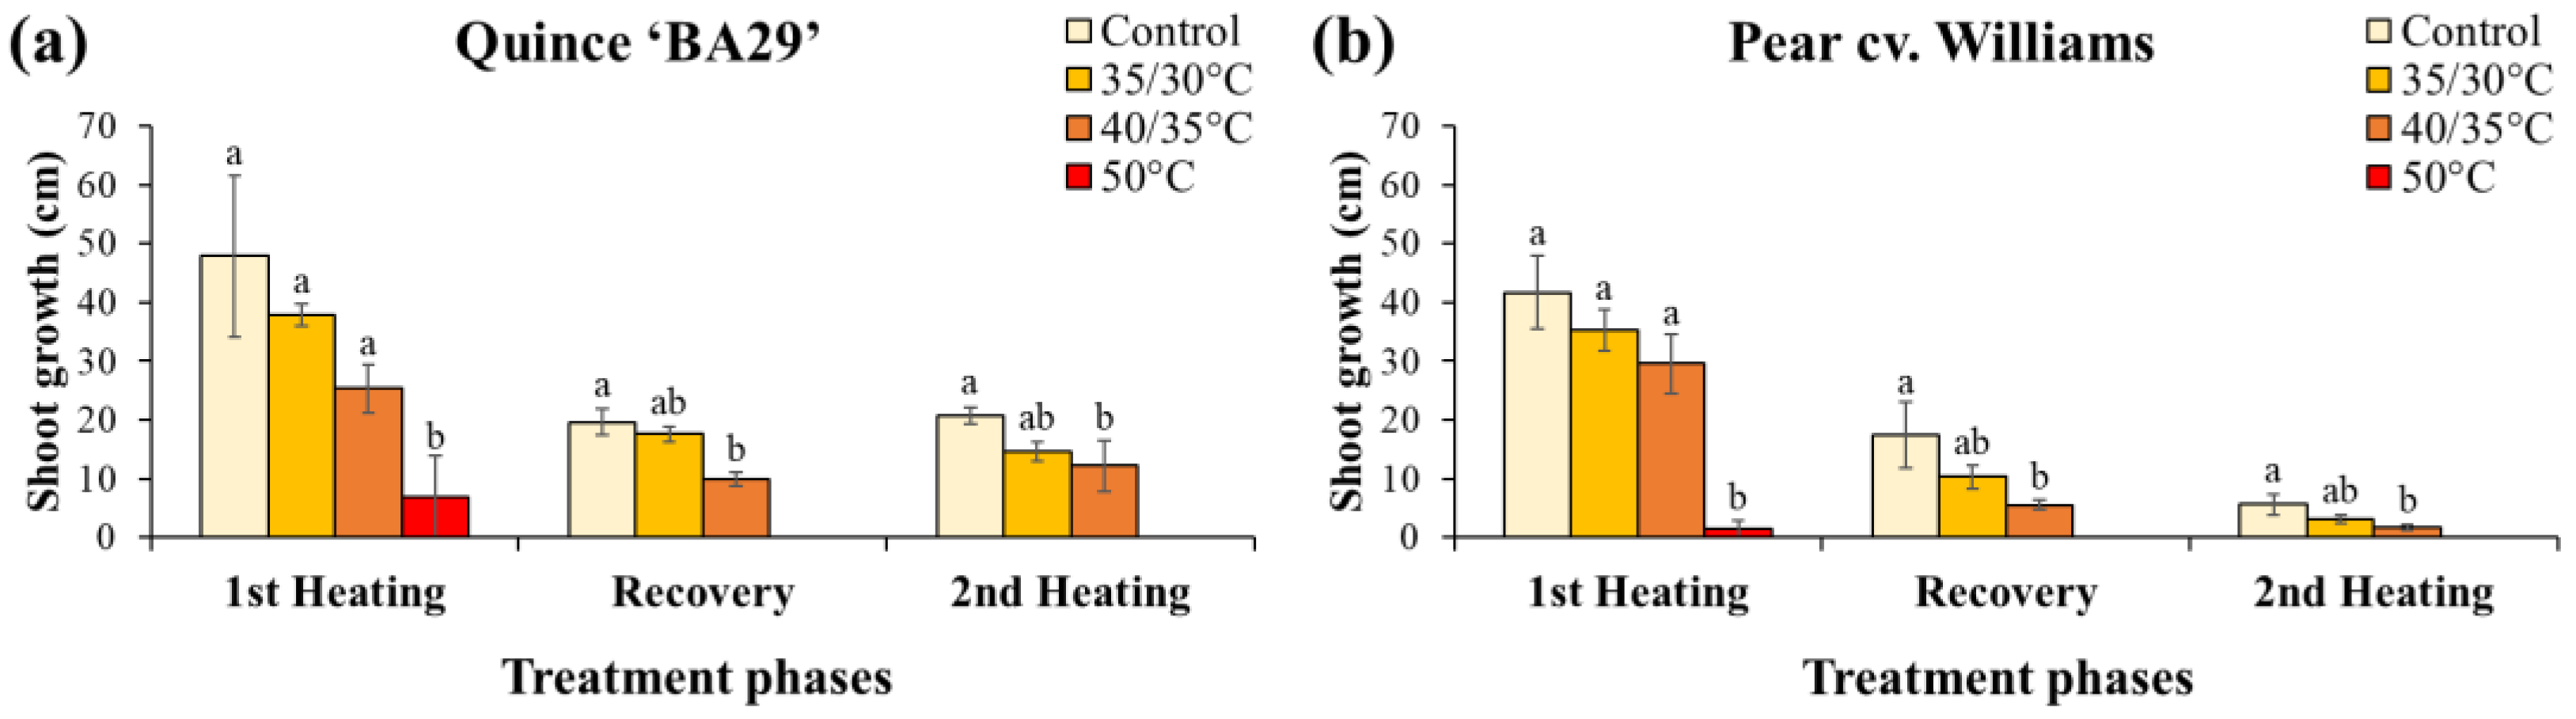
Figure 8.
Final stem diameter (A, B), shoot biomass (C, D), root biomass (E, F), and root/shoot ratio (G, H) of quince and pear plants subjected to different substrate temperatures. Data are means ± standard error (n = 10 for control and 40/35 °C treatments; n = 5 for 35/30 °C and 50 °C treatments). Different letters indicate significant differences between treatments within each species (P < 0.05).
Disclaimer/Publisher’s Note: The statements, opinions and data contained in all publications are solely those of the individual author(s) and contributor(s) and not of MDPI and/or the editor(s). MDPI and/or the editor(s) disclaim responsibility for any injury to people or property resulting from any ideas, methods, instructions or products referred to in the content. |
© 2025 by the authors. Licensee MDPI, Basel, Switzerland. This article is an open access article distributed under the terms and conditions of the Creative Commons Attribution (CC BY) license (http://creativecommons.org/licenses/by/4.0/).
Copyright: This open access article is published under a Creative Commons CC BY 4.0 license, which permit the free download, distribution, and reuse, provided that the author and preprint are cited in any reuse.


