
Submitted:
15 October 2025
Posted:
16 October 2025
You are already at the latest version
Abstract
In the Nutrient Film Technique (NFT) system, air-temperature stress presents a severe challenge to the cultivation of hydroponic lettuce, often limiting its yield and quality during warm seasons. Although previous studies have confirmed that regulating air temperature can alleviate the stress on crops, challenges such as uneven temperature distribution and high equipment costs hinder effective air temperature management in greenhouse environments. In contrast, independently regulating root-zone temperature (RZT) under the same air-temperature stress conditions offers a more practical approach to enhancing crop growth, which can significantly improve crop outcomes without incurring substantial additional costs. This study used 'Spanish Green' lettuce as the test material and established four RZT treatments: T0 (control: 24.65–31.65℃), T1 (24.5℃), T2 (20.5℃), and T3 (16.5℃). Over a 38-day cultivation period, we systematically monitored the effects of different RZT treatments on lettuce growth parameters (such as plant height, leaf area, and shoot dry weight) and nutritional quality indicators (including vitamin C, nitrate, and mineral element content). The fuzzy membership function method was employed for a comprehensive evaluation of lettuce quality.The results showed that all cooling treatments (T1, T2, T3) promoted increases in plant height, leaf area, and shoot dry weight. Based on calculations from the fuzzy membership function, lettuce under treatment T1 achieved the best balance between growth performance and nutritional quality. Lettuce in treatment T0 exhibited the poorest growth; compared to T0, shoot dry weight increased by 47.24%, 16.24%, and 12.21% for treatments T1, T2, and T3, respectively. However, mineral element contents such as P, Ca, and Zn were significantly higher in treatment T0 than in the other three treatments. The overall quality of lettuce in treatment T2 was superior to that in T3; although T2 promoted growth relative to T0, its growth performance was significantly lower than that of T1, and both T2 and T3 exhibited a decline in overall growth quality. Nutrient solution consumption was highest for treatment T1 and lowest for treatment T0.This study demonstrates that independently regulating RZT to approximately 24.5℃ can achieve a synergistic enhancement of biomass and quality in lettuce, providing a theoretical basis and practical guidelines for optimizing NFT system production during summer conditions.
Keywords:
root-zone temperature
; hydroponics
; lettuce
; nutrient film technique (NFT)
; growth
1. Introduction
Lettuce(Lactuca Sativa L.)is typically cultivated using three primary methods: soil cultivation, substrate cultivation, and hydroponics [1]. Among these, the Nutrient Film Technique (NFT), a hydroponic technology, is widely used in lettuce production due to its high efficiency [2]. The core principle of NFT involves using a pump to deliver a prepared nutrient solution from a reservoir to the root-zone of plants located in an elevated cultivation channel. The nutrient solution flows through the channels in a thin layer (typically ≤ 5 cm deep) and returns to the reservoir via a return pipe, forming a recirculating system [3].
The advantages of NFT are twofold. First, the roots are partially immersed in the nutrient solution while the upper parts are exposed to air, facilitating simultaneous nutrient uptake and oxygen absorption, thereby meeting metabolic demands [4]. Second, NFT overcomes limitations associated with soil cultivation, allowing more efficient use of limited agricultural land [5]. This method also reduces the risk of soil-borne diseases, enables precise control of nutrient composition, and lowers labor requirements [6,7]. Moreover, NFT exhibits higher energy efficiency compared to conventional cultivation systems [8]. Studies have reported that in some regions, the use of NFT for lettuce production shortened the growth cycle by 43% compared to soil-based cultivation, demonstrating its high production potential [9]. However, during summer in temperate climates, high air temperatures can lead to increased nutrient solution temperatures, which often reduce the yield and quality of NFT-grown lettuce and may even cause production interruptions. This can result in underutilization of hydroponic facilities and wastage of land resources. Therefore, developing strategies to mitigate air-temperature stress in NFT systems has become a critical issue for lettuce production in these regions.
Elevated air temperatures have been reported to reduce flowering and seed set by inhibiting anther dehiscence and pollen viability. High temperatures can also disrupt physiological processes such as synthesis of leaf compounds, thereby impairing plant growth and development [10,11,12,13,14]. This suggests that modulating aerial temperature could help alleviate the stress in shoots. Several greenhouse cooling methods have been employed, including ventilation, shade nets, wet curtain-fan systems, spray cooling, and misting. However, under persistent high-temperature conditions, the effectiveness of ventilation, shading, and spray cooling is limited. While wet curtain-fan systems and misting offer some cooling, they consume substantial energy and water, making them less suitable for arid areas. Moreover, these methods may create high-humidity conditions that increase the incidence of leaf diseases and rot [15]. For most greenhouse operators, cost-effective and efficient cooling systems are not yet widely available.
Recent studies suggest that high root-zone temperatures (RZT) may cause more severe stress than high air temperatures [16]. Roots are critical organs for water and nutrient uptake [17], and the temperature of the root environment directly affects root functionality by influencing physiological processes such as respiration rate and nutrient absorption [18]. A well-documented signaling pathway between roots and shoots allows plants to integrate root physiological status with overall growth regulation [19]. For example, under air-temperature stress of 32 °C, Arabidopsis thaliana with root cooling showed no significant differences in root number, root length, or shoot development compared to plants grown at 22 °C. In contrast, plants without root cooling at 32 °C exhibited impaired root function and reduced shoot growth [18]. Plant responses to RZT are characterized by an “optimal temperature window”, within which growth rate and dry matter accumulation exhibit a unimodal response curve with a peak at the optimum RZT. Owing to genetic variation and differences in environmental adaptation among species [20], the optimal RZT varies across crops [21,22,23] and may shift with changes in ambient air temperature [24]. When RZT exceeds tolerance thresholds, key physiological functions are disrupted. For instance, water uptake in grapevines and Acacia dealbata, and nitrogen absorption and assimilation in cucumbers and maize, are adversely affected under non-optimal RZT [25,26,27,28]. In strawberries, an RZT of 30 °C significantly reduced root oxygen consumption and cellular activity. After two months, plants showed wilting, reduced fruit yield, increased deformity, and decreased biomass. In contrast, regulating RZT to 10 °C increased leaf biomass and fruit yield [29]. Furthermore, high RZT can induce excessive accumulation of reactive oxygen species (ROS) in roots [30], and inhibit plasma membrane H⁺-ATPase activity in lodgepole pine seedlings, thereby impairing ion transport [31]. Together, these findings suggest that regulating RZT independently may be a more effective strategy for alleviating the stress than modifying aerial temperature.
Several studies have examined the effects of RZT on lettuce growth. In an early spring glasshouse environment (air temperature 20–26.5 °C), gradient experiments reducing RZT to 18.3 °C showed that lettuce grown at 21.1 °C accumulated the most dry matter [32]. However, the results of this experiment may only be applicable to spring and may not be representative of typical summer production in common greenhouses. Another study used ice blocks to lower the nutrient solution temperature from 25 °C to 10 °C during the dry season and found optimal growth at 10 °C for two lettuce varieties [33]. Nonetheless, this method is labor-intensive and offers poor temperature stability. In contrast, using water chillers to regulate RZT requires moderate investment but provides better temperature control and reduces labor. Another study showed that reducing the nutrient solution temperature to 20 ± 1 °C during hot seasons promoted lettuce growth and dry matter accumulation [34]. However, only one cooling treatment was applied, and thus the optimal RZT for NFT-grown lettuce in summer remains unclear. Therefore, it is still unknown whether root-zone cooling alone can enable successful hydroponic lettuce production during hot seasons.
In this context, the present study aims to identify the optimal RZT for lettuce growth using a water chiller to create multiple cooling treatments (24.5 °C, 20.5 °C, and 16.5 °C) under summer greenhouse conditions. By assessing plant height, stem diameter, dry weight, vitamin C content, soluble protein content, and mineral element content, this research seeks to clarify the physiological responses of lettuce to different RZT regimes. The findings are expected to help optimize NFT production in temperate summer conditions, improve yield, and provide theoretical and practical solutions to mitigate air-temperature stress, reduce production interruptions, and minimize resource wastage.
2. Materials and Methods
2.1. Experimental Site Overview
The experiment was conducted from early August to mid-September 2024 at the demonstration garden of the Beijing Jingwa Agricultural Technology Innovation Center, located in Pinggu District, Beijing. The greenhouse is oriented along a north-south axis and is equipped with a retractable thermal blanket system on the roof, operated via a motorized control. Throughout the experimental period, the thermal blanket was deployed only during periods of heavy rainfall and remained retracted otherwise. The site is situated at 40°10′41″ N, 117°0′56″ E (Figure 1) and experiences a warm temperate semi-humid to semi-arid monsoon climate. Summer, during which the experiment took place, is characterized by abundant sunlight and photoperiods suitable for lettuce growth, alongside high temperatures. The mean annual temperature is approximately 11.7 °C, with an average annual precipitation of around 629.4 mm. Summer precipitation accounts for 72% of the annual total, and the annual sunshine duration averages approximately 2519 hours.
2.2. Experimental Design
The experiment was designed with four treatments: T0, T1, T2, and T3, employing a randomized block design with three replicates for each treatment. Based on the optimal growth temperature range for lettuce (15–25 °C) [35], and considering that the experiment was conducted during the summer when environmental temperatures were high, a root-zone cooling gradient was applied to investigate its effects on lettuce growth. The cooling treatments were established as follows: T0 (control group, with greenhouse temperatures ranging from 24.65 to 31.65 °C), T1 (24.5 °C), T2 (20.5 °C), and T3 (16.5 °C). The actual monitored nutrient solution temperature fluctuated within a range similar to the set cooling water temperature (Figure 16). Treatment T3 (16.5 °C) was incorporated to investigate the effects of lower temperature levels on lettuce growth.
Each treatment used a cultivation rack measuring 4 meters in length, consisting of 36 holes arranged in a 4×9 configuration (Figure 3). The lower section featured a plastic support framework (96×65×86 cm), while the upper section consisted of a cultivation trough and pipe system made of PVC-U (116×89 cm, inner diameter: 90×50 mm). Each cultivation rack was equipped with an independent plastic nutrient solution tank with a capacity of 20 liters, accommodating the planting of 36 lettuce plants per rack. The T0 treatment was not connected to a water chiller and served as the control; treatments T1 and T2 were each connected to one water chiller for cooling. Due to the lower target temperature of T3, a single water chiller could not achieve the set temperature; therefore, two water chillers were operated simultaneously to ensure precise temperature control. The water chiller used in the experiment was a household aquarium water chiller (34 × 20 × 32 cm, 150 W, 220 V ~50 Hz).
2.3. Experimental Materials
2.3.1. Lettuce Variety and Fertilizer
The lettuce variety used in the experiment was “Spanish Green” (Beijing Chaolai Agricultural Garden, Beijing, China). The fertilizer applied was a specialized nutrient solution for leafy vegetables, provided by the supplier of the cultivation racks, Jiangsu Rongcheng Agricultural Technology Development Co., Ltd. (Nantong, China).

Table 1.
Main components of fertilizer.
| components | C | N | P₂O₅ | K₂O | CaO | MgO | S |
|---|---|---|---|---|---|---|---|
| concentrtions/(g·Kg-1) | 11 | 106 | 51 | 166 | 98 | 35 | 13 |
Note: The table shows the main components of the fertilizer.
The fertilizer consisted of two components: Solution A and Solution B. Prior to use, both solutions were diluted separately and then mixed with water at a volume ratio of 1:200 (fertilizer solution to water). The electrical conductivity (EC) of the mixed solution was approximately 1500 μS/cm, and the pH ranged from 6.5 to 6.7.
2.3.2. Assembly of Cultivation Racks and Water Chiller Unit
The nutrient solution cooling system was assembled as follows: Both the inlet and outlet hoses provided with the water chiller (Aoling SF102, Shenzhen Aoling Hengye Technology Co., Ltd., Shenzhen, China) were placed into the nutrient solution tank.The water chiller pump (Haisheng HS-461, Zhongshan Haisheng Electric Appliance Co., Ltd., Zhongshan, China) was immersed in the same nutrient solution tank. Its outlet was connected to the inlet hose of the water chiller. Thereby, the water chiller and its pump formed an independent circulation loop. The pump drew the nutrient solution from the tank into the water chiller for cooling, and the cooled nutrient solution was returned to the original tank via the outlet hose of the water chiller, thereby continuously lowering the overall temperature of the nutrient solution in the tank (Figure 2).
The circulation system of the cultivation racks was configured as follows: The cultivation rack pump (Haisheng HS-461, Zhongshan Haisheng Electric Appliance Co., Ltd., Zhongshan, China) was placed in the same nutrient solution tank, with a filter screen attached to its inlet. The outlet of this pump was connected to the inlet pipe of the cultivation racks, through which the cooled nutrient solution was pumped into the cultivation gutter system. After flowing through all the cultivation gutters, the nutrient solution returned by gravity to the nutrient solution tank via a short, vertically oriented outlet pipe designed to minimize flow resistance and prevent siphoning, thus completing the cycle (Figure 2).
All pumps operated uninterruptedly 24 hours per day throughout the experimental period. Each nutrient solution tank was initially filled with an equal volume of nutrient solution at the same concentration.
2.3.3. Lettuce Seedling Transplantation
On August 4, 2024, the selected lettuce seedlings were all at the two-true-leaf stage, with essentially uniform growth characteristics—such as size and coloration—across all treatment groups. The transplantation procedure was performed as follows: The base of each seedling was wrapped in pre-treated growing sponges, then placed into net cups, and the entire assembly was mounted onto the cultivation gutters. The sponges continuously absorbed nutrient solution, thereby supplying water and nutrients to the seedlings. As the root systems elongated, they first developed within the sponges and subsequently extended through the pores of the sponges into the nutrient solution tank below the net cups, ensuring efficient uptake of water and nutrients.
2.4. Measurement Indicators and Methods
2.4.1. Temperature and Humidity Monitoring
A soil moisture collector (Brand: Lvshui, Agrocore Technology (Beijing) Co., Ltd., Beijing, China) was adapted to monitor the nutrient solution temperature. The device is equipped with four temperature probes, each suspended on the same inner side of the corresponding nutrient solution tank, enabling synchronous temperature data collection from four treatment groups. Monitoring data can be accessed on mobile devices by scanning the QR code on the instrument.
Air temperature and humidity inside the greenhouse were recorded using a remote temperature and humidity collector (Model: Pengyun S10A, Xuzhou Faraday Electronic Technology Co., Ltd., Xuzhou, China). The instrument was placed at a suitably located position near the four cultivation racks, with data recorded at one-hour intervals. The collected data can be viewed and managed in real-time via the “Pengyun IoT” software on mobile devices.
2.4.2. Monitoring of Nutrient Solution Indicators
The electrical conductivity (EC) of the nutrient solution was measured using a conductivity meter (METTLER TOLEDO, Shanghai, China). pH was monitored every two days using a pH meter (METTLER TOLEDO, Shanghai, China). When pH was high, it was adjusted with phosphoric acid (H₃PO₄); when it was low, sodium hydroxide (NaOH) was used. The nutrient solution was replenished every 1–2 days based on consumption, and each addition was recorded in detail.
2.4.3. Monitoring of Lettuce Growth Indicators
Plant height, stem diameter, leaf number, and SPAD value were measured starting from August 18, 2024, after transplanting, and subsequently assessed every four days. Root dry weight, shoot dry weight, and leaf area were determined using destructive sampling, with five measurements conducted from August 19, 2024. For each treatment, three uniformly grown plants were selected per assessment, and the results were averaged. The final harvest was conducted on September 10, 2024, followed by nutritional quality testing. The entire experiment lasted 38 days.
Figure 3.
Schematic diagram of SPAD value measurement.
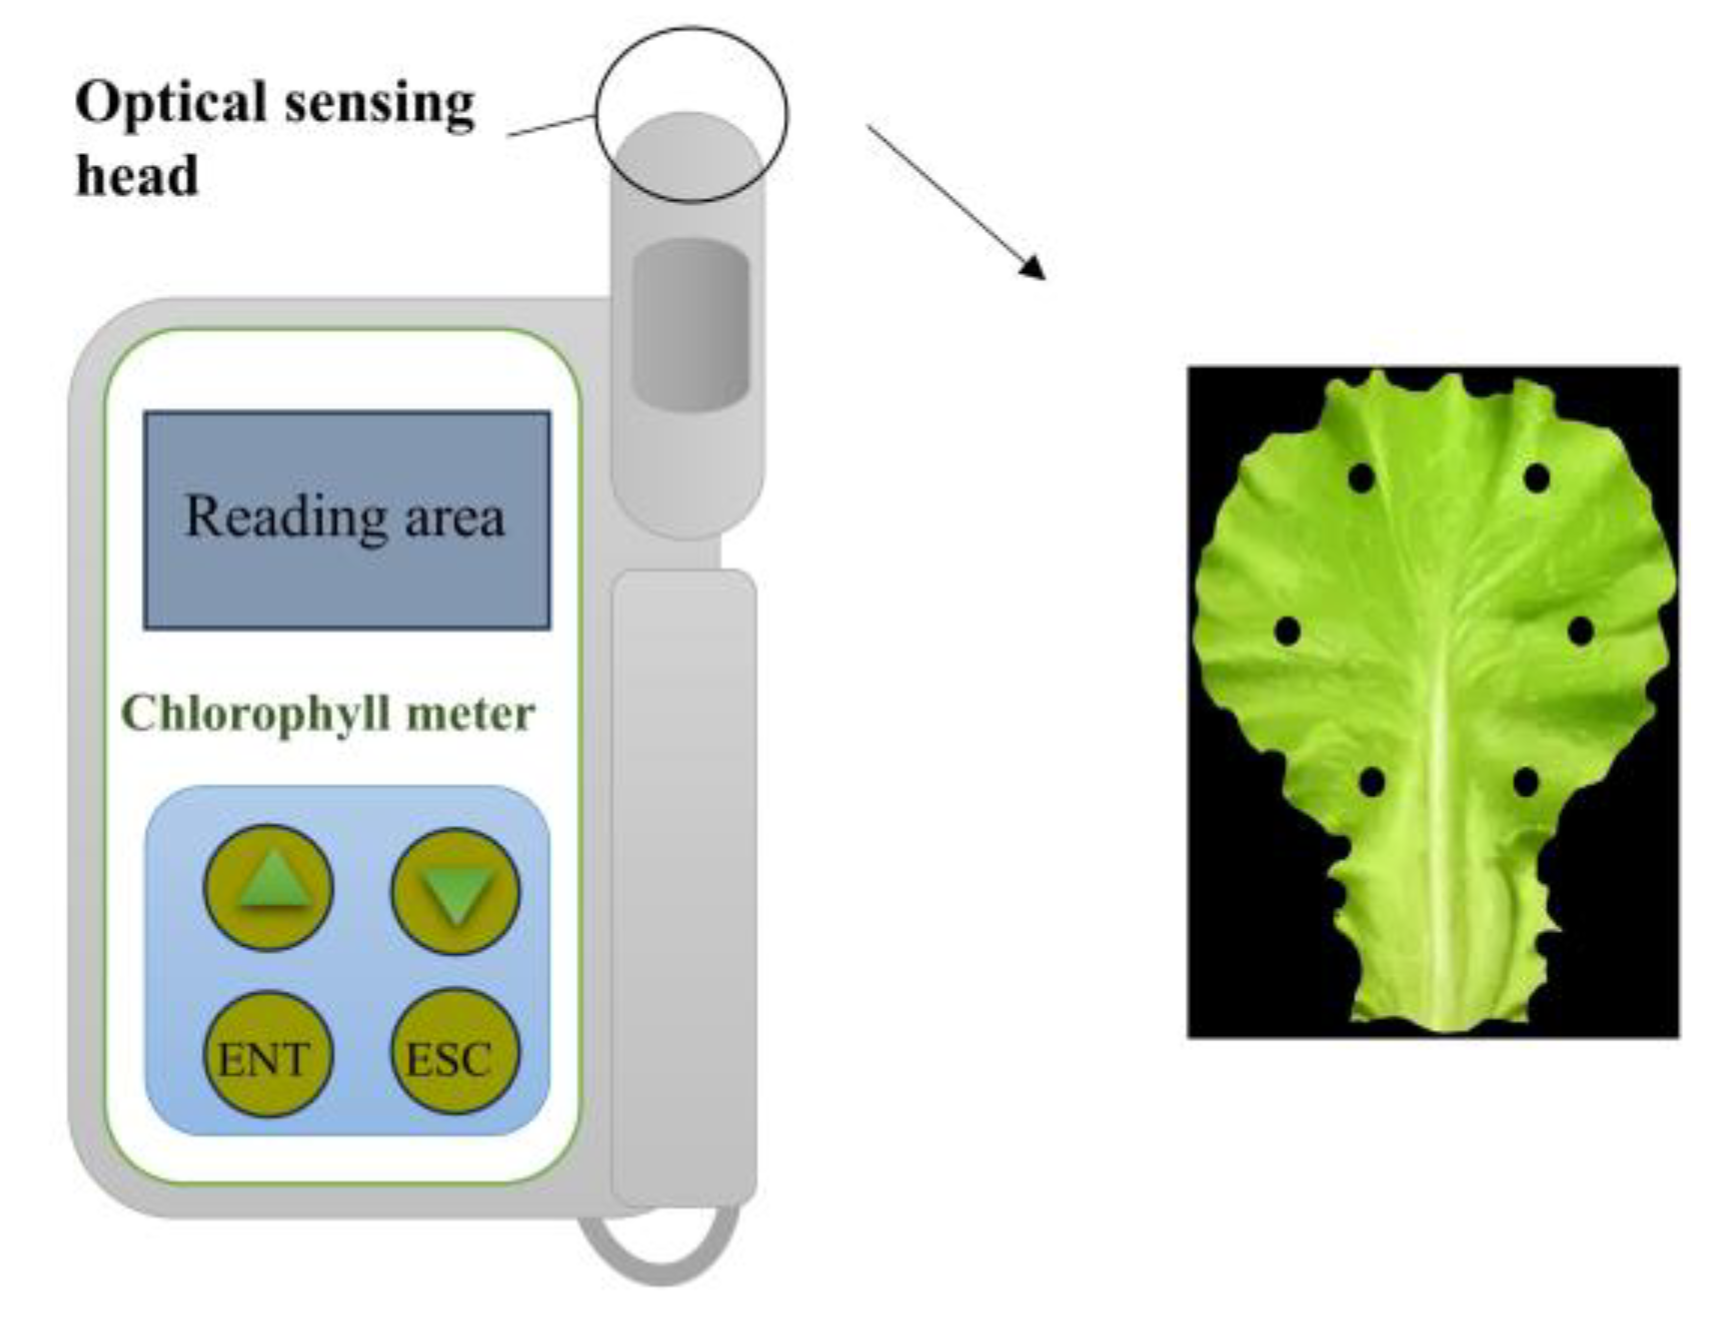
Plant height was measured using a ruler (accuracy: 1 mm) as the vertical distance from the upper edge of the transplant cup to the highest point of the plant. Stem diameter was measured using a caliper (accuracy: 0.02 mm). The number of leaves with an area greater than 1 cm² was counted manually. The relative chlorophyll content (SPAD value) was measured using a chlorophyll meter (SPAD-502, Beijing Harvesting Technology Co., Ltd., Beijing, China). One leaf from the same position on each plant was selected, avoiding the main vein. Six measurement points were symmetrically chosen along the midline at the front, middle, and back parts of the leaf. Each leaf was measured three times at each point, and the values were averaged (Figure 3).
Leaf area was measured using a leaf area meter (Model: EPSON YMJ-S, Hengmei Electronic Technology Co., Ltd., Weifang, China). During measurement, all leaves were sequentially placed flat on the scanning area of the instrument, maintaining appropriate spacing between leaves to prevent overlapping. The obtained leaf area data were analyzed and recorded using the built-in professional software on a computer (Figure 4).
Dry weight determination: The surface moisture of the lettuce was blotted dry with absorbent paper. The shoot and root of each plant were separated using scissors, placed into labeled kraft paper sample bags, and subsequently dried in an electric blast drying oven (Model: BPG-9070A; Manufacturer: Shanghai Hengke Instrument Co., Ltd., Shanghai, China)(Figure 5(a)). The samples were first heated at 105 °C for 15 minutes to deactivate enzymes, followed by drying at 80 °C until constant weight was achieved. The dry weights of the shoot and root were measured separately using an electronic balance with a precision of 0.0001 g (Manufacturer: BEL ENGINEERING; Supplier: Beijing UNITE Gas Engineering Technology Co., Ltd., Beijing, China)(Figure 5(b)).
2.4.4. Lettuce Imaging
Digital images of the lettuce in each treatment group were acquired using a smartphone for phenotypic comparison. Temperature distribution was assessed using an infrared thermal imager (Testo 890; Testo Instruments International Trading (Shanghai) Co., Ltd., Shanghai, China), and the captured thermal images were analyzed with the dedicated IRSoft software (Testo).
2.4.5. Determination of Mineral Elements and Nutritional Quality
After harvest completion on September 10, 2024, the remaining 21 lettuce samples from each treatment were organized, and their mineral element content and nutritional quality were sent to a professional third-party institution (Vegetable Research Center, Beijing Academy of Agriculture and Forestry Sciences) for blind testing The measurements of various nutritional and functional components were performed according to the corresponding standard methods, as specified below:
The contents of total nitrogen, total phosphorus, total potassium, total calcium, total magnesium, total iron, and total zinc were determined in accordance with GB 5009.268-2016 [36]. Trace elements such as iron and zinc were preferentially analyzed using inductively coupled plasma mass spectrometry (ICP-MS), while macroelements including nitrogen, phosphorus, potassium, calcium, and magnesium were more suitably determined by inductively coupled plasma optical emission spectrometry (ICP-OES), ensuring both detection efficiency and accuracy.
Total sulfur content was measured by the barium sulfate turbidimetric method as described in Soil Agro-Chemical Analysis Methods [37].
Nitrate content was analyzed by ion chromatography (IC) according to GB 5009.33-2016 [38].
Vitamin C (ascorbic acid, Vc) content was determined by high-performance liquid chromatography (HPLC) following GB 5009.86-2016 [39].
Dietary fiber content was analyzed using the enzymatic-gravimetric method based on GB 5009.88-2008 [40].
Soluble sugar content was assessed by the anthrone colorimetric method according to the Agricultural Industry Standard NY/T 1278-2007 [41].
Soluble protein content was determined by the Kjeldahl method following GB/T 22492-2008 [42].
2.5. Statistical Analysis
Data organization and summarization were performed using Microsoft Excel 2024 (Microsoft Corporation, USA). Graphs and charts related to the measured indicators were generated using Origin 2021 (OriginLab Corporation, USA). A schematic diagram of the equipment was prepared using Microsoft PowerPoint 2024 (Microsoft Corporation, USA). Data analysis was conducted in IBM SPSS Statistics 27 (IBM Corporation, USA). Specifically, one-way analysis of variance (ANOVA) was employed for intergroup comparisons, followed by post-hoc testing using the Least Significant Difference (LSD) method, with the significance level set at P = 0.05. One-way analysis of variance (ANOV A)
To characterize the daily root-zone temperature, the average of four time points per day (2:00, 8:00, 14:00, and 20:00) was used as the mean daily temperature. Temperature and humidity data inside the greenhouse were recorded hourly, and the arithmetic mean of all values within a day was taken as the daily average.
The nutrient solution consumption (Vᵢ) was calculated using the following formula:
Vᵢ = ∑[A × (Hᵢ - hᵢ)] (i = 1, 2, …, n)
For comprehensive evaluation, the fuzzy membership function analysis method was applied. If an indicator was positively correlated with the trait, the membership function was calculated as:
R(Xᵢ) =(Xᵢ- Xₘᵢₙ)/(Xₘₐₓ- Xₘᵢₙ)
If the indicator was negatively correlated with the trait, the inverse membership function was used:
where:
R’(Xᵢ)=1-(Xᵢ-Xₘᵢₙ)/(Xₘₐₓ- Xₘᵢₙ)
Xᵢ denotes the measured value of a given indicator;
Xₘᵢₙ and Xₘₐₓ represent the minimum and maximum values of that indicator across all tested materials, respectively [43].
3. Results
3.1. Effects of Different Root-Zone Temperatures (RZT) on Morphological Indicators of Lettuce
3.1.1. Effects of Different Root-Zone Temperatures (RZT) on Plant Height of Lettuce
Plant height can serve as one of the key indicators reflecting plant growth rate. In this experiment, the plant height of lettuce in all treatment groups (Figure 6) exhibited a steady linear increasing trend throughout the growth period.
The plant height under the T1 treatment (24.5 °C) was consistently higher than that under the T0 (24.65–31.65 °C), T2 (20.5 °C), and T3 (16.5 °C) treatments. After a 31-day growth cycle, the plant height in the T1 treatment reached the highest value of 23.37 cm, while the T3 treatment resulted in the lowest value of 19.83 cm. Statistical analysis indicated that the plant heights in the T1 and T2 treatments were significantly higher than those in the T0 and T3 treatments (P < 0.05). At the final measurement, compared to T0, the plant heights in T1 and T2 increased significantly by 14.73% and 13.25%, respectively (P < 0.05). In contrast, the T3 treatment showed a decrease of 2.65% relative to T0. These results demonstrate that 24.5 °C was the most suitable RZT for lettuce growth under the experimental conditions, while the lower temperature of T3 and the higher temperature of T0 both exhibited inhibitory effects on lettuce growth.
3.1.2. Effects of Different Root-Zone Temperatures (RZT) on Lettuce Stem Diameter
The stem of lettuce serves as a critical channel for water and nutrient transport, and its diameter can indirectly reflect the plant’s ability to absorb and translocate nutrients. Generally, an increase in stem diameter indicates well-developed plant growth, whereas a thinner stem suggests restricted water or nutrient uptake and weaker plant vigor.
The dynamic changes in stem diameter under the four treatments in this experiment (Figure 7) showed that as lettuce growth progressed, the stem diameter continued to increase across all treatments. Among them, the stem growth rates of the three cooling treatments (T1, T2, and T3) were generally higher than that of T0, with T1 exhibiting the best performance. This indicates that moderate cooling significantly promotes stem development. At the final measurement, T1 had the largest stem diameter (12.09 mm), while T0 had the smallest (9.59 mm). Compared with T0, the stem diameters of T1, T2, and T3 increased significantly by 26.07%, 22.42%, and 21.17%, respectively. Thus, it can be concluded that higher RZT conditions (T0) significantly inhibit lettuce stem development, while maintaining the nutrient solution temperature at 24.5 °C is most conducive to water and nutrient absorption and utilization, thereby promoting stem thickening.
3.1.3. Effects of Different Root-Zone Temperatures (RZT) on the Leaf Number of Lettuce
Leaf number is a key indicator reflecting the emergence of new leaves and the development of the canopy in lettuce. A greater leaf number generally corresponds to a larger photosynthetic area, which facilitates the accumulation of photosynthetic products and provides ample energy for plant growth. Throughout the growth period, the leaf number in all treatment groups exhibited a linear increasing trend (Figure 8). The T1 treatment consistently maintained a higher leaf number than the T0, T2, and T3 treatments.
At the final harvest, the average leaf number in the T1 treatment reached 20, which was significantly higher than that in other treatments. In contrast, the T3 treatment yielded the lowest average leaf number (16). Compared to the T0 treatment, the leaf number increased significantly by 19.98% in T1 and by 6.00% in T2. Conversely, a decrease of 2.04% was observed in the T3 treatment. These results indicate that the lower RZT (T3) significantly inhibited leaf growth and expansion, whereas the optimal RZT (T1) was highly beneficial for leaf development and canopy formation.
3.1.4. Effects of Different Root-Zone Temperatures (RZT) on Leaf Area of Lettuce
Leaf area is a critical physiological trait that reflects a plant’s capacity for water and nutrient uptake, photosynthetic efficiency, and overall growth performance.
During the experiment, leaf area increased in all treatments (Figure 9), with T1 exhibiting consistently significantly larger leaf areas than T0. At the final harvest, the total leaf area in T1 (2319.49 cm²) was significantly greater than that in all other treatments. Relative to T0, leaf area increased by 82.46% in T1, 42.21% in T2, and 18.91% in T3. These results suggest that the RZT in T1 likely optimized metabolic processes, leading to enhanced resource assimilation and biomass accumulation. In contrast, the elevated RZT in T0 significantly suppressed leaf expansion and overall plant development, demonstrating the detrimental impact of RZT stress on lettuce physiology.
3.1.5. Effects of Different Root-Zone Temperatures (RZT) on Root Dry Weight of Lettuce
The root system, being the primary organ for water and nutrient uptake in plants, reflects biomass accumulation, morphological development, and functional activity. Generally, greater root dry weight indicates more developed roots and improved absorptive capacity.
Throughout the experimental period, root dry weight increased across all treatments (Figure 10). Comparisons between measurements taken on August 31 and September 4 showed that T1 and T2 exhibited rapid increases, whereas T0 and T3 showed more moderate gains. The root dry weight in T1 reached 0.64 g, which was significantly and consistently higher than that in the other treatments (T0, T2, and T3). Compared to T0, the root dry weights in T1, T2, and T3 increased by 73.87%, 53.15%, and 11.71%, respectively. These results demonstrate that the temperature conditions in T1 were most conducive to root growth and biomass accumulation in lettuce, whereas the higher root-zone temperature in T0 significantly inhibited normal root development and reduced absorptive capacity.
3.1.6. Effects of Different Root-Zone Temperatures (RZT) on Lettuce Shoot Dry Weight
Shoot dry weight is a key indicator for assessing biomass accumulation and yield in lettuce. Throughout the growth cycle (Figure 11), the shoot dry weight under T1 treatment consistently exceeded that of T0, T2, and T3 treatments.
By the final measurement, T1 achieved the highest shoot dry weight of 4.26 g, while T0 recorded the lowest value of only 2.89 g. Compared with T0, T1 resulted in a significant increase of 47.24% in shoot dry weight. T2 and T3 treatments increased shoot dry weight by 16.24% and 12.21%, respectively, relative to T0. Combined with root dry weight data, it is evident that root development status is positively correlated with shoot growth. Under T1 treatment, well-developed roots efficiently absorbed water and nutrients, providing ample material support for aboveground growth, thereby promoting the accumulation of shoot dry weight. In contrast, under heat stress in T0 treatment, root growth was inhibited (Figure 10), leading to reduced absorption capacity, which consequently limited biomass accumulation and normal development of the aboveground parts. These results demonstrate that suitable RZT can indirectly enhance shoot yield by promoting root development, while heat stress adversely affects overall plant growth by suppressing root physiological functions.
3.1.7. Effects of Different Root-Zone Temperatures (RZT) on SPAD Values in Lettuce Leaves
SPAD (Soil and Plant Analyzer Development) value is a commonly used indicator to characterize the relative chlorophyll content in plant leaves, which indirectly reflects the photosynthetic capacity and nitrogen status of plants. Chlorophyll, as a key pigment in photosynthesis, is primarily involved in the absorption (especially in the red and blue light bands) and conversion of light energy. It also plays a role in various important physiological processes, such as the synthesis of amino acids and nucleic acids. Throughout the observation period (Figure 12), the range of variation in SPAD values in the T0 treatment was consistently greater than that in the T1, T2, and T3 treatments. Although the SPAD values exhibited some fluctuations, possibly due to factors such as measurement environment, and did not show a continuous linear upward trend, an overall increasing tendency was observed with the rise in RZT. The final measurement results indicated that, compared to T0, the SPAD values of T1, T2, and T3 treatments decreased by 3.95%, 5.81%, and 5.93%, respectively. A higher RZT (T0) may promote chlorophyll accumulation or delay its degradation, while the three cooling treatments somewhat suppressed the relative chlorophyll content. This phenomenon may be related to the regulatory effect of temperature on chlorophyll synthase activity and photosystem stability.
3.2. Effects of Different Root-Zone Temperatures (RZT) on Nutrient Solution Consumption
During the experimental period (August 12 to September 4, 2024), differences in nutrient solution consumption were observed among the treatment groups (Figure 13). The T1 treatment exhibited the highest cumulative consumption, reaching 62.88L, which aligns with its optimal growth performance (Figure 6,Figure 7,Figure 8,Figure 9,Figure 10,Figure 11). This indicates higher water and nutrient absorption efficiency in lettuce under this RZT condition. The overall order of nutrient solution consumption was T1 > T0 > T2 > T3. Previous metrics demonstrated that lettuce in the T1 treatment outperformed other groups in all aspects of growth, with its high water demand particularly reflected in the dry weight of the lettuce canopy.
Notably, although the T0 treatment ranked second in nutrient solution consumption, earlier data indicated that T0 plants exhibited the poorest growth (Figure 6,Figure 7,Figure 8,Figure 9,Figure 10,Figure 11). This phenomenon may be attributed to air-temperature stress, which sustains a higher transpiration rate, leading to increased water loss through transpiration. Concurrently, physiological metabolic efficiency decreases, reducing nutrient utilization capacity. On the other hand, the elevated transpiration rate may cause a concentration effect of mineral elements in plant tissues, which could partly explain why certain element contents were higher in T0 than in other treatments. It should be noted that despite the increased element concentrations, this did not translate into improved plant growth, further confirming the inhibitory effect of air-temperature stress on physiological metabolism.
Specifically, compared to T0, nutrient solution consumption in the T1 treatment increased significantly by 6.79%, while it decreased by 11.89% and 15.29% in T2 and T3, respectively. These results suggest that an appropriate temperature (e.g., T1) synergistically promotes water absorption and growth development. In contrast, this stress (T0) increases transpiration-driven water consumption but fails to effectively convert it into biomass accumulation in lettuce. Instead, it may exacerbate physiological stress and disrupt elemental metabolism.
3.3. Comparison of Lettuce Under Different Root-Zone Temperatures (RZT)
Figure 14 was captured using a smartphone at 15:30 on August 20, 2024. The image shows that lettuce under the T1 treatment exhibited greater leaf expansion, leaf area, plant height, and root length compared to the other treatments, with the difference being particularly notable when compared to the T0 treatment.
Figure 15 (a) and the corresponding visible-light image Figure 15 (b)were acquired with a thermal imager at 19:00 on September 3, 2024. During imaging, one lettuce plant was randomly selected from each treatment group for real-time thermal recording. The thermal image visually reflects the differences in RZT among various treatments through temperature visualization. It should be noted that, as the plants were exposed to ambient air, the RZT was somewhat influenced by the air temperature, leading to an increase that may partially mask the actual root-zone temperature. As indicated by the color bar on the right side of the thermal image Figure 15 (a), the color gradient from bottom to top represents a gradual increase in temperature. The roo-zone of the T3 treatment was predominantly dark blue, corresponding to a temperature range of 20.1–22.5 °C; the T2 treatment root-zone mainly appeared blue-green, with temperatures around 23.0–25.0 °C. Overall, RZT increased sequentially from T3 to T0, with the T0 root-zone showing yellow coloration, indicating the highest temperature. In contrast, the shoot temperature showed little variation among treatments, suggesting that changes in RZT had minimal impact on the shoot thermal status. This further supports that RZT regulation is the primary factor responsible for the differences in lettuce growth performance across treatments.
3.4. Effects of Different Root-Zone Temperatures (RZT) on the Accumulation of Mineral Elements in Lettuce.
Mineral elements in vegetables serve as essential nutritional sources for sustaining vital activities and ensuring health, and they are also a core indicator for evaluating vegetable quality and cultivation effectiveness.Table 2 summarizes the variations in the contents of eight elements in lettuce and the differences among the various treatments.
The responses of mineral element contents to RZT changes exhibited distinct trends across the four treatment groups (Table 2). No significant differences were observed in N content among the treatments. The highest value was recorded in T3 (0.34 g/100g), while T0 and T2 showed the lowest values (0.31 g/100g). Compared to T0, the N content in T1, T2, and T3 increased by 6.45%, 0%, and 9.68%, respectively. As a key component of nucleic acids and proteins, N deficiency leads to leaf yellowing and growth retardation.
The contents of P, Ca, Mg, Fe, and Zn were highest in T0 and significantly different from the other treatments. The P content in T0 was 401.33 mg/kg. Compared to T0, T1–T3 showed significant reductions of 15.95%–19.10%. The Ca content in T0 was 549.67 mg/kg. T1 decreased by 11.28%, while T3 and T2 significantly decreased by 21.65% and 24.62%, respectively. The Mg content in T0 was 175.33 mg/kg. T1 decreased by 8.74%, while T2 and T3 significantly decreased by 21.29%. The Fe content in T0 was 4.23 mg/kg. T3 decreased by 8.27%, while T1 and T2 significantly decreased by 22.22% and 23.40%, respectively. The Zn content in T0 was 3.17 mg/kg and decreased with declining temperature, with reductions of 19.56%–31.55% in T1–T3. These elements play critical roles in plants: P is involved in energy metabolism; Ca is a structural component of cell walls, and its deficiency causes leaf curling; Mg promotes carbohydrate and fat synthesis, and its deficiency leads to leaf yellowing and abscission; Fe participates in chlorophyll synthesis and redox reactions, and its deficiency results in interveinal chlorosis in older leaves; Zn acts as a cofactor for enzymes and influences auxin synthesis, with deficiency inhibiting plant growth and leaf differentiation.
No significant differences were detected in S and K contents among the treatments. Both elements were highest in T0 (S: 148.00 mg/kg; K: 4576.67 mg/kg) and lowest in T3 (S: 126.67 mg/kg; K: 4186.67 mg/kg). Compared to T0, S content in T1–T3 decreased by 5.18%–14.41%, while K content decreased by 3.20%–8.52%, showing a declining trend with temperature reduction. K regulates stomatal opening and closure, thereby affecting photosynthesis. S is essential for protein synthesis, and its deficiency disrupts protein metabolism.
3.5. Effects of Different Root-Zone Temperatures (RZT) on the Nutritional Quality of Lettuce
The nutritional quality of lettuce is commonly evaluated based on indicators such as nitrate, vitamin C (Vc), dietary fiber, soluble sugar, and soluble protein content. Variations in these components collectively influence the taste and overall edible quality of lettuce.
Nitrate, after ingestion, can be converted into nitric oxide, which promotes vasodilation. However, vegetables tend to accumulate excessive nitrate, which may act as an anti-nutrient [44]. Excessive nitrate intake can lead to its conversion into nitrite in the human body, which may further form carcinogenic compounds through subsequent chemical reactions [45]. No significant differences in nitrate content were observed among the four treatments (Table 3). The highest nitrate content was recorded in T0 (343.33 mg/kg), while the lowest was in T2 (270.00 mg/kg). Compared with T0, the nitrate content in T1, T2, and T3 decreased by 7.77%, 21.36%, and 14.56%, respectively. Lower RZT significantly reduced nitrate accumulation under cool conditions.
Adequate intake of Vc can reduce skin pigmentation and contribute to skin whitening. The Vc content was highest in T1 (6.11 mg/100g), which was significantly higher than in the other three treatments, and lowest in T3 (3.96 mg/100g). Compared with T0, the Vc content in T1 increased significantly by 26.50%, whereas it decreased by 17.60% and 18.01% in T2 and T3, respectively.
Dietary fiber promotes intestinal health and helps regulate blood sugar and cholesterol levels. The dietary fiber content was highest in T2 (1.76 g/100g), significantly exceeding that of the other treatments, and lowest in T1 (1.59 g/100g). Compared with T0, the dietary fiber content in T2 increased significantly by 26.50%, while it decreased by 17.60% and 18.01% in T1 and T3, respectively.
Soluble sugars provide energy for plant growth and development and improve the taste of vegetables. No significant differences in soluble sugar content were observed among the four treatments. The highest content was found in T3 (0.15%), while the lowest was in T1 and T2 (both 0.06%). Compared with T0, the soluble sugar content decreased by 50.00% in both T1 and T2, but increased by 25.00% in T3.
Soluble proteins help maintain cellular osmotic pressure, prevent dehydration, and serve as a major form of nitrogen storage. No significant differences in soluble protein content were detected among the treatments. The highest content was recorded in T0 (0.61 g/100g), and the lowest in T2 (0.56 g/100g). Compared with T0, the soluble protein content decreased by 1.64%, 8.20%, and 7.14% in T1, T2, and T3, respectively.
3.6. Temperature and Humidity Monitoring
In the RZT (Figure 16 (a)), T0 represents the ambient temperature, which ranged from 24.65 to 31.65 °C, with a mean value of 28.44 °C. The fluctuation of T0 was the most pronounced, and temperatures decreased over time (Figure 16 (a)). The measured mean temperatures for T1, T2, and T3 were 24.72 °C, 20.21 °C, and 16.49 °C, respectively. The actual measured temperatures showed minimal deviation from the temperatures set by the water chiller, indicating accurate cooling performance. During the experimental period, the air temperature inside the greenhouse exceeded the normal growth range for crops (Figure 16 (b)), with the highest temperature surpassing 50 °C. These conditions led to a state of unoccupied greenhouse The relative humidity (Figure 16 (c)) reflected that the moisture content in the air under the current conditions was close to saturation at the prevailing temperatures. Excessively low relative humidity can lead to stomatal closure in plants, affecting transpiration, photosynthesis, and respiration. Suitable humidity conditions facilitate stomatal opening, thereby supporting physiological processes such as plant water balance.
3.7. Comprehensive Evaluation of Lettuce Under Different Treatments Using Fuzzy Membership Function
In greenhouse hydroponic lettuce production, both biomass and nutritional value are critical evaluation criteria. To systematically assess the comprehensive quality of lettuce under different treatments, this study employed the fuzzy membership function method to integrate 20 measured indicators: plant height, stem diameter, leaf number, leaf area, SPAD value, root dry weight, shoot dry weight, total nitrogen, total phosphorus, total sulfur, total potassium, total calcium, total magnesium, total iron, total zinc, nitrate content, vitamin C, dietary fiber, soluble sugar content, and soluble protein content. Among these, the nitrate content was calculated using an inverse membership function, meaning that a lower calculated R-value corresponds to a higher actual content. The final average membership function value closer to 1 indicates better quality (value range: 0.5–1) [46].
The calculation results showed that treatment T0 achieved a membership function value of R = 1 in nine indicators, including R(5), R(9), R(10), R(11), R(12), R(13), R(14), R(15), and R(20), indicating that these indicators performed better under T0 conditions compared to other treatments, which may be related to the physiological accumulation effect induced by heat stress(Table 4). Treatment T1 performed optimally (R = 1) in seven indicators, including R(1), R(2), R(3), R(4), R(6), R(7), and R(17), suggesting that it was under suitable RZT conditions. Treatments T2 and T3 achieved R = 1 only in R(16), R(18) and R(8), R(19), respectively. In terms of the number of indicators with R = 0, T0, T1, T2, and T3 had 6, 2, 7, and 8 such indicators, respectively.
Table 4.
Membership function values and comprehensive ranking of lettuce indicators under different RZT conditions (Part 1).
Table 4.
Membership function values and comprehensive ranking of lettuce indicators under different RZT conditions (Part 1).
| Treatment | R(1) | R(2) | R(3) | R(4) | R(5) | R(6) | R(7) | R(8) | R(9) | R(10) | R(11) |
|---|---|---|---|---|---|---|---|---|---|---|---|
| T0 | 0.15 | 0.00 | 0.09 | 0.00 | 1.00 | 0.00 | 0.00 | 0.00 | 1.00 | 1.00 | 1.00 |
| T1 | 1.00 | 1.00 | 1.00 | 1.00 | 0.33 | 1.00 | 1.00 | 0.67 | 0.17 | 0.53 | 0.62 |
| T2 | 0.92 | 0.86 | 0.36 | 0.51 | 0.02 | 0.72 | 0.34 | 0.00 | 0.00 | 0.64 | 0.47 |
| T3 | 0.00 | 0.85 | 0.00 | 0.23 | 0.00 | 0.16 | 0.26 | 1.00 | 0.10 | 0.00 | 0.00 |
Note: Membership function values correspond to R(1): plant height, R(2): stem diameter, R(3): number of leaves, R(4): leaf area, R(5): SPAD value, R(6): root dry weight, R(7): shoot dry weight, R(8): total nitrogen, R(9): total phosphorus, R(10): total sulfur, R(11): total potassium.
Table 5.
Membership function values and comprehensive ranking of lettuce indicators under different RZT conditions (Part 2).
Table 5.
Membership function values and comprehensive ranking of lettuce indicators under different RZT conditions (Part 2).
| Treatment | R(12) | R(13) | R(14) | R(15) | R(16) | R(17) | R(18) | R(19) | R(20) | Mean | Ranking |
|---|---|---|---|---|---|---|---|---|---|---|---|
| T0 | 1.00 | 1.00 | 1.00 | 1.00 | 0.00 | 0.40 | 0.41 | 0.67 | 1.00 | 0.54 | 2 |
| T1 | 0.54 | 0.59 | 0.05 | 0.38 | 0.36 | 1.00 | 0.00 | 0.00 | 0.80 | 0.60 | 1 |
| T2 | 0.00 | 0.00 | 0.00 | 0.18 | 1.00 | 0.01 | 1.00 | 0.00 | 0.00 | 0.35 | 3 |
| T3 | 0.12 | 0.00 | 0.65 | 0.00 | 0.68 | 0.00 | 0.24 | 1.00 | 0.20 | 0.27 | 4 |
Note: Membership function values correspond to R(12): total calcium, R(13): total magnesium, R(14): total iron, R(15): total zinc, R(16): nitrate content, R(17): vitamin C, R(18): dietary fiber, R(19): soluble sugar content, R(20): soluble protein content. Note that R(16) represents the inverse membership function value for nitrate.
Although lettuce under T0 treatment performed well in multiple indicators, its comprehensive quality score was still second to that of T1. However, it should be noted that T0 was under a relatively high temperature stress conditions, making it difficult to meet the practical requirements for lettuce growth stability and market adaptability. Additionally, the nitrate content in T0 was relatively high (Table 3). In contrast, lettuce under T1 treatment exhibited superior comprehensive quality under cooling conditions, aligning with the objective of optimizing summer production in this experiment. Due to poor performance in multiple indicators, T2 and T3 received lower comprehensive quality evaluations. Ultimately, considering both the mechanisms of lettuce quality formation and practical application value, T1 was identified as the optimal treatment condition.
4. Discussion
This study investigated the effects of different RZT on the growth of hydroponic lettuce, aiming to explore effective strategies for optimizing NFT hydroponic systems during temperate summers. The experimental results indicated that root-zone cooling consistently improved the above-ground growth of lettuce. Lettuce under the T1 treatment exhibited the best growth performance and the highest nutrient solution consumption. Although lettuce under the T0 treatment showed the poorest growth, it recorded the highest SPAD values, elemental content, and overall nutritional quality, alongside relatively high nutrient solution consumption. The comprehensive performance of lettuce under the T2 and T3 treatments decreased sequentially, with a corresponding reduction in nutrient solution consumption.
Root-zone cooling alone was beneficial for lettuce growth and development, as indicated by an increasing trend in six growth indicators: plant height (Figure 6), stem diameter (Figure 7), number of leaves (Figure 8), leaf area (Figure 9), root dry weight (Figure 10), and shoot dry weight (Figure 11). As the nutrient solution temperature decreased gradually from T0 to T3 (Figure 16(a)), these indicators initially increased and then decreased, reaching their optimum under T1, followed by T2. Both T3 and T0 significantly inhibited plant growth, with the most pronounced inhibition observed under T0 (Figure 14). Growth dynamics revealed a substantial increasing trend in leaf area (Figure 9), root dry weight (Figure 10), and shoot dry weight (Figure 11) for all treatments at the final measurement (September 4), indicating rapid lettuce growth during this stage. In contrast, the increases in plant height (Figure 6), stem diameter (Figure 7), and number of leaves (Figure 8) were relatively slower.
A synergistic promotion relationship existed between root and shoot growth. Root dry weight (Figure 10) and shoot dry weight (Figure 11) increased sequentially from T0, T3, T2, to T1. As reported previously, a signaling mechanism exists between roots and shoots, whereby relevant signals transmit information based on the root growth status to the shoot, thereby coordinating plant growth [19]. The growth rate of various indicators under T3, T2, and T1 increased sequentially, accompanied by a corresponding acceleration in nutrient solution consumption (Figure 13. Although the nutrient solution consumption under T0 (Figure 13) was second only to T1, lettuce growth was the slowest. Analysis revealed that the T0 treatment had the highest contents of P, K, Ca, Fe, and Zn (Table 2), nitrate, soluble protein (Table 3), and SPAD values (Figure 12). This phenomenon is likely associated with heat stress-triggered osmotic adjustment mechanisms and transpiration-driven solute concentration effects. Specifically, heat stress causes metabolic disorders in plant cells, leading to excessively high pigment content in chloroplasts and consequently higher SPAD values under T0 (Figure 12). Furthermore, higher RZT promotes faster root water uptake and more pronounced transpiration rates, resulting in significant water loss and concentration of cell sap, which leads to element accumulation in leaves [30,47,48,49,50] and the accumulation of other nutritional qualities. Moreover, under T0, roots were subjected to high-temperature stress, resulting in damaged root cell membrane structures, denaturation and inactivation of proteins, inhibited root growth, and consequently led to a shortened root length [51]. Consequently, shoot growth slowed, and root and shoot dry weights decreased (Figure 10,Figure 11).
Root-zone cooling needs to be controlled within a specific range. According to the comprehensive evaluation using the membership function method (Table 4), lettuce growth was optimal under T1, followed by T0. However, in this experiment, the T0 condition represented an abnormal growth environment where the greenhouse was unoccupied; lettuce under T0 exhibited poor growth and high nitrate content, making it unsuitable for consumption. Therefore, the membership function evaluation for T0 should only serve as a reference. The T1 treatment confirmed that the optimal root-zone cooling temperature for hydroponic lettuce is approximately 24.5 °C. The T2 treatment (20.5 °C) also promoted lettuce growth, consistent with previous findings [34], but its overall performance was inferior to T1, so this temperature is not recommended for widespread application. It remains uncertain whether setting RZT between T0-T1 or T1-T2 could produce lettuce with overall quality surpassing T2. Considering that heat stress response may enhance mineral element content and nutritional quality, it is speculated that further setting cooling gradients between T0-T1 might improve lettuce quality. Lettuce growth under the T3 treatment was relatively slow, indicating that 16.5 °C induced some low-temperature stress on lettuce growth. Lower RZT damages the stability of chloroplast membrane lipids ,inhibits the activity of key photosynthetic enzymes and chlorophyll biosynthesis [52], leading to decreased SPAD values (Figure 12FigureFigure 12), subsequently affecting the light reaction process and ultimately limiting plant photosynthetic performance. Lower temperature conditions can induce nitrogen metabolism processes [53]; compared to other treatments, the nitrogen content in lettuce leaves under T3 increased significantly (Table 2). This adaptive adjustment in nitrogen allocation strategy under lower temperatures is similar to previous experimental results where pepper plants at 17 °C prioritized nitrogen allocation to the stems [54]. Additionally, lower temperatures increase cell membrane viscosity, reduce cell permeability [55], decrease root activity [54], and restrict water uptake by crops [56]. Excessively low or high temperatures inhibit the efficiency of photosynthesis and respiration, thereby hindering crop growth and development [47,57].
In summary, temperature exerts an important impact on crops [58]. Maintaining a stable nutrient solution temperature at 24.5 °C can significantly enhance lettuce yield. However, in this experiment, the constant temperature settings for T1, T2, and T3 might have limited the accumulation of secondary metabolites due to the lack of diurnal temperature variation [59]. Future research should further explore RZT regulation modes. Provided that cooling equipment is cost-effective, root-zone cooling could support normal production of NFT hydroponic lettuce in temperate regions during warmer seasons. This study holds significant importance for alleviating seasonal vegetable supply shortages, stabilizing markets, and promoting the development of water- and energy-saving agriculture.
5. Conclusion
This experiment investigated the effects of root-zone cooling on lettuce grown in NFT hydroponic systems within summer greenhouses, yielding the following conclusions:
Under conditions of higher air-temperature stress, root-zone cooling alone contributed to increased dry matter accumulation in lettuce. The dry matter exhibited an inverted U-shaped trend in response to decreasing RZT (from T0 to T3), with the optimal dry matter accumulation observed under the T1 treatment.
A comprehensive evaluation based on the fuzzy membership function indicated that the T1 treatment resulted in the best overall lettuce quality and the highest nutrient solution consumption. Although the T0 treatment led to higher contents of several mineral elements and partial nutritional qualities in lettuce, it was associated with lower water and fertilizer use efficiency, accelerated plant senescence, and a tendency toward accumulation of toxic substances.
RZT was not necessarily more beneficial for lettuce growth at lower temperatures (T3). This study identified an optimal root-zone cooling range around 24.5 °C. Furthermore, given the intense daytime air-temperature stress, high transpiration rates, and strong heat stress responses, root-zone cooling could be prioritized during daytime hours. Cooling treatment may be discontinued at night to reduce energy consumption while avoiding the negative impact of continuous cooling on nutrient accumulation in plants.
Author Contributions
Conceptualization, W.G., C.G., Y.T. ; methodology, W.G.,and C.G., Z.Z.;software, Y.T.and Z.Z.; validation, Z.Z., W.G. and Y.C.; formal analy-sis, Z.Z.; investigation, W.G., H.X.,and C.G.; resources, W.G. ,H.X.and Y.T.; data curation, Z.Z. and Y.C.; writing–original draft preparation,Z.Z.; writing–review and editing, W.G.; visu-alization, Z.Z.; supervision, W.G. and C.G.; pro-ject administration, W.G. and Y.C.; funding acquisition, W.G., C.G and H.X. All authors have read and agreed to the published version of the manuscript.
Funding
This research was funded by the Special Project for International Science and Technology Cooperation of Ningxia Academy of Agriculture and Forestry Sciences (DW-X-2023001) “Development and Application of a Smart Water and Fertilizer Man-agement System for Facility Vegetables Based on New Generation Information Technolo-gy”, and the Key Research and Development Program of Ningxia Hui Autonomous Region (2023BCF01047): “Research and Demonstration on Structural Optimization Design and Supporting Key Technologies for Low-Energy Consumption Large-Scale Facilities on Agriculturally Suitable Non-Arable Land”.
Data Availability Statement
The original contributions presented in the study are included in the article; further inquiries can be directed to the corresponding author.
Acknowledgments
We thank all the authors for their support. The authors are also very grateful for the kind suggestions and valuable comments by the anonymous review-ers.
Conflicts of Interest
The authors declare no conflicts of interest.
References
- Hu, Y.; Cui, W.; Jin, M.F.; Wang, Q.X. Effects of different cultivation methods on the growth and nutritional qualities of lettuce. J. Shanghai Norm. Univ. (Nat. Sci.) 2019, 48, 566–573. [Google Scholar]
- Xi, Z.J.; Gong, K.X.; Jia, D.D.; Guo, W.Z. Design and experiment of automatic harvesting device for hydroponic lettuce with three-dimensional dislocation. J. Chin. Agric. Mech. 2024, 45, 34–41. [Google Scholar]
- Chen, Y.C.; Liu, K.N.; Pei, S.; Cao, D.S.; Liu, Z.A.; Cheng, X.J. Effects of different substrates on growth characteristics and quality of hydroponic lettuce. Agric. Eng. Technol. 2024, 44, 43–49. [Google Scholar]
- Liao, C.; Peng, X.Y.; Xie, L.; Li, X.; Zhou, L.; Yang, D.R. High-Efficiency Pipeline Hydroponics Cultivation of Lettuce with Plant Factory Nutrient Film Technology and Post-Harvest Processing Technology. Fertil. Health 2021, 48, 27–31. [Google Scholar]
- Gómez, C.; Currey, C.J.; Dickson, R.W.; Kim, H.J.; Hernández, R.; Sabeh, N.; Raudales, R.; Brumfield, R.; Walla, A.; Wilke, A.; et al. Controlled Environment Food Production for Urban Agriculture. HortScience 2019, 54, 1448–1458. [Google Scholar] [CrossRef]
- Mohammed, S.B.; Sookoo, R. Nutrient film technique for commercial production. Agric. Sci. Res. J. 2016, 6, 269–274. [Google Scholar]
- Suganob, N.J.; Arroyo, C.L.; Concepcion, R., II. Interplay of Fogponics and Artificial Intelligence for Potential Application in Controlled Space Farming. AgriEngineering 2024, 6, 2144–2166. [Google Scholar] [CrossRef]
- Gillani, S.A.; Abbasi, R.; Martinez, P.; Ahmad, R. Comparison of Energy-use Efficiency for Lettuce Plantation under Nutrient Film Technique and Deep-Water Culture Hydroponic Systems. Procedia Comput. Sci. 2023, 217, 11–19. [Google Scholar] [CrossRef]
- Concepcion, R.S. , II, R.S.; Alejandrino, J.D.; Lauguico, S.C.; Tobias, R.R.; Sybingco, E.; Dadios, E.P.; Bandala, A.A. Lettuce growth stage identification based on phytomorphological variations using coupled color superpixels and multifold watershed transformation. Int. J. Adv. Intell. Inform. 2020, 6, 233–245. [Google Scholar]
- Kumari, S.; Basu, S.; Kumar, G. A systematic review on the implications of concurrent heat and drought stress in modulating floral development in plants. Plant Sci. 2024, 344, 112248. [Google Scholar] [CrossRef]
- Sarma, B.; Kashtoh, H.; Lama Tamang, T.; Bhattacharyya, P.N.; Mohanta, Y.K.; Baek, K.H. Abiotic Stress in Rice: Visiting the Physiological Response and Its Tolerance Mechanisms. Plants 2023, 12, 3948. [Google Scholar] [CrossRef] [PubMed]
- Qian, D.; Wang, M.; Niu, Y.; Yang, Y.; Xiang, Y. Sexual reproduction in plants under high temperature and drought stress. Cell Rep. 2025, 44, 115390. [Google Scholar] [CrossRef]
- Khan, S.; Jaral, S.; Kumari, P.; Verma, S. Effect of elevated temperature on the rate of flowering anthesis and seed set in Olea ferruginea. Ecol. Front. 2024, 44, 282–288. [Google Scholar] [CrossRef]
- Chen, Y.L.; Yang, K.M.; Shiao, X.Y.; Huang, J.J.; Ma, Y.A.; Chiang, P.Y. Relationship between Storage Quality and Functionality of Common Buckwheat (Fagopyrum esculentum Moench) and Tartary Buckwheat (Fagopyrum tataricum Gaertn) at Different Temperatures. AgriEngineering 2024, 6, 3121–3136. [Google Scholar] [CrossRef]
- Pham, T.; Hwang, S. High temperatures reduce nutrients and defense compounds against generalist Spodoptera litura F. in Rorippa dubia. Arthropod-Plant Interact. 2020, 14, 333–344. [Google Scholar] [CrossRef]
- Du, Y.; Tachibana, S. Effect of supraoptimal root temperature on the growth, root respiration and sugar content of cucumber plants. Sci. Hortic. 1994, 58, 289–301. [Google Scholar] [CrossRef]
- Zhang, S.Y.; Cui, B.W.; Wang, J.L.; Lin, J.X.; Yang, Q.J. Advances in Physiological and Molecular Responses of Plant Root Systems under Abiotic Stress. Acta Agric. Zhejiangensis 2024, 36, 2391–2401. [Google Scholar]
- Fu, G.H.; Yang, Q.C.; Liu, W.K.; Yan, W.K. Research Progress about Effects of Root Zone Temperature on Physiology and Ecology of Protected Horticulture Crops. China Veg. 2016, 10, 18–25. [Google Scholar]
- Lipiec, J.; Doussan, C.; Nosalewicz, A.; Kondracka, K. Effect of drought and heat stresses on plant growth and yield: a review. Int. Agrophys. 2013, 27, 463–477. [Google Scholar] [CrossRef]
- Holmes, S.C.; Wells, D.E.; Pickens, J.M.; Kemble, J.M. Selection of Heat Tolerant Lettuce (Lactuca sativa L.) Cultivars Grown in Deep Water Culture and Their Marketability. Horticulturae.
- Ameen, M.; Zhang, Z.; Wang, X.; Yaseen, M.; Umair, M.; Noor, R.S.; Lu, W.; Yousaf, K.; Ullah, F.; Memon, M.S. An Investigation of a Root Zone Heating System and Its Effects on the Morphology of Winter-Grown Green Peppers. Energies 2019, 12, 933. [Google Scholar] [CrossRef]
- San, W.K.; Newman, S.E. Air and root-zone temperatures influence growth and flowering of snapdragons. HortScience 1992, 27, 796–798. [Google Scholar] [CrossRef]
- Hao, T.; Ding, X.T.; Zhang, H.M.; Jin, H.J.; Yu, J.Z. Effects of root-zone temperature on the growth, photosynthesis and chlorophyll fluorescence characteristics of cucumber seedlings. Acta Agric. Shanghai 2015, 31, 45–50. [Google Scholar]
- Yamori, N.; Levine, C.P.; Mattson, N.S.; Yamori, W. Optimum root zone temperature of photosynthesis and plant growth depends on air temperature in lettuce plants. Plant Mol. Biol. 2022, 110, 385–395. [Google Scholar] [CrossRef]
- Rogiers, S.Y.; Clarke, S.J. Nocturnal and daytime stomatal conductance respond to root-zone temperature in ‘Shiraz’ grapevines. Ann. Bot. 2013, 111, 433–444. [Google Scholar] [CrossRef]
- Liang, J.S.; Zhang, J.H.; Cao, X.Z. Effects of Root-zone Temperature Change on Root Water Uptake and Leaf Transpiration. J. Integr. Plant Biol. 1998, 40, 1135–1141. [Google Scholar]
- Yan, Q.Y.; Duan, Z.Q.; Li, X.; Dong, J.L.; Wang, A.H.; Xing, P.; Dong, F. Effect of root zone temperature on growth of cucumber and nutrient utilization in soils. Acta Pedol. Sin. 2013, 50, 752–760. [Google Scholar]
- Xia, Z.; Gong, Y.; Yang, Y.; Wu, M.; Bai, J.; Zhang, S.; Lu, H. Effects of root-zone warming, nitrogen supply and their interactions on root-shoot growth, nitrogen uptake and photosynthetic physiological characteristics of maize. Plant Physiol. Biochem. 2024, 214, 108887. [Google Scholar] [CrossRef]
- Biela, M.M.; Nonnecke, G.R.; Graves, W.R.; Horner, H.T. High root-zone temperature inhibits strawberry reproductive and vegetative growth and development. HortScience 1999, 34, 499B. [Google Scholar] [CrossRef]
- Xia, Z.; Si, L.; Jin, Y.; Fu, Y.; Wang, Q.; Lu, H. Effects of Root Zone Temperature Increase on Physiological Indexes and Photosynthesis of Different Genotype Maize Seedlings. Russ. J. Plant Physiol. 2021, 68, 1169–1179. [Google Scholar] [CrossRef]
- Iivonen, S.; Rikala, R.; Ryyppö, A.; Vapaavuori, E. Responses of Scots pine (Pinus sylvestris) seedlings grown in different nutrient regimes to changing root zone temperature in spring. Tree Physiol. 1999, 19, 951–958. [Google Scholar] [CrossRef] [PubMed]
- Thakulla, D.; Dunn, B.; Hu, B.; Goad, C.; Maness, N. Nutrient solution temperature affects growth and Brix parameters of seventeen lettuce cultivars grown in an NFT hydroponic system. Horticulturae 2021, 7, 321. [Google Scholar] [CrossRef]
- Rachman, A.A.; Kusumiyati; Sutari, W. ; Anwar, S. Effect of Nutrient Solution Temperature and Varieties on Growth and Yield of Lettuce (Lactuca sativa L.) with Nutrient Film Technique System. EKSAKTA 2023, 24, 476–486. [Google Scholar]
- Li, F.; Yu, L.G.; Li, Y.K.; Xu, F.; Wang, L.C. Effect of Nutrient Solution Temperature Control on Yield and Quality of Hydroponic Lettuce Over Summer in Greenhouse. North. Hortic. 2016, 22, 56–59. [Google Scholar]
- Huo, G.T.; Xu, G.L.; Huo, F.; Zhao, B.; Ma, T.; Xu, H.; Ge, G.J.; Long,P. ;Wei,S.W. Screening and Identification of New Heat-Resistant Lettuce Varieties (Lines). Shanghai Veg. 2024, 3, 4–10. [Google Scholar]
- National Food Safety Standard—Determination of Multi-Elements in Foods: GB 5009.268-2016[S]. Beijing: Standards Press of China, 2016.
- Lu, R.K. Soil Agro-chemical Analysis Methods[M]. Beijing: China Agricultural Science and Technology Press, 2000: 322–324.
- National Food Safety Standard—Determination of Nitrite and Nitrate in Foods: GB 5009.33-2016[S]. Beijing: Standards Press of China, 2016.
- National Food Safety Standard—Determination of Ascorbic Acid in Foods: GB 5009.86-2016[S]. Beijing: Standards Press of China, 2016.
- Ministry of Health of the People’s Republic of China. Determination of Dietary Fiber in Foods: GB/T 5009.88-2008[S]. Beijing: Standards Press of China, 2008.
- Determination of Soluble Sugars in Vegetables and Their Products—Copper Reduction Iodometric Method: NY/T 1278-2007[S]. Beijing: 2007.
- National Grain and Oil Standardization Technical Committee. Soybean Peptide Powder: GB/T 22492-2008[S]. Beijing: Standards Press of China, 2008.
- Song, X.X. Effects of Different Organic Substrates on the Growth, Yield and Quality of Lettuce. Master’s Thesis, Northwest A&F University, Xianyang, China, 2013. [Google Scholar]
- Ramírez-Pedraza, A.; Salazar-Colores, S.; Terven, J.; Romero-González, J.A.; González-Barbosa, J.J.; Córdova-Esparza, D.M. Nutritional Monitoring of Rhodena Lettuce via Neural Networks and Point Cloud Analysis. AgriEngineering 2024, 6, 3474–3493. [Google Scholar] [CrossRef]
- Huang, W.; Liu, Y.C.; Li, H.H. Study on the relationship between nitrate and nutrient quality of vegetable. J. Chongqing Univ. Arts Sci. (Nat. Sci. Ed.) 2011, 30, 34–37. [Google Scholar]
- Ren, Y.Z.; Shen, L.X.; Liu, S.H.; Yin, H.; Xu, J.H. Effect of Drip Irrigation Combined with Water-soluble Organic Fertilizer on Yield and Quality of Lettuce in Greenhouse. Water Sav. Irrig. 2024, 9, 96–103. [Google Scholar]
- Hasanuzzaman, M.; Nahar, K.; Alam, M.M.; Roychowdhury, R.; Fujita, M. Physiological, biochemical, and molecular mechanisms of heat stress tolerance in plants. Int. J. Mol. Sci. 2013, 14, 9643–9684. [Google Scholar] [CrossRef]
- Levine, C.P.; Hayashi, S.; Ohmori, Y. Controlling root zone temperature improves plant growth and pigments in hydroponic lettuce. Ann. Bot. 2023, 132, 455–470. [Google Scholar] [CrossRef]
- Xu, W.; Liu, J.; Zhang, S.; Wu, J. Mechanism of Transpiration in Green Vegetation and Its Infrared Radiation Characteristics. J. Army Eng. Univ. 2022, 1, 38–43. [Google Scholar]
- Gao, S. Why Do Plants Perform Transpiration? J. Read. 2019, 86, 48. [Google Scholar]
- Liu, X.; Zhou, Y.; Xiao, J.; Bao, F. Effects of Chilling on the Structure, Function and Development of Chloroplasts. Front. Plant Sci. 2018, 9, 1715. [Google Scholar] [CrossRef]
- Sheng, P.; Ding, L.; Zhang, M. Research progress on high-temperature stress and countermeasures in vegetable crops. South. Agric. 2022, 16, 147–159. [Google Scholar]
- Aidoo, M.K.; Sherman, T.; Lazarovitch, N.; Fait, A.; Rachmilevitch, S. A bell pepper cultivar tolerant to chilling enhanced nitrogen allocation and stress related metabolite accumulation in the roots in response to low root zone temperature. Physiol. Plant. 2017, 161, 196–210. [Google Scholar] [CrossRef] [PubMed]
- Yan, Q.; Duan, Z.; Mao, J.; Li, X.; Dong, F. Low Root Zone Temperature Limits Nutrient Effects on Cucumber Seedling Growth and Induces Adversity Physiological Response. J. Integr. Agric. 2013, 12, 1450–1460. [Google Scholar] [CrossRef]
- Lyons, J.M. Chilling Injury in Plants. Annu. Rev. Plant Physiol. 1973, 24, 445–466. [Google Scholar] [CrossRef]
- Setter, T.L.; Greenway, H. Growth Reductions in Rice at Low Root Temperatures: Decreases in Nutrient Uptake and Development of Chlorosis. J. Exp. Bot. 1988, 39, 811–829. [Google Scholar] [CrossRef]
- Yamori, W.; Hikosaka, K.; Way, D.A. Temperature response of photosynthesis in C3, C4, and CAM plants: temperature acclimation and temperature adaptation. Photosynth. Res. 2014, 119, 101–117. [Google Scholar] [CrossRef] [PubMed]
- Hatfield, J.L.; Prueger, J.H. Temperature extremes: Effect on plant growth and development. Weather Clim. Extrem. 2015, 10, 4–10. [Google Scholar] [CrossRef]
- Chen, S.K.; Liu, G.P. Fundamentals of Plant Physiology—Lecture 9: Plant Growth. J. Jiangxi Agric. Sci. Technol. 1982, 12, 30–32. [Google Scholar]
Figure 1.
a) External view of the experimental greenhouse; (b) Internal view of the experimental greenhouse.
Figure 1.
a) External view of the experimental greenhouse; (b) Internal view of the experimental greenhouse.
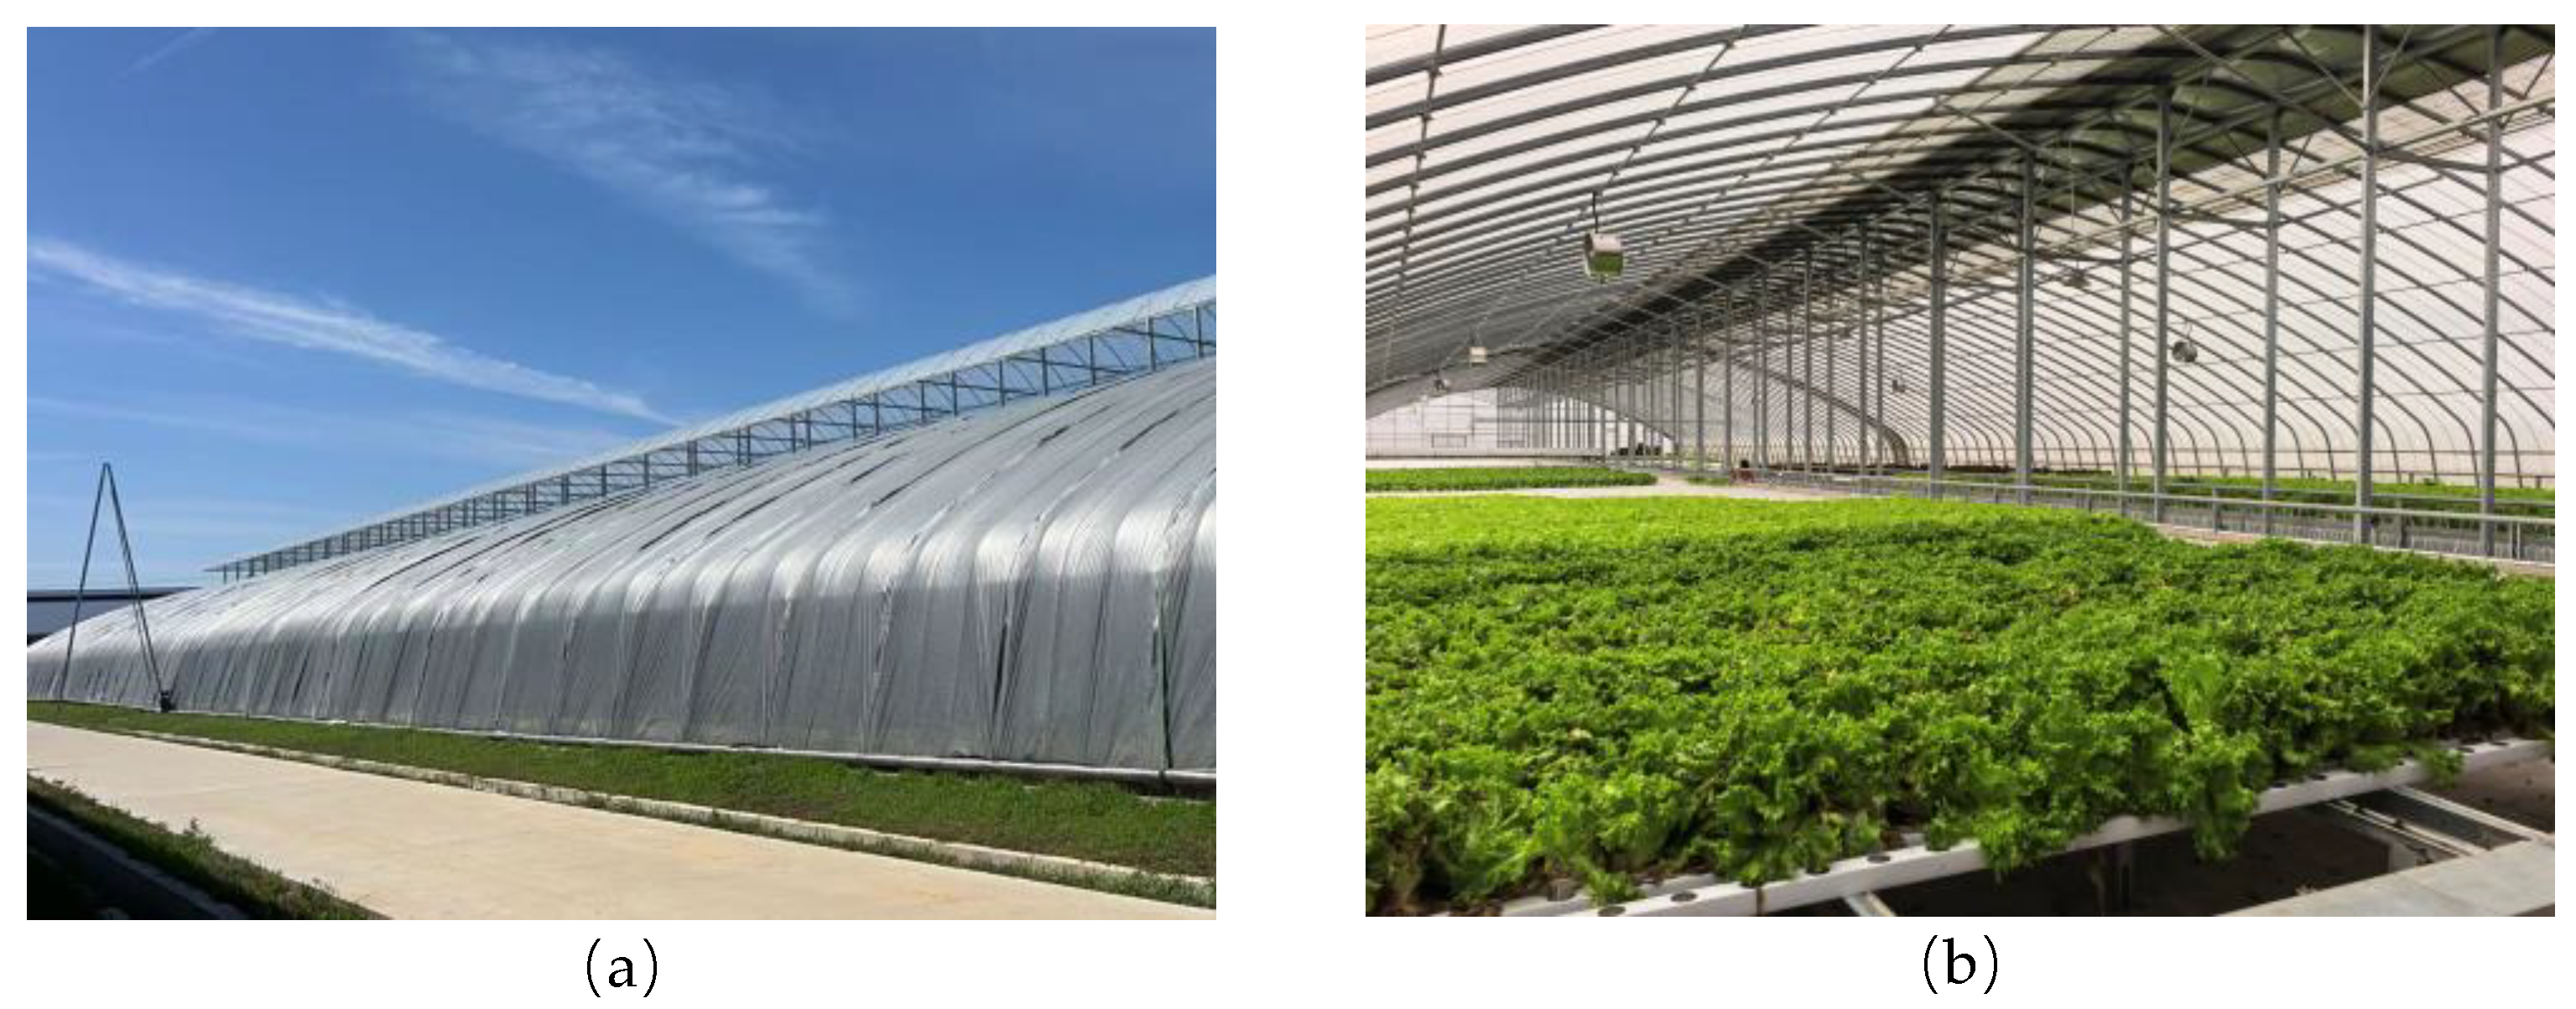
Figure 2.
Schematic diagram of the Nutrient Film Technique (NFT) cultivation system and water chiller cooling.
Figure 2.
Schematic diagram of the Nutrient Film Technique (NFT) cultivation system and water chiller cooling.
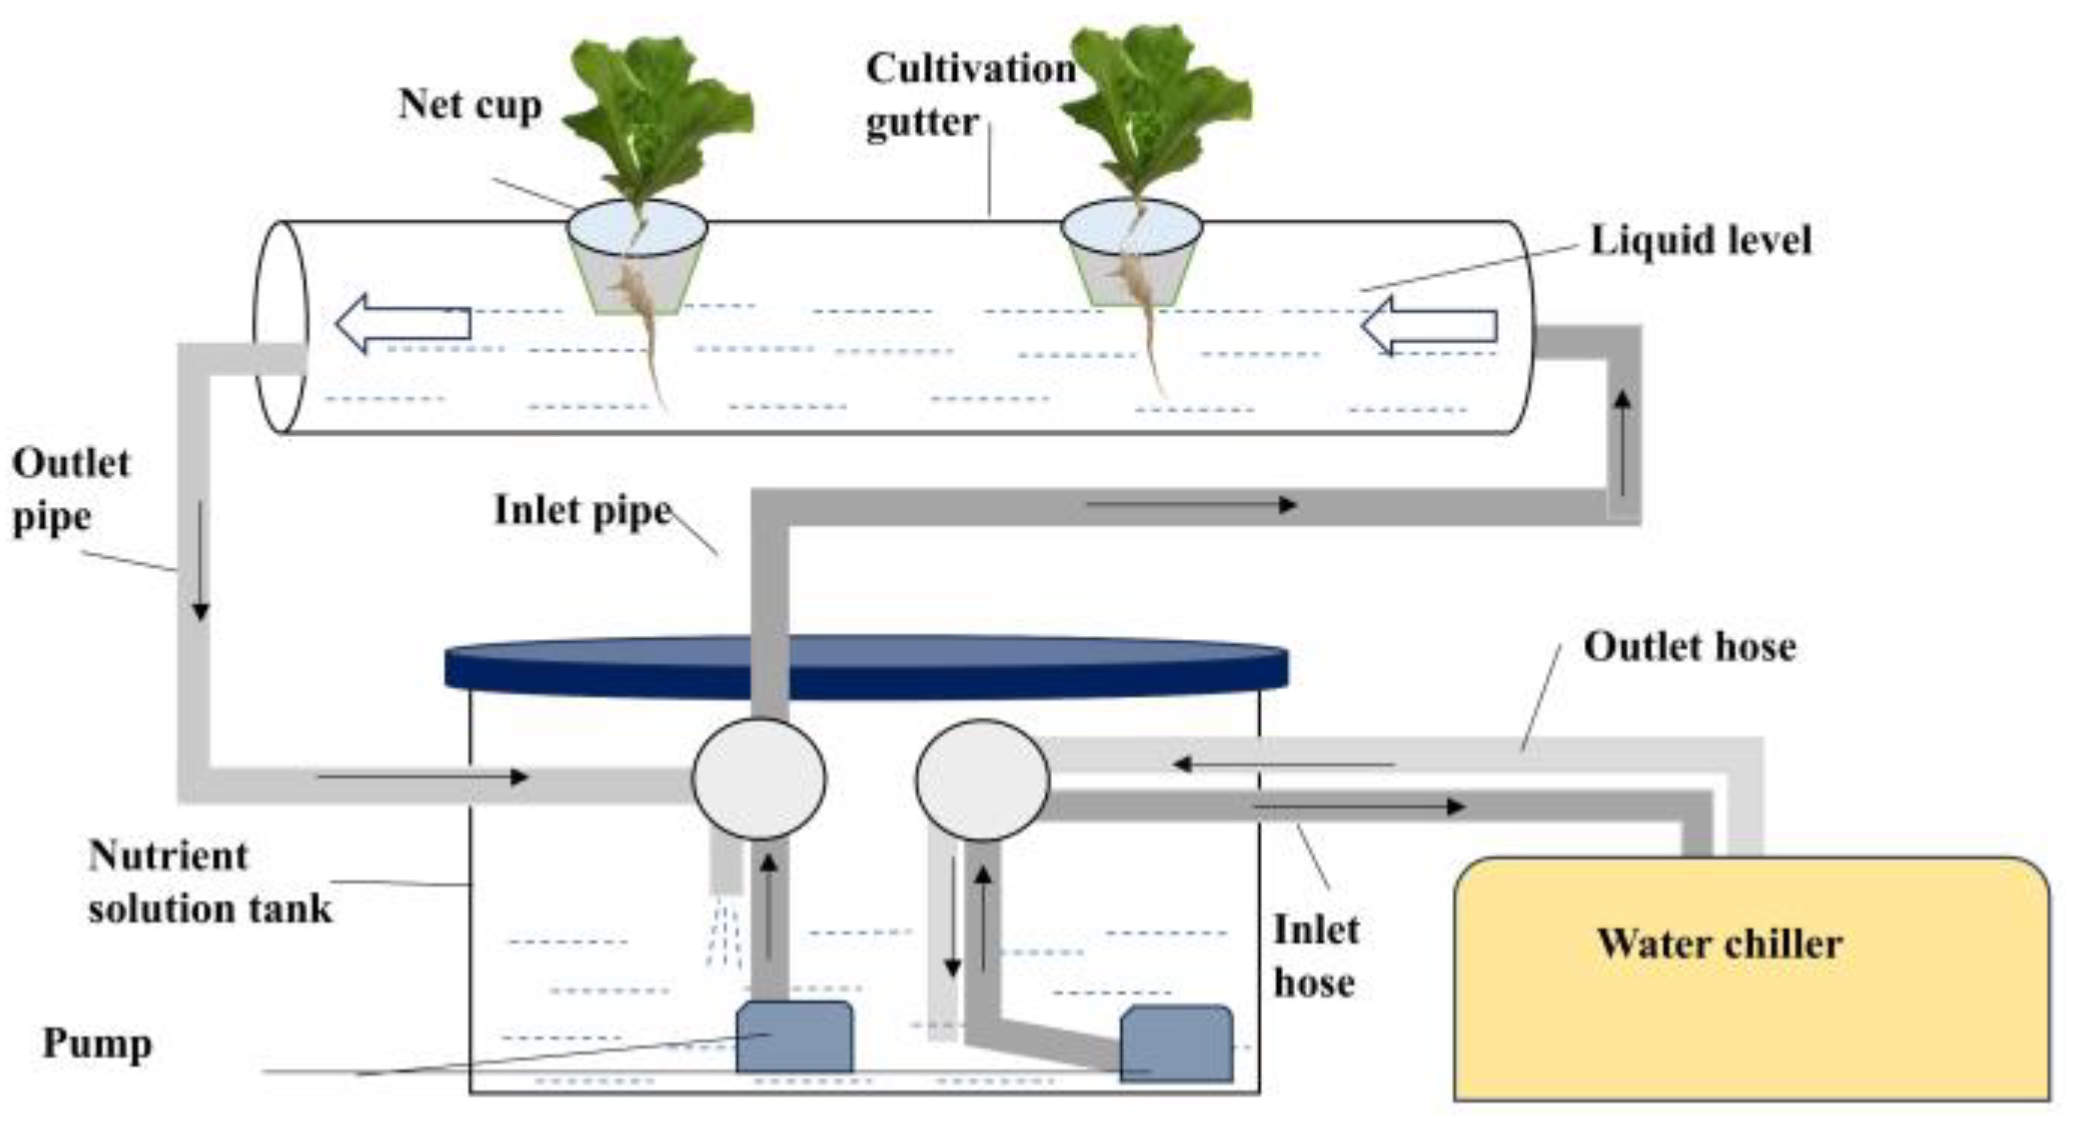
Figure 4.
Schematic diagram of leaf area measurement.
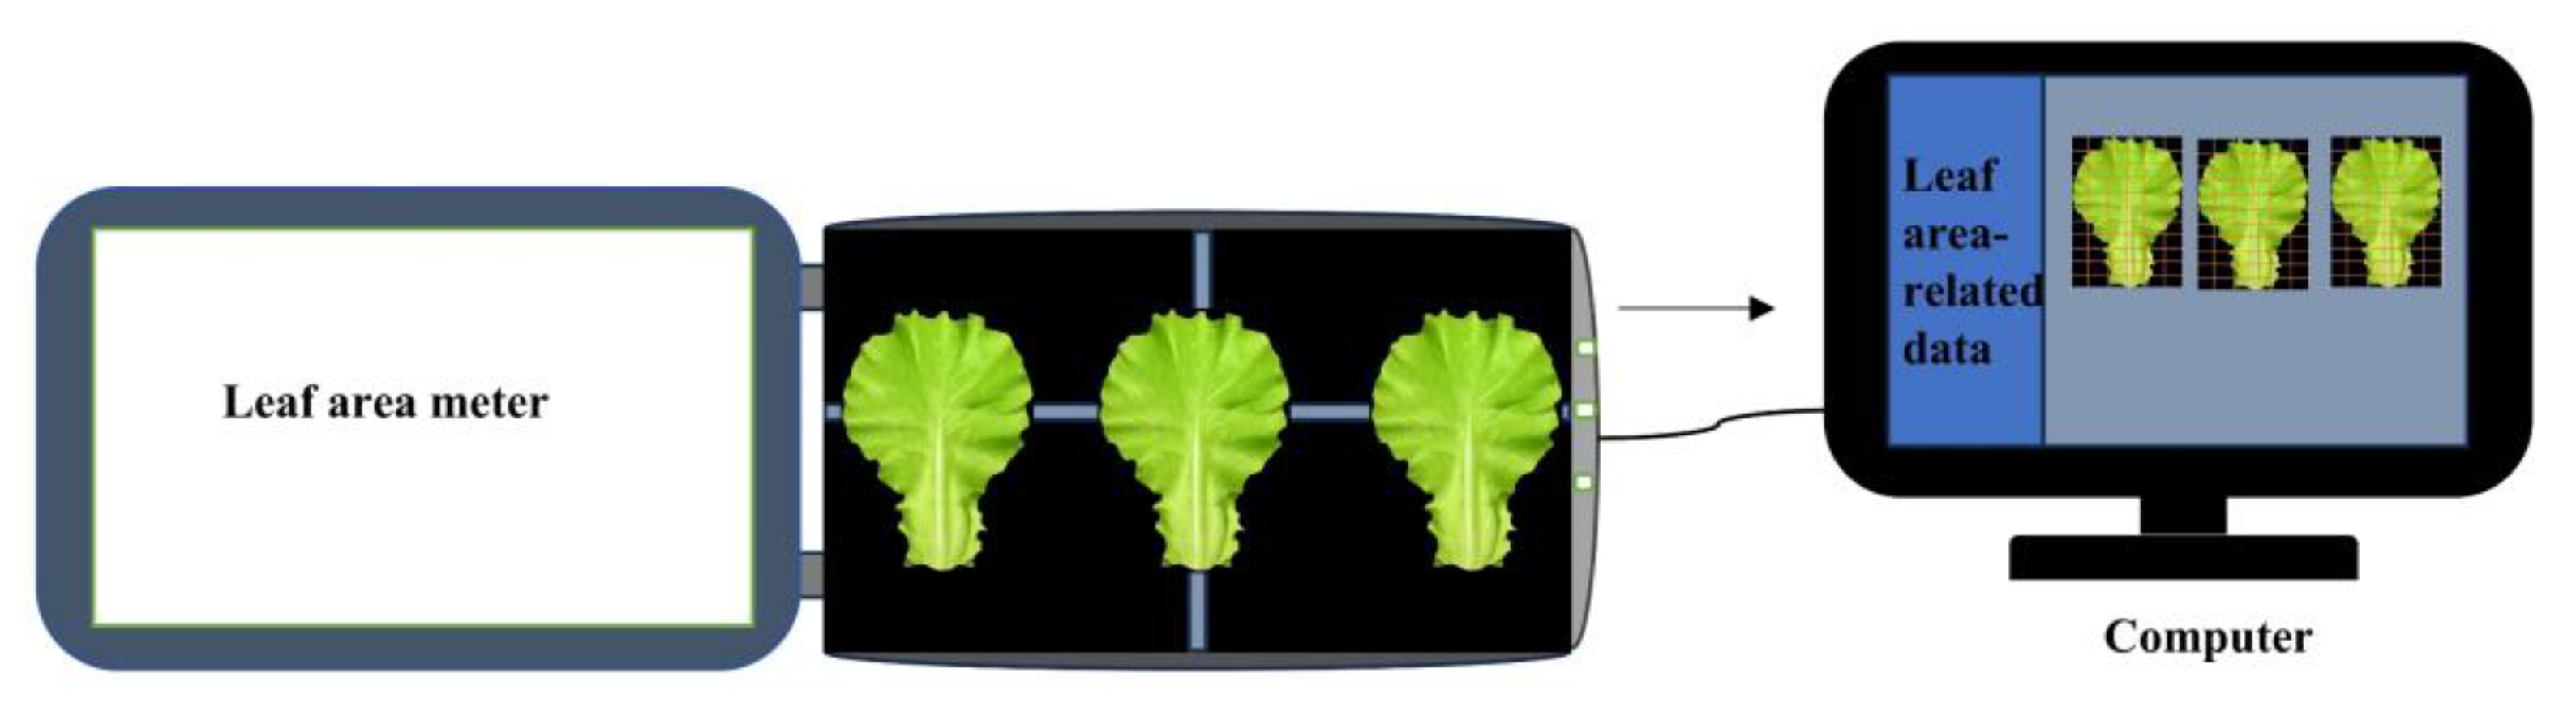
Figure 5.
(a) Electric blast drying oven; (b) Electronic balance.
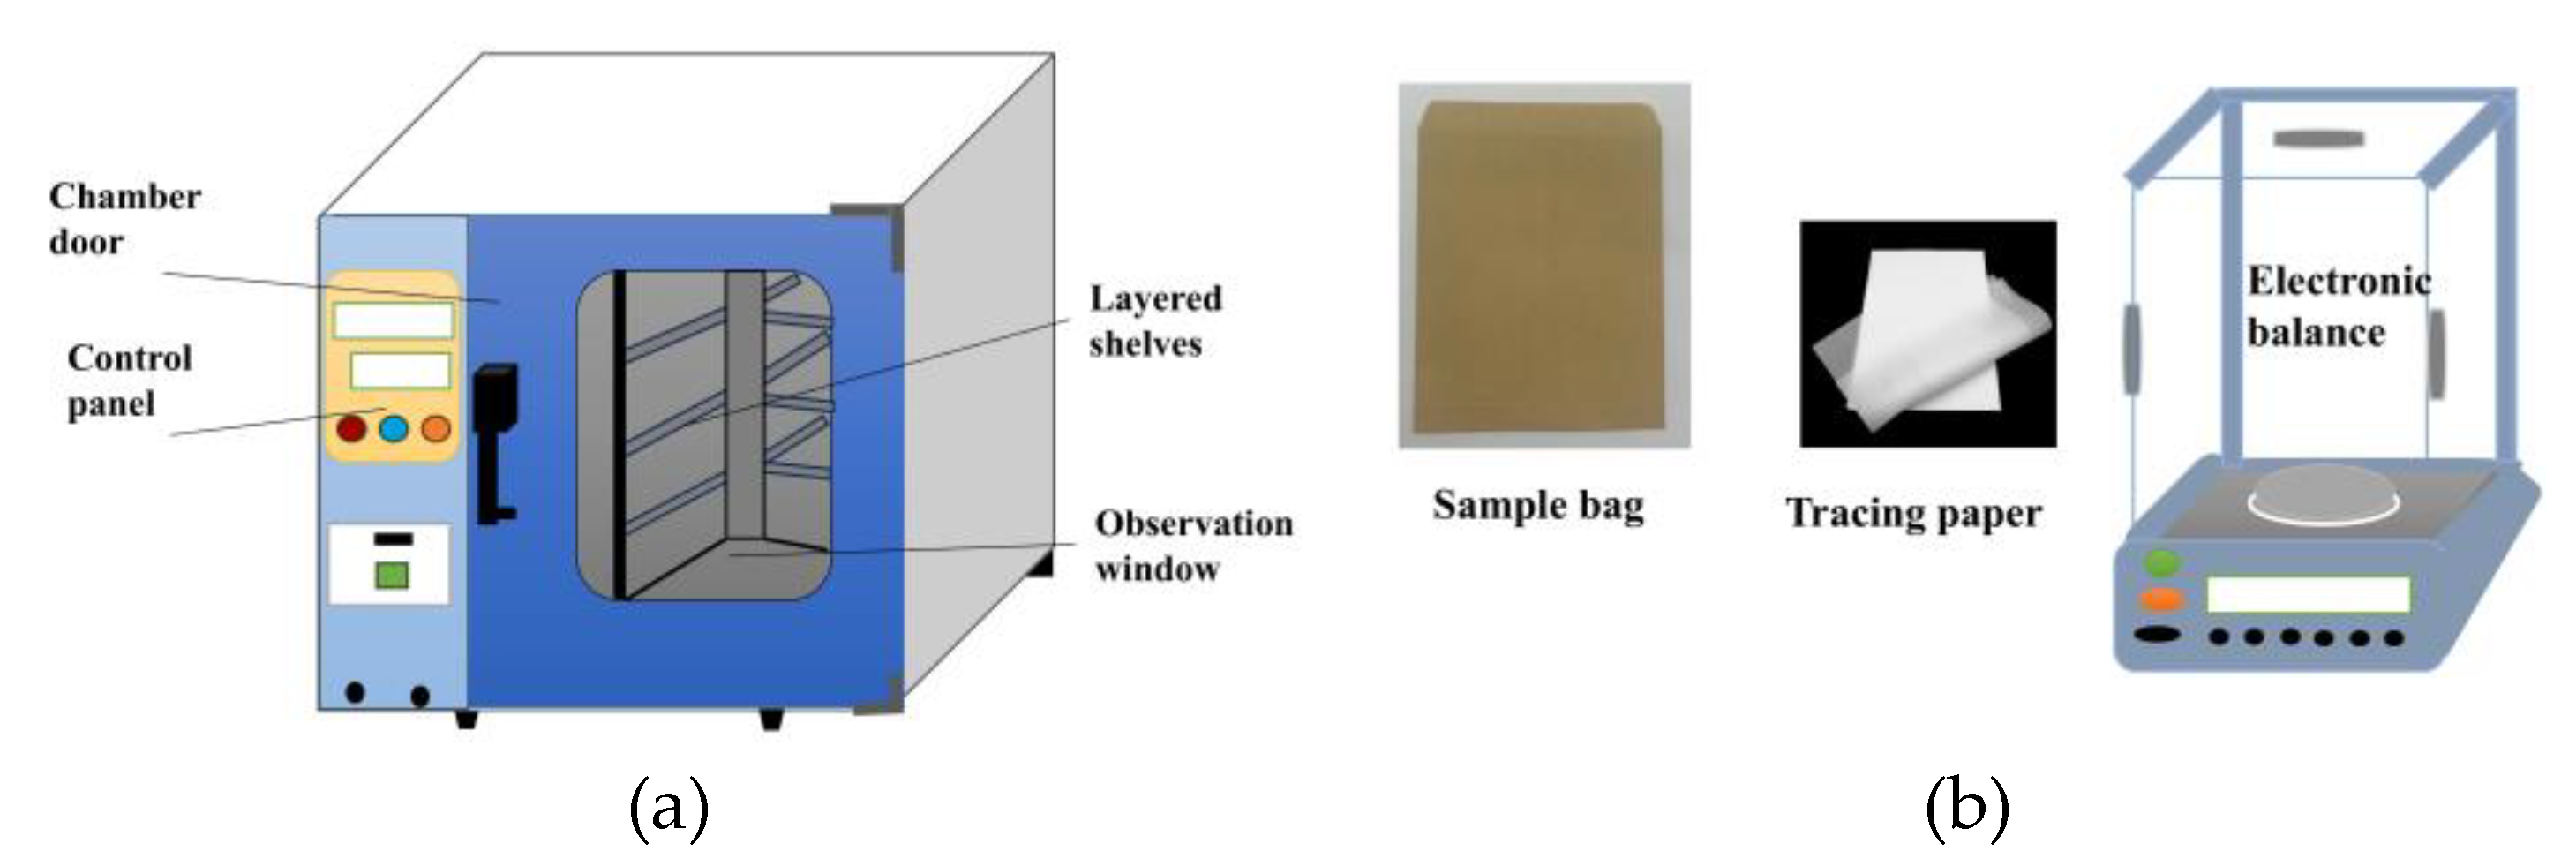
Figure 6.
Changes in plant height under different treatments during the growth period. Different lowercase letters on the same measurement date indicate significant differences according to one-way ANOVA and LSD test (P < 0.05).
Figure 6.
Changes in plant height under different treatments during the growth period. Different lowercase letters on the same measurement date indicate significant differences according to one-way ANOVA and LSD test (P < 0.05).
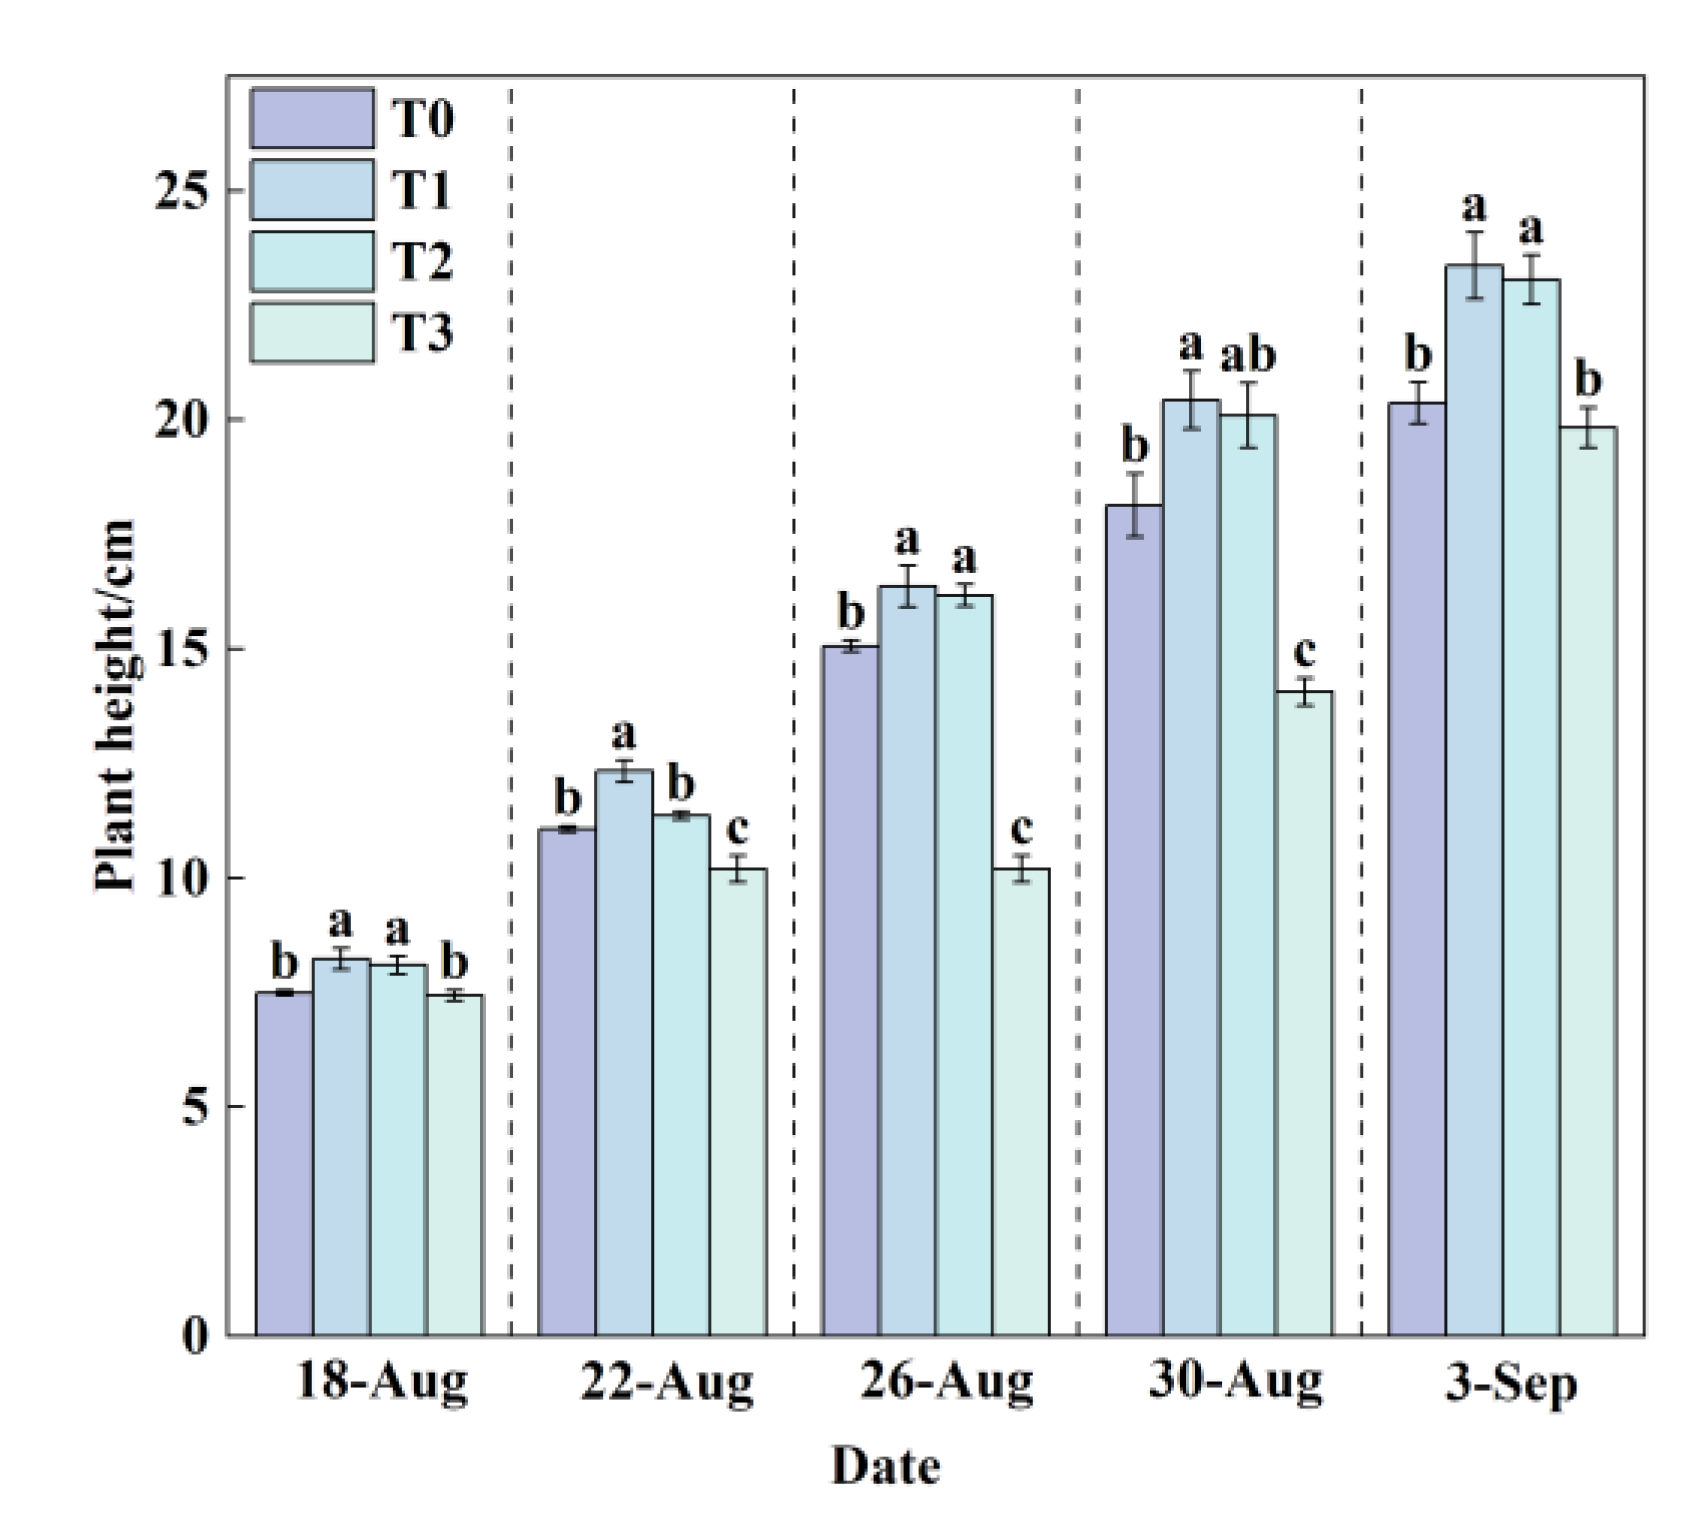
Figure 7.
Changes in stem diameter under different treatments during the growth period. Different lowercase letters on the same measurement date indicate significant differences according to one-way ANOVA and LSD test (P < 0.05).
Figure 7.
Changes in stem diameter under different treatments during the growth period. Different lowercase letters on the same measurement date indicate significant differences according to one-way ANOVA and LSD test (P < 0.05).
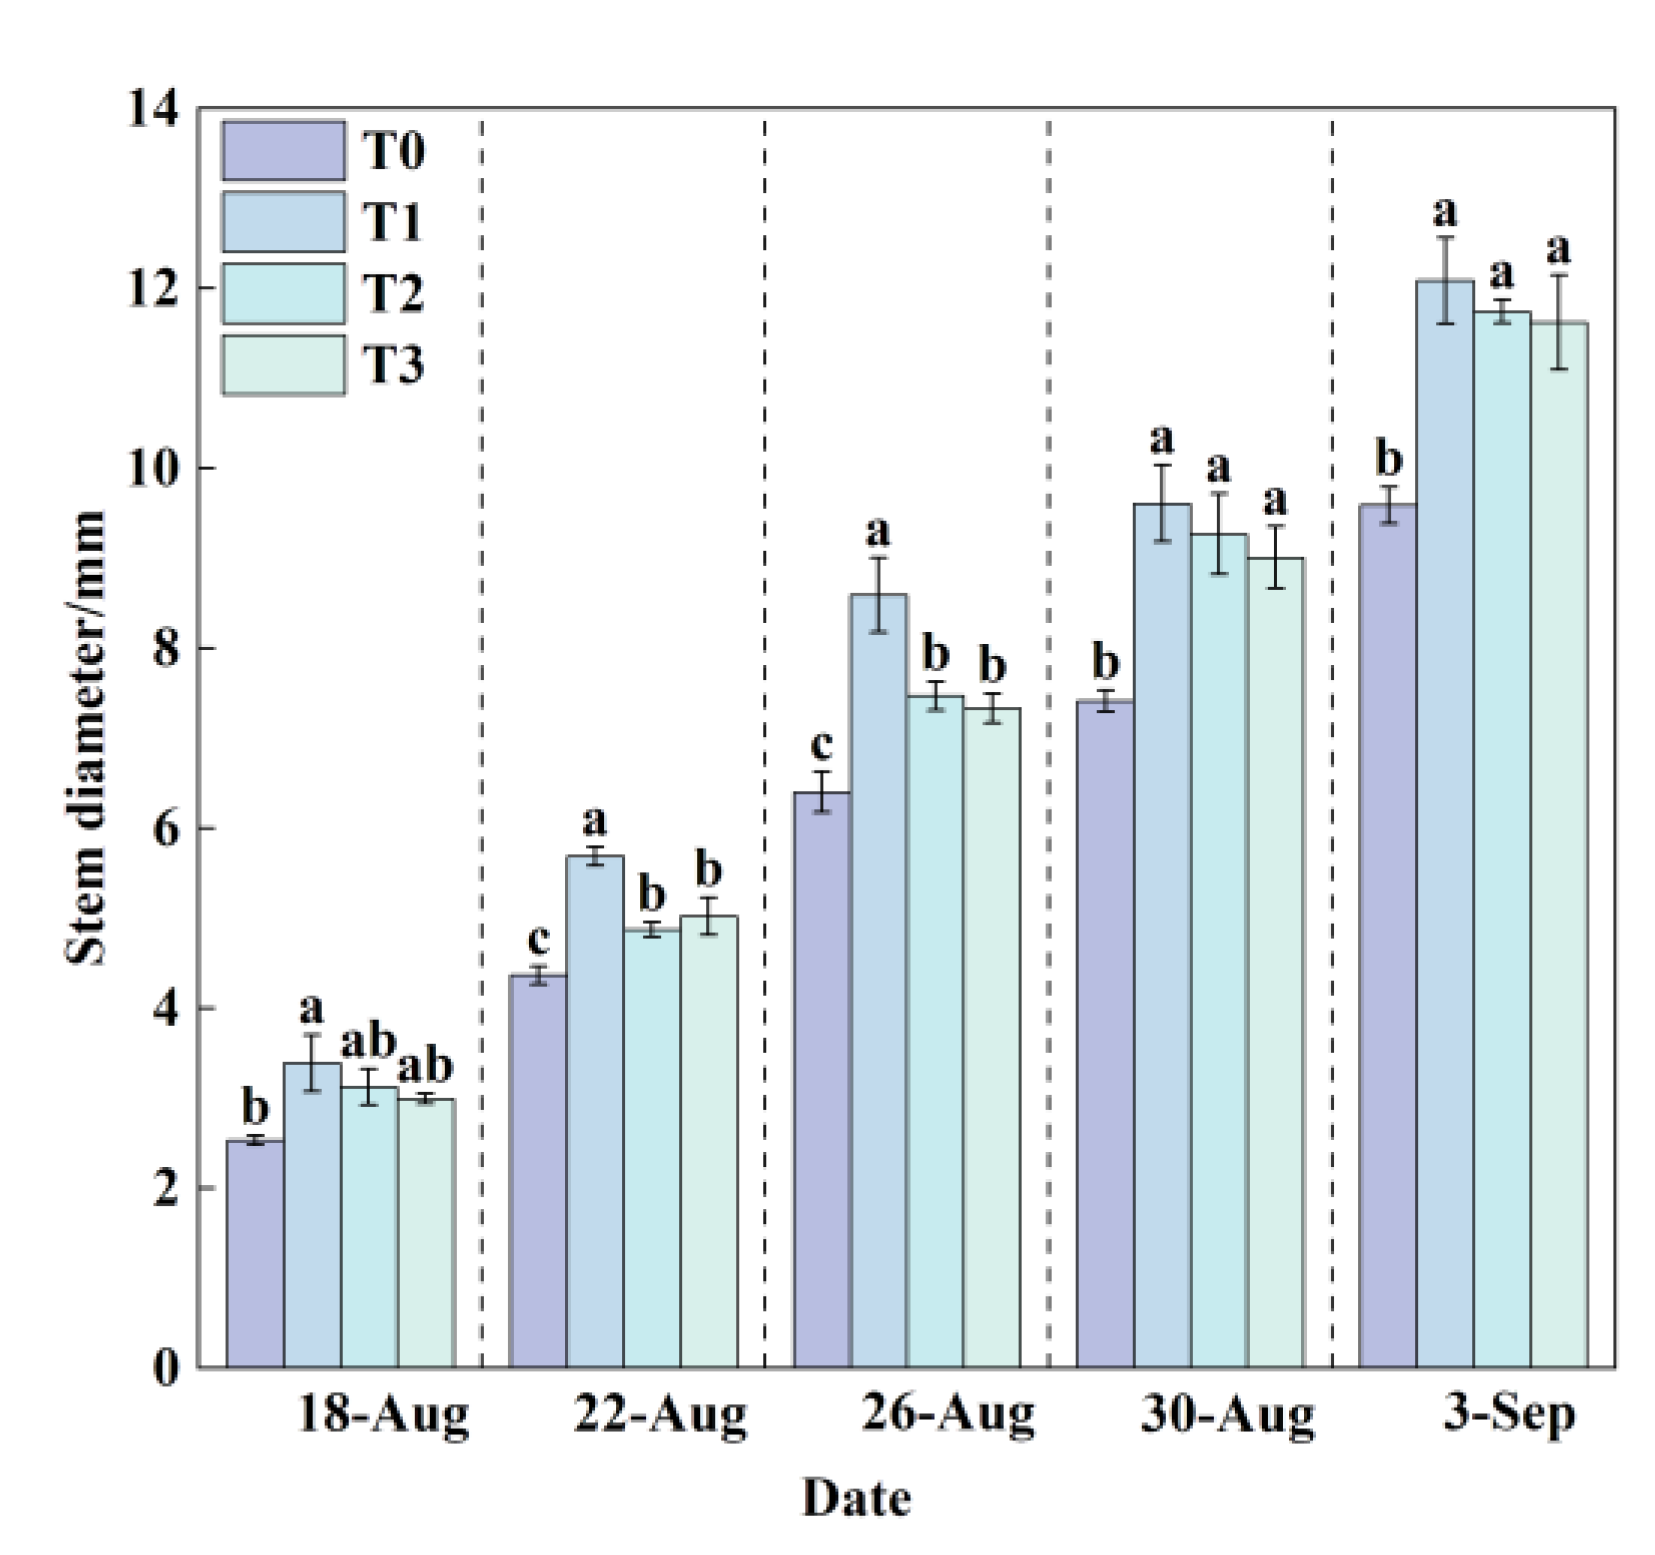
Figure 8.
Changes in leaf number under different treatments during the growth period. Different lowercase letters on the same measurement date indicate significant differences according to one-way ANOVA and LSD test (P < 0.05).
Figure 8.
Changes in leaf number under different treatments during the growth period. Different lowercase letters on the same measurement date indicate significant differences according to one-way ANOVA and LSD test (P < 0.05).
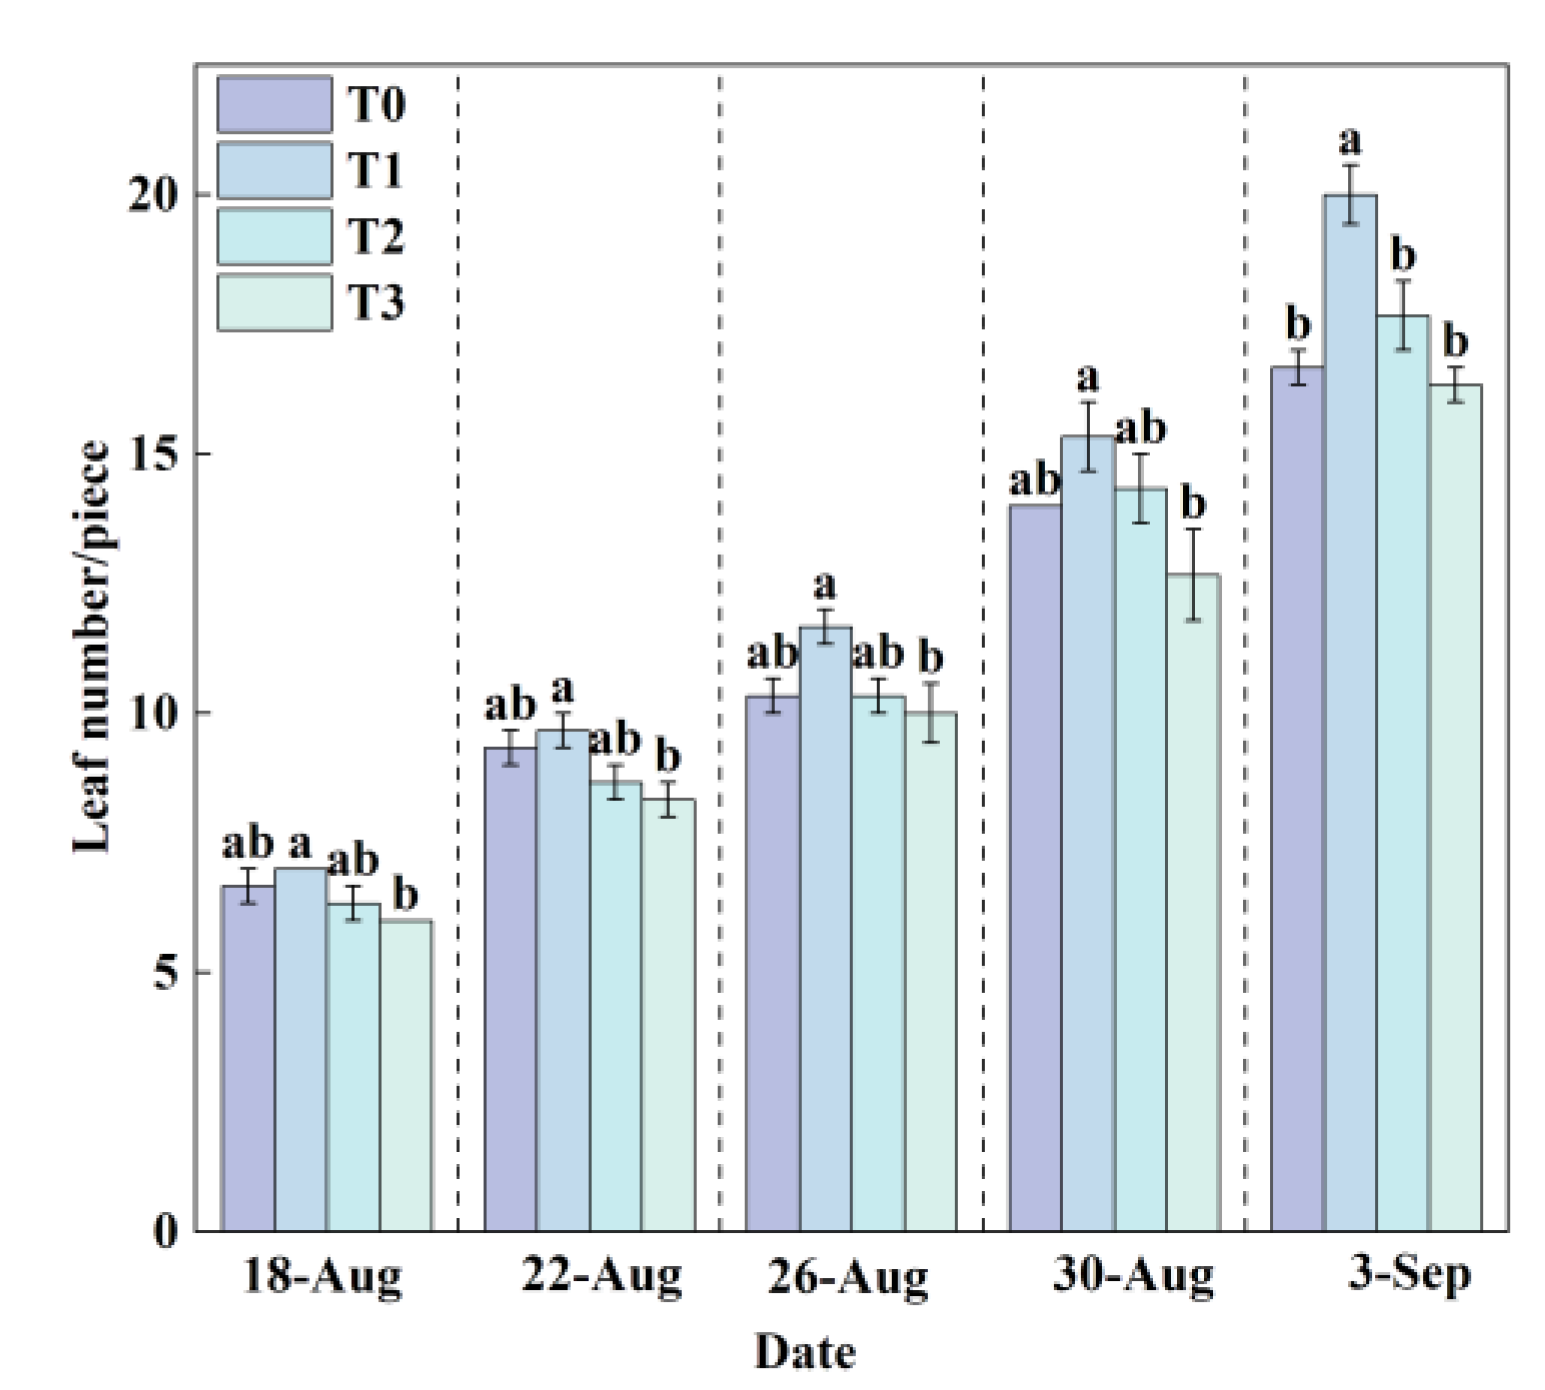
Figure 9.
Changes in leaf area under different treatments during the growth period. Different lowercase letters above on the same measurement date indicate significant differences according to one-way ANOVA followed by LSD test (P < 0.05).
Figure 9.
Changes in leaf area under different treatments during the growth period. Different lowercase letters above on the same measurement date indicate significant differences according to one-way ANOVA followed by LSD test (P < 0.05).
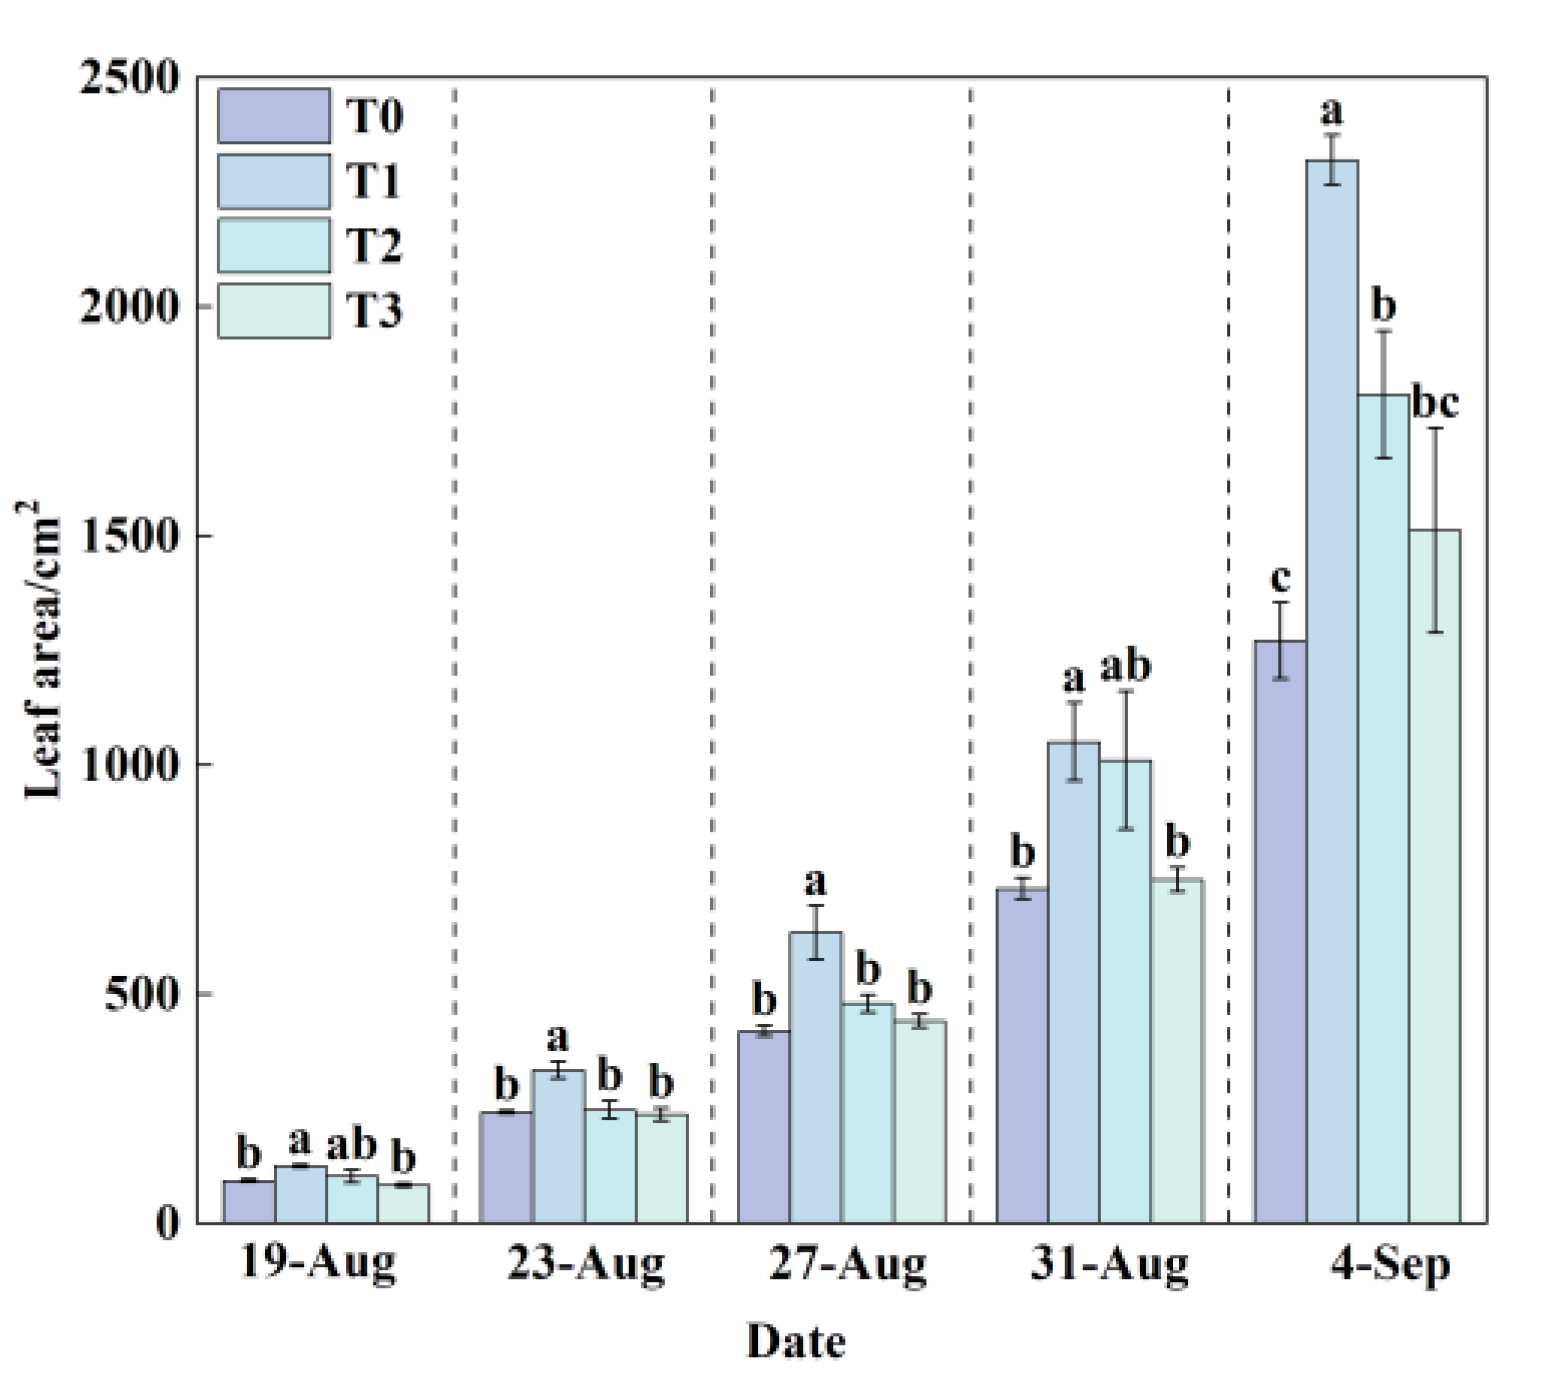
Figure 10.
Changes in root dry weight under different treatments during the growth period. Different lowercase letters on the same measurement date indicate significant differences according to one-way ANOVA followed by LSD test.
Figure 10.
Changes in root dry weight under different treatments during the growth period. Different lowercase letters on the same measurement date indicate significant differences according to one-way ANOVA followed by LSD test.
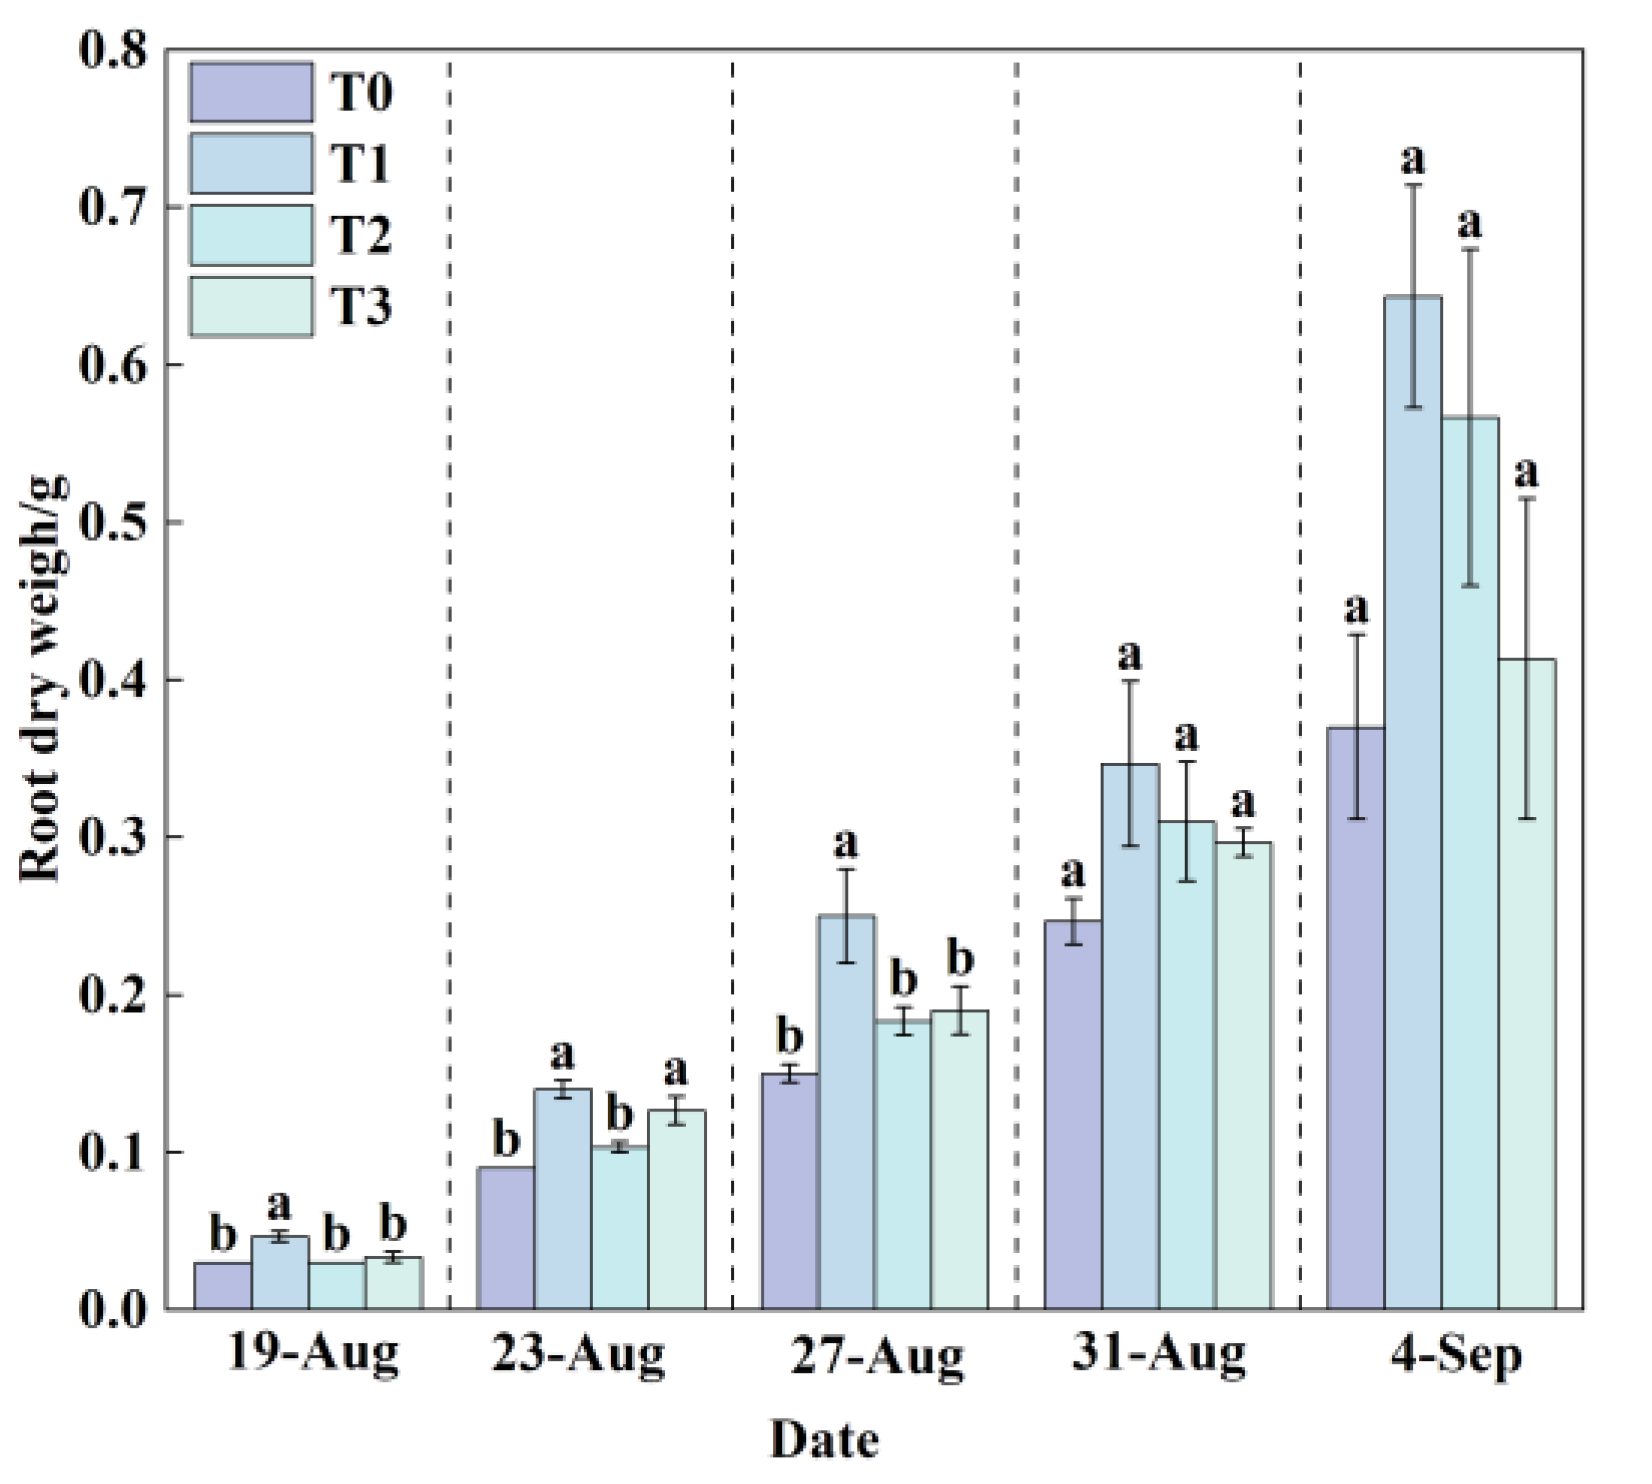
Figure 11.
Changes in shoot dry weight under different treatments during the growth period. Different lowercase letters on the same measurement date indicate significant differences according to one-way ANOVA followed by LSD test (P < 0.05).
Figure 11.
Changes in shoot dry weight under different treatments during the growth period. Different lowercase letters on the same measurement date indicate significant differences according to one-way ANOVA followed by LSD test (P < 0.05).
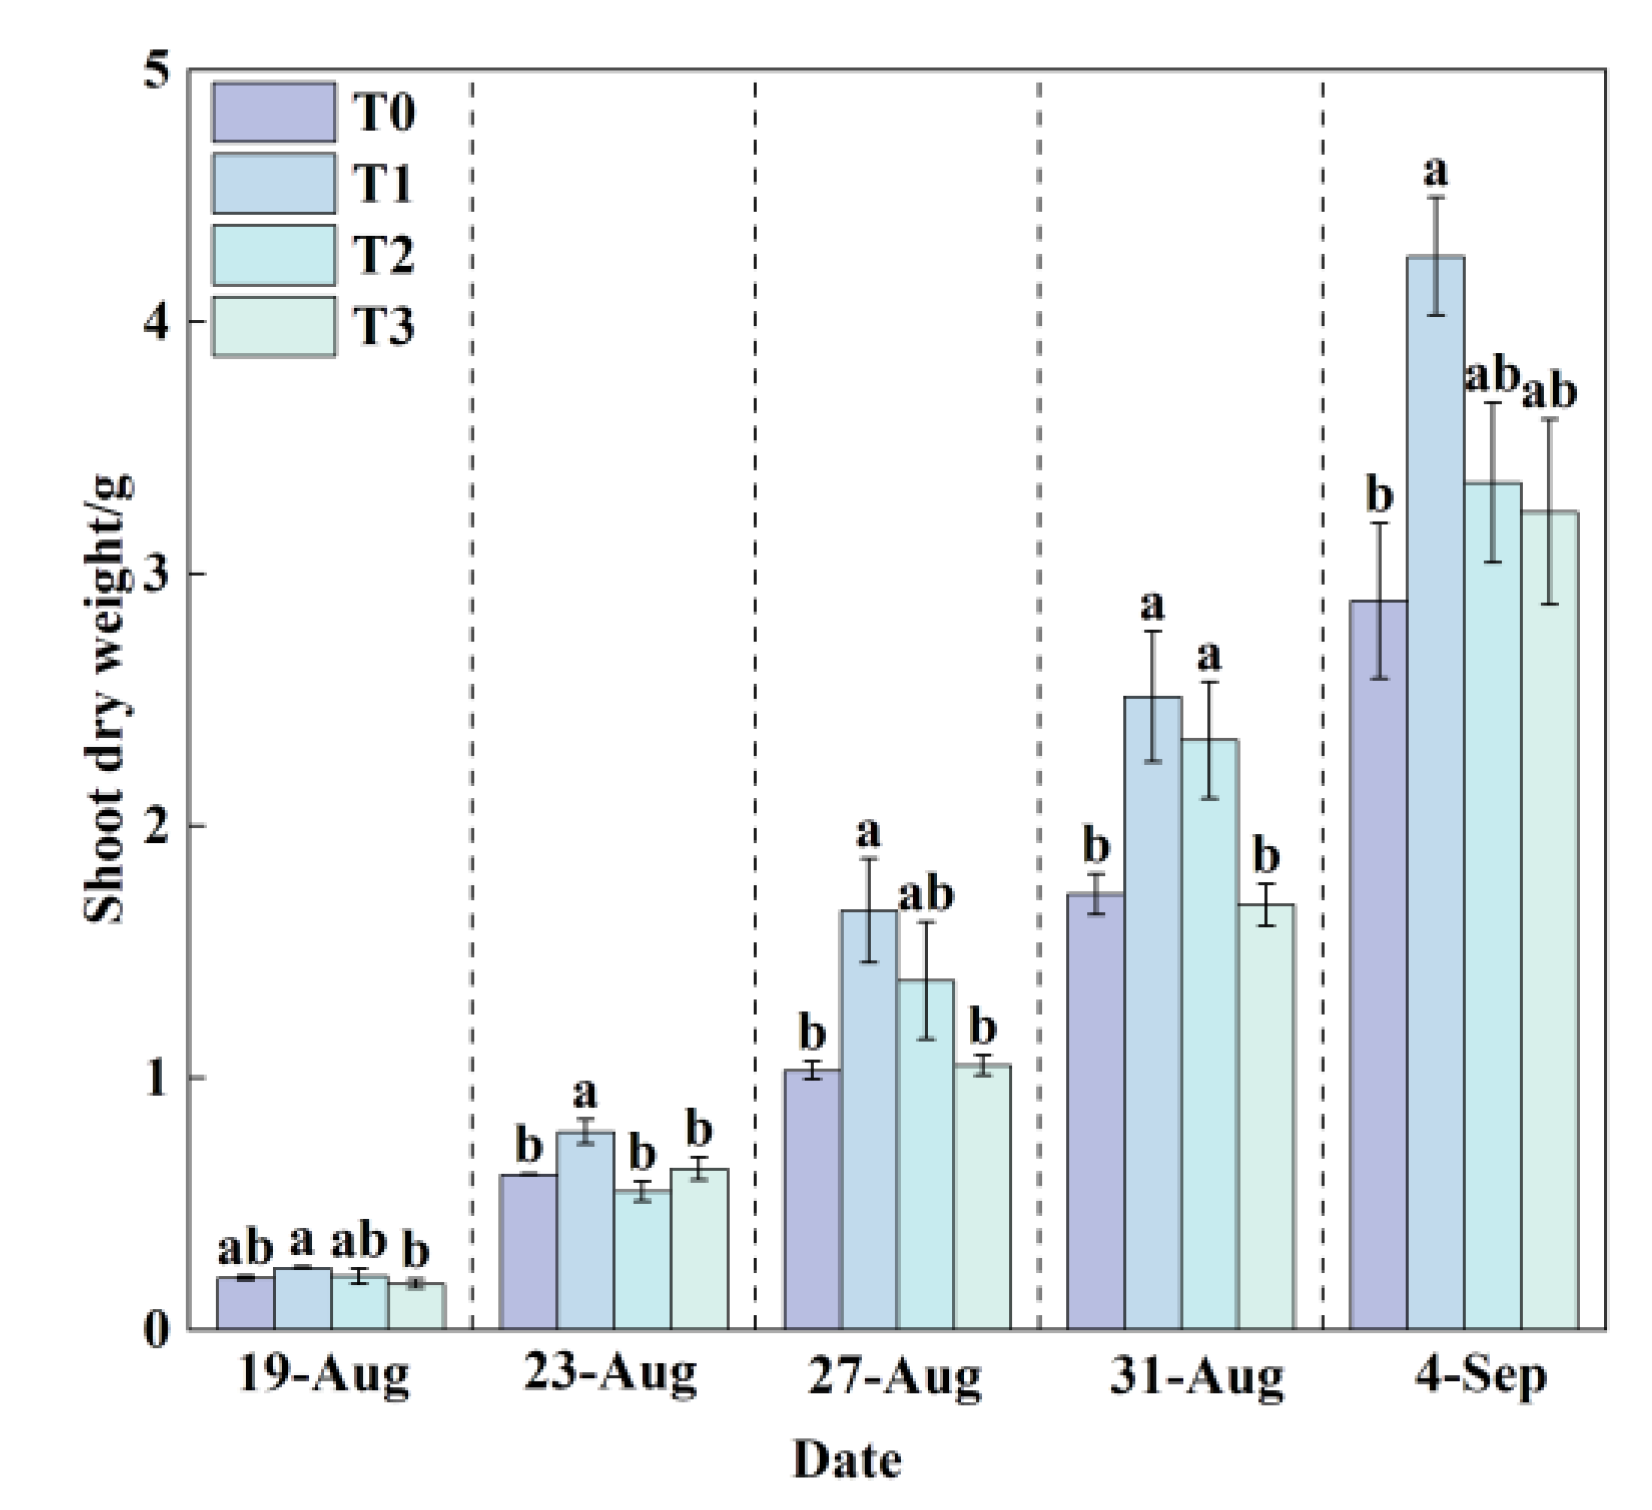
Figure 12.
Changes in SPAD values under different treatments during the growth period. Different lowercase letters on the same measurement date indicate significant differences according to one-way ANOVA followed by LSD test (P < 0.05).
Figure 12.
Changes in SPAD values under different treatments during the growth period. Different lowercase letters on the same measurement date indicate significant differences according to one-way ANOVA followed by LSD test (P < 0.05).
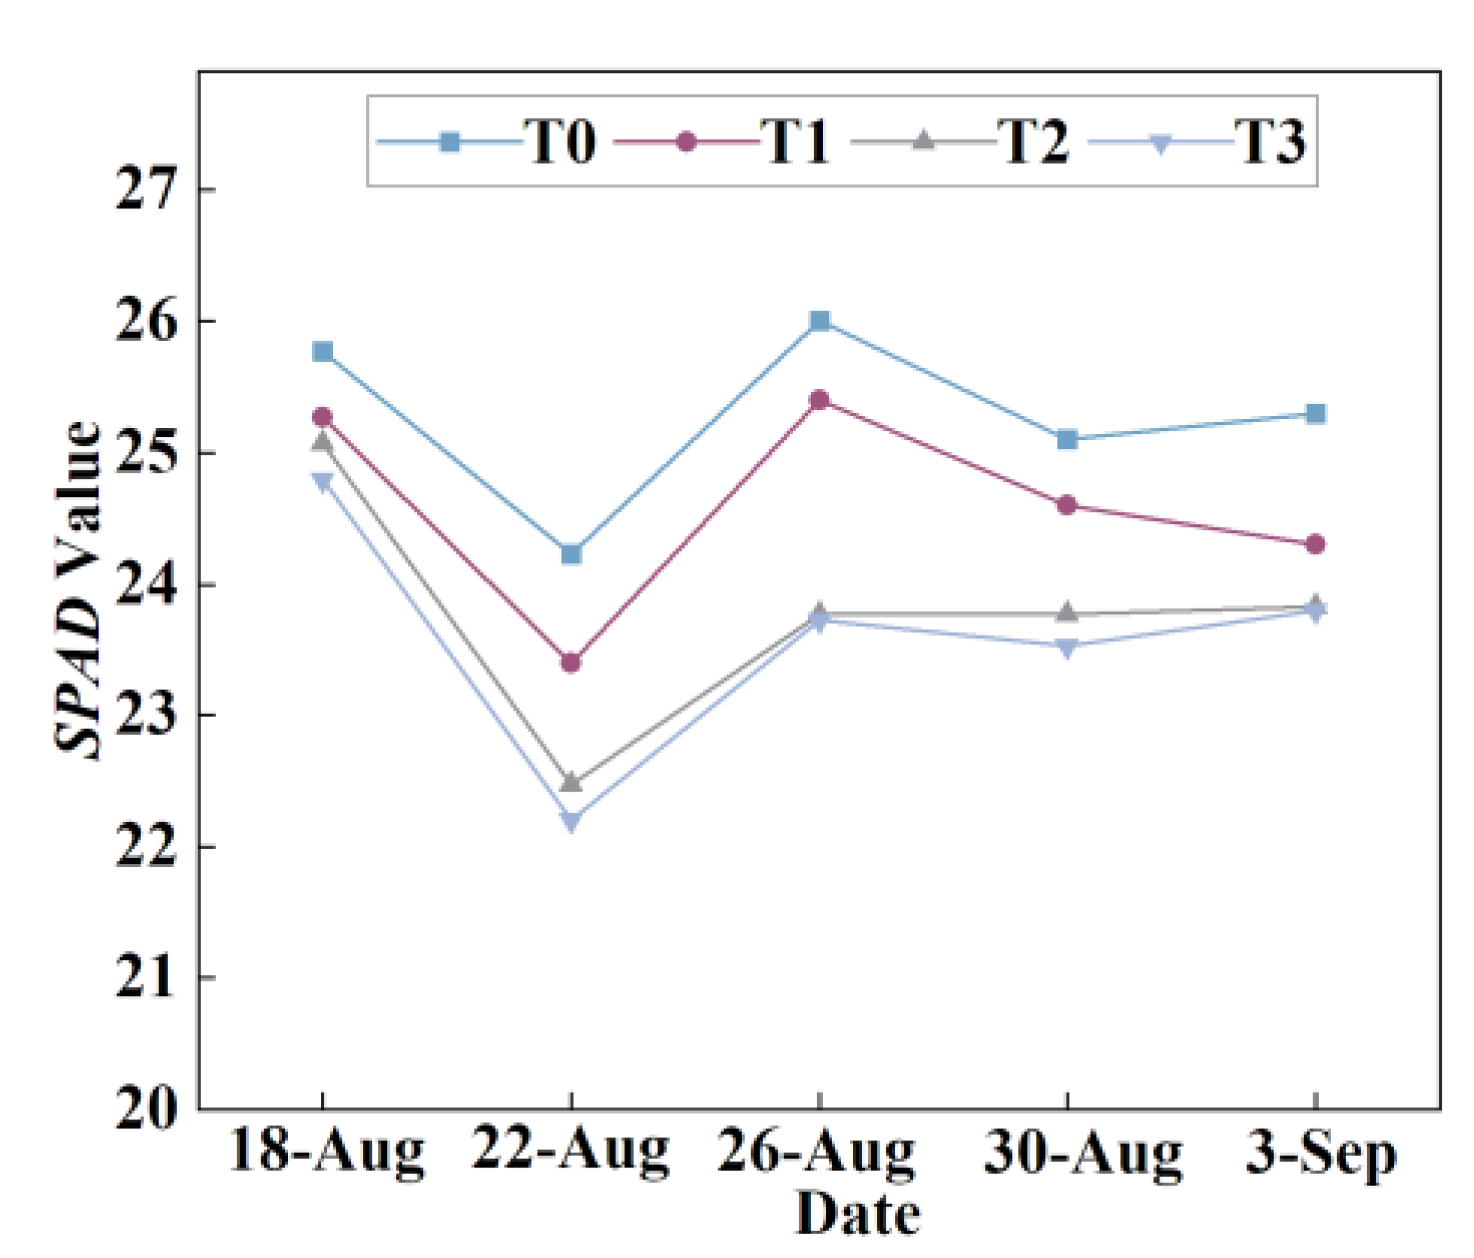
Figure 13.
Changes in nutrient solution consumption under different treatments during the growth period.
Figure 13.
Changes in nutrient solution consumption under different treatments during the growth period.
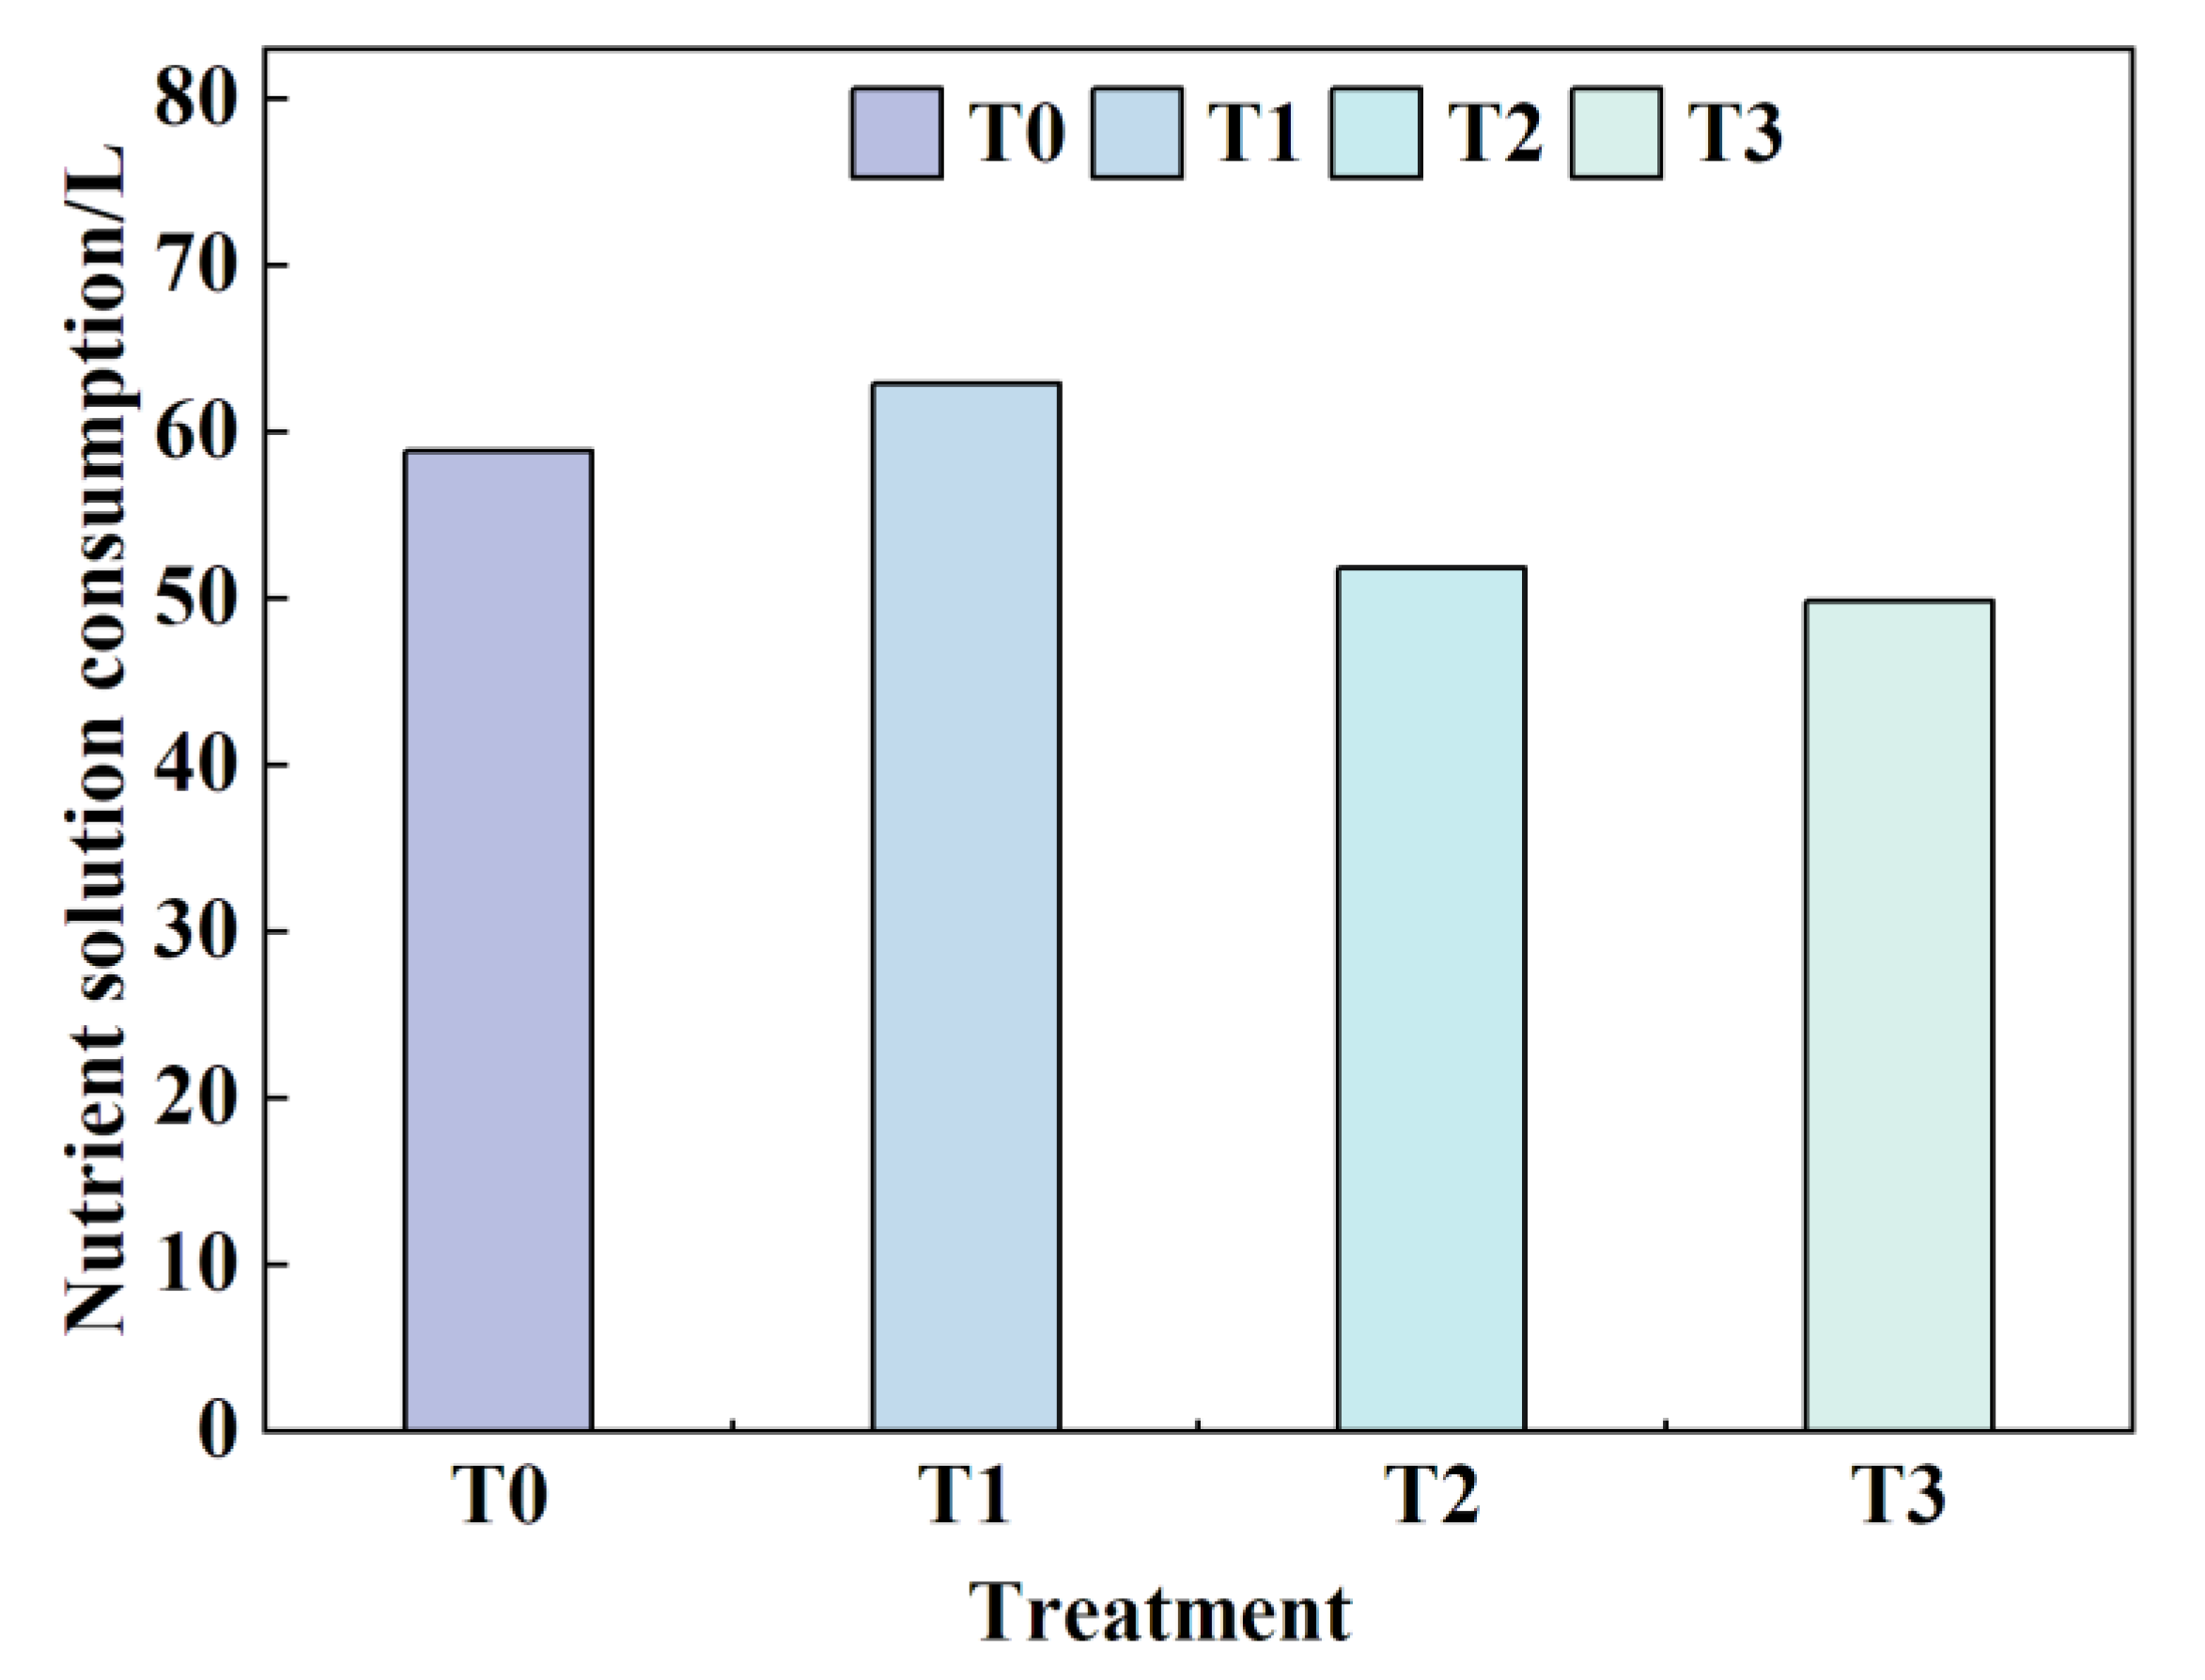
Figure 14.
Comparison of lettuce plants under different treatments.
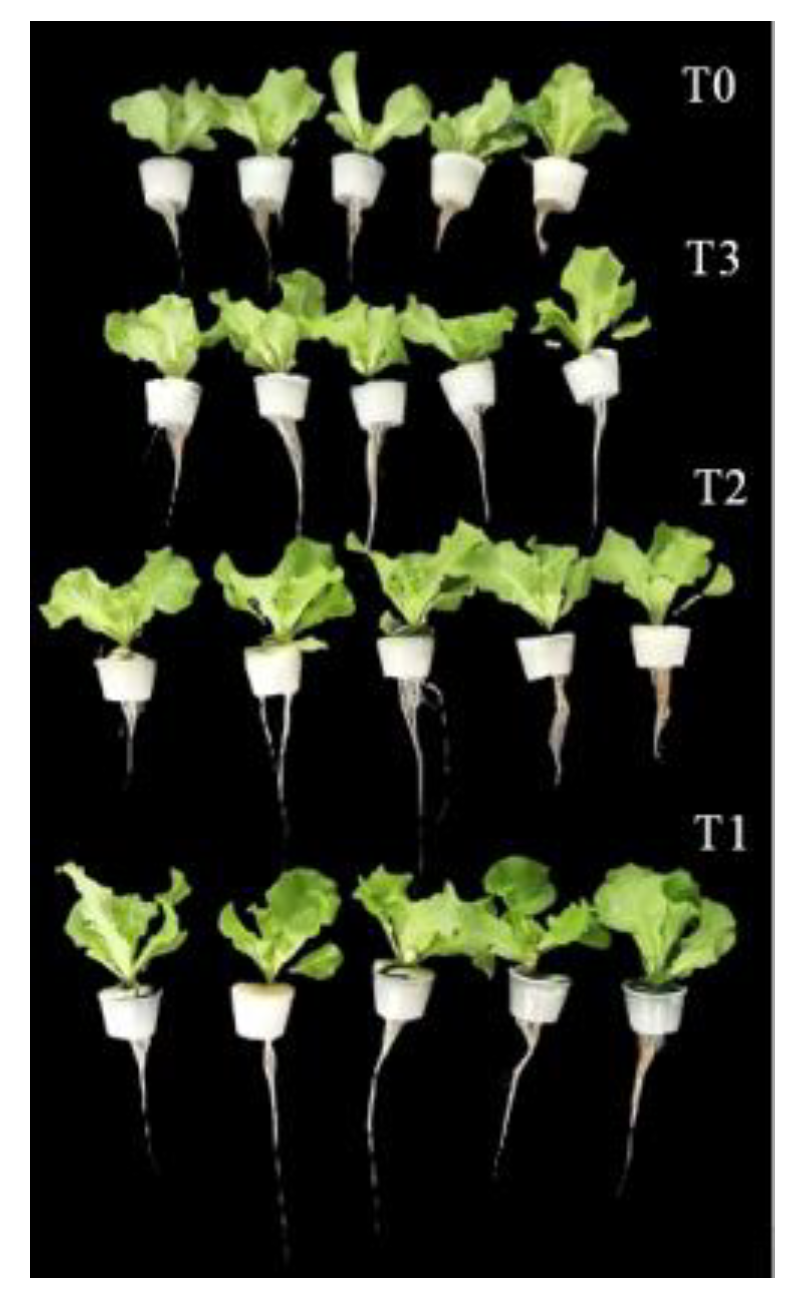
Figure 15.
(a) Thermal image; (b) Visible-light image corresponding to (a).
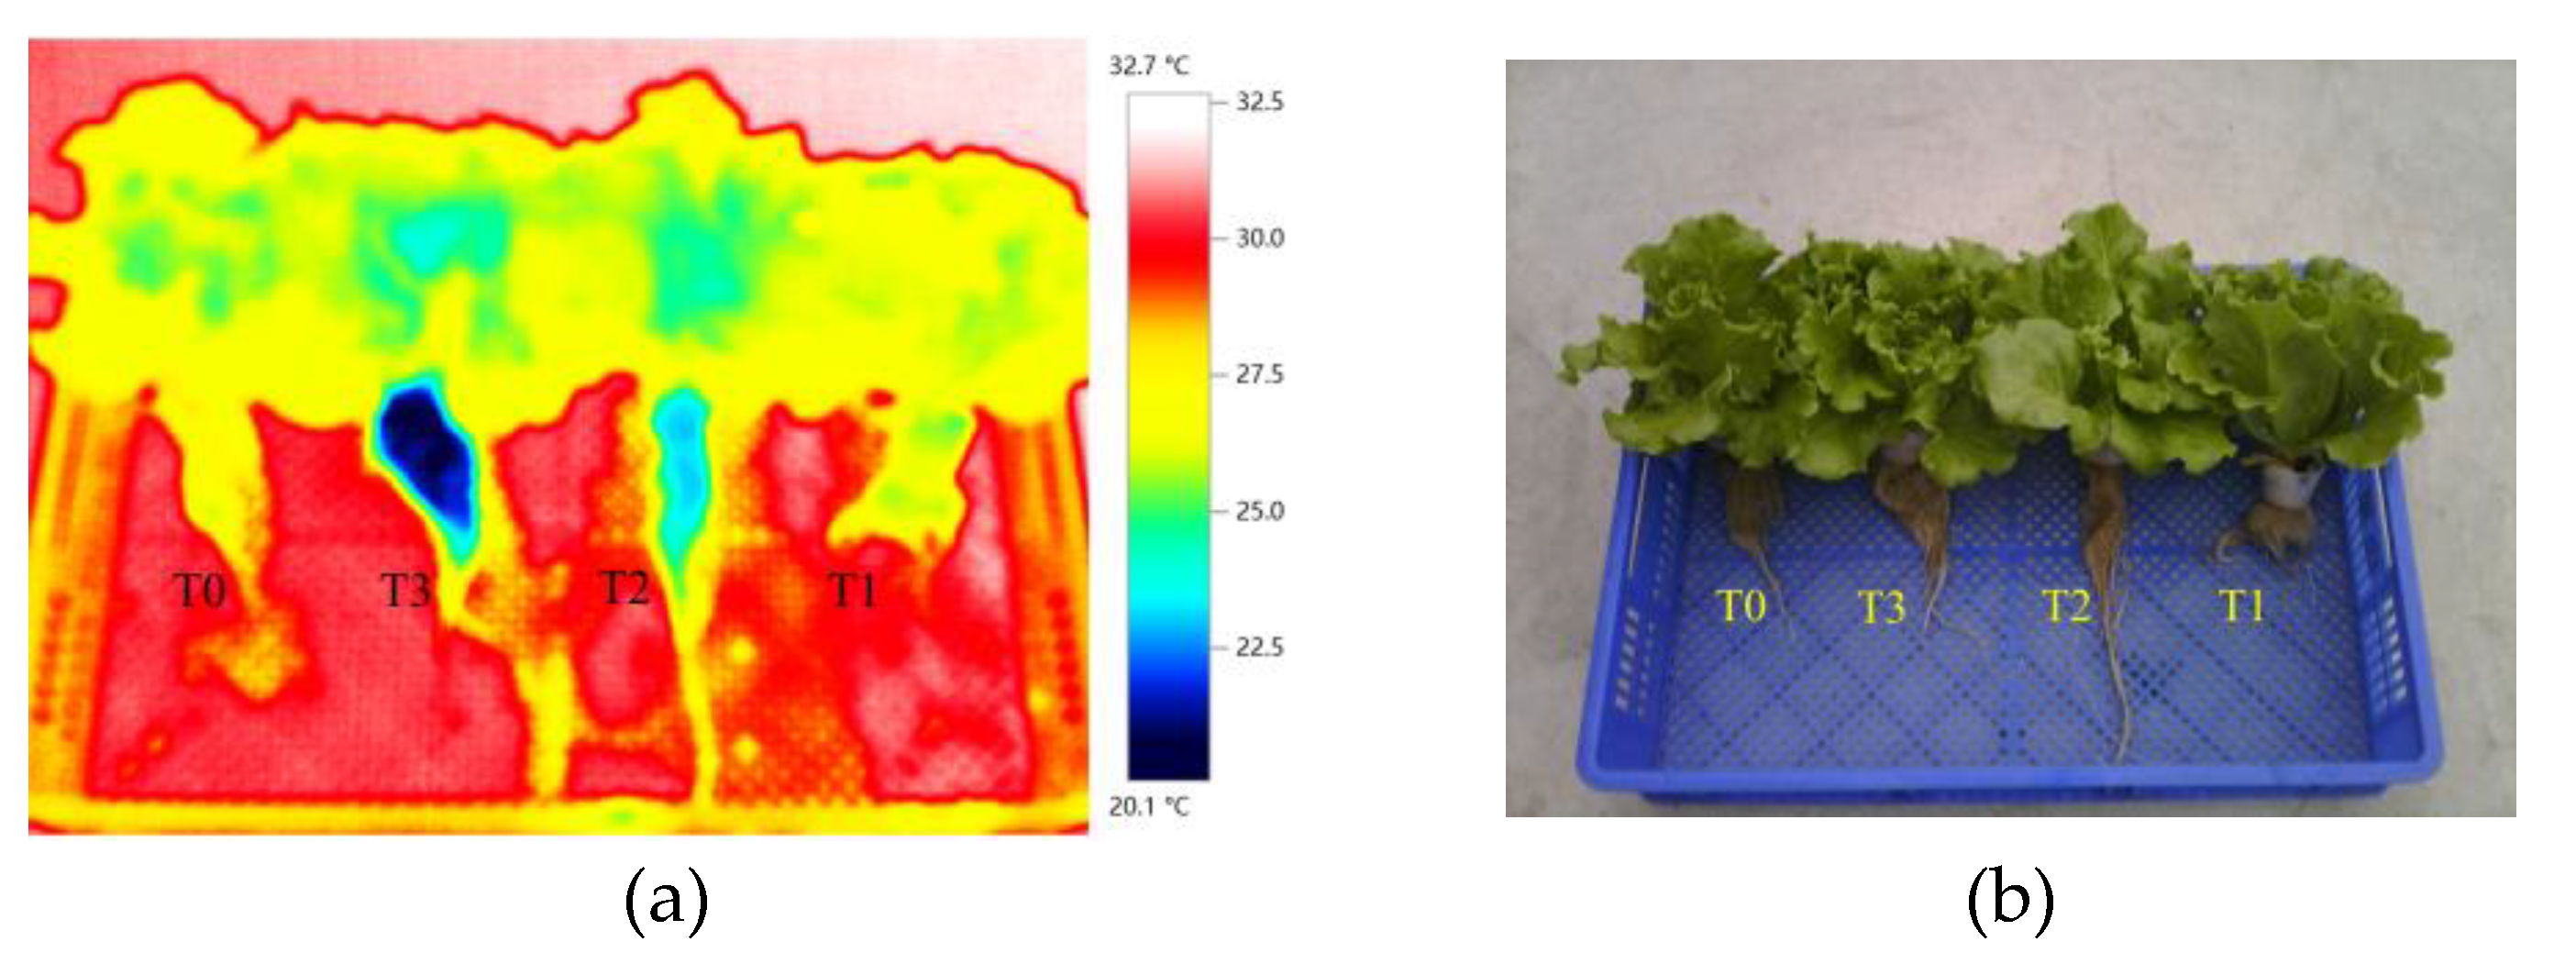
Figure 16.
(a) Nutrient solution temperature data for the four treatments, representing RZT; (b) Environmental temperature data inside the greenhouse; (c) Relative air humidity data inside the greenhouse.
Figure 16.
(a) Nutrient solution temperature data for the four treatments, representing RZT; (b) Environmental temperature data inside the greenhouse; (c) Relative air humidity data inside the greenhouse.
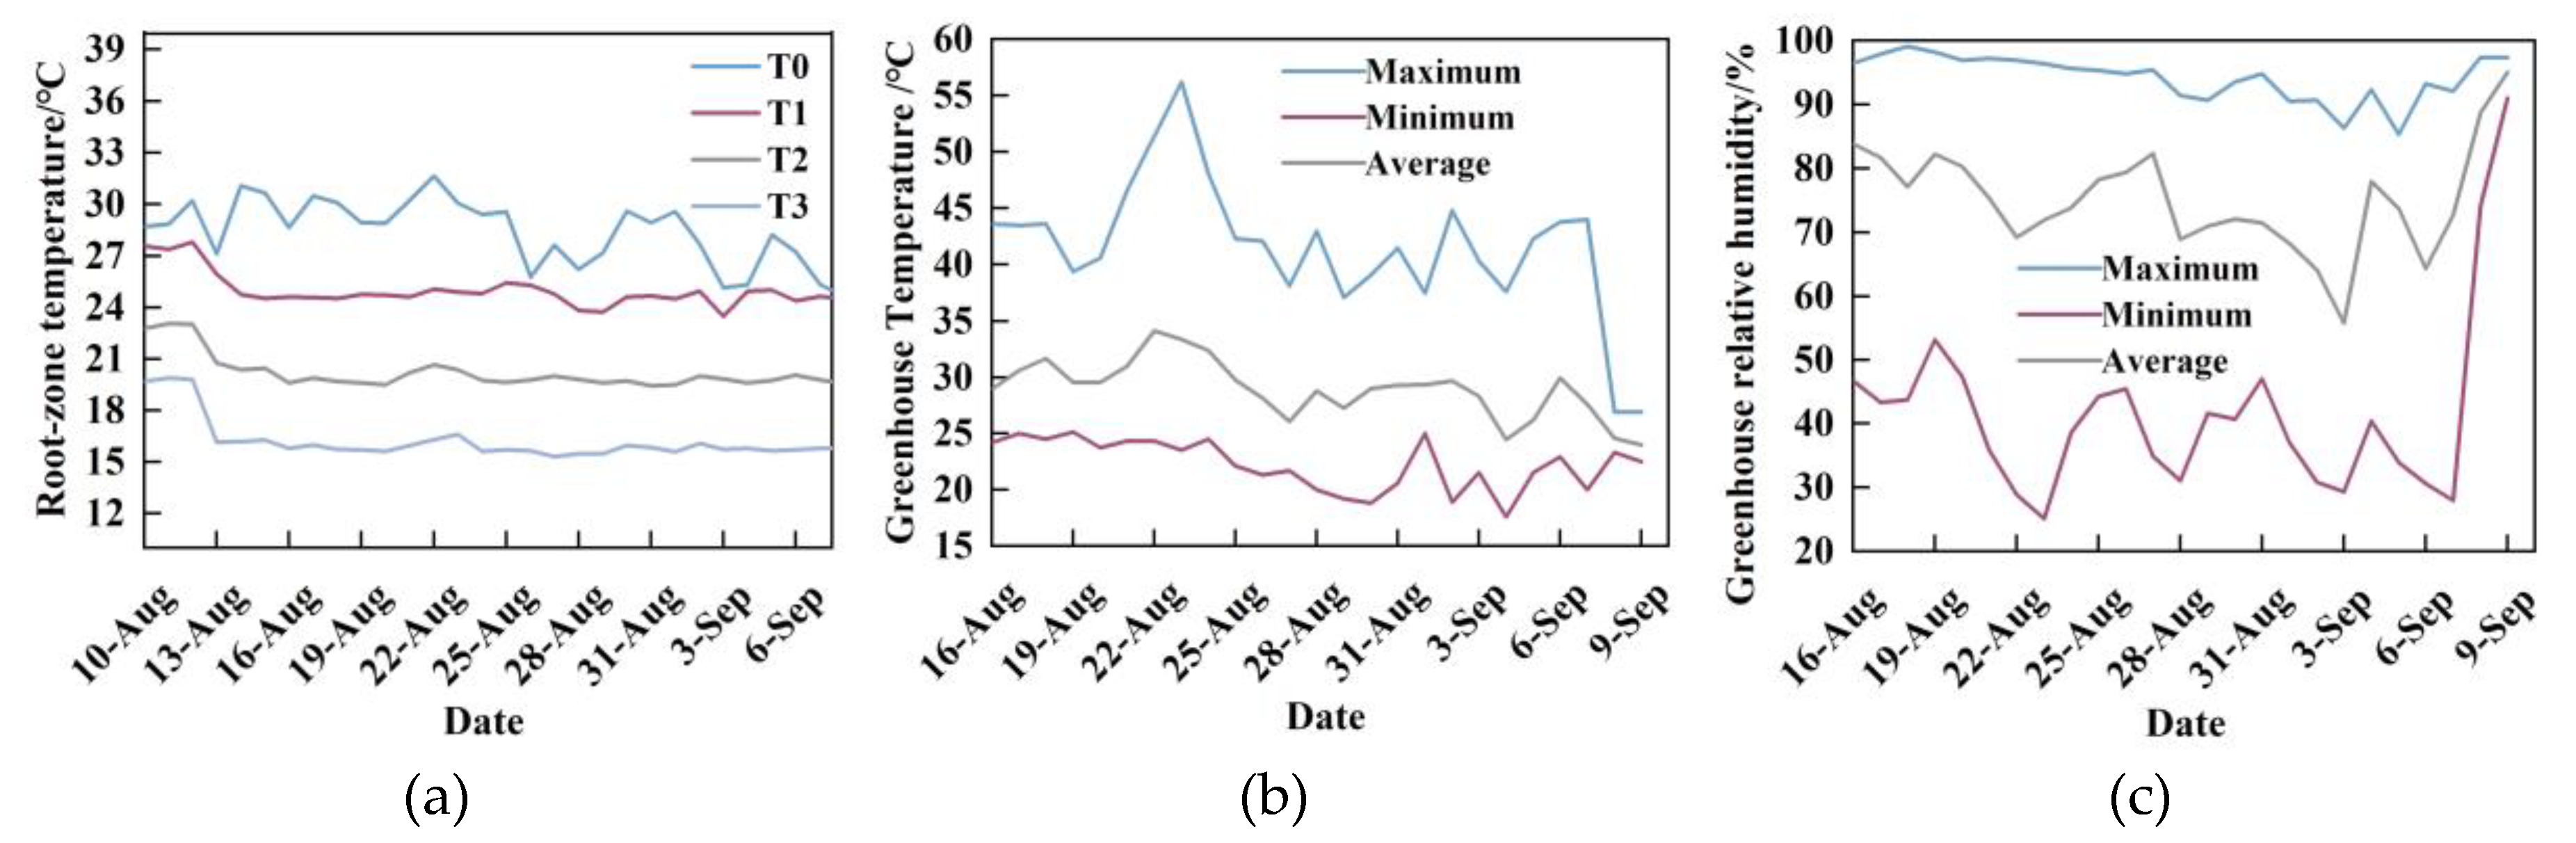
Table 2.
Effects of Different Root-Zone Temperatures (RZT) on Mineral Element Content in Lettuce.
| Treatment | N (g/100g) |
P (mg/kg) |
S (mg/kg) |
K (mg/kg) |
Ca (mg/kg) |
Mg (mg/kg) |
Fe (mg/kg) |
Zn (mg/kg) |
|---|---|---|---|---|---|---|---|---|
| T0 | 0.31±0.01a | 401.33±25.15a | 148.00±5.29a | 4576.67±298.72a | 549.67±50.29a | 175.33±13.65a | 4.23±0.55a | 3.17±0.41a |
| T1 | 0.33±0.03a | 337.33±17.90b | 138.00±12.53a | 4430.00±242.49a | 487.67±48.23ab | 160.00±16.37ab | 3.29±0.19bc | 2.55±0.14b |
| T2 | 0.31±0.01a | 324.67±16.04b | 140.33±14.01a | 4370.00±262.11a | 414.33±34.95b | 138.00±9.17b | 3.24±0.25c | 2.35±0.16b |
| T3 | 0.34±0.03a | 332.67±4.73b | 126.67±16.62a | 4186.67±97.13a | 430.67±12.06b | 138.00±3.61b | 3.88±0.13ab | 2.17±0.07b |
Note: Data are expressed as the mean ± standard deviation (n = 3). Different lowercase letters within the same parameter indicate significant differences between treatments according to one-way ANOVA and LSD test (p < 0.05).
Table 3.
Effects of Different Root-Zone Temperatures (RZT) on the Nutritional Quality of Lettuce.
| Treatment | Nitrate (mg/kg) |
Vc (mg/100g) |
Dietary fiber (g/100g) |
Soluble sugar (%) |
Soluble protein (g/100g) |
|---|---|---|---|---|---|
| T0 | 343.33±15.8a | 4.83±0.35b | 1.66±0.02b | 0.12±0.07a | 0.61±0.04a |
| T1 | 316.67±75.72a | 6.11±0.77a | 1.59±0.08b | 0.06±0.04a | 0.60±0.02a |
| T2 | 270.00±17.32a | 3.98±0.49b | 1.76±0.05a | 0.06±0.03a | 0.56±0.02a |
| T3 | 293.33±5.77a | 3.96±0.30b | 1.63±0.05b | 0.15±0.10a | 0.57±0.02a |
Note: Data are expressed as the mean ± standard deviation (n = 3). Different lowercase letters within the same parameter indicate significant differences between treatments according to one-way ANOVA and LSD test (p < 0.05).
Disclaimer/Publisher’s Note: The statements, opinions and data contained in all publications are solely those of the individual author(s) and contributor(s) and not of MDPI and/or the editor(s). MDPI and/or the editor(s) disclaim responsibility for any injury to people or property resulting from any ideas, methods, instructions or products referred to in the content. |
© 2025 by the authors. Licensee MDPI, Basel, Switzerland. This article is an open access article distributed under the terms and conditions of the Creative Commons Attribution (CC BY) license (http://creativecommons.org/licenses/by/4.0/).
Copyright: This open access article is published under a Creative Commons CC BY 4.0 license, which permit the free download, distribution, and reuse, provided that the author and preprint are cited in any reuse.


