Submitted:
17 November 2025
Posted:
18 November 2025
You are already at the latest version
Abstract
Recent developments in next-generation sequencing have improved the reliability of phylogenetic trees, allowing genome-wide phylogenetic analyses. Fusarium fungi are important phytopathogenic and clinical fungi. As the identification of species in this genus is conducted on a species complex (SC) basis, evaluating the monophyly of each SC and its evolutionary history are important. Recently, genome-scale phylogenetic analyses using a concatenation approach based on DNA data identified the putative phylogeny of Fusarium SCs. However, different data types and analytical approaches often yield different trees, and the possibility of alternative phylogenetic relationships has not yet been discussed. In this study, phylogenetic analyses using concatenation and coalescence approaches as well as polytomy tests based on DNA and amino acid data from 1,190 genes were performed on 23 Fusarium SCs. Our results suggest that (i) F. commune is independent of F. nisikadoi SC; (ii) the branching order among F. oxysporum SC, F. newnwsense SC, and F. nisikadoi SC cannot be determined; and (iii) the phylogenetic position of F. buxicola is inconsistent among the analyses. This study provides novel insights into the evolutionary history of Fusarium SCs and has implications for their classification and identification.
Keywords:
Fusarium
; species complex
; evolutionary history
; concatenation approach
; coalescence approach
; monophyly
1. Introduction
Recent developments in next-generation sequencing technologies, methodologies, and software have enabled analysis of genome-wide phylogenies. Genome-scale phylogenetic trees constructed from the alignment of hundreds to thousands of concatenated genes can significantly improve the reliability of phylogenetic tree branches and provide valuable insights into phylogenetic relationships [1]. Additionally, software for genome-scale coalescent-based phylogenetic analyses, such as ASTRAL [2], has been developed and used to resolve controversial lineages [3]. Furthermore, genome data allows us to predict polytomies, which are useful for discussing evolutionary histories [4,5].
The taxonomy of Fusarium Link has long been studied by many researchers because Fusarium fungi are internationally recognized as important phytopathogenic and clinical fungi. The genus Fusarium was established in 1809, and approximately 400 species are currently phylogenetically recognized. Because of the large number of Fusarium species, classification and identification are conducted based on the species complex (SC), a monophyletic group comprising multiple species without synapomorphy, as the operational taxonomic unit. Therefore, the monophyly of each SC must be ensured to accurately classify and identify species.
Since their establishment, the evolutionary history of SCs has been investigated using multiple genes. Geiser et al. [6] inferred phylogenetic relationships based on combined RPB1 (the largest subunit of the RNA polymerase II gene) and RPB2 (the second largest subunit of the RNA polymerase II gene) nucleotide sequence data. Most phylogenetic relationships among SCs were supported by the results of O’Donnell et al. [7] and Geiser et al. [8], who subsequently analyzed phylogenies based on 19 genes, improving branch reliability. However, differences were observed in the branching order of F. fujikuroi, F. newnesense, F. nisikadoi, and F. oxysporum SCs when comparing lineages derived from 559 core genes [9]. In the former, the order was (F. newnesense SC, (F. oxysporum SC, (F. nisikadoi SC, F. fujikuroi SC))), whereas in the latter, it was (F. fujikuroi SC, (F. oxysporum SC, (F. newnesense SC, F. nisikadoi SC))). Differences were observed in the outer phylogenetic relationships of Fusarium sensu stricto (s. str.). Multigene (2- and 19-gene) analyses showed the following SC branching order: ((F. dimerum SC, F. ventricosum SC), (F. albidum SC, (( F. solani SC, F. decemcellulare SC), (F. staphyleae SC, (Fusarium s. str., F. buxicola SC))))), whereas the genome-scale phylogenetic analysis showed (F. ventricosum SC, (F. dimerum SC, (F. albidum SC, (F. staphyleae SC, ((Fusarium s. str., F. buxicola SC), (F. solani SC, F. decemcellulare SC))))) [9]. Both phylogenetic trees based on 19-gene and genome-scale analyses showed high branch support.
However, cases showing discrepancies between nucleotide and amino acid sequences or concatenation and coalescence approaches have been reported in molecular phylogenetic analyses. The coalescent-based method of species phylogeny estimation accounts for the possible effects of incomplete lineage sorting on tree reconstruction [10,11,12,13]. In genome-scale analyses, different data types or analysis methods may yield different topologies composed of statistically supported internal branches [10]. In such cases, selecting a single phylogenetic tree to represent the evolutionary history is difficult; therefore, multiple phylogenetic trees that do not fully match should be considered.
Lizcano Salas et al. [14] suggested that there is a conflict regarding the position of the F. oxysporum SC between results obtained using concatenation and coalescent approaches based on DNA data. The concatenation approach indicated that F. oxysporum SC is sister to a clade consisting of F. nisicadoi SC and F. newnesense SC, whereas the coalescent approach showed that F. oxysporum SC is sister to F. fujikuroi SC. This inconsistency highlights an unresolved issue in the phylogenetic placement of SCs within the genus Fusarium, and further information is needed to elucidate their evolutionary relationships.
In this study, to evaluate the monophyly and evolutionary history of the current Fusarium SCs, we performed genome-scale phylogenetic analyses using both concatenation and coalescence approaches with DNA and amino acid sequences. In addition, to further explore conflicts in evolutionary histories among studies, we conducted a quartet-based polytomy test implemented using ASTRAL (Accurate Species TRee ALgorithm; Mirarab et al. [2]).
Here, we report three conflicting evolutionary histories among the analyses: (i) the phylogenetic position of F. commune, a member of the F. nisikadoi SC; (ii) the branching order of F. commune, F. newnesense SC, F. nisikadoi SC, and F. oxysporum SC; and (iii) the phylogenetic position of the F. buxucola SC.
2. Materials and Methods
2.1. Taxon Sampling
The ingroup taxa comprised genomic data from 101 species, representing 23 Fusarium SCs. As outgroup taxa, three strains belonging to three species of Neonectria (N. coccinea, N. galligena, and Nectria sp.) and Trichoderma brevicompactum were selected based on previous studies (Supplementary Table S1 [15,16,17,18,19,20,21,22,23,24,25,26,27,28,29]).
2.2. Orthology Inference of Genes and Selection
We conducted a reciprocal BLAST search to identify orthologous genes, following the method described by Nozawa et al. [30]. Briefly, gene predictions were performed using Augustus v.3.3.3 [31] with the parameter: “--genemodel=complete --species=fusarium <genomic data>”. Orthology inference was conducted using reciprocal BLAST analysis with BLASTP in BLAST 2.9.0+ software (e-value ≤ 1E-05) [32,33], considering the reciprocal best BLAST hits as orthologs. Multiple sequence alignments for each orthologous gene were generated using Clustal Omega v.1.2.2 [34] with default settings at the amino acid sequence level.
Genes longer than 1,000 bp (excluding gap-containing sites after alignment) were selected, as Mirarab et al. [2] demonstrated that species tree accuracy improves when individual gene lengths increase from 500 to 1,000 bp. To obtain gene alignments meeting this criterion, we trimmed the gap-containing sites using trimAl v.1.2 [35] and counted the remaining sites using PhyKIT v.1.2.0 (https://jlsteenwyk.com/PhyKIT/; Steenwyk et al. [36]). Sequence statistics for the concatenated datasets were calculated using the Sequence Data Explorer module of MEGA10 [37].
2.3. Phylogenetic Analyses
Phylogenetic trees were constructed using concatenation and coalescence approaches. Concatenated alignments of DNA and amino acid data from all gene sets (1,190 genes) were analyzed using RAxML v.7.0.4 [38] under the GTRGAMMA and PROTGAMMAAUTO models, respectively, with 100 bootstrap replicates.
For the coalescence approach, species trees were inferred using the summary-tree method implemented in ASTRAL III v.4.4.4 [2]. Individual gene trees were first constructed from the DNA and amino acid datasets using MEGA-CC v.10.2.5 [37]. DNA data were analyzed using the maximum likelihood method under a general time-reversible model with gamma distribution, and amino acid data were analyzed using the Poisson distribution model with gamma distribution. Statistical support for each internal branch of the coalescent-based trees was evaluated using local posterior probability (LPP) values [39].
2.4. Gene Tree Discordance Analysis and Polytomy Test
Gene tree support and conflict were evaluated using bipartition analysis implemented in the PhyParts program [40]. The coalescence-based species tree was re-rooted using T. brevicompactum (IBT40841), and all individual gene trees were re-rooted accordingly. The program calculated the number of gene trees supporting each bipartition across all the species. The results were summarized using pie charts illustrating the proportions of gene trees that (i) were congruent with the bipartition, (ii) supported most frequent alternative bipartition, and (iii) supported other alternative bipartitions.
The polytomy test was performed using the ASTRAL package (option t 10) [4]. This statistical test is based on the multispecies coalescence model, and evaluates the null hypothesis that a branch in the estimated species tree should be replaced by a polytomy.
3. Results
3.1. Dataset Characteristics
After performing RPB searches, 1,190 orthologous genes were identified. The minimum and maximum alignment lengths for the DNA data were 1,002 and 7,857 bp (mean: 1,688 bp), respectively (Supplementary Table S2). The minimum and maximum proportions of variable alignment were 33.5 and 95.2% (mean: 60.1%), respectively. The minimum and maximum alignment lengths for the amino acid data were 334 and 2,619 sites (mean: 556 sites), respectively. The minimum and maximum proportions of variable alignment sites were 7.5 and 98.3% (mean: 51.6%), respectively.
The alignment length and number of variable and parsimony-informative sites for the 1,190 genes in the DNA data were 1,984,401 bp, 1,184,205 sites (59.7%), and 1,030,213 sites (51.9%), respectively (Supplementary Table S3). For amino acid sequences, the corresponding values were 661,467 sites, 336,905 variable sites (50.9%), and 254,109 parsimony-informative sites (38.4%).
3.2. Phylogenetic Analyses
Genome-scale phylogenetic analyses were performed using concatenation and coalescence approaches based on nucleotide and amino acid sequence data from 1,190 orthologous genes. These analyses revealed the presence of non-monophyletic SCs and inconsistent evolutionary relationships, depending on the data type and analytical approach. Inconsistencies were recognized in (i) the position of F. commune, (ii) the branching order among F. nisikadoi SC, F. newnesense SC, and F. oxysporum SC, and (iii) the phylogenetic position of the F. buxicola SC (Supplementary Figure S1).
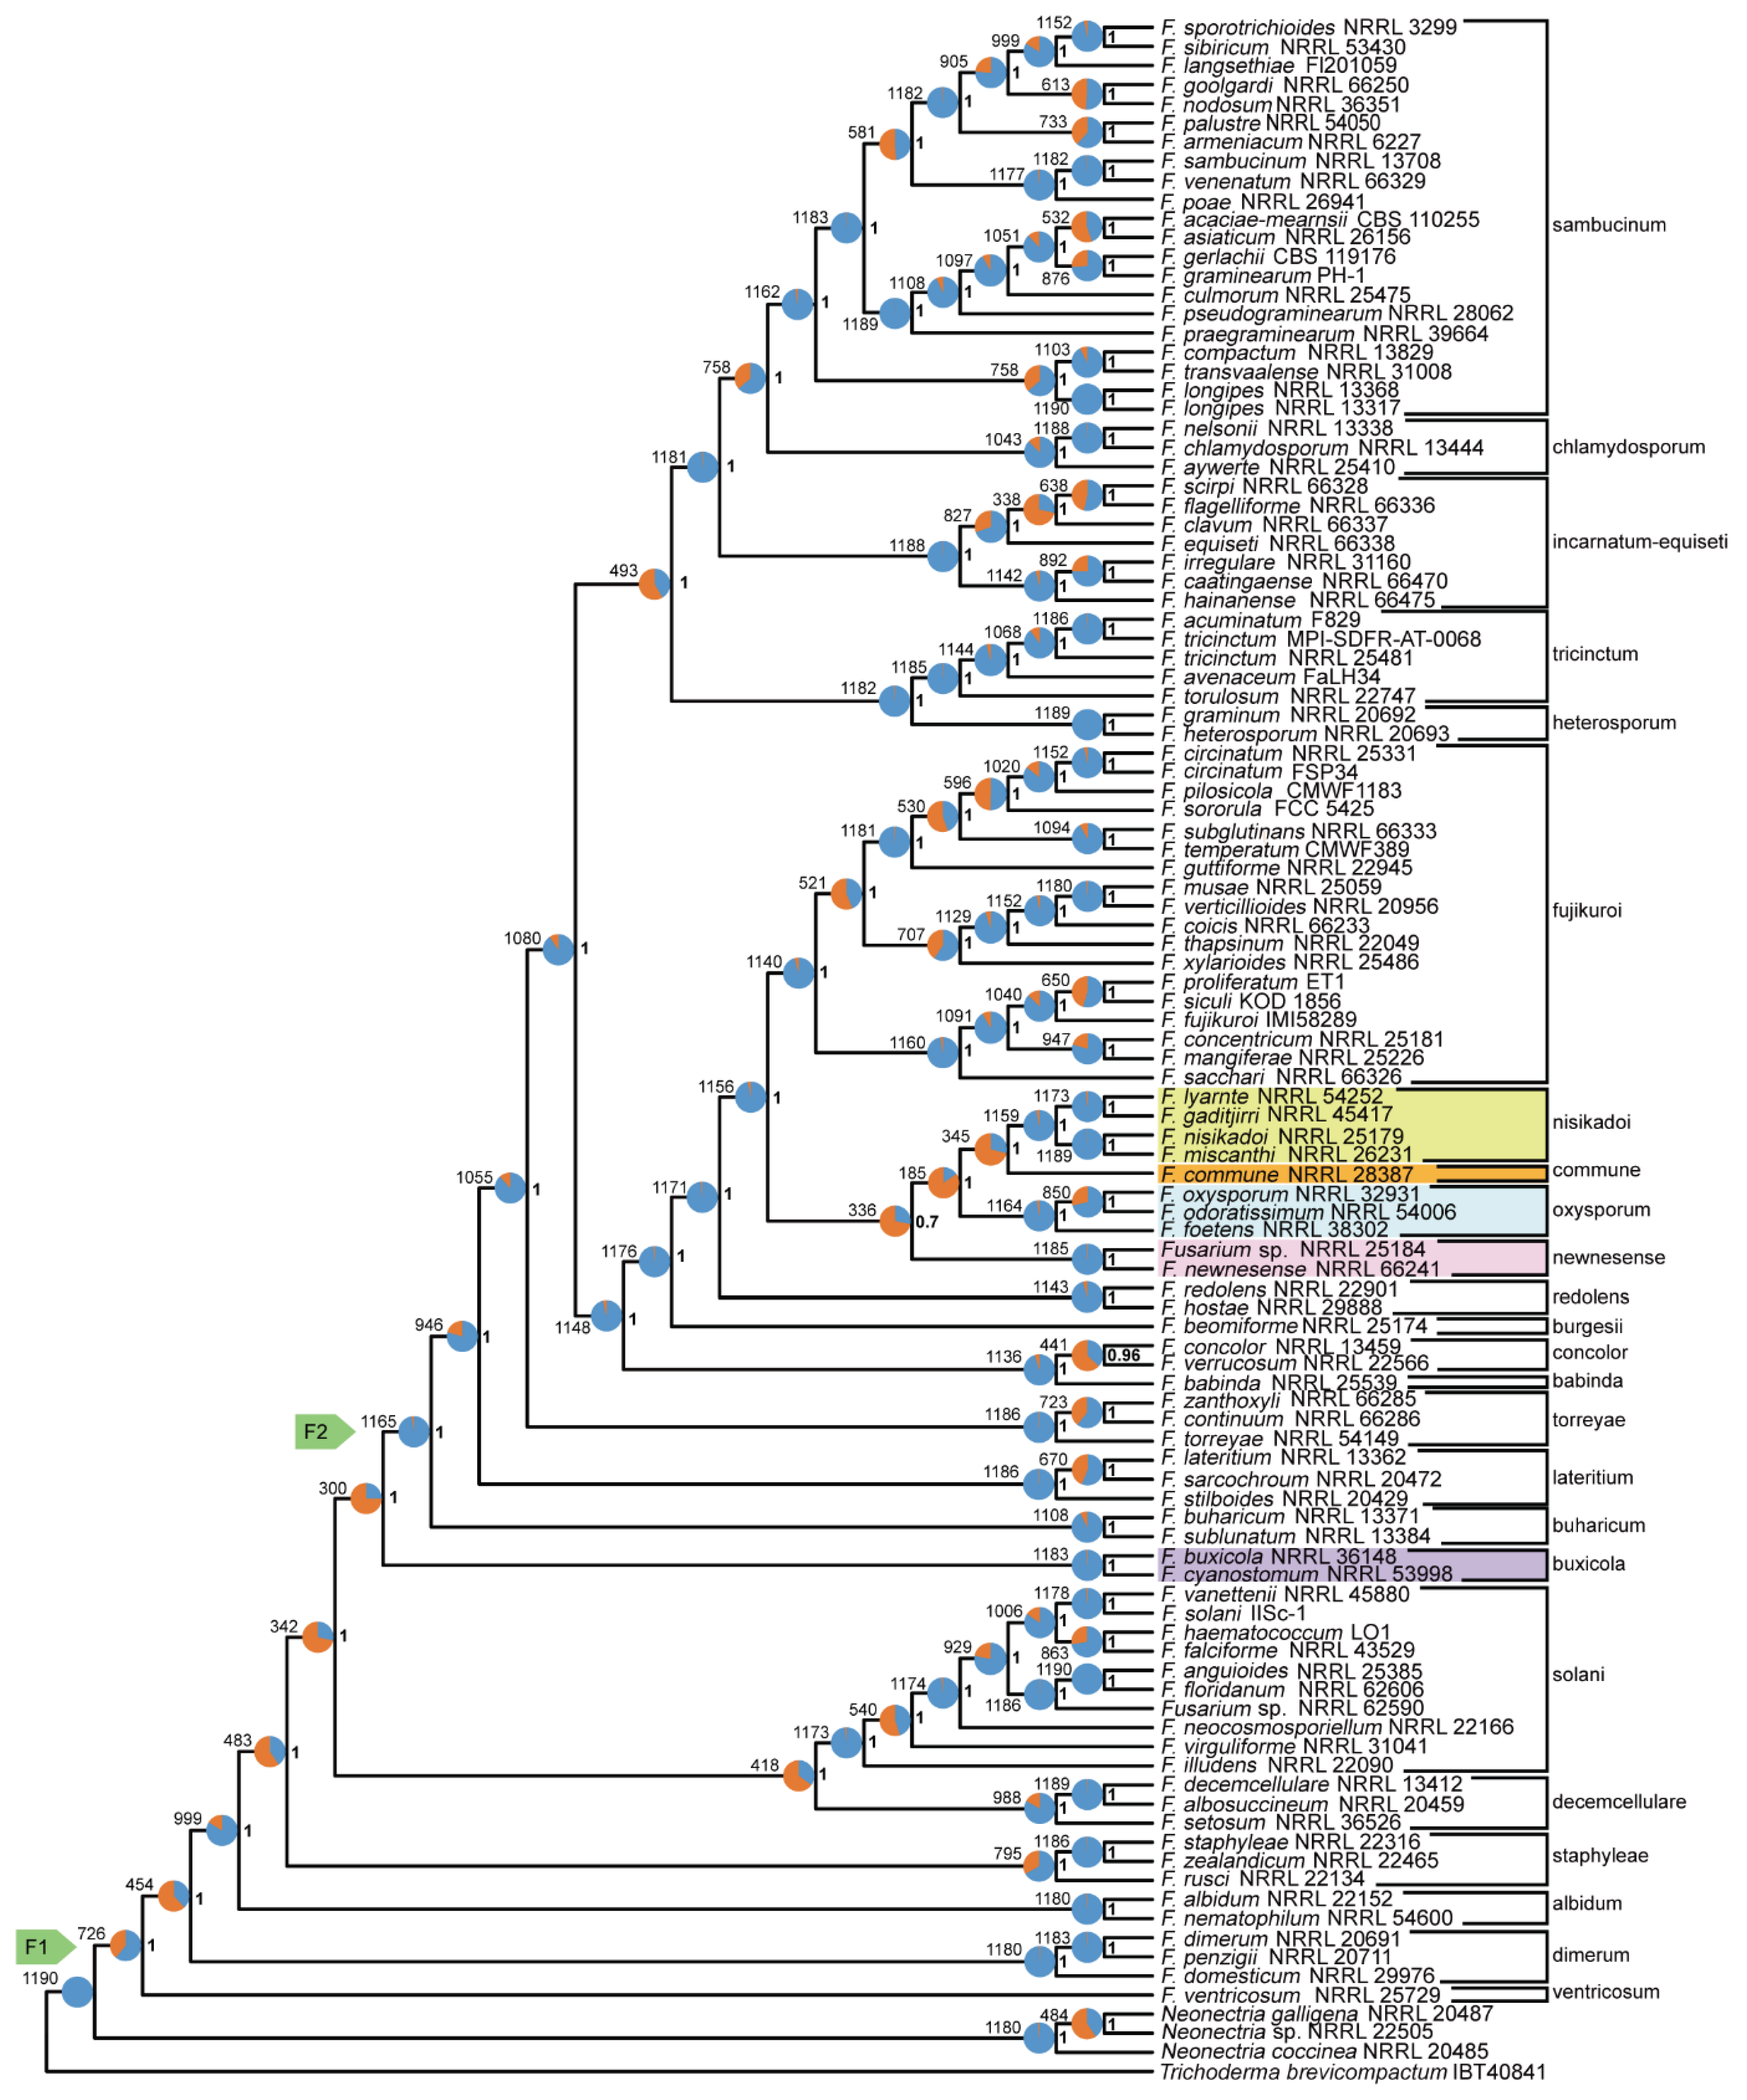
The analysis indicated that the F. nisikadoi SC is polyphyletic. In the phylogenetic tree based on the amino acid sequences obtained using concatenation (Figure 1) and coalescent approaches (Figure 2), F. commune, previously considered a member of the F. nisikadoi SC, was sister to the (F. foetens (F. odoratissimum, F. oxysporum)) clade, which corresponds to an F. oxysporum SC, but not to the F. nisikadoi SC. In both concatenation and coalescence-based analyses using nucleotide sequences, F. commune was found to be the most ancestral lineage within the F. nisikadoi SC (Figure 3 and Figure 4).
The branching order among F. newnesense, F. nisikadoi, and F. oxysporum SCs differed depending on the data type and analytical approach, as follows: the tree based on the concatenation approach using amino acid sequences was ((F. nisikadoi SC, F. newnesense SC), (F. oxysporum SC, F. commune)) (Figure 1); the tree based on the coalescent approach using amino acid sequences was (((F. oxysporum SC, F. commune), F. newnesense SC), F. nisikadoi SC) (Figure 2); the tree based on the concatenation approach using nucleotide sequences was ((F. nisikadoi SC, F. newnesense SC), F oxysporum SC) (Figure 3); the tree based on the coalescent approach using nucleotide sequences was ((F. nisikadoi SC, F. oxysporum SC), F. newnesense SC) (Figure 4). All internal branches were highly supported (bootstrap [BS] = 100; LPP = 1).
In addition, the phylogenetic position of F. buxicola differed among analyses. In the tree based on the coalescent approach using amino acid sequences, the F. buxicola SC was sister to the monophyletic group comprising F. solani and F. decemcellulare SCs. In the other analyses, the F. buxicola SC was placed between the monophyletic group consisting of F. solani, F. decemcellulare SC, and F. buharicum SC. The phylogenetic relationships of the remaining SCs were consistent across all analyses and the clades of these SCs were strongly supported.
3.3. Gene Tree Discordance
Bipartition analyses were conducted using phylogenetic trees inferred from concatenation- and coalescent-based approaches, based on both DNA and amino acid gene trees. The results confirmed the following phylogenetic uncertainties: 1) F. commune, 2) the three-SC group (F. nisikadoi SC, F. newnesense SC, and F. oxysporum SC), and 3) F. buxicola SC, which were observed to be incongruent across data types and analytical approaches, as described in the Phylogenetic Analysis section. Bipartition analyses focusing on these inconsistent branches are summarized below.
For the phylogenetic tree inferred from the amino acid data, bipartition analysis showed that 17.3% of the gene trees supported the clade comprising F. nisikadoi SC and F. oxysporum SC (Figure 5). Additionally, the topologies ((F. newnesense SC, (F. commune, F. oxysporum SC)), (F. nisikadoi SC, (F. newnesense SC, (F. commune, F. oxysporum SC))), and (F. buxicola SC, (F. decemcellulare SC, F. solani SC)) were supported by 9.8%, 12.4%, and 9.1% of the gene trees, respectively. The concordance rate calculated using ASTRAL III based on quartet trees from the amino acid data supported these results (lanes 3, 8, and 23 in Supplementary Figure S2; lines 3, 8, and 23 of Supplementary Table S4).
For the phylogenetic tree based on DNA data, bipartition analysis revealed that 28.4% of the gene trees supported the clade comprising F. commune and F. nisikadoi SC (Figure 5). Additionally, the topologies ((F. commune, F. nisikadoi SC), F. oxysporum SC), (F. newnesense SC, ((F. nisikadoi SC, F. commune), F. oxysporum SC)), and (F. buxicola SC and Fusarium sensu stricto) were supported by 15.5%, 25.2%, and 27.8% of the gene trees, respectively. The concordance rate, calculated using the ASTRAL III program based on quartet trees from the DNA data, supported these results (lanes 1, 4, and 7 in Supplementary Figure S3, lines 1, 4, and 7 in Supplementary Table S5).
3.4. Polytomy Test
The polytomy test confirmed an unreliable branching order among the (F. nisikadoi SC and F. commune), F. oxysporum SC, and F. newnesense SC clades in the DNA-based coalescent tree. Polytomy was detected among these relationships, with a high p-value of 0.46 (Figure 4).
4. Discussion
4.1. Phylogenetic Reconstruction
Phylogenetic inference using concatenation- and coalescent-based approaches, based on genomic data for various groups of organisms, is now widely used. Concatenation-based phylogenetic analysis is a scaled-up version of traditional multigene analysis, which is automated and utilizes large amounts of data. Therefore, errors, such as paralogous gene sampling and missing data, are typical. However, because these errors occur randomly and infrequently, they tend to be averaged across the dataset, resulting in phylogenetic trees with a high statistical significance.
Nevertheless, recent empirical observations of gene tree discordance, that is, cases in which genes have different evolutionary histories, have shown that the traditional concatenation approach [41] cannot fully account for such discordance among gene trees inferred from phylogenetic data. Consequently, several studies applied coalescent-based methods.
However, because the choice between coalescent- and concatenation-based approaches remains controversial regarding the accuracy of species tree estimation [2,42], both methods were used in the current study. Using both DNA and amino acid data, genome-scale phylogenetic trees were reconstructed to evaluate the monophyly of Fusarium SCs and their evolutionary relationships. Comparisons between concatenation- and coalescent-based phylogenetic trees revealed differences in the branching order of certain evolutionary lineages. Likewise, comparisons between DNA- and amino acid-based phylogenetic trees showed topological incongruence (Figure 1, Figure 2, Figure 3 and Figure 4, Supplementary Figure S1). Both trees had high statistical support for internal branches.
4.2. Evaluation of Monophyly of Species Complexes
Phylogenetic analysis showed that 22 of the 23 SCs were monophyletic (Figure 1, Figure 2, Figure 3 and Figure 4). F. nisikadoi SC was the only polyphyletic SC in the phylogenetic trees, based on both concatenation and coalescence approaches using amino acid data (Figure 1 and Figure 2). Additionally, in trees based on the both approaches using DNA data, F. commune was the most ancestral lineage within the F. nisikadoi SC (Figure 3 and Figure 4). Bipartition analysis revealed incongruence between the coalescent-based tree and most gene trees at the branch, including F. commune and other species of the F. nisikadoi SC (Figure 6). To date, no report has addressed the relationship between F. nisikadoi SC and F. commune, which has been shown to be polyphyletic with F. nisikadoi SC species in phylogenetic trees based on the elongation factor α (tef1α) gene [43] and RPB1 and RPB2 [44]. Subsequently, Geiser et al. [8] included F. commune in the F. nisikadoi SC based on phylogenetic analysis of 19 genes, and Crous et al. [45] included F. commune in the F. nisikadoi SC based on concatenated data for tef1α, RPB1, and RPB2. However, F. commune appears to be the most ancestral lineage within the F. nisikadoi SC in both these reports and in the DNA-based analyses of the current study. Considering these previous findings and our results, F. commune should be regarded as being independent of other SCs.
4.3. Evolutionary History of Species Complexes
Phylogenetic analysis showed that the evolutionary histories of 19 of 23 SCs were consistent among all analyses, with high branch support (Figure 1, Figure 2, Figure 3 and Figure 4). Nevertheless, these phylogenetic relationships differ from those reported in previous studies of concatenation-based DNA data [9]. Regarding the relationships among F. newnesense, F. nisikadoi, and F. oxysporum SCs, Gomez-Chavarria et al. [9] suggested that F. oxysporum SC is the most ancestral lineage, followed by (F. nisikadoi SC and F. newnesense SC) branches with high support. However, the topologies obtained in the current study differed from those of Gomez-Chavarria et al. [9], except for the tree derived from the concatenation approach using DNA data, which used the same data type and method (Figure 1, Figure 2, Figure 3 and Figure 4, Supplementary Figure S1). Therefore, the branching order among F. newnesense SC, F. nisikadoi SC, F. commune, and F. oxysporum SC could not be resolved.
Additionally, the polytomy test based on DNA data indicated that the F. newnesense SC, (F. nisikadoi SC, F. commune), and F. oxysporum SC formed a polytomy (Figure 4). This suggests that these three groups diverged within a narrow temporal window, which made it difficult to determine the precise branching sequence. Similar issues have been observed in mbuna cichlids, where different analyses have yielded conflicting divergence patterns, even with whole-genome sequence data [46]. Hard polytomy was detected using the ASTRAL polytomy test, further illustrating the difficulty of inferring the evolutionary order in rapidly radiating groups using molecular data alone. Similar to the findings of Scherz et al. [46] in mbuna cichlids, no definitive solution was observed to resolve the branching order among F. newnesense SC, F. nisikadoi SC, F. commune, and F. oxysporum SC. Therefore, maintaining this relationship through polytomy is appropriate.
Regarding phylogenetic relationships outside Fusarium s. str., the branching orders of most SCs were consistent among analyses, except for the position of the F. buxicola SC. Three phylogenetic trees constructed using the concatenation approach with both DNA and amino acid data, as well as the coalescence approach with amino acid data, indicated that the F. buxicola SC is a sister group to Fusarium s. str. clade. However, one tree based on the coalescent approach with amino acid data showed the F. buxicola SC as a sister to the (F. solani SC, F. decemcellulare SC) clade. In both cases, the branches of the clade comprising the F. buxicola SC clade and its sister group were highly supported (100%) and LPPs (0.95 and 1.0). Nonetheless, the proportion of branching patterns inconsistent with the coalescent-based tree was higher according to bipartition analysis (Figure 5). Furthermore, the main topology had a lower proportion than the alternative topologies in the quartet tree-based concordance analysis (Supplementary Figure S2 and Supplementary Table S4), confirming the inconsistency between the analyses. Although the majority of evidence supports the placement of the F. buxicola SC as a sister group to the Fusarium s. str. clade, additional analyses will be necessary to clarify the precise branching order.
4.4. Boundary of the Genus Fusarium
In all analyses, both the terminal Fusarium and Fusarium s. str. clades were monophyletic with high branch support (Figure 1, Figure 2, Figure 3 and Figure 4; BS = 100%, LPP = 1). No polytomies were observed within these branches (Figure 2 and Figure 4). Bipartition analyses further showed that 1,123/1,190 genes in the ASTRAL tree based on the amino acid data (Figure 5) and 1,165/1,190 genes in the ASTRAL tree based on DNA data (Figure 6) supported the divergence of the Fusarium s. str. clade. These results indicate that Fusarium s. str. represents an evolutionarily independent. This conclusion aligns with the findings of O’Donnell et al. [7], Geiser et al. [8], and Gomez-Chavarria et al. [9].
Regarding the taxonomic boundary of Fusarium, Lombard et al. [47] delimited Fusarium to correspond to Fusarium s. str. clade, emphasizing the distinct teleomorph morphologies among the independent Fusarium genera. Conversely, O’Donnell et al. [7] and Geiser et al. [8] argued that F. solani SC should be included in Fusarium, as the terminal Fusarium clade including F. solani SC is well supported, and F. solani SC represents an important group of human pathogenic fusaria. Furthermore, the number of teleomorphs identified was insufficient to justify genus-level separation based solely on teleomorphic traits.
To clarify the boundary of Fusarium, synapomorphies of terminal Fusarium and Fusarium s. str. clades should be examined further. If synapomorphy exists for the terminal Fusarium clade, the seven groups proposed by Lombard et al. [47] as separate genera should instead be treated as subgenera or species groups, or the terminal Fusarium clade may warrant subfamily status. Conversely, if a synapomorphy is found in the Fusarium s. str. clade, these seven Fusarium s. str. clades should be recognized as a single genus.
5. Conclusions
High-throughput sequencing has enabled the use of large gene sequence datasets for extensive taxon sampling. F. commune is independent of the F. nisikadoi SC, being polyphyletic based on amino acid data, while F. commune represents the most ancestral lineage within the F. nisikadoi SC based on DNA data. We observed that the branching order among the F. newnesense SC, F. nisikadoi SC, F. commune, and F. oxysporum SC could not be resolved because inconsistent topologies were obtained using different data types and approaches. Our findings provide new insights into the evolutionary history of SCs in Fusarium.
Although this study was conducted on a limited number of Fusarium species using reliable genome-scale data, future studies incorporating broader taxon sampling will enhance our understanding of the monophyly and evolutionary relationships among Fusarium species. Such expanded genomic research will deepen our evolutionary knowledge of this diverse fungal group, and support taxonomic refinement, and provide a stronger foundation for applied studies in agriculture, medicine, and biotechnology.
Supplementary Materials
The following supporting information can be downloaded at the website of this paper posted on Preprints.org, Figure S1: Comparison between (a) concatenation based trees based on DNA and protein data, (b) a concatenation based tree (DNA data) and an coalescent based tree (DNA data), (c) a concatenation based tree (DNA data) and an coalescent based tree (amino acid data), (d) a concatenation based tree (amino acid data) and an coalescent based tree (DNA data), (e) a concatenation based tree (amino acid data) and an coalescent based tree (amino acid data), and (f) coalescent based trees based on DNA and protein data.; Figure S2: Discordance rate of gene trees in a phylogenetic tree inferred by ASTRAL-III based on 1,190 gene trees con-structed using MEGA-CC based on protein data. Figure S3: Discordance rate of gene trees in a phylogenetic tree inferred by ASTRAL-III based on 1,190 gene trees constructed using MEGA-CC based on DNA sequence of the protein-coding region.; Table S1: GenBank accessions for genome sequence.; Table S2: Properties of datasets without alignment gaps for concatenation phylogenetic trees based on 1,190 genes in this study; Table S3: Properties of datasets without alignment gaps for genes used for phylogenetic analysis in this study.; Table S4: Discordance rate of gene trees based on amino acid data calculated with ASTRAL program. The column numbers correspond to those in Supplemental Figure S2.; Table S5: Discordance rate of gene trees based on DNA data calculated with ASTRAL program. The column numbers correspond to those in Supplemental Figure S3.
Author Contributions
Conceptualization, S.N. and K.W.; methodology, S.N. and Y.S.; validation, S.N.; formal analysis, S.N.; investigation, S.N.; data curation, S.N.; writing—original draft preparation, S.N.; writ-ing—review and editing, S.N. and K.W.; visualization, S.N.; supervision, S.N.; project admin-istration, K.W.; funding acquisition, K.W. All authors have read and agreed to the published version of the manuscript.
Funding
This work was supported by the Science and Technology Research Partnership for Sustainable Development (SATREPS) in a collaboration between the Japan Science and Technology Agency (JST, JPMJSA2007) and the Japan International Cooperation Agency (JICA).
Institutional Review Board Statement
Not applicable.
Informed Consent Statement
Not applicable.
Data Availability Statement
The genomic data used in this study are available in the NCBI database with reference to the GenBank accession numbers in Supplementary Table S1.
Conflicts of Interest
The authors declare no conflict of interest.
Abbreviations
The following abbreviations are used in this manuscript:
| SC | species complex |
| LPP | local posterior probability |
| BS | bootstrap |
References
- Rokas, A.; Williams, B.L.; King, N.; Carroll, S.B. Genome-scale approaches to resolving incongruence in molecular phylogenies. Nature 2003, 425, 798–804. [Google Scholar] [CrossRef]
- Mirarab, S.; Reaz, R.; Bayzid, M.S.; Zimmermann, T.; Swenson, M.S.; Warnow, T. ASTRAL: genome-scale coalescent-based species tree estimation. Bioinformatics 2014, 30, i541–i548. [Google Scholar] [CrossRef]
- Folk, R.A.; Soltis, P.S.; Soltis, D.E.; Guralnick, R. New prospects in the detection and comparative analysis of hybridization in the tree of life. Am. J. Bot. 2018, 105, 364–375. [Google Scholar] [CrossRef]
- Sayyari, E.; Mirarab, S. Testing for polytomies in phylogenetic species trees using quartet frequencies. Genes 2018, 9, 132. [Google Scholar] [CrossRef]
- Owen, C.L.; Miller, G.L. Phylogenomics of the Aphididae: deep relationships between subfamilies clouded by gene tree discordance, introgression and the gene tree anomaly zone. Syst. Entomol. 2022, 47, 470–486. [Google Scholar] [CrossRef]
- Geiser, D.M.; Aoki, T.; Bacon, C.W.; Baker, S.E.; Bhattacharyya, M.K.; Brandt, M.E.; Brown, D.W.; Burgess, L.W.; Chulze, S.; Coleman, J.J.; M., *!!! REPLACE !!!*; et al. , Kang S., Kistler H.C., Kuldau G.A., Leslie J.F., Logrieco A., Lu G., Lysøe E., Ma L.J., McCormick S.P., Migheli Q., Moretti A., Munaut F., O'Donnell K., Pfenning L., Ploetz R.C., Proctor R.H., Rehner S.A., Robert V.A., Rooney A.P., Bin Salleh B., Scandiani M.M., Scauflaire J., Short D.P., Steenkamp E., Suga H., Summerell B.A., Sutton D.A., Thrane U., Trail F., Van Diepeningen A., Vanetten H.D., Viljoen A., Waalwijk C., Ward T.J., Wingfield M.J., Xu J.R., Yang X.B., Yli-Mattila T., Zhang N. 2013. One fungus, one name: defining the genus Fusarium in a scientifically robust way that preserves longstanding use. Phytopathology 2013, 103, 400–408. [Google Scholar]
- O’Donnell, K.; Al-Hatmi, A.M.S.; Aoki, T.; Brankovics, B.; Cano-Lira, J.F.; Coleman, J.J.; de Hoog, G.S.; Di Pietro, A.; Frandsen, R.J.N.; Geiser, D.M.; et al. No to Neocosmospora: phylogenomic and practical reasons for continued inclusion of the Fusarium solani species complex in the genus Fusarium. mSphere 2020, 5, e00810–e00820. [Google Scholar] [CrossRef] [PubMed]
- Geiser, D.M.; Al-Hatmi, A.M.S.; Aoki, T.; Arie, T.; Balmas, V.; Barnes, I.; Bergstrom, G.C.; Bhattacharyya, M.K.; Blomquist, C.L.; Bowden, R.L.; et al. Phylogenomic analysis of a 55.1-kb 19-gene dataset resolves a monophyletic Fusarium that includes the Fusarium solani species complex. Phytopathology 2021, 111, 1064–1079. [Google Scholar] [CrossRef] [PubMed]
- Gomez-Chavarria, D.A.; Rua-Giraldo, A.L.; Alzate, J.F. An evolutionary view of the Fusarium core genome. BMC Genom. 2024, 25, 304. [Google Scholar] [CrossRef]
- Jeffroy, O.; Brinkmann, H.; Delsuc, F.; Philippe, H. Phylogenomics: the beginning of incongruence? Trends Genet. 2006, 22, 225–231. [Google Scholar] [CrossRef] [PubMed]
- Gillung, J.P.; Winterton, S.L.; Bayless, K.M.; Khouri, Z.; Borowiec, M.L.; Yeates, D.; Kimsey, L.S.; Misof, B.; Shin, S.; Zhou, X.; et al. Anchored phylogenomics unravels the evolution of spider flies (Diptera, Acroceridae) and reveals discordance between nucleotides and amino acids. Mol. Phylogenet. Evol. 2018, 128, 233–245. [Google Scholar] [CrossRef]
- Jiang, X.; Edwards, S.V.; Liu, L. The multispecies coalescent model outperforms concatenation across diverse phylogenomic data sets. Syst. Biol. 2020, 69, 795–812. [Google Scholar] [CrossRef]
- Shen, X.X.; Steenwyk, J.L.; Rokas, A. Dissecting incongruence between concatenation- and quartet-based approaches in phylogenomic data. Syst. Biol. 2021, 70, 997–1014. [Google Scholar] [CrossRef]
- Lizcano Salas, A.F.; Duitama, J.; Restrepo, S.; Celis Ramírez, A.M. Phylogenomic approaches reveal a robust time-scale phylogeny of the Terminal Fusarium Clade. IMA Fungus 2024, 15, 13. [Google Scholar] [CrossRef] [PubMed]
- Aoki, T.; O’Donnell, K.; Ichikawa, K. Fusarium fractiflexum sp. nov. and two other species within the Gibberella fujikuroi species complex recently discovered in Japan that form aerial conidia in false heads. Mycoscience 2001, 42, 461–478. [Google Scholar] [CrossRef]
- Britz, H.; Couhnho, T.A.; Gordon, T.R.; Wingfield, M.J. Characterisation of the pitch canker fungus, Fusarium circinatum, from Mexico. S. Afr. J. Bot. 2001, 67, 609–614. [Google Scholar] [CrossRef]
- O’Donnell, K.; Rooney, A.P.; Proctor, R.H.; Brown, D.W.; McCormick, S.P.; Ward, T.J.; Frandsen, R.J.N.; Lysøe, E.; Rehner, S.A.; Aoki, T.; et al. Phylogenetic analyses of RPB1 and RPB2 support a Middle Cretaceous origin for a clade comprising all agriculturally and medically important fusaria. Fungal Genet. Biol. 2013, 52, 20–31. [Google Scholar] [CrossRef]
- O’Donnell, K.; Gräfenhan, T.; Laraba, I.; Busman, M.; Proctor, R.H.; Kim, H.S.; Wiederhold, N.P.; Geiser, D.M.; Seifert, K.A. Fusarium abutilonis and F. guadeloupense, two novel species in the Fusarium buharicum clade supported by multilocus molecular phylogenetic analyses. Mycologia 2022, 114, 682–696. [Google Scholar] [CrossRef] [PubMed]
- Maryani, N.; Lombard, L.; Poerba, Y.S.; Subandiyah, S.; Crous, P.W.; Kema, G.H.J. Phylogeny and genetic diversity of the banana fusarium wilt pathogen Fusarium oxysporum f. sp. cubense in the Indonesian centre of origin. Stud. Mycol. 2019, 92, 155–194. [Google Scholar] [CrossRef]
- Sandoval-Denis, M.; Swart, W.J.; Crous, P.W. New Fusarium species from the Kruger National Park, South Africa. MycoKeys 2018, (34), 63–92. [Google Scholar] [CrossRef]
- Degradi, L.; Tava, V.; Kunova, A.; Cortesi, P.; Saracchi, M.; Pasquali, M. Telomere to telomere genome assembly of Fusarium musae F31, causal agent of crown rot disease of banana. Mol. Plant Microbe Interact. 2021, 34, 1455–1457. [Google Scholar] [CrossRef]
- Duong, T.A.; Aylward, J.; Ametrano, C.G.; Poudel, B.; Santana, Q.C.; Wilken, P.M.; Martin, A.; Arun-Chinnappa, K.S.; de Vos, L.; DiStefano, I.; et al. IMA Genome-F15: draft genome assembly of Fusarium pilosicola, Meredithiella fracta, Niebla homalea, Pyrenophora teres hybrid WAC10721, and Teratosphaeria viscida. IMA Fungus 2021, 12, 30. [Google Scholar] [CrossRef]
- Laraba, I.; McCormick, S.P.; Vaughan, M.M.; Geiser, D.M.; O’Donnell, K. Phylogenetic diversity, trichothecene potential, and pathogenicity within the Fusarium sambucinum species complex. PLOS One 2021, 16, e0245037. [Google Scholar] [CrossRef]
- Rabaaoui, A.; Dall’Asta, C.; Righetti, L.; Susca, A.; Logrieco, A.F.; Namsi, A.; Gdoura, R.; Werbrouck, S.P.O.; Moretti, A.; Masiello, M. Phylogeny and mycotoxin profile of pathogenic Fusarium species isolated from sudden decline syndrome and leaf wilt symptoms on date palms (Phoenix dactylifera) in Tunisia. Toxins 2021, 13, 463. [Google Scholar] [CrossRef]
- Żelechowski, M.; Molcan, T.; Bilska, K.; Myszczyński, K.; Olszewski, J.; Karpiesiuk, K.; Wyrębek, J.; Kulik, T. Patterns of diversity of Fusarium fungi contaminating soybean grains. Toxins (Basel) 2021, 13, 884. [Google Scholar] [CrossRef] [PubMed]
- Spahr, E.J. Genetic Underpinnings of Novel Trait Development in a Euwallacea-Fusarium Mutualism; West Virginia University, 2022.
- Chen, Y.P.; Su, P.W.; Hyde, K.D.; Maharachchikumbura, S.S.N. Phylogenomics and diversification of Sordariomycetes. Mycosphere 2023, 14, 414–451. [Google Scholar] [CrossRef]
- Duan, Y.N.; Ma, S.R.; Chen, X.S.; Shen, X.; Yin, C.M.; Mao, Z.Q. Genome sequence resource of Fusarium proliferatum f. sp. malus domestica MR5, the causative agent of apple replant disease. Plant Dis. 2023, 107, 903–907. [Google Scholar] [CrossRef] [PubMed]
- Navasca, A.M.; Singh, J.; Rivera-Varas, V.; Gill, U.; Secor, G.; Baldwin, T.T. Dispensable genome and segmental duplications drive the genome plasticity in Fusarium solani. Front. Fungal Biol. 2025, 6, 1432339. [Google Scholar] [CrossRef] [PubMed]
- Nozawa, S.; Pangilinan, D.C.J.; Alvindia, D.G.; Watanabe, K. Specific PCR primer designed from genome data for rapid detection of Fusarium oxysporum f. sp. cubense tropical race 4 in the Cavendish banana. PLOS One. 2024, 19, e0313358. [Google Scholar] [CrossRef]
- Stanke, M.; Morgenstern, B. Augustus: a web server for gene prediction in eukaryotes that allows user-defined constraints. Nucleic Acids Res. 2005, 33, W465–W467. [Google Scholar] [CrossRef]
- Altschul, S.F.; Gish, W.; Miller, W.; Myers, E.W.; Lipman, D.J. Basic local alignment search tool. J. Mol. Biol. 1990, 215, 403–410. [Google Scholar] [CrossRef] [PubMed]
- Camacho, C.; Coulouris, G.; Avagyan, V.; Ma, N.; Papadopoulos, J.; Bealer, K.; Madden, T.L. Blast+: architecture and applications. BMC Bioinform. 2009, 10, 421. [Google Scholar] [CrossRef]
- Sievers, F.; Higgins, D.G. Clustal omega. Curr. Protoc. Bioinformatics 2014, 48, 3.13–1. [Google Scholar] [CrossRef]
- Capella-Gutiérrez, S.; Silla-Martínez, J.M.; Gabaldón, T. trimAl: a tool for automated alignment trimming in large-scale phylogenetic analyses. Bioinformatics 2009, 25, 1972–1973. [Google Scholar] [CrossRef]
- Steenwyk, J.L.; Buida, T.J.; Labella, A.L.; Li, Y.; Shen, X.X.; Rokas, A. PhyKIT: a broadly applicable UNIX shell toolkit for processing and analyzing phylogenomic data. Bioinformatics 2021, 37, 2325–2331. [Google Scholar] [CrossRef]
- Kumar, S.; Stecher, G.; Li, M.; Knyaz, C.; Tamura, K. MEGA X: Molecular evolutionary genetics analysis across computing platforms. Mol. Biol. Evol. 2018, 35, 1547–1549. [Google Scholar] [CrossRef]
- Stamatakis, A. RAxML-VI-HPC: maximum likelihood-based phylogenetic analyses with thousands of taxa and mixed models. Bioinformatics 2006, 22, 2688–2690. [Google Scholar] [CrossRef]
- Sayyari, E.; Mirarab, S. Fast coalescent-based computation of local branch support from quartet frequencies. Mol. Biol. Evol. 2016, 33, 1654–1668. [Google Scholar] [CrossRef]
- Smith, S.A.; Moore, M.J.; Brown, J.W.; Yang, Y. Analysis of phylogenomic datasets reveals conflict, concordance, and gene duplications with examples from animals and plants. BMC Evol. Biol. 2015, 15, 150. [Google Scholar] [CrossRef] [PubMed]
- de Queiroz, A.; Gatesy, J. The supermatrix approach to systematics. Trends Ecol. Evol. 2007, 22, 34–41. [Google Scholar] [CrossRef] [PubMed]
- Springer, M.S.; Gatesy, J. Land plant origins and coalescence confusion. Trends Plant Sci. 2014, 19, 267–269. [Google Scholar] [CrossRef] [PubMed]
- Summerell, B.A. Resolving Fusarium: current status of the genus. Annu. Rev. Phytopathol. 2019, 57, 323–339. [Google Scholar] [CrossRef]
- Laurence, M.H.; Summerell, B.A.; Burgess, L.W.; Liew, E.C.Y. Genealogical concordance phylogenetic species recognition in the Fusarium oxysporum species complex. Fungal Biol. 2014, 118, 374–384. [Google Scholar] [CrossRef]
- Crous, P.W.; Lombard, L.; Sandoval-Denis, M.; Seifert, K.A.; Schroers, H.J.; Chaverri, P.; Gené, J.; Guarro, J.; Hirooka, Y.; Bensch, K.; et al. Fusarium: more than a node or a foot-shaped basal cell. Stud. Mycol. 2021, 98, 100116. [Google Scholar] [CrossRef]
- Scherz, M.D.; Masonick, P.; Meyer, A.; Hulsey, C.D. Between a rock and a hard polytomy: phylogenomics of the rock-dwelling Mbuna Cichlids of Lake Malaŵi. Syst. Biol. 2022, 71, 741–757. [Google Scholar] [CrossRef] [PubMed]
- Lombard, L.; Van der Merwe, N.A.; Groenewald, J.Z.; Crous, P.W. Generic concepts in Nectriaceae. Stud. Mycol. 2015, 80, 189–245. [Google Scholar] [CrossRef] [PubMed]
Figure 1.
Phylogenetic trees constructed using the concatenation approach in RAxML with the amino acid sequences of 1,190 orthologous genes. Numbers above the internal nodes represent the maximum likelihood of bootstrap (BS) support. Node F1 is for the terminal Fusarium clade. Node F2 is for the Fusarium s. str. clade.
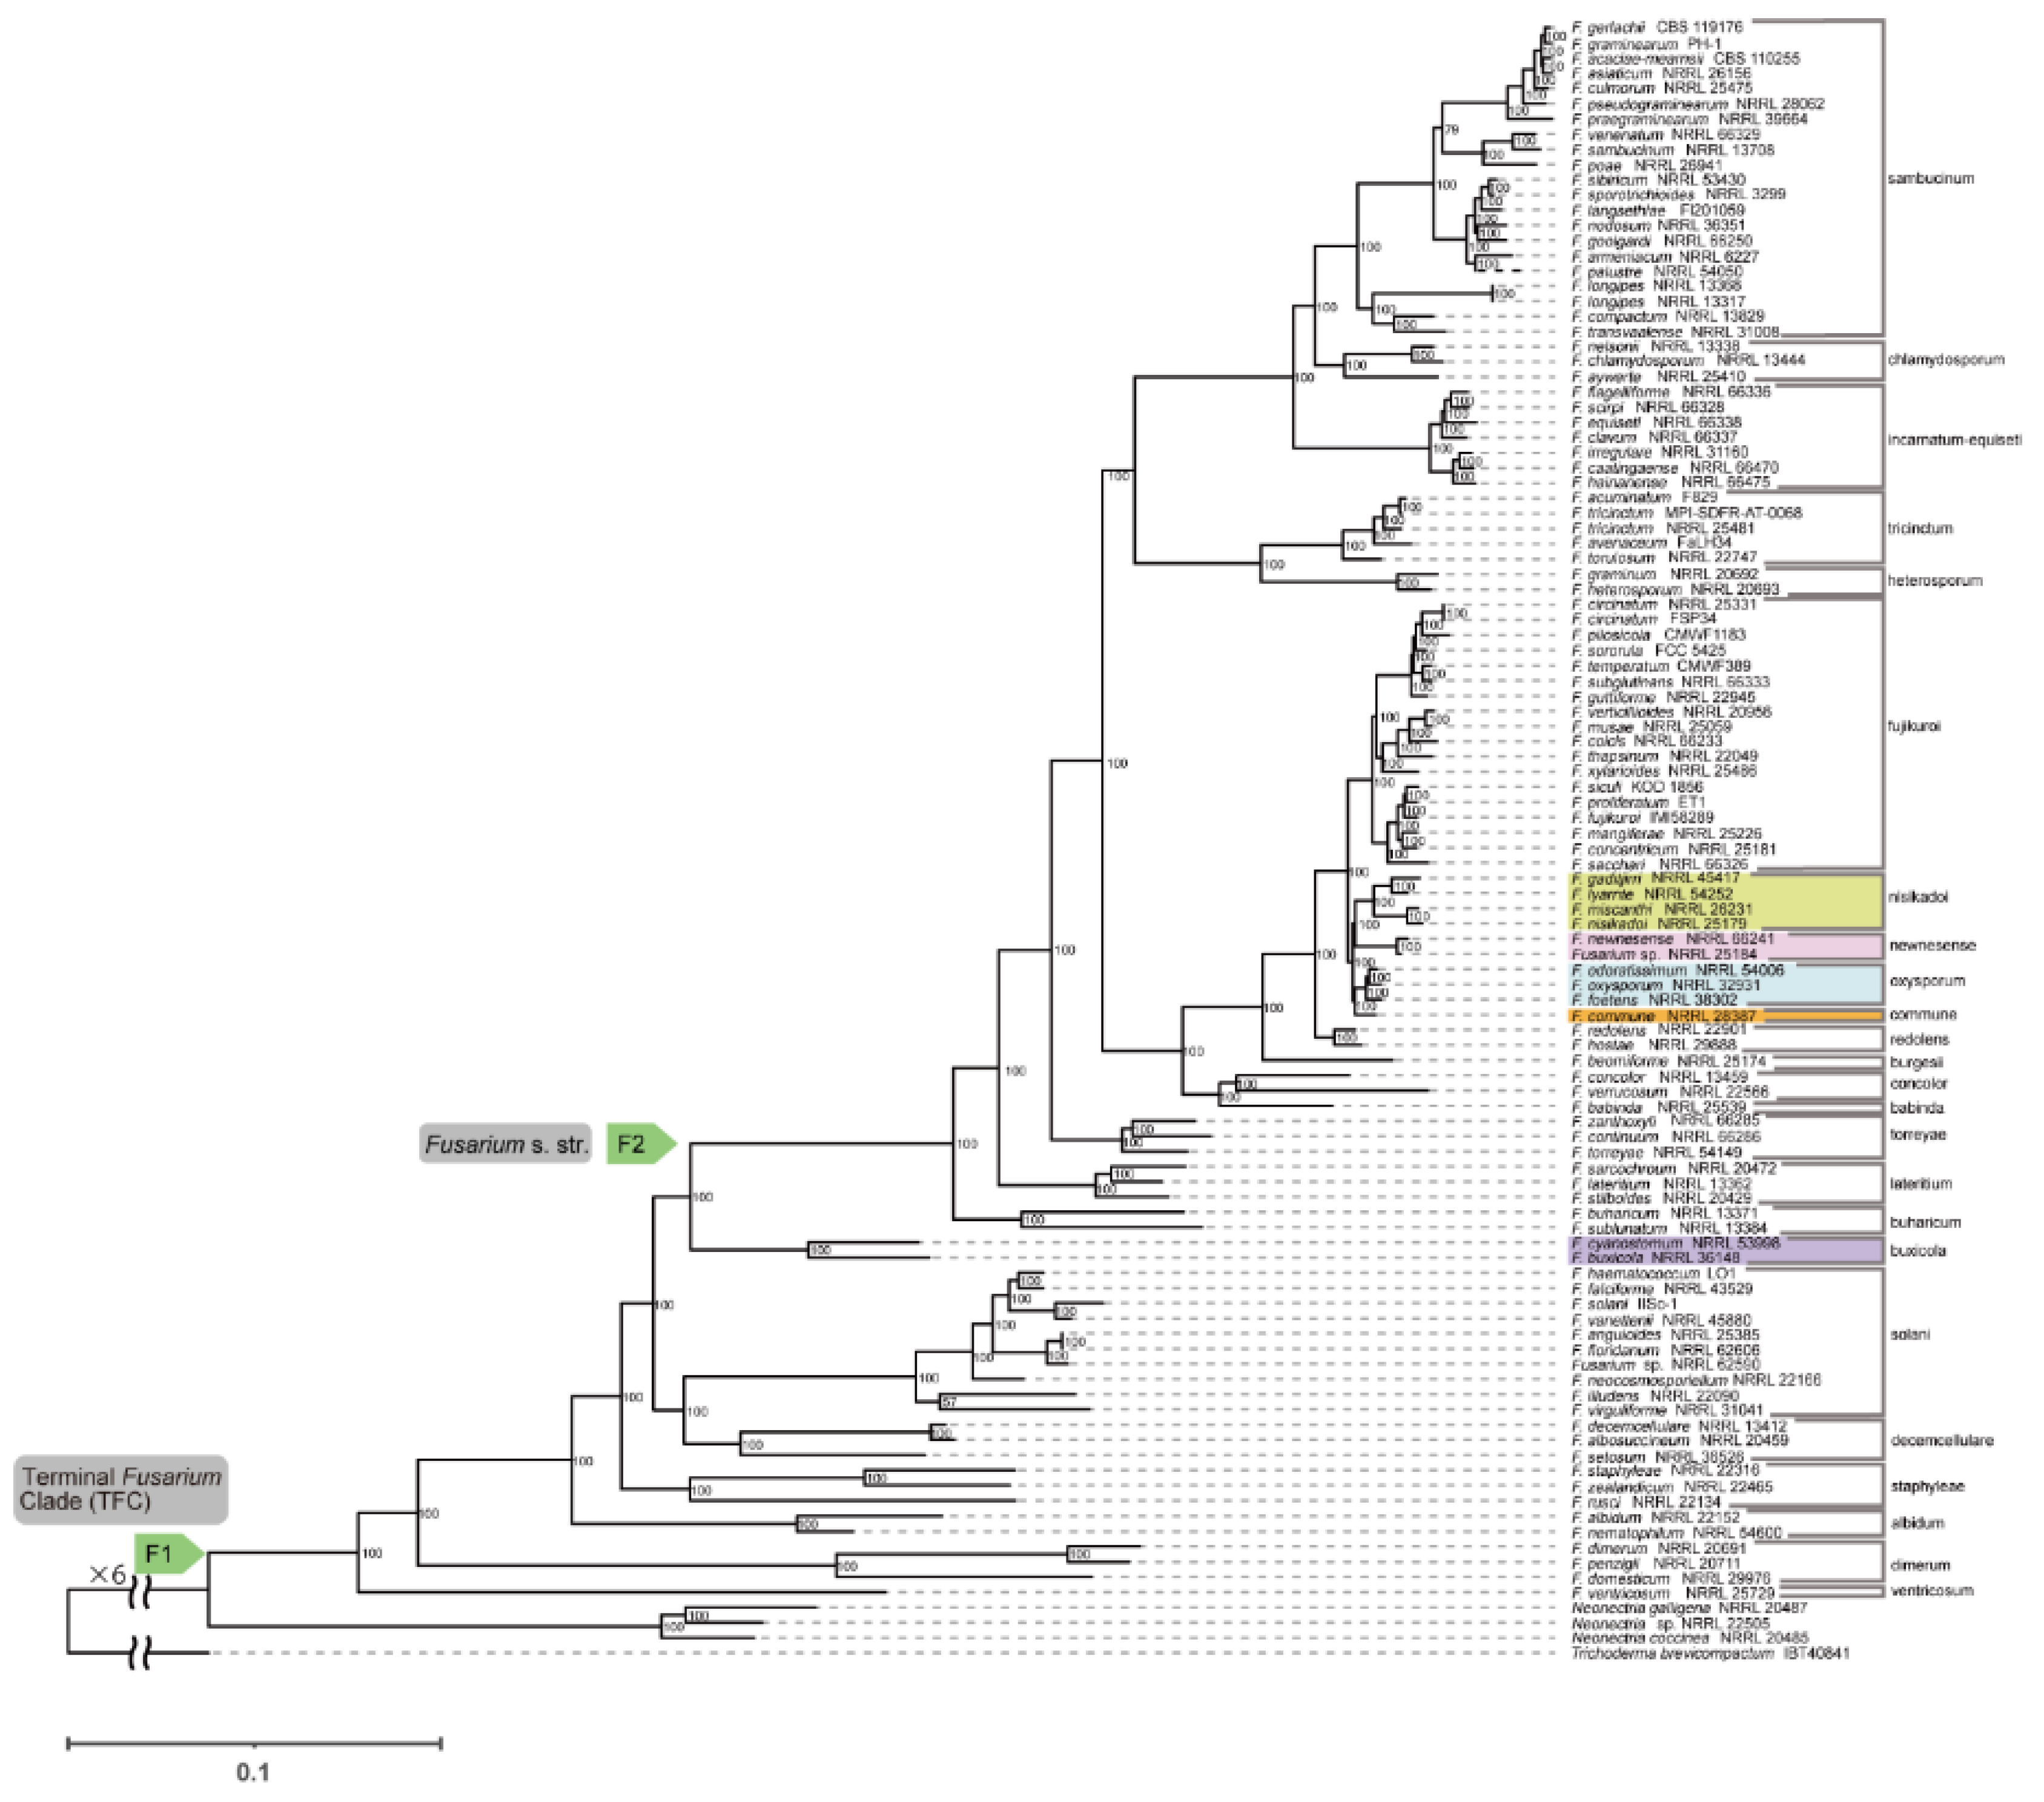
Figure 2.
Phylogenetic trees constructed using the coalescent approach in ASTRAL III with the amino acid sequences of 1,190 orthologous genes. Numbers above the internal nodes represent local posterior probability (LPP) support. Node F1 is for the terminal Fusarium clade. Node F2 is for the Fusarium s. str. clade.
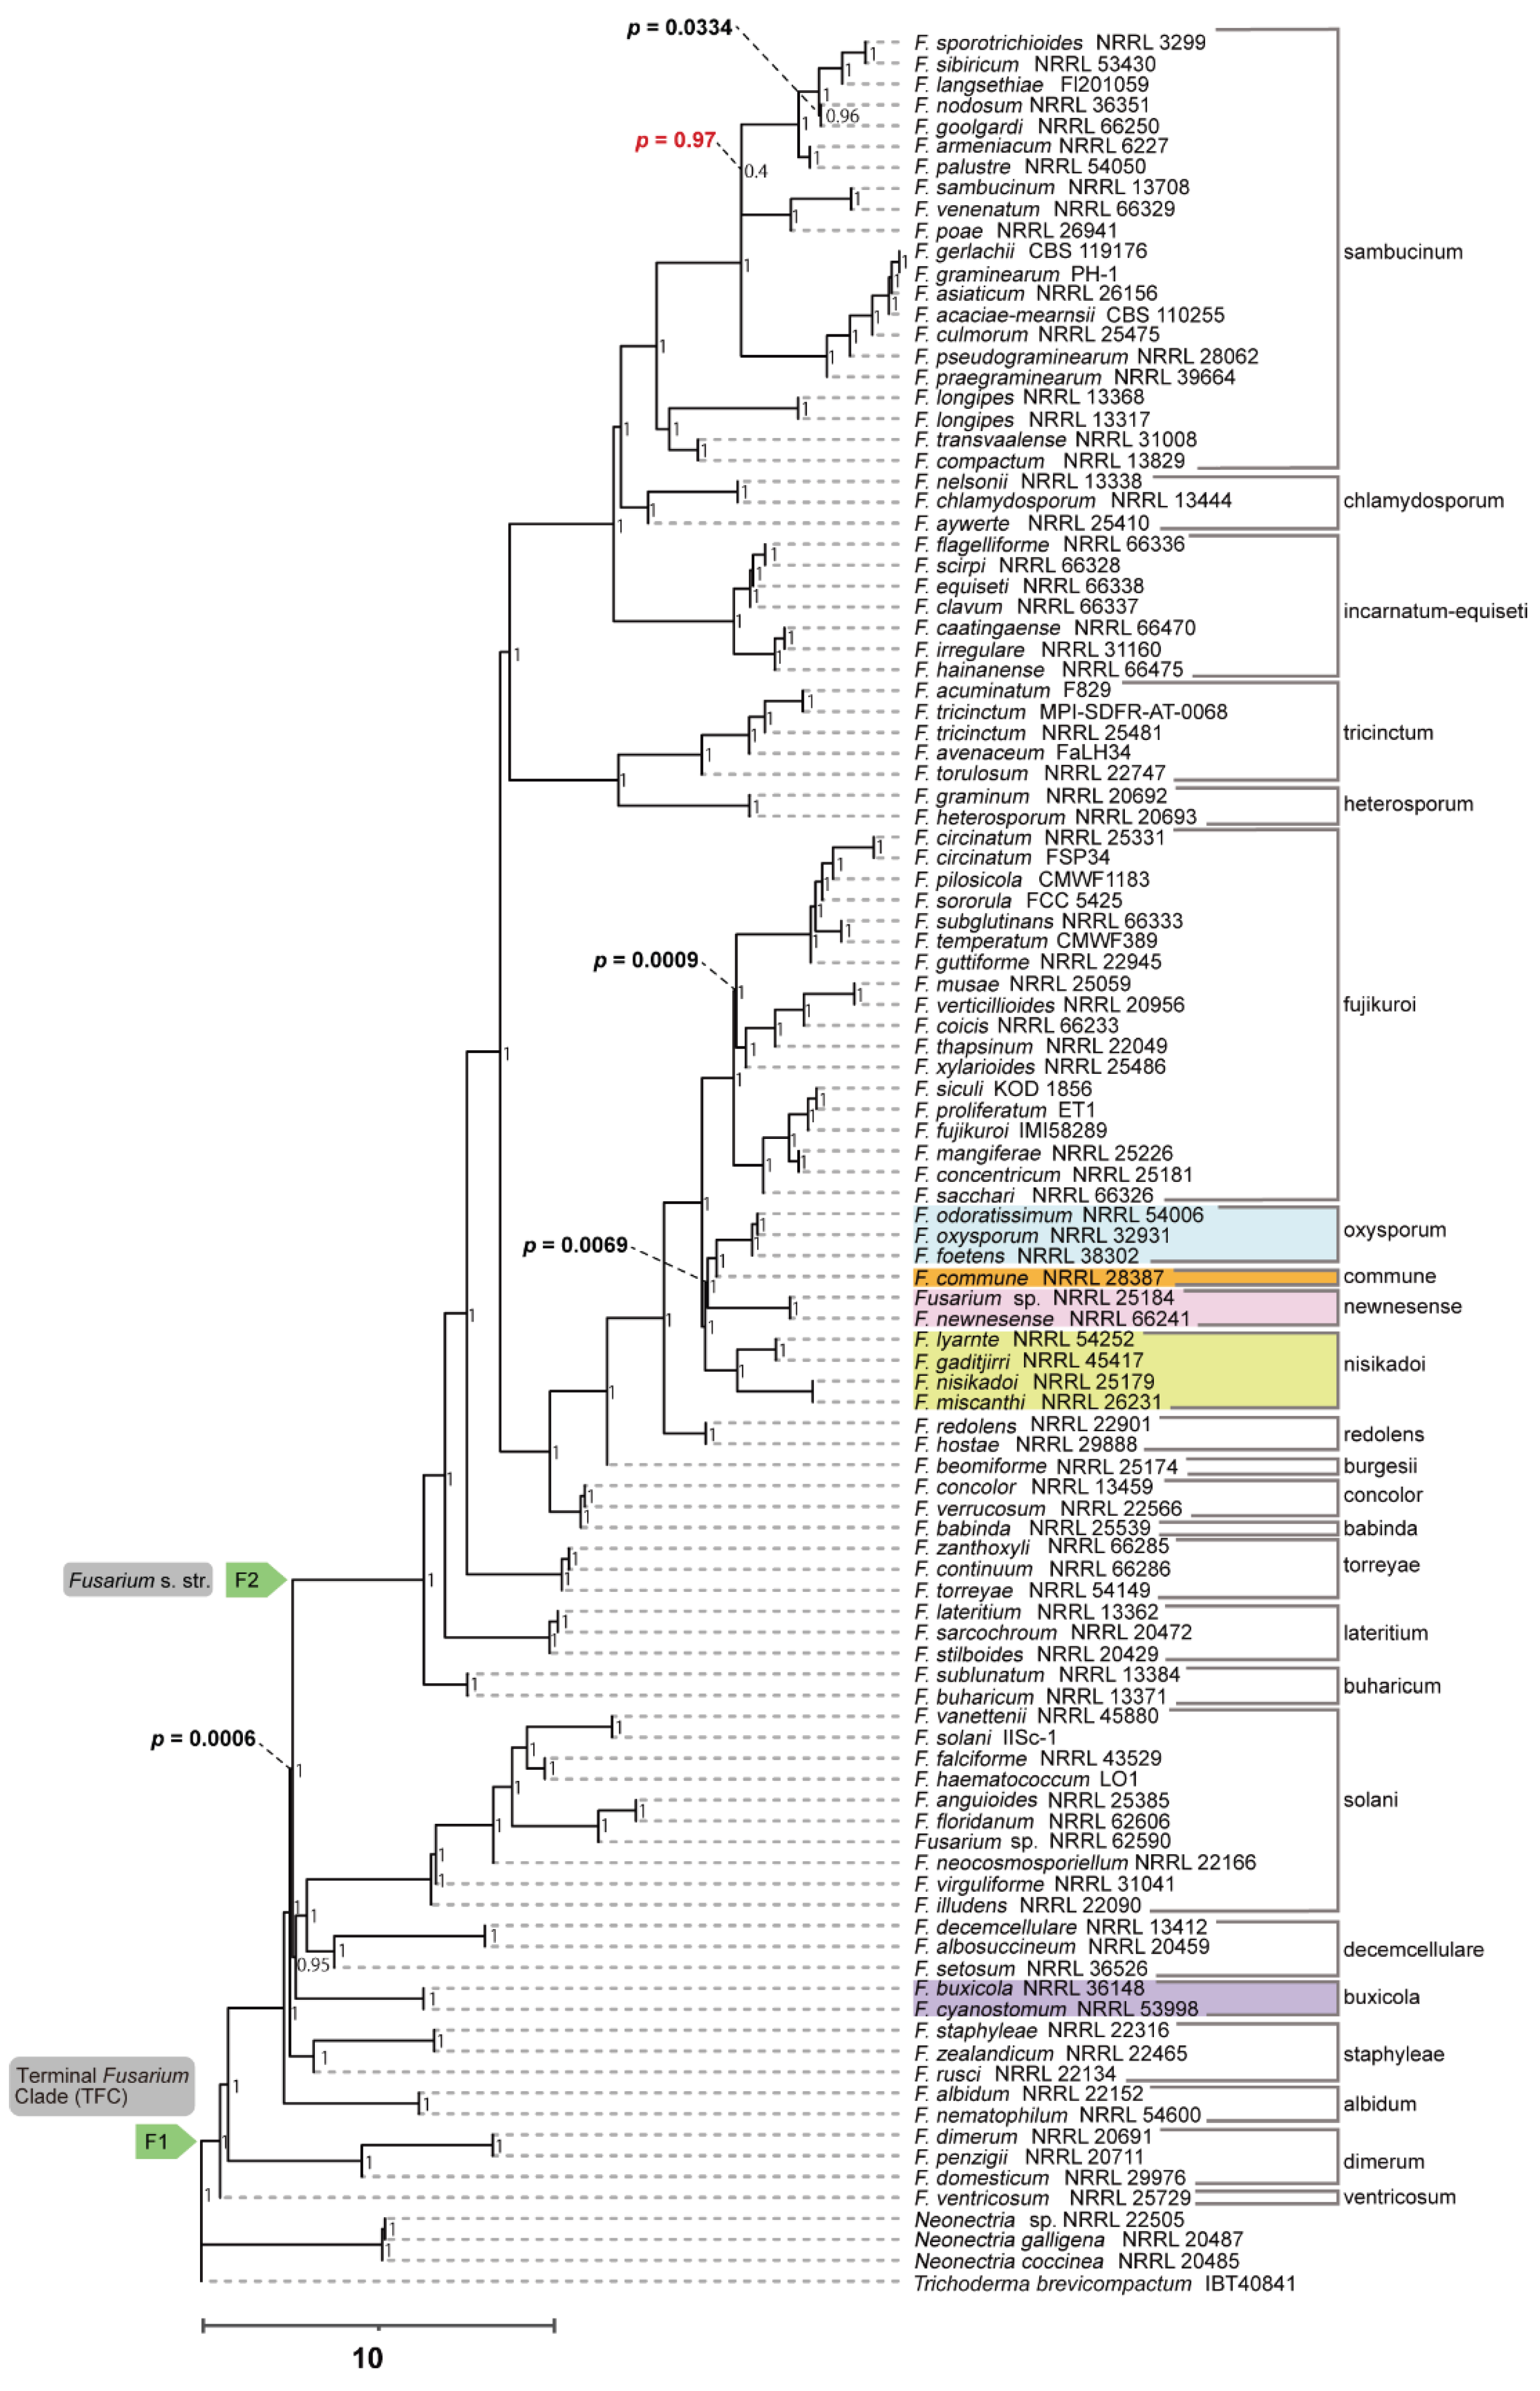
Figure 3.
Phylogenetic trees constructed using the concatenation approach in RAxML with the DNA sequences of 1,190 orthologous genes. Numbers above the internal nodes represent the maximum likelihood of bootstrap (BS) support. Node F1 is for the terminal Fusarium clade. Node F2 is for the Fusarium s. str. clade.
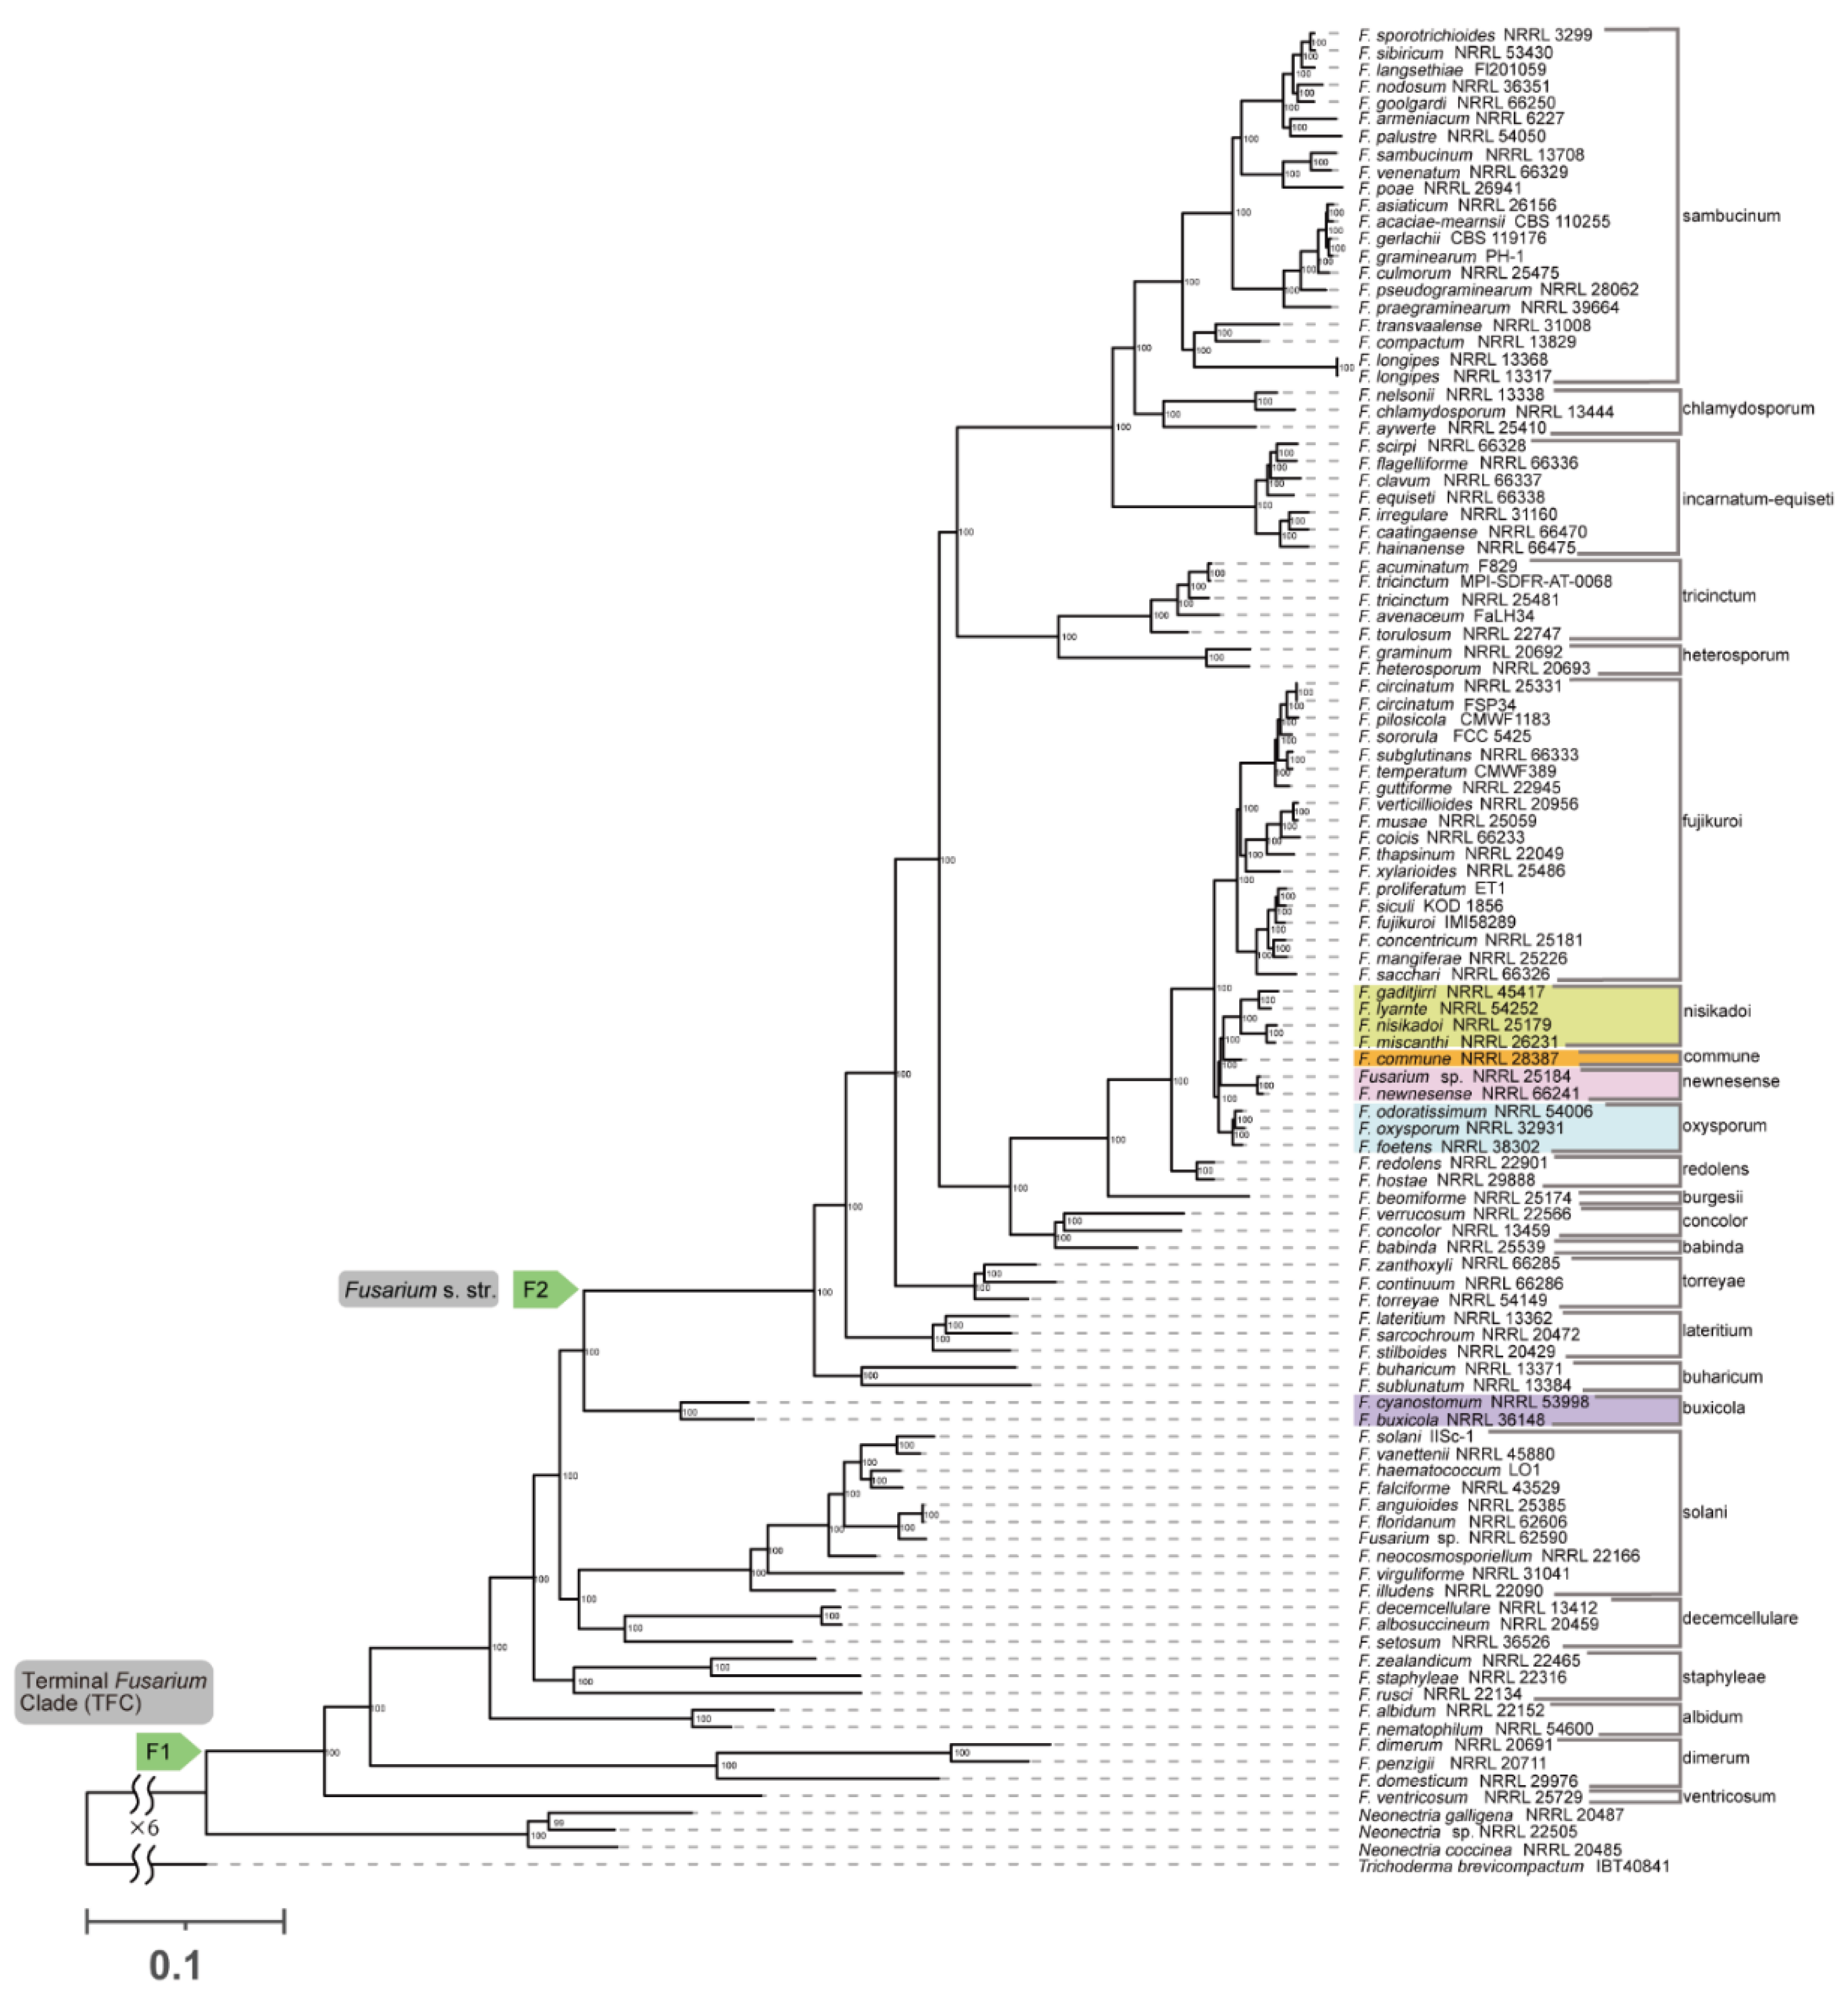
Figure 4.
Phylogenetic trees inferred using the coalescent approach in ASTRAL III with the DNA sequences of 1,190 orthologous genes. Numbers above the internal nodes represent local posterior probability (LPP) support. Node F1 is for the terminal Fusarium clade. Node F2 is for the Fusarium s. str. clade.
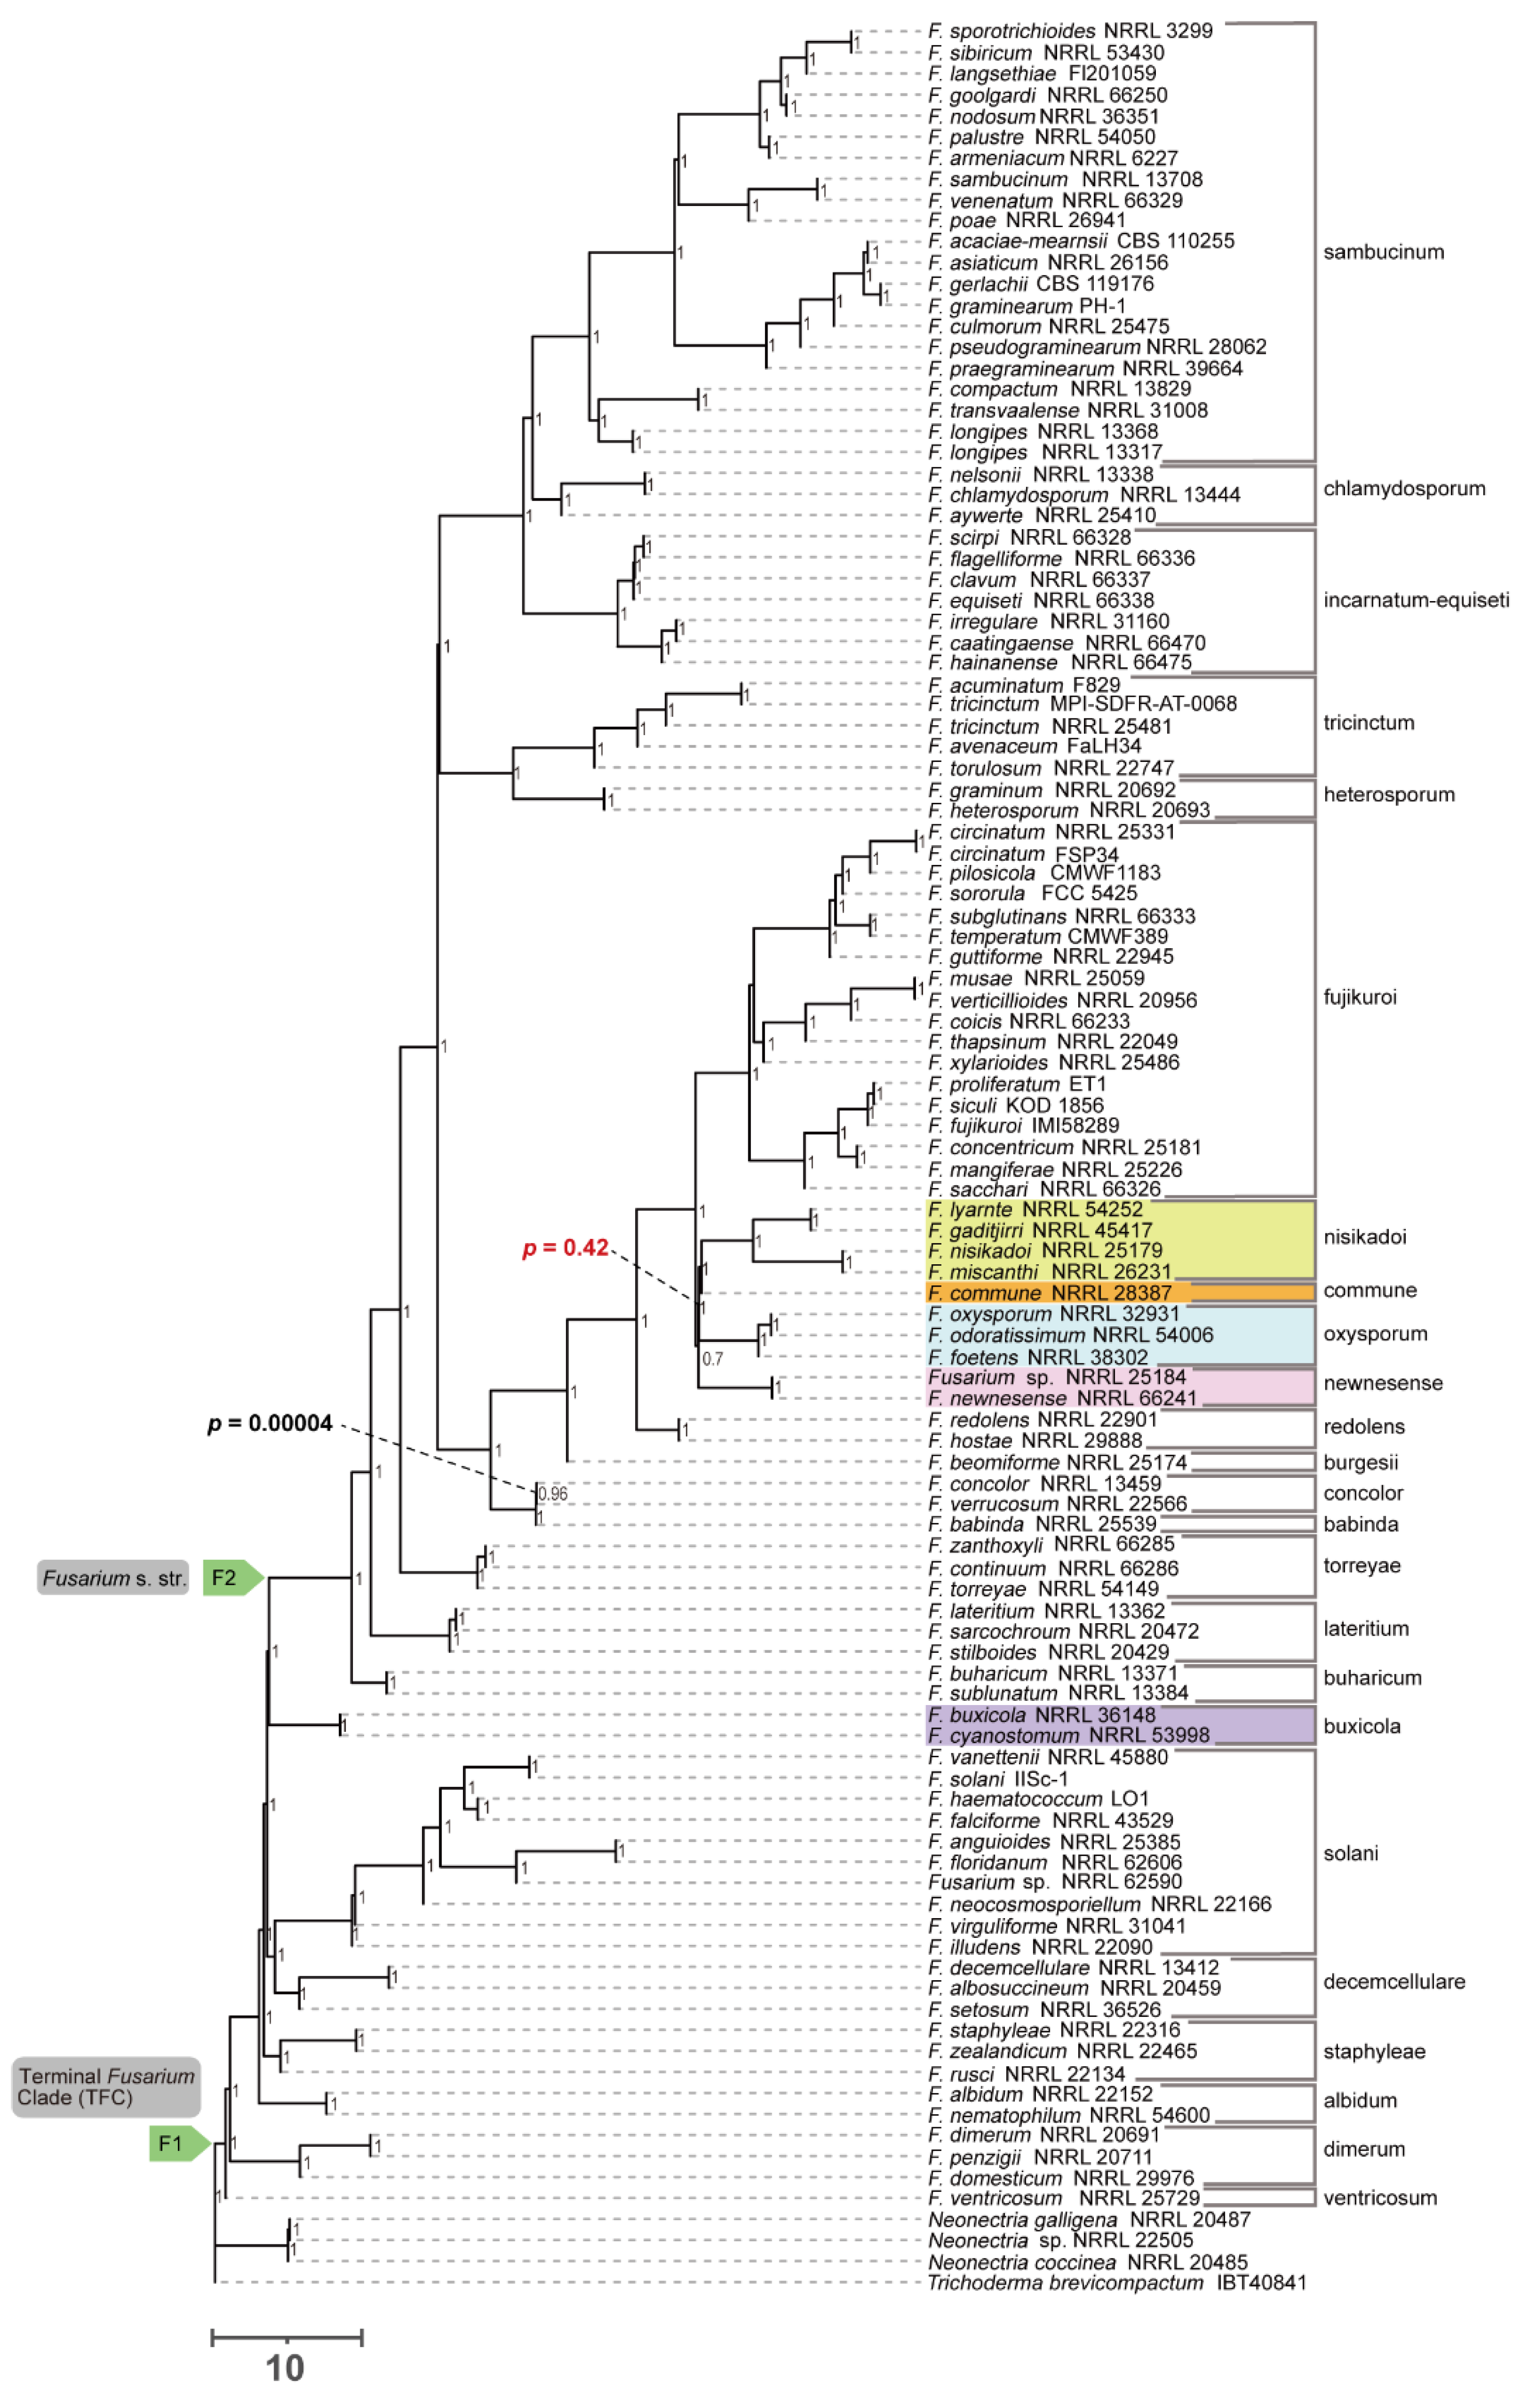
Figure 5.
Phylogenetic tree based on amino acid data of 1,190 genes using coalescent-approach analyzed with ASTRAL, with summary of conflicting and concordant homologs. For each branch, the top number indicates the number of homologs concordant with the species tree at that node. The pie charts at each node present the proportion of homologs that support that clade (blue) and the proportion that support the main alternative for that clade (orange). Node F1 is for the terminal Fusarium clade. Node F2 is for Fusarium s. str. clade.
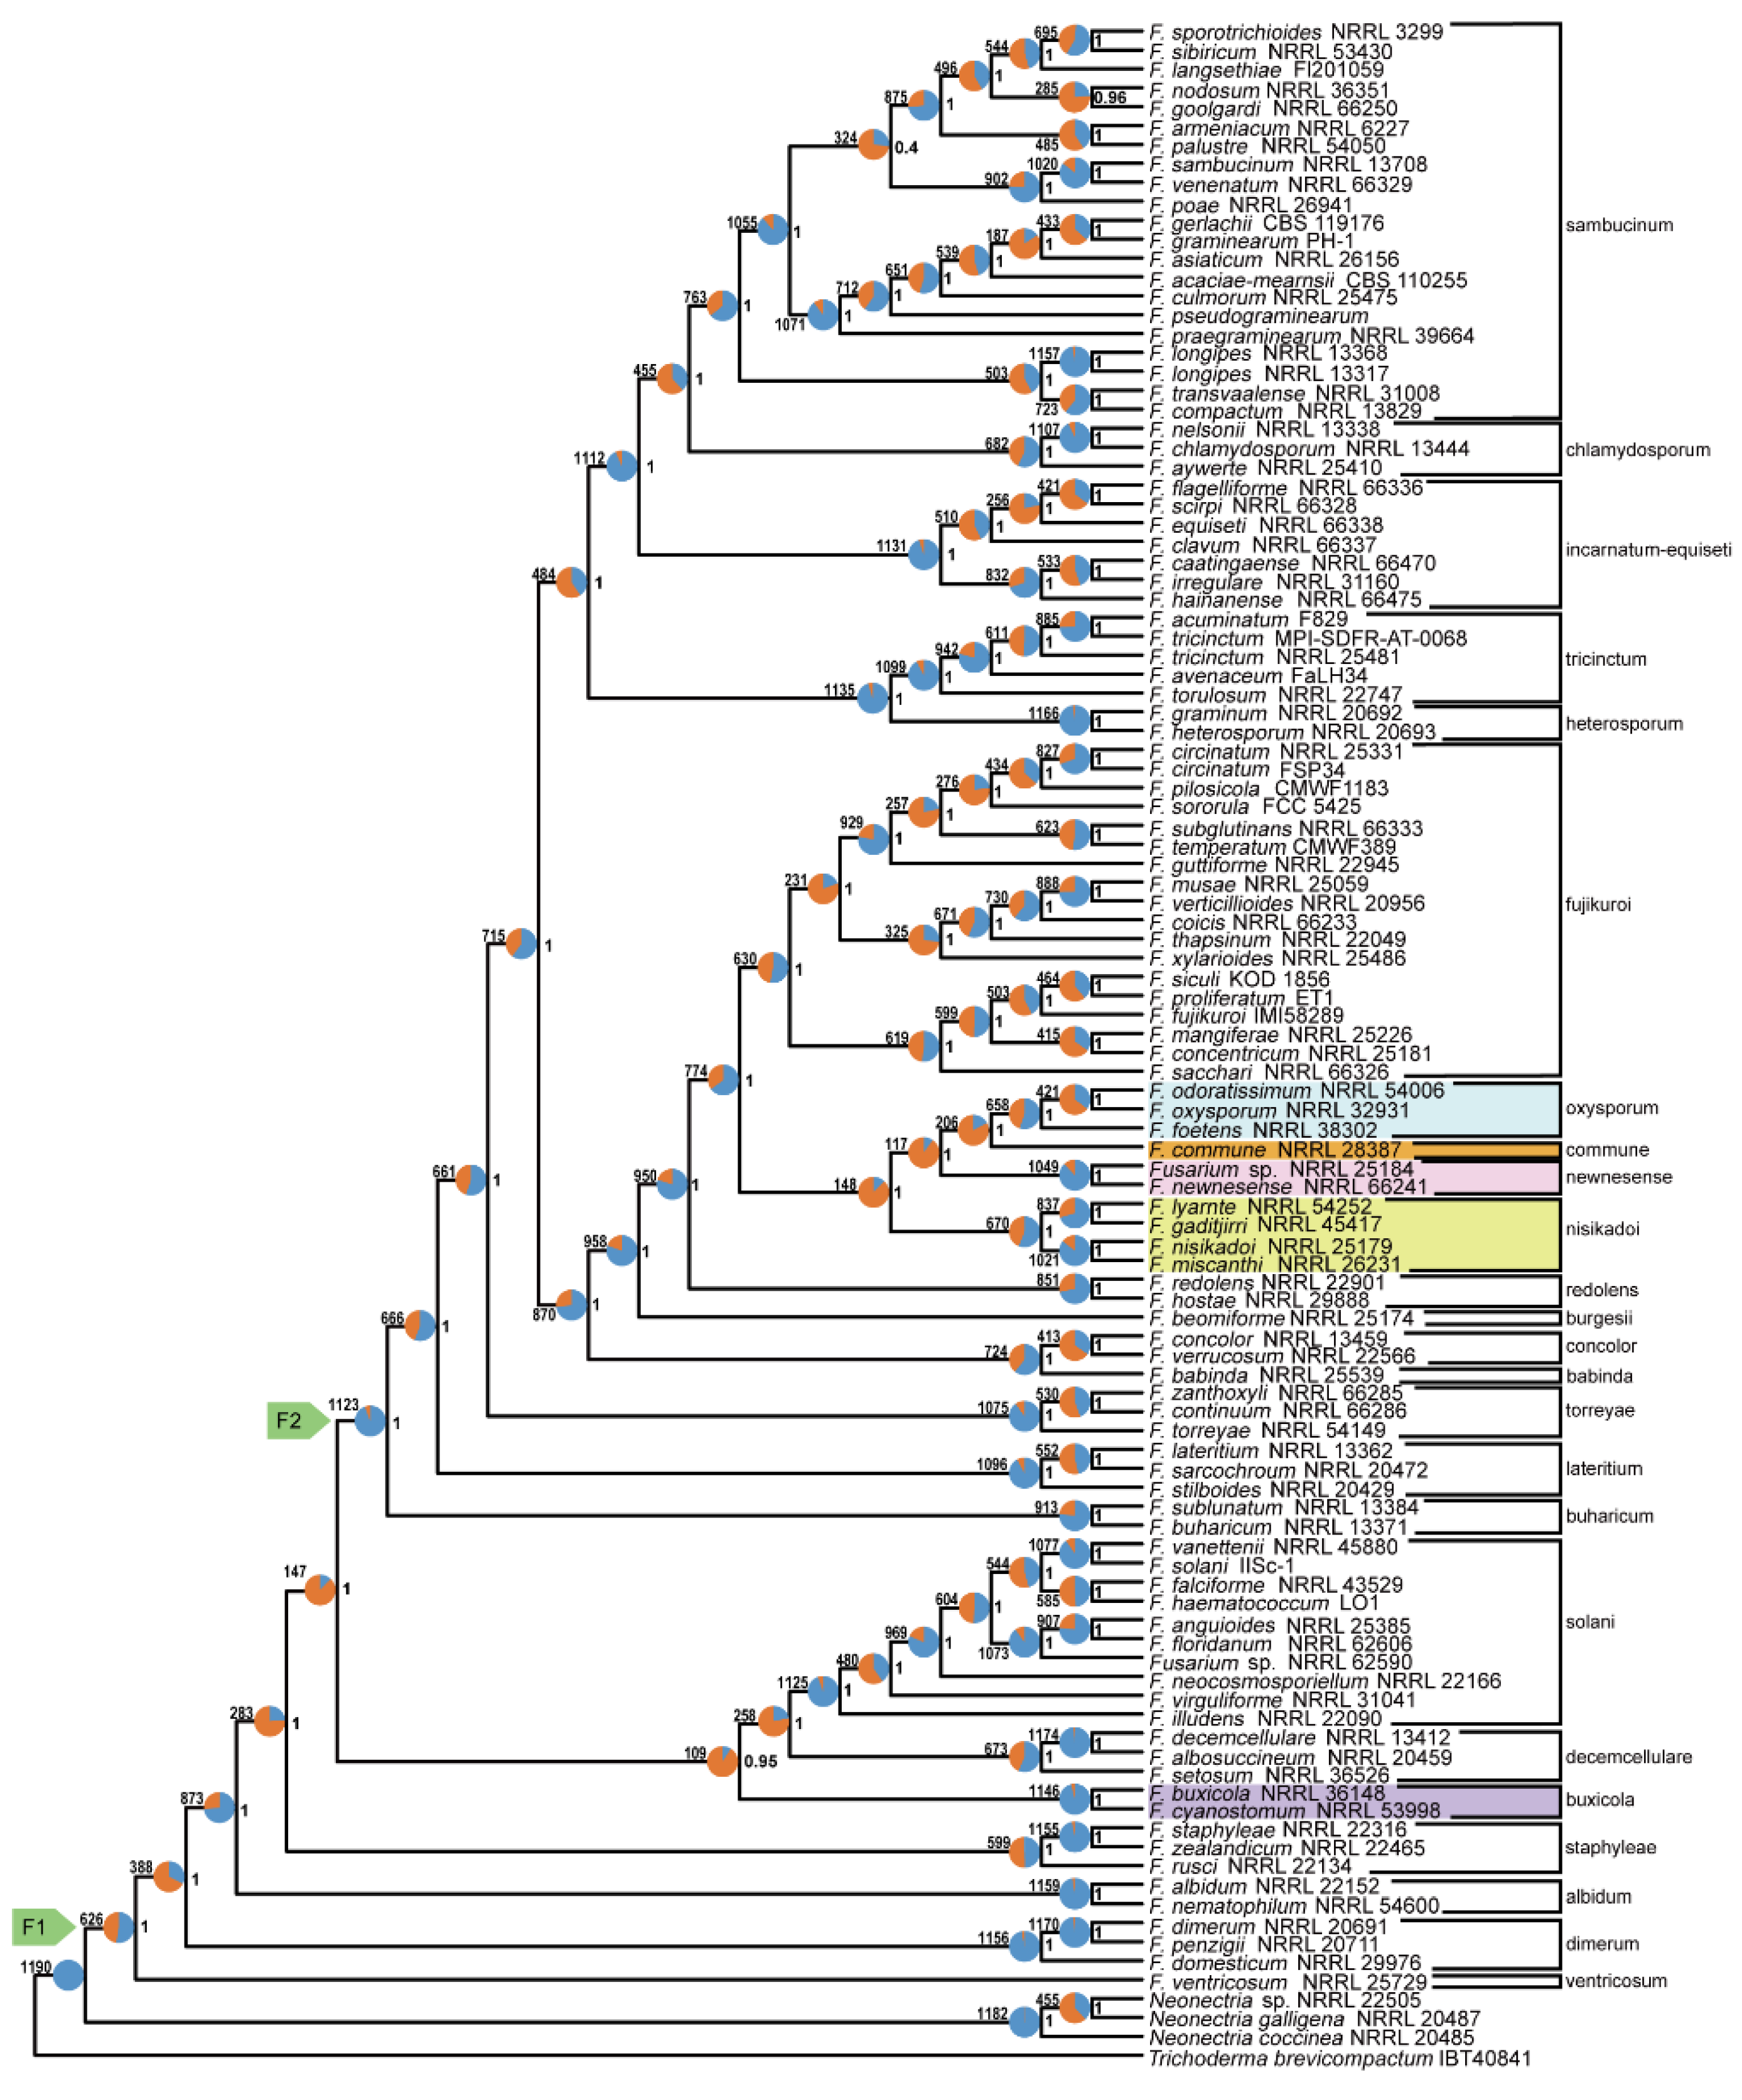
Figure 6.
Phylogenetic tree based on DNA data of 1,190 genes using coalescent-approach analyzed with ASTRAL, with summary of conflicting and concordant homologs. For each branch, the top number indicates the number of homologs concordant with the species tree at that node. The pie charts at each node present the proportion of homologs that support that clade (blue) and the proportion that support the main alternative for that clade (orange). Node F1 is for the terminal Fusarium clade. Node F2 is for Fusarium s. str. clade.
Disclaimer/Publisher’s Note: The statements, opinions and data contained in all publications are solely those of the individual author(s) and contributor(s) and not of MDPI and/or the editor(s). MDPI and/or the editor(s) disclaim responsibility for any injury to people or property resulting from any ideas, methods, instructions or products referred to in the content. |
© 2025 by the authors. Licensee MDPI, Basel, Switzerland. This article is an open access article distributed under the terms and conditions of the Creative Commons Attribution (CC BY) license (http://creativecommons.org/licenses/by/4.0/).
Copyright: This open access article is published under a Creative Commons CC BY 4.0 license, which permit the free download, distribution, and reuse, provided that the author and preprint are cited in any reuse.


