
Submitted:
12 November 2025
Posted:
13 November 2025
You are already at the latest version
Abstract
Clinical imaging diagnostics in AD primarily focus on amyloid and tau accumulation; however, recent work suggests that neuro-metabolic and vascular dysregulation (MVD) begins prior to protein deposition. MVD changes persist in preclinical and clinical cases across the disease spectrum; therefore, comparing them could provide valuable insight into disease onset and progression. Regional MVD phenotypes were determined using imaging readouts as surrogates for cerebral metabolism and blood flow, and region-set enrichment analysis (RSEA) was performed to determine brain functional category (BFC) changes based on metabolic variations. Clinically, MVD showed changes across the disease spectrum, while mice showed similar trajectories, though these were genotype- and age-dependent. Although there is no one-to-one relationship between BFC across species, RSEA showed significant changes in comparable categories. Our findings indicate that clinical MVD and RSEA changes can be mapped to preclinical models, aiding the development of early diagnostic techniques, improving disease stratification, and enabling therapeutic testing.
Keywords:
Alzheimerʹs disease
; neuro‐vascular‐metabolic dysregulation
; metabolic changes
; preclinical models
1. Introduction
Animal models are widely used in medical research to better understand disease mechanisms,[1,2] conduct pharmacokinetic studies,[1,2] evaluate toxicity levels,[1,2] and conduct pre-clinical testing.[1,2] Many biological processes in animals can be closely modeled to mimic those in humans.[1,2] Current pre-clinical research is focused on improving the translational relevance of animal models by developing more “humanized” models and using advanced genetic engineering techniques to better mimic human disease etiology.[3,4] Of particular interest are rodents (e.g., mice, rats), which are among the most commonly used species.[5] However, one of the biggest concerns within the research community is the model relevance which leads to a translational gap between models and humans.[6-8] Biological differences, such as genetics,[9] physiology,[9] environment,[9] and their interactions,[9] influence the predictive validity and translational potential of these models, leading to delayed development of effective treatments,[10,11] variability issues,[11,12] and inefficient use of resources.[10-12]
Although animal models are typically created to emulate specific aspects of human pathology, some models are discovered through the natural development of disease conditions that closely resemble those observed in humans.[13,14] A classic example of this phenomenon is the use of nine-banded armadillos to study leprosy because of their natural susceptibility to Mycobacterium Leprae.[15] These types of “natural models” offer several benefits, including a natural resemblance to disease complexity, enhanced translational relevance, and insight into the natural course of pathogenesis.[13,14]
In the field of Alzheimer’s disease (AD) and related dementias (RD), the Model Organism Development and Evaluation for Late-onset Alzheimer’s Disease (MODEL-AD)[16] consortium has genetically engineered more than 70 mouse models carrying humanized risk variants (i.e., APOE4, TREM2, PLCG2) to better replicate the complex molecular and clinical characteristics of human late-onset AD (LOAD). Hence, MODEL-AD aims to develop rigorous, reproducible, and standardized animal models that align with clinical stages of AD, facilitating the establishment of guidelines for pre-clinical testing, thus enhancing the success rate of drug development and discovery.[16] This collaborative research effort addresses the inherent translational challenges associated with animal models.[16]
While these animal models have been developed over the years, their complete translation remains an ongoing challenge.[3,17-19] Moreover, the consortium recognizes that it may not be possible to encapsulate the full spectrum of human AD into a single humanized mouse model due to the range of mechanisms, comorbidities, and disease progression.[16] Despite this, multiple studies have shown utility of these models for studying the clinical sequelae.[17-19] These findings include neurovascular dysregulation, brain network reorganization, aspects of amyloid-beta deposition, metabolic changes, and behavioral changes.[3,17-19] Hence, to the best of our knowledge, no human-to-mice translation has been performed that covers the AD continuum, and ongoing research by our lab as part of MODEL-AD has been working to bridge this translational gap.[17,18,20,21] In this study, we present a comparison between the clinical disease stages of AD and the corresponding MODEL-AD mouse models, which closely approximates each clinical stage across neuro metabolic and vascular dysregulation (MVD) continuum, brain network reorganization, and functional alterations perspectives.
2. Comparison Datasets
Human data used in the preparation of this article were obtained from the Alzheimer’s Disease Neuroimaging Initiative (ADNI) database (adni.loni.usc.edu). ADNI was launched in 2003 as a public-private partnership, led by Principal Investigator Michael W. Weiner, MD. The primary goal of ADNI has been to test whether serial MRI, PET, other biological markers, and clinical and neuropsychological assessment can be combined to measure the progression of MCI and early AD.[22]
The neurovascular uncoupling dataset comprised 403 subjects from ADNI phases 2 and 3, who underwent 18F-FDG PET, T1-weighted, T2-FLAIR, and Arterial Spin Labeling (ASL) MRI within 180 days. MRI sequences were processed using ExploreASL[23] to obtain cerebral blood flow (CBF) maps, which serve as a surrogate readout of cerebral perfusion. In contrast, 18F-FDG serves as a surrogate readout of glycolytic metabolism. ADNI provided disease classification, and the split is as follows: 95 CN, 71 EMCI, 112 MCI, 42 LMCI, and 83 AD. For the metabolic connectomics analysis (MCA) and regional set enrichment analysis (RSEA), the database comprises 431 cases with splices as follows: 98 CN, 76 EMCI, 129 MCI, 42 LMCI, and 86 AD (per ADNI classifications). The slight increase is due to MCA, for which only the 18F-FDG PET sequence is required, thereby alleviating the imaging exclusion/inclusion criteria. No grey matter masking was performed for 18F-FDG.
Humanized APOE mouse models (APOE3 and APOE4) are mouse strains that carry humanized APOE knock-in allele, where the mouse APOE gene (exons 2, 3, a majority of exon 4, and some 3′ untranslated region sequence) was replaced with the corresponding sequences of the human APOE isoform genes (ε3 and ε4). The LOAD1 model, a double homozygous model, is produced by incorporating two risk factors (APOEε4 and Trem2*R47H) into C57BL/6J mice, and the LOAD2 model, a triple homozygous model, contains humanized amyloid-beta (Aβ) in addition to the LOAD1 risk factors. Additional information on these mice is available from the Jackson Laboratory strain datasheets (APOE3, https://www.jax.org/strain/029018; APOE4, https://www.jax.org/strain/027894; LOAD1, https://www.jax.org/strain/028709; LOAD2, https://www.jax.org/strain/030670). Cohorts of B6, APOE3, APOE4, and LOAD1 mice were aged to 12-month for both sexes. LOAD2 mice were aged to 12- and 18-months. In addition, two separate cohorts of LOAD1 and LOAD2 mice were given a control diet (LabDietR 5K52/5K67: 6% fat, control diet, CD2) and a high-fat diet (HFD; ResearchDietR feed D12451i: 45% of high fat, 35% of carbohydrates, HFD3) per our previous work.[24,25]
In summary, the mouse dataset consists of 164 mice divided as follows: n=14 B6 at 12 mos., n=26 APOE3 at 12 mos, n=22 APOE at 12 mos, m=13 LOAD1 at 2-mps, n=11 LOAD1+High-Fat Diet (HFD) at 12 mos, n=15 LOAD2 at 12 mos , n=22 LOAD2+HFD at 12 mos, n=17 LOAD2 at 18 mos, and n=24 LOAD2+HFD at 18 mos.
For the human cases, all imaging data were registered to the MRI MNI152+, and the atlas is a fusion of the Montreal Neurological Institute, Harvard-Oxford Cortical + subcortical(RRID:SCR_001476) and FSL Probabilistic Cerebellar Atlases, thus permitting a direct comparison in a common reference space. Similarly, for the mouse cases, all imaging data were registered to the Paxinos-Franklin atlas, per our previous work.[26] However, due to species differences, the number of brain regions differs between humans and mice: the human atlas contains 59 unilateral regions, while the mouse atlas contains 28. Multiple analyses, which includes MVD, MCA, and RSEA analyses were performed using the workflows described in our previous works.[17,18,20,21]
3. Comparison Perspectives
In this study, we propose comparing humans and mice across the entire spectrum of diseases from three distinct perspectives: MVD using perfusion and metabolic data, MCA network clusters, and functional variations derived from metabolic readouts. To conduct these comparisons, we utilized previously developed pre-clinical and clinical workflows.[17,18,20,21] However, an important limitation in these inter-species comparisons lies in the absence of direct one-to-one structural and functional alignments.[7,11] In the case of AD, this is because no mouse model can encompass the full spectrum of the human disease.[16,19] Therefore, to overcome these limitations, it is essential to select a specific disease stage and utilize the corresponding reference and experimental mouse models. Moreover, non-diseased (wild-type) C57BL/6J mice (B6) are not a proper representation of CN human patients, due to differences between mouse and human APOE, leading to the creation of “humanized” APOE mice, which contains the APOE3 gene.[27] Beyond the scope of this manuscript, B6 mice can be used to examine how these genes differ from normal mouse biology, thus serving as a reference under these conditions.[28] In summary, while humans can always be compared to CN, in mouse models, it is necessary to include a reference group alongside the experimental group.
3.1. Neuro-Vascular and Metabolic Uncoupling Perspective
Following previous pre-clinical and clinical studies performed by our lab and others,[17,18,20,21] MVD represents one of the earliest changes in AD progression, occurring prior to hallmark pathological features (i.e., amyloid-beta and tau tangles accumulation) and manifestation of clinical symptoms (i.e., cognitive and memory decline, behavioral changes) regardless of species.[17,20] This dysregulation initiates a cascade of physiological events (i.e., neuroinflammation,[29] glial cell activation,[30] vascular proliferation[31]), highlighting both widespread and region-specific alterations across the brain.[17,20,32,33] Hence, distinct disease phenotypes can be determined based on the set of characteristics associated with this dysregulation. For instance, as mentioned in our previous works,[20] disease progression begins with uncoupled responses between metabolism and perfusion, resulting in two phenotypes: Type 1 Uncoupling (T1U; ↑CBF ↓MET) and Type 2 Uncoupling (T2U; ↓CBF ↑MET ).[20] Then, the disease progression follows an abnormal coupled response, which results in two distinct phenotypes: Prodromal Coupling (PC; ↑CBF ↑MET ) and Neuro-metabolic-vascular failure (NMVF; ↓CBF ↓MET ).[20] These trajectories has been referred to as the MVD pattern, and is common across species.[17,20] For instance, each brain region follows its own MVD trajectory, with susceptible regions, such as the temporal gyrus, occipital pole, and planum polare in humans, and primary somatosensory cortex (S1), parietal cortex post-rostral (PtPR), and retrosplenial cortex (RSC) in mice progressing faster through the MVD pattern (Figure 1).[17,20]
For instance, by processing both mouse and human datasets using a translational-capable framework as described in our previous studies,[17,18,20,21] we can compare results within the same domain, with minor species-dependent differences. The comparative analysis using neurovascular uncoupling charts (Figure 2) across human and mouse data reveals both conserved and divergent patterns of dysregulation associated with AD progression (or risk factors in mice). In these charts, the scatter plots illustrate the relationship between brain atlas region, cerebral perfusion (x-axis), and metabolic uptake (y-axis) for both sexes.
The human data (Figure 2.A-D) show that the overall trajectory followed by the brain regions from EMCI to AD, both relative to CN, is: T1U→T2U→PC→NVMF. In addition, it can be observed that females progress faster through this sequence, as previously described.[20] However, the dispersion at early stages of the AD is less pronounced compared to later stages, and described in our previous work.[20] By comparison, the mouse models (Figure 2.E-H) follow the same MVD pattern as humans, but exhibit more pronounced variations in neurovascular uncoupling, making the overall MVD trajectory more noticeable. This exaggerated phenotypical response in mouse (compared with humans) could be due to the different combinations of genetic variants in the mouse models (i.e., LOAD1, LOAD2, APOE3, APOE4), age effect (i.e., 12-months, 18-months), environmental manipulations (i.e., diet effect), illustrating that no single mouse model is able to encapsulate the complete spectrum of human AD. Importantly, these responses offers the benefit of displaying clear, reproducible pathological changes, with a large dynamic range, which occur over a compressed timeframe, allowing rapid evaluation of disease mechanisms and therapeutic responses, and thereby circumventing the slow and variable progression seen in naturally occurring clinical cases, which take 15-30 times longer to develop than in mouse models.[3] Importantly, this feature allows one to perform a precision medicine approach, where one selects a mouse model, which carefully aligns to the mechanism of action of the drug, thus permitting hypothesis testing with a translatable biomarker.
Overall, both mouse and human cases demonstrate substantial similarities in the MVD trend exhibited by brain regions with respect to cerebral perfusion and metabolic uptake alterations associated with AD progression. In both species, the progressive dysregulation of brain metabolism manifests as variable uncoupling and coupling between perfusion and metabolism, accompanied by the emergence of distinct metabolic brain region clusters. In particular, this process starts with T1U followed by T2U, two uncoupling phenotypes. Then, the disease progression shows prodromal and NVMF coupling phenotypes, which manifest with disease severity, age, and interaction of genes, age, and environmental drivers.
In Figure 2, for each condition, the corresponding mouse model displayed below the human uncoupling chart serves as a functional and metabolic analog, such that the LOAD1+HFD relative to LOAD1 at 12 months mirrors the EMCI relative to CN transition in humans, modeling early-stage vascular and metabolic impairment under combined genetic and dietary risk. Likewise, LOAD2+HFD relative to LOAD2 at 12 months, LOAD2+HFD relative to LOAD2 at 18 months, and APOE4 relative to APOE3 mouse groups exhibit progressive genetically and diet-driven NVC alterations comparable to those observed across MCI, LMCI, and AD relative to CN. In each case, the clustering and directionality of the relation between perfusion–metabolism uncoupling/coupling phenotype in the mouse data recapitulate, with an increased and exaggerated effect, the organization observed in humans, and the appearance of coupled and uncoupled phenotypes. Notably, both species datasets exhibit sex-related dysregulation patterns, with recent findings confirming broad sex-specific metabolic signatures in AD patients and mouse models, including conserved alterations in lipid metabolism and energy pathways.[21,34] Collectively, these inter-species parallels underscore that the core metabolic disturbances underlying neurodegeneration are evolutionarily conserved,[18,21,34,35] validating the translational value of these animal models for elucidating disease mechanisms and testing targeted therapeutic strategies.
In summary, these MVD changes are consistently observed in both mouse models and clinical human cases, underscoring the relevance of regional MVD trajectories to disease progression rather than an isolated, species-specific phenomenon. Hence, the consistency of MVD as an inter-species event affirms the value of these changes as predictive and diagnostic biomarkers for disease staging, monitoring, and progression in humans, as well as highlighting the translational potential of mouse models. An important limitation is the need to strategically select mouse models that accurately reflect the disease phenotypes observed in humans, given that a single mouse model cannot capture the whole human AD spectrum. However, if the mouse models are correctly selected, it will allow researchers to use these systems to conduct therapeutic testing in mice, thereby improving the likelihood that observed effects will be meaningful in clinical settings. Such an approach not only advances understanding of disease mechanisms, but also enhances the development and preclinical validation of interventions that target these crucial physiological pathways.
3.2. Metabolic Connectomics Perspective
Currently, ADRD is characterized by pronounced dysregulation of brain energy metabolism, with alterations in glucose uptake and mitochondrial dysfunction as central pathological features.[32,36] These metabolic impairments drive bioenergetic stress, as the human brain requires glucose transport and mitochondrial oxidative phosphorylation to meet its high energy demands, supporting synaptic transmission and neuronal activity.[32] Moreover, these variations precede clinical symptoms and are tightly linked to pathological processes such as amyloid-beta accumulation,[32] tau hyperphosphorylation,[32] and glial cell activation,[30] which contribute to neuronal loss, synaptic weakening, and cognitive degradation.[32,37] The main theories that support these neurometabolic changes are the brain metabolic reprogramming,[33,38] energy fuel switching,[39] and energy failure.[40]
Functional connectomics studies highlight metabolic disconnection, which causes brain network remodeling in response to changes in the energy demand and disruption.[33,38] On the other hand, from the bioenergetic hypotheses,[39,40] it has been proposed that impaired cerebral glucose metabolism (especially in cortical regions, parietal lobes, and the hippocampus) drives pathogenesis and cognitive decline by contributing to amyloid and tau pathologies. Recent metabolomics studies confirm these findings, which include glycolytic flux impairment and activation of ketone metabolism.[41] Furthermore, this emphasizes that metabolic deficits may trigger a cascade of events, including neuronal dysfunction due to energy deficits,[36] chronic oxidative stress,[42] and neuroinflammation,[29] all of which are connected to metabolic stress and neurodegeneration.[29,36,42] In addition to impairing ATP production, mitochondrial metabolic dysfunction exacerbates inflammatory responses in the brain due to the excessive production of reactive oxygen and altered redox signaling.[32,36] Lastly, glial cell activation alters cytokine signaling, causing a shift to astrocyte energy support, which further contributes to the destructive cycle that affects neuronal viability and network plasticity.[43]
All these theories[33,38-40] share the idea that these metabolic changes trigger compensatory brain structural and functional restructuring to adapt the brain to increased bioenergetic deficits, switching energy fuel sources, neuronal loss due to oxidative stress, and/or a combination of factors[33,38-40] exhibited in preclinical and clinical studies.[18,21] Recent studies have shown that early local and global network changes are compensatory adaptations aimed at preserving cognitive function;[18,21,33,38] for example, an increase in metabolic uptake, which serves as a temporary buffer against functional loss.[36] Importantly, this temporal buffer is designed to be short lived, and under disease conditions, this excessive energy consumption leads to network failure.[40,44-47]
An important factor that has been largely ignored is the sex-dependent changes, with recent studies advocating for sex-stratified analyses given the sexual dimorphism that occurs in network organization, mitochondrial function, and glucose metabolism.[18,21,33,48] For example, female-specific transcriptomic pathways involving ALDOA (aldolase A enzyme), ENO2 (enolase 2), PRKACB (beta-catalytic subunit of protein kinase A), and PPP2R5D (serine/threonine-protein phosphatase 2A) reveal regulatory mechanisms of energy metabolism that are either delayed or absent in males.[48] Other factors that need to be accounted for that further emphasize this sexual dimorphism are differential hormonal regulation,[49] genetic risk,[49] and neuroinflammatory response;[49] all of which could help enhance our understanding of sex-specific neural adaptation strategies to metabolic stress.[48,49] Consequently, we hypothesize, as many in the research community do, that analyzing sex-specific metabolic alterations and compensatory mechanisms may enable accurate modeling of AD pathophysiology, as well as a more comprehensive framework for developing precision diagnostics and therapeutic strategies tailored to individual bioenergetic and network profiles.[20,21,34,50]
Analyzing and comparing inter-species metabolic connectomics changes offers a highly integrative framework for comparison by unifying molecular energy dysregulation, network reorganization, and sex-specific biology into a single analytical perspective.[21,34,35] This framework is supported by distinct metabolic changes in the presence of pathological conditions and, from a comparative perspective, allows identification of shared versus disease-specific metabolic signatures across neurodegenerative conditions, regional metabolic dysfunction, and network-level changes. Ultimately, this provides a rationale for metabolic and functional network-based biomarkers that predict disease progression by tracking disease trajectories across brain regions and assessing the degree of specialization or integration of brain networks.
Due to the complexity of this analysis, the metabolic covariance networks comparison will focus on clinical cases of CN and AD compared to preclinical mice of humanized APOE3 and humanized APOE4. For this comparison, metabolic covariance matrices (MCMs) were computed from 18F-FDG SURV data for mice and humans, using the same analysis workflow as in previous studies in our lab.[18,21] Then, brain regions were clustered using multiresolution consensus clustering, and, in the same manner, these tasks were performed using the open-source packages: Brain Connectivity Toolbox,[51] generalized Louvain modularity,[52] and CovNet.[18] The metabolic covariance matrices and the results of the multiresolution consensus clustering are shown in Figure 3.
From the MCMs, males’ cases (Figure 3.A-D) show a reduction in the number of clusters between CN and AD in humans and between APOE3 and APOE4 in mice, indicating that brain networks become more integrated in the presence of disease (or a risk factor in mice). In contrast, for females (Figure 3.E-H), the number of clusters follows an opposite trend (increasing), indicating that brain networks become more fractured. Hence, the number of clusters in mice and humans follows the same sex-dependent trends. These data align with results from our previous studies,[18,21] and reinforces the notion that brain structures change in response to different risk factors. Although there is no direct one-to-one relationship between brain regions, functionally related regions tend to group. For instance, the mid-temporal gyrus regions (regions 11 to 16) tend to belong to the same cluster in humans, whereas regions related to sensorial inputs (e.g., posterior parietal cortex, secondary somatosensory cortex) tend to cluster together in mice. However, in the presence of disease or risk factors, these regions are broken apart.
At the whole-brain network-level (Figure 4), similar patterns can be observed across species. For instance, by analyzing the trend of each metric in humans relative to CN, we can discern a “W” pattern relative to disease progression. However, in mice, the comparison needs to be performed between pairs of cohorts (i.e., LOAD1+HFD relative to LOAD1 at 12 months), where the “W” pattern observed in humans can be reconstructed. Consequently, these alterations reveal analogous network organization profiles across species and sexes, with males exhibiting more clustered, dense, and positively connected networks than females (Figure 3 and Figure 4). This analysis supports the presence of disease-related alterations across both species and establishes a robust framework capable of discerning network-level distinctions between species, consistent across multiple metrics.
In summary, the variations in the number of clusters and network metrics occur across both species, indicating that these changes are disease-related rather than species-related. In addition, these changes can be used to identify similarities in disease progression across species and to monitor changes in disease-related and therapeutic responses within functional regional and brain organization.
3.3. Metabolic Functional Perspective
AD leads to progressive changes in the brain's structure and function, resulting in worsening behavioral and cognitive decline.[21,32,35,40] As the disease advances, neurodegeneration affects key brain regions (e.g., hippocampus, prefrontal cortex) responsible for memory, executive function, and emotion regulation.[20,21,35,40] This disruption results in clinical manifestations, including memory deficits, attentional problems, delusions, sleep disturbances, language difficulties, emotional dysregulation, and severe dementia.[40,41,53] These symptoms can be observed at various stages of the disease.[53]
Transgenic (e.g., APP/PS1, 5XFAD) and LOAD knock-in (e.g., LOAD1, LOAD2) mouse models of AD replicate many of the pathological and behavioral features observed in humans with AD, including amyloid and tau burden,[3,19] anxiety-like behaviors,[3,19] memory impairment,[3,19] social withdrawal[3,19], and neuro-metabolic and vascular dysregulation.[17,20] However, translating findings from mice to humans is complicated by noteworthy differences between the two species.[6] These differences encompass variations in brain complexity, reduced cortical layering, and high-order integration levels of network connectivity.[6,19,35] As a result, not all aspects of the diseases are identical, making it challenging to directly map human behavioral syndromes, such as depression and apathy, with their rodent counterparts.[6,19] Therefore, cross-species behavioral interpretation complicates translational research since animal behavioral tests can only approximate a fraction of human clinical symptoms.[6,19] The lack of this one-to-one correspondence is the primary barrier to preclinical-to-clinical extrapolation, which contributes to translational failures in AD drug development.[7,10-12]
Current research trends using glycolytic metabolism readout have gained prominence as a translational biomarker that links neuronal activity and network integrity in both human and mouse studies.[18,40,54] Although mouse and human brains possess different numbers of anatomical and functional subdivisions, correspondences can still be established at the level of related functional categories, since previous transcriptomic analyses have revealed that many gene co-expressions and biological processes (e.g., energy metabolism, glial activity, and synaptic function) are preserved across species.[17,20,21,34,55] As such, mice can be used to model specific AD mechanisms[3,19] by comparing functional variations from metabolic-based readouts, rather than behavioral outputs, thus resulting in a translational framework to bridge inter-species gaps by integrating metabolic functional signatures.[56,57]
To bridge current limitations, and to compare inter-species functional changes, region set enrichment analysis (RSEA), a technique developed by our lab,[21] quantitatively detects brain functional changes based on regional metabolic readout variations relative to a reference group. This method works by weighting changes in each region (experimental group minus the reference group) and then linking these changes to functional set enrichment categories (FSEC). [21] Therefore, RSEA offers a promising way to align inter-species differences in brain function via energy metabolism patterns rather than using raw behavior, since it is not a species-specific technique, as it uses glycolytic metabolism readouts, a validated biomarker of functional brain activity that correlates with neuronal network activity and decline in AD pathology. However, due to species differences, the FSEC between humans and mice are different, where in humans, the FSECs are auditory, autonomics, cognition, emotions, language, memory, motor, sensorial, speech, and visual. By contrast, in mice, the FSECs have been classified into auditory, learning, motor, perception, sensory, integration, and visual based on the brain parcellations of Paxinos-Franklin atlas. Then, using the modules obtained for CN in humans and B6 in mice in the previous section (Section 3.2, Figure 3), modular FSEC scores were generated for each experimental group by summing the columns within the corresponding module, per our previous work.[21] Although several studies have attempted to perform translational mapping between mouse and human brain organization and function;[35,58] however, to the best of our knowledge, using RSEA to make this type of comparisons is the first of its kind.
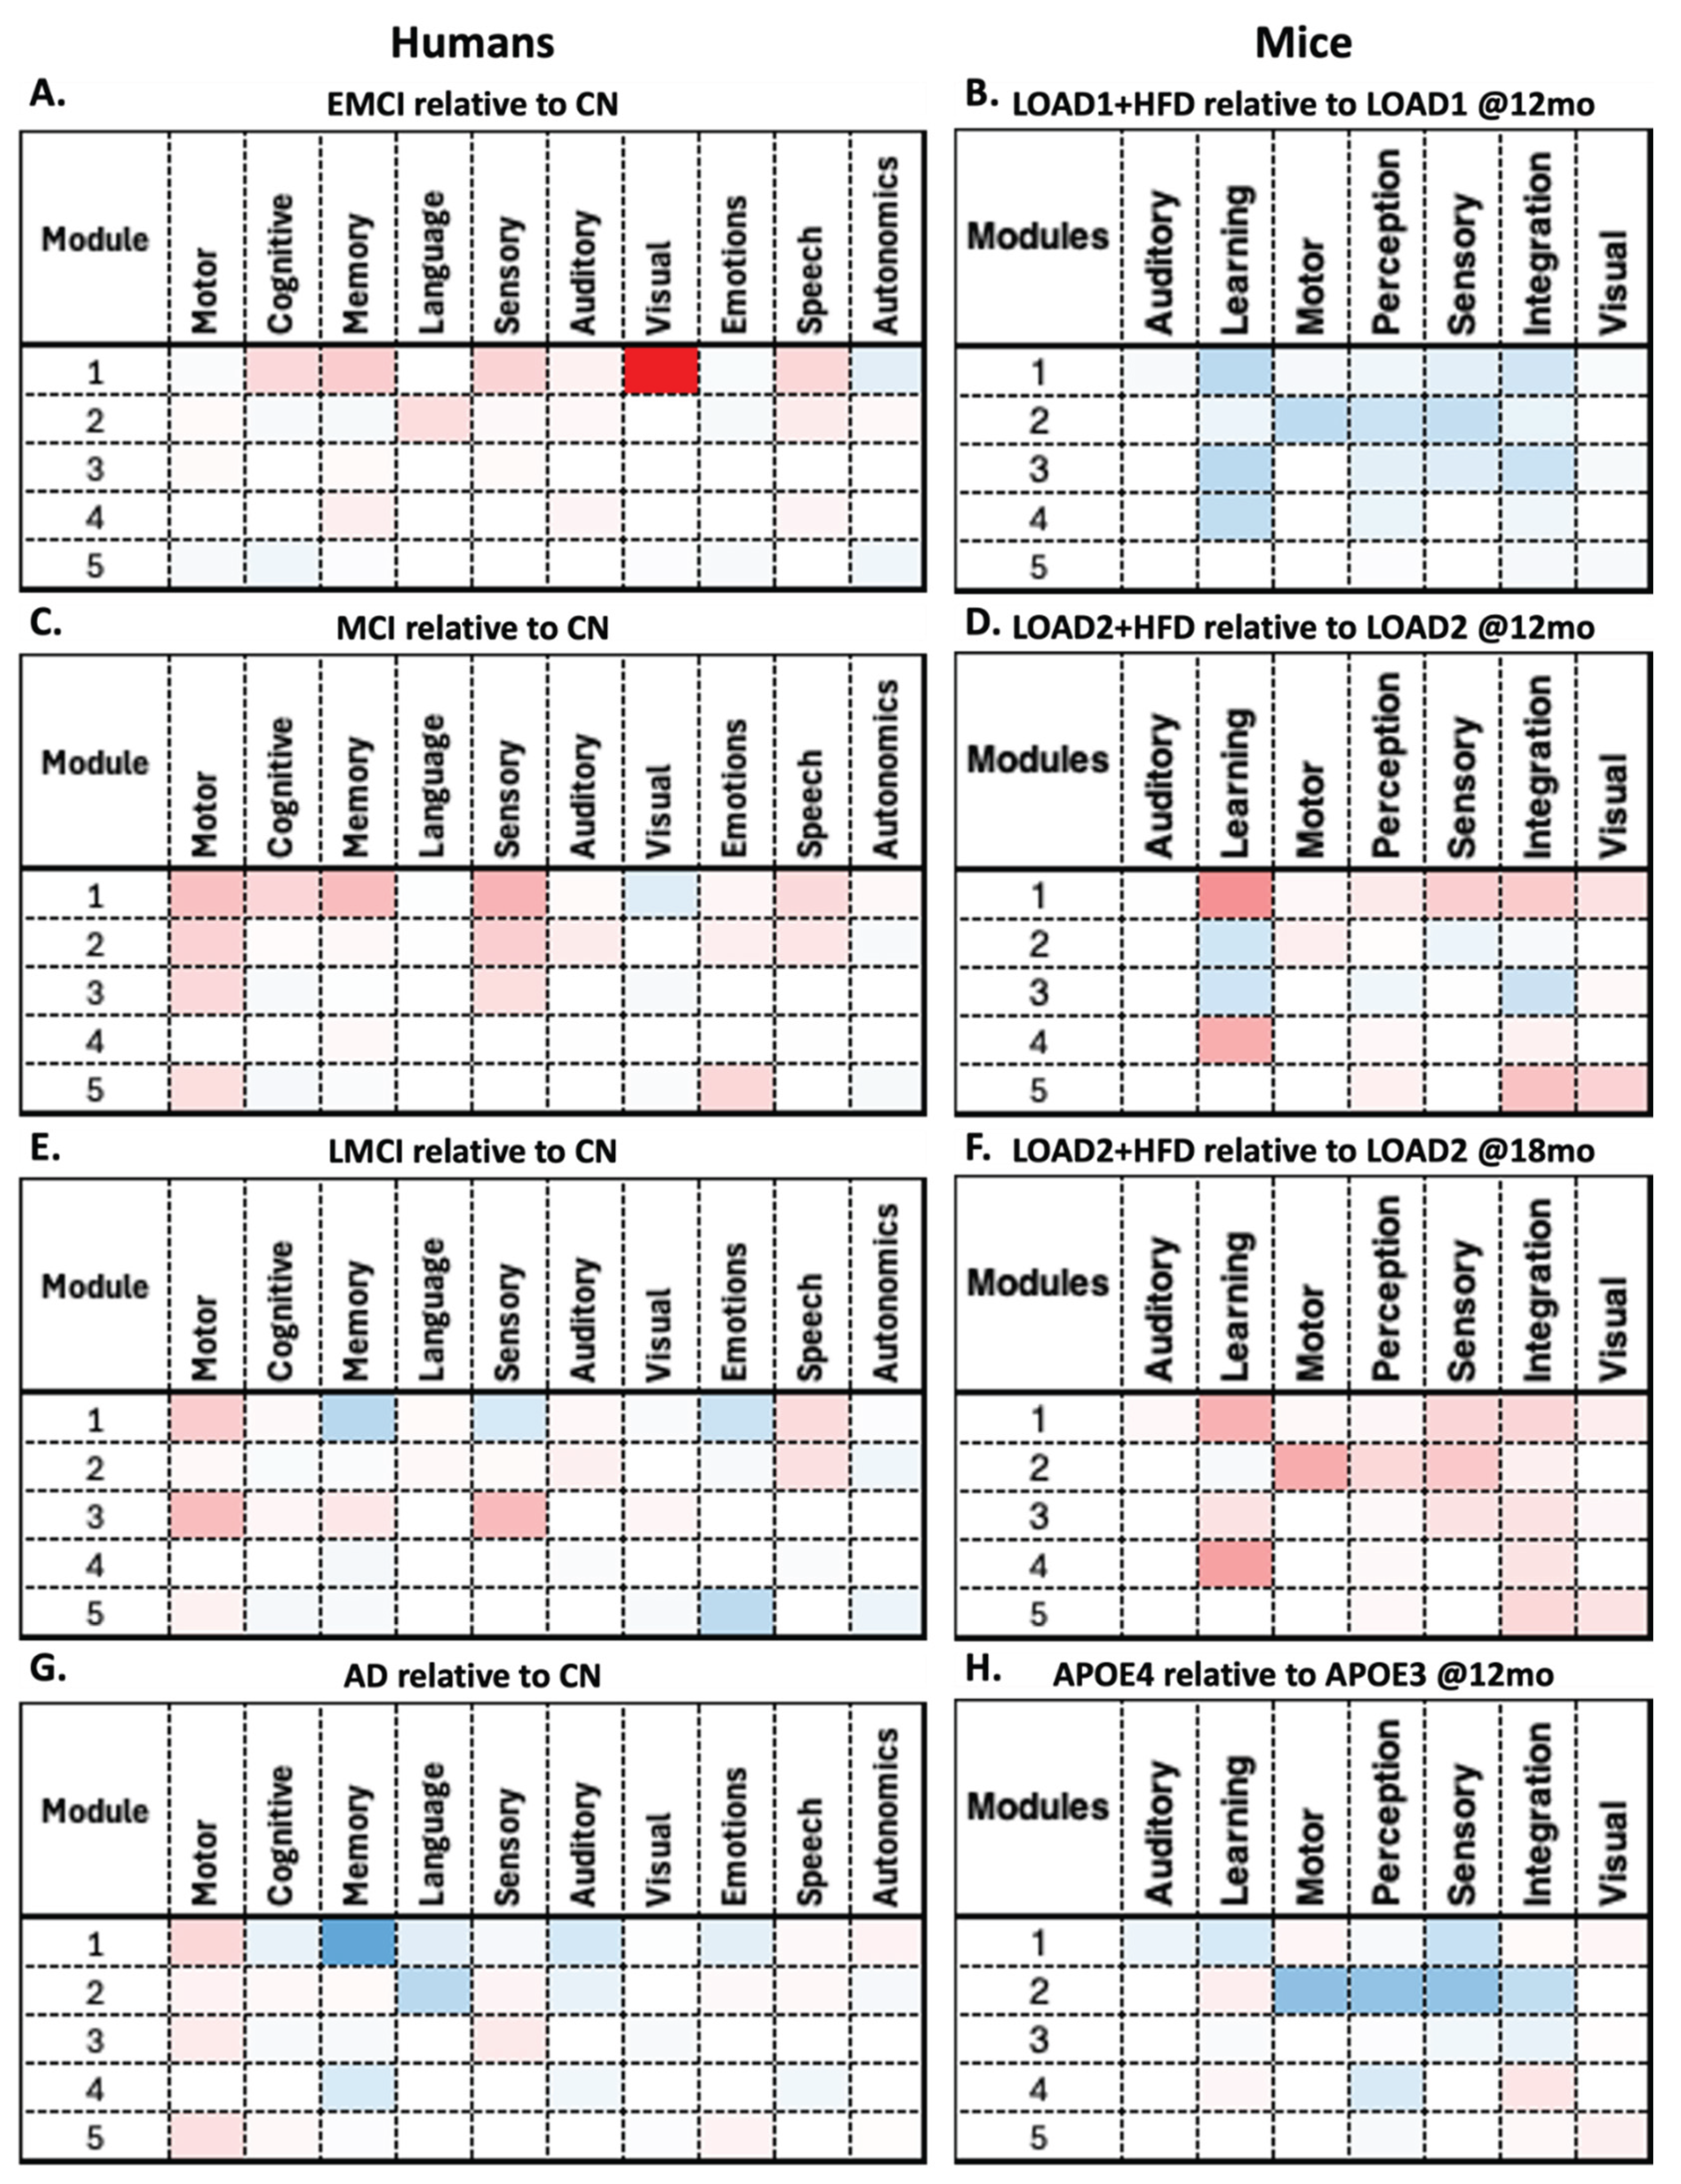
RSEA analysis revealed similar patterns between humans and mice. For instance, males' EMCI relative to CN shows decreases in functional changes in Module 4 across multiple human FSECs (Figure 5.A). In contrast, mice LOAD1+HFD (12 months) relative to LOAD1 (12 months) show decreases across all modules in the mice's FSECs (Figure 5.B). For the human MCI relative to CN and the mouse LOAD2+HFD (12 months) relative to LOAD2 (12 months), both show increases across multiple modules (Figure 5.C-D). In contrast, human LMCI relative to CN and the mouse LOAD2+HFD (18 months) relative to LOAD2 (18 months) show opposite behaviors (Figure 5.E-F). Finally, human AD relative to CN and the mouse APOE4 (12 months) relative to APOE3 (12 months) show a similar patterns to those of human AD (Figure 5.G-H). This again illustrates the limitations of mouse models, which cannot capture the complete spectrum of AD, but can replicate disease components for specific phenotypes. On the other hand, RSEA results for females are shown in Figure 6, where all comparisons show similar patterns except for human EMCI relative to CN (Figure 6.A) and LOAD1+HFD (12 months) relative to LOAD1 (12 months) (Figure 6.B) show opposite trends.
By comparing these findings in detail, RSEA can be used to identify functional changes across comparable categories. For instance, human FSECs motor, memory, cognition, and language follow similar trends to mouse FSECs motor, learning, and perception across multiple modules in both males and females. These findings suggest that these FSECs may be correlated across species (Figure 6); however, further studies are required to confirm this observation. Moreover, the overall trends between decreases and increases across the different comparisons indicate an energy balance dysregulation, which is supported by the brain reorganization and energy failure theories.[33,38-40] For instance, overall metabolic fluctuations indicate that disease progression starts with a hypo-metabolic phase, followed by a hyper-metabolic phase, which then enters a second hypo-metabolic phase. The intermediate hyper-metabolic phase aligns with previous studies indicating that the brain attempts to balance bioenergetic demands, which it eventually cannot sustain, ultimately leading to energy failure, as expressed in the second hypo-metabolic phase.
4. Closing Remarks
To the best of our knowledge, this inter-species perspective comparison is the first attempt to relate disease progression in clinical cases with different mouse models from neurovascular and metabolic dysregulation, metabolic connectomics variations, and metabolic functional changes. Our findings indicate that mouse models can be used to study specific disease mechanisms and phenotypes via the strategic selection of models that encapsulate human progression, as disease stage-dependent alterations can be mimicked. However, the current limitation is that no single mouse model can be used to study the whole disease progression.
From the neurovascular and metabolic uncoupling perspective, clinical MVD changes across the disease spectrum can be mimicked in mice by strategically selecting appropriate models that encompass the risk factor of interest (e.g., humanized genetic models, diet effects, age), and that produces the corresponding phenotype (Figure 1-2). Based on the proposed mouse models for each clinical disease stage, sex-dependent MVD trajectories were consistently observed across both species, indicating that these trajectories are not species-specific. The main difference between humans and mice is that mice exhibit more pronounced phenotypic effects than humans do, consistent with the introduction of novel risk genes, aging, and environmental drivers.
Metabolic connectomics revealed that energy variations and network organization across both species follow similar patterns, which aligns with the multiple brain restructuring[33,38] and bioenergetic theories.[39,40] Changes in the number of clusters and the regions that compose them indicate a reorganization in the communication between regions (Figure 3). At a whole-brain level (Figure 4), changes in connectomics metrics (e.g., node density, clustering coefficient) provide evidence of these network changes. Notably, males follow opposite trends to females in both species, reinforcing the idea that sexual dimorphism is not a species-dependent phenomenon, as seen in previous studies.[18,21]
As can be appreciated from the metabolic functional perspective (Figure 5 and Figure 6), even in the absence of a one-to-one comparison between mice and humans, functional changes can be identified using glycolytic uptake as a surrogate for metabolic readouts. Comparable FSECs for both species show substantial differences across each pair in both males (Figure 5) and females (Figure 6). Moreover, the same metabolic variation pattern was observed in both species, indicating that this may not be an isolated, species-specific phenomenon but rather a biological mechanism the brain uses to meet its bioenergetic demands in the presence of disease (or risk factors in mice).
Overall, AD progression causes a cascade of interconnected structural, metabolic, vascular, behavioral, and cognitive changes. These variations cause brain network reorganization, neurovascular and metabolic dysregulation, accumulation of amyloid and tau tangles, oxidative stress, energy deficits, and neuroinflammation, which lead to neuronal death, synaptic dysfunction, functional changes, and clinical manifestations (e.g., memory decline, linguistic deficits, spatial orientation, and cognitive degradation). While mouse models may mimic key features of human pathology, including amyloid deposition, tau aggregation, and behavioral changes, connecting these across species relies increasingly on quantitative integrative measures. Moreover, some aspects are challenging to translate across species due to differences in brain complexity. Specialized species-independent frameworks may permit partial alignment of these changes across species. However, without a mouse model that captures the whole progression of human AD, the strategic selection of experimental and reference models is required. Thus, providing a framework with the potential to bridge the translational gap between mouse models and clinical AD subjects.
Author Contributions
JAKCC contributed to the study design, data collection and management, data analysis and interpretation, data quality assessment, literature review, and manuscript drafting. SAC participated in study design, data collection and management, data analysis, and quality assessment. ORS and AC did literature search for functional analysis of the brain regions. PS provided statistical and image analysis advice, participated in data interpretation, and helped write the manuscript. PRT contributed to the study design, data analysis and interpretation, and helped write and edit the manuscript. JAKCC, PRT, and SAC had access to all raw data. JAKCC, PRT, PS, and SAC verified the data and results. All authors helped revise the manuscript. All authors had final responsibility for the decision to submit for publication.
Funding
JAKCC was supported by a T32 post-doctoral fellowship from Stark Neuroscience Research Institute (NIH grant T32AG071444). The funders had no role in study design, data collection and analysis, decision to publish, or preparation of the manuscript.
Ethics Committee Approval
Ethics approval was not required for this study.
Data Sharing
The clinical data that support the findings of this study were obtained from the Alzheimer's Disease Neuroimaging Initiative (ADNI), which is available from the ADNI database (https://adni.loni.usc.edu) upon registration and compliance with the data use agreement. The preclinical data that support the findings of this study were obtained from the MODEL-AD data sets, available via the AD Knowledge Portal (https://adknowledgeportal.org). Data is available for general research use according to the following requirements for data access and data attribution (https://adknowledgeportal.org/DataAccess/Instructions).
Acknowledgments
Data collection and sharing for this project was funded by the Alzheimer's Disease Neuroimaging Initiative (ADNI) (National Institutes of Health Grant U01 AG024904) and DOD ADNI (Department of Defense award number W81XWH-12-2-0012). ADNI is funded by the National Institute on Aging, the National Institute of Biomedical Imaging and Bioengineering, and through generous contributions from the following: AbbVie, Alzheimer’s Association; Alzheimer’s Drug Discovery Foundation; Araclon Biotech; BioClinica, Inc.; Biogen; Bristol-Myers Squibb Company; CereSpir, Inc.; Cogstate; Eisai Inc.; Elan Pharmaceuticals, Inc.; Eli Lilly and Company; EuroImmun; F. Hoffmann-La Roche Ltd and its affiliated company Genentech, Inc.; Fujirebio; GE Healthcare; IXICO Ltd.; Janssen Alzheimer Immunotherapy Research & Development, LLC.; Johnson & Johnson Pharmaceutical Research & Development LLC.; Lumosity; Lundbeck; Merck & Co., Inc.; Meso Scale Diagnostics, LLC.; NeuroRx Research; Neurotrack Technologies; Novartis Pharmaceuticals Corporation; Pfizer Inc.; Piramal Imaging; Servier; Takeda Pharmaceutical Company; and Transition Therapeutics. The Canadian Institutes of Health Research is providing funds to support ADNI clinical sites in Canada. Private sector contributions are facilitated by the Foundation for the National Institutes of Health (www.fnih.org). The grantee organization is the Northern California Institute for Research and Education, and the study is coordinated by the Alzheimer’s Therapeutic Research Institute at the University of Southern California. ADNI data are disseminated by the Laboratory for Neuro Imaging at the University of Southern California. The MODEL-AD Center was supported through funding by NIA grant U54AG054345.
Conflicts of Interest
We declare no competing interests.
References
- Dominguez-Oliva, A., I. Hernandez-Avalos, J. Martinez-Burnes, et al., The Importance of Animal Models in Biomedical Research: Current Insights and Applications. Animals (Basel), 2023. 13(7). [CrossRef]
- Mukherjee, P., S. Roy, D. Ghosh, et al., Role of animal models in biomedical research: a review. Lab Anim Res, 2022. 38(1): p. 18. [CrossRef]
- Wang, Q., B.T. Zhu,P. Lei, Animal models of Alzheimer's disease: Current strategies and new directions. Zool Res, 2024. 45(6): p. 1385-1407.
- Ye, W.,Q. Chen, Potential Applications and Perspectives of Humanized Mouse Models. Annu Rev Anim Biosci, 2022. 10: p. 395-417. [CrossRef]
- Hickman, D., J. Johnson, T.H. Vemulapalli, et al., Commonly used animal models. Principles of animal research for graduate and undergraduate students, 2016: p. 117.
- Polis, B.,A.O. Samson, Addressing the Discrepancies Between Animal Models and Human Alzheimer's Disease Pathology: Implications for Translational Research. J Alzheimers Dis, 2024. 98(4): p. 1199-1218. [CrossRef]
- Ineichen, B.V., E. Furrer, S.L. Gruninger, et al., Analysis of animal-to-human translation shows that only 5% of animal-tested therapeutic interventions obtain regulatory approval for human applications. PLoS Biol, 2024. 22(6): p. e3002667. [CrossRef]
- Chang, M.C.J.,F.B. Grieder, The continued importance of animals in biomedical research. Lab Anim (NY), 2024. 53(11): p. 295-297. [CrossRef]
- McGonigle, P.,B. Ruggeri, Animal models of human disease: challenges in enabling translation. Biochem Pharmacol, 2014. 87(1): p. 162-71. [CrossRef]
- Mahalmani, V., S. Sinha, A. Prakash, et al., Translational research: Bridging the gap between preclinical and clinical research. Indian J Pharmacol, 2022. 54(6): p. 393-396.
- Austin, C.P., Opportunities and challenges in translational science. Clin Transl Sci, 2021. 14(5): p. 1629-1647. [CrossRef]
- Rhrissorrakrai, K., V. Belcastro, E. Bilal, et al., Understanding the limits of animal models as predictors of human biology: lessons learned from the sbv IMPROVER Species Translation Challenge. Bioinformatics, 2015. 31(4): p. 471-83. [CrossRef]
- Perse, M., Animal Models of Human Pathology: Revision, Relevance and Refinements. Biomedicines, 2024. 12(11). [CrossRef]
- Lairmore, M.D.,C. Khanna, Naturally occurring diseases in animals: contributions to translational medicine. ILAR J, 2014. 55(1): p. 1-3. [CrossRef]
- Balamayooran, G., M. Pena, R. Sharma, et al., The armadillo as an animal model and reservoir host for Mycobacterium leprae. Clin Dermatol, 2015. 33(1): p. 108-15. [CrossRef]
- Oblak, A.L., S. Forner, P.R. Territo, et al., Model organism development and evaluation for late-onset Alzheimer's disease: MODEL-AD. Alzheimers Dement (N Y), 2020. 6(1): p. e12110. [CrossRef]
- Onos, K., P.B. Lin, R.S. Pandey, et al., Assessment of Neurovascular Uncoupling: APOE Status is a Key Driver of Early Metabolic and Vascular Dysfunction. bioRxiv, 2024. [CrossRef]
- Chumin, E.J., C.P. Burton, R. Silvola, et al., Brain metabolic network covariance and aging in a mouse model of Alzheimer's disease. Alzheimers Dement, 2024. 20(3): p. 1538-1549. [CrossRef]
- Xu, Q.-Q., W. Yang, M. Zhong, et al., Animal models of Alzheimer’s disease: preclinical insights and challenges. Acta Materia Medica, 2023. 2(2): p. 192-215. [CrossRef]
- Chong Chie, J.K., S.A. Persohn, R.S. Pandey, et al., Neuro-Metabolic and Vascular Dysfunction as an Early Diagnostic for Alzheimer's Disease and Related Dementias. bioRxiv, 2025.
- Chong Chie, J.K., S.A. Persohn, R.S. Pandey, et al., Multiscale Metabolic Covariance Networks Uncover Stage-Specific Biomarker Signatures Across the Alzheimer's Disease Continuum. bioRxiv, 2025.
- Mueller, S.G., M.W. Weiner, L.J. Thal, et al., The Alzheimer's disease neuroimaging initiative. Neuroimaging Clin N Am, 2005. 15(4): p. 869-77, xi-xii.
- Mutsaerts, H., J. Petr, P. Groot, et al., ExploreASL: An image processing pipeline for multi-center ASL perfusion MRI studies. Neuroimage, 2020. 219: p. 117031. [CrossRef]
- Kotredes, K.P., R.S. Pandey, S. Persohn, et al., Characterizing molecular and synaptic signatures in mouse models of late-onset Alzheimer's disease independent of amyloid and tau pathology. Alzheimers Dement, 2024. 20(6): p. 4126-4146. [CrossRef]
- Oblak, A.L., K.P. Kotredes, R.S. Pandey, et al., Plcg2(M28L) Interacts With High Fat/High Sugar Diet to Accelerate Alzheimer's Disease-Relevant Phenotypes in Mice. Front Aging Neurosci, 2022. 14: p. 886575. [CrossRef]
- Paxinos, G.,K. Franklin, The mouse brain in stereotaxic coordinates. San Diego: Academic Press, 2001. 200(1): p. 65-69.
- Foley, K.E., A.A. Hewes, D.T. Garceau, et al., The APOE (epsilon3/epsilon4) Genotype Drives Distinct Gene Signatures in the Cortex of Young Mice. Front Aging Neurosci, 2022. 14: p. 838436.
- Bryant, C.D., The blessings and curses of C57BL/6 substrains in mouse genetic studies. Ann N Y Acad Sci, 2011. 1245: p. 31-3. [CrossRef]
- Heneka, M.T., W.M. van der Flier, F. Jessen, et al., Neuroinflammation in Alzheimer disease. Nat Rev Immunol, 2025. 25(5): p. 321-352.
- Xiang, X., K. Wind, T. Wiedemann, et al., Microglial activation states drive glucose uptake and FDG-PET alterations in neurodegenerative diseases. Sci Transl Med, 2021. 13(615): p. eabe5640. [CrossRef]
- Shen, L., S. Kim, S.L. Risacher, et al., Whole genome association study of brain-wide imaging phenotypes for identifying quantitative trait loci in MCI and AD: A study of the ADNI cohort. Neuroimage, 2010. 53(3): p. 1051-63. [CrossRef]
- Kazemeini, S., A. Nadeem-Tariq, R. Shih, et al., From Plaques to Pathways in Alzheimer's Disease: The Mitochondrial-Neurovascular-Metabolic Hypothesis. Int J Mol Sci, 2024. 25(21). [CrossRef]
- Demetrius, L.A., A. Eckert,A. Grimm, Sex differences in Alzheimer's disease: metabolic reprogramming and therapeutic intervention. Trends Endocrinol Metab, 2021. 32(12): p. 963-979. [CrossRef]
- Pandey, R.S., M. Arnold, R. Batra, et al., Metabolomics profiling reveals distinct, sex-specific signatures in serum and brain metabolomes in mouse models of Alzheimer's disease. Alzheimers Dement, 2024. 20(6): p. 3987-4001. [CrossRef]
- van Hout, A.T.B., S. van Heukelum, M.F.S. Rushworth, et al., Comparing mouse and human cingulate cortex organization using functional connectivity. Brain Struct Funct, 2024. 229(8): p. 1913-1925.
- Yuan, Y., G. Zhao,Y. Zhao, Dysregulation of energy metabolism in Alzheimer's disease. J Neurol, 2024. 272(1): p. 2. [CrossRef]
- Karch, C.M., C. Cruchaga,A.M. Goate, Alzheimer's disease genetics: from the bench to the clinic. Neuron, 2014. 83(1): p. 11-26. [CrossRef]
- Demetrius, L.A., P.J. Magistretti,L. Pellerin, Alzheimer's disease: the amyloid hypothesis and the Inverse Warburg effect. Front Physiol, 2014. 5: p. 522. [CrossRef]
- Cunnane, S., S. Nugent, M. Roy, et al., Brain fuel metabolism, aging, and Alzheimer's disease. Nutrition, 2011. 27(1): p. 3-20. [CrossRef]
- Zhang, X., N. Alshakhshir,L. Zhao, Glycolytic Metabolism, Brain Resilience, and Alzheimer's Disease. Front Neurosci, 2021. 15: p. 662242. [CrossRef]
- Huls, A., Y. Tan, E. Casey, et al., Metabolic dysregulation in Alzheimer's disease: A brain metabolomics approach. Alzheimers Dement, 2025. 21(9): p. e70528. [CrossRef]
- Bai, R., J. Guo, X.Y. Ye, et al., Oxidative stress: The core pathogenesis and mechanism of Alzheimer's disease. Ageing Res Rev, 2022. 77: p. 101619. [CrossRef]
- Chen, Z., Z. Yuan, S. Yang, et al., Brain Energy Metabolism: Astrocytes in Neurodegenerative Diseases. CNS Neurosci Ther, 2023. 29(1): p. 24-36. [CrossRef]
- Herculano-Houzel, S.,D.L. Rothman, From a Demand-Based to a Supply-Limited Framework of Brain Metabolism. Front Integr Neurosci, 2022. 16: p. 818685. [CrossRef]
- Kanungo, S., K. Wells, T. Tribett, et al., Glycogen metabolism and glycogen storage disorders. Ann Transl Med, 2018. 6(24): p. 474. [CrossRef]
- Longman, D., J.T. Stock,J.C.K. Wells, A trade-off between cognitive and physical performance, with relative preservation of brain function. Sci Rep, 2017. 7(1): p. 13709. [CrossRef]
- Kuzawa, C.W., H.T. Chugani, L.I. Grossman, et al., Metabolic costs and evolutionary implications of human brain development. Proc Natl Acad Sci U S A, 2014. 111(36): p. 13010-5. [CrossRef]
- Park, J.C., H. Lim, M.S. Byun, et al., Sex differences in the progression of glucose metabolism dysfunction in Alzheimer's disease. Exp Mol Med, 2023. 55(5): p. 1023-1032. [CrossRef]
- Price, B.R., K.A. Walker, J.M. Eissman, et al., Sex differences and the role of estrogens in the immunological underpinnings of Alzheimer's disease. Alzheimers Dement (N Y), 2025. 11(3): p. e70139. [CrossRef]
- Sala, A., A. Lizarraga, S.P. Caminiti, et al., Brain connectomics: time for a molecular imaging perspective? Trends Cogn Sci, 2023. 27(4): p. 353-366. [CrossRef]
- Rubinov, M.,O. Sporns, Complex network measures of brain connectivity: uses and interpretations. Neuroimage, 2010. 52(3): p. 1059-69. [CrossRef]
- Mucha, P.J., T. Richardson, K. Macon, et al., Community structure in time-dependent, multiscale, and multiplex networks. Science, 2010. 328(5980): p. 876-8. [CrossRef]
- Safiri, S., A. Ghaffari Jolfayi, A. Fazlollahi, et al., Alzheimer's disease: a comprehensive review of epidemiology, risk factors, symptoms diagnosis, management, caregiving, advanced treatments and associated challenges. Front Med (Lausanne), 2024. 11: p. 1474043. [CrossRef]
- Amend, M., T.M. Ionescu, X. Di, et al., Functional resting-state brain connectivity is accompanied by dynamic correlations of application-dependent [(18)F]FDG PET-tracer fluctuations. Neuroimage, 2019. 196: p. 161-172. [CrossRef]
- Xu, N., T.J. LaGrow, N. Anumba, et al., Functional Connectivity of the Brain Across Rodents and Humans. Front Neurosci, 2022. 16: p. 816331.
- Takado, Y., M. Mishkovsky,T. Tsurugizawa, Editorial: Imaging brain network and brain energy metabolism impairments in brain disorders. Front Mol Neurosci, 2025. 18: p. 1676946. [CrossRef]
- Brynildsen, J.K., K. Rajan, M.X. Henderson, et al., Network models to enhance the translational impact of cross-species studies. Nat Rev Neurosci, 2023. 24(9): p. 575-588. [CrossRef]
- Beauchamp, A., Y. Yee, B.C. Darwin, et al., Whole-brain comparison of rodent and human brains using spatial transcriptomics. Elife, 2022. 11. [CrossRef]
Figure 1.
– Uncoupling Migration Charts for Clinical (Human) and Preclinical (Mice) Brain Regions. Using the uncoupling migration charts (UMC) framework developed by our lab,[20] we evaluated the progression of the different brain regions across the MVD pattern. Each clinical disease stage was matched with an appropriate experimental or reference preclinical model. For the clinical subjects, each disease stage was compared relative to the cognitive normal (CN) population. However, the notation for the preclinical cases is the following: Experimental Population (Reference Population) @age.
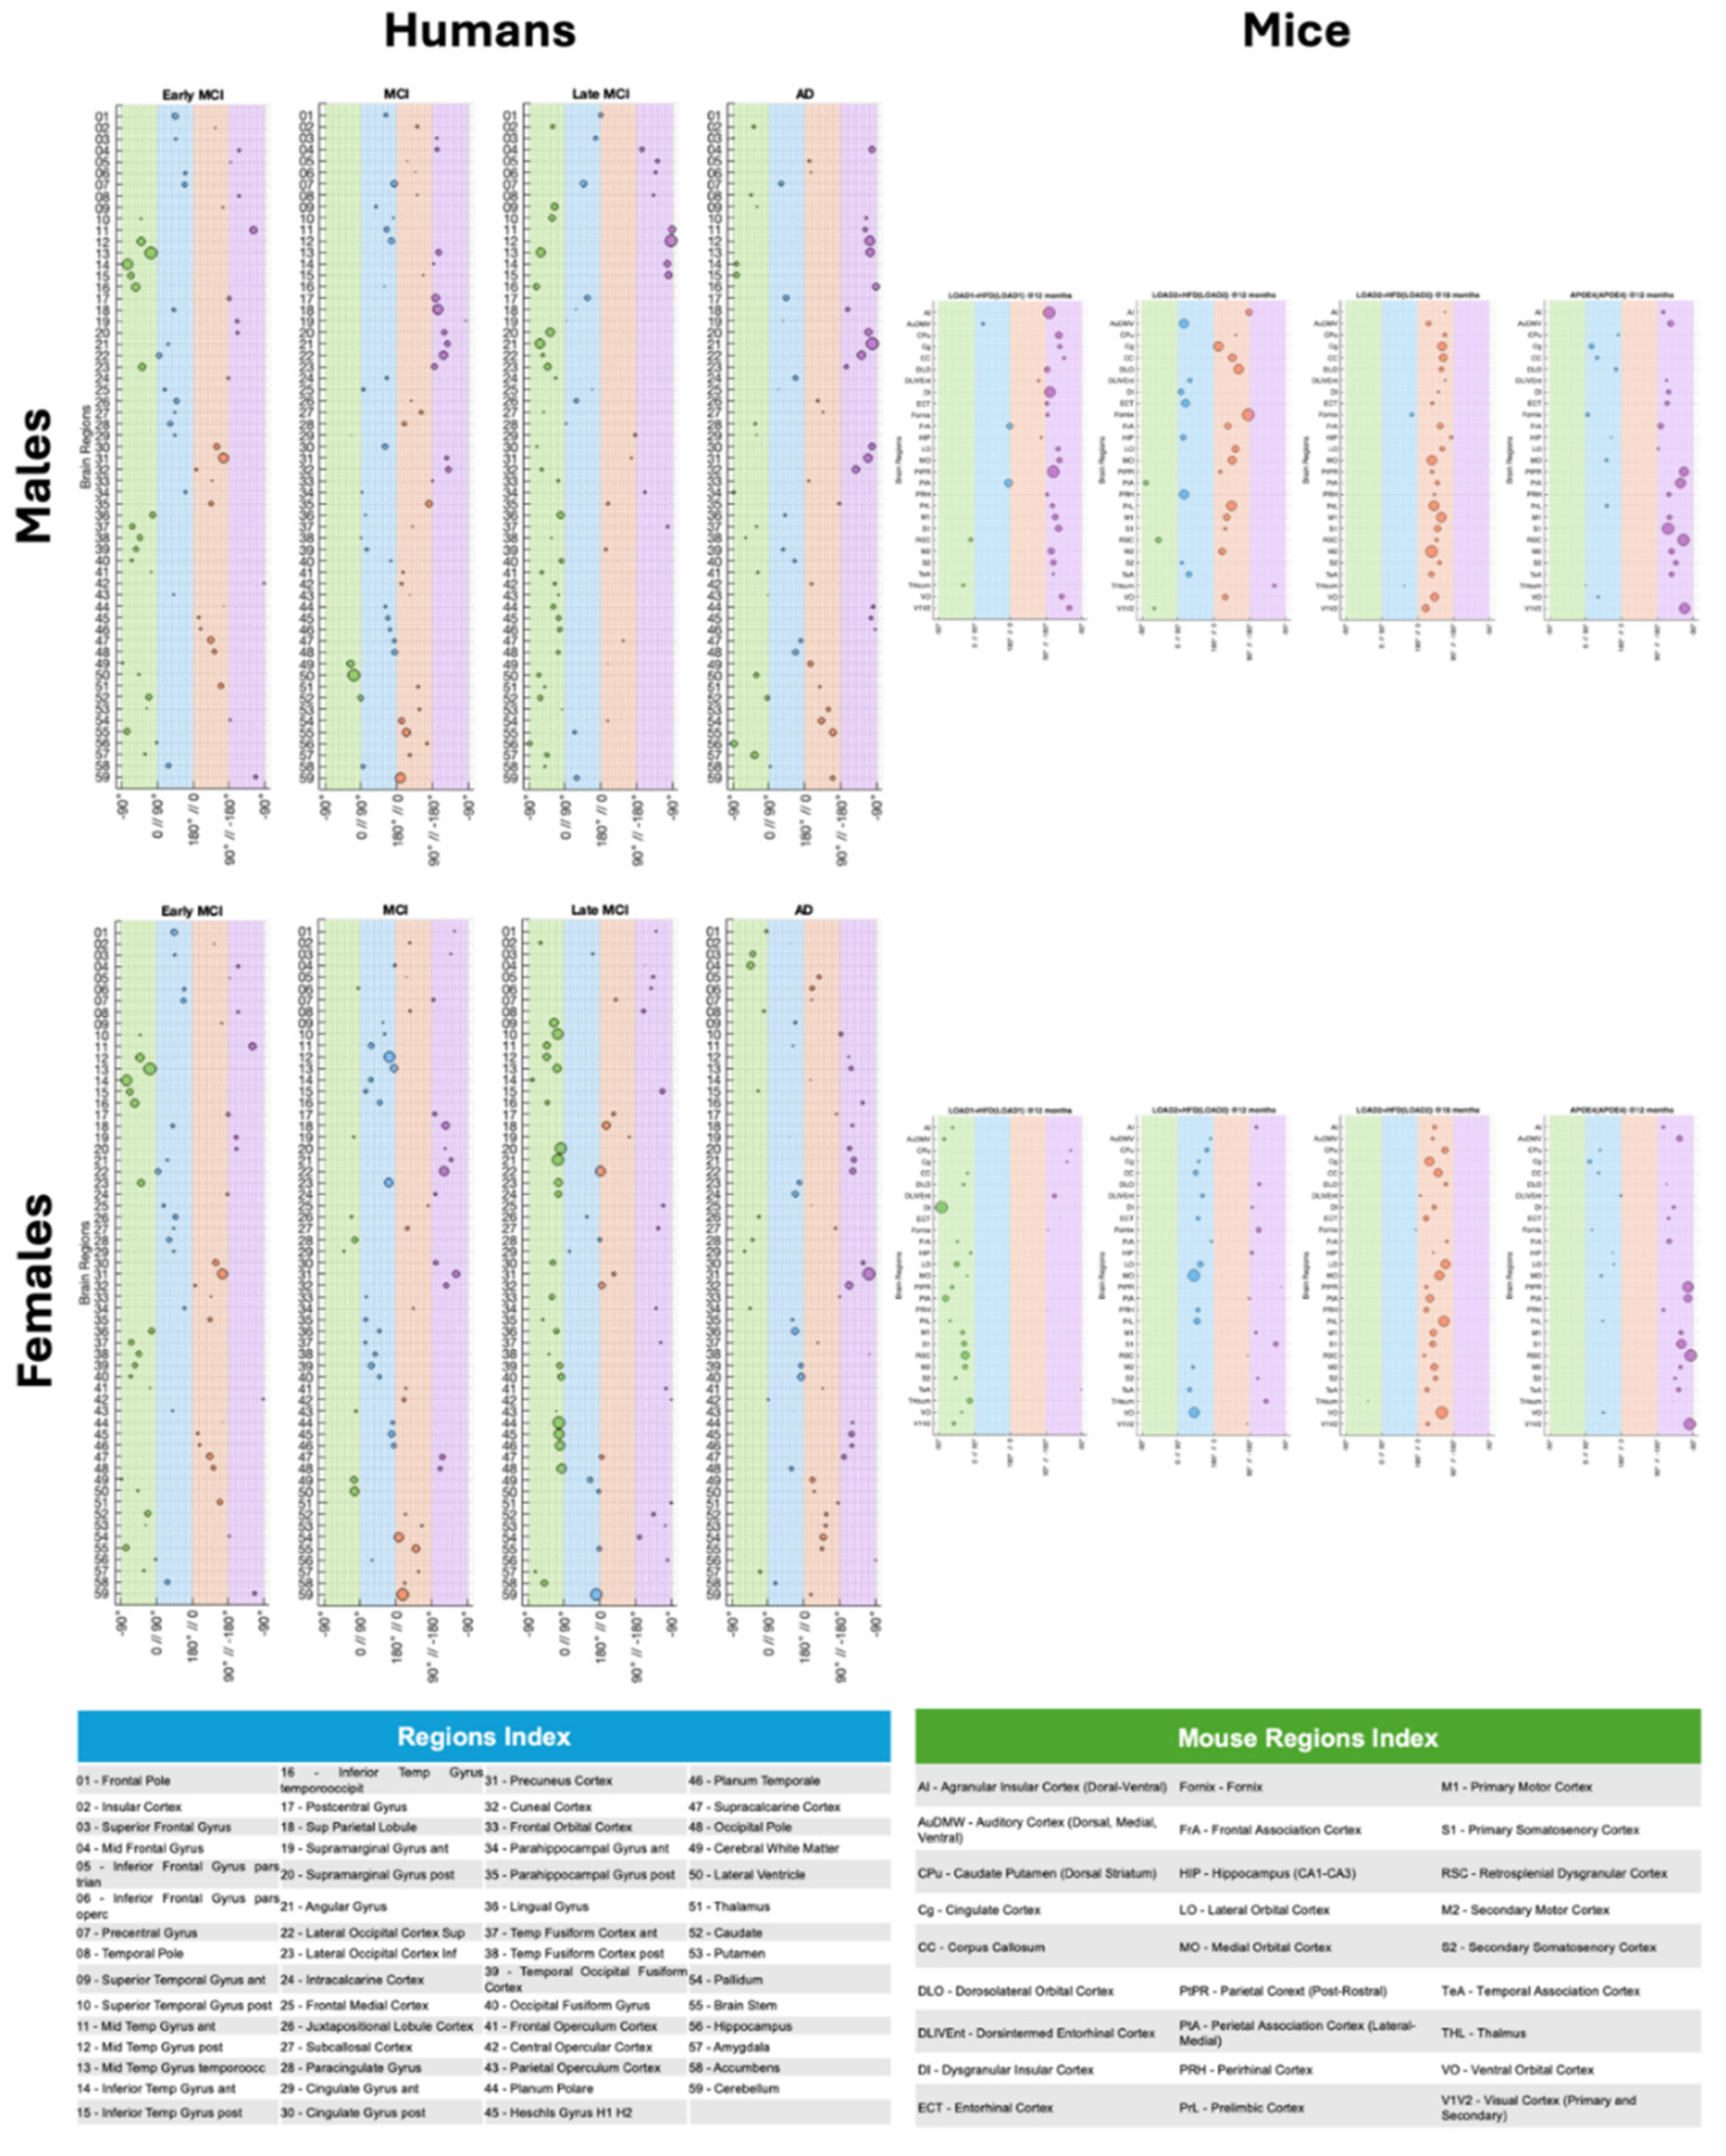
Figure 2.
– Neuro-metabolic and Vascular Dysregulation Charts. Using the MVD framework developed by our lab,[17,20] we assessed dysregulation between brain perfusion and metabolism in both species. Each clinical disease stage was matched with an appropriate experimental or reference mouse model. This comparison demonstrates that carefully selecting the experimental or reference model can produce a clinical disease phenotype that closely resembles that of humans. However, it is important to note that mice often exhibit more pronounced phenotypes, showing larger changes than those seen in humans.
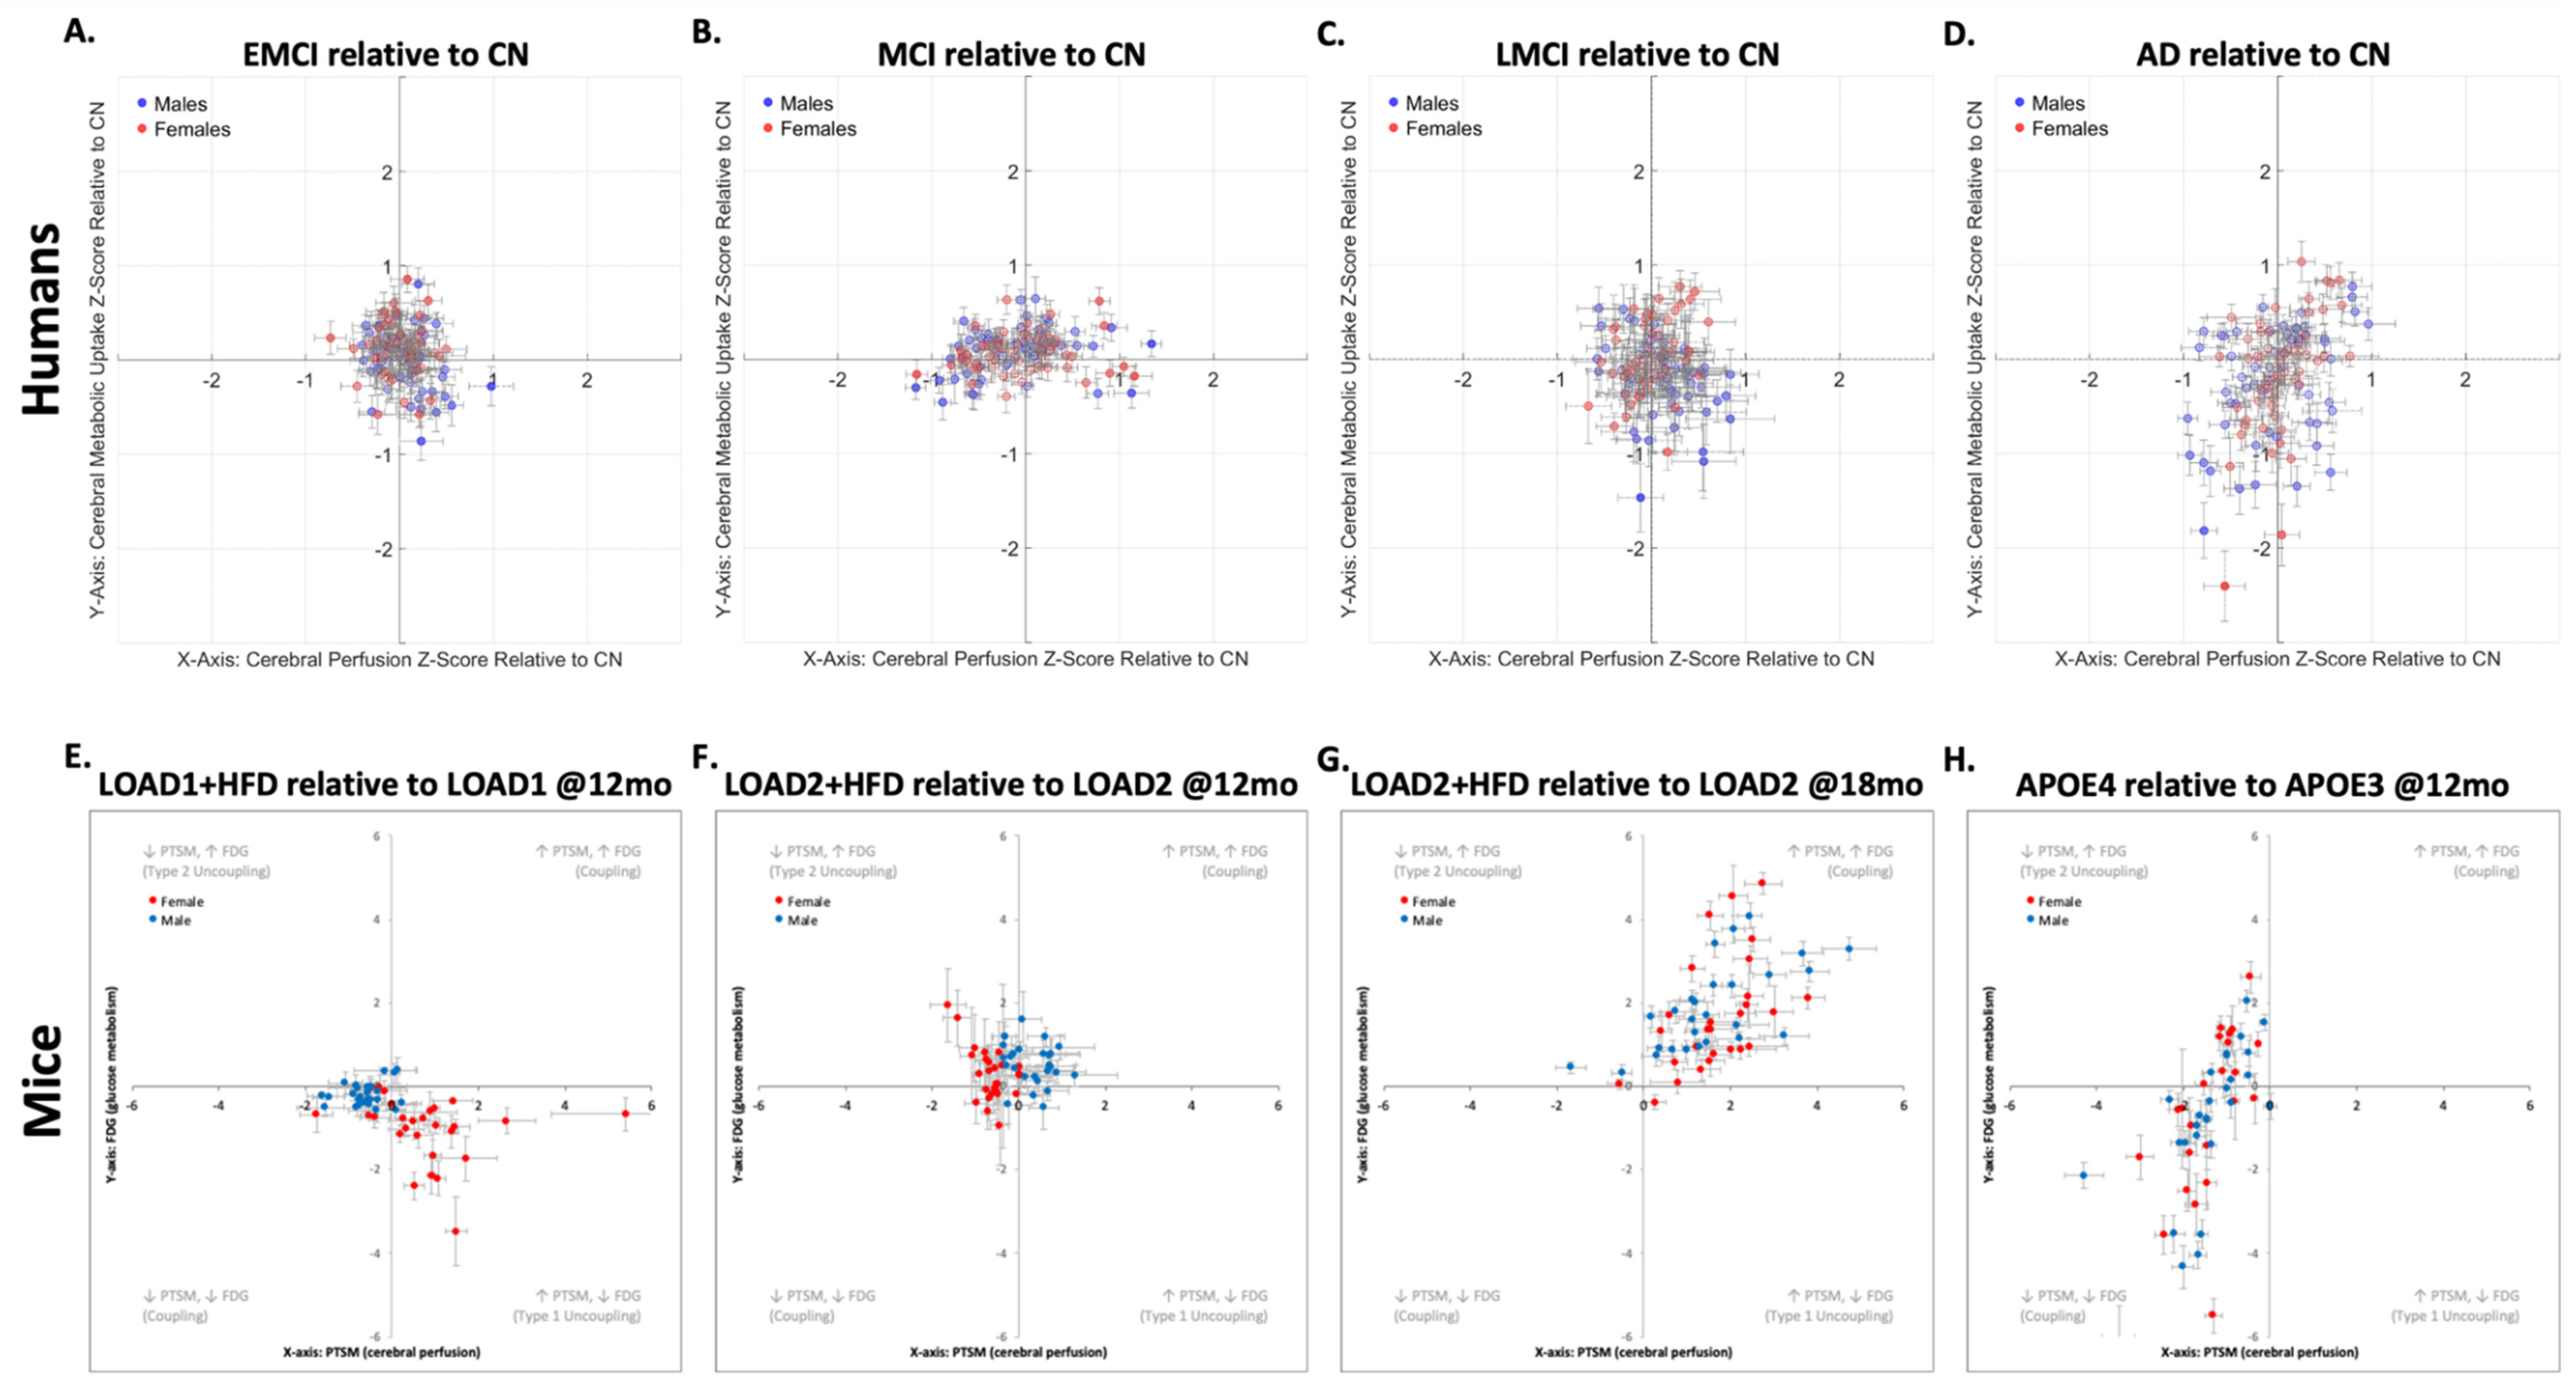
Figure 3.
– Metabolic Connectomics Matrices and Multiresolution Consensus Analysis Results.Metabolic connectomics matrices obtained using SURV values from 18F-FDG PET images for both species. The regions' clusters were obtained using multiresolution consensus clustering. In both humans and mice, male cases, the number of clusters decreases (humans: 10 to 3; mice: 4 to 3), indicating that the brain networks become more integrated in the presence of disease risk factors. On the other hand, females exhibit the opposite behavior (humans: 5 to 15; mice: 3 to 7), indicating more fractured brain networks.
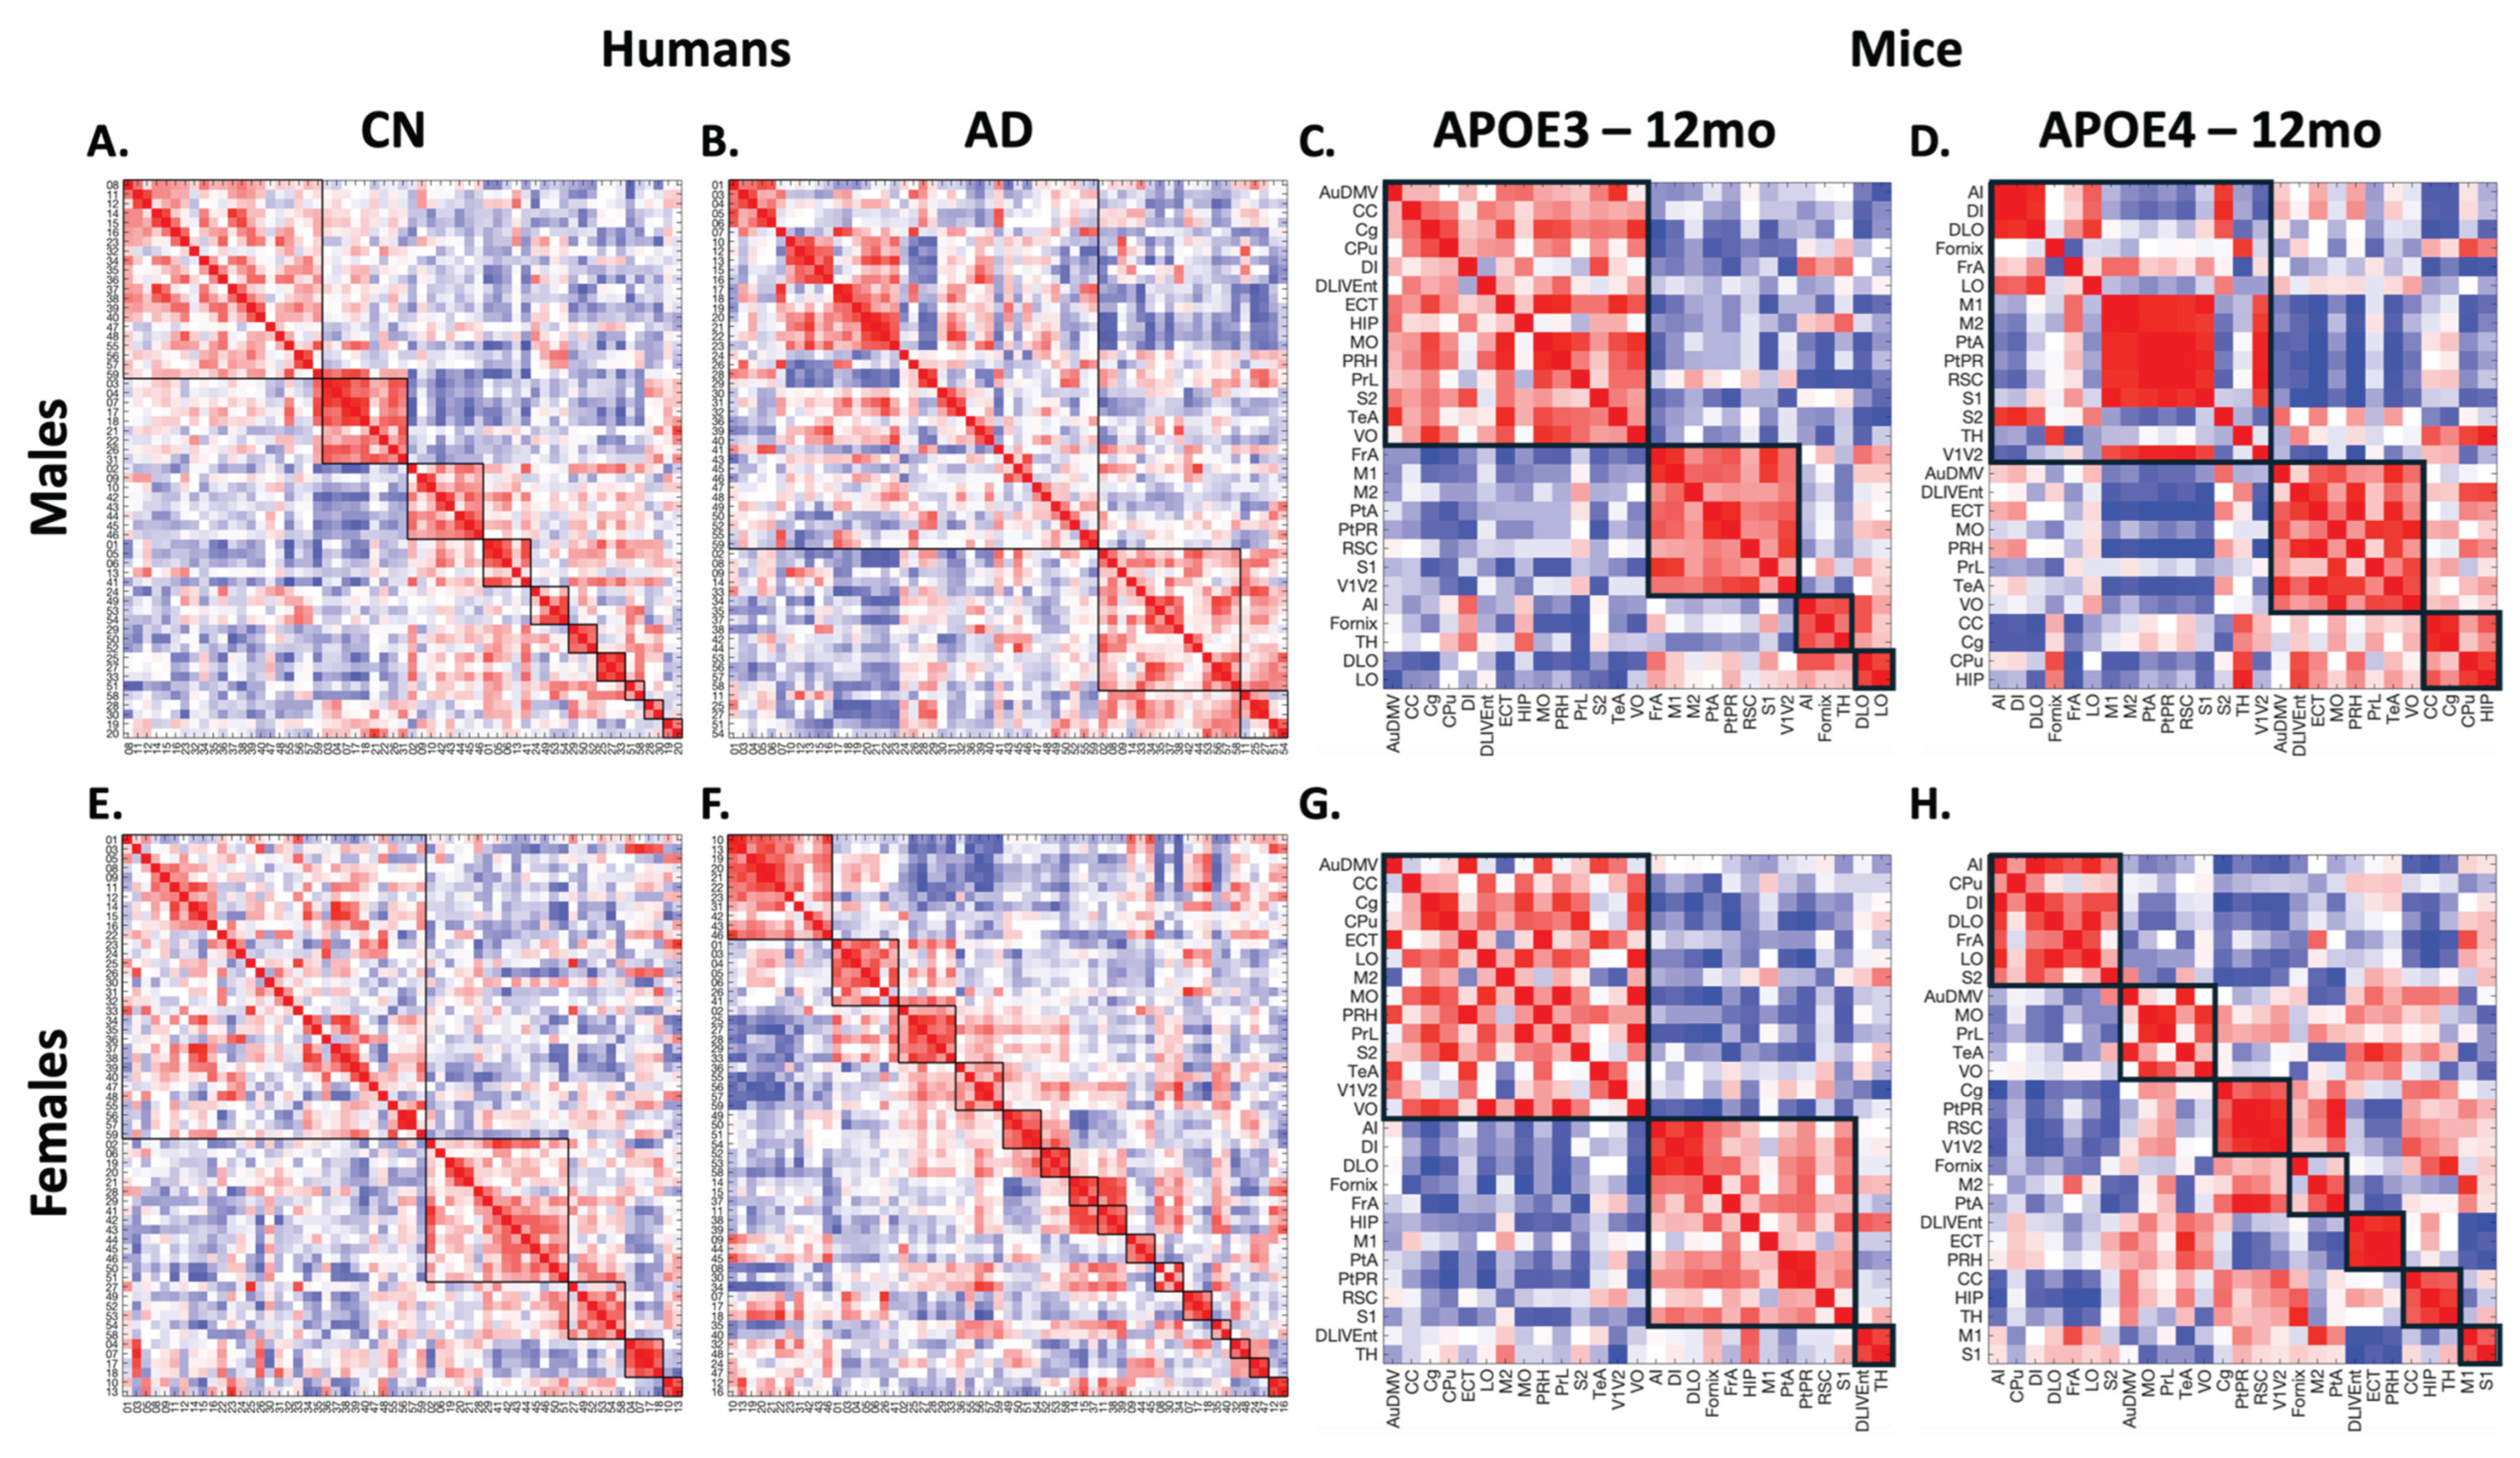
Figure 4.
– Whole Brain Metabolic Network Metrics. Connectomics metrics for each human AD disease stage group (CN, EMCI, MCI, LMCI, AD) and mouse model (B6, LOAD1 ±HFD (12 months), LOAD2±HFD (12 months and 18 months), APOE3, APOE4). These metrics capture the brain network reorganization that occurs with disease progression in humans and the effects of different risk factors (e.g., age, genes, diet) in mice. While males and females exhibit different behaviors, the inter-species comparison reveals that these metrics follow similar trends.
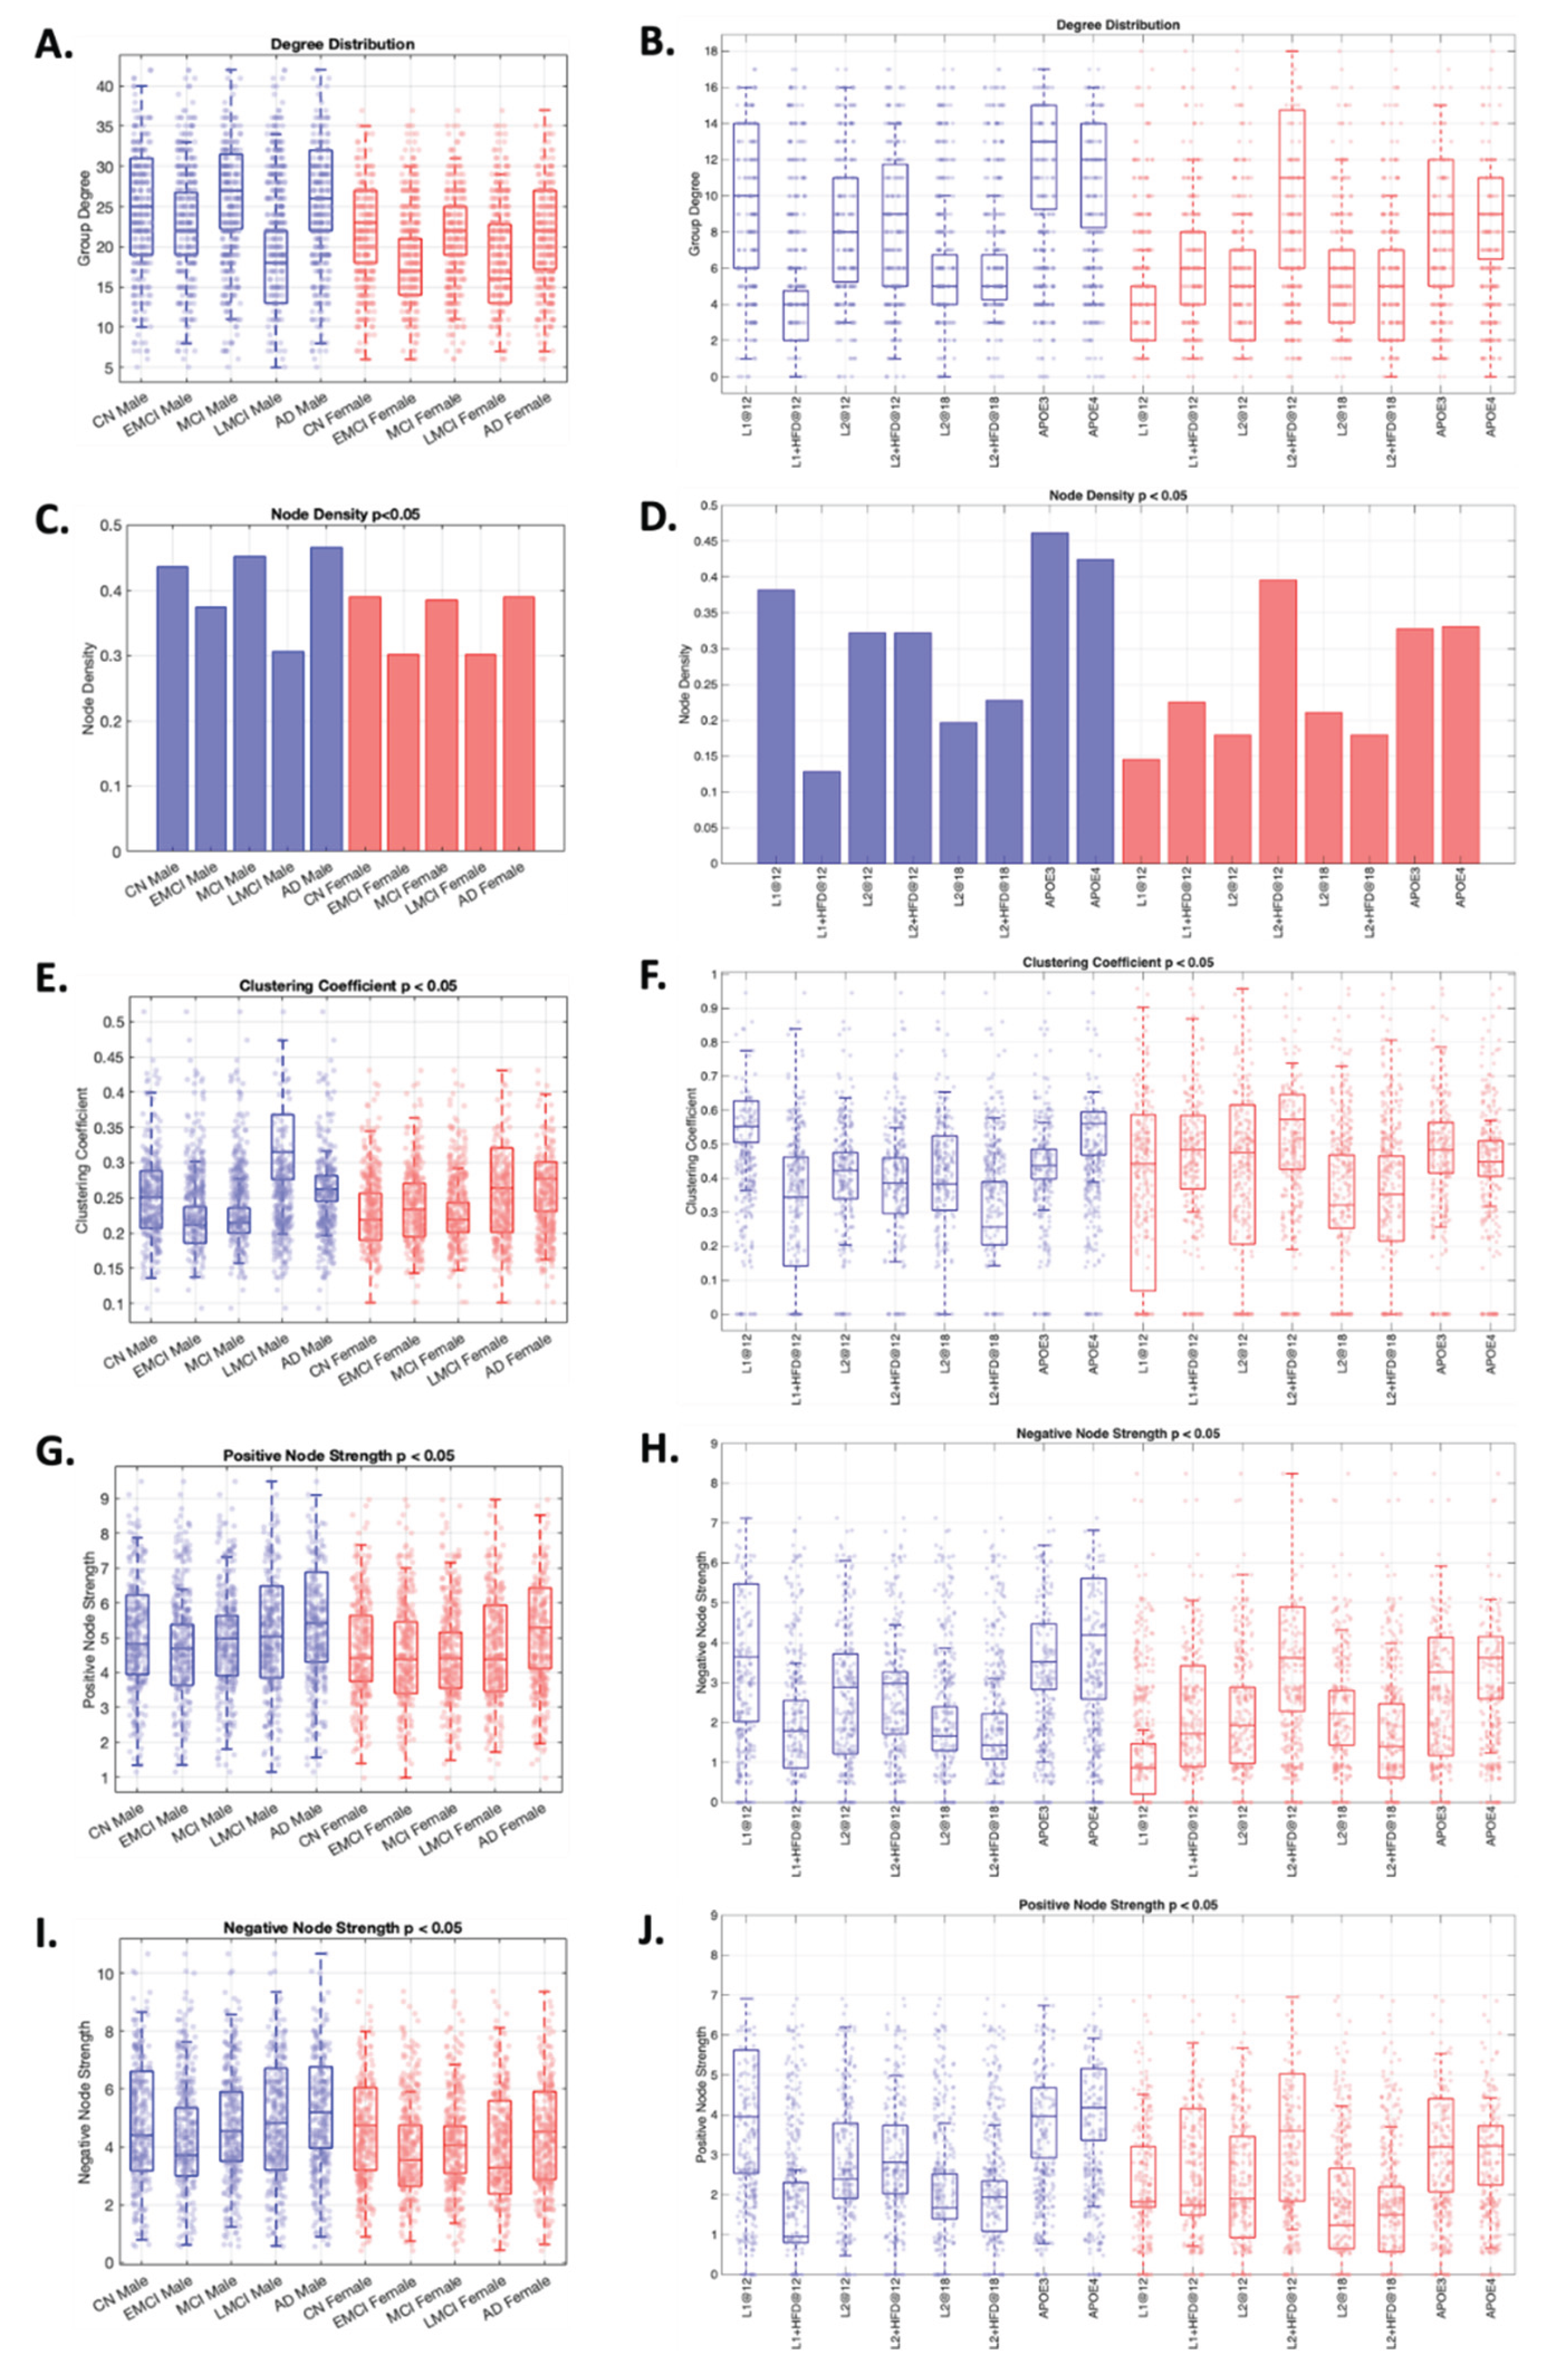
Figure 5.
– Males RSEA results for Humans and Mice. RSEA was performed using the modules obtained for CN in humans and B6 in mice, using multiresolution consensus clustering. This analysis reveals similar changes across both species: they start with a hypometabolic phase in key functional categories, then enter a hypermetabolic phase, and end in a hypometabolic phase. The hypermetabolic phase is a compensatory response the brain uses to meet its high energy demand, and the second hypometabolic phase occurs when the brain fails to meet its bioenergetic demand.
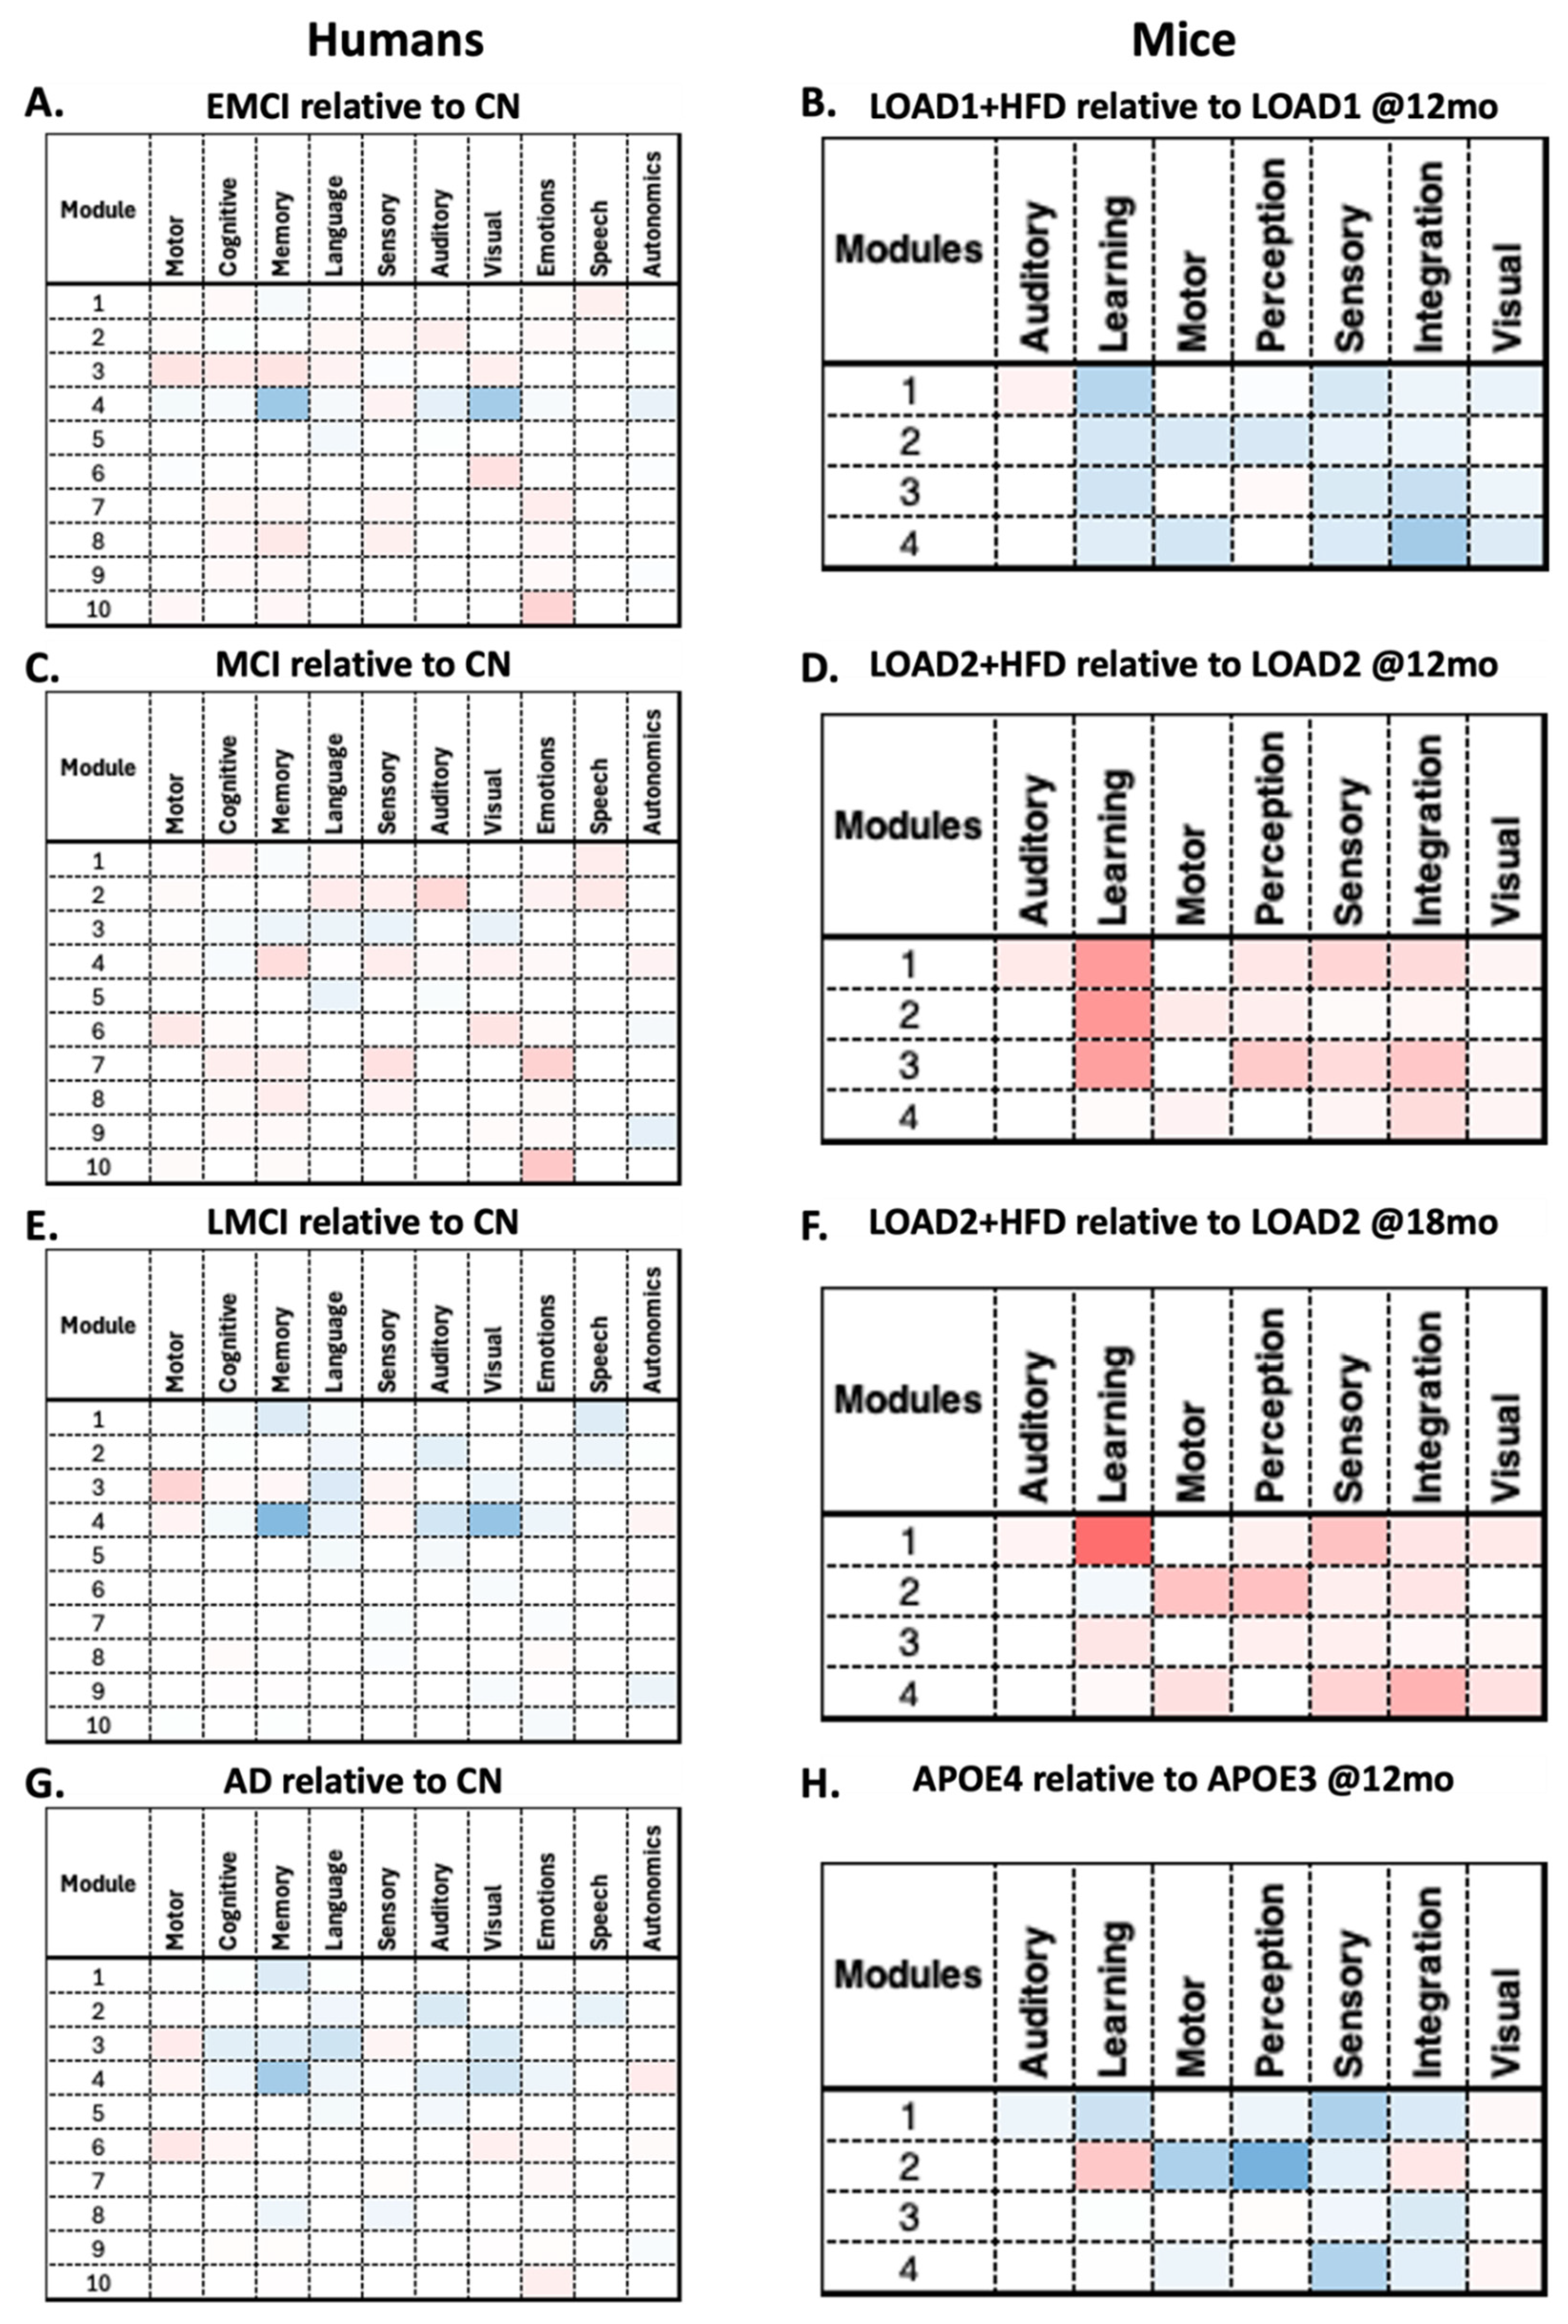
Figure 6.
– Females RSEA results for Human and Mice. As in the male cases, the modules used were obtained from CN for the human cases and from B6 for the mouse cases. The same trend in metabolic fluctuations observed in males can also be seen in females. Comparable key functional categories between species are: motor, cognition, memory, and language in humans, and motor, perception, learning, and integration in mice. These metabolic changes are supported by the brain reorganization[33,38] and energy deficits[39,40] theories.
Disclaimer/Publisher’s Note: The statements, opinions and data contained in all publications are solely those of the individual author(s) and contributor(s) and not of MDPI and/or the editor(s). MDPI and/or the editor(s) disclaim responsibility for any injury to people or property resulting from any ideas, methods, instructions or products referred to in the content. |
© 2025 by the authors. Licensee MDPI, Basel, Switzerland. This article is an open access article distributed under the terms and conditions of the Creative Commons Attribution (CC BY) license (http://creativecommons.org/licenses/by/4.0/).
Copyright: This open access article is published under a Creative Commons CC BY 4.0 license, which permit the free download, distribution, and reuse, provided that the author and preprint are cited in any reuse.


