
Submitted:
31 January 2025
Posted:
03 February 2025
You are already at the latest version
Abstract
Alzheimer’s disease (AD) is a complex, genetically heterogeneous disorder. The diverse phenotypes associated with AD result from intricate interactions between genetic and environmental factors, influencing multiple biological pathways throughout disease progression. Network-based approaches offer a comprehensive way to assess phenotype-specific states. In this study, we calculated key network metrics to characterize the network transcriptional structure and organization in LOAD, focusing on genes and pathways implicated in AD pathology within the dorsolateral prefrontal cortex (DLPFC). Our findings revealed disease-specific coexpression markers associated with diverse metabolic functions. Additionally, significant differences were observed at both the mesoscopic and local levels between AD and control networks, along with a restructuring of gene coexpression and biological functions into distinct transcriptional modules. These results show the molecular reorganization of the transcriptional program occurring in LOAD, highlighting specific adaptations that may contribute to or result from cellular responses to pathological stressors. Our findings may support the development of a unified model for the causal mechanisms of AD, suggesting that its diverse manifestations arise from multiple pathways working together to produce the disease’s complex clinical patho-phenotype.
Keywords:
Alzheimer's disease
; LOAD
; Gene Co-expression Networks
; Network Analytics
1. Introduction
Alzheimer’s disease (AD) is a clinical-pathophysiological entity, currently conceptualized as a continuum [1]. It is marked by the presence of dementia symptoms alongside specific molecular biomarkers. AD is commonly categorized as early-onset (EOAD) or late-onset (LOAD) based on an age cut-off, typically 65 years [2]. LOAD is the most prevalent neurodegenerative disorder in older adults. It affects 5%–10% of this population, with prevalence rising to 50% in individuals over 85 years old [3]. Aging is the most important risk factor for the development of AD [4]. The rise in the aging population, along with enhanced longevity, underscores the imperative for the prevention and treatment of progressive neurodegenerative diseases, particularly LOAD [5].
LOAD has been linked to disruptions in multiple biological pathways, often occurring simultaneously during disease progression. The condition presents significant complexity in both its underlying causes and clinical symptoms. The diverse molecular phenotypes observed in complex diseases such as LOAD arise from the coaction between genetic predispositions and environmental factors, which together influence various pathways and processes. For example, genetic variants associated with LOAD can impact multiple biological systems, including immune dysfunction, altered lipid metabolism, and neuroinflammation [6,7]. Additionally, a spectrum of other prevalent and complex disorders has been linked to an increased risk of developing Alzheimer’s disease [8,9,10,11,12], including other psychiatric disorders [13,14,15]. Research in this area has significantly advanced our understanding of the biological and environmental foundation of Alzheimer’s disease, particularly its association with –amyloid and tau-related mechanisms. However, the precise molecular events and biological pathways driving the disease remain elusive. This genetic heterogeneity poses substantial challenges for the development of targeted therapies and the identification of disease-associated molecular changes. Moreover, the limited understanding of how these pathological molecular events interconnect further impede the discovery of effective therapeutic targets. Given the intricate genetic interactions involved in LOAD, the condition presents a compelling case for investigation through network analysis.
Post-mortem diagnosis of AD is staged by the severity and distribution of these pathological hallmarks: extracellular -amyloid deposits and intracellular neurofibrillary tangles (NFTs) in neurons [16]. Tangles initially emerge in the entorhinal cortex (Braak stages I–II), subsequently spreading to the hippocampus and thalamus (Braak stages III–IV), and ultimately reaching the neocortex (Braak stages V–VI). This progression generally correlates with the worsening of cognitive function, ranging from mild cognitive impairment to severe dementia [16,17,18]. The dorsolateral prefrontal cortex (DLPFC) is located in the middle frontal gyrus (MFG) of the frontal lobe of the neocortex. It’s an area in the prefrontal cortex, which is not an anatomical structure, but a functional one, located in the lateral part of the 9 and 46 Brodmann areas (BA) [19]. DLPFC does not operate in isolation; it interacts with various brain regions, including the thalamus [20], hippocampus [21], and associative areas like the posterior temporal and parietal cortices [22] and it is recognized for its role in working memory [23], speech [24], cognitive control [25], cognitive flexibility [26], planning [27], impulse inhibition and self-control, risk/benefit evaluation [28], problem solving [29], among other high order cognition functions. These functions are impaired during AD progression [30], and this region has been proposed as a therapeutic target to improve working memory in individuals with AD [31]. For these reasons, the DLPFC was selected as the focus of our analysis due to its role in cognitive processes most susceptible to impairment in AD and its potential as a target for therapeutic interventions.
1.1. Transcriptional Networks
Networks are basic tools in systems biology for expressing the components of biological systems as whole integrated systems [32]. Many natural systems are structured in the form of networks. For example, genes do not function in isolation, but rather as part of large and intricate information processing networks that involve multiple molecular entities [33,34] involving dynamic events, which are subject to regulation and integration at multiple levels, each with multiple steps. In this way, gene expression is a complex process that requires the coordinated regulation of multiple steps, from DNA to RNA, including transcription initiation, elongation, termination, and post-transcriptional modifications. To better understand this complexity, gene co-expression networks offer a powerful framework to investigate intricate biological systems, such as expression landscapes in disease [35].
Gene expression can be structured as a matrix thus characterizing gene expression data as multivariate. When converting multivariate data into a network, it becomes essential to apply metrics or some form of measurement capable of quantifying the distance or similarity between two models [36]. Using a correlation measure, we can examine how genes are co-expressed within an expression matrix, resulting in the construction of an adjacency matrix that is mathematically homomorphic to a co-expression network. Transcript co-expression networks often exhibit complex topological structures and a high degree of heterogeneity in their connection strengths and capacities. These networks are distinguished by the presence of “hubs”—nodes with a disproportionately large number of connections compared to the average degree and therefore have a robust architecture as they are resistant to random node failure [37]. However, the presence of hubs makes scale-free networks vulnerable to targeted insults where a hub is compromised [38]. In co-expression networks, hub genes frequently contribute to the stability and organization of the system. Furthermore, gene organization and expression are structured within modular networks [39], where certain genes within these communities of genes can serve as drivers of specific functionalities and organizational patterns. By analyzing relevant network metrics, the graph’s topological structure can be leveraged to gain insights into the macro, mesoscopic and local landscape of health and disease. These network relationships, when considered collectively, offer a snapshot of a phenotype’s state and provide a basis for comparing distinct phenotypes [40].
Transcriptome network analysis has been a tool in understanding large-scale dysregulations associated with complex diseases such as AD and dementia [41]. In addition, downstream network analysis has been useful in nominating potential therapeutic candidates and uncovering disease-specific patterns [42,43] and recognizing genes related to medical characteristics [44,45]. We aim to identify key metrics that characterize the disease-associated network structure and organization, ultimately highlighting the biology (genes, transcripts and biological pathways) involved in the pathological processes of late-onset Alzheimer’s disease (LOAD), specifically in the dorsolateral prefrontal cortex (DLPFC). Building on these observations, this study presents a statistical analysis of a co-expression network model of the DLPFC associated with Alzheimer’s disease. By leveraging RNA-seq data and probabilistic modeling, we develop both functional and semi-mechanistic models of the disease.
2. Methods
2.1. Data Acquisition and Classification
A complete workflow for this study is depicted in Figure 1. RNA-seq count matrices from the dorsolateral prefrontal cortex (DLPFC), specifically encompassing Brodmann area BM46 and part of BM9, were obtained from 793 subjects (473 with AD and 301 controls) through the Religious Orders Study and Memory and Aging Project (ROSMAP) database [46]. These datasets were downloaded from the AMP-AD Knowledge Portal (https://www.synapse.org) in compliance with all applicable terms and conditions.
RNA sequencing was performed following the methodology described in De Jager et al. [47]. Libraries were prepared using rRNA depletion, and sequencing was conducted on an Illumina NovaSeq 6000 platform. Metadata was used to classify patients into Control and AD groups according to the AD neuropathologic changes, following the NIA-AA criteria as outlined in the revised guidelines for the neuropathologic assessment of brain disorders common in the elderly, including Braak staging for assessing the severity of neurofibrillary tangles and the Consortium to Establish a Registry for Alzheimer Disease (CERAD) semi-quantitative measure for neuritic plaques (CERAD score) [48].
2.2. Quality Control
Quality control of the data was performed using the NOIseq package in R [49], 2015). After a diagnostic analysis, transcript composition bias, and length bias were corrected. Genes with low counts were filtered using a threshold of 1 CPM. Batch effects were corrected using the ASCA Removal of Systematic Noise on Seq data (ARSyNSeq) method, with the ’sequencingBatch’ column as the reference. ARSyNSeq filters the noise associated with identified or unidentified batch effects considering the experimental design and applying Principal Component Analysis (PCA) to the ANOVA parameters and residuals [50]. After this processing 28,263 features remained, including protein-coding genes, long non-coding RNAs, microRNAs, pseudogenes, and other RNA species. The entire dataset was then normalized by the trimmed mean of the M-values normalization method (TMM), which also adjusts by transcript length [51] (See Supplementary Figure S1). Finally, data was stratified by diagnosis, resulting in two expression matrices.
2.3. Inference Of Co-Expression Networks
Mutual Information-based gene coexpression networks were constructed separately for two groups: individuals diagnosed with Alzheimer’s Disease (AD) and age-matched controls without AD (control). Nodes in the network represent genes, and edges represent significant coexpression relationships between them based on Mutual Information (MI). MI is the maximum entropy/maximum likelihood estimate of statistical dependence between two random variables [52]. MI has attractive information-theoretic interpretations and can be used to measure non-linear associations in complex systems [53], such as transcriptional programs. This characteristic is advantageous since many relationships between transcripts do not follow a linear statistical dependence. As MI is well-defined for discrete or categorical variables, we first discretized the counts and posteriorly calculated the mutual information by gene pairs with the Infotheo R package [54]. To establish a MI heuristic cut, basic network metrics by percentile were obtained for percentiles 99.9999%, 99.999%, 99.99%, 99.9%, 99%, 98%, 90%, and 80% (See Supplementary Figure S2). Also, we ran a null model to certify that the network had characteristics not due to randomness ((See Supplementary Figure S3)
By analyzing various network metrics across different percentiles (e.g., number of vertices, edges, components, clustering coefficient) provides a clear picture of how the structure changes as we move from lower to higher MI interactions. The 99.99% percentile retains a manageable number of nodes and edges while maintaining the largest components and preserving important topological features while filtering out less meaningful interactions. By selecting interactions at the 99.99% percentile, we ensure that only the statistic dependence (i.e., those with the highest MI values) are included in the network. This helps to filter out noise and weaker associations that may not contribute meaningfully to the biological interpretation. This approach is equivalent to stratifying the data based on p-value thresholds [55]. The networks were then analyzed using the igraph package in R version 2.0.3 [56] and Cytoscape v3.10.2 [57].
2.4. Topological Analysis and Network Centralities Measure
A common approach for analyzing specific network properties is to compute and compare certain local or global network indices such as degree distribution and connectedness [58]. We began by identifying key quantities that characterize the structure and organization of the networks. First, we evaluated the degree distribution behavior in both models. The degree of a node represents the number of direct connections it has with other nodes. We further compared the cumulative degree distributions between the two models to assess topological differences. A Kolmogorov Smirnov (K-S) test was performed to test whether both distributions were significantly different. We performed a goodness-of-fit test to determine the best-fitting distribution for our data. Various distributions, including power-law, Poisson, normal, Pareto, exponential, and negative binomial, were evaluated based on statistical criteria (See Supplementary Tables 1 & 2)
To compare the overall connectivity differences between the models, the Jaccard similarity for the edges was calculated by comparing the sets of edges in each network. The computed index shows the ratio of the intersection of edges between the two networks to their union, as described in Equation 1.
Equation 1: The Jaccard Index equation was used to compare the edges between both networks.
Genes with high connectivity based on the degree and betweenness of nodes in the models were identified. In coexpression networks, Hub genes are genes with a significantly high number of direct connections to other genes, serving as hyper-connected nodes that contribute to network stability and functional coordination. We defined hub genes as those with the highest node degree, specifically the top 10% of the degree distribution. Moreover, betweenness centrality measures how often a node appears on the shortest path between pairs of other nodes, indicating its importance in controlling information flow across the network [38]. By occupying a central position in the network, they influence the flow of biological information, signals, and resources, ensuring efficient communication between different regions. Consequently, they can either facilitate interactions or act as bottlenecks within the system. Accordingly, high betweenness centrality genes were defined as those ranking in the top 10% of betweenness values. To explore the biological functions of the AD-specific hub and high betweenness genes, we performed a GO enrichment analysis using the clusterProfiler package in R. We focused on Biological Process (BP) ontology terms with a p-value cutoff of 0.05 and a q-value cutoff of 0.05. To gain a deeper understanding of connectivity changes related to hubs, we identified and enriched the first neighbors of the hubs specific to the AD network that were also exclusively first neighbors of hubs within the same network.
To visualize the connectivity of AD-specific hub genes, we extracted an induced subgraph comprising only the hub nodes from the AD network. This subgraph highlights the dense interactions between these key genes (see Figure 2c).n parallel, an induced subgraph comprising only the high betweenness nodes from the AD network was built (See Figure 2d).
Transitivity (an approximation to the the global clustering coefficient) [58] was computed for both control and problem networks. This is a measure used to detect the fraction of triplets that are closed in directed networks [59]. In other words, transitivity measures the probability that the adjacent vertices of a vertex are connected [60].
2.5. Inference of Modular Structure and Functional Analysis
Modularization aims to solve a complex problem by breaking it down into conceptually manageable parts. With the increasing scale and complexity of biochemical networks, a shift toward a top-down approach has occurred. In this framework, previously characterized reactions are integrated into modules based on their co-occurrence in wiring diagrams [61] associated with specific phenotypes. Such modules facilitate the study of biological processes by deconstructing complex biological networks into conceptually simple entities. To identify modular substructures in both models, networks were partitioned into gene modules using the Infomap algorithm for community detection [62]. Infomap is based on information theory and works by representing the movement of a random walker through the network to capture the modular structure in networks [63,64].
We used normalized mutual information (NMI) as a community detection comparison metric to assess differences in the modular structure of AD and control networks. NMI was computed using the compare() function in the igraph package. Then, to evaluate the similarity of genes and biological functions across the entire network based on module enrichment, we constructed two similarity matrices: one representing gene correspondence to modules and another capturing enriched modules according to their associated biological functions. Functional similarity was quantified using the Jaccard index of semantic similarity scores, allowing for an objective comparison of the biological processes represented within each module by their respective functions.
To determine the representation of each biological process across the network, we quantified how many modules (or communities) are associated with a specific biological process following Gene Ontology (GO) enrichment analysis. We identified the number of modules in which each biological process is represented, providing insight into the distribution of these processes across the network (See Figure 3).
3. Results
Both graphs showed a power-law-like behavior, signifying that a small number of nodes, or hubs, are highly connected, while the majority have fewer connections (See Figure 4). Both networks are essentially disassortative. The Scaling exponent () in the log-log plot indicates that the AD network has a slightly higher slope, implying that the AD network tends to have more nodes with a higher number of connections than the control network. This is confirmed in the cumulative frecuency representation, where we see the same phenomenon but represented in a cumulative degree graph.
In the AD network, certain genes or nodes play a central role in maintaining connectivity across the system. In contrast, the control network shows a slightly more homogeneous and decentralized structure. This reflects a more balanced distribution of connectivity, where fewer nodes have a large number of connections, leading to a network that is less dependent on a small set of hubs for its overall cohesion. The K-S test showed that there is no statistically significant evidence to claim that the underlying distributions of the two samples are different (D = 0.037916, p-value = 0.9971). Table 1 shows the topological features of both networks.
Edges of the AD and control networks shared only 68.39% similarity. Also, two key centrality metrics, degree centrality and betweenness centrality, were analyzed to identify key genes in the topology of the networks. For both metrics, the 10% of genes with the highest degree and betweenness were taken. We found 112 Hub genes in the AD network and 108 in the control network. Both models share 82% of the Hub genes, but there are 11% of genes found only in the AD network. In parallel, 134 and 129 High betweenness centrality genes were found in the AD and control network, respectively. 52% of the high betweenness centrality genes are common to both conditions, while 25% of the genes were found only in the AD network (see Figure 2a,b). Only the high betweenness genes enriched pathways in the Biological Process (BP) ontology test. Pathways enriched included primarily the synaptic vesicle cycle, synaptic vesicle maturation, regulation of synaptic vesicle exocytosis and vesicle-mediated transport in synapse (see Figure 2e).
3.1. Mesoscopic Network Analysis
Graph partitions showed 68 modules of genes being coexpressed for the AD graph and 71 modules for the control graph (see Figure 5). By comparing the Q value for each network partition it is possible to evaluate whether there is a network in which the module detection algorithm, applied to each network, identifies a more modular structure [65]. The modularity of the AD graph is slightly higher (0.28) compared to the control graph (0.20), suggesting that the AD network has a clearer community division. We further analyzed the modular structure of the networks by comparing the community partitions derived from the Infomap algorithm, which yielded a NMI of 0.4479.
A similarity matrix based on the membership of genes to their respective modules was constructed to understand the rearrangement of genes into different modules. Of the modules in both networks, 10 modules were preserved with perfect similarity between the two networks. In addition, 11 modules showed a similarity of more than 90%, 12 modules had a similarity greater than 80%, 14 modules exceeded 70%, 18 modules showed a similarity greater than 60%, and 24 modules achieved a similarity of more than 50%. This points to a reorganization of genes in several modules between the two networks. Although some of the modules remain largely intact, in others a significant redistribution of genes between different communities is observed (See Figure 6a).
Other similarity matrix, now that compares the enriched biological functions of individual modules between the two networks to evaluate the similarity of biological functions across the networks (Figure 6b). This compares the enriched biological functions of individual modules between the two networks. Gene Ontology (GO) terms for Biological Processes (BP) were assigned to each module, allowing for a detailed functional analysis. A similarity matrix was generated based on the GO terms associated with the enriched modules. Each entry in the matrix represents the degree of functional similarity between modules in the two networks. Modules with highly similar biological functions between the two networks were identified. 25 modules were found to be enriched with the same GO terms and there are 52 modules with at least 50% similarity in GO terms.
Furthermore, to ascertain the representation of each biological process within the network, we quantified the number of modules associated with a particular biological process based on GO enrichment analysis. We determined the quantity of modules representing each biological process, offering a perspective on the distribution of these processes throughout the network (Figure 3).
4. Discussion
4.1. Gene Coexpression Network Alterations in Alzheimer’s Disease: Structural and Connectivity Insights
We used the ROSMAP cohort because it represents a broad-ranging spectrum of the older adult population compared to most autopsy series, which typically rely on selective recruitment criteria and individuals seeking medical care for their symptoms. This provides more representative and generalizable results. Additionally, we selected the DLPFC for this study due to its involvement in various higher cognitive functions, such as decision-making, working memory, and executive control, which are particularly relevant in AD, as impairments in these functions are hallmark features of the disease.
Previous transcriptomic analysis has revealed gene regulatory interactions occurring in brain tissues or regions of healthy and diseased individuals. For example, the impact of Alzheimer’s disease on different cortical regions has been investigated by gene co-expression network analysis and module and trait network analysis [43,44,66]. Here, two models of gene-to-gene correlations in the DLPFC of individuals with Alzheimer’s disease and a control group composed of older individuals were analyzed to examine alterations in coexpression patterns associated with Alzheimer’s pathology. Networks were constructed following restrictions that made them comparable. Both networks maintain the same number of connections and have a very similar size and diameter.
The K-S test indicated no significant statistical difference between the global degree distributions of the two transcriptional profiles. This suggests that the overall degree distribution remains largely unchanged. However, while the degree distributions appear statistically similar, differences may still emerge at mesoscopic and micro-level network properties. It is important to consider that both distributions correspond to the same anatomical regions in aged individuals, which may influence their structural and functional characteristics. Nonetheless, it is noteworthy that the AD network exhibits a higher number of highly co-expressed genes (see Figure 4). In contrast, the control network shows a more balanced distribution of connectivity where fewer nodes have a high degree of connections, indicative of a network that is less dependent on a small set of hubs for its overall cohesion.
Only around two-thirds of the gene-gene interactions are shared between the AD and the control network. Gene interaction patterns overlap substantially, but there is still about 31.61% difference in overall connectivity. However, this difference is key in differentiating between the normal and AD-related transcriptional regulation landscapes. The shared edges may represent preserved connections essential for basic brain function or transcriptional network neighborhoods less affected by AD pathology.
Additionally, the control network exhibits a slightly higher transitivity (0.6253) compared to the AD network (0.5956). While this difference is modest, the reduction in transitivity in the AD network may be showing a lower degree of local cohesion relative to the control network.
4.2. Functional Insights into Co-Expression Changes in the AD Network: Linking Epigenetic, Cytoskeletal, Immune, and Post-Transcriptional Pathways
In the context of co-expression networks, node degree can be interpreted as an indicator of a gene’s influence within the regulatory program. In the AD network, 13 hub genes were identified that are absent in the control network. These genes, listed in order of degree, include KRT6B, COL6A5, PDCD5P1, H3C9P, FCRL1, ONECUT3, CCL18, H2BC14, H2AC4, CROCC2, SLC25A24P1, PDE4DIP and FCRL3 (See Supplementary Table S3 for further details). A brief description of these genes and their relations with AD is listed in TableS3. Among these, KRT6B, located on chromosome 12, stands out as the most highly connected gene in the AD network, with a degree of 207.
From the 13 hub genes here, KRT6B, COL6A5 and CROCC2 are structural proteins and cytoskeletal components; H3C9P, H2BC14, H2AC4 and ONECUT3 are histones or genes related to chromatin regulation; FCRL1, FCRL3 and CCL18 are related to the immune system and inflammation; PDCD5P1 and PDE4DIP are pseudogenes related to neurodegeneration and cell death and SLC25A24P1 is a pseudogene of SLC25A24, involved in ATP transport and energy metabolism.
Interestingly, we can find 4 pseudogenes in the list of AD-specific-hub genes (SLC25A24P1, PDE4DIP, SLC25A24P1 and H3C9P). Studies have demonstrated that pseudogenes may participate in gene transcription post-transcriptional gene regulation and epigenetic regulation [67]. Other computationally predicted pseudogenes have been proposed to be involved in the etiology of AD and other NDs [68] and other pseudogenes have been identified as hubs in AD networks [43]. These findings suggest that pseudogenes may act as regulatory elements. Investigating the specific roles of these pseudogenes could provide deeper insights into their contributions to AD pathophysiology and highlight novel therapeutic targets for future research.
Other interesting gene is CCL18. It is known that chemokines and their receptors can promote AD pathology by inducing the production of A and some chemokines and receptors are also involved in tau phosphorylation. CCL18, a well described chemokine was found to have enhanced co-expression with other genes in the AD network. Given its enhanced co-expression with other genes in the AD network, CCL18 might act as a mediator or regulator of neuroinflammatory responses. For example, the chemokine-receptor interaction could stimulate pathways that promote the production or A accumulation [69].
We investigated the biological processes associated with the first neighbors of the hubs specific to the AD network. On average, changes in the degree of AD-specific hub genes affect 30.15 genes. Among these, CROCC exhibited the greatest increase in co-expression within the AD network, showing interactions with 66 newly co-expressed genes (See Figure 7a).In contrast, PDE4DIP displayed the fewest new co-expression connections, with only three additional genes.Furthermore, we identified a set of newly co-expressed genes that were consistently gained across all AD-specific hubs. Notably, 83 genes were found to be commonly co-expressed with hubs in the AD network. Functional enrichment analysis of these newly associated neighbors revealed four main functional groups See Figure 7b). The first group consists of processes related to nucleosome organization and assembly, primarily involving several histone genes. A key mechanism of epigenetic regulation in gene expression is the dynamic organization of chromatin structure, and epigenetic aberrations have been implicated in transcriptional alterations associated with AD [70].
The second group, which can be categorized as cytoskeletal organization and keratinization, is functionally related to the first group and includes genes from the KRT family as well as FLG. There is evidence suggesting that KRT family genes may play a role in neurological disorders, including dementia [71]. Research has demonstrated that the dysregulated expression of Keratin 9 is a consequence of AD pathology. However, its extensive interaction network implies additional, as yet unidentified downstream effects that may contribute to the initiation and progression of the disease [72]. Furthermore, keratin intermediate filaments have multiple roles in signaling pathways, inflammation, and various disease states [73]. Interestingly, the high-degree gene KRT6B has been implicated in the regulation of epithelial–mesenchymal transition (EMT) and immune-related pathways, including macrophage differentiation and polarization, as demonstrated in studies of bladder cancer [74].
This leads us to the third functional group, which includes antimicrobial and humoral immune response. In the past, research on inflammation-driven neurodegeneration and the immune role of A has given rise to the “Antimicrobial Protection Hypothesis” of AD. This hypothesis suggests that -amyloid deposition represents an early innate immune response to actual or misinterpreted immunological threats. Initially, A captures and neutralizes invading pathogens by forming -amyloid deposits. The subsequent fibrillization of A A activates neuroinflammatory pathways, aiding in pathogen clearance and -amyloid removal. However, in AD, prolonged activation of this response results in persistent inflammation and neurodegeneration [75].
Finally, the fourth group is related to miRNA-mediated post-transcriptional gene silencing, a key pathway in the regulation of mRNA stability and translation, involved in fine gene control and adaptive response processes. The first three groups of metabolic pathways are mediated by at least one gene, and give rise to an explanation of the interpolation between at least two hypotheses of Alzheimer’s neuropathogenesis, including the antimicrobial protection hypothesis [70,76] and the neuroinflammation hypothesis [77]. The antimicrobial humoral response and the keratinization pathways of genes are connected by SPINK5, a serine protease inhibitor [78] and KRT6A, one of the 27 different type II keratins expressed in humans [79], while the immune response and nucleosome assembly pathways are at least connected by the H2BC10 histone.
4.3. High Betweenness Genes only Present in the Disease Network Are Involved in Diverse Biological Pathways
In the AD network, 44 genes high betweenness centrality genes were identified that were not central in the control network (See Supplementary Figure S4). Ten genes with higher betweenness were LOC124903002, RAB3A, SNAP91, BEX1, INPP5F, NECAP1, INA, ATP5F1B, NSG2 and SYP. LOC124903002, an uncharacterized gene, was the gene with higher betweenness. The gene appears in 5454.812 shortest paths between pairs of other nodes. Pathway enrichment analysis revealed that these AD-specific high-betweenness genes are primarily associated with processes related to synaptic function. Specifically, enriched pathways include the regulation of short-term neuronal synaptic plasticity, the synaptic vesicle cycle, synaptic vesicle maturation, the regulation of synaptic vesicle exocytosis and the establishment of vesicle localization. Beyond these, 20 other pathways were identified, all related to vesicle dynamics, exocytosis, transport, and regulatory mechanisms. It’s notable that high-betweenness centrality genes are enriched in synaptic processes, as synaptic processes are essential for sustaining the flow of information within the brain metabolism. These genes, acting as “bridges” or nodes of elevated information flow within the network, are playing a structurally analogous role to that of synaptic functions, which similarly manage and modulate information transmission across neural circuits.
In contrast, there are 39 genes that are serving as high information-passing nodes in the control network but are not shown to be highly mediated genes in the pathology network. Two nodes, KIFBP and ACTR2 are not even present in the AD network, due to their poor statistical dependency with other genes. These “missing” genes did not enrich any gene ontology as a group. The 10 higher betweenness centrality genes that are lost in the AD network as high degree-brokering genes include MAPK9, SYT3, PACSIN1, GNG3, FBXL19, AMPH, SERPINI1, RUSC2, AP2M1, and KIFBP. The Mapk9 mitogen-activated protein kinase 9 is the most highly mediated gene lost in the AD network. This gene has functions in the transduction of environmental signals to the transcriptional machinery, a function similar to those of other MAP kinases, and it phosphorylates the c-Jun protein [80], an essential component of the AP-1 transcription factor, highlights its involvement in stress-activated pathways, such as apoptosis, inflammation, and neuroprotection. The loss of MAPK9 (betweenness in control 5714.584, betweenness in AD network 738.7555) as a high betweenness gene in the AD network is particularly relevant because it implies a disruption in a key signaling pathway involved in cellular stress responses and transcriptional regulation, probably having extensive implications of network reconfiguration in AD and the potential functional vulnerabilities that may emerge from the disruption of signaling intermediates.
One of these genes, SERPINI1 (betweenness of 2179.33 and 570.30 in control and AD, respectively) encodes neuroserpin, an inhibitory serine protease crucial for regulating plasmin and other processes related to neuronal homeostasis. The aggregation of mutant neuroserpin polymers—resulting from the misfolding of neuroserpin—in the brain is associated with the formation of abnormal intracellular inclusions, leading to neuronal degeneration and dementia [81,82]. Nevertheless, there is evidence that neuroserpin is neuroprotective, as it reduces infarct volume and protects neurons from ischemia-induced apoptosis [83]. Neuroprotective effects may result from its role in inhibition of excitotoxicity, inflammation, and blood-brain barrier disruption that occur after acute ischemic stroke [84]. The node corresponding to SERPINI1 experienced a reduction of 1,609 in the number of shortest paths that pass through it, maybe reflecting a loss of neuroprotective capacity and contributing to the neuronal degeneration characteristic of AD.
Another gene that lost its status as a high-intermediate node was SYT3. Synaptotagmins are a class of Ca2+-dependent synaptic vesicle membrane proteins prevalent in the brain, potentially involved in membrane trafficking [85]. SYT3 is present in presynaptic terminals. It is expressed throughout the brain and is enriched in the brainstem, cerebellum and hippocampus [86]. Ischemic conditions have been reported to upregulate SYT3 expression [87]. Given the link between Alzheimer’s disease (AD) and impaired cerebral circulation—characterized by reduced oxygen and nutrient supply— Chum et al. [88] proposed that cerebrovascular miRNAs associated with AD regulate mRNA targets crucial for endothelial cell functions such as angiogenesis, vascular permeability, and blood flow regulation. Their findings revealed that several miRNAs associated with AD also regulate both cardiovascular and neuronal pathways, with SYT3 identified as a gene targeted by more than four miRNAs. This overlap shows a probable relationship between vascular and neuronal health in AD. Genes such PACSIN1, AMPH, RUSC2 and KIFBP participate in mechanisms associated with cytoskeleton dynamics and intracellular transport [89,90,91,92]. The absence of these genes as high-betweenness nodes indicates a disturbance in their function as mediators within the network, potentially hindering the coordination of cytoskeleton remodeling and intracellular trafficking pathways. Such abnormalities may lead to deficiencies in neuronal architecture, synapse functionality, and transport mechanisms, which are essential processes in neurodegenerative disorders such as AD.
4.4. Network Functional Analysis Show Gene Modular Rearrangement
The idea that sets of genes carrying out related tasks ought to be strongly correlated is supported by the clustering of genes in highly associated modules [93]. It has been seen that in gene co-expression models, different gene modules may correspond to distinct biological processes [94]. This observation aligns with the modular structure of the networks analyzed, where functionally related genes tend to co-cluster within specific modules. The AD network showed more modules than the control network. This statement should be taken with caution because it is known that Infomap tends to generate small size modules. Also, the modularity of the AD graph is higher (0.28) compared to the control graph (0.20), showing that the AD network has a slightly clearer community division. The control network has a slightly higher clustering coefficient (0.625) than the AD network (0.596). This indicates that, on average, nodes in the control network tend to form triangles (groups of three interconnected nodes) more frequently than in the AD network. The latter has more defined modules, but with less local cohesion, while the control graph has a less modular structure, but with a higher density of local connections. Under disease conditions, interactions between modules are more isolated, but connections within modules may not be as densely interrelated.
NMI indicates a 45% of similarity between the two graphs partitions. The similarity matrix based on the correspondence of shared genes between these modules revealed a reorganization of genes across various modules. While the modules in the AD and control networks are not directly equivalent, there is a degree of similarity between certain modules in both networks. However, a marked difference in the arrangement of gene membership across modules is apparent (see Figure 6a). In parallel, the biological similarity matrix for the communities displays a more conserved pattern. Although some modules show distinct biological functions, indicating possible divergence in their roles across different biological contexts, the functional organization remains relatively preserved despite the substantial reorganization of genes across modules (see Figure 6b).
Also, most biological processes exhibit notably higher module representation in the AD network compared to the control, where we can see that biological processes are distributed across a greater number of modules than in the control network (See Figure 3). This broader distribution may be the result of adaptation in the transcriptional program in response to the disease. Gene expression patterns are reorganized and compartmentalized to accommodate the altered cellular environment.
Axonogenesis and axon development display the greatest divergence in module representation, being distributed across 10 modules in the control network and 19 modules in the AD network, pointing out a possible emphasis on neuronal structural processes in AD. Other biological processes associated with AD, such as cognition and learning or memory, are also distributed across more modules in the AD network. Overall, there is a tendency in the AD network for biological processes to be represented in a greater number of modules. Notably, this phenomenon of spreading is also observed in processes such as rhythmic processes, axon guidance, learning and memory, response to amyloid-beta, and differentiation. Nevertheless, although fewer in number and of lesser magnitude, some processes exhibit the opposite trend. These include the regulation of protein secretion, positive regulation of secretion, amino acid and amide transport, as well as other transport- and movement-related molecular processes.
The reorganization of biological processes into a larger number of modules in the AD network may have several explanations, based both on AD biology and on how gene networks respond to stress and pathological changes. In AD, cells, especially neurons and glial cells, undergo significant changes in their environment due to factors such as the accumulation of beta-amyloid plaques, NFTs and neuroinflammation [95]. These changes generate a chronic cellular stress environment, which can trigger adaptive responses in gene expression. To cope with this adverse environment, the transcriptional program could be reorganized, promoting the activation and redistribution of genes co-expresssion. For instance, modules associated with processes such as axonogenesis, axon development, neuron projection guidance, and dendrite morphogenesis—critical for repairing and reorganizing damaged neuronal connections—show increased representation. This phenomenon reflects a possible compensatory or adaptive strategy to neurodegeneration.
In addition, greater representation of processes such as cognition and learning and memory in multiple modules in the AD network suggests that the disease affects entire sets of processes related to these high cognitive functions.
Differences in the transcriptional regulatory landscape between AD and healthy aged individuals are more subtle than in other diseases such as cancer, where we can see a clearer disruption in the modularity and coexpression [96]. The overall differences in topology point to changes at the mesoscopic level in the rearrangement of genes and molecular functions in co-expression modules in AD.
Moreover, because our correlations are based on the statistical dependence of mutual information, we can detect nonlinear relationships. However, these interactions lack directional inference, meaning we cannot determine whether they are associated with upregulation or downregulation. Additionally, AD is a disease with high comorbidity, a factor not explicitly accounted for in our analysis. More regions in the brain should be explored to obtain a more solid landscape of the complex transcriptional mechanism of the brain in AD, specially areas more affected by proteinopathy. Our findings should further be viewed as in-silico genomic-data-driven hypotheses that require additional experimental validation, given the statistical nature (gain/loss of correlation) of the differential connectivity relationships.
Supplementary Materials
The following supporting information can be downloaded at the website of this paper posted on Preprints.org.
Author Contributions
Conceptualization— A.P.P.G, G.D.J., E.H.L.; methodology— A.P.P.G, G.D.J., E.H.L.; validation—A.I.G.C.; formal analysis—A.P.P.G; investigation—A.P.P.G, G.D.J., E.H.L.; resources— E.H.L.; data curation—A.P.P.G; writing—original draft preparation— A.P.P.G, writing—review and editing— A.P.P.G, G.D.J., E.H.L. All authors have read and agreed to the published version of the manuscript.
Funding
The author(s) declare financial support was received for the research, authorship, and/or publication of this article. AP-G is a doctoral student from Programa de Doctorado en Ciencias Biomédicas (PDCB), Universidad Nacional Autónoma de México (UNAM), and received fellowship 904078 from CONAHCYT (now SECIHTI). Study data were provided by the Rush Alzheimer’s Disease Center, Rush University Medical Center, Chicago. Data collection was supported through funding by NIA grants P30AG10161 (ROS), R01AG15819 (ROSMAP; genomics and RNAseq), R01AG17917 (MAP), R01AG30146, R01AG36042 (5hC methylation, ATACseq), RC2AG036547 (H3K9Ac), R01AG36836 (RNAseq), R01AG48015 (monocyte RNAseq) RF1AG57473 (single nucleus RNAseq), U01AG32984 (genomic and whole exome sequencing), U01AG46152 (ROSMAP AMP-AD, targeted proteomics), U01AG46161(TMT proteomics), U01AG61356 (whole genome sequencing, targeted proteomics, ROSMAP AMP-AD), the Illinois Department of Public Health (ROSMAP), and the Translational Genomics Research Institute (genomic). Additional phenotypic data can be requested at http://www.radc.rush.edu.
Conflicts of Interest
The authors declare that the research was conducted in the absence of any commercial or financial relationships that could be construed as a potential conflict of interest.
References
- Aisen, P.S.; Cummings, J.; Jack, C.R.; Morris, J.C.; Sperling, R.; Frölich, L.; Jones, R.W.; Dowsett, S.A.; Matthews, B.R.; Raskin, J.; et al. On the path to 2025: Understanding the Alzheimer’s disease continuum. Alzheimer’s Research & Therapy 2017, 9, 60. [Google Scholar] [CrossRef]
- Wingo, T.S.; Lah, J.J.; Levey, A.I.; Cutler, D.J. Autosomal recessive causes likely in early-onset Alzheimer disease. Archives of Neurology 2012, 69, 59–64. [Google Scholar] [CrossRef]
- Arvanitakis, Z.; Shah, R.C.; Bennett, D.A. Diagnosis and Management of Dementia: A Review. JAMA 2019, 322, 1589–1599. [Google Scholar] [CrossRef] [PubMed]
- Guerreiro, R.; Bras, J. The age factor in Alzheimer’s disease. Genome Medicine 2015, 7, 106. [Google Scholar] [CrossRef] [PubMed]
- Reynolds, C.F.; Jeste, D.V.; Sachdev, P.S.; Blazer, D.G. Mental health care for older adults: Recent advances and new directions in clinical practice and research. World Psychiatry 2022, 21, 336–363. [Google Scholar] [CrossRef]
- Kao, Y.C.; Ho, P.C.; Tu, Y.K.; Jou, I.M.; Tsai, K.J. Lipids and Alzheimer’s Disease. International Journal of Molecular Sciences 2020, 21, 1505. [Google Scholar] [CrossRef]
- Tesi, N.; van der Lee, S.J.; Hulsman, M.; Jansen, I.E.; Stringa, N.; van Schoor, N.M.; Scheltens, P.; van der Flier, W.M.; Huisman, M.; Reinders, M.J.T.; et al. Immune response and endocytosis pathways are associated with the resilience against Alzheimer’s disease. Translational Psychiatry 2020, 10, 332. [Google Scholar] [CrossRef]
- Chung, Y.; Lee, H. Correlation between Alzheimer’s disease and type 2 diabetes using non-negative matrix factorization. Scientific Reports 2021, 11, 15265, Publisher: Nature Publishing Group. [Google Scholar] [CrossRef]
- Hamzé, R.; Delangre, E.; Tolu, S.; Moreau, M.; Janel, N.; Bailbé, D.; Movassat, J. Type 2 Diabetes Mellitus and Alzheimer’s Disease: Shared Molecular Mechanisms and Potential Common Therapeutic Targets. International Journal of Molecular Sciences 2022, 23, 15287. [Google Scholar] [CrossRef]
- Aggarwal, M.; Alkhayyat, M.; Abou Saleh, M.; Sarmini, M.T.; Singh, A.; Garg, R.; Garg, P.; Mansoor, E.; Padival, R.; Cohen, B.L. Alzheimer Disease Occurs More Frequently In Patients With Inflammatory Bowel Disease: Insight From a Nationwide Study. Journal of Clinical Gastroenterology 2023, 57, 501–507. [Google Scholar] [CrossRef]
- Sohrabi, M.; Sahu, B.; Kaur, H.; Hasler, W.; Prakash, A.; Combs, C.K. Gastrointestinal Changes and Alzheimer’s Disease. Current Alzheimer research 2022, 19, 335–350. [Google Scholar] [CrossRef]
- Tini, G.; Scagliola, R.; Monacelli, F.; La Malfa, G.; Porto, I.; Brunelli, C.; Rosa, G.M. Alzheimer’s Disease and Cardiovascular Disease: A Particular Association. Cardiology Research and Practice 2020, 2020, 2617970. [Google Scholar] [CrossRef] [PubMed]
- Huang, Y.Y.; Gan, Y.H.; Yang, L.; Cheng, W.; Yu, J.T. Depression in Alzheimer’s Disease: Epidemiology, Mechanisms, and Treatment. Biological Psychiatry 2024, 95, 992–1005. [Google Scholar] [CrossRef] [PubMed]
- Tong, Q.; Chen, L. Associations of Alzheimer’s Disease Neuropathologic Changes with Clinical Presentations of Parkinson’s Disease. Journal of Alzheimer’s disease: JAD 2021, 81, 201–207. [Google Scholar] [CrossRef] [PubMed]
- Hampel, H.; Nisticò, R.; Seyfried, N.T.; Levey, A.I.; Modeste, E.; Lemercier, P.; Baldacci, F.; Toschi, N.; Garaci, F.; Perry, G.; et al. Omics sciences for systems biology in Alzheimer’s disease: State-of-the-art of the evidence. Ageing Research Reviews 2021, 69, 101346. [Google Scholar] [CrossRef]
- Serrano-Pozo, A.; Frosch, M.P.; Masliah, E.; Hyman, B.T. Neuropathological Alterations in Alzheimer Disease. Cold Spring Harbor Perspectives in Medicine: 2011, 1, a006189. [Google Scholar] [CrossRef]
- Braak, H.; Alafuzoff, I.; Arzberger, T.; Kretzschmar, H.; Del Tredici, K. Staging of Alzheimer disease-associated neurofibrillary pathology using paraffin sections and immunocytochemistry. Acta Neuropathologica 2006, 112, 389–404. [Google Scholar] [CrossRef]
- Wilson, R.S.; Boyle, P.A.; Yu, L.; Barnes, L.L.; Sytsma, J.; Buchman, A.S.; Bennett, D.A.; Schneider, J.A. Temporal course and pathologic basis of unawareness of memory loss in dementia. Neurology 2015, 85, 984–991. [Google Scholar] [CrossRef]
- Pàmies-Vilà, R.; Fabregat-Sanjuan, A.; Ros-Alsina, A.; Rigo-Vidal, A.; Pascual-Rubio, V. Analysis of the Dorsolateral Prefrontal Cortex MNI Coordinates. In Proceedings of the Proceedings of the XV Ibero-American Congress of Mechanical Engineering; Vizán Idoipe, A.; García Prada, J.C., Eds., Cham, 2023; pp. 132–138. [CrossRef]
- Le Reste, P.J.; Haegelen, C.; Gibaud, B.; Moreau, T.; Morandi, X. Connections of the dorsolateral prefrontal cortex with the thalamus: a probabilistic tractography study. Surgical and radiologic anatomy: SRA 2016, 38, 705–710. [Google Scholar] [CrossRef]
- Bähner, F.; Demanuele, C.; Schweiger, J.; Gerchen, M.F.; Zamoscik, V.; Ueltzhöffer, K.; Hahn, T.; Meyer, P.; Flor, H.; Durstewitz, D.; et al. Hippocampal–Dorsolateral Prefrontal Coupling as a Species-Conserved Cognitive Mechanism: A Human Translational Imaging Study. Neuropsychopharmacology 2015, 40, 1674–1681, Publisher: Nature Publishing Group. [Google Scholar] [CrossRef]
- Zhou, X.; Qi, X.L.; Constantinidis, C. Distinct Roles of the Prefrontal and Posterior Parietal Cortices in Response Inhibition. Cell reports 2016, 14, 2765–2773. [Google Scholar] [CrossRef] [PubMed]
- Barbey, A.K.; Koenigs, M.; Grafman, J. Dorsolateral prefrontal contributions to human working memory. Cortex 2013, 49, 1195–1205. [Google Scholar] [CrossRef] [PubMed]
- Hertrich, I.; Dietrich, S.; Blum, C.; Ackermann, H. The Role of the Dorsolateral Prefrontal Cortex for Speech and Language Processing. Frontiers in Human Neuroscience 2021, 15, 645209. [Google Scholar] [CrossRef] [PubMed]
- Rilling, J.K.; Sanfey, A.G. Social Interaction. In Encyclopedia of Neuroscience; Squire, L.R., Ed.; Academic Press: Oxford, 2009; pp. 41–48. [Google Scholar] [CrossRef]
- Uddin, L.Q. Cognitive and behavioural flexibility: Neural mechanisms and clinical considerations. Nature Reviews Neuroscience 2021, 22, 167–179, Publisher: Nature Publishing Group. [Google Scholar] [CrossRef]
- Kaller, C.P.; Rahm, B.; Spreer, J.; Weiller, C.; Unterrainer, J.M. Dissociable contributions of left and right dorsolateral prefrontal cortex in planning. Cerebral Cortex (New York, N.Y.: 1991) 2011, 21, 307–317. [Google Scholar] [CrossRef]
- Obeso, I.; Herrero, M.T.; Ligneul, R.; Rothwell, J.C.; Jahanshahi, M. A Causal Role for the Right Dorsolateral Prefrontal Cortex in Avoidance of Risky Choices and Making Advantageous Selections. Neuroscience 2021, 458, 166–179. [Google Scholar] [CrossRef]
- Greene, J.D.; Nystrom, L.E.; Engell, A.D.; Darley, J.M.; Cohen, J.D. The neural bases of cognitive conflict and control in moral judgment. Neuron 2004, 44, 389–400. [Google Scholar] [CrossRef]
- American Psychiatric Association. Diagnostic and Statistical Manual of Mental Disorders, fifth edition ed.; American Psychiatric Association, 2013. [CrossRef]
- Kumar, S.; Zomorrodi, R.; Ghazala, Z.; Goodman, M.S.; Blumberger, D.M.; Cheam, A.; Fischer, C.; Daskalakis, Z.J.; Mulsant, B.H.; Pollock, B.G.; et al. Extent of Dorsolateral Prefrontal Cortex Plasticity and Its Association With Working Memory in Patients With Alzheimer Disease. JAMA Psychiatry 2017, 74, 1266–1274. [Google Scholar] [CrossRef]
- Thomas, S.; Bonchev, D. A survey of current software for network analysis in molecular biology. Human Genomics 2010, 4, 353. [Google Scholar] [CrossRef]
- Barabási, A.L.; Oltvai, Z.N. Network biology: Understanding the cell’s functional organization. Nature Reviews. Genetics 2004, 5, 101–113. [Google Scholar] [CrossRef]
- Stuart, J.M.; Segal, E.; Koller, D.; Kim, S.K. A gene-coexpression network for global discovery of conserved genetic modules. Science (New York, N.Y.) 2003, 302, 249–255. [Google Scholar] [CrossRef] [PubMed]
- Miller, J.A.; Oldham, M.C.; Geschwind, D.H. A Systems Level Analysis of Transcriptional Changes in Alzheimer’s Disease and Normal Aging. The Journal of Neuroscience 2008, 28, 1410. [Google Scholar] [CrossRef] [PubMed]
- Altaf-Ul-Amin, M.; Afendi, F.M.; Kiboi, S.K.; Kanaya, S. Systems Biology in the Context of Big Data and Networks. BioMed Research International 2014, 2014, 428570. [Google Scholar] [CrossRef] [PubMed]
- Barabasi, A.L.; Albert, R. Emergence of scaling in random networks. Science (New York, N.Y.) 1999, 286, 509–512. [Google Scholar] [CrossRef]
- Barabási, A.L. Network science. Philosophical Transactions of the Royal Society A: Mathematical, Physical and Engineering Sciences 2013, 371, 20120375, Publisher: Royal Society. [Google Scholar] [CrossRef]
- He, B.; Xu, J.; Tian, Y.; Liao, B.; Lang, J.; Lin, H.; Mo, X.; Lu, Q.; Tian, G.; Bing, P. Gene Coexpression Network and Module Analysis across 52 Human Tissues. BioMed Research International 2020, 2020, 6782046. [Google Scholar] [CrossRef]
- Nakamura-García, A.K.; Espinal-Enríquez, J. Pseudogenes in Cancer: State of the Art. Cancers 2023, 15, 4024. [Google Scholar] [CrossRef]
- Gómez-Pascual, A.; Rocamora-Pérez, G.; Ibanez, L.; Botía, J.A. Targeted co-expression networks for the study of traits. Scientific Reports 2024, 14, 16675, Publisher: Nature Publishing Group. [Google Scholar] [CrossRef]
- Conte, F.; Paci, P. Alzheimer’s disease: Insights from a network medicine perspective. Scientific Reports 2022, 12, 16846, Publisher: Nature Publishing Group. [Google Scholar] [CrossRef]
- Mitra, S.; Bp, K.; C R, S.; Saikumar, N.V.; Philip, P.; Narayanan, M. Alzheimer’s disease rewires gene coexpression networks coupling different brain regions. npj Systems Biology and Applications 2024, 10, 1–16, Publisher: Nature Publishing Group. [Google Scholar] [CrossRef]
- Beck, J.S.; Madaj, Z.; Cheema, C.T.; Kara, B.; Bennett, D.A.; Schneider, J.A.; Gordon, M.N.; Ginsberg, S.D.; Mufson, E.J.; Counts, S.E. Co-expression network analysis of frontal cortex during the progression of Alzheimer’s disease. Cerebral Cortex 2022, 32, 5108–5120. [Google Scholar] [CrossRef] [PubMed]
- Sun, Y.; Lin, J.; Zhang, L. The application of weighted gene co-expression network analysis in identifying key modules and hub genes associated with disease status in Alzheimer’s disease. Annals of Translational Medicine 2019, 7, 800–800, Number: 24 Publisher: AME Publishing Company. [Google Scholar] [CrossRef]
- Bennett, D.A.; Buchman, A.S.; Boyle, P.A.; Barnes, L.L.; Wilson, R.S.; Schneider, J.A. Religious Orders Study and Rush Memory and Aging Project. Journal of Alzheimer’s disease: JAD 2018, 64, S161–S189. [Google Scholar] [CrossRef]
- De Jager, P.L.; Ma, Y.; McCabe, C.; Xu, J.; Vardarajan, B.N.; Felsky, D.; Klein, H.U.; White, C.C.; Peters, M.A.; Lodgson, B.; et al. A multi-omic atlas of the human frontal cortex for aging and Alzheimer’s disease research. Scientific Data 2018, 5, 180142, Publisher: Nature Publishing Group. [Google Scholar] [CrossRef]
- Hyman, B.T.; Phelps, C.H.; Beach, T.G.; Bigio, E.H.; Cairns, N.J.; Carrillo, M.C.; Dickson, D.W.; Duyckaerts, C.; Frosch, M.P.; Masliah, E.; et al. National Institute on Aging-Alzheimer’s Association guidelines for the neuropathologic assessment of Alzheimer’s disease. Alzheimer’s & Dementia: The Journal of the Alzheimer’s Association 2012, 8, 1–13. [Google Scholar] [CrossRef]
- Tarazona, S.; Furió-Tarí, P.; Turrà, D.; Pietro, A.D.; Nueda, M.J.; Ferrer, A.; Conesa, A. Data quality aware analysis of differential expression in RNA-seq with NOISeq R/Bioc package. Nucleic Acids Research 2015, 43, e140. [Google Scholar] [CrossRef]
- Nueda, M.J.; Ferrer, A.; Conesa, A. ARSyN: A method for the identification and removal of systematic noise in multifactorial time course microarray experiments. Biostatistics (Oxford, England) 2012, 13, 553–566. [Google Scholar] [CrossRef] [PubMed]
- Robinson, M.D.; Oshlack, A. A scaling normalization method for differential expression analysis of RNA-seq data. Genome Biology 2010, 11, R25. [Google Scholar] [CrossRef] [PubMed]
- Chow, C.; Liu, C. Approximating discrete probability distributions with dependence trees. IEEE Transactions on Information Theory 1968, 14, 462–467, Conference Name: IEEE Transactionson Information Theory. [Google Scholar] [CrossRef]
- Steuer, R.; Kurths, J.; Daub, C.O.; Weise, J.; Selbig, J. The mutual information: Detecting and evaluating dependencies between variables. Bioinformatics (Oxford, England) 2002, 18 Suppl 2, S231–240. [CrossRef]
- Meyer, P. Information-Theoretic Variable Selection and Network Inference from Microarray Data 2008.
- Margolin, A.A.; Nemenman, I.; Basso, K.; Wiggins, C.; Stolovitzky, G.; Favera, R.D.; Califano, A. ARACNE: An Algorithm for the Reconstruction of Gene Regulatory Networks in a Mammalian Cellular Context. BMC Bioinformatics 2006, 7, S7. [Google Scholar] [CrossRef]
- Csardi, G.; Nepusz, T. The Igraph Software Package for Complex Network Research. InterJournal 2005, Complex Systems, 1695. [Google Scholar]
- Shannon, P.; Markiel, A.; Ozier, O.; Baliga, N.S.; Wang, J.T.; Ramage, D.; Amin, N.; Schwikowski, B.; Ideker, T. Cytoscape: A software environment for integrated models of biomolecular interaction networks. Genome Research 2003, 13, 2498–2504. [Google Scholar] [CrossRef] [PubMed]
- Schank, T.; Wagner, D. Approximating Clustering Coefficient and Transitivity. Journal of Graph Algorithms and Applications 2005, 9, 265–275. [Google Scholar] [CrossRef]
- Wasserman, S.; Faust, K. Social network analysis: Methods and applications; Social network analysis: Methods and applications, Cambridge University Press: New York, NY, US, 1994. Pages: Xxxi, 825. [CrossRef]
- Barrat, A.; Barthélemy, M.; Pastor-Satorras, R.; Vespignani, A. The architecture of complex weighted networks. Proceedings of the National Academy of Sciences of the United States of America 2004, 101, 3747–3752. [Google Scholar] [CrossRef] [PubMed]
- Papin, J.A.; Reed, J.L.; Palsson, B.O. Hierarchical thinking in network biology: The unbiased modularization of biochemical networks. Trends in Biochemical Sciences 2004, 29, 641–647. [Google Scholar] [CrossRef]
- Rosvall, M.; Axelsson, D.; Bergstrom, C.T. The map equation. The European Physical Journal Special Topics 2009, 178, 13–23. [Google Scholar] [CrossRef]
- Bohlin, L.; Edler, D.; Lancichinetti, A.; Rosvall, M. Community Detection and Visualization of Networks with the Map Equation Framework. In Measuring Scholarly Impact: Methods and Practice; Ding, Y., Rousseau, R., Wolfram, D., Eds.; Springer International Publishing: Cham, 2014; pp. 3–34. [Google Scholar] [CrossRef]
- Lancichinetti, A.; Fortunato, S.; Radicchi, F. Benchmark graphs for testing community detection algorithms. Physical Review E 2008, 78, 046110, Publisher: American Physical Society. [Google Scholar] [CrossRef]
- de Anda-Jáuregui, G. Guideline for comparing functional enrichment of biological network modular structures. Applied Network Science 2019, 4, 1–17, Number: 1 Publisher: SpringerOpen. [Google Scholar] [CrossRef]
- Hartl, C.L.; Ramaswami, G.; Pembroke, W.G.; Muller, S.; Pintacuda, G.; Saha, A.; Parsana, P.; Battle, A.; Lage, K.; Geschwind, D.H. Co-expression network architecture reveals the brain-wide and multi-regional basis of disease susceptibility. Nature neuroscience 2021, 24, 1313. [Google Scholar] [CrossRef]
- Poliseno, L. Pseudogenes: Newly discovered players in human cancer. Science Signaling 2012, 5, re5. [Google Scholar] [CrossRef]
- Costa, V.; Esposito, R.; Aprile, M.; Ciccodicola, A. Non-coding RNA and pseudogenes in neurodegenerative diseases: “The (un)Usual Suspects”. Frontiers in Genetics 2012, 3, 231. [Google Scholar] [CrossRef] [PubMed]
- Wang, H.; Zong, Y.; Zhu, L.; Wang, W.; Han, Y. Chemokines in patients with Alzheimer’s disease: A meta-analysis. Frontiers in Aging Neuroscience 2023, 15, 1047810. [Google Scholar] [CrossRef]
- Patel, P.J.; Ren, Y.; Yan, Z. Epigenomic analysis of Alzheimer’s disease brains reveals diminished CTCF binding on genes involved in synaptic organization. Neurobiology of Disease 2023, 184, 106192. [Google Scholar] [CrossRef]
- Wong, Y.Y.; Xiong, L.Y.; Mori-Fegan, D.K.; Noor, S.; Chenoweth, M.J.; Mirza, S.S.; Masellis, M.; Black, S.E.; Swardfager, W.; Alzheimer’s Disease Neuroimaging Initiative. Relationships between polymorphisms in keratin genes and Alzheimer’s disease phenotypes. Alzheimer’s & Dementia 2023, 19, e074162. [Google Scholar] [CrossRef]
- Richens, J.L.; Spencer, H.L.; Butler, M.; Cantlay, F.; Vere, K.A.; Bajaj, N.; Morgan, K.; O’Shea, P. Rationalising the role of Keratin 9 as a biomarker for Alzheimer’s disease. Scientific Reports 2016, 6, 22962, Publisher: Nature Publishing Group. [Google Scholar] [CrossRef] [PubMed]
- Moll, R.; Divo, M.; Langbein, L. The human keratins: Biology and pathology. Histochemistry and Cell Biology 2008, 129, 705–733. [Google Scholar] [CrossRef]
- Song, Q.; Yu, H.; Cheng, Y.; Han, J.; Li, K.; Zhuang, J.; Lv, Q.; Yang, X.; Yang, H. Bladder cancer-derived exosomal KRT6B promotes invasion and metastasis by inducing EMT and regulating the immune microenvironment. Journal of Translational Medicine 2022, 20, 308. [Google Scholar] [CrossRef]
- Moir, R.D.; Lathe, R.; Tanzi, R.E. The antimicrobial protection hypothesis of Alzheimer’s disease. Alzheimer’s & Dementia: The Journal of the Alzheimer’s Association 2018, 14, 1602–1614. [Google Scholar] [CrossRef]
- Vojtechova, I.; Machacek, T.; Kristofikova, Z.; Stuchlik, A.; Petrasek, T. Infectious origin of Alzheimer’s disease: Amyloid beta as a component of brain antimicrobial immunity. PLOS Pathogens 2022, 18, e1010929, Publisher: Public Library of Science. [Google Scholar] [CrossRef]
- Tiwari, S.; Atluri, V.; Kaushik, A.; Yndart, A.; Nair, M. Alzheimer’s disease: Pathogenesis, diagnostics, and therapeutics. International Journal of Nanomedicine 2019, 14, 5541–5554. [Google Scholar] [CrossRef]
- Roedl, D.; Traidl-Hoffmann, C.; Ring, J.; Behrendt, H.; Braun-Falco, M. Serine protease inhibitor lymphoepithelial Kazal type-related inhibitor tends to be decreased in atopic dermatitis. Journal of the European Academy of Dermatology and Venereology: JEADV 2009, 23, 1263–1266. [Google Scholar] [CrossRef] [PubMed]
- Lehmann, S.M.; Leube, R.E.; Schwarz, N. Keratin 6a mutations lead to impaired mitochondrial quality control. The British Journal of Dermatology 2020, 182, 636–647. [Google Scholar] [CrossRef]
- Kallunki, T.; Su, B.; Tsigelny, I.; Sluss, H.K.; Dérijard, B.; Moore, G.; Davis, R.; Karin, M. JNK2 contains a specificity-determining region responsible for efficient c-Jun binding and phosphorylation. Genes & development 1994, 8, 2996–3007. [Google Scholar] [CrossRef]
- Benvenga, S. Conformational mutations in neuroserpin and familial dementias. Lancet (London, England) 2002, 360, 1696. [Google Scholar] [CrossRef]
- Davis, R.L.; Shrimpton, A.E.; Carrell, R.W.; Lomas, D.A.; Gerhard, L.; Baumann, B.; Lawrence, D.A.; Yepes, M.; Kim, T.S.; Ghetti, B.; et al. Association between conformational mutations in neuroserpin and onset and severity of dementia. Lancet (London, England) 2002, 359, 2242–2247. [Google Scholar] [CrossRef]
- Yepes, M.; Sandkvist, M.; Wong, M.K.K.; Coleman, T.A.; Smith, E.; Cohan, S.L.; Lawrence, D.A. Neuroserpin reduces cerebral infarct volume and protects neurons from ischemia-induced apoptosis. Blood 2000, 96, 569–576. [Google Scholar] [CrossRef] [PubMed]
- Rodríguez-González, R.; Sobrino, T.; Rodríguez-Yáñez, M.; Millán, M.; Brea, D.; Miranda, E.; Moldes, O.; Pérez, J.; Lomas, D.A.; Leira, R.; et al. Association between neuroserpin and molecular markers of brain damage in patients with acute ischemic stroke. Journal of Translational Medicine 2011, 9, 58. [Google Scholar] [CrossRef]
- Moghadam, P.K.; Jackson, M.B. The Functional Significance of Synaptotagmin Diversity in Neuroendocrine Secretion. Frontiers in Endocrinology 2013, 4. [Google Scholar] [CrossRef]
- Weingarten, D.J.; Shrestha, A.; Juda-Nelson, K.; Kissiwaa, S.A.; Spruston, E.; Jackman, S.L. Fast resupply of synaptic vesicles requires synaptotagmin-3. Nature 2022, 611, 320–325, Publisher: Nature Publishing Group. [Google Scholar] [CrossRef]
- Lu, H.; Chen, S.; Nie, Q.; Xue, Q.; Fan, H.; Wang, Y.; Fan, S.; Zhu, J.; Shen, H.; Li, H.; et al. Synaptotagmin-3 interactions with GluA2 mediate brain damage and impair functional recovery in stroke. Cell Reports 2023, 42, 112233. [Google Scholar] [CrossRef]
- Chum, P.P.; Bishara, M.A.; Solis, S.R.; Behringer, E.J. Cerebrovascular miRNAs Track Early Development of Alzheimer’s Disease and Target Molecular Markers of Angiogenesis and Blood Flow Regulation. Journal of Alzheimer’s disease : JAD 2024, 99, S187–S234. [Google Scholar] [CrossRef] [PubMed]
- Esashi, E.; Bao, M.; Wang, Y.H.; Cao, W.; Liu, Y.J. PACSIN1 regulates the TLR7/9-mediated type I interferon response in plasmacytoid dendritic cells. European Journal of Immunology 2012, 42, 573–579. [Google Scholar] [CrossRef] [PubMed]
- Floyd, S.R.; Porro, E.B.; Slepnev, V.I.; Ochoa, G.C.; Tsai, L.H.; De Camilli, P. Amphiphysin 1 binds the cyclin-dependent kinase (cdk) 5 regulatory subunit p35 and is phosphorylated by cdk5 and cdc2. The Journal of Biological Chemistry 2001, 276, 8104–8110. [Google Scholar] [CrossRef] [PubMed]
- Alwadei, A.H.; Benini, R.; Mahmoud, A.; Alasmari, A.; Kamsteeg, E.J.; Alfadhel, M. Loss-of-function mutation in RUSC2 causes intellectual disability and secondary microcephaly. Developmental Medicine & Child Neurology 2016, 58, 1317–1322. _eprint. [Google Scholar] [CrossRef]
- MacKenzie, K.C.; de Graaf, B.M.; Syrimis, A.; Zhao, Y.; Brosens, E.; Mancini, G.M.S.; Schot, R.; Halley, D.; Wilke, M.; Vøllo, A.; et al. Goldberg–Shprintzen syndrome is determined by the absence, or reduced expression levels, of KIFBP. Human Mutation 2020, 41, 1906–1917. [Google Scholar] [CrossRef]
- Melo, D.; Pallares, L.F.; Ayroles, J.F. Reassessing the modularity of gene co-expression networks using the Stochastic Block Model. PLOS Computational Biology 2024, 20, e1012300. [Google Scholar] [CrossRef]
- Yin, W.; Mendoza, L.; Monzon-Sandoval, J.; Urrutia, A.O.; Gutierrez, H. Emergence of co-expression in gene regulatory networks. PLoS ONE 2021, 16, e0247671. [Google Scholar] [CrossRef]
- Li, M.; Hao, X.; Hu, Z.; Tian, J.; Shi, J.; Ma, D.; Guo, M.; Li, S.; Zuo, C.; Liang, Y.; et al. Microvascular and cellular dysfunctions in Alzheimer’s disease: an integrative analysis perspective. Scientific Reports 2024, 14, 20944, Publisher: Nature Publishing Group. [Google Scholar] [CrossRef]
- García-Cortés, D.; Hernández-Lemus, E.; Espinal-Enríquez, J. Luminal A Breast Cancer Co-expression Network: Structural and Functional Alterations. Frontiers in Genetics 2021, 12. Publisher: Frontiers. [Google Scholar] [CrossRef]
Figure 1.
The workflow methodology used in this work includes 3 stages. Stage 1 includes Data quality control, normalization and stratification, followed by the construction of the gene co-expression networks separately for the two groups: individuals diagnosed with AD and age-matched controls. Stage 2 includes the Topological analysis and the null model test and finally, Stage 3 includes communities and functional analysis (Created in BioRender.com)
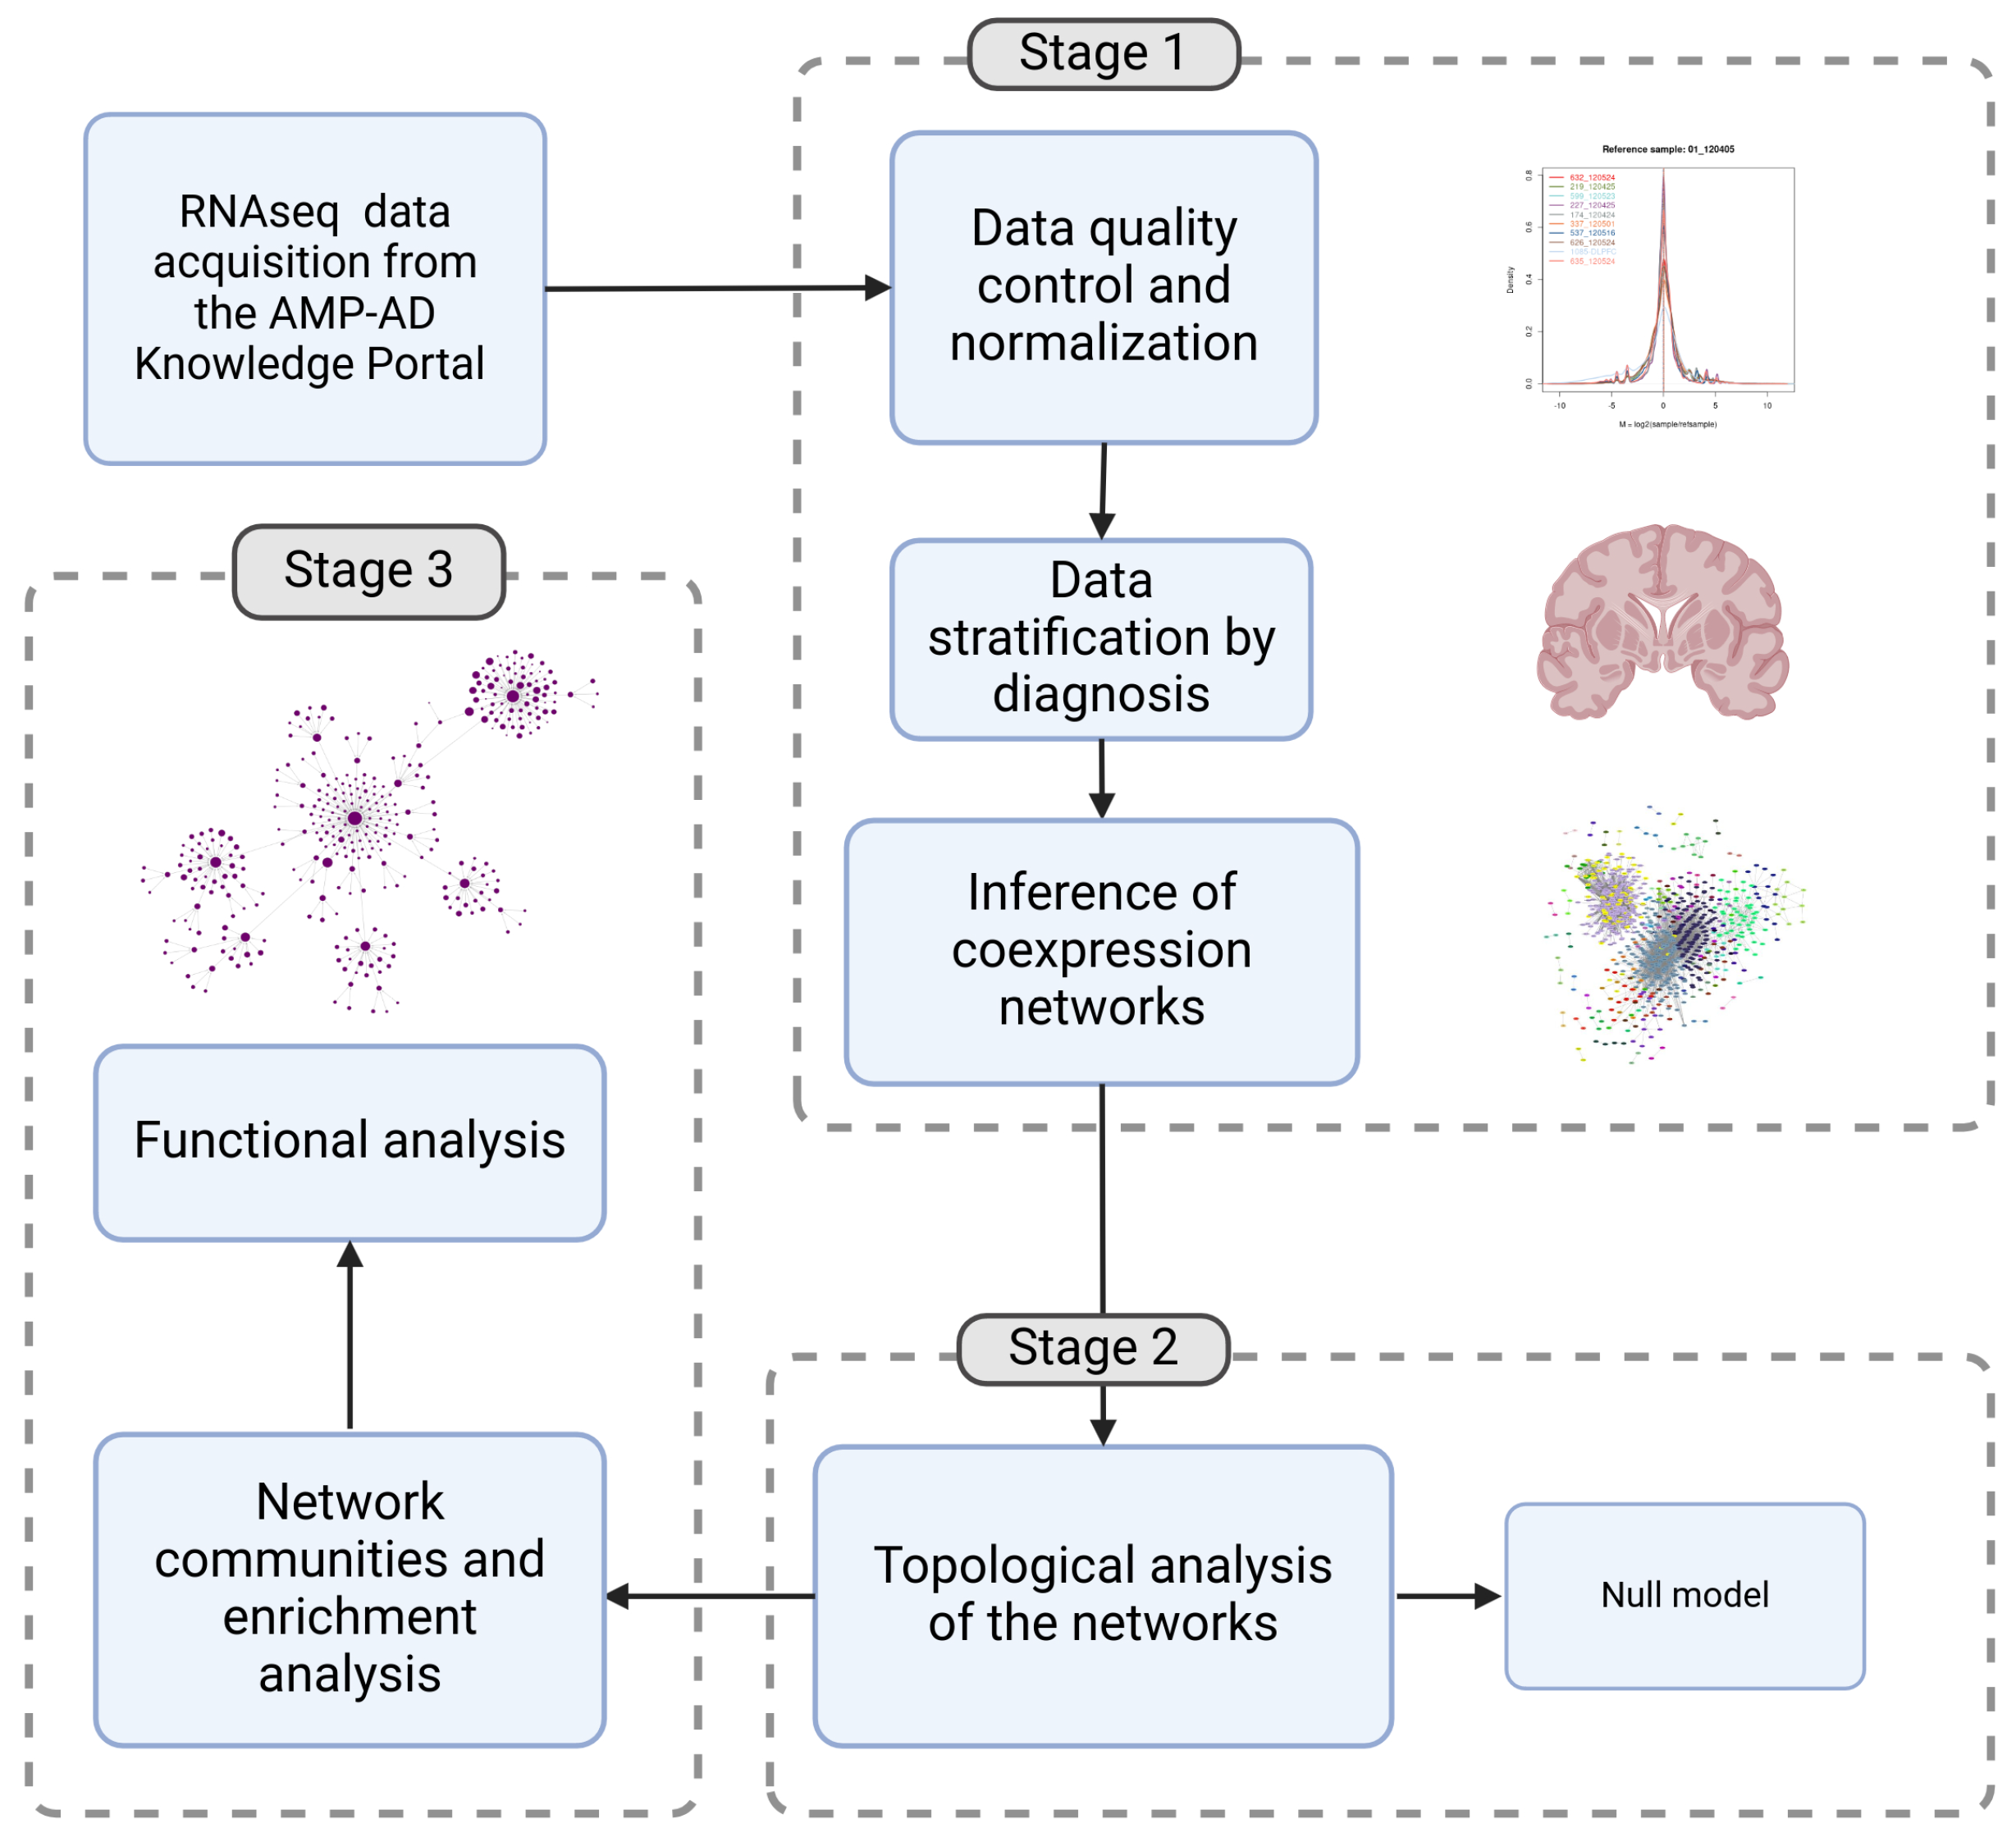
Figure 2.
(a) Comparison of shared and exclusive “hub” genes between people with AD (AD) and people without AD (C). The blue area shows the hub genes shared by both conditions, while the other sectors highlight the exclusive genes. (b) Comparison of genes with high betweenness centrality between people with and without AD. The blue intersection indicates genes with high shared betweenness centrality, while the remaining sectors show genes unique to each condition. (c) Induced subgraph of hub genes present in the network of people with AD that are not found in the list of hub genes of people without AD. This represents the genes specific to the AD condition in terms of degree centrality. (d) Induced subgraph of genes with high betweenness centrality present in the network of people with AD, which are not in the list of “hub genes” of people without AD. (e) Gene-Concept Network of the enriched pathways for the set of high betweenness genes in the hypergeometric test for the Biological Process (BP). Enriched pathways include the regulation of short-term neuronal synaptic plasticity, synaptic vesicle maturation, synaptic vesicle cycle, regulation of synaptic vesicle exocytosis, and the vesicle-mediated transport in synapse, among others.
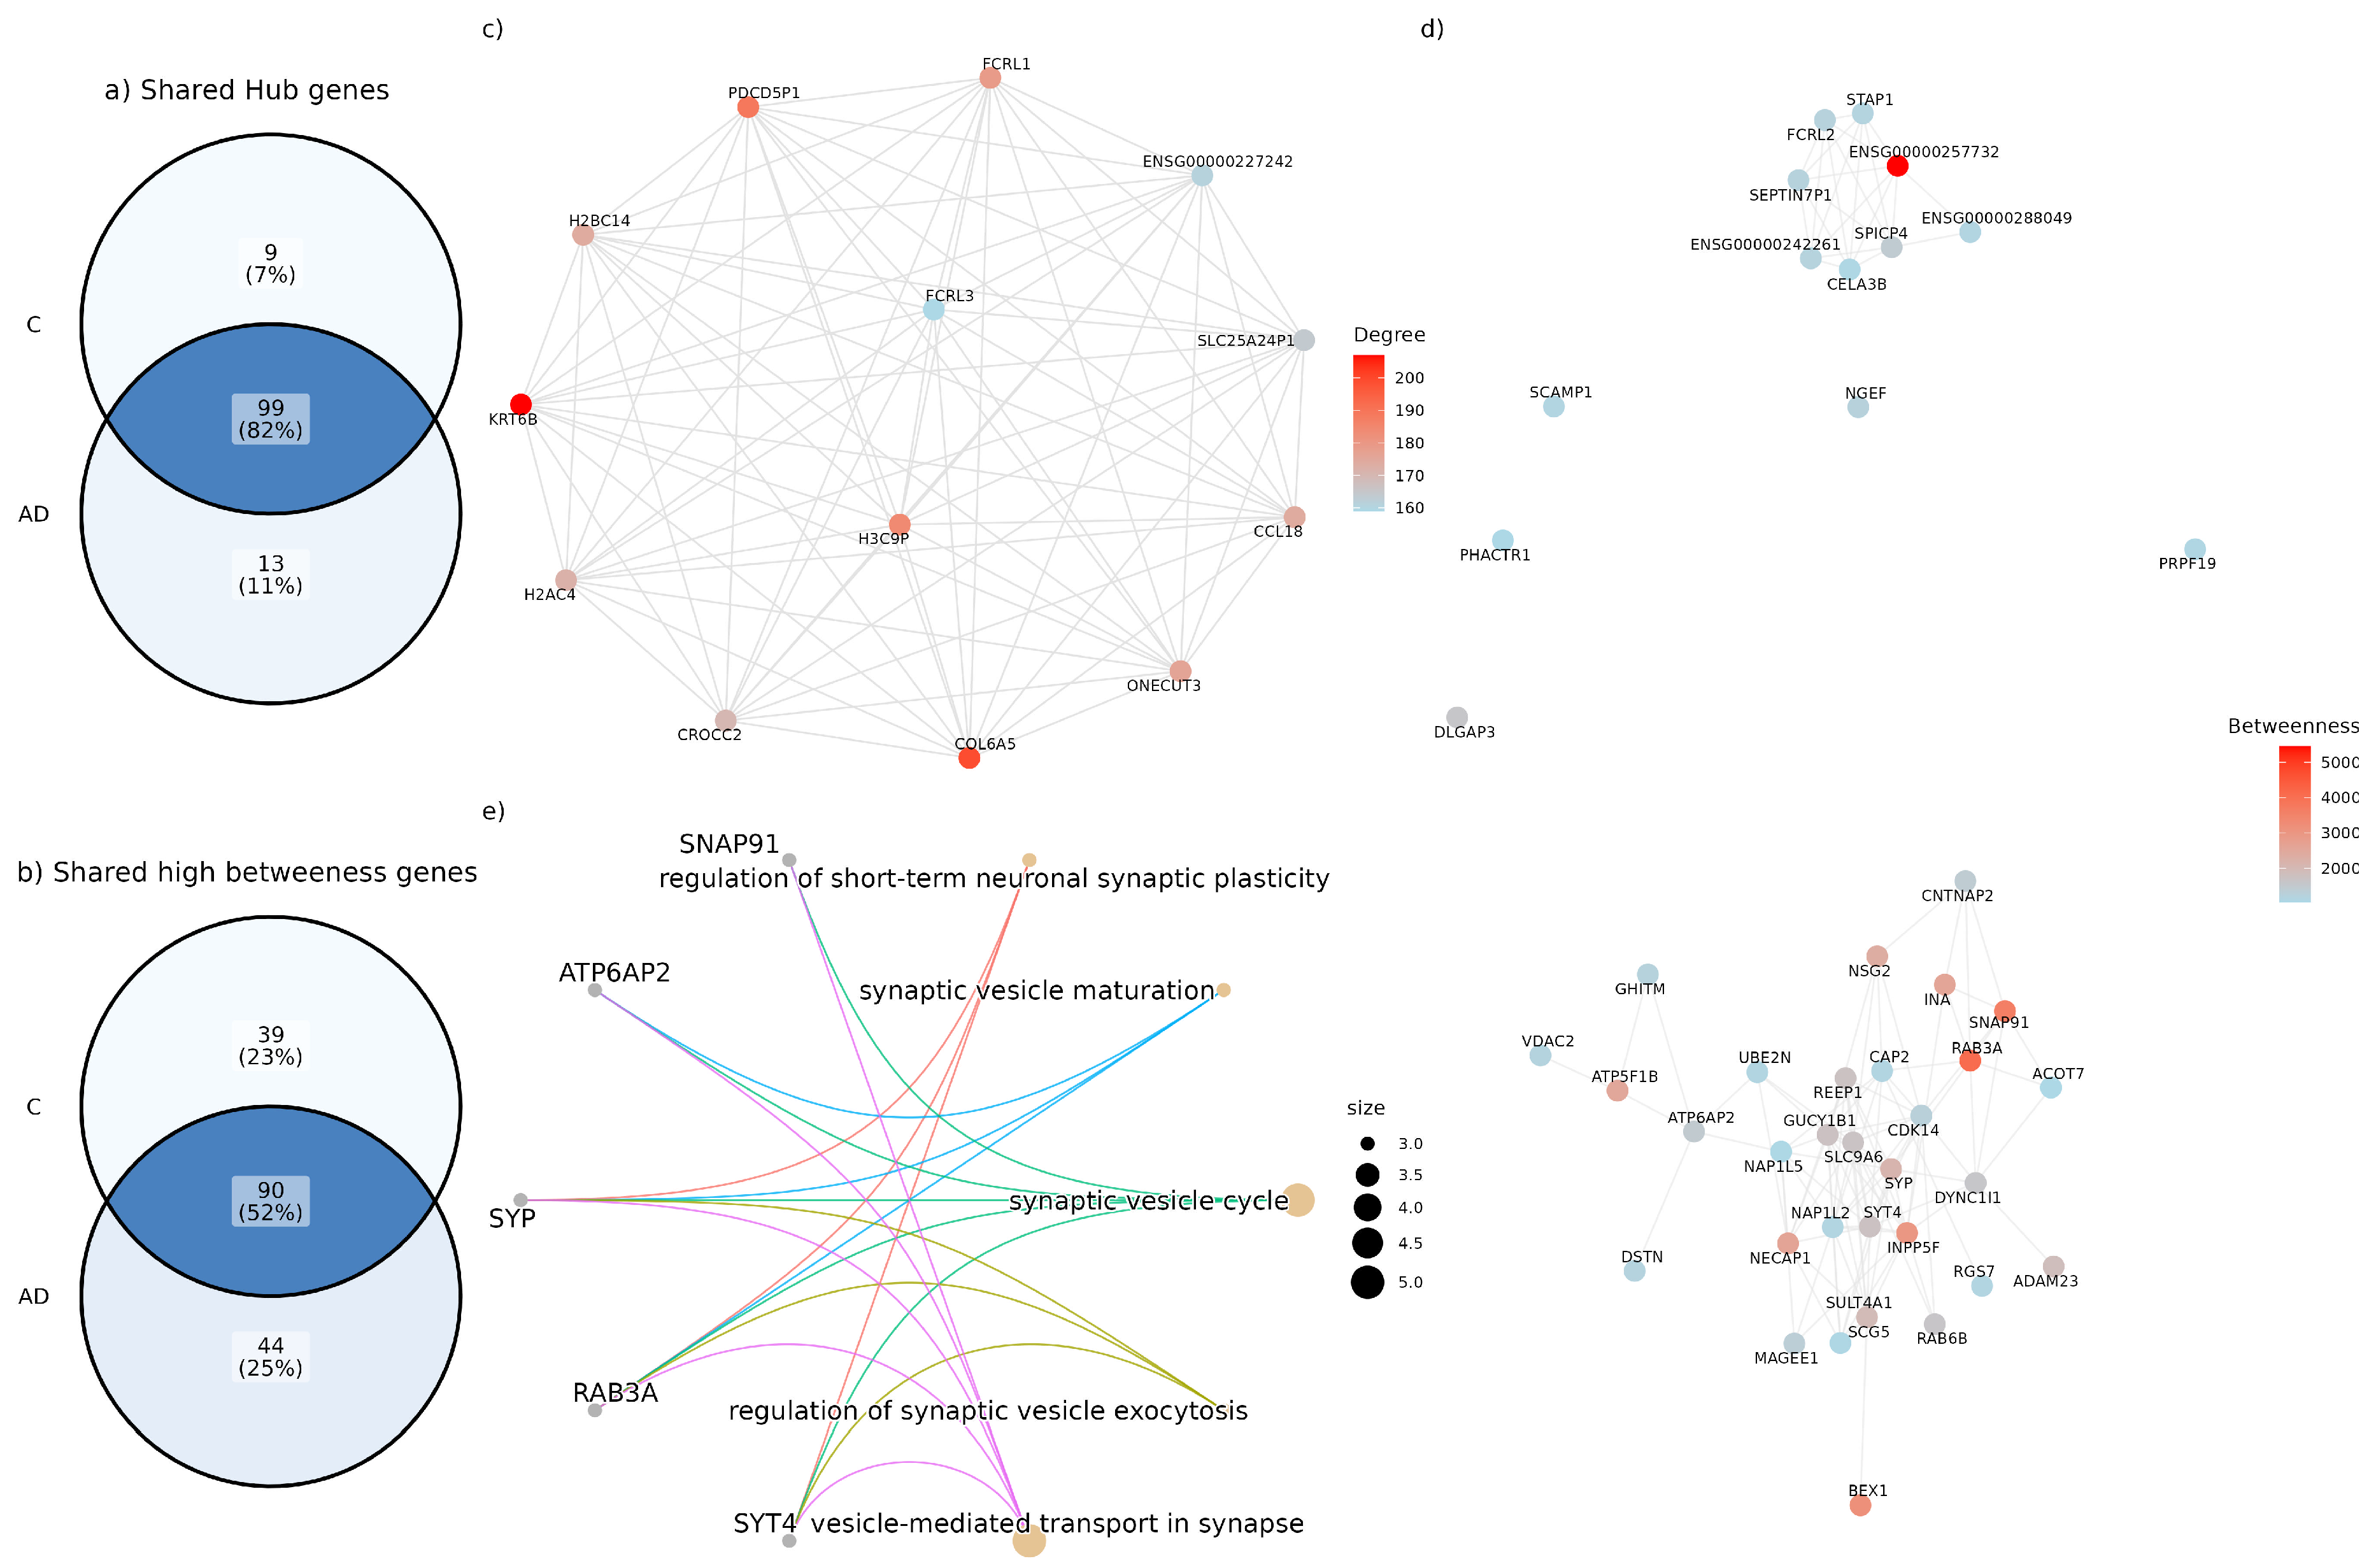
Figure 3.
Top 50 Biological Processes with Largest Differences in Module Representation between AD and Control Networks. Here is shown the number of modules associated with the top 50 GO:BP terms that exhibit the largest differences in module representation between AD and control networks. Biological processes are listed on the y-axis, while the number of modules associated with each process is represented on the x-axis. Red bars correspond to modules in the AD network, while blue bars represent modules in the control network. The numbers on the right indicate the absolute differences of modular representation units.
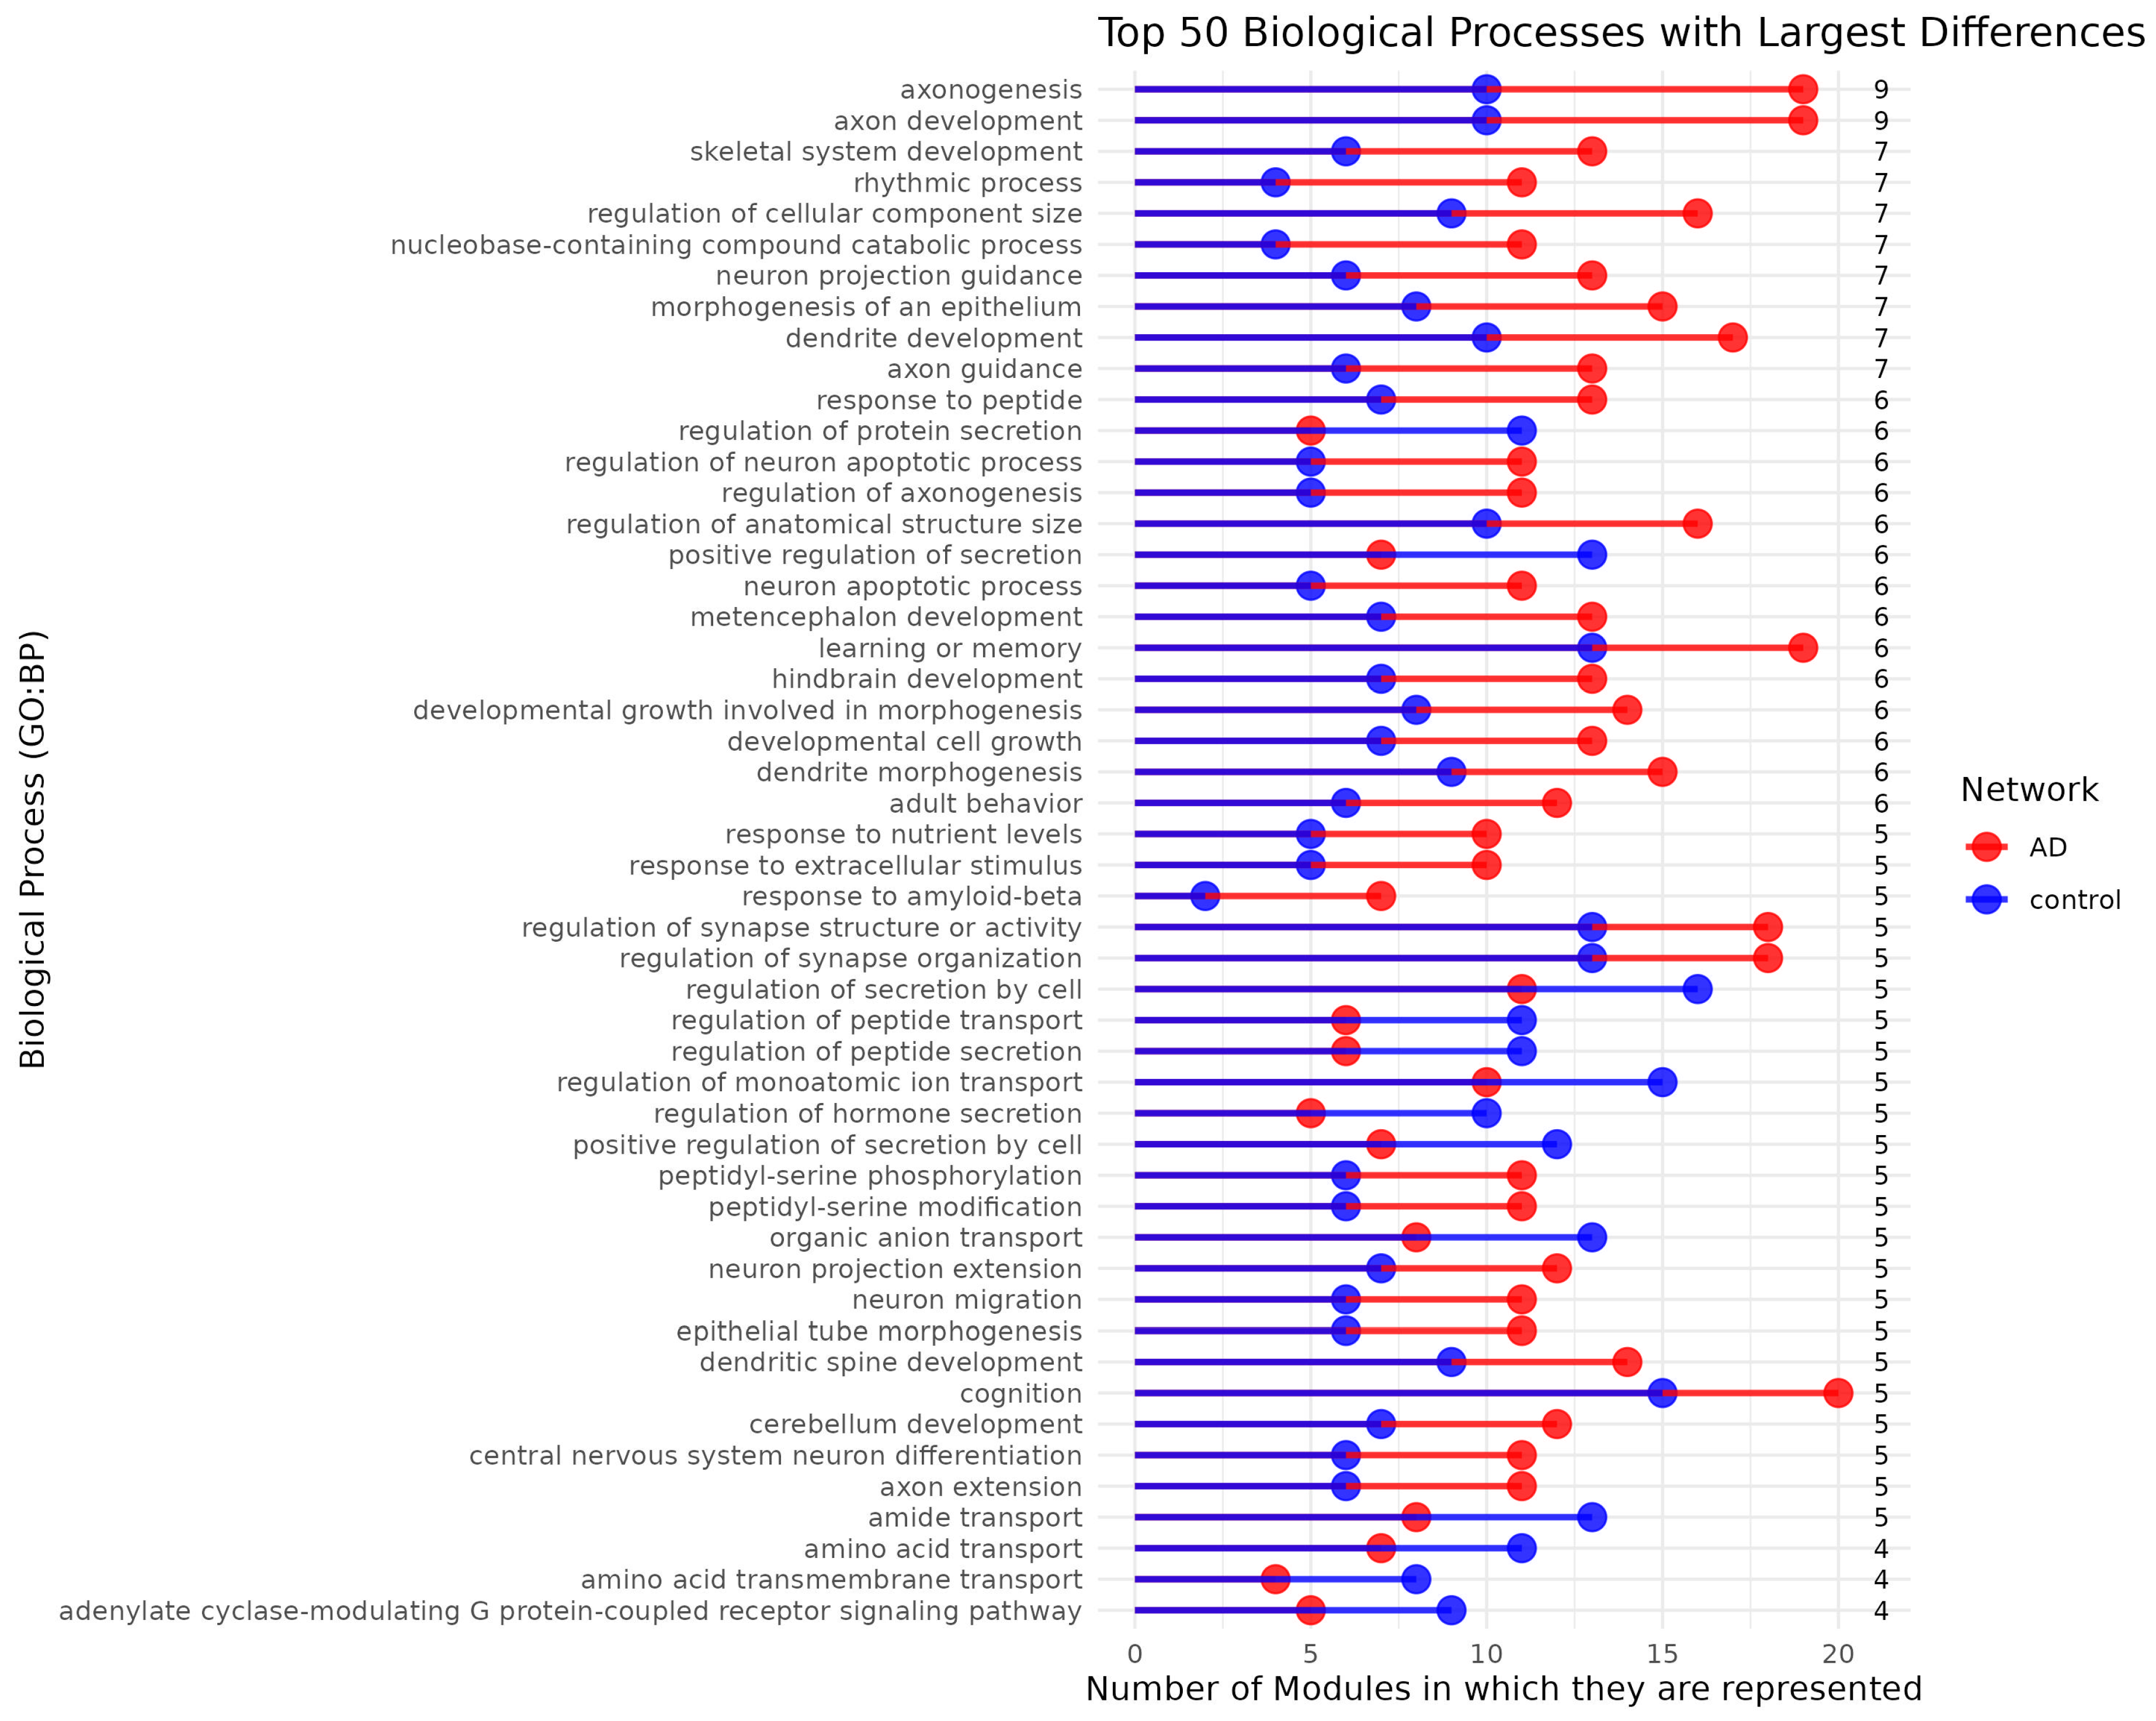
Figure 4.
log(k) vs log(p(k)). log-log representation of the degree distribution for the two networks. Lines and dots in blue represent the data of the network corresponding to AD and nodes in gray represent the data of the control network. (Inset) Cumulative degree distribution of both models. The red curve represents the AD network and the blue curve the control network.
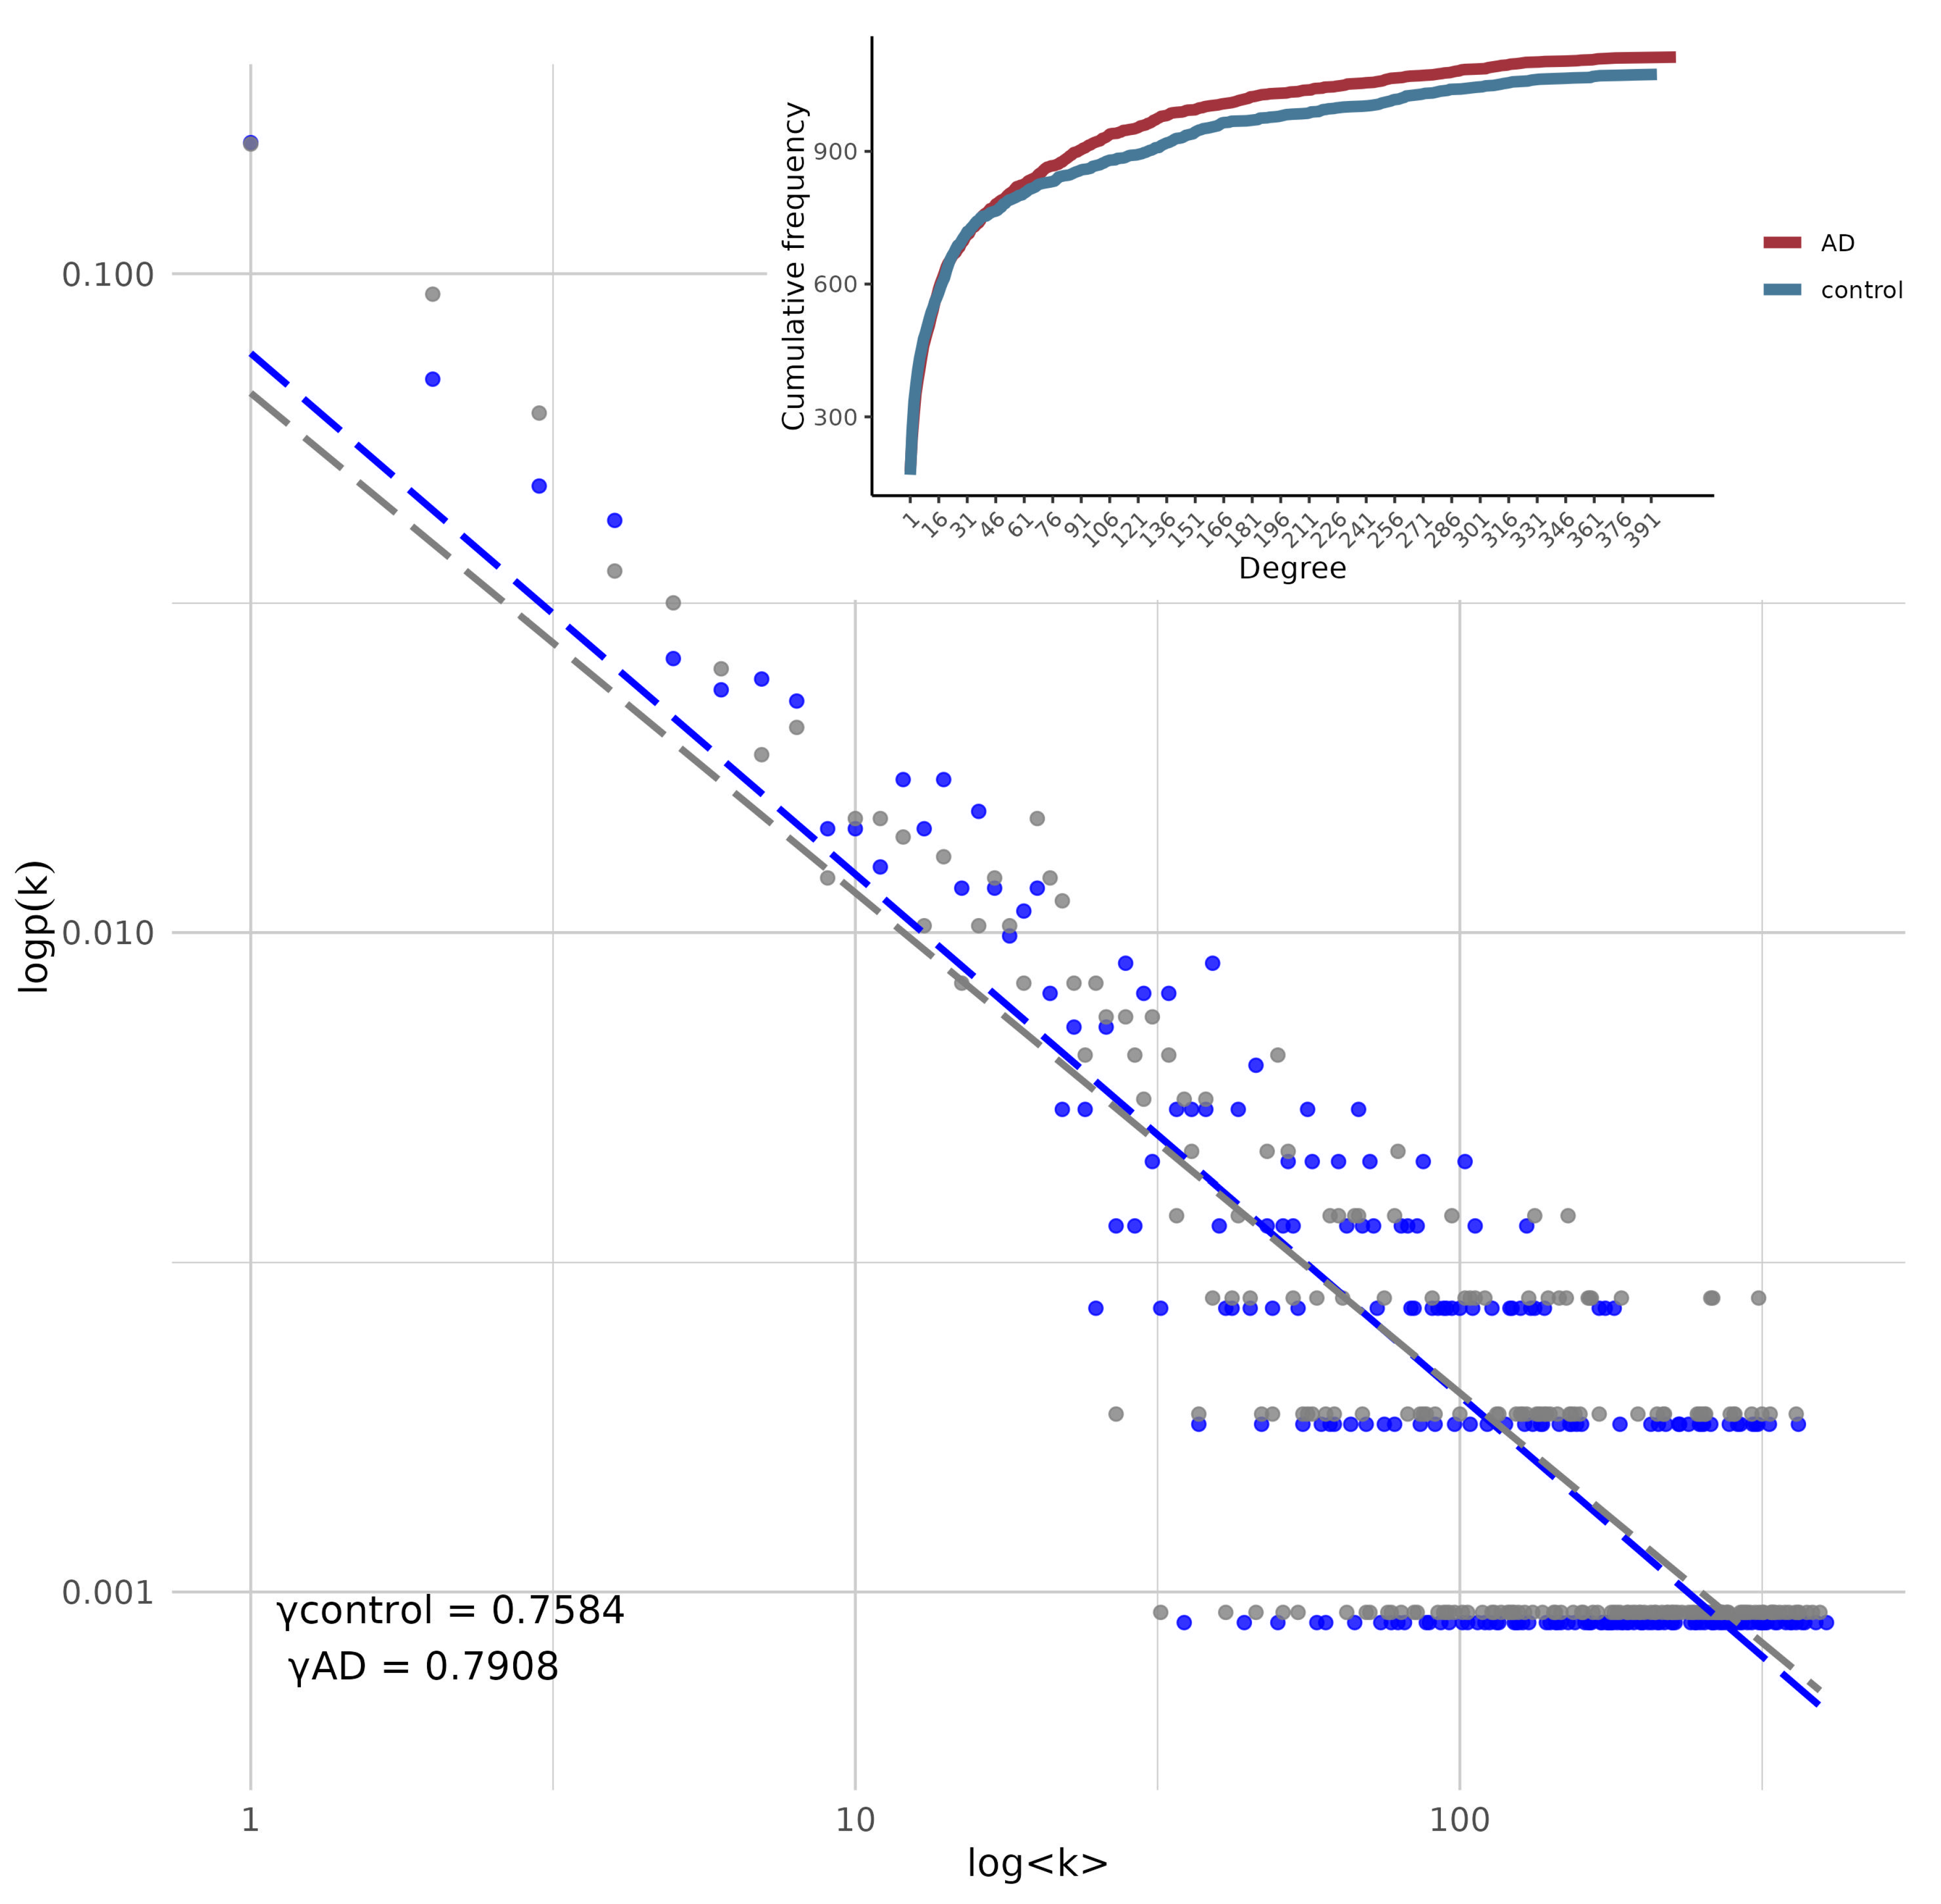
Figure 5.
Modular structure of networks for (a) Control network; (b) Alzheimer’s disease coexpression network. The nodes belonging to a community are colored the same. The same color for different modules is not related.
Figure 5.
Modular structure of networks for (a) Control network; (b) Alzheimer’s disease coexpression network. The nodes belonging to a community are colored the same. The same color for different modules is not related.
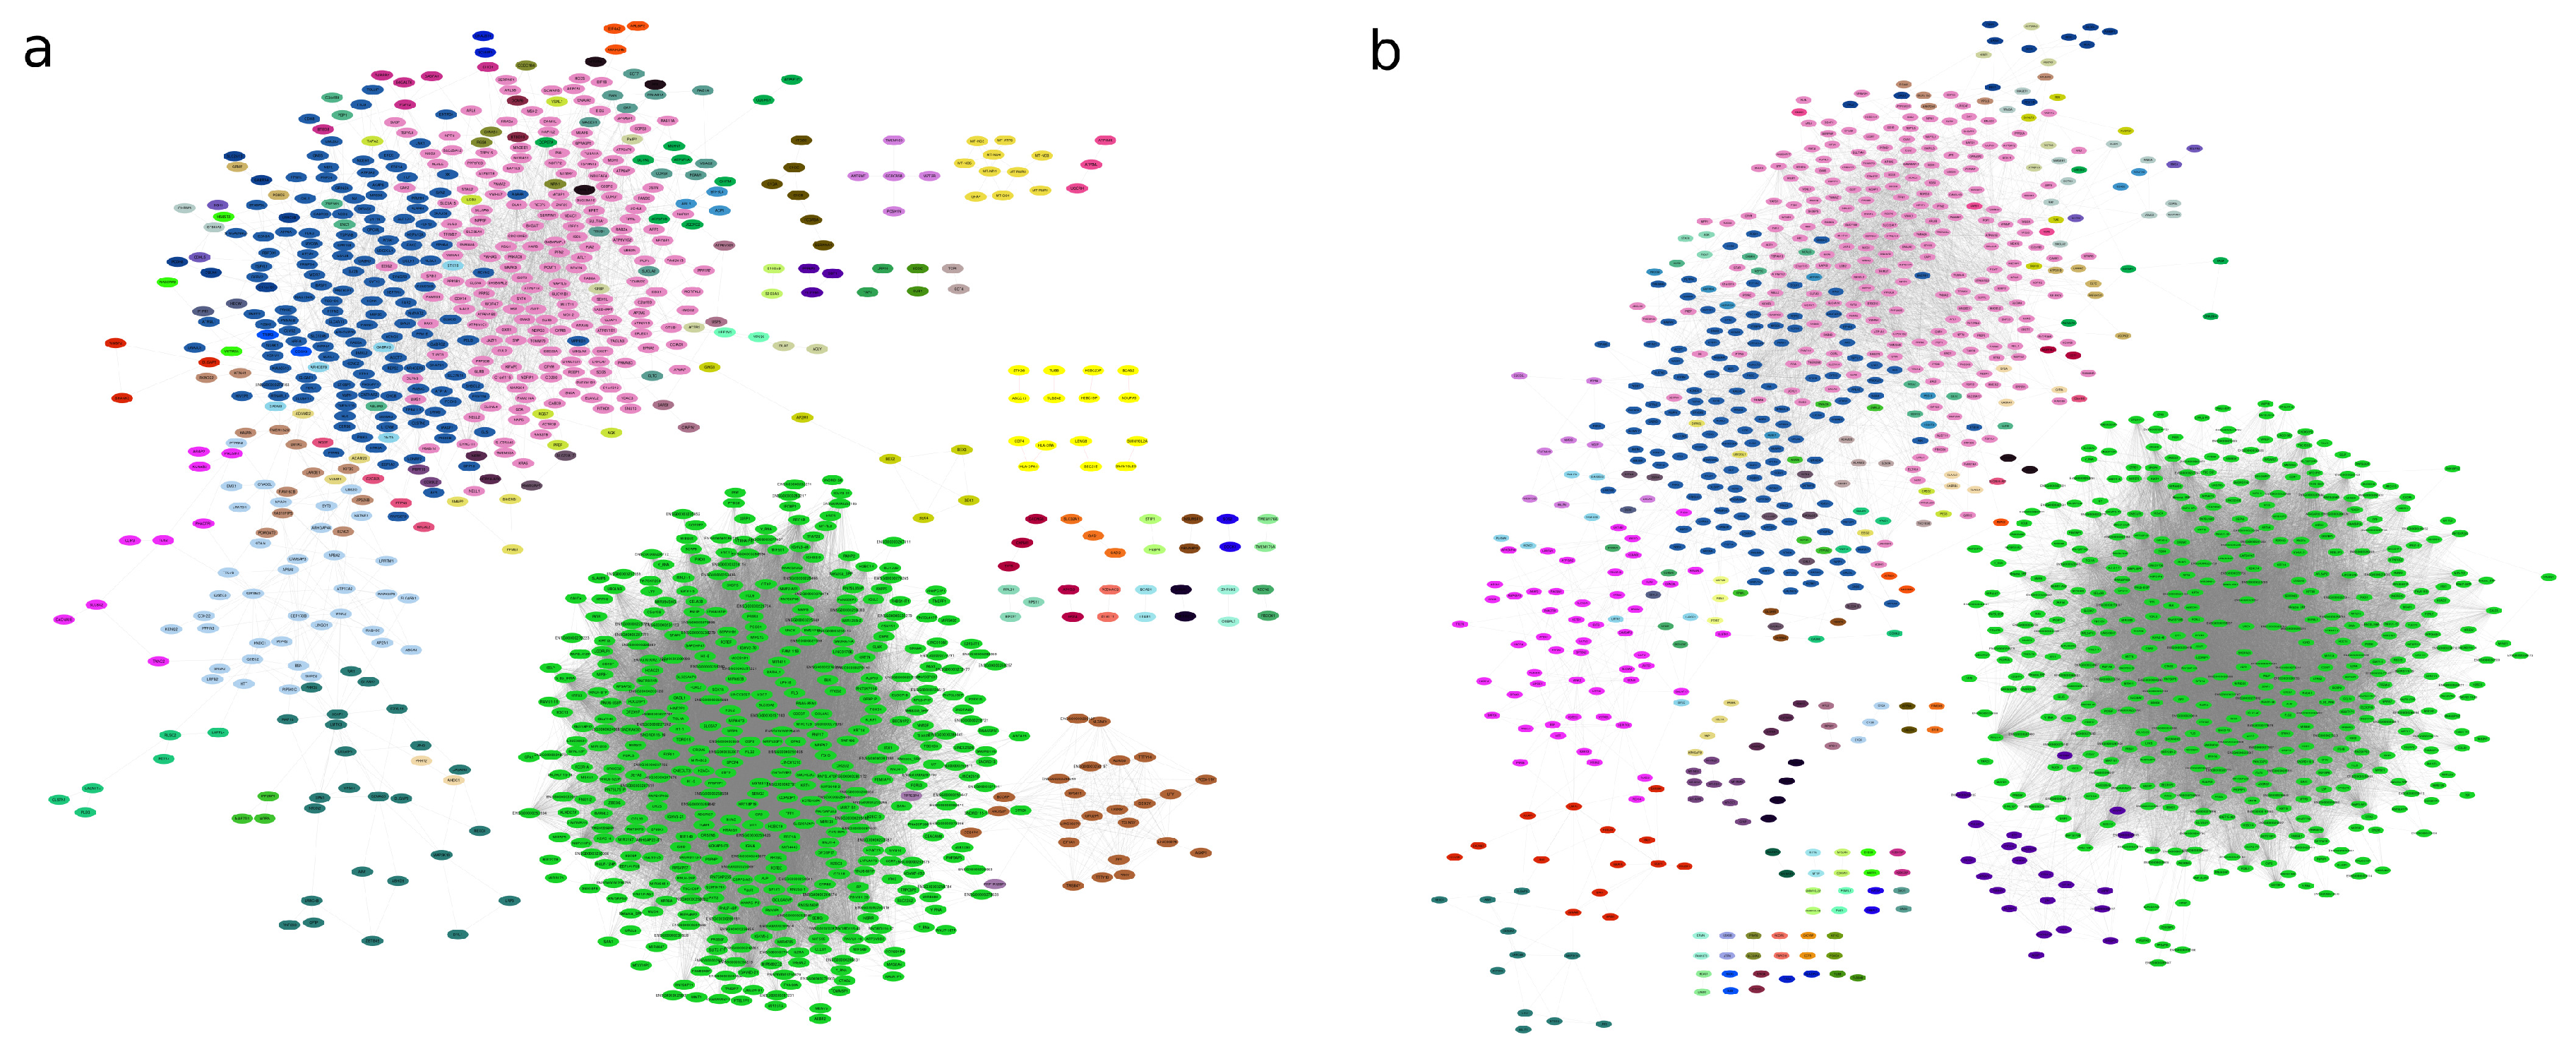
Figure 6.
(a) Similarity matrix between gene modules, based on the correspondence of shared genes between these modules. Each row and column corresponds to a specific gene module from two different networks. The colors of the cells represent the degree of similarity between the modules, calculated using the Jaccard index. (b) Heatmap of functional enrichment similarities between gene modules based on GO:BP biological processes.
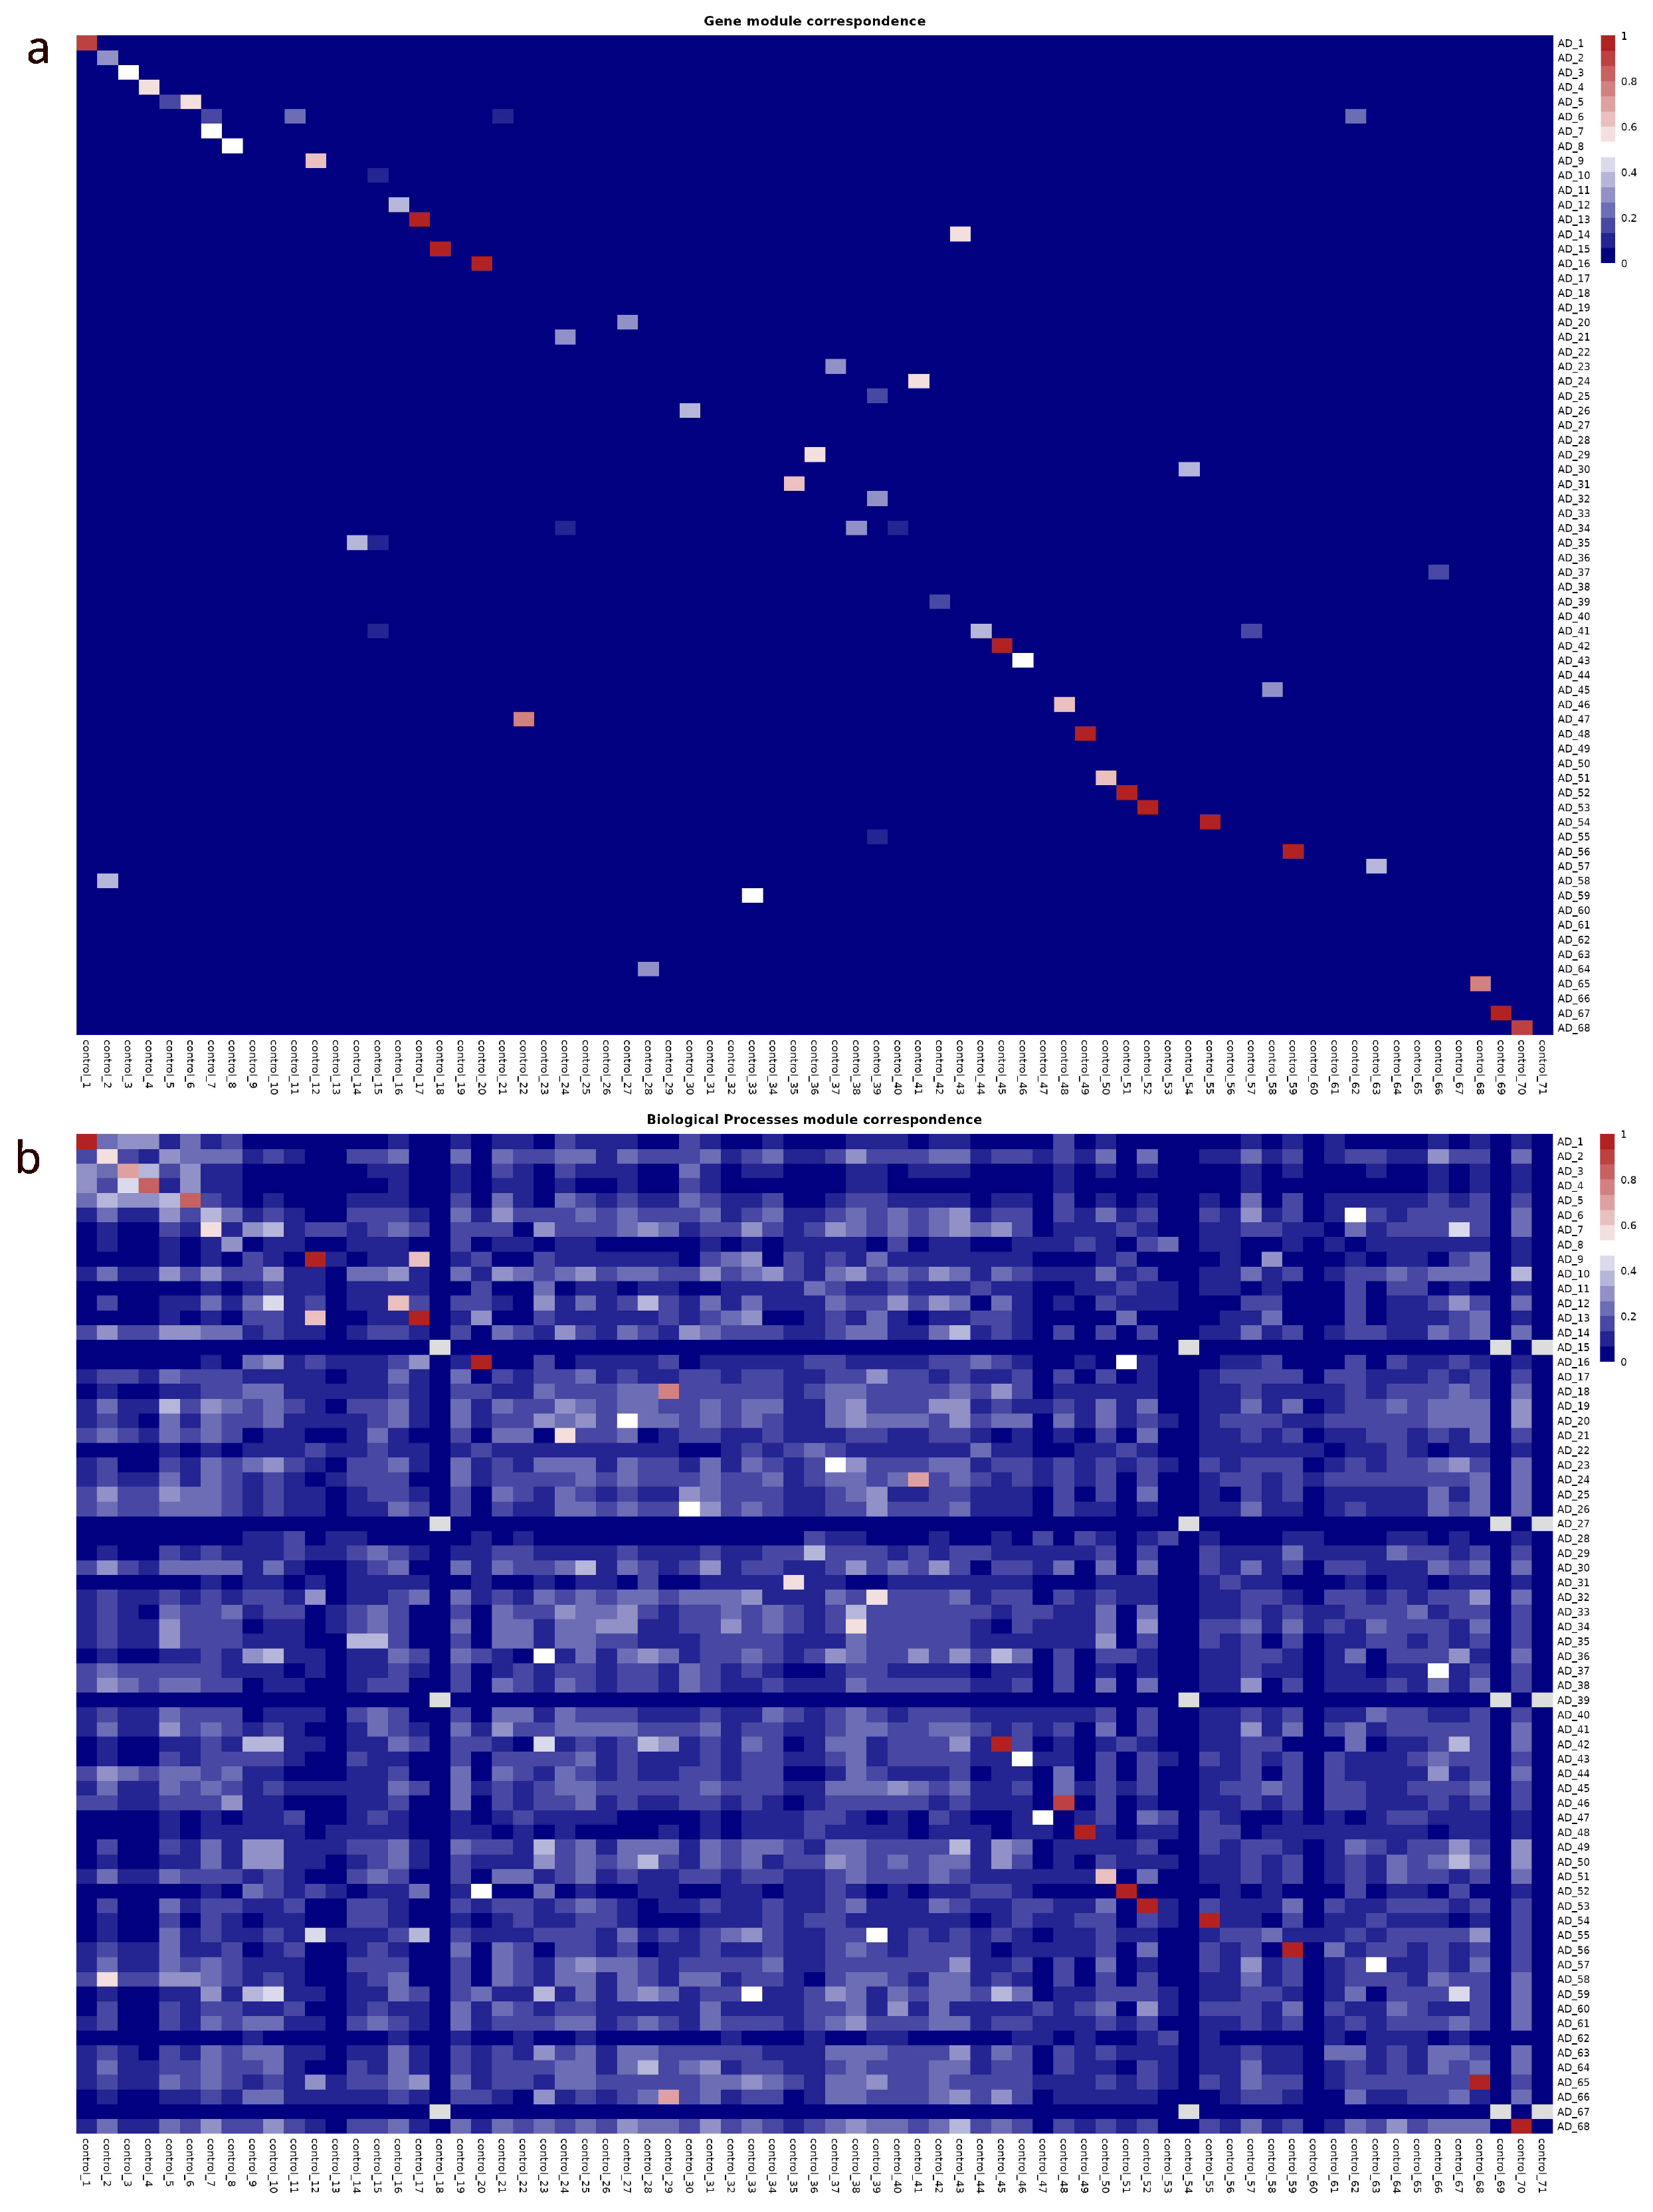
Figure 7.
(a) Changes in the degree of hub genes in the control network (blue) and in the AD network (red). The number at the top of the bars indicates the difference in degree between the two conditions (b) Enrichment of common newly coexpressed genes. We can observe at least 4 weekly groups of metabolic pathways.
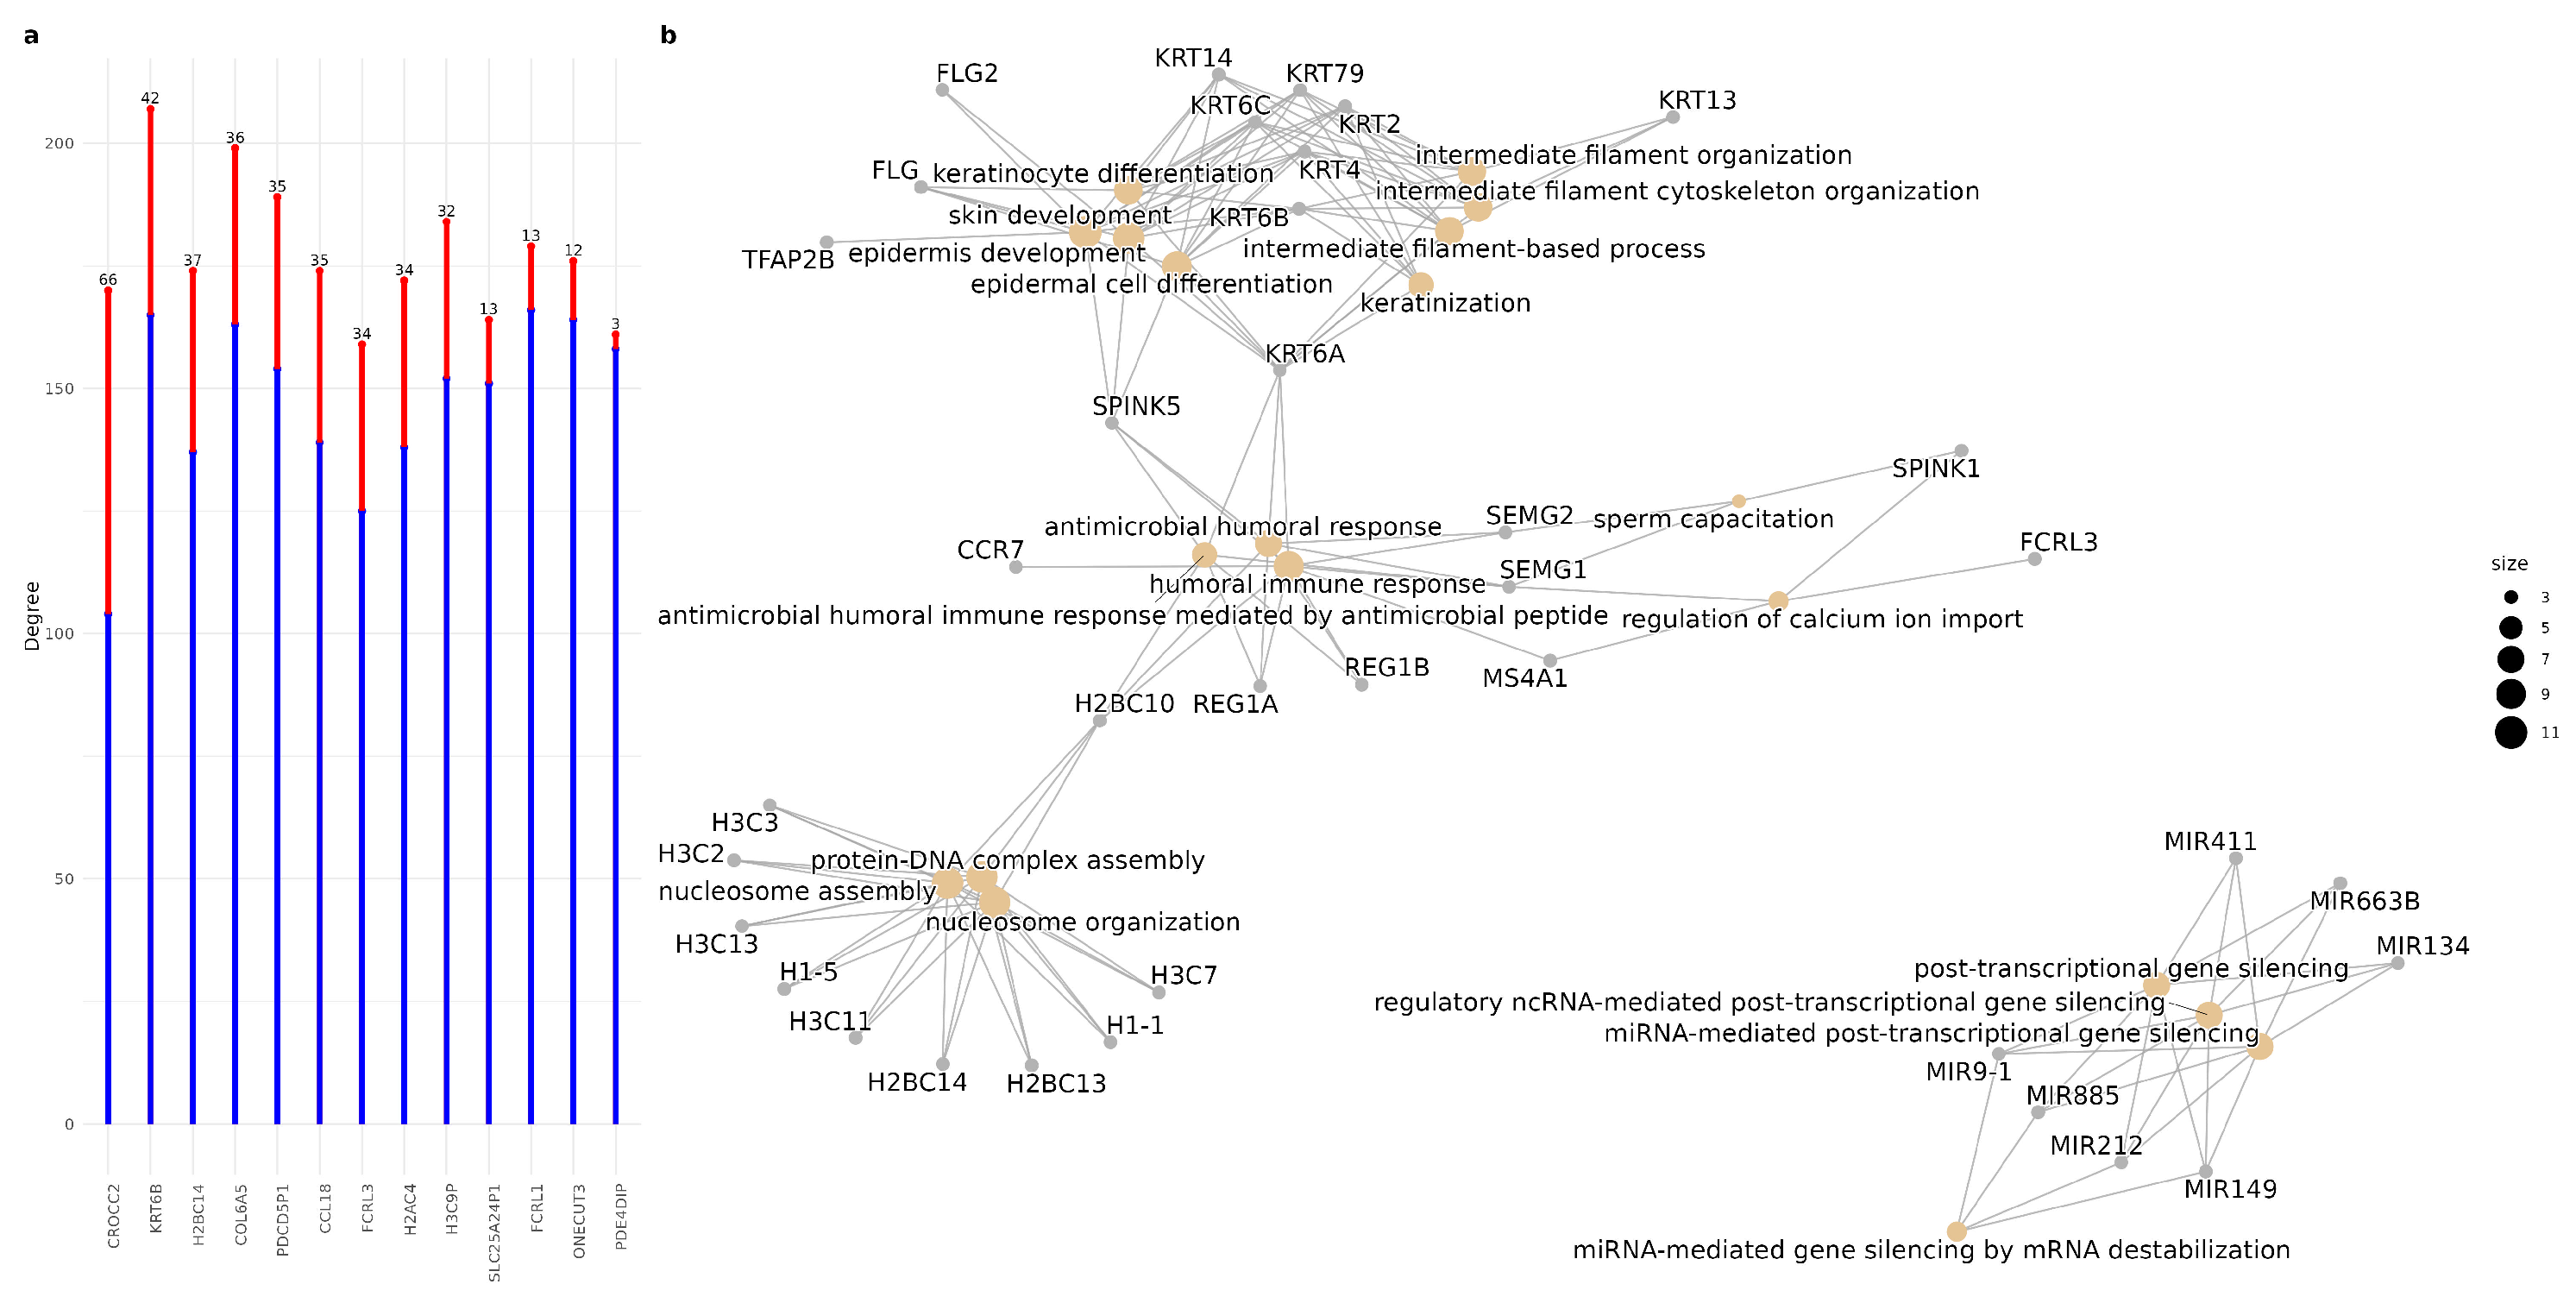

Table 1.
Topological features of the AD and control network.
| Control network | AD network | |
|---|---|---|
| Total genes | 1074 | 1113 |
| Number of edges | 28160 | 28160 |
| Network diameter | 12 | 13 |
| Global transitivity (Clustering coefficient) | 0.6252799 | 0.5956005 |
| Edges similitude (by Jaccard index) | 68.39% | |
| Number of genes in largest connected component | 529 | 568 |
| Number of modules (Infomap partition) | 71 | 68 |
| Scaling exponent | 0.7584 | 0.7908 |
Disclaimer/Publisher’s Note: The statements, opinions and data contained in all publications are solely those of the individual author(s) and contributor(s) and not of MDPI and/or the editor(s). MDPI and/or the editor(s) disclaim responsibility for any injury to people or property resulting from any ideas, methods, instructions or products referred to in the content. |
© 2025 by the authors. Licensee MDPI, Basel, Switzerland. This article is an open access article distributed under the terms and conditions of the Creative Commons Attribution (CC BY) license (http://creativecommons.org/licenses/by/4.0/).
Copyright: This open access article is published under a Creative Commons CC BY 4.0 license, which permit the free download, distribution, and reuse, provided that the author and preprint are cited in any reuse.


