
Submitted:
18 December 2024
Posted:
26 December 2024
You are already at the latest version
Abstract
The rising prevalence of Alzheimer’s disease (AD), particularly among older adults, has driven increased research into its underlying mechanisms and risk factors. Aging, genetic susceptibility, and cardiovascular health are recognized contributors to AD, but how the age of onset affects disease progression remains underexplored. This study investigates the role of early- versus late-onset Alzheimer’s disease (EOAD and LOAD, respectively) in shaping the trajectory of cognitive decline. Leveraging data from the Religious Orders Study and Memory and Aging Project (ROSMAP), two cohorts were established: individuals with early-onset AD and those with late-onset AD. Comprehensive analyses, including differential gene expression profiling, pathway enrichment, and gene co-expression network construction, were conducted to identify distinct molecular signatures associated with each cohort. Network modularity learning algorithms were used to discern inner structure of co-expression networks and their related functional features. Key network descriptors were computed to enhance the interpretation of these findings, providing new insights into how age at onset may influence the biological progression of AD.
Keywords:
Alzheimer’s disease
; Molecular Signatures
; Gene Co-expression Networks
; Pathway Enrichment
; Network Analytics
1. Introduction
Alzheimer’s disease (AD) stands as one of the most pressing health challenges of the 21st century, with its prevalence escalating in tandem with global aging demographics. Despite decades of intensive research, the etiology and progression of AD remain elusive, necessitating innovative approaches to unravel its complexities. In recent years, computational systems biology and network science have emerged as powerful tools for dissecting the intricate molecular mechanisms underlying complex diseases like AD. Leveraging high-throughput data and advanced analytical methods, these interdisciplinary fields offer new avenues for understanding the pathogenesis of AD and identifying potential therapeutic targets.
Numerous risk factors have been implicated in the development of AD, including genetic predisposition, aging, and cardiovascular conditions. However, the interplay between these factors and their impact on disease progression remains poorly understood. Addressing this knowledge gap requires a holistic approach that integrates diverse data types and employs sophisticated analytical frameworks. Here, we present a comprehensive investigation into Alzheimer’s disease progression, emphasizing the interaction between genetic predisposition, aging, and cardiovascular conditions. Utilizing data from the Religious Orders Study and Memory and Aging Project (ROSMAP), this study aims to identify molecular networks and pathways that advance understanding of the interplay between these risk factors.
By delineating gene expression patterns, elucidating enriched biological pathways, and constructing gene co-expression networks, we aim to unravel the molecular underpinnings of AD pathogenesis. Through the lens of computational systems biology and network science, we seek to uncover novel insights into the complex role of gene expression as it relates to AD onset. Our study represents an effort to bridge the gap between traditional biomedical research and cutting-edge computational methodologies, offering a unique perspective on the multifaceted nature of AD and paving the way for personalized therapeutic strategies.
2. Methods
2.1. Data Acquisition, Preprocessing, and Differential Expression
For our study, we utilized RNA sequencing (RNA-seq) data from the Religious Orders Study and Memory and Aging Project (ROSMAP) [1]. ROSMAP offers a valuable cohort of longitudinally collected clinical data, making it an ideal source for studying the molecular underpinnings of aging and Alzheimer’s disease progression. The preprocessing of this data involved standard steps to minimize biases typically introduced by batch effects, variations in sequencing depth, and potential contamination. This preprocessing was critical to ensure the integrity and comparability of our expression profiles across different samples.
Normalization of the data was conducted using the Trimmed Mean of M values (TMM) method, implemented via the edgeR package [2]. Following normalization, we conducted differential expression analysis to distinguish between early-onset and late-onset Alzheimer’s disease phenotypes using the same edgeR tool. This analysis helps identify genes that exhibit significant changes in expression between these two conditions, highlighting their differences at the gene expression level.
2.2. Pathway Enrichment Analysis
The functional enrichment analysis was performed using the Generally Applicable Gene-set Enrichment (GAGE) method [3]. Unlike traditional methods that assume uniform expression changes within a pathway, GAGE acknowledges the complexity of biological regulation, where different components of a pathway can be regulated in opposing directions. This nuanced approach allows for a more realistic interpretation of the pathway data.
For these analysis, pathway descriptions were sourced from the Kyoto Encyclopedia of Genes and Genomes (KEGG) [4]. KEGG’s comprehensive databases of signaling and metabolic pathways provided us with the necessary framework to map our expression data onto biologically relevant pathways, therefore providing with a thorough description of the molecular mechanisms that are differently affected in early and late-onset Alzheimer’s disease and identifying key processes impacted by the disease.
2.3. Reconstruction of Gene Co-Expression Networks
To explore the complex molecular interplay in Alzheimer’s disease, we inferred gene co-expression networks for both early-onset and late-onset phenotypes using the mutual information metric, implemented in the minet package [5]. Mutual information, a non-linear measure of association, is particularly adept at capturing the diverse ways in which gene expressions can be interlinked, beyond simple linear correlations. This approach allowed us to construct networks that reflect true biological relationships with higher fidelity. By setting a threshold at the 99th percentile for mutual information values, we ensured that only the most significant connections were considered, thus focusing on the most influential gene interactions. These networks were further analyzed and visualized using the igraph package [6] and Cytoscape software [7], providing both quantitative and qualitative insights into the gene regulatory networks that define each Alzheimer’s phenotype.
2.4. Inference of Modular Structure and Functional Analysis in Alzheimer’s Disease Co-Expression Networks
Modules were detected using the Infomap algorithm [8] as implemented in the igraph package. We ran 1000 iterations to ensure convergence. We chose the Infomap algorithm for its efficiency and superior performance as demonstrated in various tests, where it consistently ranked highest in runtime, accuracy, and overall performance, particularly in terms of the LFR benchmark [9].
We then proceeded to identify the functional role of these modules using an enrichment strategy. We employed Over Representation Analysis, utilizing a hypergeometric test to ascertain significant associations between each module’s gene set and sets of genes involved in biological functions as outlined by the Gene Ontology (GO) database [10]. This approach was implemented using the HTSanalyzer package in R [11], where GO terms were deemed significantly enriched if they exhibited an adjusted Benjamini-Hochberg p-value less than 0.05.
The resultant relationships from the enrichment analysis were represented as functional bipartite networks. These networks consist of two layers: one of gene modules and another of GO terms, effectively illustrating the connections between gene clusters and their related biological processes. This network representation aids in modeling the complex interplay of molecular functions in the progression of Alzheimer’s disease, showcasing the specific biological processes associated with different gene modules.
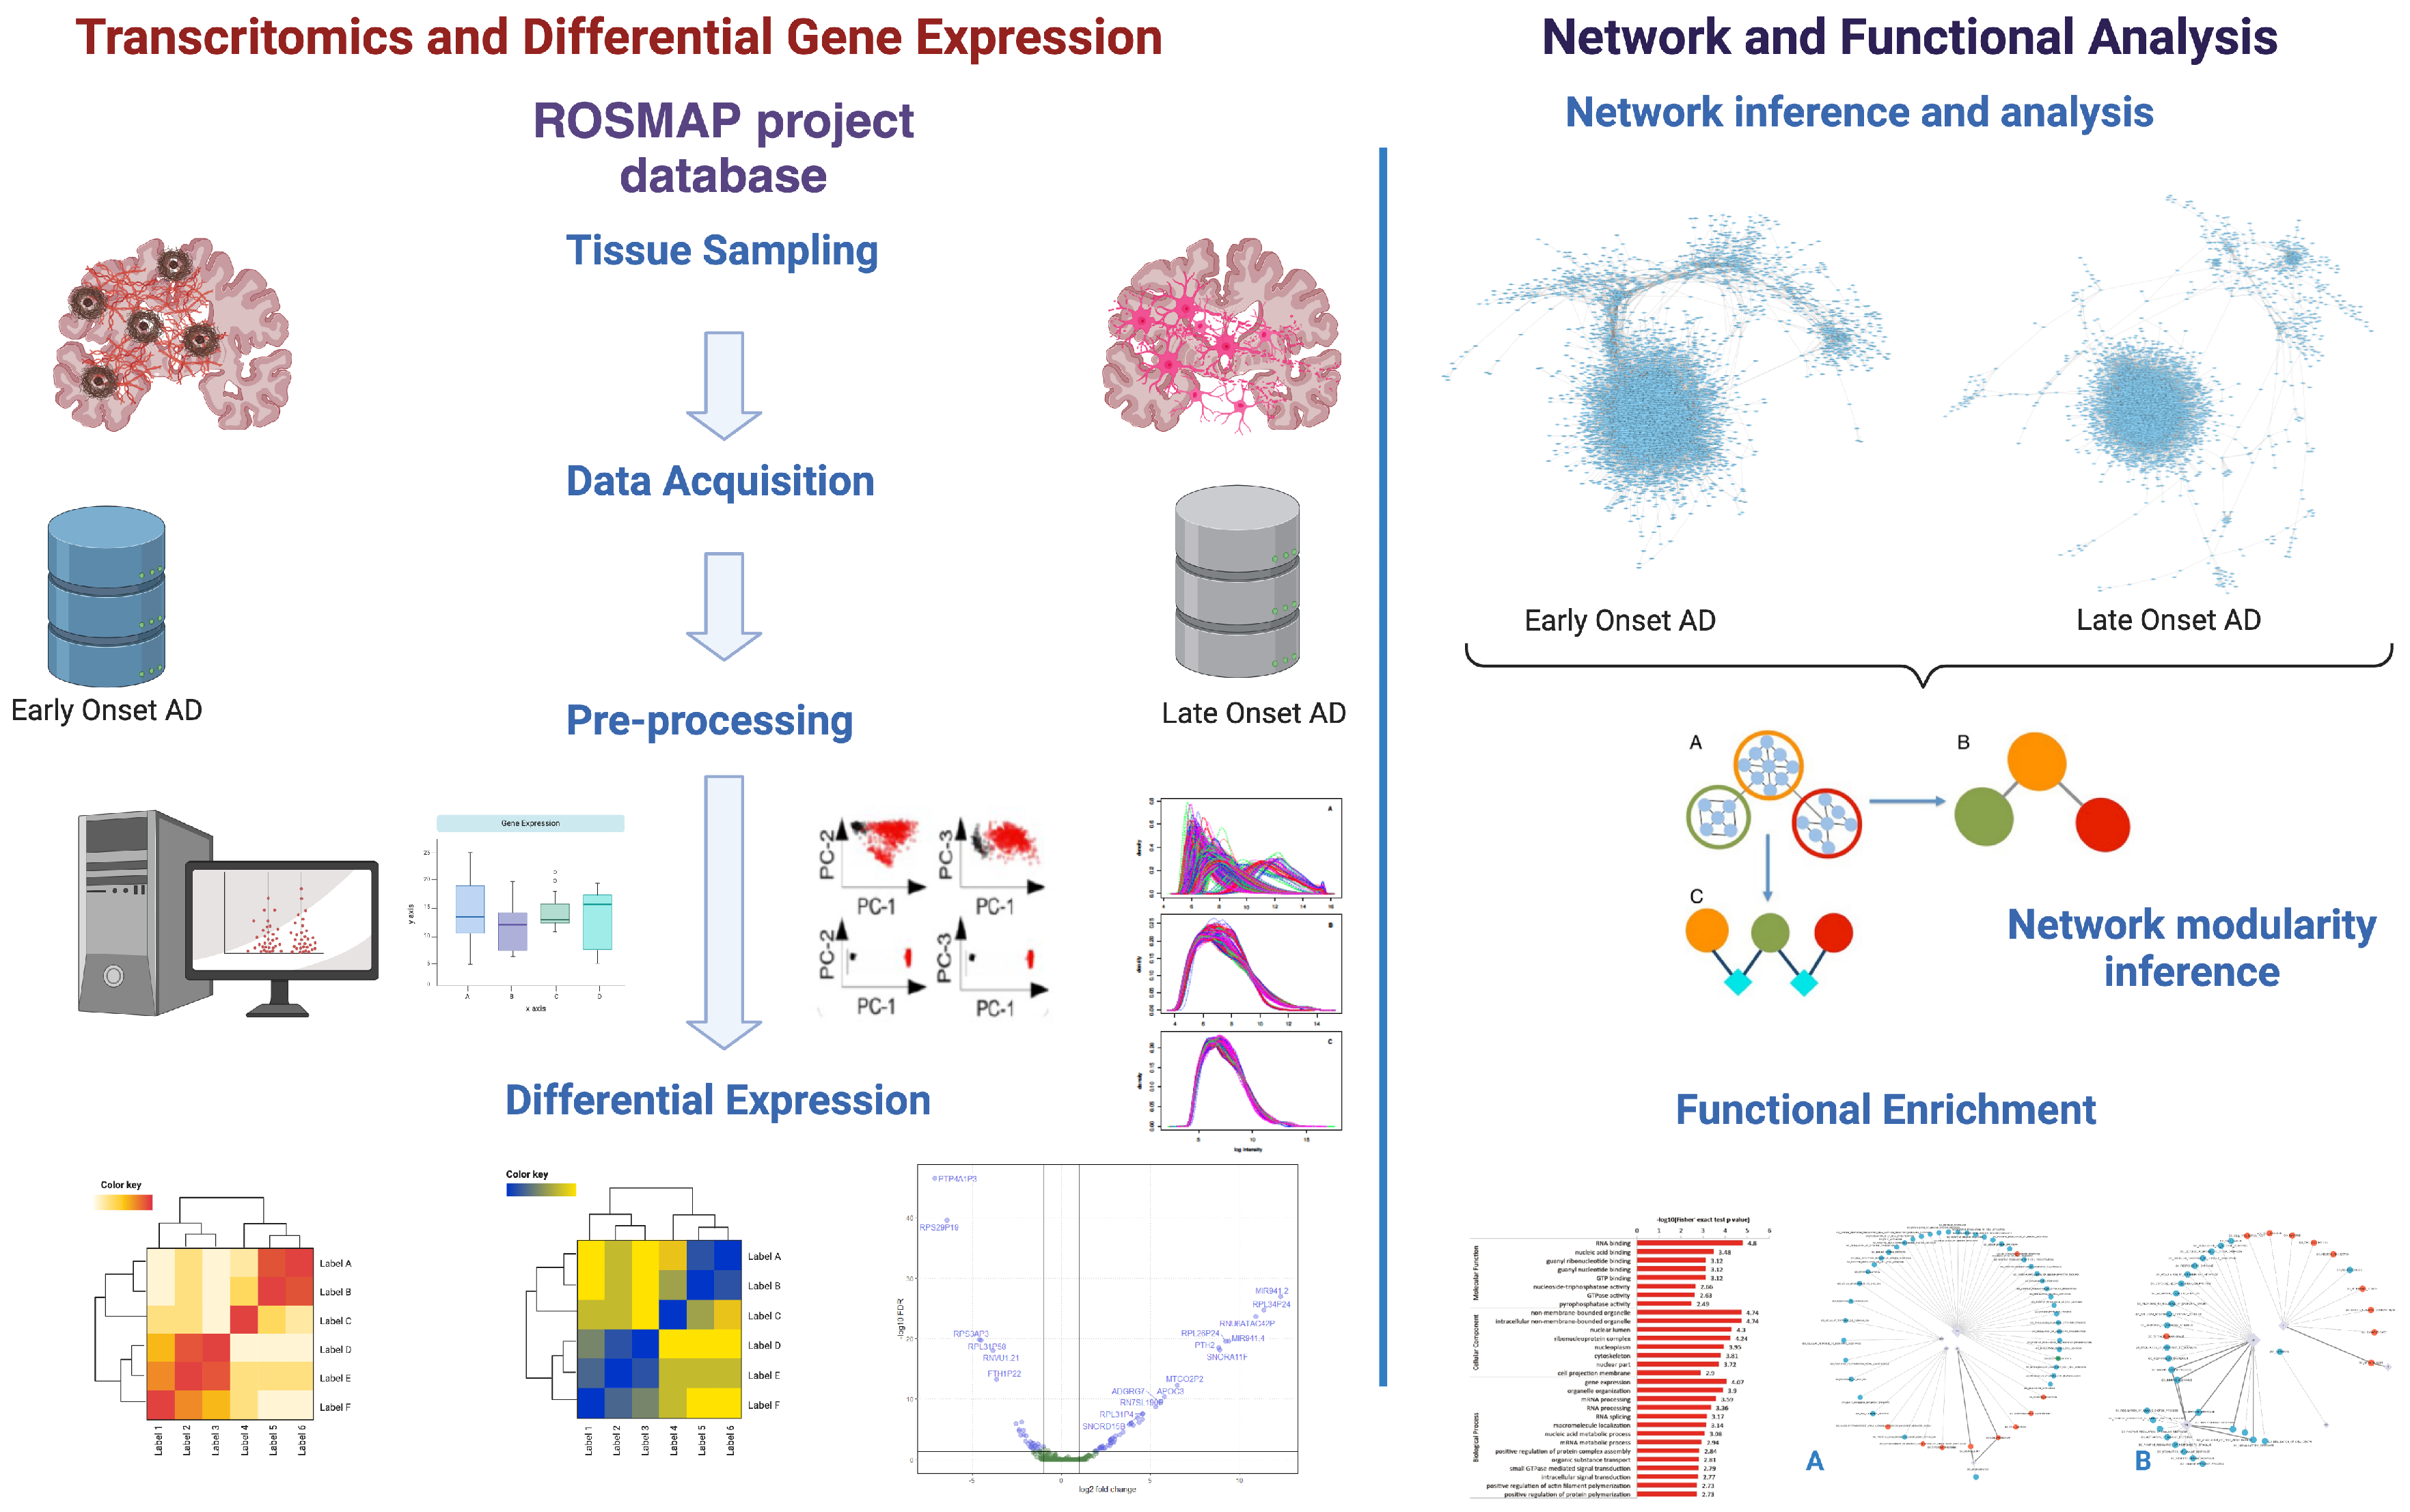
Figure 1.
Schematic representation of the workflow followed in this work (Created in BioRender.com).
Figure 1.
Schematic representation of the workflow followed in this work (Created in BioRender.com).
3. Results
Our findings reveal interactions between key Alzheimer’s disease risk factors. For instance, APOE alleles show age-dependent effects on disease progression, while cardiovascular biomarkers interact with genetic predisposition to influence molecular network dysregulation.
3.1. Differential Gene Expression and Pathway Enrichment Analysis
Differential Gene Expression Analysis (DGE) data were subjected to Pathway Enrichment Analysis (PEA), revealing two significantly perturbed pathways distinguishing the control and study groups. First, the oxidative phosphorylation pathway exhibited negative regulation of complex III and ATPase type V, indicating potential deregulation in metabolite transport and ATP production. Interestingly, the gene encoding ATPase type V displayed minimal interaction with other genes, suggesting a localized alteration within this pathway. Consistent with previous studies, regions affected metabolically displayed reduced neuronal density and increased neurofibrillary tangles [12].
Additionally, the pathway associated with cardiac muscle contraction exhibited significant dysregulation, particularly in genes involved in calcium ion regulation within cardiac muscle cells. Perturbations in these genes may lead to impaired systolic and diastolic processes, potentially contributing to heart failure. Notably, genes encoding Troponin C, calsequestrin 2, and actin demonstrated intermediate fold-change values and significant alterations, suggesting their potential influence on other biological processes.
While the relationship between dementias such as Alzheimer’s disease (AD) and cardiac pathology remains unclear, emerging evidence suggests a potential link, with -amyloid protein aggregation implicated in both conditions [13,14]. These findings underscore the multifaceted nature of AD pathogenesis and highlight the interconnectedness between neurodegenerative disorders and cardiovascular health.
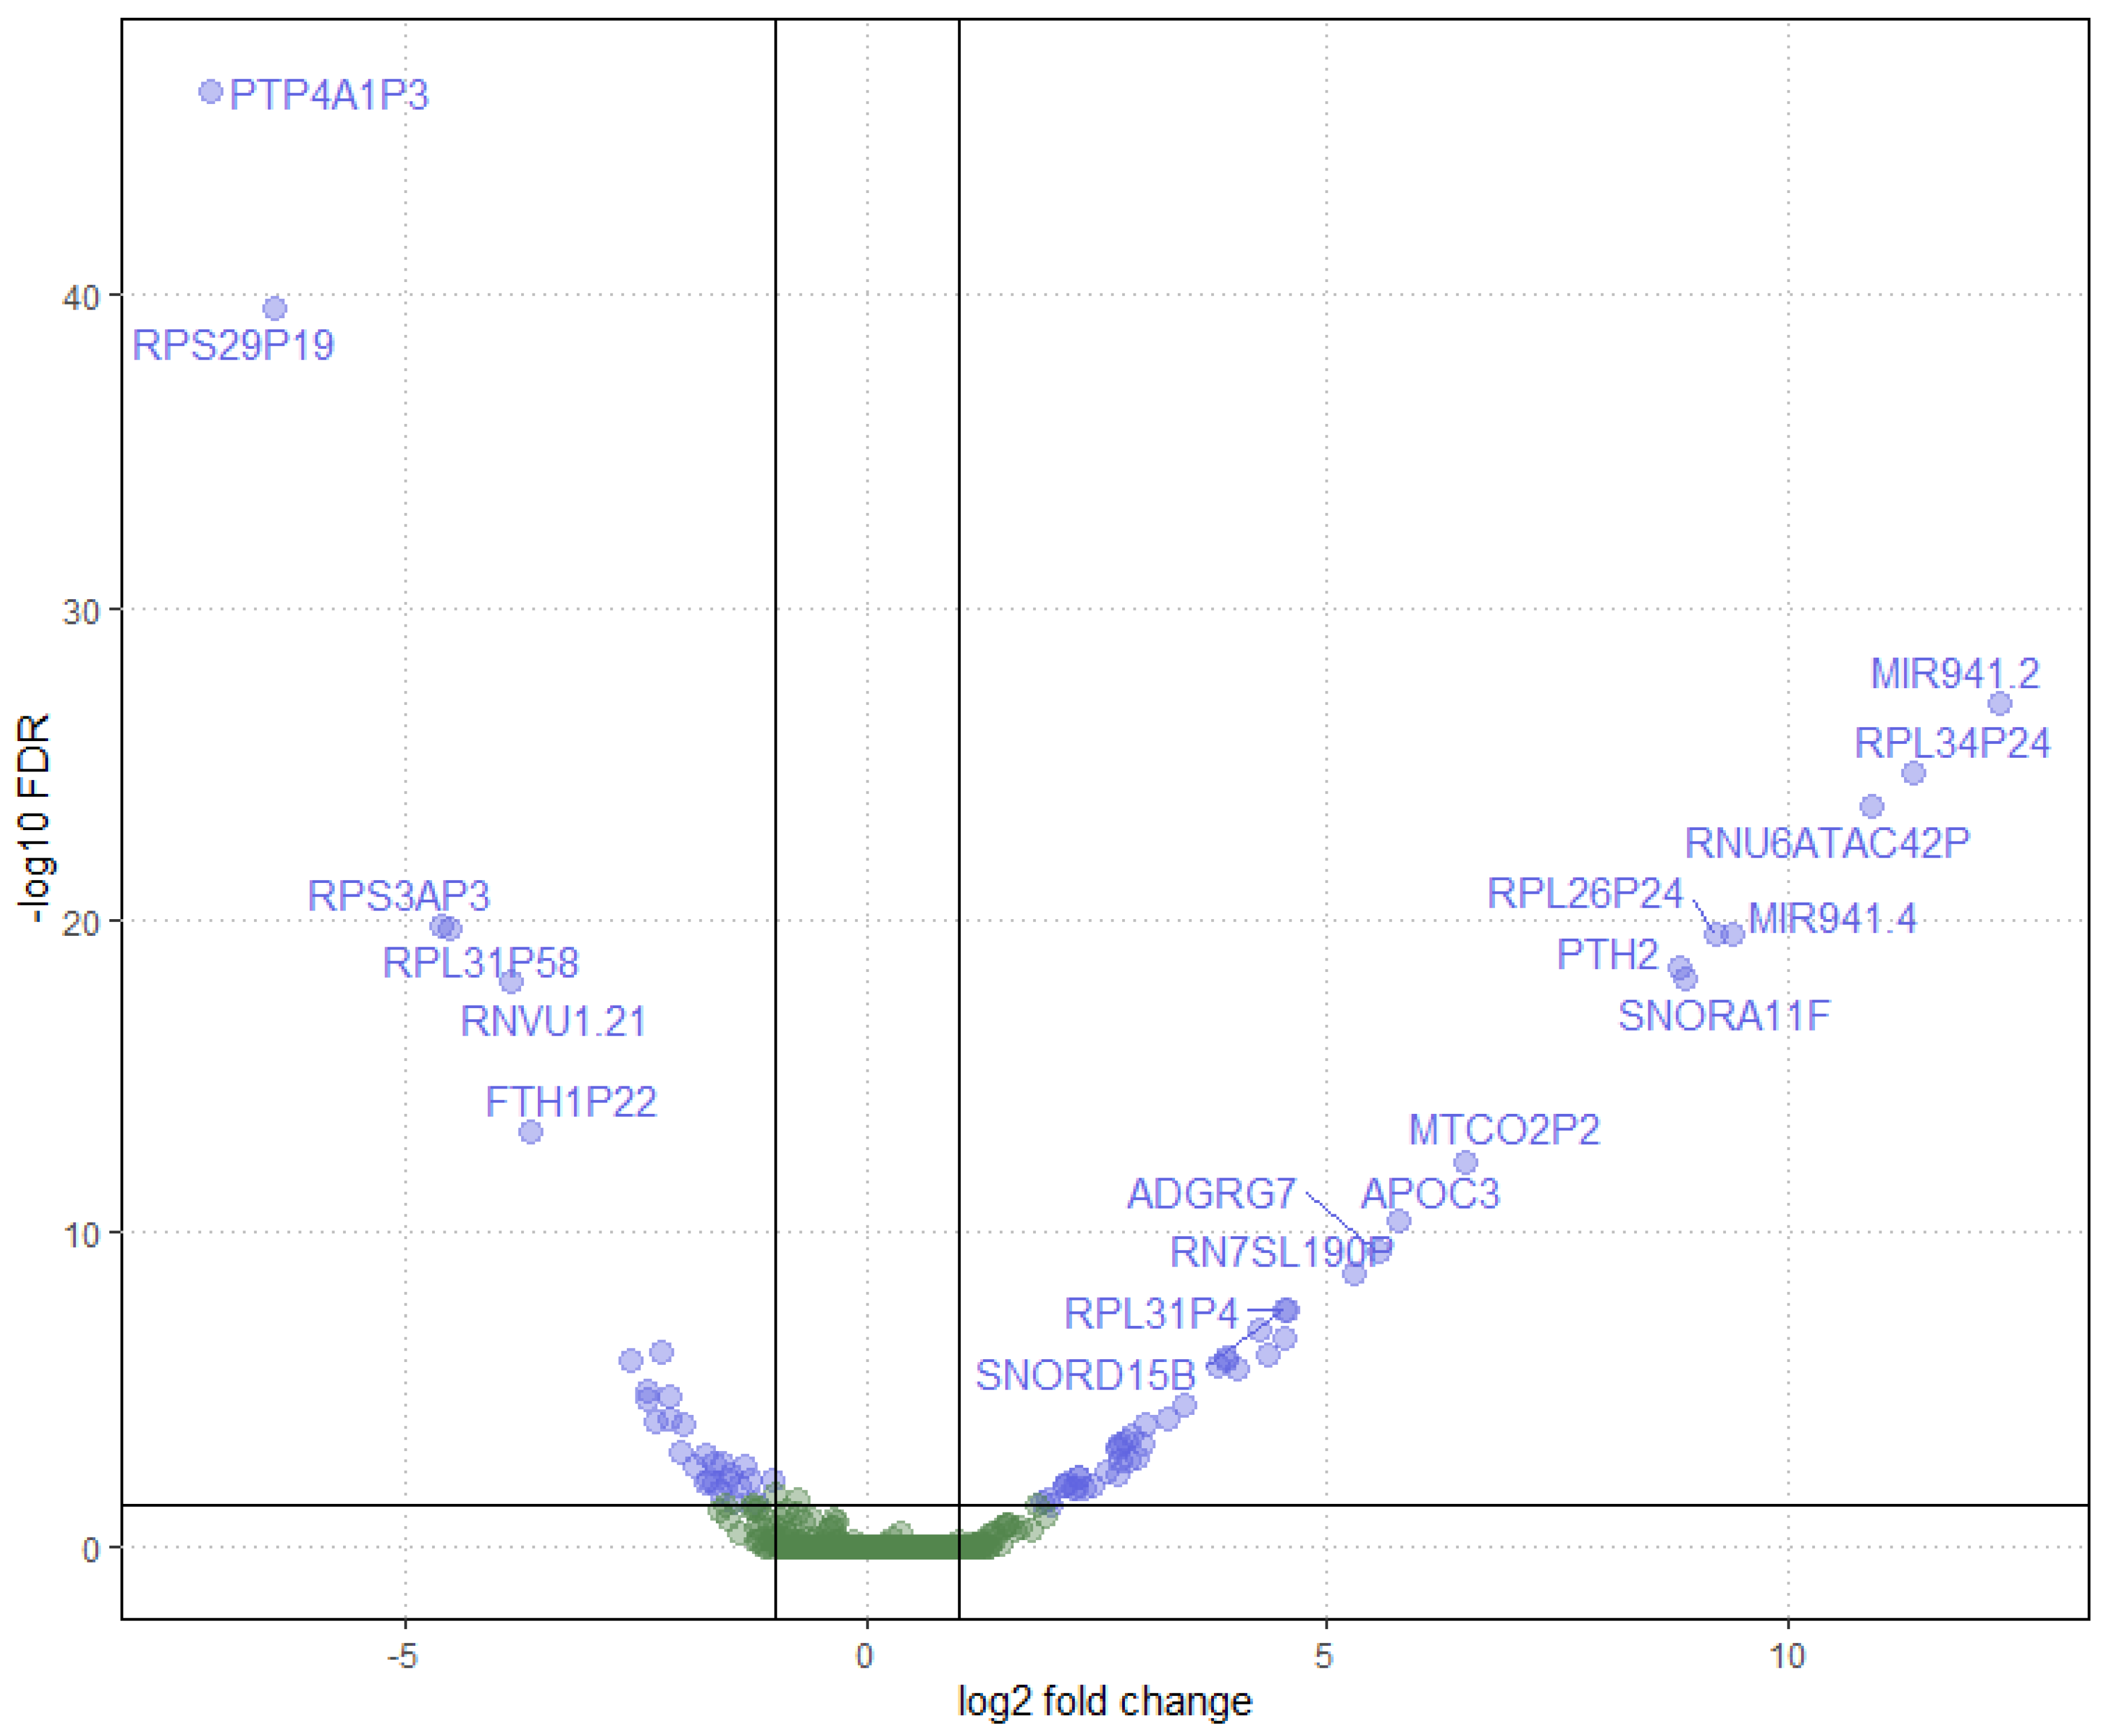
Figure 2.
Volcano plot representing differential gene expression between early-onset and late-onset Alzheimer’s disease phenotypes. Each point corresponds to a gene, with the log2 fold change on the x-axis and the negative logarithm (base 10) of the false discovery rate (FDR) on the y-axis. Genes upregulated are shown on the right, and downregulated genes are on the left. Points above the threshold line represent genes with significant changes in expression and potential biological relevance. Gene names are labeled for those with the highest level of significance and fold change.
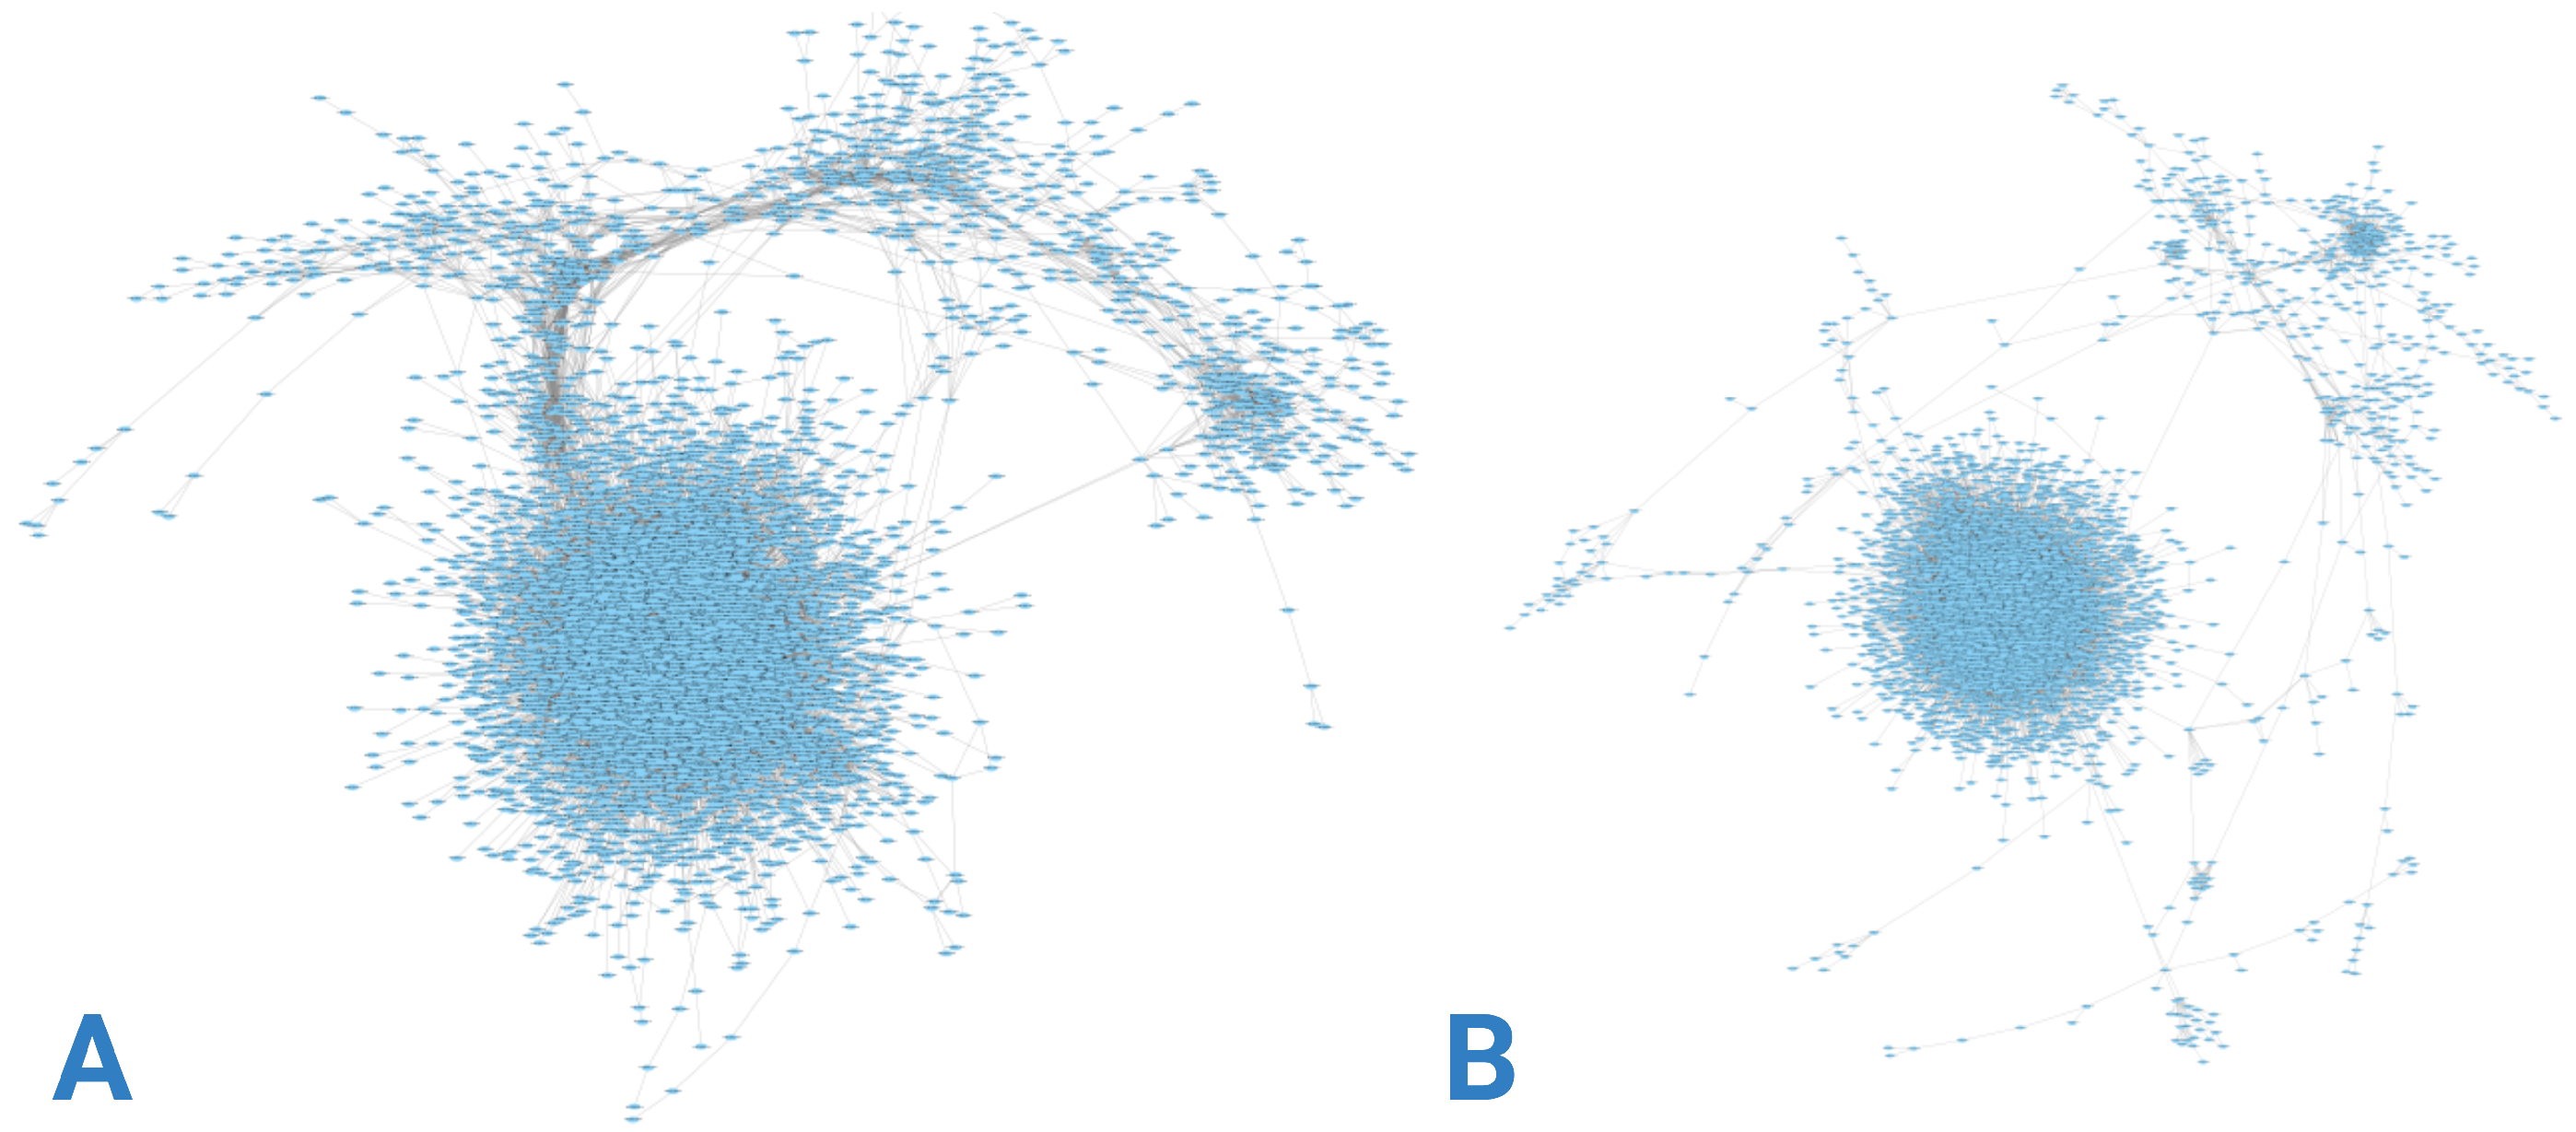
3.2. Gene Co-Expression Networks
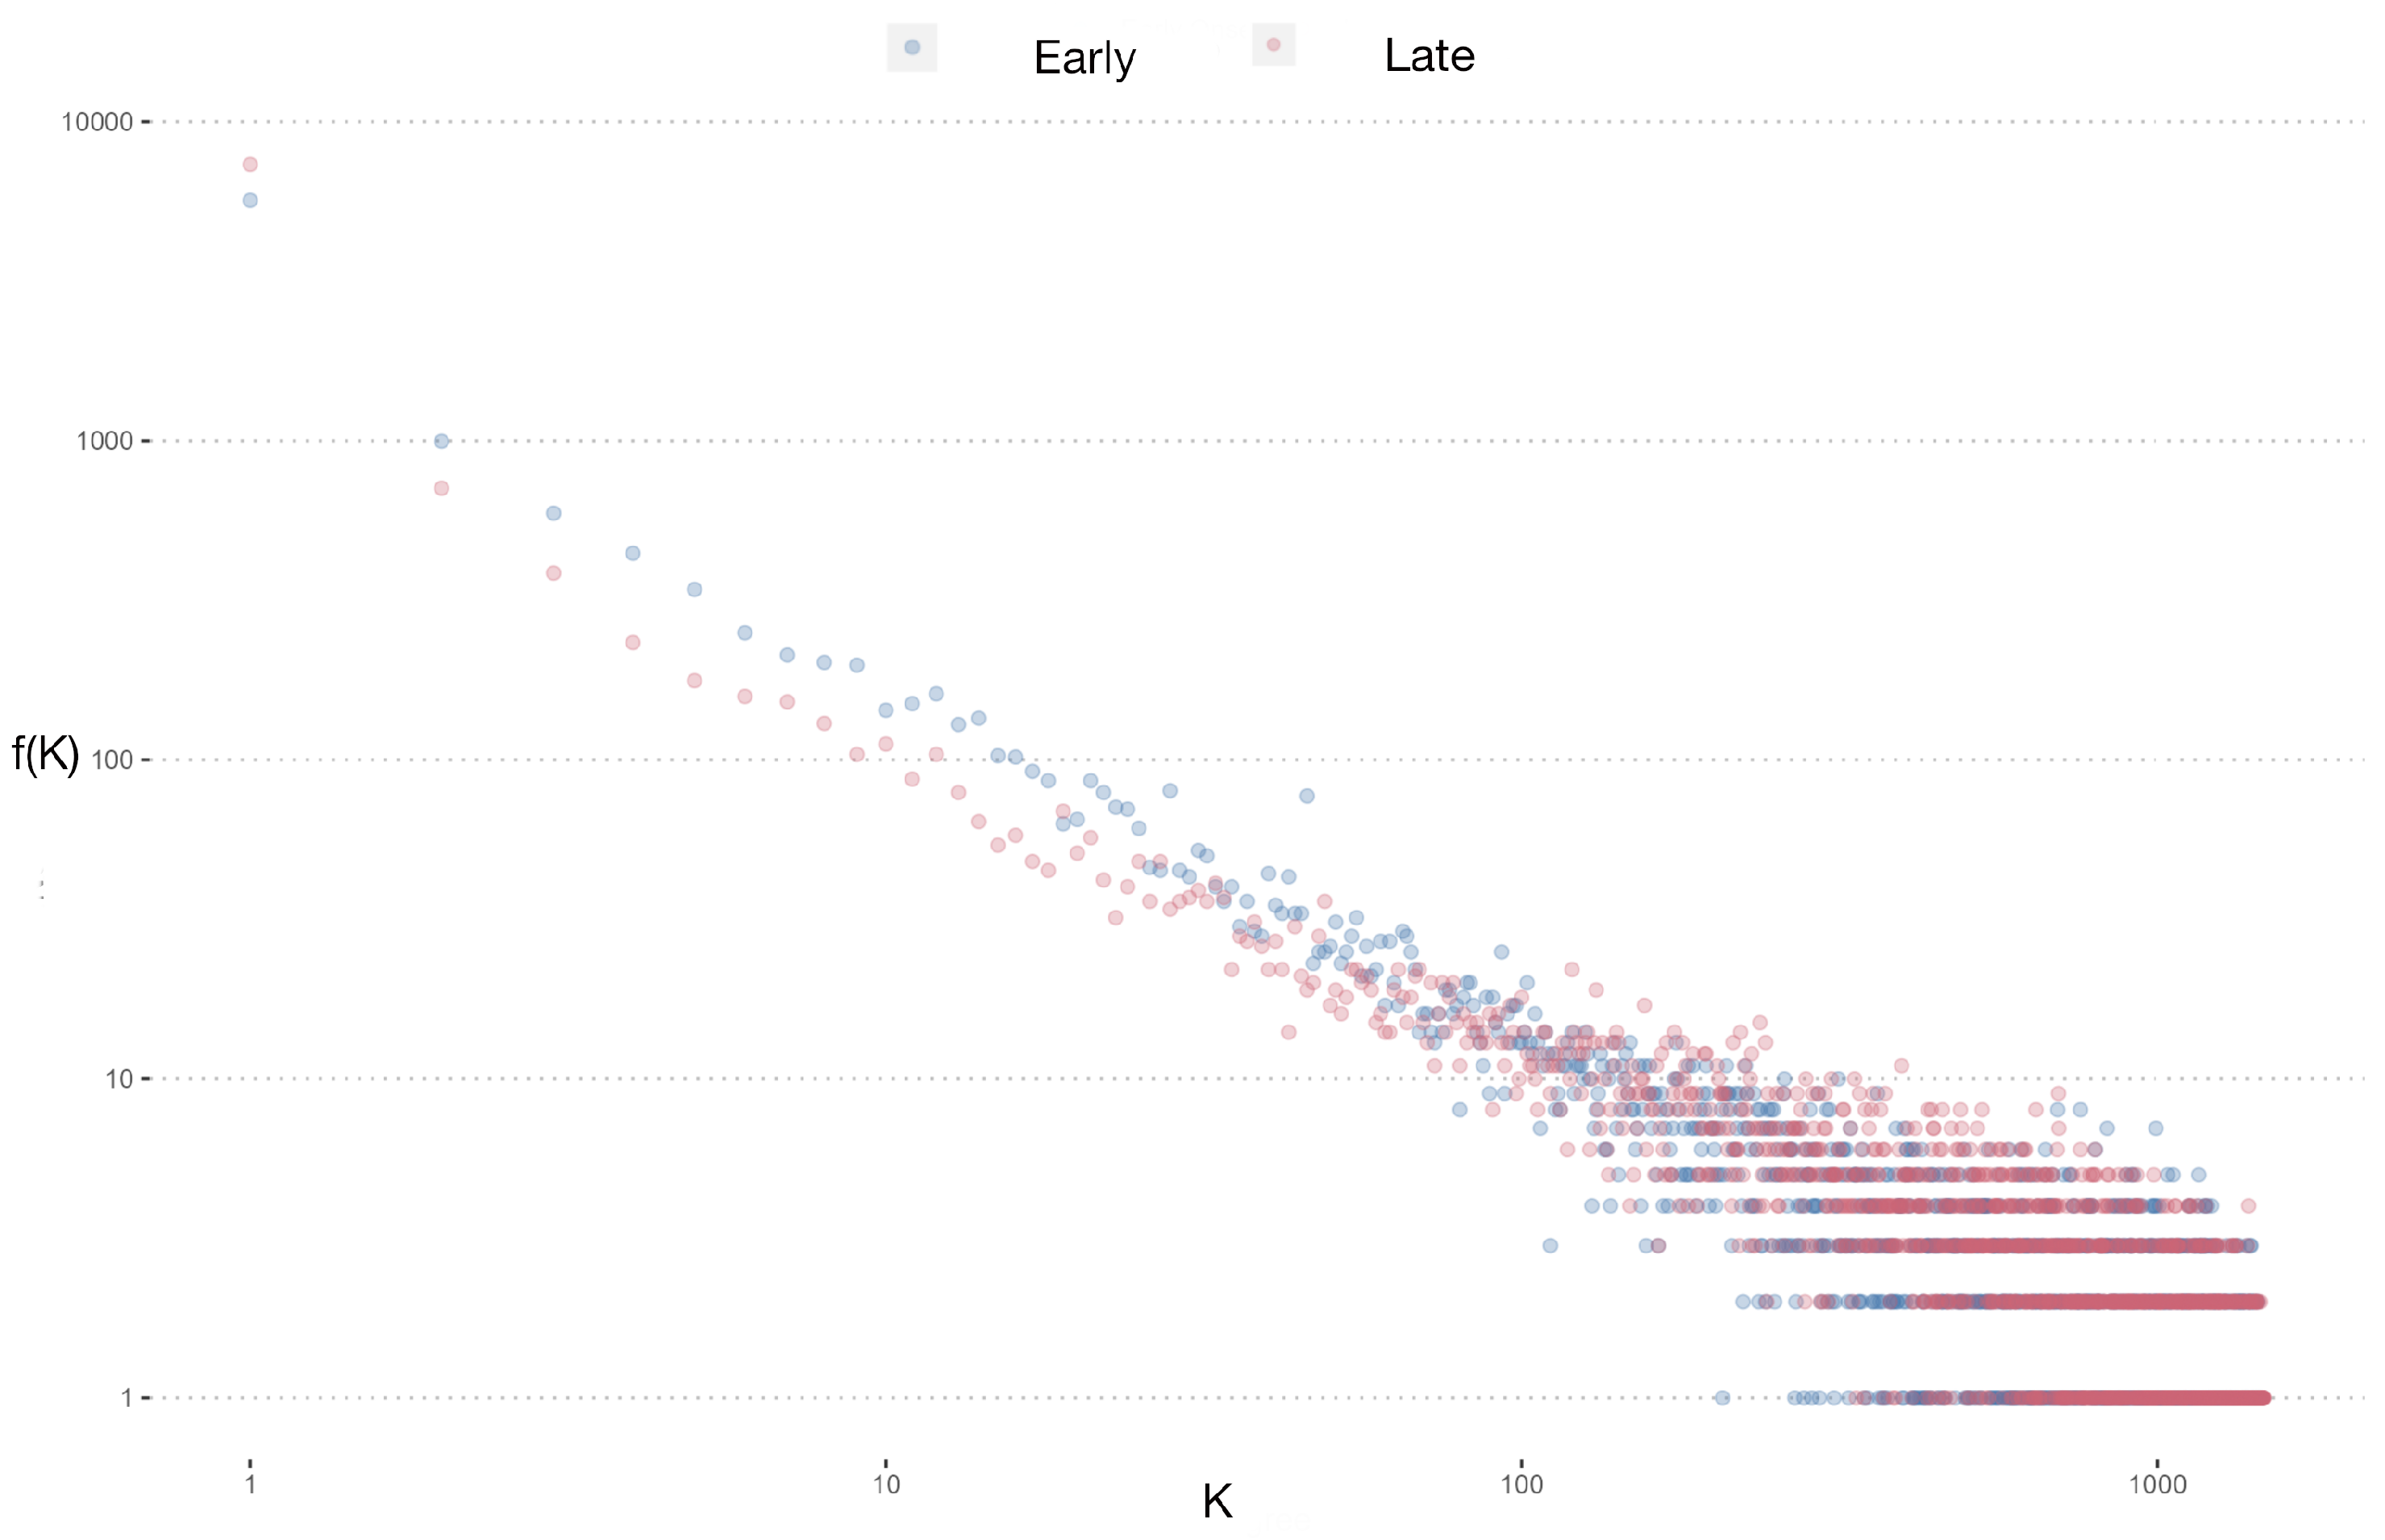
Gene co-expression networks were constructed using RNA-seq data from each group, as depicted in Figure 3. Figure 3A illustrates a network with higher gene density concentrated at specific nodes, contrasting with Figure 3B, where greater dispersion is evident. This disparity is further elucidated by examining the node-degree distributions presented in Figure 4. Although both networks exhibit similar degree value trends, the control group network displays a larger proportion of nodes with intermediate and low degree values.
Statistical analysis was conducted to assess differences in discrete distribution using and Cramer’s V testing, yielding significant results: = 9248727, p-value , and Cramer’s V . These findings underscore distinct distributions between the control and study groups, suggesting potential regulatory differences in gene expression networks associated with Alzheimer’s disease onset age.
3.3. Network Modularity and Functional Enrichment
In our study of Alzheimer’s disease, distinct differences in modular distribution were observed between the Early-Onset Alzheimer’s Disease (EOAD) and Late-Onset Alzheimer’s Disease (LOAD) networks. The EOAD network contained 541 modules, compared to only 263 in the LOAD network. Despite the notable difference in the number of modules, the size distribution of these modules remained consistent across both networks. Upon examining modules with at least one enrichment, it was observed that the most enriched modules were not necessarily the largest ones, indicating that module size does not directly correlate with the level of functional significance. For instance, in the control group network, smaller modules like Module 5, with 1216 genes, interact predominantly with cellular components and show significant interactions with the biological function neurogenesis, suggesting intricate biological roles that are not merely dependent on the number of genes.
When these modules were projected onto new networks, the node-degree distributions appeared similar, although the EOAD network exhibited a higher number of nodes at low and intermediate degree values, with the nodes having the highest degrees predominantly found in the control group. This observation underscores a complex interplay of gene regulation that might influence disease progression through varying network structures.
The functional enrichment analysis further complements this observation. Using Gene Ontology (GO) terms to characterize the biological functions of the modules revealed that the EOAD network was associated with 53 distinct GO terms, whereas the LOAD network featured 40. These functional associations, visualized in bipartite graphs, provided insights into the biological dynamics at play. Both networks showed that similar modules, such as Module 2, were linked to the ’neuron part’ GO term, displaying common functional characteristics that suggest shared biological processes across different stages of Alzheimer’s disease. Conversely, unique functional pathways were also evident; for instance, Module 24 in the LOAD network, and corresponding modules in the EOAD network, were linked to the ’defense response’ GO term, indicating distinct responses in disease progression.
Moreover, the rearrangement of modules like the neurogenesis module in the LOAD network suggests a significant reconfiguration of biological functions, which may contribute to the differing progression of Alzheimer’s disease between the two groups. Such differences, especially in how modules interact with cellular components and biological functions, highlight the importance of a nuanced approach to understanding Alzheimer’s disease through network modularity and functional enrichment.
This integrated analysis offers deeper insights into the complex biological mechanisms underlying the different stages of Alzheimer’s disease, underscoring the importance of understanding modular and functional variations in disease research. These findings not only enhance our understanding of Alzheimer’s disease mechanisms but also highlight potential targets for therapeutic intervention, demonstrating the value of network approaches in complex disease research.
Figure 5.
Panels (A) and (B) display the bipartite networks for early and late onset Alzheimer’s disease, respectively. Each network connects enriched modules, shown as numbered nodes, with their associated Gene Ontology (GO) functions, represented by nodes labeled with GO terms. Edges indicate significant enrichment associations between modules and functions. These networks visualize the unique patterns of functional enrichment linked to the biological processes involved in the early and late stages of Alzheimer’s disease.
4. Discussion
While this study focuses on computational analyses, we acknowledge the lack of experimental validation as a limitation. However, our findings provide a robust framework for hypothesis generation and prioritization, paving the way for future experimental studies.
In this work, we complement traditional bioinformatic pathways with network-based systems biology approaches to study the differences at the transcriptional level of early-onset and late-onset Alzheimer’s Disease. The application of network science to the study of Alzheimer’s disease offers a powerful framework for unraveling the complex molecular interactions that underpin the disease’s progression. By mapping the relationships and interactions among genes and their products, network approaches provide a holistic view of the cellular processes that are disrupted in Alzheimer’s disease. This systems biology perspective enables the identification of key regulatory nodes and modules that are critical in the onset and development of the disease, which may not be apparent through traditional reductionist approaches.
Several genes analyzed exhibited notable log2 fold-change values in the differential gene expression analysis, showcasing that expression patterns are distinct between Early-Onset Alzheimer’s Disease (EOAD) and Late-Onset Alzheimer’s Disease (LOAD). Specifically, pseudogenes related to ribosomes and certain microRNAs were identified as differentially expressed. The presence of differentially expressed pseudogenes, particularly in the LOAD group, suggests potential regulatory changes that could affect the progression and severity of the syndrome. These changes may involve modifications in gene translation that impact ribosomal stability and protein synthesis—processes fundamental to cellular proliferation and neurogenesis [15]. Furthermore, the presence of differentially expressed pseudogenes that interact with ribosomal components highlights the intricate regulatory mechanisms at play, which could lead to varied clinical manifestations of Alzheimer’s disease depending on the onset stage. This observation underscores the importance of reevaluating the functional capabilities of pseudogenes within the genomic landscape of neurodegenerative diseases.
In addition, the pathway associated with cardiac muscle contraction exhibited significant dysregulation, particularly in genes involved in calcium ion regulation within cardiac muscle cells. This finding may contribute to impaired systolic and diastolic processes, potentially leading to heart failure. Notably, genes encoding Troponin C, calsequestrin 2, and actin demonstrated significant alterations, suggesting their potential influence on other biological processes. Moreover, negative regulation of complex III and ATPase type V within the oxidative phosphorylation pathway suggests potential issues in metabolite transport and ATP production. The minimal interaction of the ATPase type V gene with other genes suggests a localized alteration within this pathway, as regions affected metabolically exhibited reduced neuronal density and increased neurofibrillary tangles [16]. Furthermore, it is well known that malfunctioning in Complex I is associated with neurodegenerative diseases, including Alzheimer’s disease [17]. The involvement of Complex II and III has also been reported, suggesting a broader impact on disease development [18,19].
Structural differences in the network topology further showcase differences between EOAD and LOAD phenotypes beyond individual gene expression levels. While some macroscale features such as component sizes generally agree, the connectivity of individual genes varies between phenotypes. The differences in node-degree distributions between the networks further suggest a reconfiguration of gene interactions, indicating that the biological significance of individual genes may shift considerably depending on the stage of Alzheimer’s disease.
The modular structures of the gene co-expression networks were obtained with the understanding that cellular functionality in biological systems can be fractioned into collections of modules, which are responsible for carrying out tasks with characteristics sufficient to differentiate one from another [20]. In the networks analyzed in this study, the biological entities that significantly enriched the modules were consistent, meaning that the entities each module was enriched with belong to a specific system or purpose. Regarding the modules belonging to the EOAD and LOAD groups, these are enriched with in GO terms related to cellular components of brain tissue and neurogenesis, they are the enriched modules that interact with a greater number of nodes in the modular structures. Furthermore, if the two modules from the control group and the two modules from the experimental group that interact with cellular components in terms of transcripts that compose them are compared, a similarity can be observed between modules 5 (EOAD) and 1 (LOAD) and modules 2 (EOAD) and 2 (LOAD).
However, there is a considerable proportion of transcripts that come from other sources, so different behaviors are expected between each Alzheimer’s variant. Considering the aforementioned factors, if there is any disturbance in these nodes, it is possible that it could have a broad repercussion on more communities with which it is interacting, in addition to the implications on the cellular components with which they were enriched. It is noteworthy that when comparing both bipartite networks, a rearrangement can be observed in how they interact with neurogenesis, which may be an indication of some difference for the progression of the disease in patients affected by the two variants under study.
In the control group network, interactions with cellular responses to metals and metabolic processes can also be seen in module 127. These mechanisms are not enriching any module of the LOAD network. Specifically, the absence of metabolism processes in the experimental group is an attractive idea, as a modification in the enrichment of the modules provides information about some disturbance in how these functions are regulated in both Alzheimer’s variants, supporting the previously mentioned results where an overactivation of ribosomes and oxidative phosphorylation were identified. As can be seen, the construction of networks provides more information about the microenvironment that may have caused the appearance of differentially expressed genes.
While at this stage this is a descriptive analysis and does not directly lead to actionable clinical insights, these integrated network approaches generate potential leads that can be further explored through in silico, in vitro, and in vivo testing. In our study, highlighting these differences between different manifestations of AD in terms of its temporal manifestation may be important in the context of precision medicine.
5. Conclusions
This study highlights the distinct biological differences between early-onset Alzheimer’s disease (EOAD) and late-onset Alzheimer’s disease (LOAD), underscoring the critical role that the age of onset plays in disease progression. Our analyses of differential gene expression, pathway enrichment, and gene co-expression networks reveal that EOAD and LOAD exhibit unique molecular profiles, which may influence the speed and nature of cognitive decline. Specifically, early-onset cases tend to show faster disease progression and greater disruption of gene networks associated with neurodegenerative processes. In contrast, late-onset cases appear more influenced by cumulative aging factors, including cardiovascular health and lifestyle, which may moderate the pace of decline.
These findings suggest that therapeutic strategies for AD may benefit from a more tailored approach, addressing the unique molecular and environmental drivers of EOAD and LOAD. By understanding the distinct pathways involved, targeted interventions can be developed to slow disease progression more effectively in both forms of the disease. Future research should continue to explore these differences and integrate additional factors, such as environmental exposures and comorbidities, to provide a more comprehensive picture of Alzheimer’s disease and its heterogeneous nature.
Author Contributions
Conceptualization— G.D.J., E.H.L.; methodology— G.D.J., E.H.L.; validation—A.I.G.C.; formal analysis—G.D.J., E.H.L.; investigation—A.I.G.C., G.D.J., E.H.L.; resources— G.D.J., E.H. L.; data curation—A.I.G.C.; writing—original draft preparation— A.I.G.C. writing—review and editing— G.D.J., E.H.L. All authors have read and agreed to the published version of the manuscript.
Funding
This work was supported by Intramural funds from the National Institute of Genomic Medicine. The funders had no role in study design, data collection and analysis, decision to publish, or preparation of the manuscript.
Conflicts of Interest
The authors declare that the research was conducted in the absence of any commercial or financial relationships that could be construed as a potential conflict of interest.
References
- Bennett, D.A.; Buchman, A.S.; Boyle, P.A.; Barnes, L.L.; Wilson, R.S.; Schneider, J.A. Religious Orders Study and Rush Memory and Aging Project. Journal of Alzheimer’s Disease 2018, 64, S161–S189. [Google Scholar] [CrossRef] [PubMed]
- Chen, Y.; Chen, L.; Lun, A.T.L.; Baldoni, P.L.; Smyth, G.K. edgeR 4.0: powerful differential analysis of sequencing data with expanded functionality and improved support for small counts and larger datasets. BioRxiv 2024. [Google Scholar] [CrossRef]
- Luo, W.; Friedman, M.S.; Shedden, K.; Hankenson, K.D.; Woolf, P.J. GAGE: generally applicable gene set enrichment for pathway analysis. BMC Bioinformatics 2009, 10. [Google Scholar] [CrossRef]
- Kanehisa, M. KEGG: Kyoto Encyclopedia of Genes and Genomes. Nucleic Acids Research 2000, 28, 27–30. [Google Scholar] [CrossRef] [PubMed]
- Meyer, P.E.; Lafitte, F.; Bontempi, G. minet: A R/Bioconductor Package for Inferring Large Transcriptional Networks Using Mutual Information. BMC Bioinformatics 2008, 9. [Google Scholar] [CrossRef] [PubMed]
- Csárdi, G.; Nepusz, T.; Traag, V.; Horvát, S.; Zanini, F.; Noom, D.; Müller, K. igraph: Network Analysis and Visualization in R, 2024. R package version 2.0.3. [CrossRef]
- Shannon, P.; Markiel, A.; Ozier, O.; Baliga, N.S.; Wang, J.T.; Ramage, D.; Amin, N.; Schwikowski, B.; Ideker, T. Cytoscape: A Software Environment for Integrated Models of Biomolecular Interaction Networks. Genome Research 2003, 13, 2498–2504. [Google Scholar] [CrossRef] [PubMed]
- Edler, D.; Holmgren, A.; Rosvall, M. The MapEquation software package. https://mapequation.org, 2024.
- Lancichinetti, A.; Fortunato, S.; Radicchi, F. Benchmark graphs for testing community detection algorithms. Physical Review E 2008, 78. [Google Scholar] [CrossRef] [PubMed]
- Ashburner, M.; Ball, C.A.; Blake, J.A.; Botstein, D.; Butler, H.; Cherry, J.M.; Davis, A.P.; Dolinski, K.; Dwight, S.S.; Eppig, J.T.; Harris, M.A.; Hill, D.P.; Issel-Tarver, L.; Kasarskis, A.; Lewis, S.; Matese, J.C.; Richardson, J.E.; Ringwald, M.; Rubin, G.M.; Sherlock, G. Gene Ontology: tool for the unification of biology. Nature Genetics 2000, 25, 25–29. [Google Scholar] [CrossRef] [PubMed]
- Wang, X.; Terfve, C.; Rose, J.C.; Markowetz, F. HTSanalyzeR: an R/Bioconductor package for integrated network analysis of high-throughput screens. Bioinformatics 2011, 27, 879–880. [Google Scholar] [CrossRef] [PubMed]
- Furcila, D.; Domínguez-Álvaro, M.; DeFelipe, J.; Alonso-Nanclares, L. Subregional Density of Neurons, Neurofibrillary Tangles and Amyloid Plaques in the Hippocampus of Patients With Alzheimer’s Disease. Frontiers in Neuroanatomy 2019, 13. [Google Scholar] [CrossRef]
- Johansen, M.C.; Wang, W.; Zhang, M.; Knopman, D.S.; Ndumele, C.; Mosley, T.H.; Selvin, E.; Shah, A.M.; Solomon, S.D.; Gottesman, R.F.; Chen, L.Y. Risk of Dementia Associated With Atrial Cardiopathy: The ARIC Study. Journal of the American Heart Association 2022, 11. [Google Scholar] [CrossRef] [PubMed]
- Troncone, L.; Luciani, M.; Coggins, M.; Wilker, E.H.; Ho, C.Y.; Codispoti, K.E.; Frosch, M.P.; Kayed, R.; del Monte, F. Aβ Amyloid Pathology Affects the Hearts of Patients With Alzheimer’s Disease. Journal of the American College of Cardiology 2016, 68, 2395–2407. [Google Scholar] [CrossRef] [PubMed]
- Wool, I.G. Extraribosomal functions of ribosomal proteins. Trends in Biochemical Sciences 1996, 21, 164–165. [Google Scholar] [CrossRef] [PubMed]
- Mastroeni, D.; Khdour, O.M.; Delvaux, E.; Nolz, J.; Olsen, G.; Berchtold, N.; Cotman, C.; Hecht, S.M.; Coleman, P.D. Nuclear but not mitochondrial-encoded oxidative phosphorylation genes are altered in aging, mild cognitive impairment, and Alzheimer’s disease. Alzheimer’s & Dementia 2016, 13, 510–519. [Google Scholar] [CrossRef] [PubMed]
- Ohnishi, T.; Ohnishi, S.T.; Salerno, J.C. Five decades of research on mitochondrial NADH-quinone oxidoreductase (complex I). Biological Chemistry 2018, 399, 1249–1264. [Google Scholar] [CrossRef] [PubMed]
- Barrera, G.; Gentile, F.; Pizzimenti, S.; Canuto, R.; Daga, M.; Arcaro, A.; Cetrangolo, G.; Lepore, A.; Ferretti, C.; Dianzani, C.; Muzio, G. Mitochondrial Dysfunction in Cancer and Neurodegenerative Diseases: Spotlight on Fatty Acid Oxidation and Lipoperoxidation Products. Antioxidants 2016, 5, 7. [Google Scholar] [CrossRef] [PubMed]
- Jodeiri Farshbaf, M.; Kiani-Esfahani, A. Succinate dehydrogenase: Prospect for neurodegenerative diseases. Mitochondrion 2018, 42, 77–83. [Google Scholar] [CrossRef] [PubMed]
- Ravasz, E.; Somera, A.L.; Mongru, D.A.; Oltvai, Z.N.; Barabási, A.L. Hierarchical Organization of Modularity in Metabolic Networks. Science 2002, 297, 1551–1555. [Google Scholar] [CrossRef] [PubMed]
Figure 3.
Gene co-expression networks. Nodes represent genes, and edges represent co-expression (measured as significant statistical dependency through mutual information). Panel A presents the network corresponding to early onset AD. Panel B presents the network corresponding to late onset AD.
Figure 3.
Gene co-expression networks. Nodes represent genes, and edges represent co-expression (measured as significant statistical dependency through mutual information). Panel A presents the network corresponding to early onset AD. Panel B presents the network corresponding to late onset AD.
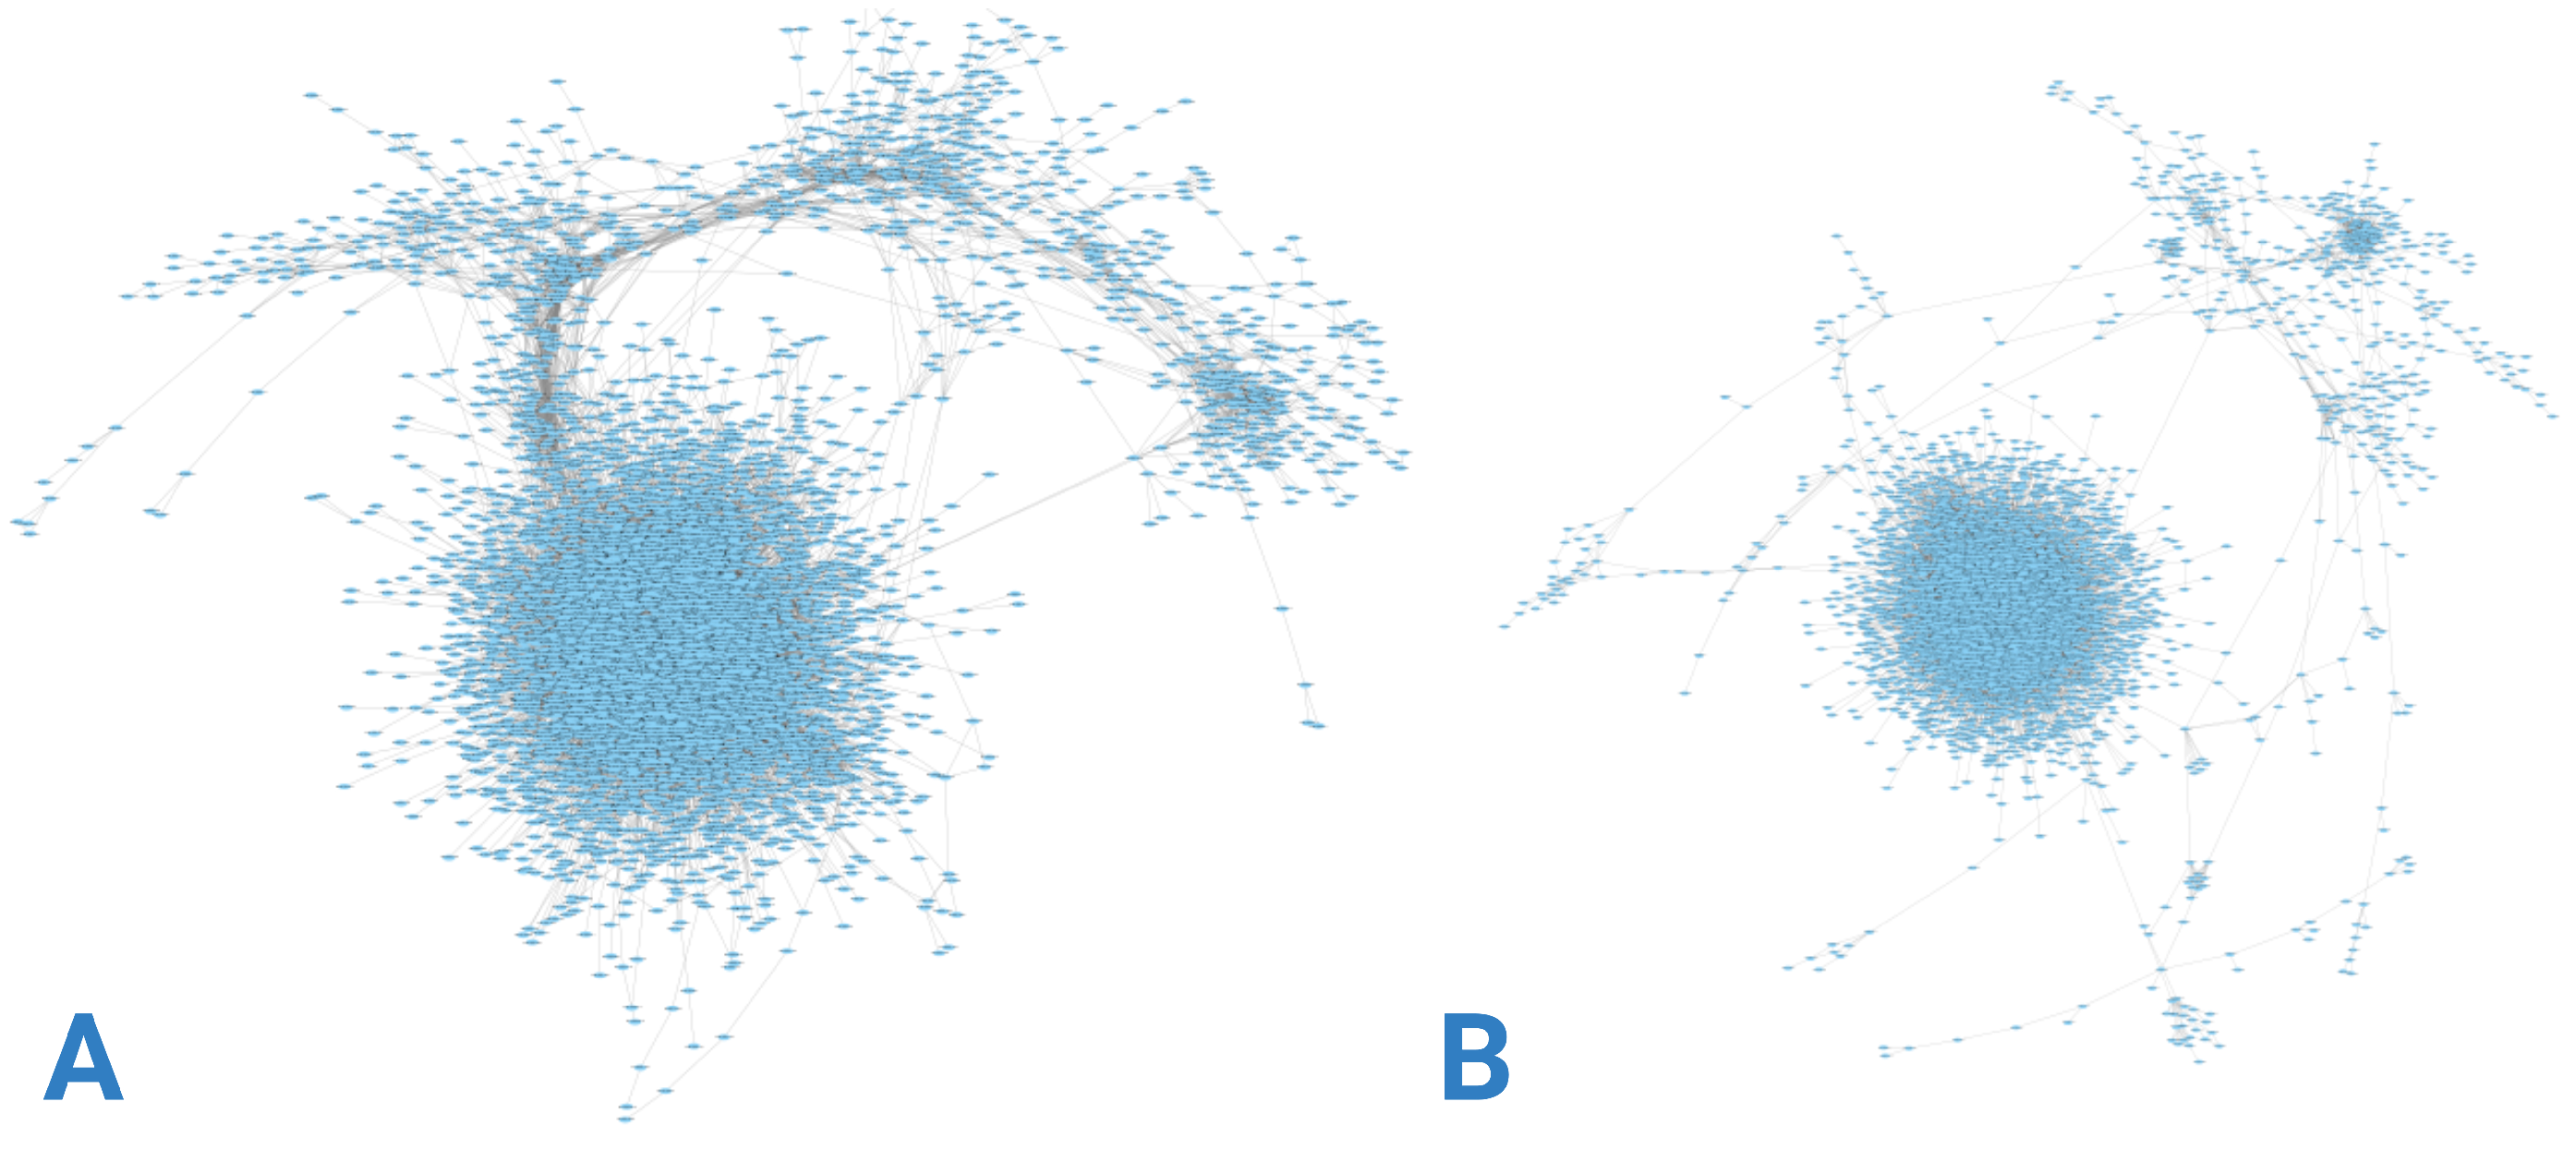
Figure 4.
The degree distributions for both networks are illustrated with color-coded nodes: blue dots for early-onset Alzheimer’s disease and red dots for late-onset Alzheimer’s disease. This visualization not only highlights the distinct connectivity patterns unique to each disease stage but also draws attention to the similarities in node density at low and intermediate degrees of connectivity.
Disclaimer/Publisher’s Note: The statements, opinions and data contained in all publications are solely those of the individual author(s) and contributor(s) and not of MDPI and/or the editor(s). MDPI and/or the editor(s) disclaim responsibility for any injury to people or property resulting from any ideas, methods, instructions or products referred to in the content. |
© 2024 by the authors. Licensee MDPI, Basel, Switzerland. This article is an open access article distributed under the terms and conditions of the Creative Commons Attribution (CC BY) license (http://creativecommons.org/licenses/by/4.0/).
Copyright: This open access article is published under a Creative Commons CC BY 4.0 license, which permit the free download, distribution, and reuse, provided that the author and preprint are cited in any reuse.


