
Submitted:
10 November 2025
Posted:
12 November 2025
You are already at the latest version
Abstract
The aim of the study was to analyse the impact of carbonaceous and mineral contami-nants present in mineral oils on the tribological wear of the 42CrMo-4 steel under mixed friction conditions. A range of advanced analytical techniques was employed, including polarised light optical microscopy, SEM, XRF, EDS, XRD, as well as Raman spectroscopy and profilometry. Wear tests were conducted using a roller-on-roller tribological test rig to evaluate changes in surface topography and the extent of surface damage. The results showed no clear functional correlation between the mass loss of the samples and the con-tent of non-combustible fractions in the carbonaceous contaminants. The most favourable tribological performance was observed for the abrasive variant with low ash content and high elemental carbon content. In this case, a thin graphite-like carbon layer formed on the surface, significantly improving lubrication, reducing friction, limiting surface spalling, and reducing damage depth (to approx. 10 µm). In other variants, despite the formation of compressed carbon–mineral layers, the higher content of hard mineral particles reduced their durability and led to increased wear. Local temperature and particle size were found to significantly influence wear intensity – smaller particles contributed to lower flash temperatures and reduced surface damage. The variant with pure oil, lacking any abra-sive additives, showed no protective effects, resulting in intense microscratching and sur-face spalling due to direct asperity contact.
Keywords:
wear
; coal
; claystone
; tribology
; wear-resistant steels
1. Introduction
Over the course of operation of machines and equipment, lubrication conditions may change due to the impact of the working environment, e.g. by way of a change in instantaneous load or operating temperature. Changes in operating conditions may also be continuous in nature on account of the time-dependent degradation of oil properties. The effects of oil degradation may include: colour change, increased acid number, formation of deposits and lakes, increased content of solid particles (solid contaminants), water ingress into oil, viscosity change, etc. [1,2,3,4,5].
Lubrication of friction nodes in driven machines [6,7,8,9] with contaminated oil typically renders them non-operational prematurely. Impure oil usually contains particles such as mineral grains, metal swarf, or water. The aforementioned contaminants can damage machine components, especially their drive units, leading to progressive wear and even failure. Such components include gear wheels, bearings, and seals, in particular. As for abrasives containing very hard grains, damage occurs as a consequence of micro-scratching or micro-ridging. The effects of such wear processes will depend significantly on the size, type, and hardness of the oil contaminating particles. The adverse effect of hard mineral abrasives on the wear of machine components is well known and extensively described in the literature on the subject [10,11,12,13,14]. Contaminated oil can also deteriorate in terms of its capacity to lubricate parts properly, resulting in excessive friction, overheating, and reduced performance. In many industries, degradation processes caused by lubrication with contaminated oil are counteracted by filtering [15,16,17,18,19], and fresh oil is added or replaced, yet in many cases this is still insufficient.
The potential effects of the presence of solid contaminants in lubricating oil depend on momentary lubrication conditions at friction nodes [1,20,21,22,23,24,25]. The key parameter determining the lubrication conditions is relative oil film thickness λ, defined by the following relationship [26,27,28]:
where:
hmin – the minimum lubricant film thickness,
Rq1,2 – the root mean square surface finish of contacting bodies respectively.
The λ parameter also determines the type of friction occurring between mating surfaces. Lubrication conditions, and so the friction type as well, can be determined based on the λ parameter [21,23,26,27,29] given by formula (1). Within the range of λ=(0.1), boundary friction is to be expected. In the range of relative oil film thickness of λ=(1.3), mixed friction is the dominant type, while the lubrication conditions which develop within the range of λ=<3.10> are characterised by the formation of an oil film with a thickness exceeding that of surface irregularities. Above the relative oil film thickness value of λ>10, hydrodynamic fluid friction occurs. The fact that damage occurs on the surface depends on the relationship between the minimum oil film thickness and the size of the oil contaminating particles. According to Moon [30], there are three cases (Figure 1) of such relationships:
- a)
- the abrasive grain is smaller than the oil film thickness and passes through the mating area without contact,
- b)
- the abrasive grain is larger than the oil film thickness and stops before the mating area,
- c)
- the abrasive grain is comparable in size to the oil film thickness.
The third case corresponds to a situation where functional surfaces (e.g. bearing races or gear teeth) are subject to abrasive wear. Particles sized similarly to the oil film thickness can penetrate into the contact area where the film thickness is minimal. The load affecting a given surface is transferred to these particles, which become pressed against the mating surface and exert a cutting action. This causes surface degradation, dimensional changes, and the formation of wear products.
The research conducted by Watanabe et al. [31] has confirmed the relationship between oil film thickness, particle size, and the rate of wear of mating surfaces. What the authors found was that the rate of wear depended largely on the film thickness to particle size ratio. The maximum wear rate was observed when this ratio equalled one, meaning that lesser wear occurred when particles were both larger and smaller than the oil film thickness.
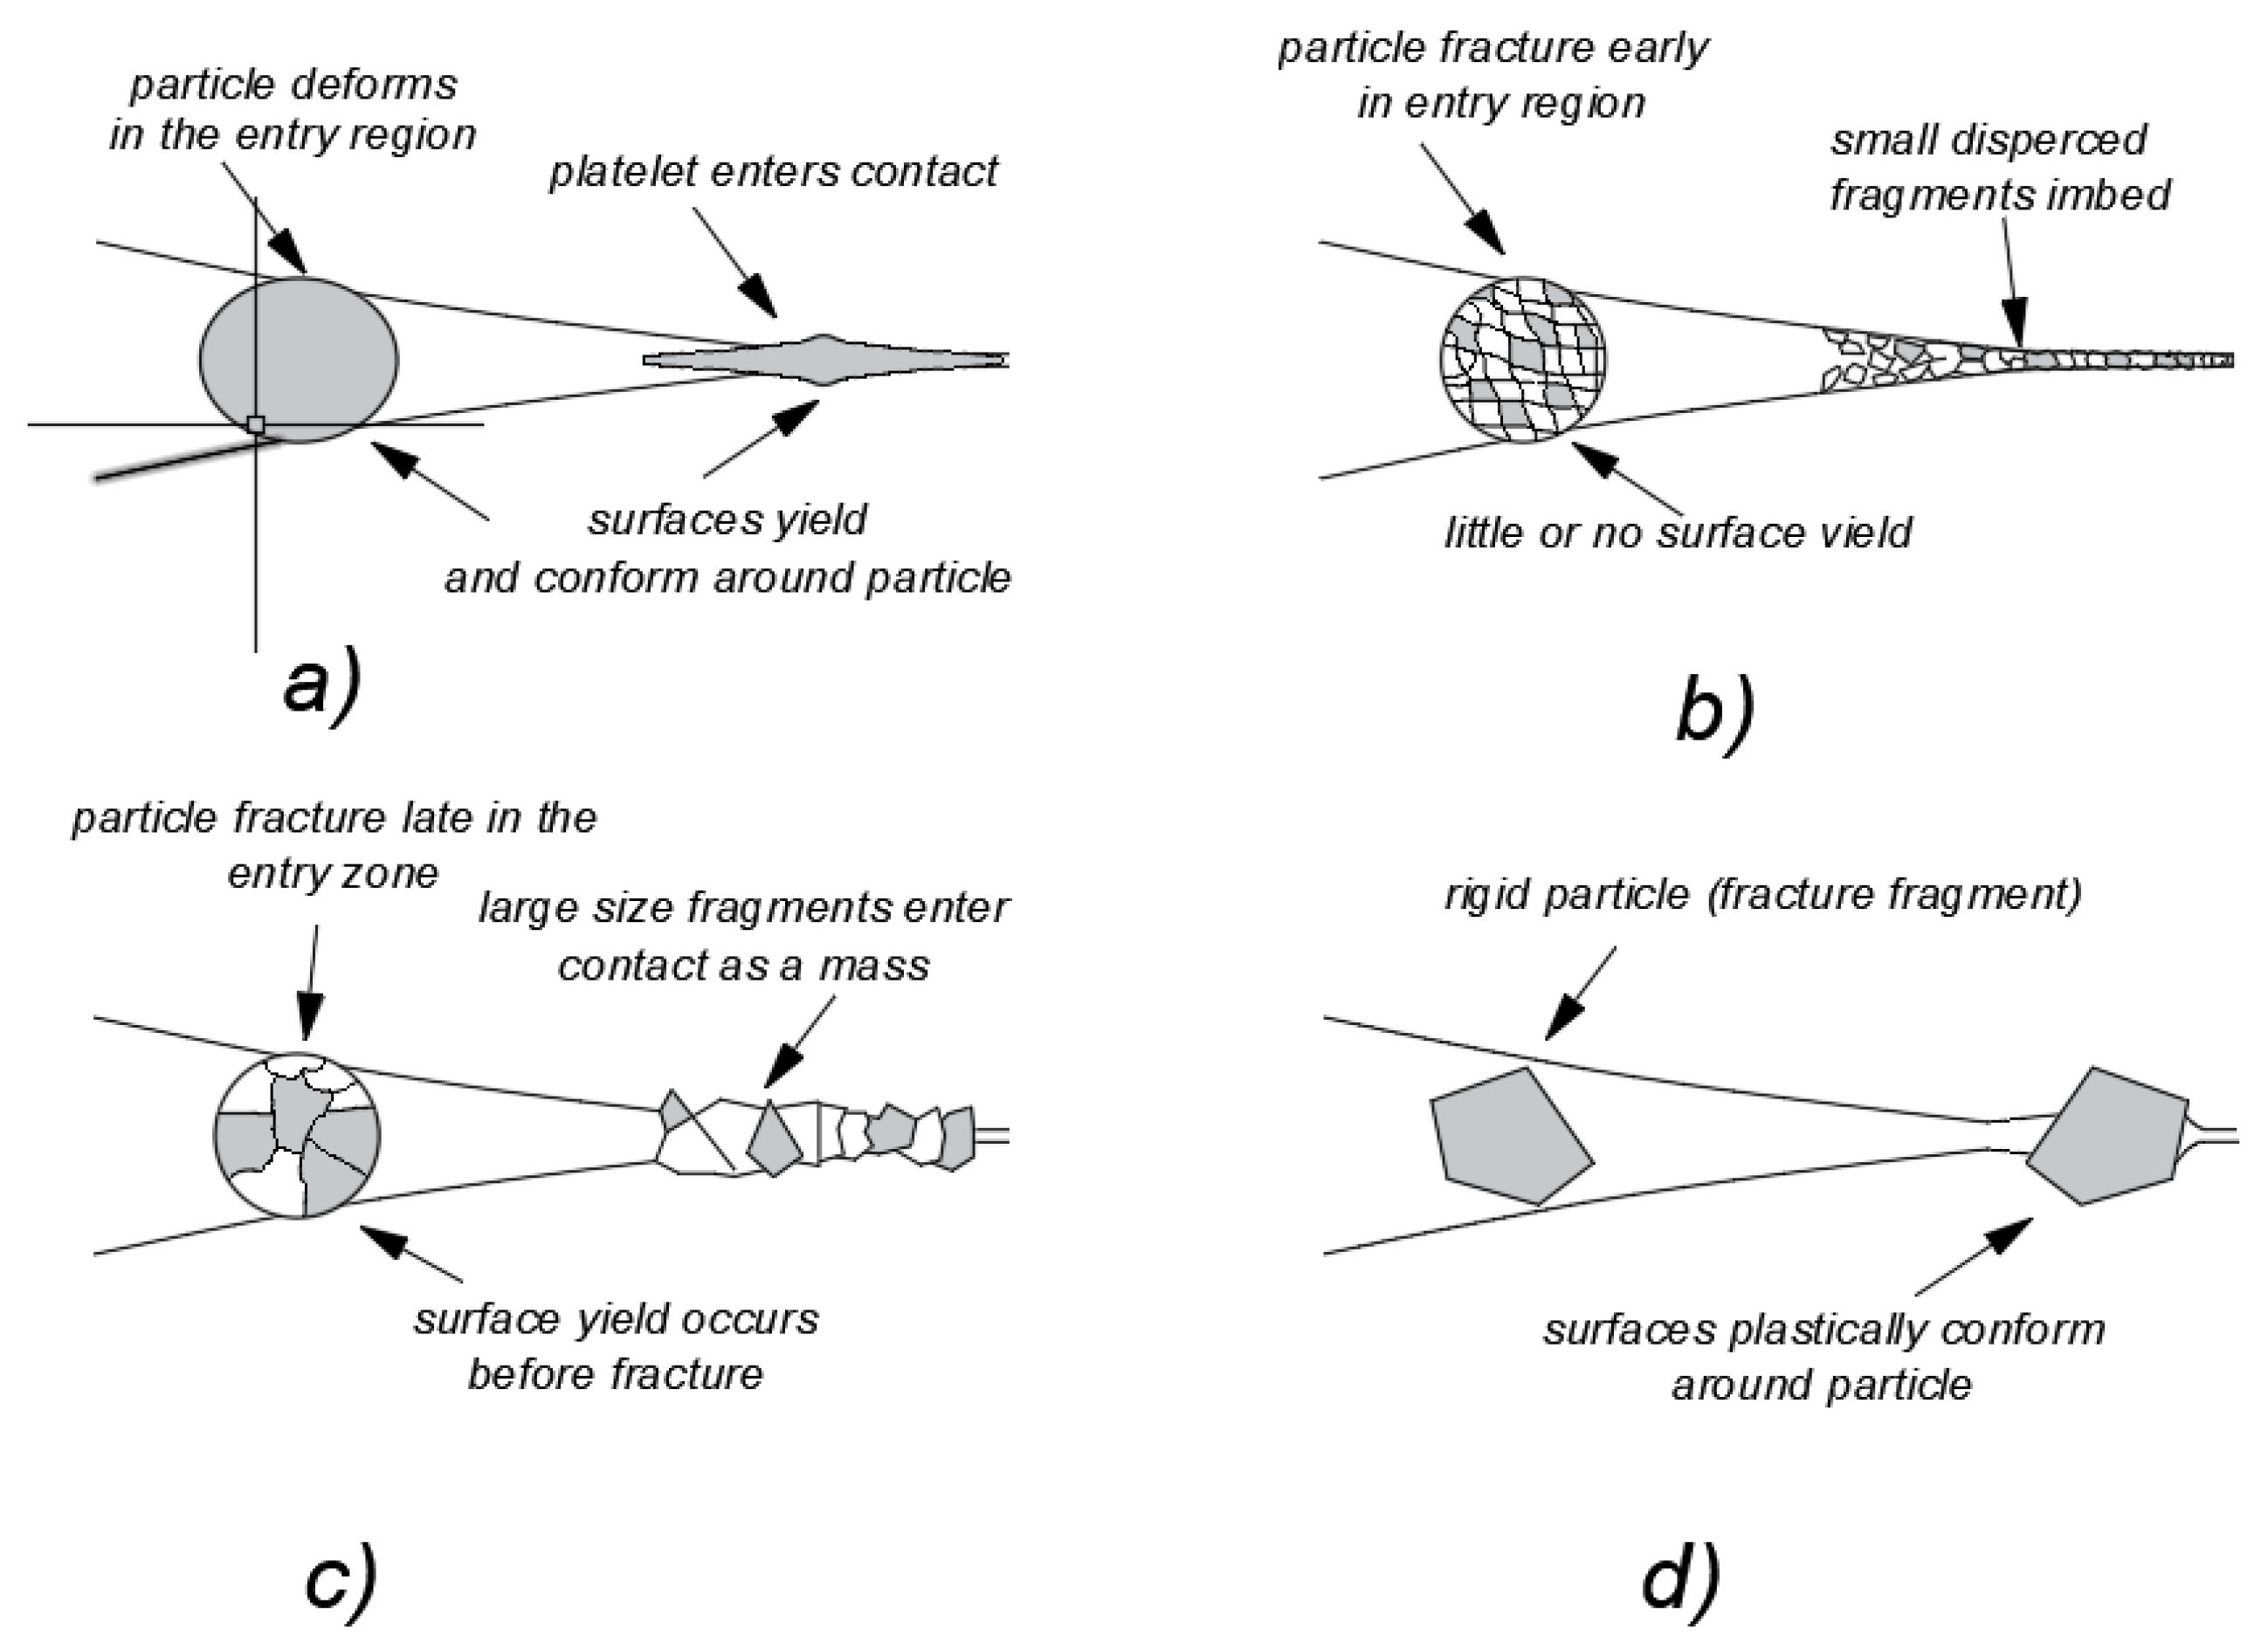
Dwyer-Joyce et al. [32,33,34] distinguish between four possible behaviour patterns displayed by the mineral particles which have already entered the mating zone between two functional surfaces:
- a)
- plastic abrasive grains deform flat and flatten on mating surfaces,
- b)
- abrasive grains consisting of fine mineral fractions become defragmented easily in the mating area (under conditions of lubrication, this may correspond to case a in Figure 1),
- c)
- abrasive grains consisting of large mineral fractions become slightly defragmented in the mating area (under conditions of lubrication, this may correspond to cases c and d in Figure 1),
- d)
- hard and homogeneous abrasive grains do not become defragmented in the mating area (under conditions of lubrication, this may partly correspond to case b in Figure 1).
The characteristics of oil contaminating particles depend on the operating environment. Table 1 contains information about the concentration, type, and size of the particles found in lubricating oil, determined by various researchers for different industries.
Figure 2.
Models of impact of mineral particles in the mating zone of functional surfaces; based on [36].
Figure 2.
Models of impact of mineral particles in the mating zone of functional surfaces; based on [36].
In the case of abrasives composed of soft rock grains, including coal, some other wear mechanisms may occur, including surface fatigue or delamination processes taking the form of shallow spalling [40,41,42]. However, abrasive mixtures are often inhomogeneous and may contain materials of wear properties that differ significantly. One such material is hard coal, which is very often contaminated with mineral substances and may also contain interlayers of clastic rocks: sandstones, mudstones and argillaceous rocks. Immediately after extraction, hard coal should not be treated as a homogeneous component, but only as a mixture of various minerals and coal.
As mentioned in papers [43,44], the following was determined for non-lubricated friction nodes subject to wear in the presence of hard coal and carbonaceous claystone: the typical forms of damage due to wear mechanisms were micro-scratching and micro-fatigue; there was kaolinite and carbonaceous substance pressed into the scratches caused by surface spalling; metal particles and mineral grains could be partially neutralised by a layer of pressed-in claystone. Wieczorek et al. [45] demonstrated surface damage caused by cutting with mineral fraction grains and flat surface spalling products for coal-mineral and mineral abrasives. Additionally, hard grains were observed to deposit in damaged surface areas, which was facilitated by the presence of carbonaceous fractions. On the other hand, for surfaces worn in the presence of carbonaceous grains alone, wear tests revealed undisturbed traces of the grinding process, suggesting the formation of unstable layers of pressed-in coal. Furthermore, the aforementioned paper introduces two models of wear in the presence of coal and coal-mineral abrasives occurring in a real-life tribological system, namely a scraper moving on the surface of a sliding plate. What has also been determined in that study is the potential impact of the presence of coal-based abrasives on the intensity of the wear process in the components of machinery transporting energy raw materials.
The impact of coal type (lithotype) on abrasive wear was analysed in study [46]. In this respect, slight differences in wear values were found in the coal types subject to tests, and no impact of load on abrasive wear was observed. Following the tests, pressed-in coal grains were observed in the scratches resulting from grinding, and the pressed-in coal also formed layers on the surface of the samples. The resulting coal films exhibited protective and neutralising properties against the destructive action of steel particles.
Report [47] concerning tests of oil-coal mixtures of variable non-carbon fraction content, grain size, and solid contaminant concentration reads that the most favourable wear, thermal, and friction properties were established for the pure oil lubrication variant (roller-block tester) and the lowest friction coefficient values (four-ball tester). The following has also been noted: an increase in the proportion of non-carbon fractions in solid lubricant contaminants, regardless of their particle size, significantly increased the wear of the test samples; as the size of the coal particles contained in the lubricating mixtures increased, the values of the parameters characterising friction and wear decreased; the presence of additional solid particles in the lubricating oil may, to a certain limited extent, improve resistance to scuffing.
In paper [48], on the other hand, it has been demonstrated that gear transmissions for mining applications are operated under unfavourable boundary and mixed lubrication conditions, and the fraction of solid contaminants in their lubricating oil after 1 month comes to 0.4% at the least. Studies of the oil contaminants found in transmissions used in hard coal mines [49] showed that the diameter of the contaminating particles ranged from 0 to 10 μm (an average particle size being approx. 2.5 μm) and that these particles were composed mainly of coal, SiO2 and iron particles.
Ostrikov et al. [50] observed in their study that the addition of carbon black significantly improved the lubricity of mineral oil, enhancing its properties, while it activated wear processes in oil without additives. The lubricity of pure oil with additives increased by more than 30% once it had been exposed to ultrasounds, which resulted from the activation of its dispersion medium. It was further noted that small amounts of engine fuel combustion products which penetrated oil increased the lubricity of oil enriched with additives, similarly to other carbon-based additives.
In paper [51], on the other hand, Bölter argues that, as the content of carbon black increases in oil, the coefficient of friction decreases, while surface properties after the wearing-in process deteriorate as the content of carbon black grows. The surfaces of components operated in oils containing carbon black were found to show less damage, and their superficial layers displayed a lower content of anti-wear additives, which may suggest them being bonded by the particles of carbon black.
Pang et al. [52] conducted research on the effects of contamination of solid mining transmission lubricants with coal and rock dust on the wear of steel. Pulverised coal and silica dust with a grain size of approx. 180 µm and 75 µm were used in the experiments. The finding of that study is that wear is considerably dependent on the type of contaminants and their combination, and a small amount of pulverised coal exerts a beneficial effect on account of its lubricating properties, while higher concentrations significantly increase wear. What this study has also demonstrated is the lower coefficients of friction established for oil contaminated with anthracite coal dust (COF=0.065) compared to oil contaminated with a mixture of coal and silica dust (COF=0.105). Another conclusion derived from that study is that the cyclic loads attributable to the presence of coal particles lead to dynamic changes in surface stresses in alloy steel, resulting in local stress concentrations which promote initiation of microcracks, and as the friction process progresses, these microcracks propagate, leading to the gradual detachment of material particles and the formation of wear products. The aforementioned study has also revealed that the presence of reactive elements, such as phosphorus (P) and sulphur (S), contained in coal-derived contaminants significantly intensifies surface degradation by accelerating oxidation processes.
In their respective papers, Tlotleng et al. [53], Xia et al. [54], Yarali et al. [55], Shao et al. [56], Shi et al. [57], Terva, et al. [58], Wang et al. [59], Labaš et al. [60], Ngoy et al. [61], Wells et al. [62,63], as well as Petrica et al. [64] have confirmed the major abrasive effect of hard coal, leading to considerable wear of mining tools and equipment.
On the other hand, based on the results obtained from a numerical model taking into account both the plastic deformation of particles and the forces generated by grease under pressure, as well as the distribution of the heat attributable to friction, including the values of flash temperature, as it is commonly referred to, Niklas [65] has detected a significant effect of thermal load on the cracking and spalling in the superficial layer of surfaces lubricated with oil contaminated with soft particles. Thermal load is generated by way of the processes of forcing through and compression of mineral material grains over the course of elastohydrodynamic contact, leading to a considerable short-term local temperature increase due to friction (a phenomenon known as flash temperature).
According to the same author [66], the peak flash temperature occurs in less than one millisecond, depending on the rolling and sliding velocity. This phenomenon is most powerful just before the particle enters the central contact zone, which determines the location where the maximum temperature is observed. The distribution of heat between the particle and counterfaces is directly dependent on their thermal properties. Typically, most of the heat is transferred to the surface to which the particle adheres. It has also been noticed that the larger and/or harder the particle, the smaller the temperature difference between the counterfaces. The main factor affecting flash temperature is the particle size, not its hardness. The difference in flash temperature between particles of 5 μm and 20 μm in size, made of the same material, can exceed 1,000°C (Table 2).
Frictional heating generates thermal stresses which, in numerous cases, significantly exceed mechanical stresses [67,68]. This phenomenon raises the risk of surface damage, shifting the high-risk zone of plastic deformation closer to counterfaces. Unlike hard particles, which retain their shape, soft particles flatten, thus increasing the friction surface considerably. For this reason, and on account of the predominance of thermal stresses, soft particles can cause serious damage.
Unfortunately, in many cases, oil contamination cannot be avoided in lubricated friction nodes due to sealing system leaks, the use of vents, and the cyclical processes of heating and shrinking of machine bodies [69]. This is a typical mining situation, encountered particularly in hard coal mines, which, despite the use of advanced materials and heat treatment technologies dedicated to this industry [70,71], leads to critical damage, which manifests itself as pitting or abrasive wear, and consequently to the decommissioning of the affected equipment.
The main objective of the studies discussed in this paper was to identify the quantitative and qualitative impact of mineral oil contaminants in the form of pulverised hard coal and carbonaceous claystone grains on the surface wear mechanisms in heat-treated 42CrMo-4 steel. The impact of the oil mixtures containing coal-mineral fractions, especially carbonaceous claystones, has not been explained sufficiently enough. A review of the literature on the subject has revealed that it provides no results of studies on the mechanisms of steel surface damage under conditions of lubrication with oil containing claystone and coal-based abrasives, which makes the subject addressed in the paper a novelty, given the state of the art.
2. Materials and Methods
Tests enabling quantitative and qualitative determination of wear of mating elements were conducted at an Amsler roller-type test rig [72]. The test assembly consisted of two cylindrical rings contacting each other with their cylindrical surfaces, loaded with a constant radial force, and rotating in such a way as to cause counter-motion of the samples.
The wear tests at the roller test rig proceeded under the following conditions:
- −
- friction type – rolling with slide,
- −
- load – constant radial force of F = 490 N,
- −
- sample contact area width – b = 10 mm,
- −
- rotational speed – n1 = 200 min-1,
- −
- sample circumferential speed – vp = 0.8 m·s-1,
- −
- counter-sample circumferential speed – vpp = 0.92 m·s-1,
- −
- counter-motion of samples.
The samples and counter-samples were made of the 42CrMo-4 steel (quenched and tempered at a low temperature of 160°C) with a surface hardness of 56 HRC (their chemical composition has been provided in Table 3). After the heat treatment, this steel displayed a structure of tempered martensite.
Both the samples and counter-samples were of identical dimensions: outer diameter of ϕ40, hole diameter of ϕ16, and sample width of 10 mm. Mass loss measurements were performed after 5, 20, 50, and 80 minutes of co-operation of the rings tested. Before the wear test began and after each friction cycle, the mass of the sample (having been carefully cleaned and dried) was determined five times using an analytical balance characterised by a measurement accuracy of 0.1 mg. Student’s t-test was conducted to establish the measurement uncertainty for the samples.
Pure VG 220 mineral oil and 5 oil mixtures with 1% mass fraction of the coal and claystone particles examined (these minerals have been described in detail in Section 3.1 of the paper) were used in the tests. The oil-coal and oil-claystone mixture variants taken into account have been listed in Table 4. Table 5 provides a compilation of the parameters characterising pure oil and, due to the very similar results obtained, the average viscosity values obtained for Variants 1÷5 of the mixtures examined. For purposes of the study, with reference to Table 1 (Various group), it was assumed that the range of diameters of the mineral contaminant particles to be added to pure oil would be 0÷100 μm.
Additionally, in order to characterise the conditions of lubrication of the test samples, the following was determined:
Based on the lubricating film thickness calculations, one can conclude that the ring-ring friction pair tested was subject to mixed friction conditions.
The chemical composition of the coal abrasives was determined by X-ray fluorescence (WD-XRF) using a Rigaku ZSX Primus II WD-XRF spectrometer (Rh lamp). The samples were dried, and then the relevant loss on ignition was determined at the temperature of 1,025°C. Roasted to obtain a constant mass, the samples were melted using an off-the-shelf mixture of lithium tetraborate, lithium metaborate, and lithium bromide (66.67%, 32.83%, and 0.5%, respectively) characterised by a flux purity suitable for XRF (from Spex). The spectrum was analysed qualitatively by identifying spectral lines and determining their possible coincidences. On such a basis, analytical lines were selected. Semi-quantitative analysis was performed using the SQX Calculation program (by the fundamental parameters method). The analysis was performed in the fluorine-uranium (F-U) range, and the contents of the elements thus determined were normalised to 100%.
The phase composition of the coal abrasives was studied using a Panalytical X’Pert PRO MPD X-ray diffractometer featuring a cobalt anode X-ray tube (λKα = 0.179 nm) and a PIXcel 3D detector. The diffractograms were recorded in the Bragg-Brentano geometry with the angles ranging at 5–100o 2Theta with a step of 0.026o and a counting time of 80 seconds per step. Qualitative X-ray phase analysis was performed using the HighScore Plus (v. 3.0e) software and the PAN-ICSD dedicated database of inorganic crystal structures.
Spectroscopic analysis of the minerals tested was performed using an inVia Reflex Raman spectrometer from Renishaw featuring a Leica Research Grade confocal microscope capable of observing samples in reflected and transmitted light. Excitation was performed using a 50 mW ion-argon laser beam with a wavelength of λ = 514 nm. Sample measurements were recorded in a wide wave number range from 50 to 3,200 cm-1.
The surface of the samples was observed using an Axia ChemiSEM scanning electron microscope (SEM) enabling secondary electron (SE) detection at an accelerating voltage of 20 kV and a magnification range of 60÷1,000x. The chemical composition of the test material in the micro-areas was subject to a qualitative analysis by energy dispersive X-ray spectroscopy (EDS) at an accelerating voltage of 20 kV. Prior to testing, the samples were coated with a thin film of gold to ensure electrical charge dissipation during the tests.
3. Results
3.1. Identification of the Abrasives Studied
In pursuit of the pre-defined objective of the study, namely identification of the quantitative and qualitative impact of hard coal and carbonaceous claystone based oils on surface wear mechanisms, detailed identification of the mineral components of the mineral abrasives proved necessary.
Three coal-based abrasives (Variants 1–3) and two carbonaceous claystone-based abrasives (Variants 4–5) were used to test the wear of the lubricated friction nodes. Their chemical composition has been presented in Table 8.
The coal abrasives subject to the tests were contaminated to varying degrees with mineral substance, the content of which was determined by the ash content in the coals, representing the residue left after combustion. The presence of the mineral substance in coal is attributable to the original plant-based material as well as the rock material penetrating the coal bed over the course of its formation (syngenetic components) or deposited at a later time (epigenetic components).
Generally, two types of the mineral substance can be distinguished:
- −
- external substance, including minerals from the group of silicates, aluminosilicates, carbonates, sulphides, sulphates, and chlorides; this substance can be removed rather easily from coal by mechanical processing;
- −
- internal substance, which cannot be separated from the fuel by mechanical means; it consists of organometallic compounds, i.e. chemically bound metals with humic acids, waxes, and resins forming salts.
However, it should be noted that the ash obtained through the coal combustion differs in terms of quantity and quality from the mineral substance, subject to significant changes during the combustion, where one can observe phenomena such as decomposition of carbonates accompanied by CO2 release, loss of crystallisation water by silicates and aluminosilicates, etc. The ash content in coal varies from a few to even several dozen per cent, and such variation may be found between entire groups of deposits, between individual deposits, and even within deposits. The average ash content in coal is determined to range between 11 and 16 per cent. On account of the ash content, coal is broken down into low-ash (up to 20% ash) and high-ash (up to 40% ash) grades [74,75]. What has been found in the case of the abrasives studied is that Variant 1 represents low-ash coal, Variant 2 – high-ash coal, while Variant 3, with the ash content exceeding 55%, may already represent a transitional form between coal and carbonaceous claystone.
The second group of samples is represented by carbonaceous claystones with an ash content exceeding 85%. One of the characteristics of coal-based claystones is that they contain carbonaceous substance in a dispersed form, referred to as pigment, which accounts for their distinctive black colour.
Having analysed further test results, one can conclude that the analysed coal abrasives (Variants 1÷3) are characterised by a relatively low elemental C content, which typically ranges at 76–93% in hard coal [74,75]. For Variant 1, taking standard deviation into account, it can be assumed that the coal content falls within the standard, while for Variants 2 and 3, the coal content is 51.2% and 30.2%, respectively. This confirms the conclusion formulated above that Variant 3 is a transitional rock form between coal and carbonaceous claystone, which may also be a probable scenario for Variant 2, where the coal content barely exceeds 50%. These results correlate with the content of other components, where a significant increase in the SiO2 content can be observed in Variants 4 and 5 (57.42% and 20.06%, respectively), with a small fraction of silica in Variant 3 (3.72%). The results obtained for the content of Al₂O₃ and K₂O are similar, indicating an increase in the fraction of argillaceous minerals in Variants 4 and 5.
In order to characterise the mineral components in a more detail manner, X-ray diffraction (XRD) tests were conducted (Figure 4). Based on the results thus obtained, the argillaceous minerals were found to be represented by kaolinite, while quartz and muscovite were also revealed to be present. Additionally, the abrasives subject to tests were examined using Raman spectroscopy. Figure 5 shows examples of the Raman spectra of the abrasives studied. Furthermore, these abrasives were also analysed structurally by Raman spectroscopy. Figure 5 shows the Raman spectra for individual abrasive types. Four main modes (D, G, 2D, and D+G) can be distinguished in the spectra recorded, indicating the presence of amorphous carbon or highly disordered graphite in the structure of the materials tested. The vibrations of carbon skeletons (tensile vibrations in the C-C plane) characteristic of sp2 carbons correspond to the G mode, observed at ~1,585 cm-1, while the occurrence of the D mode at ~1,350 cm-1 indicates structural defects or disorder in the graphite lattice. The second-order D mode (2D) can be observed at ~2,710 cm-1. Furthermore, the recorded D+G band (~2,930 cm-1) implies a high degree of disorder in the carbon structure. The Raman spectra analysis indicates that there is more carbonaceous material with a high degree of structural disorder (including graphite) in the first three samples, i.e. A, B, and C, compared to materials D and E [76].
Images of the grains of the abrasives tested, obtained by scanning electron microscopy (SEM), have been provided in Figure 6. Based on the aforementioned observations, it has been established that, regardless of the coal type analysed (Figure 6 A–C), the grains presented are characterised by irregular shapes and varied sizes, falling within the pre-assumed grain size limits. However, grains with an average size of approx. 25 μm predominate, alongside which a significant quantity of finer grains can be observed. Larger grains are characterised by a heavily scratched surface, and one can also notice numerous grooves filled with finer material, which also accumulates on the surface of larger abrasive fragments. In the carbonaceous claystone-based abrasives, angular coal grains are generally visible alongside aggregates (clusters) of argillaceous minerals. The form in which they occur in this case is rather typical of these argillaceous minerals, which is related to the very small size of individual grains, usually having a flaky shape.
3.2. Wear Test Results
The results of the abrasive wear tests obtained for individual mixtures of oil with carbonaceous and argillaceous contaminants, in the form of mass loss curves in a function of time, have been provided in Figure 7. In the case of Variant 1, one can observe a slight effect of wearing-in on the mass loss value, while this effect is much more considerable in the other cases (Variants 0 and 2÷5). After the initial wear period (the first 5 minutes of the test), the surface of the samples tested under the conditions set for Variant 1 revealed shiny surface without any visible spalling under macroscopic magnification (approx. x30), and such a surface form remained throughout the test. In the case of the other variants, pits were clearly visible on the surface of the samples already after the first wear cycle, while the mass loss increments were relatively small.
Figure 8 shows the maximum mass loss values determined for the variants subject to tests in a function of the percentage share of non-combustible fractions λP. Based on their values, the variants analysed can be ranked in the order of increasing wear: Variant 1 < Variant 5 < Variant 4 < Variant 0 < Variant 3 < Variant 2. What the figure also shows is that the wear determined for the case of lubrication with oil containing hard coal with the lowest ash content and the highest elemental carbon content (Variant 1) was characterised by the lowest wear, while the results obtained for the other variants, including the one with pure oil lubrication, were very similar (which is confirmed by the regression line determined for the results obtained for Variants 0 and 2÷5).
Figure 9, on the other hand, provides graphs of the mass loss of the steel lubricated with oil contaminated with coal-mineral particles in a function of the mineral composition of the oil contaminants tested (cf. Table 7). The following fractions were analysed:
- −
- fraction of hard minerals (SiO2+Al2O3), accountable for the abrasive properties of the materials examined,
- −
- carbonaceous fraction (C), determining the degree of carbonisation of abrasives,
- −
- fraction of alkali metal oxides (CaO+Na₂O+K₂O), determining the capacity to form hydroxides with water,
- −
- sulphur, determining the capacity to form superficial oxide layers.
What can be observed in the analysed range of the percentage share of non-combustible fractions λP = 9.24%÷89.78% in the carbonaceous contaminants of mineral oils is the mass loss declining as the degree of carbonisation of abrasives (Figure 9A) and sulphur content (Figure 9C) increase, as well as the mass loss increasing as the share of abrasive minerals, i.e. silica and aluminium oxide (Figure 9B), and the share of alkali metal oxide fractions (Figure 9D) increase.
3.3. Identification of Surface Damage Forms
Once the wear tests had been completed, the next stage in the research consisted in assessing the effects of the abrasive on the surface of the steel samples tested. To this end, microscopic observations of the surface of the samples were performed by scanning electron microscopy and light microscopy, and surface topography was measured using a digital confocal microscope.
Figure 10 provides images of the sample surface (lower and upper, respectively) lubricated with pure oil (Variant 0) following the wear test. It can be noticed that the dominant types of damage were scratches (Figure 10D) and flat surface spalling (Figure 10A,B). The presence of spalling indicates delamination under the impact of repeated load cycles caused by the movement of the abrasive material. The presence of scratches, on the other hand, implies the secondary impact of wear products on the surface of steel samples. What can also be observed in this case is surface texturing, suggesting the initial stages of pitting (Figure 10E,F), and surface cracking in the vicinity of parallel cracks (Figure 10C), which may herald delamination.
The steel surface profilogram provided in Figure 11 reveals extensive fatigue-induced delamination with a maximum depth of approx. 50 μm.
The longitudinal section of the spalling area shows that the cracks spread at a slight angle into the surface layer, while the cross-section indicates that the spalling edges are almost vertical.
Figure 12 provides images of the steel sample surface following the wear test in the presence of a mixture of oil and coal with an ash content of λp = 9.24% (Variant 1). The predominant types of damage identified for this variant were fatigue surface defects of flat spalling in the form of delamination platelets (Figure 12A,B) as well as the initial (Figure 12D,E) and final stages of pitting damage (Figure 12F). Shallow surface scratches with a few coal grains and pressed-in abrasive particles are also visible on the surface of the samples (Figure 12C).
The results of the profilometric tests conducted for Variant 1, as shown in Figure 13, illustrate a different form of spalling than that established for Variant 0, characterised by small shallow cracks with a maximum depth of approx. 12 μm.
Figure 14, Figure 15 and Figure 16 provide images of the surfaces of the samples lubricated with contaminated oil (Variants 2, 3 and 5, respectively) following the wear test (the surface view obtained for Variant 4 has not been provided due to its high similarity to that of Variant 5). The predominant types of damage for all these variants were shallow scratches and flat surface spalls caused by surface delamination. Only for Variant 3 were there initial and final spalling marks typical of pitting. The forms of surface damage produced over the course of the wear tests under the conditions of lubrication with contaminated oil (Variants 2, 3, 4 and 5) were very similar to the defects identified when studying Variant 0. There were pressed-in coal abrasive particles and numerous artefacts with the characteristics of corrosion products (iron oxides) also found on the surfaces of these samples.
Similarly to the surface profilogram of the steel studied under Variant 0 (shown in Figure 9), the profilograms obtained for Variants 2, 3 and 5 (Figure 17, Figure 18 and Figure 19, respectively) reveal large fatigue-induced signs of delamination spalling which, however, differ slightly in terms of maximum depth: it is approx. 55 μm for Variant 2, while for Variants 3 and 5, it is approx. 45 μm.
The spalling depth values established for all the variants studied, save for Variant 1, are similar to those of the depth of maximum Hertzian stresses (cf. Table 6). The spalling forms identified for the variants employing the samples lubricated with coal-contaminated oil are also very similar to the damage found when studying Variant 0 (which also applies to Variant 4).
4. Discussion
Having analysed Figure 8, showing the maximum mass loss values in a function of the percentage share of non-combustible fractions λP in carbonaceous contaminants, one can notice that there is no explicit functional relationship between wear and the share of ash in coal (λP), while a clear local minimum of mass loss is observed for λP = 9.24%. It should be added that the differences in the mass loss determined for the other cases are insignificant.
As aforementioned, Variant 1 is characterised by a large variation in mass loss values compared to the other variants, i.e. Variants 0 and 2÷5. As Table 8 implies, Variant 1 was characterised by the highest degree of carbonisation, the lowest content of hard mineral fractions, and a relatively high sulphur content. It is such a combination of properties that makes this abrasive material a low-abrasion type.
The minimal wear observed for Variant 1 can be explained primarily by its capacity (similar to graphite) to form carbonaceous films on the irregularities of mating surfaces under mixed friction conditions. It is also noteworthy that the Raman spectroscopy tests have revealed a distinct G-mode for this variant within the Raman shift range of 1,590, which is characteristic of ordered graphite structures.
Graphite is a soft material which displays good lubricating properties, significant cleavability, and high thermal resistance. Graphite of both natural and synthetic origin is used for lubrication purposes, their properties being similar. A characteristic property of graphite is its high chemical resistance. It also exhibits high thermal resistance, which makes it suitable for application at temperatures up to 550°C.
Another advantage of graphite, used as a wear-reducing agent, is its capacity to adsorb onto metallic surfaces [11]. This property is attributable to the effect of both electrostatic forces and the van der Waals forces. Additionally, when graphite particles are introduced between mating surfaces, they mechanically fill surface irregularities. Consequently, a strongly adhering film with a thickness of 200÷1,000 μm, called graphoid, is formed on the mating surfaces, preventing dry friction of these surfaces. Graphoid films are physically bound to the friction surface by oxides. Under boundary or mixed friction conditions, graphite particles are additionally arranged along the oriented surface. The formation of graphoid on surfaces subject to friction reduces the wear of metallic parts and decreases frictional resistance. Graphoid prevents dry friction between mating surfaces.
Under conditions of insufficient lubrication, where direct contact between surface irregularities in mating elements is possible, the graphite particles contained in the liquid lubricant are physically adsorbed onto the metal surface, forming a sufficiently durable graphoid film. Further graphite particles are attracted to this film until the depressions in the irregularities have been filled and the surface smoothed. The reciprocal displacement of the surfaces takes place in the graphite layer along what is referred to as a “graphite mirror.” The resulting graphoid-graphite film (Figure 20) is characterised by good adsorption properties, as a result of which the lubricant molecules are strongly attracted and form a sufficiently durable lubricating film, thus improving the operating conditions of the friction node. The graphoid film increases the lubricity of a given lubricant on account of its greater oil adsorption capacity compared to metals. It should also be added that, due to their low shear strength, the graphite films covering the irregularities of mating surfaces reduce the friction forces associated with the interaction of the peaks of these irregularities.
It is highly likely that, in the case of Variant 1, coal particles were also adsorbed onto the surface of the samples, having backfilled the irregularities of this surface. The adsorption of coal particles onto the surface of the samples is associated with its properties, specifically the ability of coal to become plastic when heated to a temperature of approx. 350÷500°C [77,78,79]. In terms of colloid chemistry, the plastic state of coal constitutes a system composed of a dispersing medium and a dispersed medium. It has been proved that, once heated, hard coals decompose, first entering a softened state, then a plastic state [80,81], and then solidifying into a product with an altered structure, devoid of gaseous and liquid parts [82,83]. Over the course of the tests performed, as a result of friction processes, the abrasive material could be exposed to high temperatures. Its impact is insignificant on a macro scale, but on a micro scale, the temperature could locally reach a level that enabled the coal abrasive to soften, causing it to be pressed into the scratches formed by the effect of wear products, and leading to the formation of a film showing properties similar to the graphoid-graphite film described above.
The formation of a coat composed of pressed-in carbonaceous particles causes separation of the mating surfaces to a certain extent, preventing mutual contact between their vertices. The surface roughness reduction resulting from the formation of that coat has a positive effect on the lubrication conditions at the point of contact and may, therefore, be the reason for the mass loss reduction observed in the case of Variant 1. The improvement in lubrication conditions resulting from the formation of the carbonaceous layer most likely led to a reduction in the coefficient of friction (COF), which conforms with the results of the studies by Pang et al. [52] and Bölter [51].
Over the course of the wear process taking place on the surface of the samples lubricated with oil containing coal abrasives with an ash content of λP = 29.15÷89.78%, similarly to Variant 1, films of pressed-in coal-mineral material were also most likely formed. The formation of these films is indicated by their residues visible in Figure 14 C÷E, Figure 15B and Figure 16B. Some heterogeneous fragments of the coal-mineral film are particularly visible in Figure 14D. The share of hard fractions in these abrasives could have caused these films to be unstable and unable to separate the mating surface irregularities under mixed friction conditions (cf. Table 6). The share of non-carbonaceous fractions probably reduces the adsorption properties of coal particles, which they manifest on the surface of samples, hence the significantly reduced durability of the films in question. This resulted in the separation of fragments of the vertices of the surface irregularities and caused them to scratch the surfaces (as shown in Figure 14A, Figure 15A and Figure 16A).
It should be noted at this point that the predominant form of surface defect in the 42CrMo-4 steel is spalling. In the case of Variant 1, the spalls were approx. 10 μm deep, while in the other cases, the spalling depths ranged at approx. 40÷50 μm, which was consistent with the location of the zone of the highest contact stresses (cf. Table 7). As Figure 7 implies, the greatest increase in mass loss and the associated formation of spalling were observed during the wearing-in of the samples. In this phase of the wear test, the strongest thermal effect resulting from the friction of surfaces, still of relatively high roughness at this stage, is typically observed.
The surface spalling observed after the wear tests of Variants 2÷5 was most likely caused by the combined effect of contact stresses and thermal stresses. The factors which substantiate the foregoing causes are the depth of the spalling which corresponds to the location of the maximum contact stresses and the presence of unbonded coal-mineral particles which, under mixed friction conditions, are pressed into the contact area, flattened, and heated to high temperatures due to friction. This leads to an increase in flash temperature [65,66] and local surface heating (cf. Table 2) which, when combined with contact stresses, can cause rapid surface degradation by way of spalling. The heating of the surface during the tests was facilitated by the considerable mutual slipping, attributable to the counter-motion of the samples, triggered in the zone of contact between irregularities. This process may also have benefited from the bonding of the anti-wear (AW) additives contained in the lubricating oil by coal-mineral grains, as demonstrated by Pang et al. [52].
As aforementioned, the depth of spalling determined for Variant 1 is significantly smaller (approx. four times) than that observed for Variants 2÷5. This difference can be explained by the formation of a layer of pure coal absorbed on the surface of the steel samples, most likely leading to an increase in the relative thickness of the oil film. It is most probable that an increase in the relative thickness of the said oil film reduces friction, thus lowering the flash temperature, and may increase the suppression of contact stress variability, which implies shallower crack propagation into the surface layer of the samples.
On the other hand, the declining wear observed when studying Variants 2÷5 as the ash content increased in coal was most likely due to the tendency of claystone grains to break down into smaller particles (cf. Figure 6). According to Nikas [67,68], it is the size of the carbonaceous particle, rather than its hardness, that has a decisive effect on the flash temperature. Consequently, the susceptibility to disintegration of claystone particles may locally cause lower temperatures as the particles are being pressed through the contact area of the mating surfaces.
The surface spalling over the course of the lubrication with pure oil (Variant 0) was most likely also attributable to the combined effect of contact stresses and thermal stresses. It was only under the impact of mixed friction that contact occurred between the vertices of surface irregularities, which could deform plastically, heat up, and cause surface cracks under such conditions.
5. Conclusions
The following conclusions have been drawn with reference to the studies of the wear of the 42CrMo-4 steel lubricated with mineral oil containing carbonaceous and argillaceous contaminants under mixed friction conditions:
1. Analysis has revealed no clear functional correlation between the mass loss in the samples and the share of non-combustible fractions (λP) in the carbonaceous contaminants.
2. Variant 1, which stood out for the highest degree of carbonisation and low mineral fraction content, showed the lowest mass loss among all the variants examined. This is most likely attributable to the presence of carbonaceous particles with a structure similar to graphite, as confirmed by the Raman spectroscopy results.
3. In the case of Variant 1, the favourable tribological properties are most likely due to the formation of a thin carbonaceous film during the test, which improves lubrication conditions. This film is formed as a result of the adsorption of coal particles onto the metal surface as well as their pressing-in and plasticisation under the conditions of elevated temperature and contact stresses.
4. The carbonaceous film reduces the direct contact between irregularities and causes surface roughness to decline, which consequently leads to a reduction in surface wear and spalling depth.
5. The depth of surface spalling observed when studying Variant 1 was approx. 10 µm, which corresponded to ca. 25% of the depth of spalling established for the remaining variants (2÷5). The reduced susceptibility to surface spalling, as observed in that case, can be explained by the improved attenuating properties of the carbonaceous film formed as well as lower thermal and mechanical stresses, most likely resulting from the flash temperature reduction in the contact area.
6. In Variants 2÷5, despite the formation of the films of pressed-in coal-mineral material, the presence of hard fractions weakened their durability and tendency to become fragmented.
7. High local temperature and the size of coal particles (rather than their hardness) are critical for wear intensity. Smaller claystone particles, prone to disintegration, may have contributed to lower flash temperature and lower wear in some cases.
8. In the absence of coal-based additives, lubrication with pure oil did not prevent direct contact between surface irregularities, leading to their heating, plastic deformation, and crack initiation.
Author Contributions
Conceptualization, A.N.W.; methodology, A.N.W. and I.J.; investigation M.S, D.Ł, A.G, M.K. and A.P.; formal analysis, F.K. and M.K. resources, F.K., M.K. and A.P.; Writing—Original draft preparation, A.N.W.; Writing—Review and Editing, I.J., K.F., D. Ł. and M.S.; funding acquisition, A.N.W. and K.F. All authors have read and agreed to the published version of the manuscript.
Funding
The article was written as part of the research work of the Department of Mining Mechanization and Robotization of the Silesian University of Technology No. 06/020/BK_21/0052 under the title "Identification of the mechanisms of the impact of abrasive on the basis of sedimentary rocks accompanying coal seams on the surface of friction nodes".
Dodać Techmatstrateg
Institutional Review Board Statement
Not applicable.
Informed Consent Statement
Not applicable.
Data Availability Statement
Not applicable.
Conflicts of Interest
The authors declare no conflict of interest.
References
- Dhanola, A.; Garg, H.C. Tribological challenges and advancements in wind turbine bearings: A review. Engineering Failure Analysis 2020, 118, 1–29. [Google Scholar] [CrossRef]
- Kenworthy, J.; Hart, E.; Stirling, J.; Stock, A.; Keller, J.; Guo, Y.; Brasseur, J.; Evans, R. Wind turbine main bearing rating 852 lives as determined by IEC 61400-1 and ISO 281: A critical review and exploratory case study. Wind Energy 2024, 27, 179–197. [Google Scholar] [CrossRef]
- Peng, H.; Zhang, H.; Fan, Y.; Shangguan, L.; Yang, Y. A Review of Research on Wind Turbine Bearings’ Failure Analysis 857 and Fault Diagnosis. Lubricants 2023, 11, 11–33. [Google Scholar]
- Sheng, S. Monitoring of Wind Turbine Gearbox Condition through Oil and Wear Debris Analysis: A Full-scale Testing 859 Perspective. Tribol. Trans. 2015, 59, 149–162. [Google Scholar] [CrossRef]
- Coronado, D.; Wenske, J. Monitoring the Oil of Wind-Turbine Gearboxes: Main Degradation Indicators and Detection 891 Methods. Machines 2018, 6, 1–24. [Google Scholar] [CrossRef]
- Zum Gahr, K.H. Microstructure and Wear of Materials. Elsevier 1987, 10. [Google Scholar]
- Hawk, J.A.; Wilson, R.D. Tribology of Earthmoving, Mining, and Minerals Processing. In Modern Tribology Handbook; Bhushan, B., Ed.; CRC Press LLC: Boca Raton, FL, USA, 2001; Volume 35, pp. 1331–1370. [Google Scholar]
- Czichos, H.; Habig, K.H. Tribologie-Handbuch. Tribometrie, Tribomaterialien, Tribotechnik; Springer Vieweg: Wiesbaden, Germany, 2010; p. 757. [Google Scholar]
- Lawrowski, Z. Tribologia. Tarcie, zużywanie i smarowanie; Oficyna Wydawnicza Politechniki Wrocławskiej: Wrocław, Poland, 2008; p. 331. [Google Scholar]
- Nadolny, K. Tribologia kół zębatych: zagadnienia trwałości i niezawodności; Wydawnictwo Politechnika Poznańska: ITE, Poznań-Radom, Poland, 1999; p. 229. [Google Scholar]
- Płaza, S., Margielewski, L. and Celichowski, G. Wstęp do tribologii i tribochemia; Wydawnictwo Uniwersytetu Łódzkiego: Łódź, Poland, 2005; p. 420.
- Norman, T.E. Wear in ore processing machinery. In Wear Control Handbook; Peterson, M.B. and Winer, W.O. Eds: New York, ASME, USA, 1980, pp. 1009–1051. [Google Scholar]
- Wieczorek, A.N.; Polis, W. Operation-oriented method for testing the abrasive wear of mining chain wheels in the conditions of the combined action of destructive factors. Manag. Syst. Prod. Eng. 2015, 19, 175–178. [Google Scholar]
- Myszka, D.; Wieczorek, A.N. Effect of phenomena accompanying wear in dry corundum abrasive on the properties and microstructure of austempered ductile iron with different chemical composition. Arch. Metall. Mater. 2015, 60, 483–490. [Google Scholar] [CrossRef]
- del Álamo, J.R.; Duran, M.J.; Muñoz, F.J. Analysis of the Gearbox Oil Maintenance Procedures in Wind Energy. Energies. 2020, 13. [Google Scholar] [CrossRef]
- Wakiru, J.M.; Pintelon, L.; Muchiri, P.N.; Chemweno, P.K. A Review on Lubricant Condition Monitoring Information Anal-789 ysis for Maintenance Decision Support. Mech. Syst. Signal Process. 2019, 118, 108–132. [Google Scholar] [CrossRef]
- Zhu, J.; He, D.; Bechhoefer, E. Survey of Lubrication Oil Condition Monitoring, Diagnostics, and Prognostics Techniques 799 and Systems. J Chem. Sci. Technol. 2013, 2, 100–115. [Google Scholar]
- Roylance, B.J.; Hunt, T.M. The Wear Debris Analysis Handbook; Co Hunt, T.M., Ed.; Coxmoor Publishing: Kingham, United Kingdom, 1999; p. 127. [Google Scholar]
- Tuszyński, W.; Michalczewski, R.; Osuch-Słomka, E.; Snarski-Adamski, A.; Kalbarczyk, M.; Wieczorek, A.N.; Nędza, J. Abrasive Wear, Scuffing and Rolling Contact Fatigue of DLC-Coated 18CrNiMo7-6 Steel Lubricated by a Pure and Contaminated Gear Oil. Materials. 2021, 14. [Google Scholar] [CrossRef] [PubMed]
- Scott, D. Industrial tribology: The practical aspects of friction, lubrication and wear. Wear; Elsevier Applied Science Publishers: London, United Kingdom, 1983; pp. 12–30. [Google Scholar]
- Wiśniewski, M. Elastohydrodynamische Schmierung; Expert Verlag: Renningen-Malmsheim, Germany, 2000; p. 214. [Google Scholar]
- Stachowiak, G.B.; Stachowiak, G.W. The effects of particle characteristics on three-body abrasive wear. Wear. 2001, 249, 201–207. [Google Scholar] [CrossRef]
- Bartz, W.J. Getriebeschmierung. Expert Verlag: Ehningen, Germany, 1989; p. 547. [Google Scholar]
- Marian, M.; Bartz, M.; Wartzack, S.; Rosenkranz, A. Non-Dimensional Groups, Film Thickness Equations and Correction Factors for Elastohydrodynamic Lubrication: A Review. Lubricants. 2020, 8, 1–20. [Google Scholar] [CrossRef]
- Zhao, Z.; Yang, Y.; Han, H.; Ma, H.; Wang, H.; Li, Z. Meshing Characteristics of Spur Gears Considering Three-Dimensional Fractal Rough Surface under Elastohydrodynamic Lubrication. Machines. 2022, 10. [Google Scholar] [CrossRef]
- Dowson, D.; Higginson, G.R. Elastohydrodynamic lubrication; Pergamon Press: Oxford-London, United Kingdom, 1976; p. 235. [Google Scholar]
- Hamrock, B.J.; Dowson, D. Ball Bearing Lubrication; John Wiley & Sons: New York, Chichester, Brisbane, Toronto, Singapore, USA, 1981; p. 386. [Google Scholar]
- Tylczak, J.H. Abrasive wear. ASM Handbook—Friction, Lubrication, and Wear Technology; ASM International: Almere, Netherlands, 1992; Volume 18, pp. 184–190. [Google Scholar]
- Marinescu, I.; Rowe, W.; Dimitrov, B.; Inaski, I. Tribology of Abrasive Machining Processes; Elsevier Science: Amsterdam, Netherlands, 2004; p. 751. [Google Scholar]
- Moon, M. How clean are your lubricants? Trends in Food Science and Technology. 2007, 18, 74–88. [Google Scholar] [CrossRef]
- Watanabe, S.; Saki, K.; Asanabe, S.; Fukutomi, M. Evaluation of Wear Life of Journal Bearings by Contaminated Oils. Proc. JSLE International Tribology Conference, Tokyo, Japan; 1985. [Google Scholar]
- Dwyer-Joyce, R.S.; Sayles, R.S.; Ioannides, E. An investigation into the mechanisms of closed three-body abrasive wear. Wear. 1994, 175, 133–142. [Google Scholar] [CrossRef]
- Dwyer-Joyce, R.S.; Hamer, J.C.; Sayles, R.S.; Ioannides, E. Surface Damage Effects Caused by Debris in Rolling Bearing Lubricants with a Particular Emphasis on Friable Debris Materials, Rolling Element Bearings - towards the 21st Century, Mechanical Engineering Publications for the Institution of Mechanical Engineers, London, United Kingdom, 1990, pp. 1–8.
- Dwyer-Joyce, R.S.; Hamer, J.C.; Sayles, R.S.; Ioannides, E. Lubricant Screening for Debris Effects to Improve Fatigue and Wear Life. In Wear Particles - from Dwyer-Joyce, Sayles, Ioannides page 20 the cradle to the grave, Proceedings of 18th Leeds-Lyon Symposium on Tribology, Leeds, United Kingdom, 1991; Dowson, D., Taylor, C.,M., Godet, M.; Elsevier: Amsterdam, Netherlands 57–53.
- Sayles, R.S. Debris and roughness in machine element contacts: some current and future engineering implications. Proceedings of the Institution of Mechanical Engineers, Part J: Journal of Engineering Tribology. 1995, 3, 149–172. [Google Scholar] [CrossRef]
- Dwyer-Joyce, R. S. The effects of lubricant contamination on rolling bearing performance. PhD Thesis, Imperial College, London, United Kingdom, 1993. [Google Scholar]
- Beghini, E.; Dwyer-Joyce, R. S.; Iaannides, E.; Jacobson, B.; Lubrecht, A.A.; Tripp, J.H. Elastic/plastic contact and endurance life prediction. J. Phys. D: Appl. Phys. 1992, 5, A379–A383. [Google Scholar] [CrossRef]
- Eleftberakis, J.G.; Khalil, A. Development of a laboratory test contaminant for transmissions. SAE technical paper 1990. [Google Scholar]
- Loewenthal, S.H.; Moyer, D.W. Filtration effects in ball bearing life and conditions in a contaminated lubricant. Journal of Lubrication Technology. 1979, 2, 171–176. [Google Scholar] [CrossRef]
- Stachowiak, A.; Zwierzycki, W. Delamination wear of steel AISI 304 in tribocorrosive conditions. Tribologia. 2010, 5, 315–322. [Google Scholar]
- Fleming, J.R.; Suh, N.P. Mechanics of crack propagation in delamination wear. Wear 1977, 44, 39–56. [Google Scholar] [CrossRef]
- Szczerek, M.; Wiśniewski, M. Tribologia i tribotechnika; Polskie Towarzystwo Tribologiczne, Instytut Technologii Eksploatacji, Stowarzyszenie Inżynierów i Techników mechaników Polskich, Poland, Radom, 2000; pp. 15–19.
- Jonczy, I.; Wieczorek, A.; Filipowicz, K.; Mucha, K.; Kuczaj, M.; Pawlikowski, A.; Nuckowski, P.; Pieczora, E. Impact Identification of Carbon-Containing Carboniferous Clays on Surfaces of Friction Nodes. Energies. 2021, 14. [Google Scholar] [CrossRef]
- Jonczy, I.; Wieczorek, A.N.; Podwórny, J.; Gerle, A.; Staszuk, M.; Szweblik, J. Characteristics of hard coal and its mixtures with water subjected to friction. Gospod. Surowcami Miner. Miner. Resour. Manag. 2020, 36, 185–201. [Google Scholar]
- Wieczorek, A.N.; Jonczy, I.; Bala, P.; Stankiewicz, K.; Staszuk, M. Testing the Wear Mechanisms of the Components of Machines Used in Fossil Energy Resource Extraction. Energies. 2021, 14, 1–20. [Google Scholar] [CrossRef]
- Wieczorek, A.N.; Jonczy, I.; Filipowicz, K.; Kuczaj, M.; Pawlikowski, A.; Łukowiec, D.; Staszuk, M.; Gerle, A. Study of the Impact of Coals and Claystones on Wear-Resistant Steels. Materials. 2023, 16, 1–19. [Google Scholar] [CrossRef]
- Wieczorek, A.N. (Faculty of Mining, Safety Engineering and Industrial Automation, Silesian University of Technology, Gliwice, Poland). Raport BK – 273RG-2/2015, Wpływ zanieczyszczeń o pochodzeniu węglowym na zużywanie się powierzchni smarowanych, 2015, (Unpublished work).
- Wieczorek, A.N. Analysis of lubrication conditions for angle planetary gearboxes applied in mining scraper conveyors. Scientific Journal of Silesian University of Technology. Series Transport. 2018, 98, 191–199. [Google Scholar] [CrossRef]
- Mendoza, F.C. (Kazimierz Pułaski University of Technology and Humanities in Radom, Radom, Poland). The analysis of changes in oils used for lubrication of gears in coal mines, 2017, (Unpublished work).
- Ostrikov, V.; Tupotilov, N.; Kornev, A. Effect of carbon contaminants on the lubricity of motor oils. Chemistry and Technology of Fuels and Oils. 2006, 6, 412–414. [Google Scholar] [CrossRef]
- Bölter, J. Auswirkungen von Ruß im Schmieröl von DI-Dieselmotoren auf das tribologische Verhalten und Tribomutationen von hochbelasteten Motorkomponenten. PhD Thesis, Technische Hochschule, Karlsruhe, Germany, 2010. [Google Scholar]
- Pang, X.; He, Y.; Chen, X.; Zhao, J.; Luo, X.; Lv, K. Research on Debris Characteristics and Wear Mechanism of Gear Material 18CrNiMo7-6 Used in Mining Reducer Under Dust-Contaminated Lubrication. Lubricants 2025, 13. [Google Scholar] [CrossRef]
- Tlotleng, M.T. Coal Characteristics that Lead to Abrasion during Grinding. Master’s Thesis, University of the Witwatersrand, Johannesburg, South Africa, 2011. [Google Scholar]
- Xia, R.; Li, B.; Wang, X.; Yang, Z.; Liu, L. Screening the Main Factors Affecting the Wear of the Scraper Conveyor Chute Using the Plackett–Burman Method. Hindawi Math. Probl. Eng. 2019, 2019. [Google Scholar]
- Yarali, O., Yasar, E., Bacak, G., and Ranjith, P.G. A study of rock abrasivity and tool wear in Coal Measures Rocks. International Journal of Coal Geology. 2008, 74, 53–66. [CrossRef]
- Shao, H.S.; Chen, H.H. Study on abrasive wear characteristics of coal. J. China Coal Soc. 1983, 12, 97–100. [Google Scholar]
- Shi, Z.; Zhu, Z. Case study: Wear analysis of the middle plate of a heavy-load scraper conveyor chute under a range of operating conditions. Wear. 2017, 380-381, 36–41. [Google Scholar] [CrossRef]
- Terva, J., Teeri, T., Kuokkala, V.T., Siitonen, P., Liimatainen, J. Abrasive wear of steel against gravel with different rock–steel combinations. Wear. 2009, 267, 1821–1831. [CrossRef]
- Wang, S.; Ge, Q., and Wang, J. The impact wear-resistance enhancement mechanism of medium manganese steel and its applications in mining machines. Wear. 2017, 376-377, 1097–1104. [CrossRef]
- Labaš, M.; Krepelka, F.; Ivaničová, L. Assessment of abrasiveness for research of rock cutting. Acta Montanica. 2012, 17, 65–73. [Google Scholar]
- Ngoy, E.K.; Mulaba-Bafunbiandi, A.F. An analytical model of coal abrasiveness index in function of the mineral composition of coal. In Proceedings of the International Conference on Chemical and Environmental Engineering, Johannesburg, South Africa; 2013; 79–83. [Google Scholar]
- Wells, J.J.; Wigley, F.; Foster, D.J.; Gibb, W.H.; Williamson, J. The relationship between excluded mineral matter and the abrasion index of a coal. Fuel. 2004, 83, 359–364. [Google Scholar] [CrossRef]
- Wells, J.J.; Wigley, F.; Foster, D.J.; Livingston, W.R.; Gibb, W.H.; Williamson, J. The nature of mineral matter in a coal and the effects on erosive and abrasive behaviour. Fuel Process. Technology. 2005, 86, 535–550. [Google Scholar] [CrossRef]
- Petrica, M.; Badisch, E.; Peinsitt, T. Abrasive wear mechanisms and their relation to rock properties. Wear. 2013, 308, 86–94. [Google Scholar] [CrossRef]
- Nikas, GK. Theoretical modelling of the entrainment and thermomechanical effects of contamination particles in elastohydrodynamic contacts. PhD Thesis, Imperial College London, London, England, 1999. [Google Scholar]
- Nikas, G.K. Mathematical analysis of the entrapment of solid spherical particles in non-conformal contacts. ASME Journal of Tribology. 2001, 123, 83–93. [Google Scholar] [CrossRef]
- Nikas, G.K. Particle Entrapment in Line Elastohydrodynamic Contacts and the Influence of Intermolecular (van der Waals) Forces. Lubricants. 2020, 8. [Google Scholar] [CrossRef]
- Nikas, GK. Review of studies on the detrimental effects of solid contaminants in lubricated machine element contacts. In Reliability engineering advances, Hayworthm, G. I.; Nova Science: New York, USA, 2009; Chapter 1; pp. 1–44. [Google Scholar]
- Spałek, J. Problemy inżynierii smarowania maszyn w górnictwie; Wydawnictwo Politechniki Śląskiej: Gliwice, Poland, 2003. [Google Scholar]
- Myszka, D.; Skołek, E.; Wieczorek, A. Manufacture of Toothed Elements in Nanoausferritic Ductile Iron. Arch. Metall. Mater. 2014, 59, 1217–1221. [Google Scholar] [CrossRef]
- Wasiak, K.; Węsierska-Hinca, M.; Skołek, E.; Rożniatowski, K.; Wieczorek, A.; Świątnicki, W.A. Effect of austempering time on multiphase microstructure evolution and properties of carburized Cr-Mn-Si alloyed steel subjected to bainitization quenching & partitioning heat treatment. J. Alloys Compd. 2023, 966. [Google Scholar]
- PN-82/H- 04332 Testing the wear of metals or their diffusion layers in a sliding friction process under constant pressure using an Amsler machine.
- ISO/TR 15144-1:2014 (E) Calculation of micropitting load capacity of cylindrical spur and helical gears - Part 1: Introduction and basic principles.
- Gabzdyl, W. Geology of deposits, Wydawnictwo Politechniki Śląskiej: Gliwice, Poland, 1995, 1891.
- Jelonek, I.; Jelonek, Z.; Nocoń, A. Fuel quality assessment on the example of bituminous coal and wooden pellets. Górnictwo Odkrywkowe. 2018, 3, 69–77. [Google Scholar]
- Radoń, A.; Włodarczyk, P.; Łukowiec, D. Structure, Temperature and Frequency Dependent Electrical Conductivity of Oxidized and Reduced Electrochemically Exfoliated Graphite. Physica E: Low-Dimensional Systems and Nanostructures 2018, 99, 82–90. [Google Scholar] [CrossRef]
- Berkowitz, N. An Introduction to Coal Technology, 2nd ed; Academic Press: Cambridge, USA, 1994. [Google Scholar]
- Berkowitz, N. The Chemistry of Coal; Elsevier: Amsterdam, Netherlands, 1995. [Google Scholar]
- Van Krevelen, D.W. Coal. Elsevier Publishing Company: Amsterdam-London-New York-Princeton, Netherlands, 1961.
- Własności koksownicze węgla. Available online: http://www.polymer-carbon.ch.pwr.edu.pl/instrukcje/SNE_koksowanie.pdf (accessed on 24 April 2021).
- Petrica, M.; Peissl, S.; Badisch, E. Influence of coal on the wear behavior of steels in 3-body conditions. Key Eng. Mater. 2014, 604, 75–78. [Google Scholar] [CrossRef]
- Misiak, J. Petrographic composition and forms of bituminous coal lithotypes in the Upper Carboniferous Formations of the Upper Silesian Coal Basin. Gospodarka Surowcami Mineralnymi/Mineral Resources Management. 2017, 33, 109–120. [Google Scholar] [CrossRef]
- Xi, Y.; You, J.; Lu, L.; Wang, M.; Wang, J. Raman spectroscopic study of coal samples during heating. Applied Sciences. 2019, 9, 1–9. [Google Scholar] [CrossRef]
Figure 1.
Potential relationships between the minimum oil film thickness and the size of oil contaminating particles; based on [30].
Figure 1.
Potential relationships between the minimum oil film thickness and the size of oil contaminating particles; based on [30].
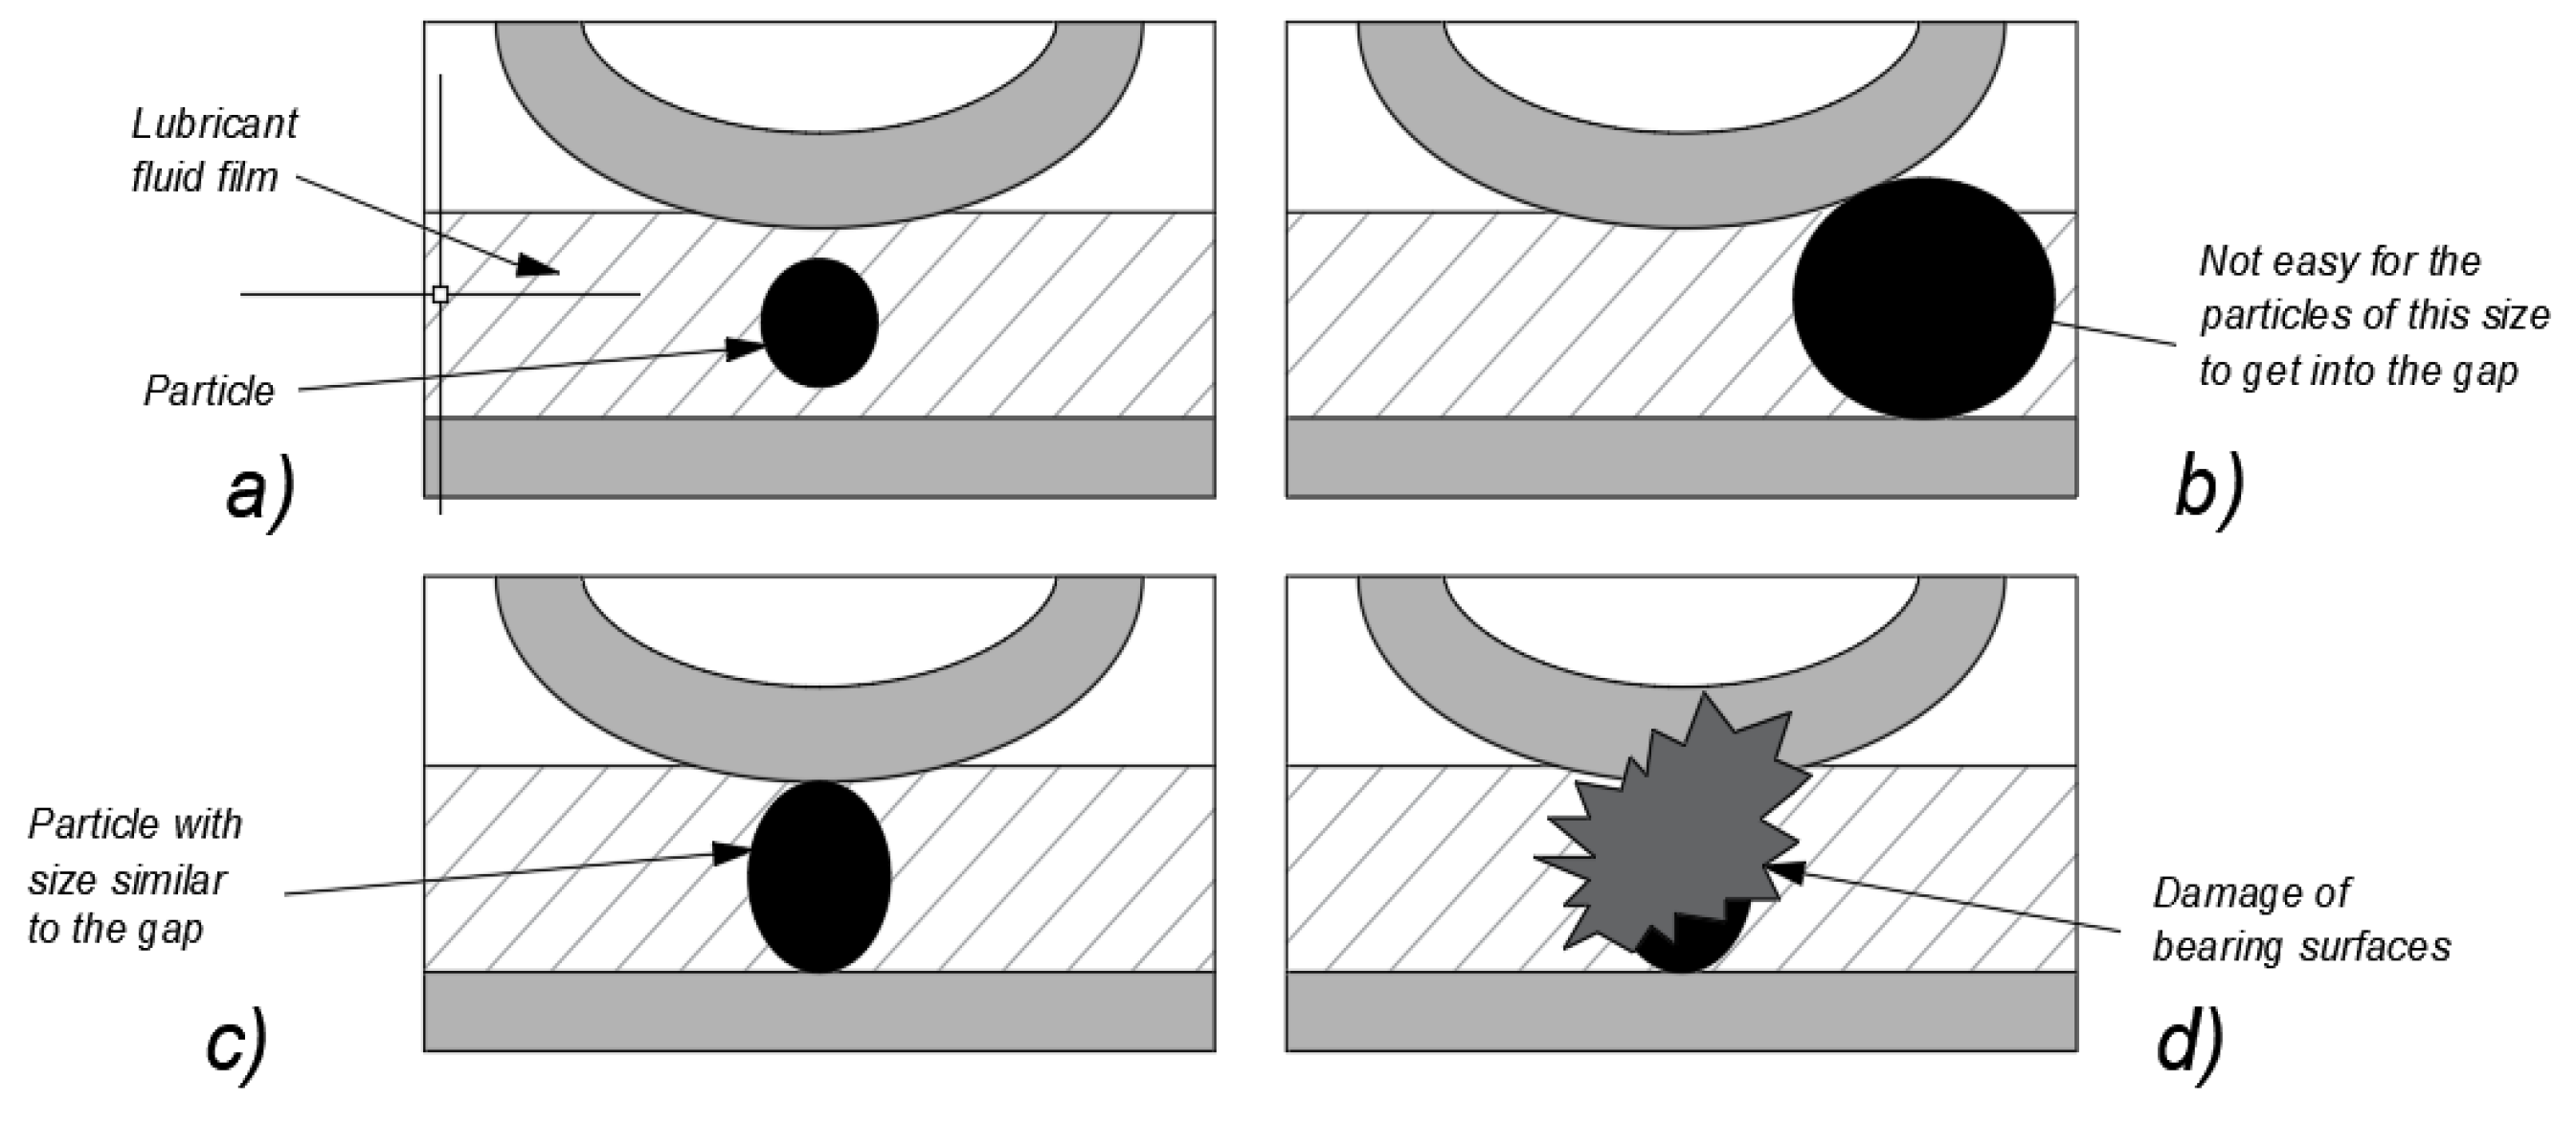
Figure 3.
Results of surface roughness measurements.
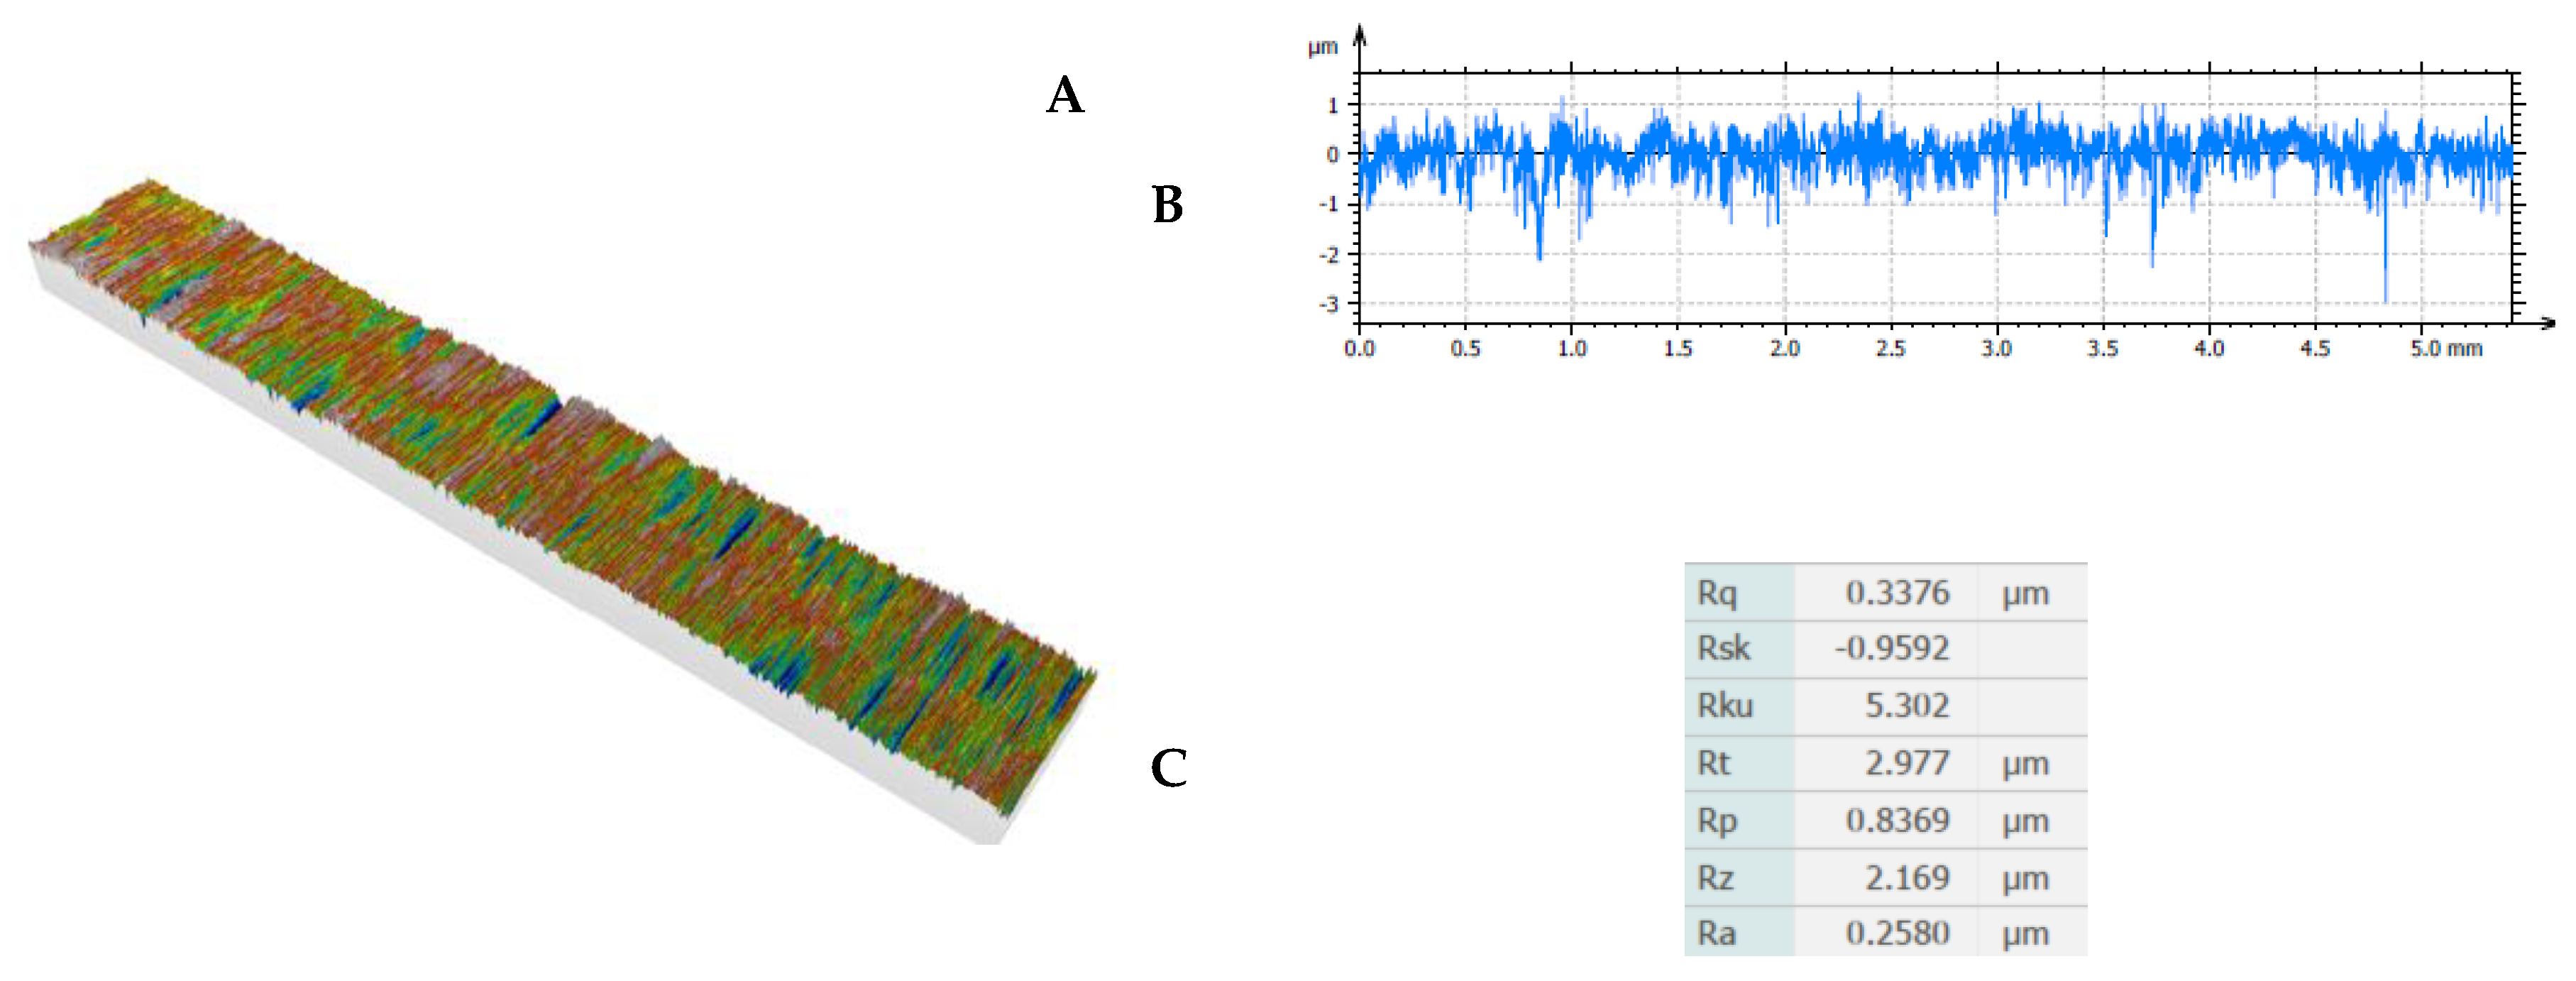
Figure 4.
XRD test results for the abrasives studied: A – coal with ash content of λp = 9.24%; B – coal with ash content of λp = 29.15%; C – coal with ash content of λp = 55.28%; D – claystone with ash content of λp = 89.78%; E – claystone with ash content of λp = 85.93%.
Figure 4.
XRD test results for the abrasives studied: A – coal with ash content of λp = 9.24%; B – coal with ash content of λp = 29.15%; C – coal with ash content of λp = 55.28%; D – claystone with ash content of λp = 89.78%; E – claystone with ash content of λp = 85.93%.
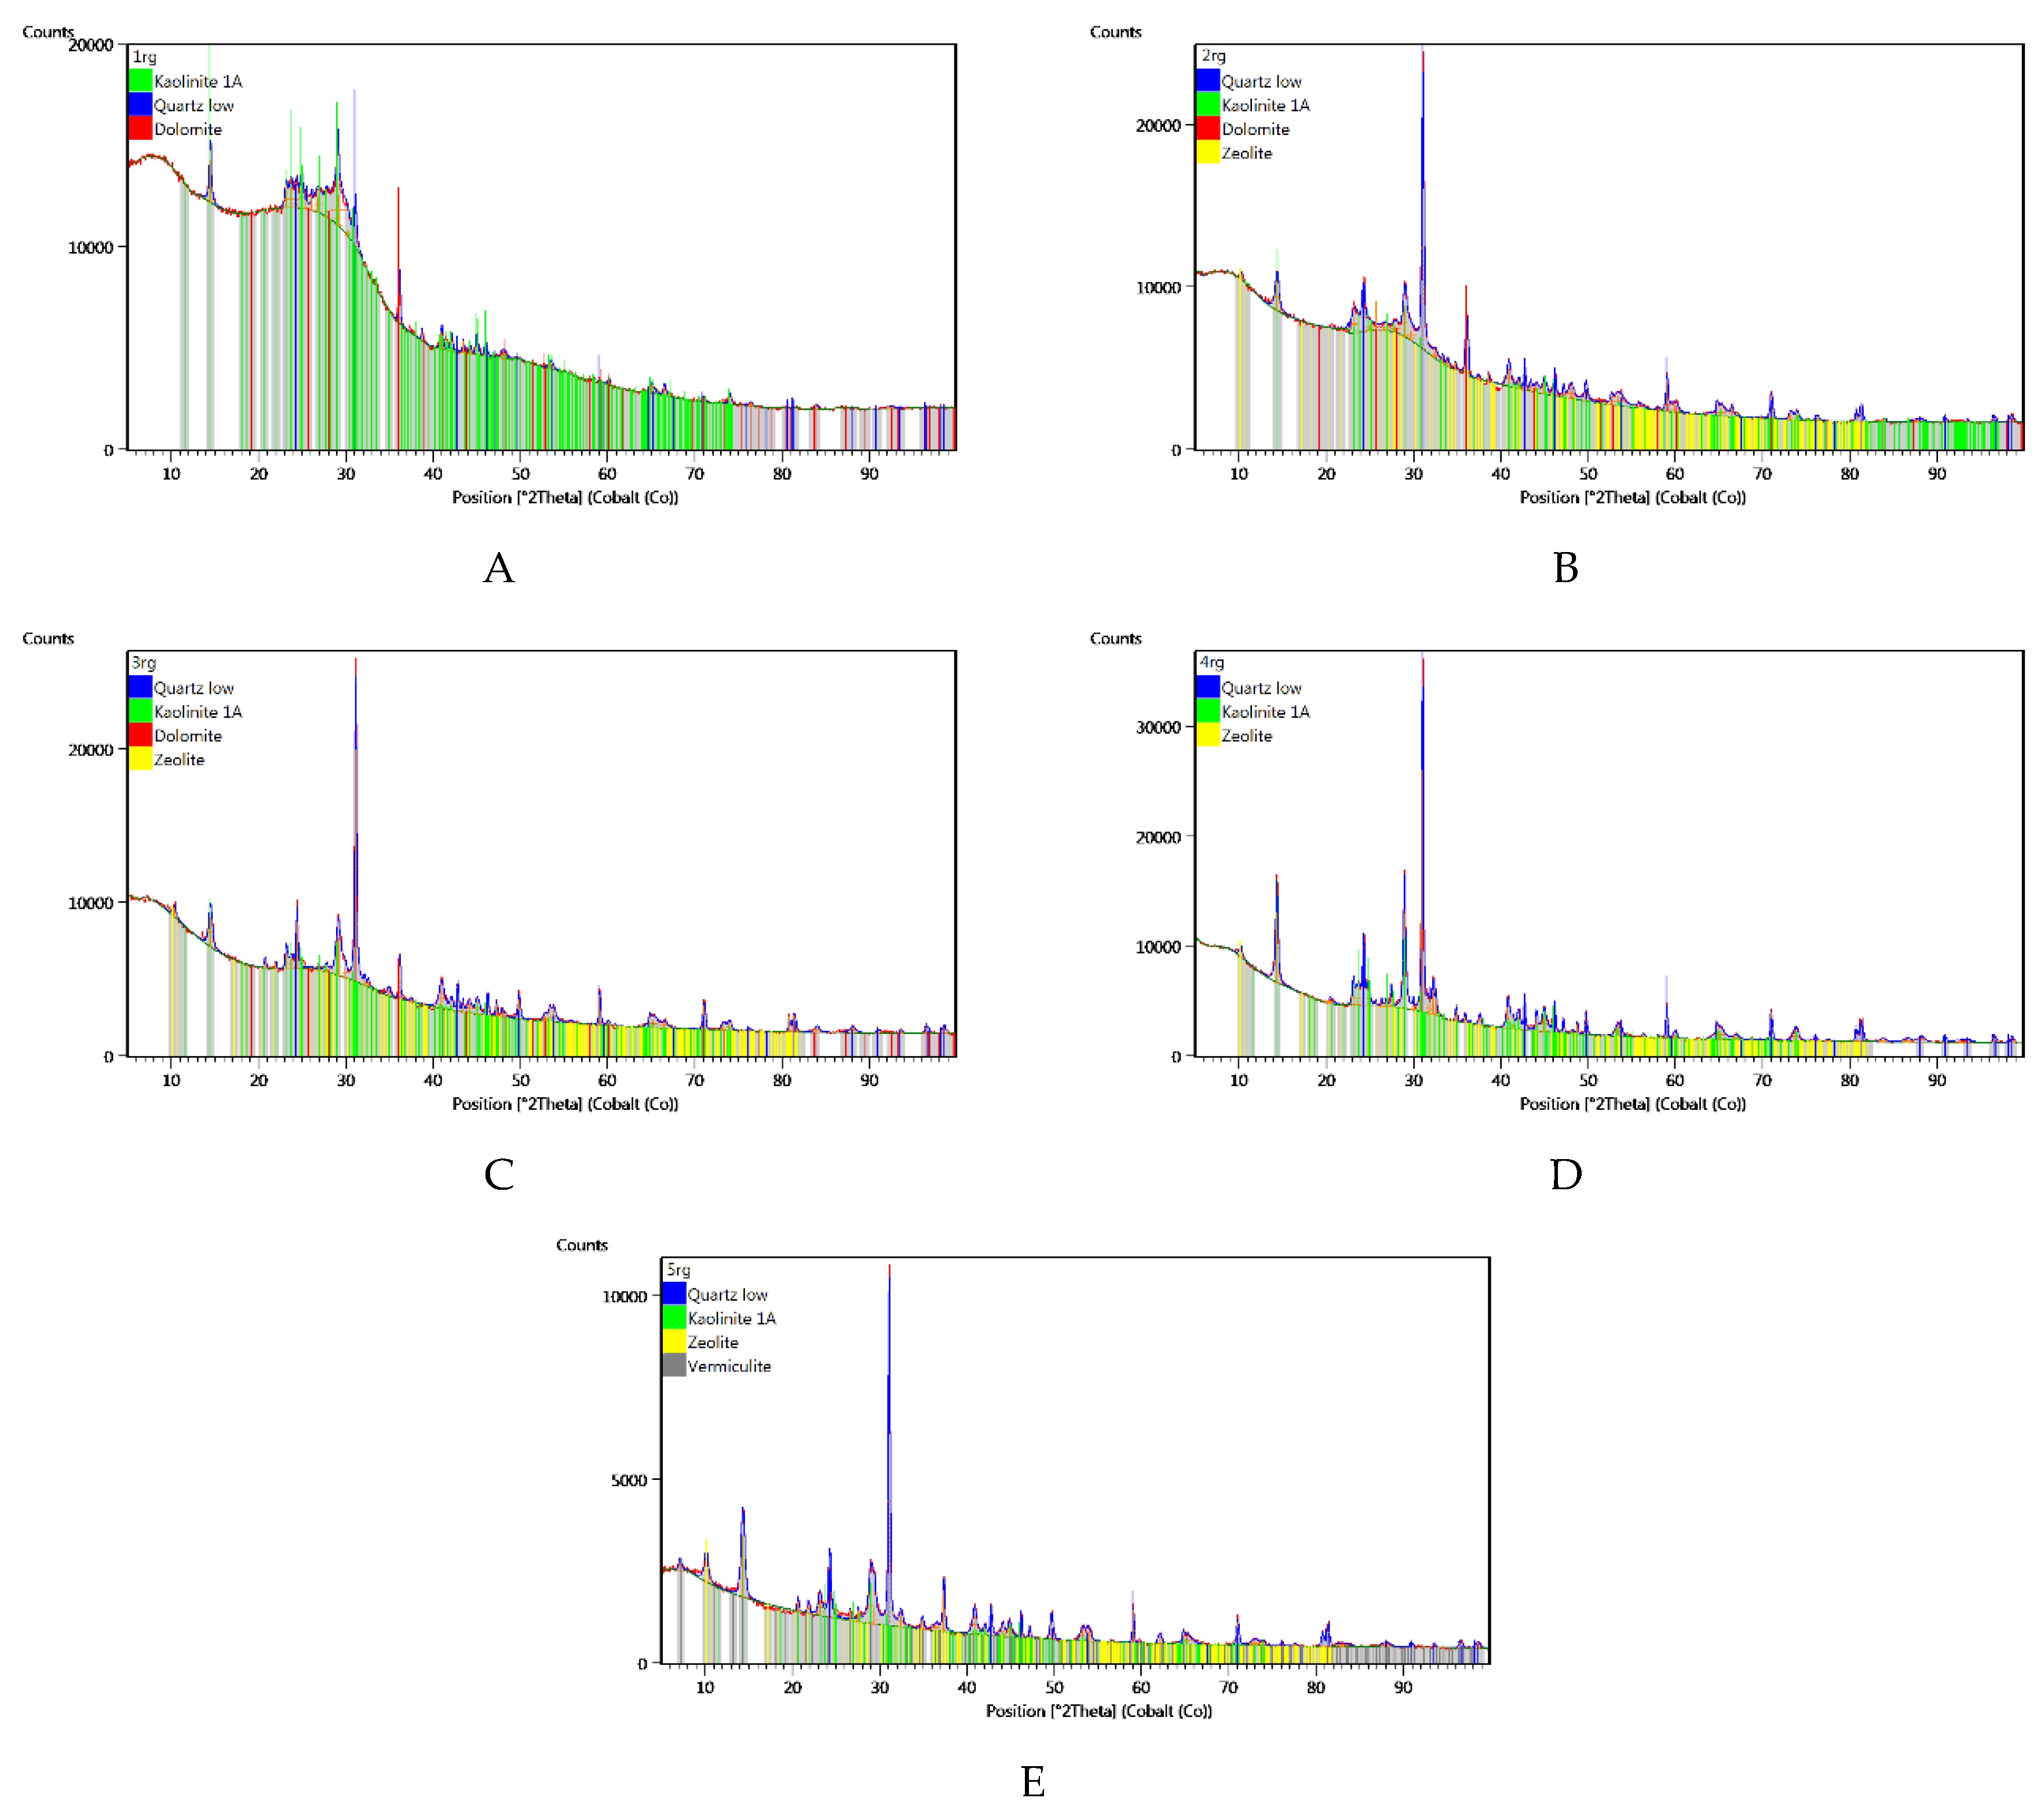
Figure 5.
Raman spectra of the abrasives studied: A – coal with ash content of λp = 9.24%; B – coal with ash content of λp = 29.15%; C – coal with ash content of λp = 55.28%; D – claystone with ash content of λp = 85,93%; E – claystone with ash content of λp = 89,78%.
Figure 5.
Raman spectra of the abrasives studied: A – coal with ash content of λp = 9.24%; B – coal with ash content of λp = 29.15%; C – coal with ash content of λp = 55.28%; D – claystone with ash content of λp = 85,93%; E – claystone with ash content of λp = 89,78%.
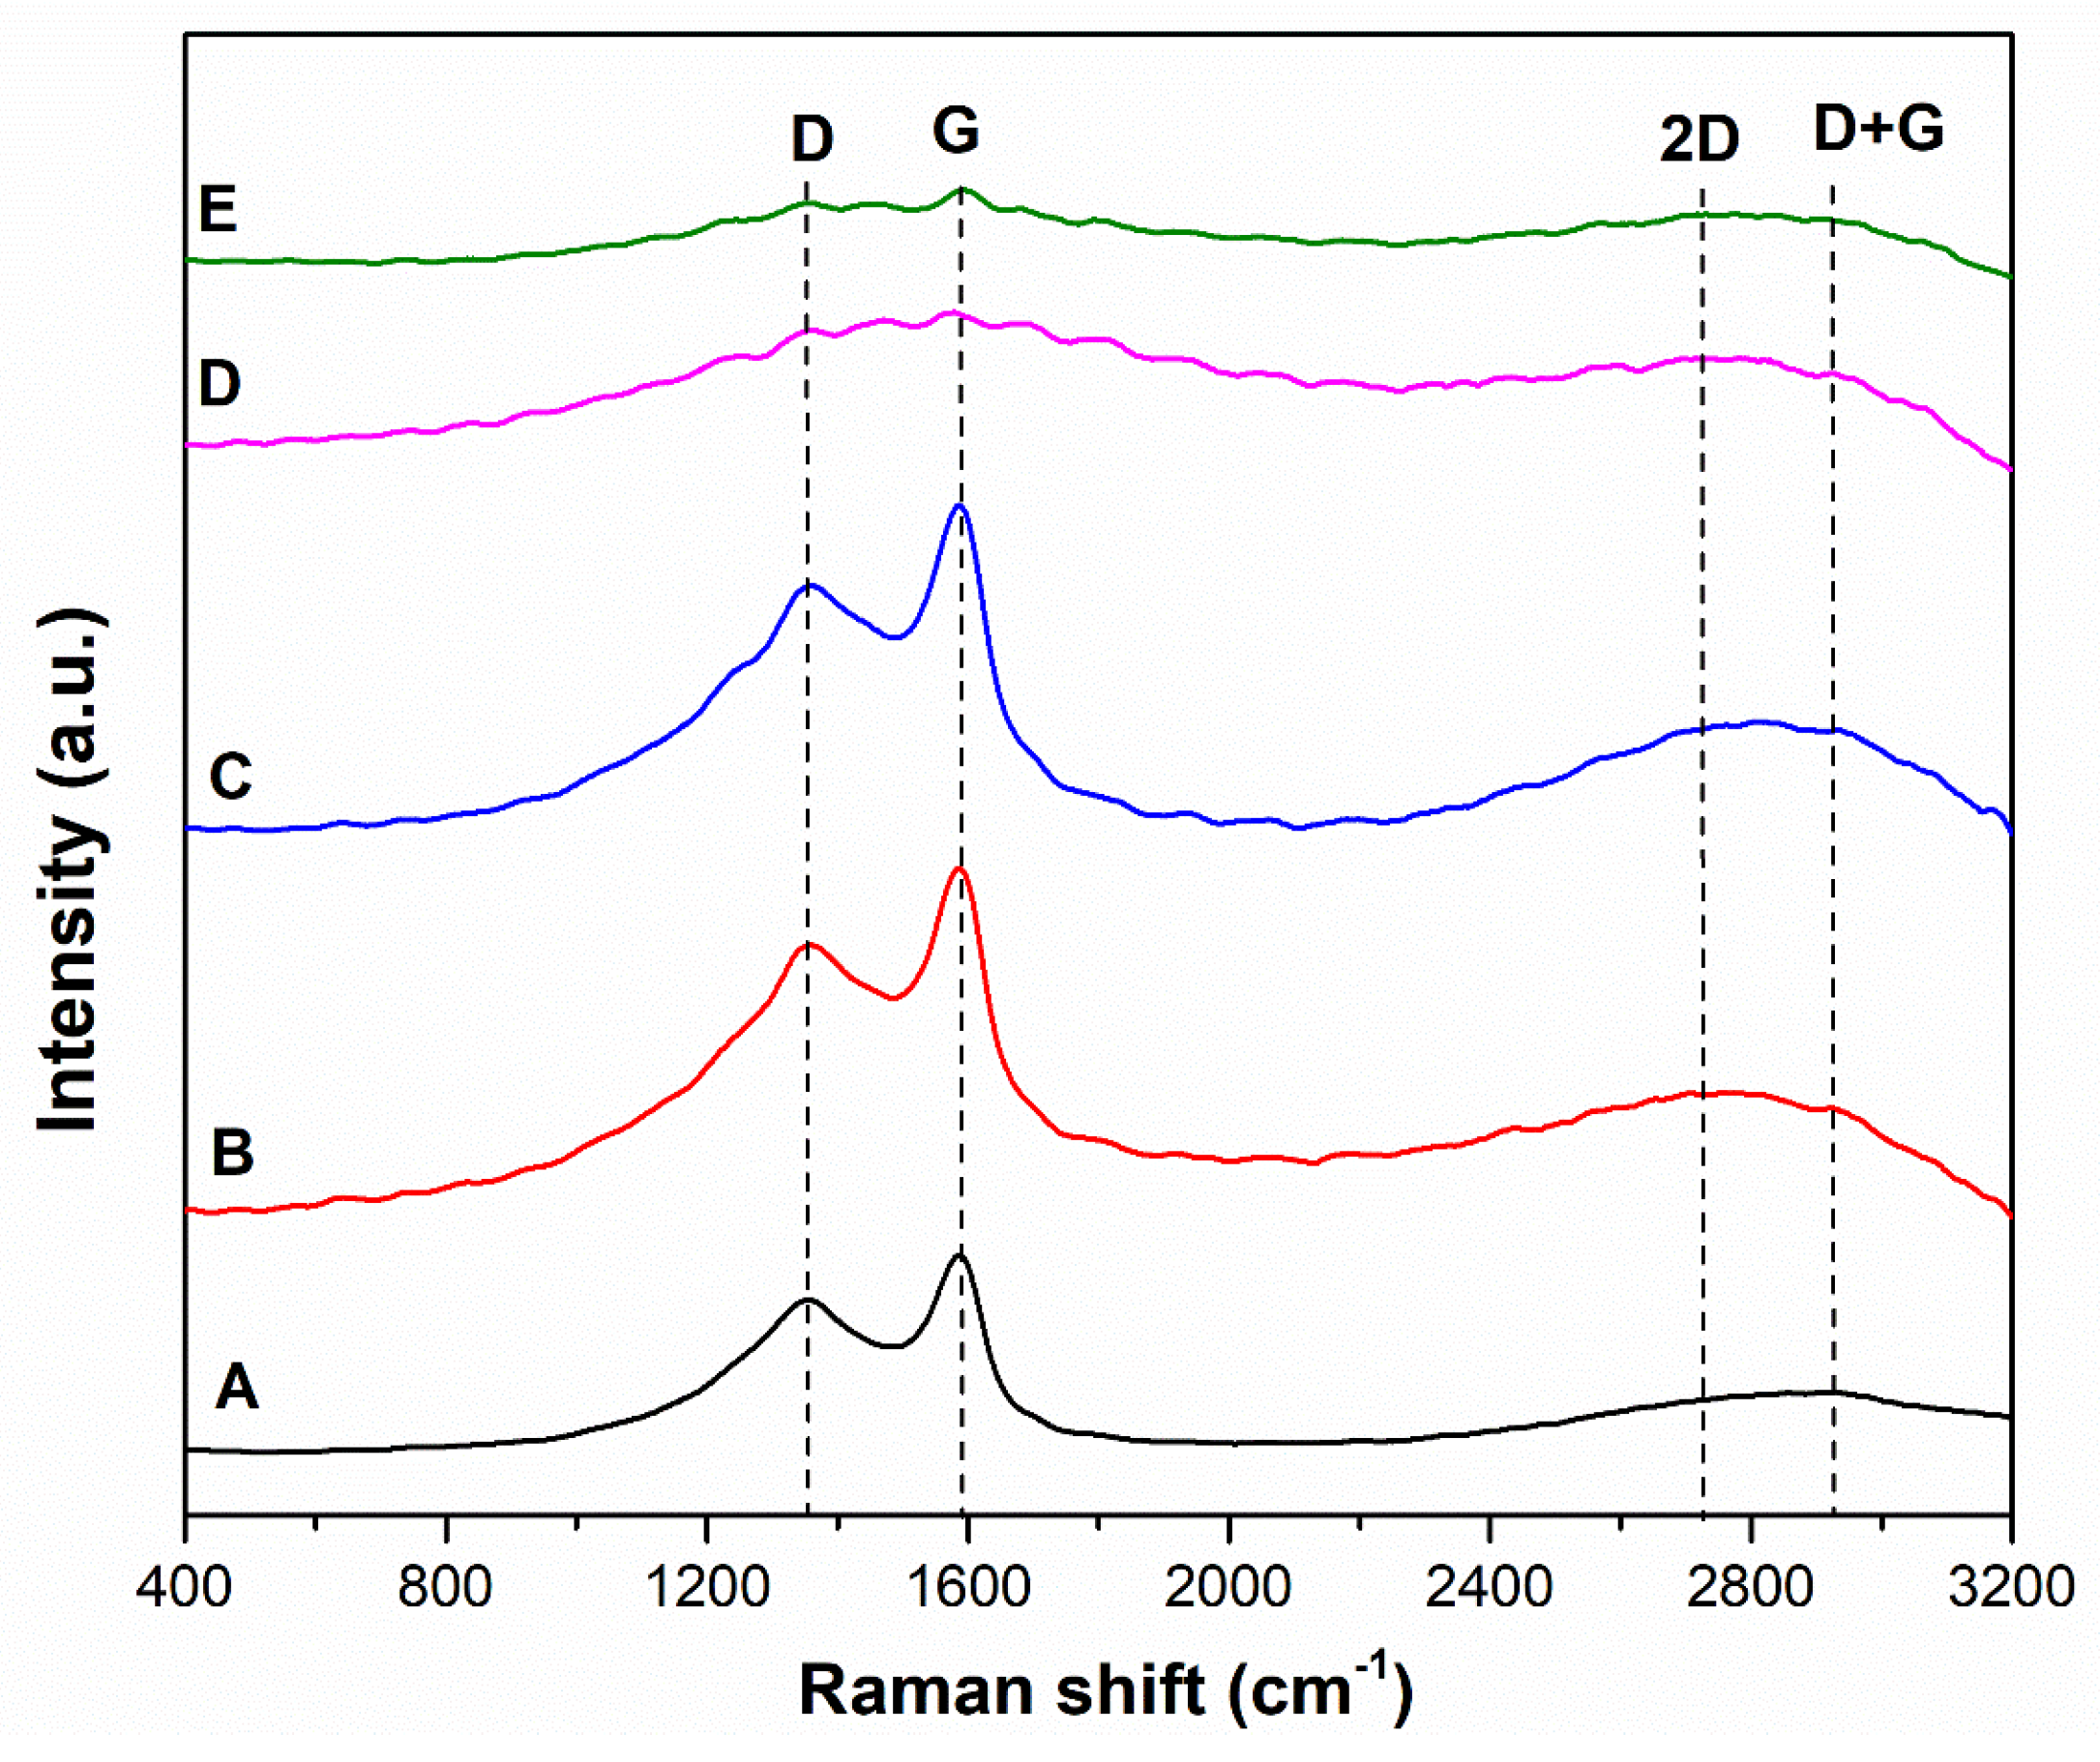
Figure 6.
Grains of the abrasives studied (SEM image): A – coal with ash content of λp = 9.24%; B – coal with ash content of λp = 29.15%; C – coal with ash content of λp = 55.28%; D – claystone with ash content of λp = 85.93%; E – claystone with ash content of λp = 89.78%.
Figure 6.
Grains of the abrasives studied (SEM image): A – coal with ash content of λp = 9.24%; B – coal with ash content of λp = 29.15%; C – coal with ash content of λp = 55.28%; D – claystone with ash content of λp = 85.93%; E – claystone with ash content of λp = 89.78%.

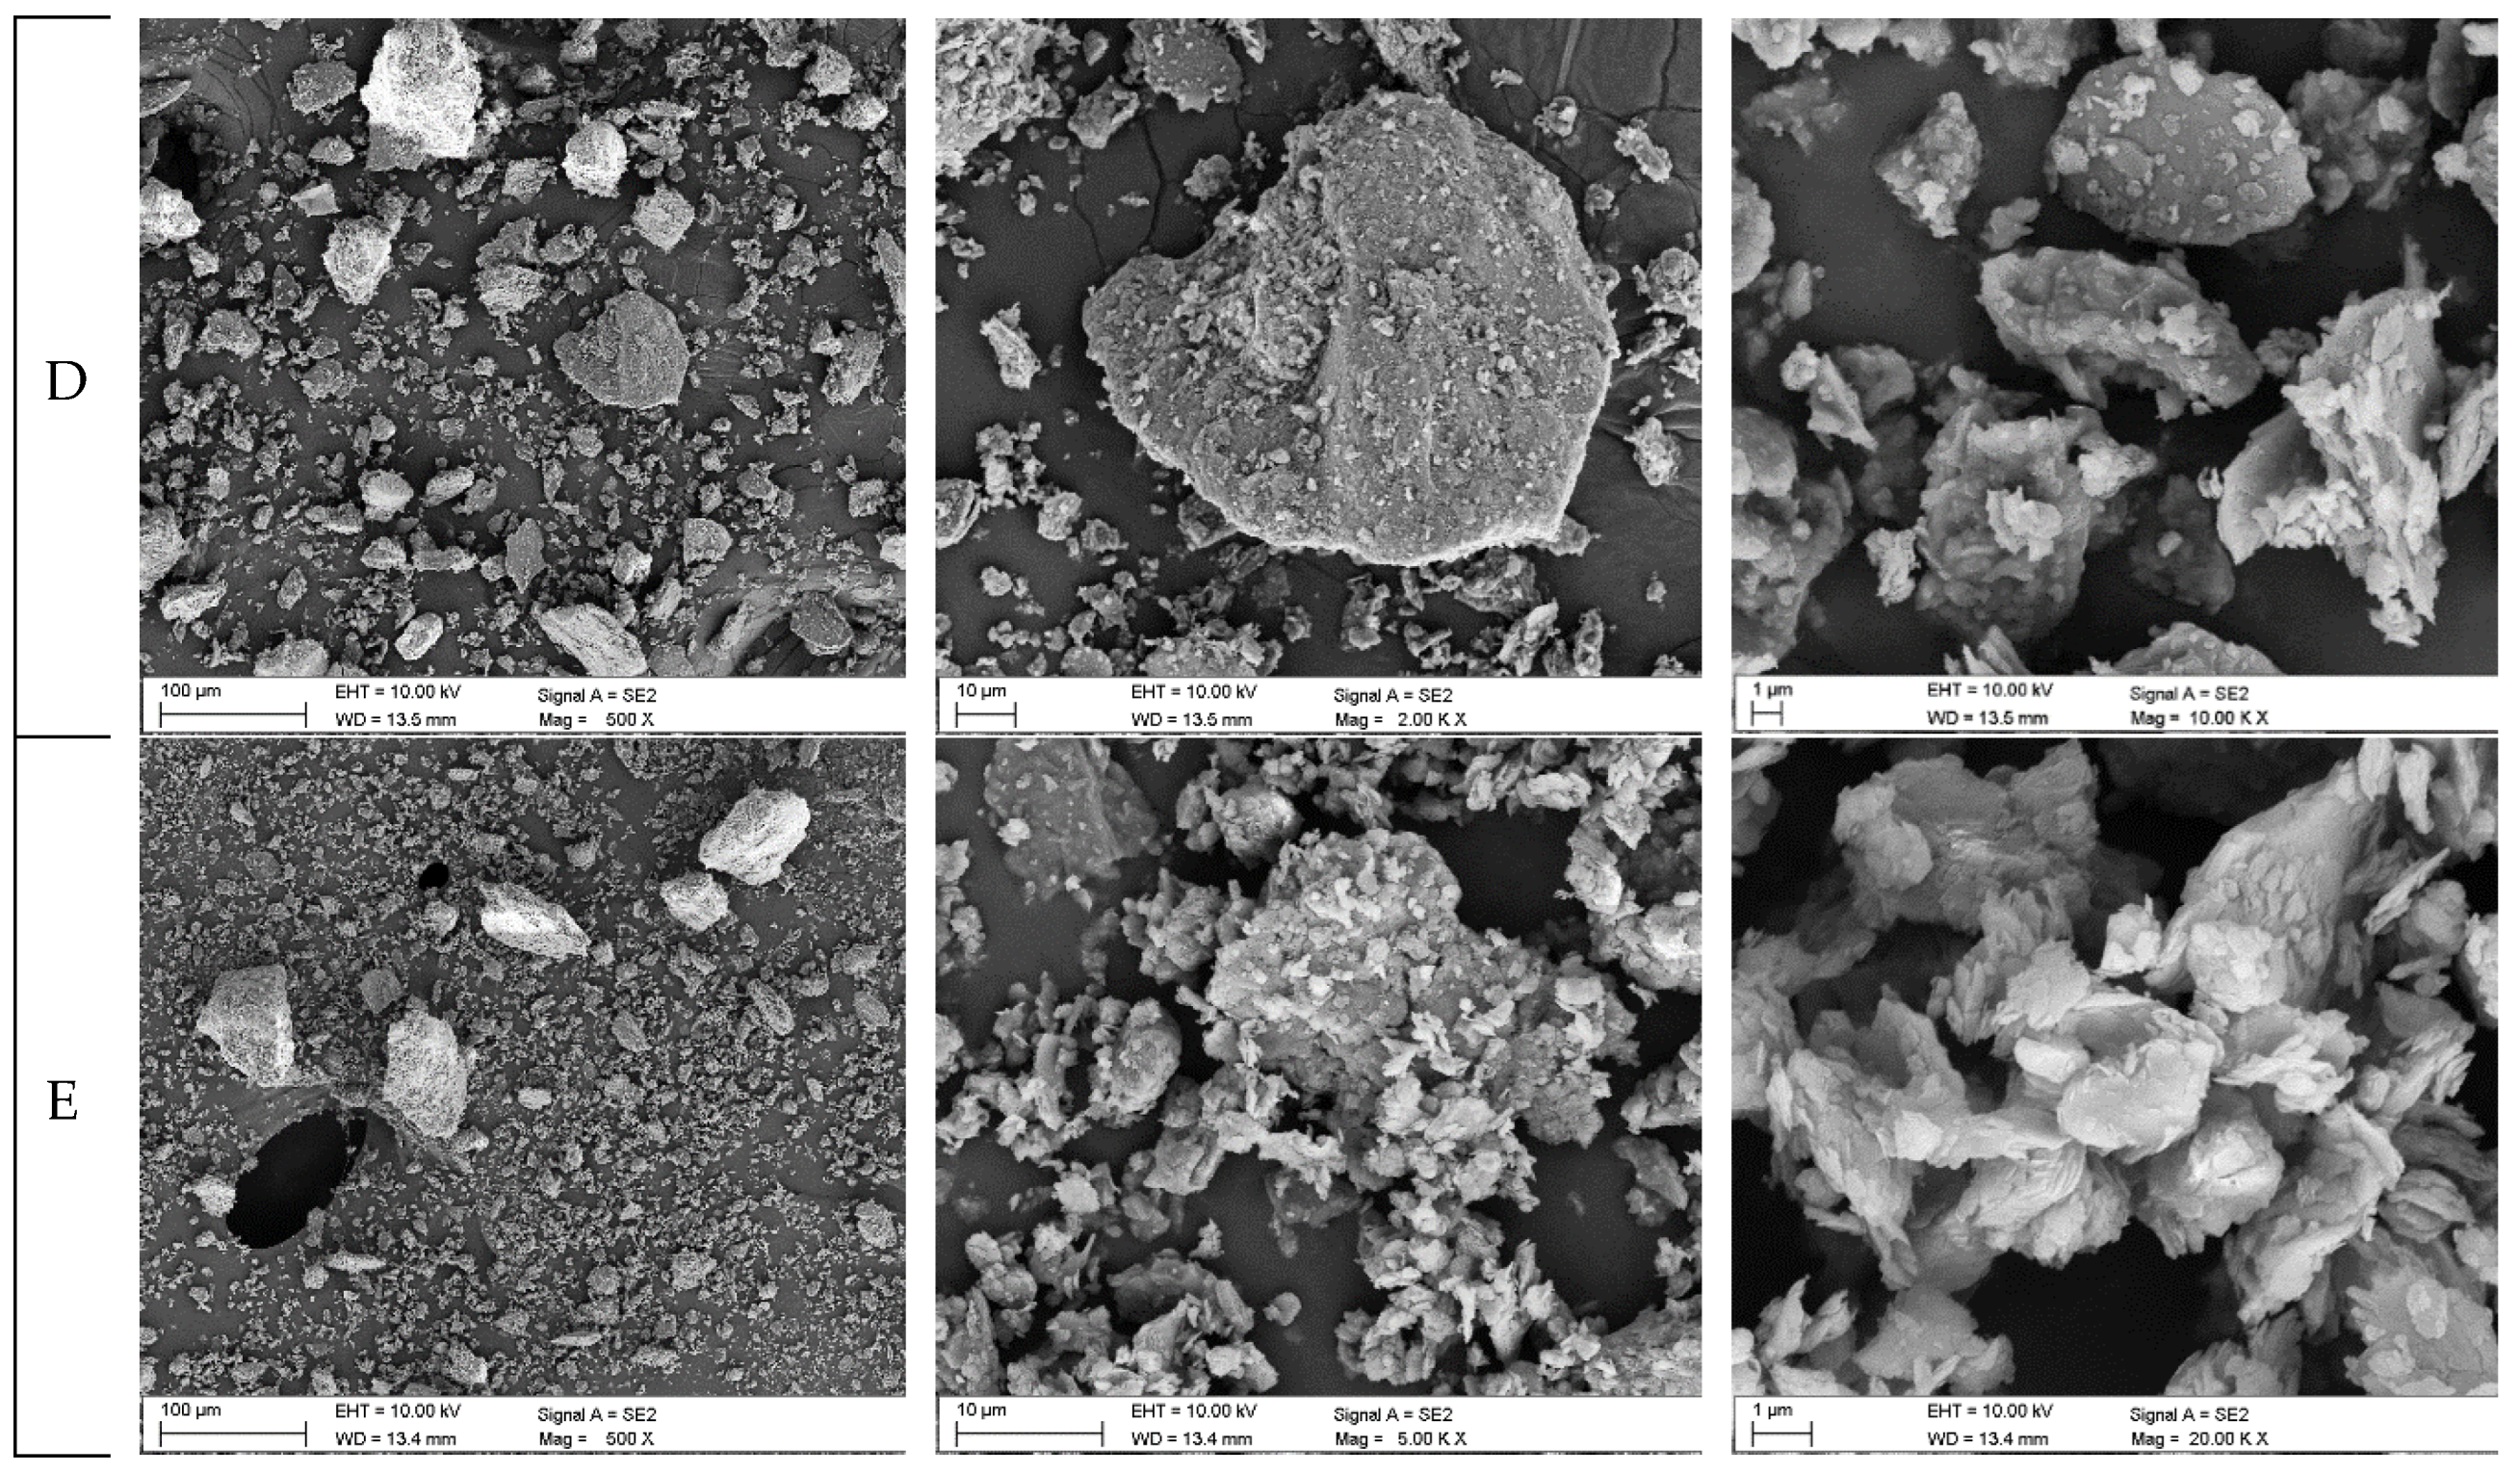
Figure 7.
Mass loss determined for samples lubricated with oils containing carbonaceous contaminants in a function of time.
Figure 7.
Mass loss determined for samples lubricated with oils containing carbonaceous contaminants in a function of time.
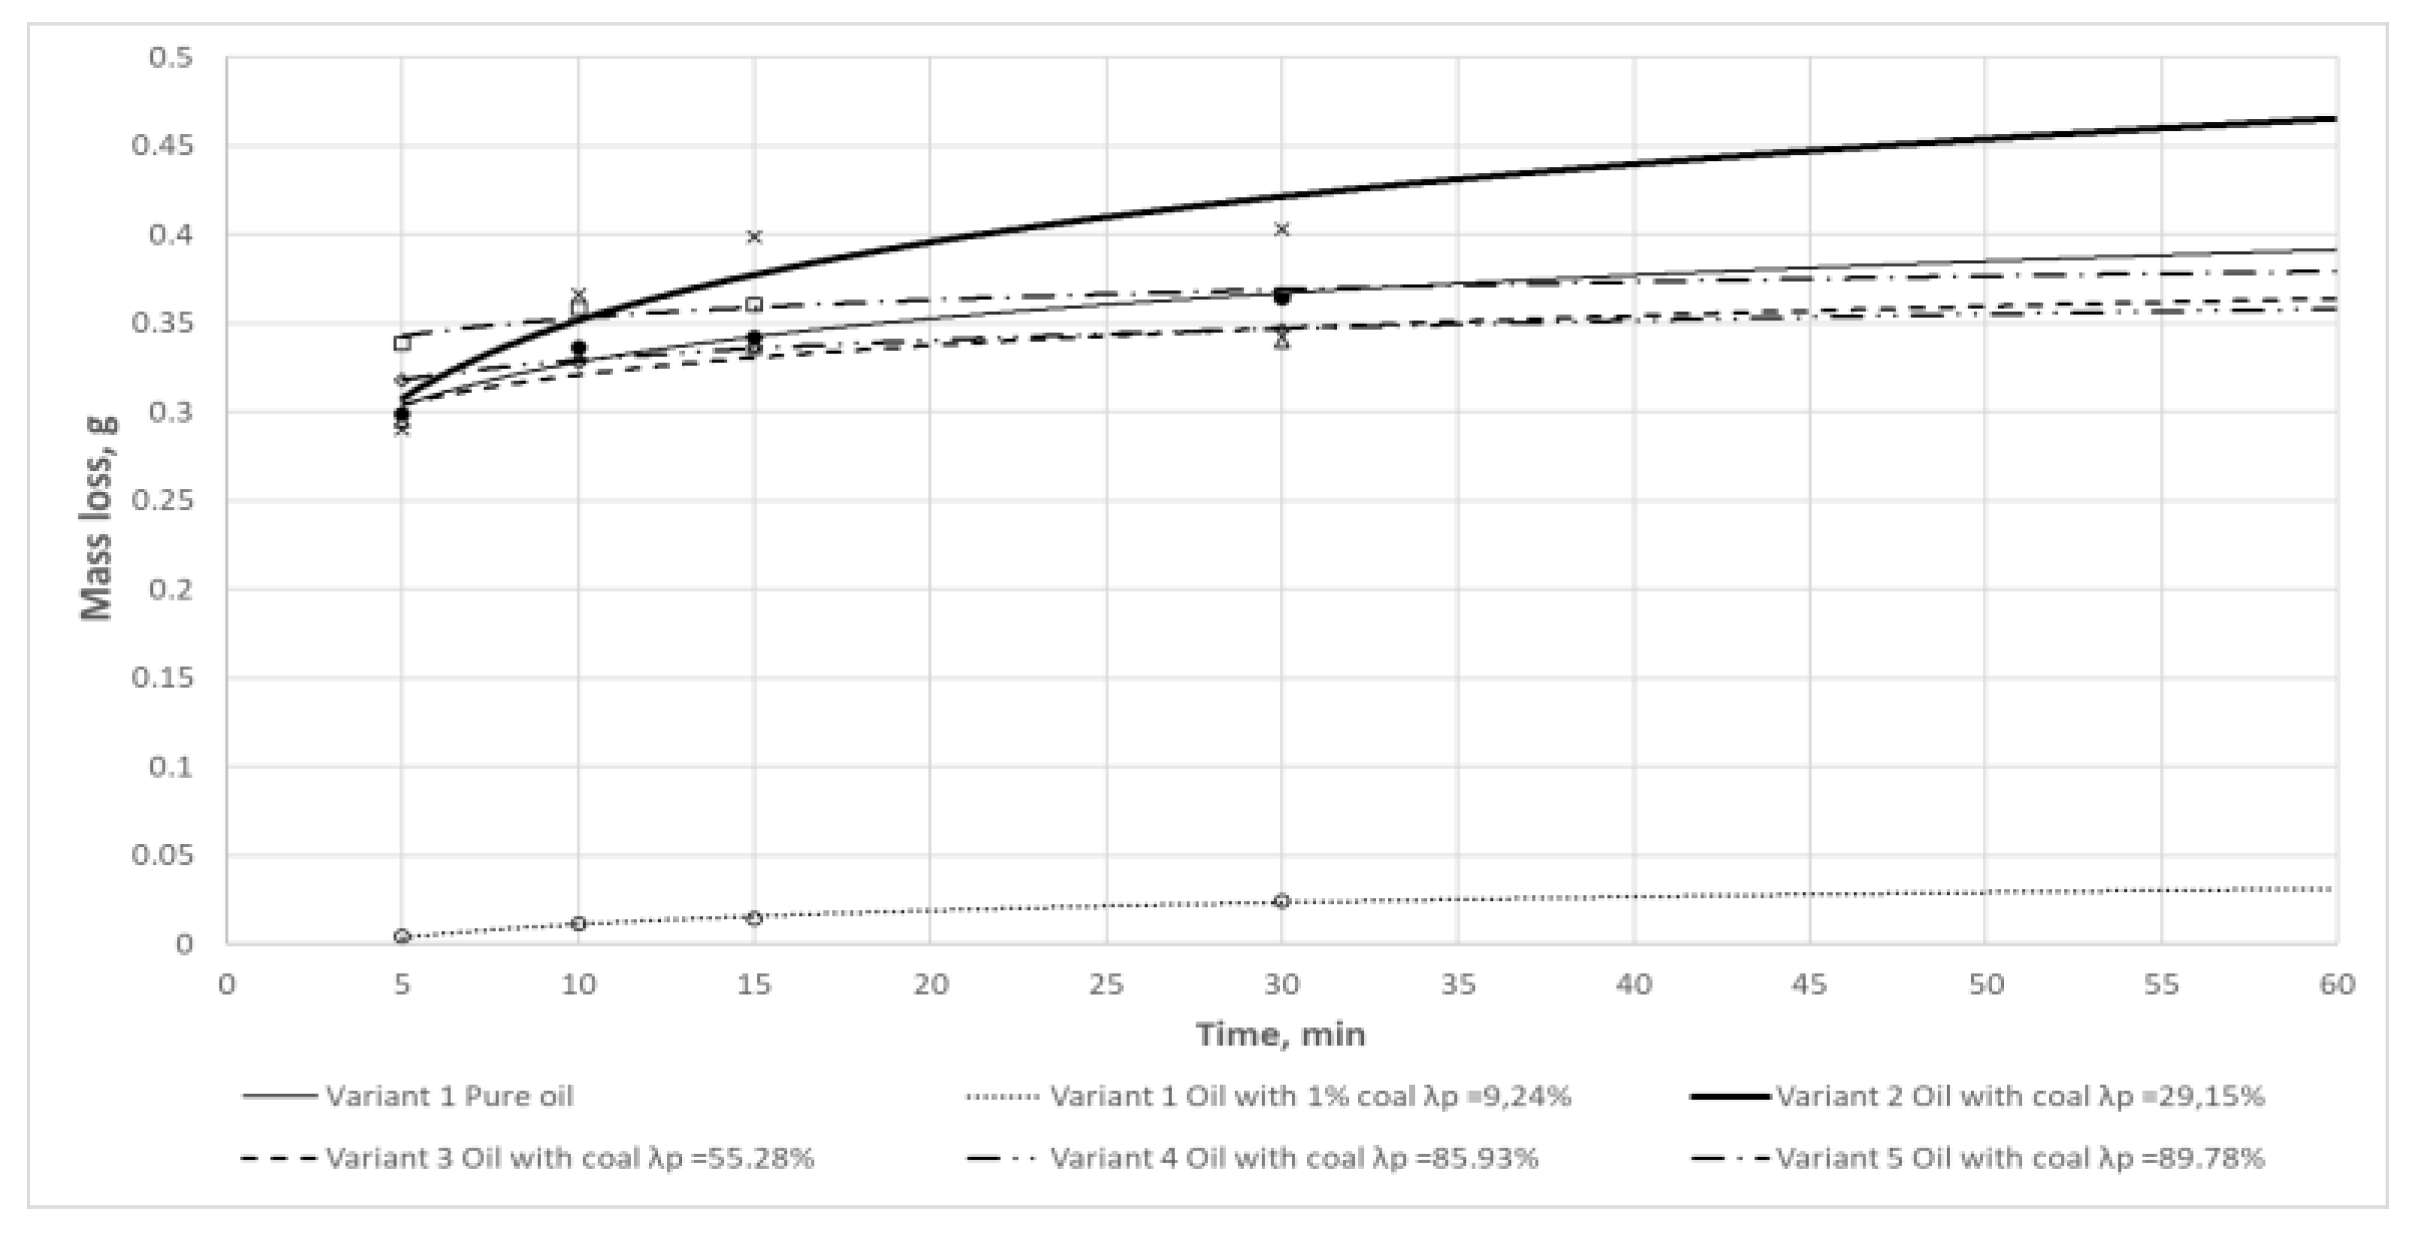
Figure 8.
Maximum mass loss values determined for the variants studied and the corresponding percentage share of non-combustible fraction λP in carbonaceous contaminants; the regression line takes into account the wear results obtained for Variants 0 and 2÷5.
Figure 8.
Maximum mass loss values determined for the variants studied and the corresponding percentage share of non-combustible fraction λP in carbonaceous contaminants; the regression line takes into account the wear results obtained for Variants 0 and 2÷5.
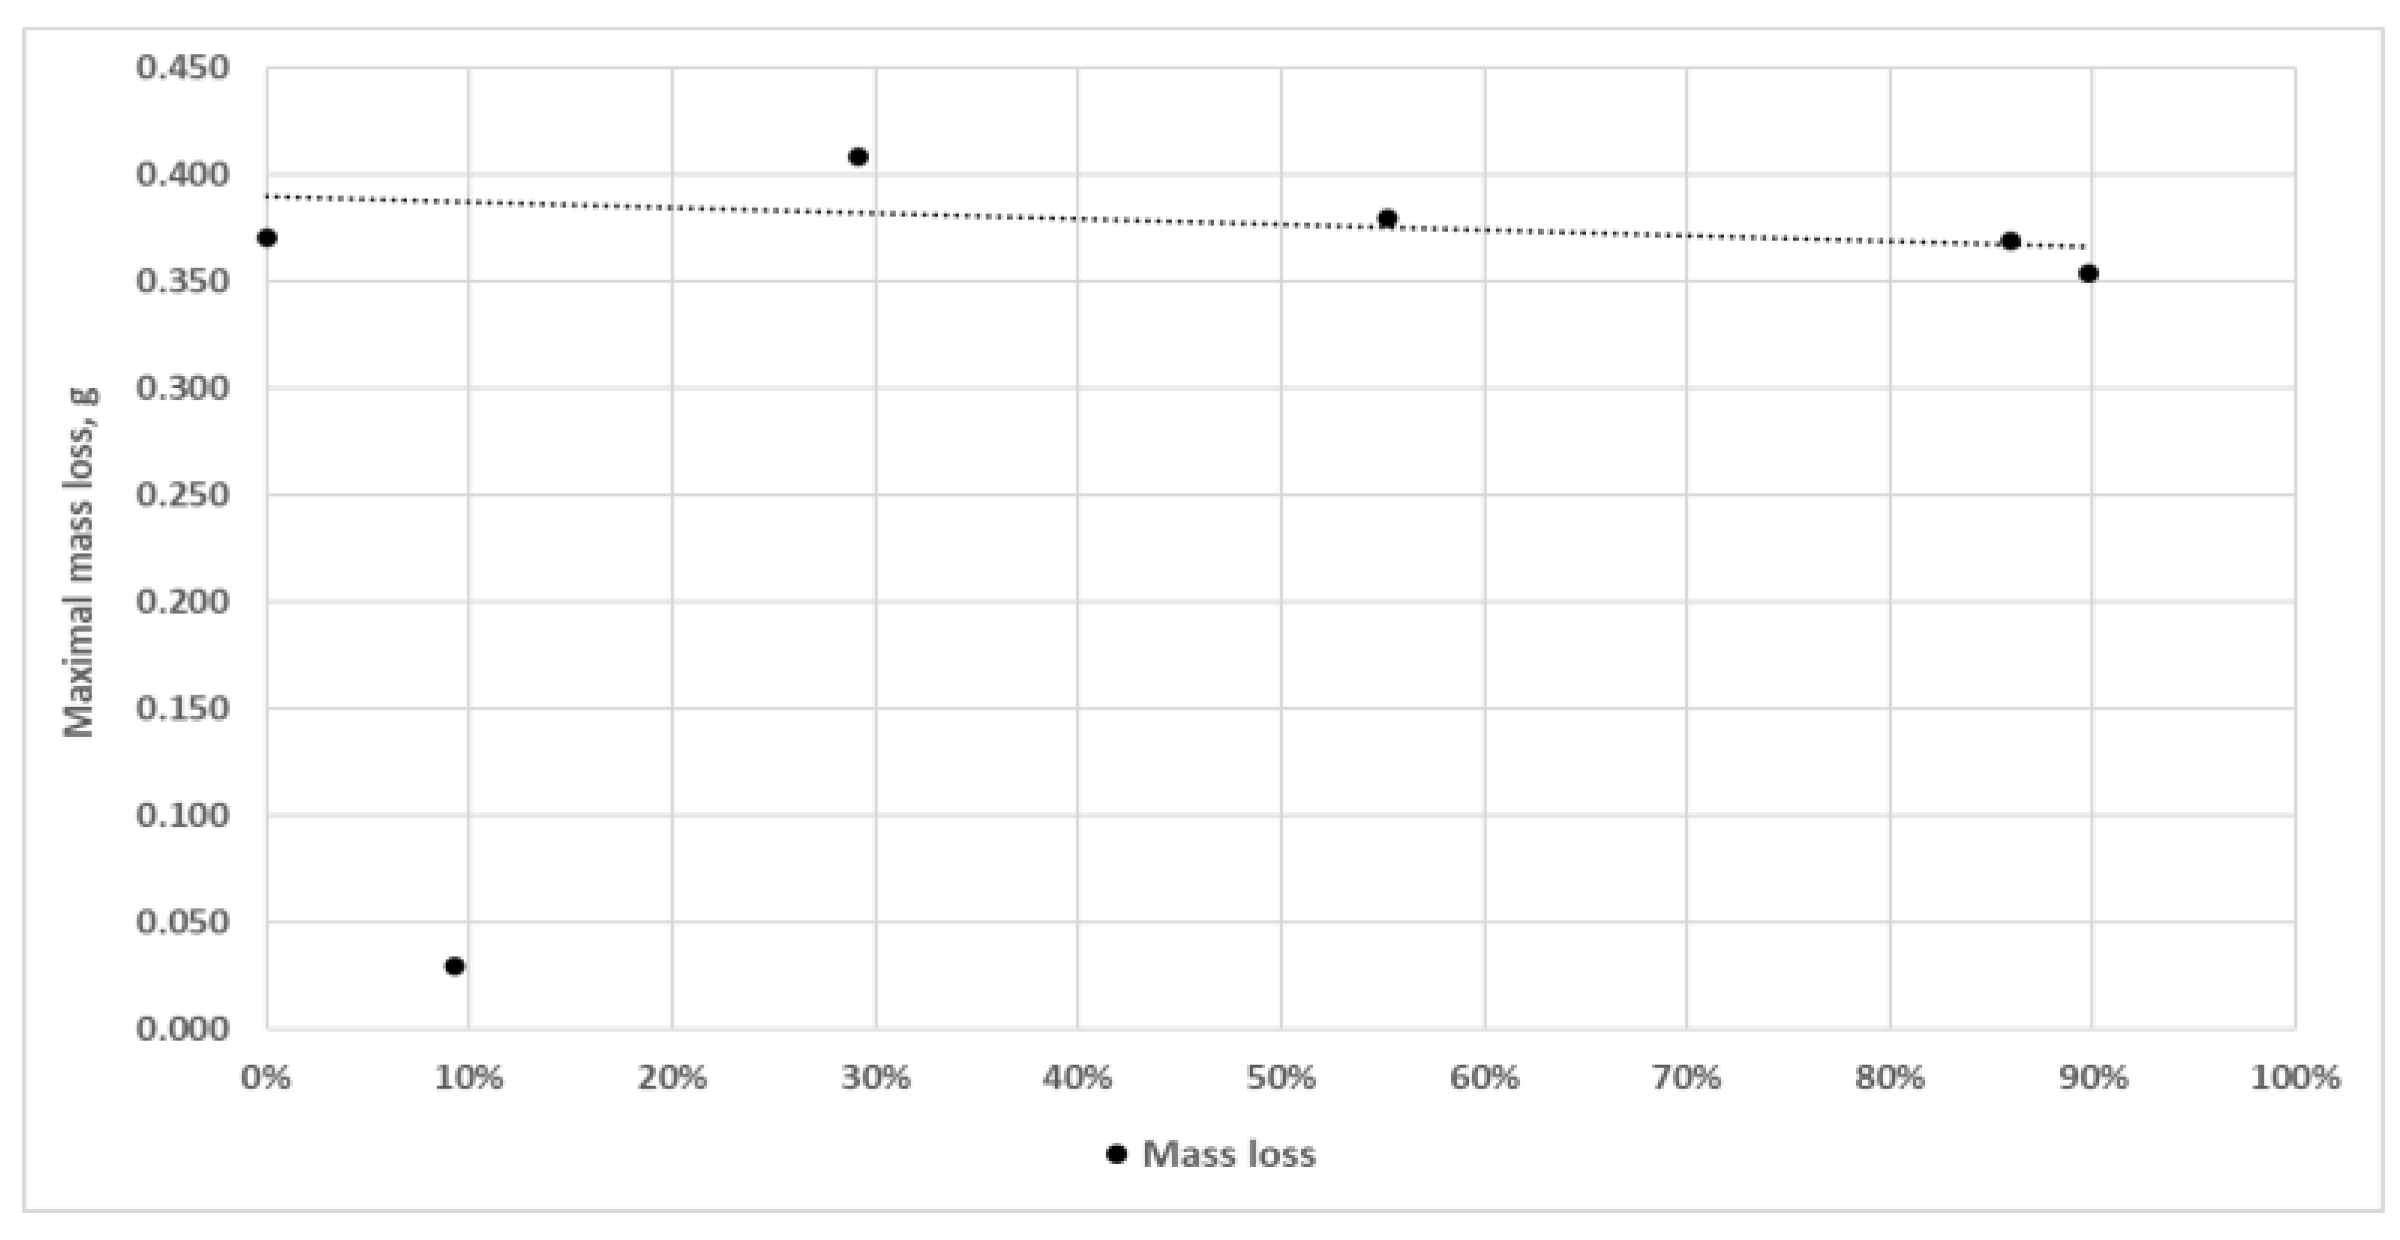
Figure 9.
Effect of the share of individual mineral fractions in the abrasives based on hard coal and carbonaceous claystone on the mass loss in test samples: A – carbonaceous fraction, B – hard mineral fraction, C – sulphur, D – alkali metal oxide fraction.
Figure 9.
Effect of the share of individual mineral fractions in the abrasives based on hard coal and carbonaceous claystone on the mass loss in test samples: A – carbonaceous fraction, B – hard mineral fraction, C – sulphur, D – alkali metal oxide fraction.
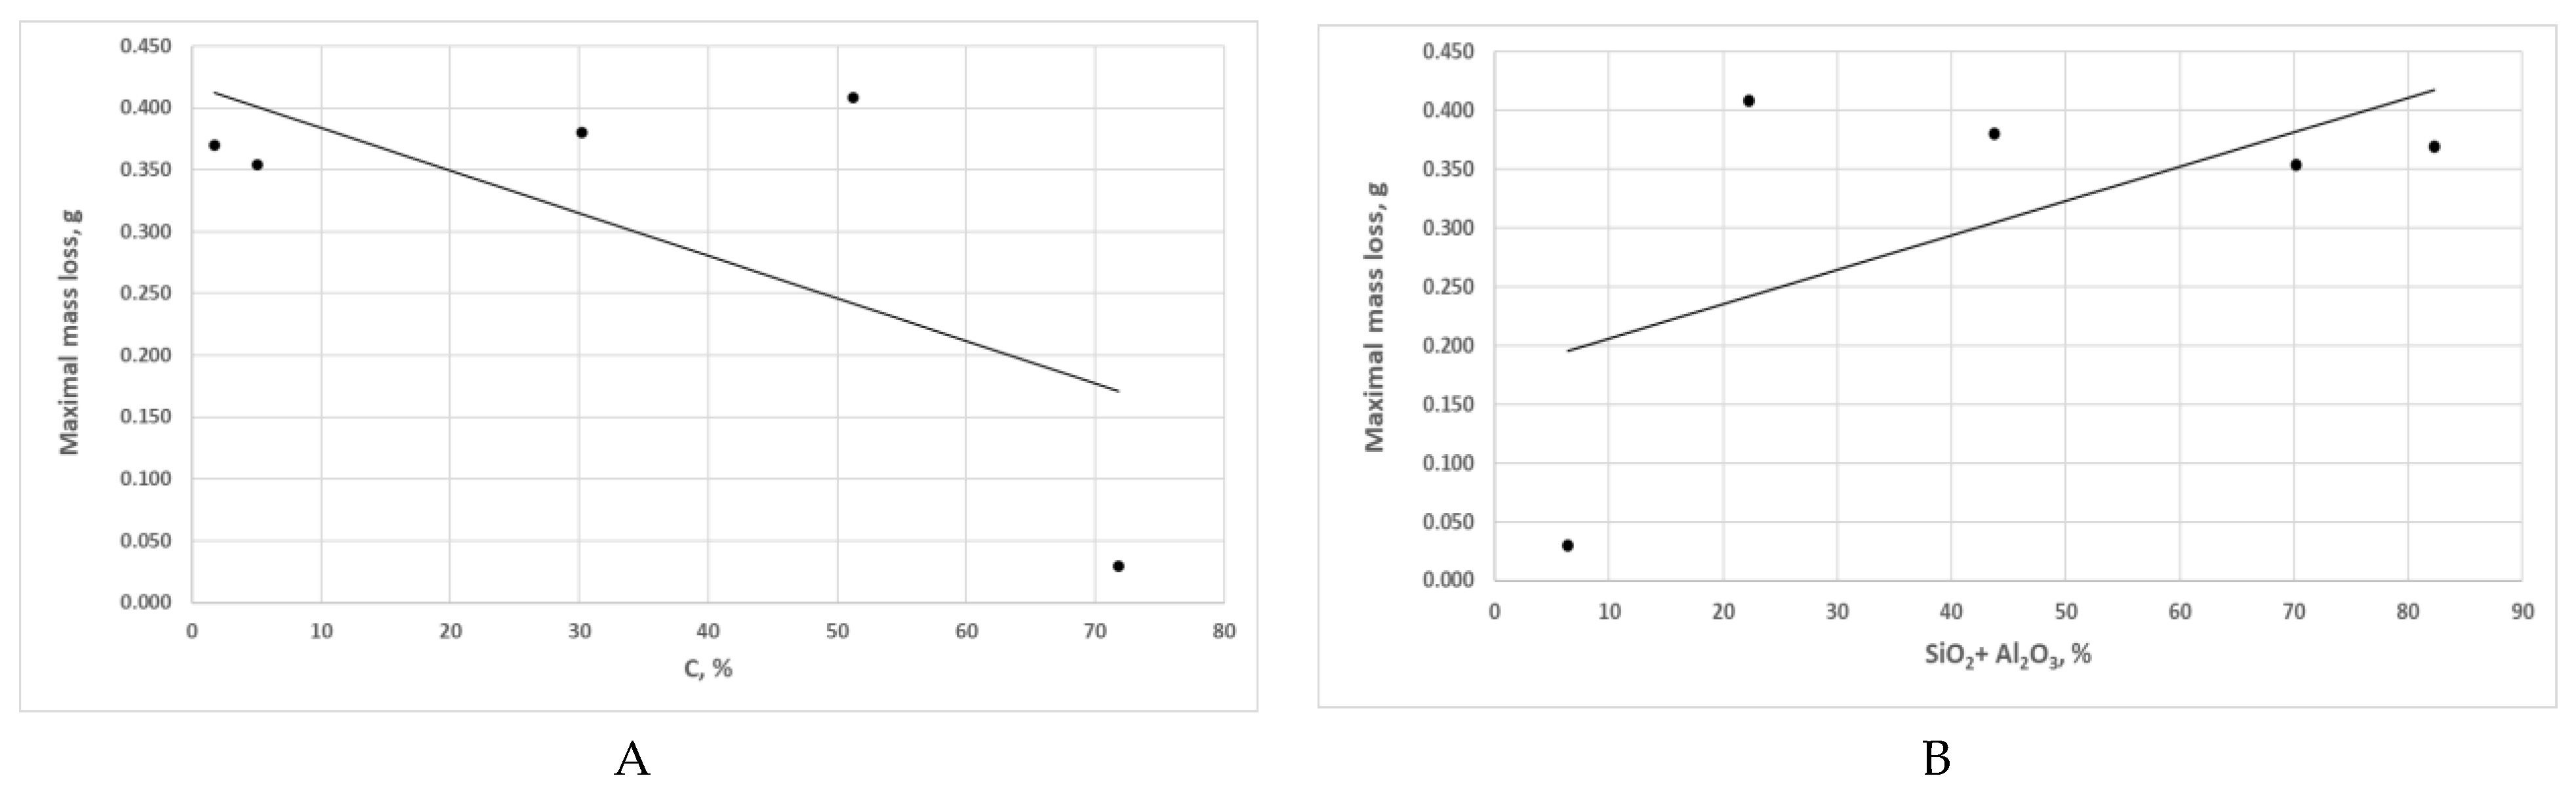
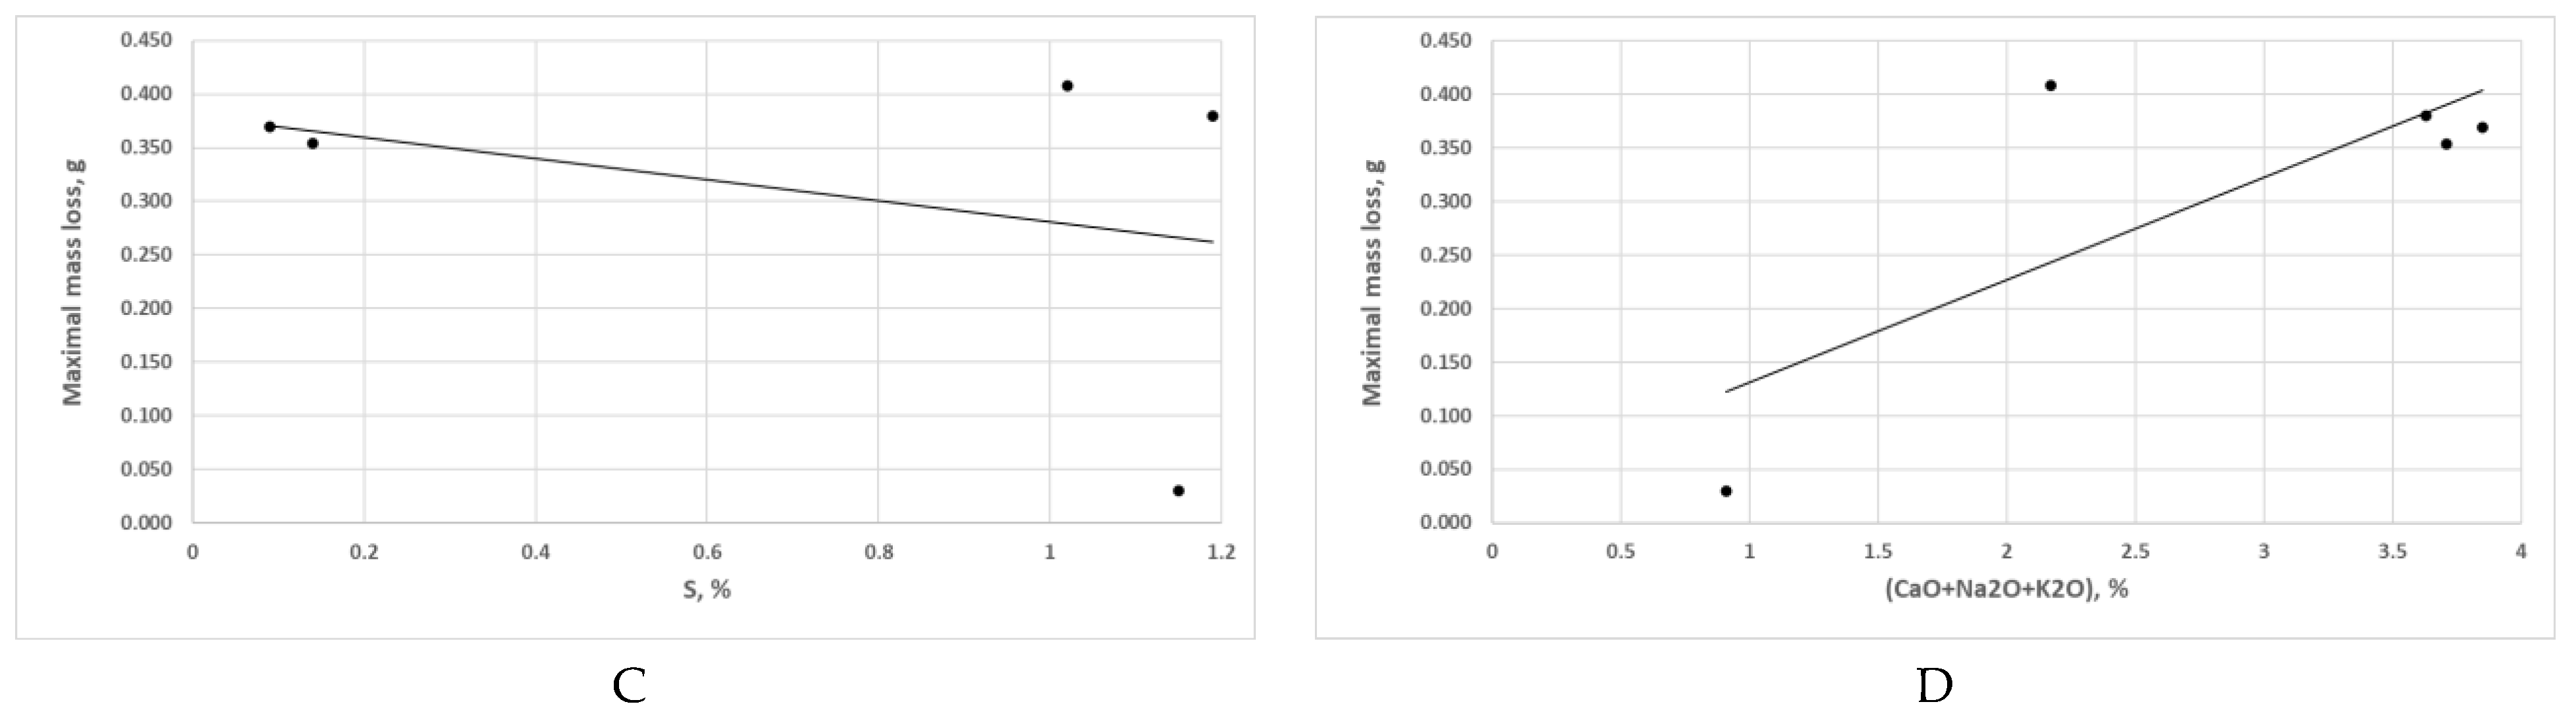
Figure 10.
Images of the surface damage of the samples following wear tests in the presence of pure oil (Variant 0): A, B – surface spalling (delamination), C – surface cracking in the vicinity of pitting cracks, D – surface scratches, E, F – initial stages of pitting (SEM).
Figure 10.
Images of the surface damage of the samples following wear tests in the presence of pure oil (Variant 0): A, B – surface spalling (delamination), C – surface cracking in the vicinity of pitting cracks, D – surface scratches, E, F – initial stages of pitting (SEM).
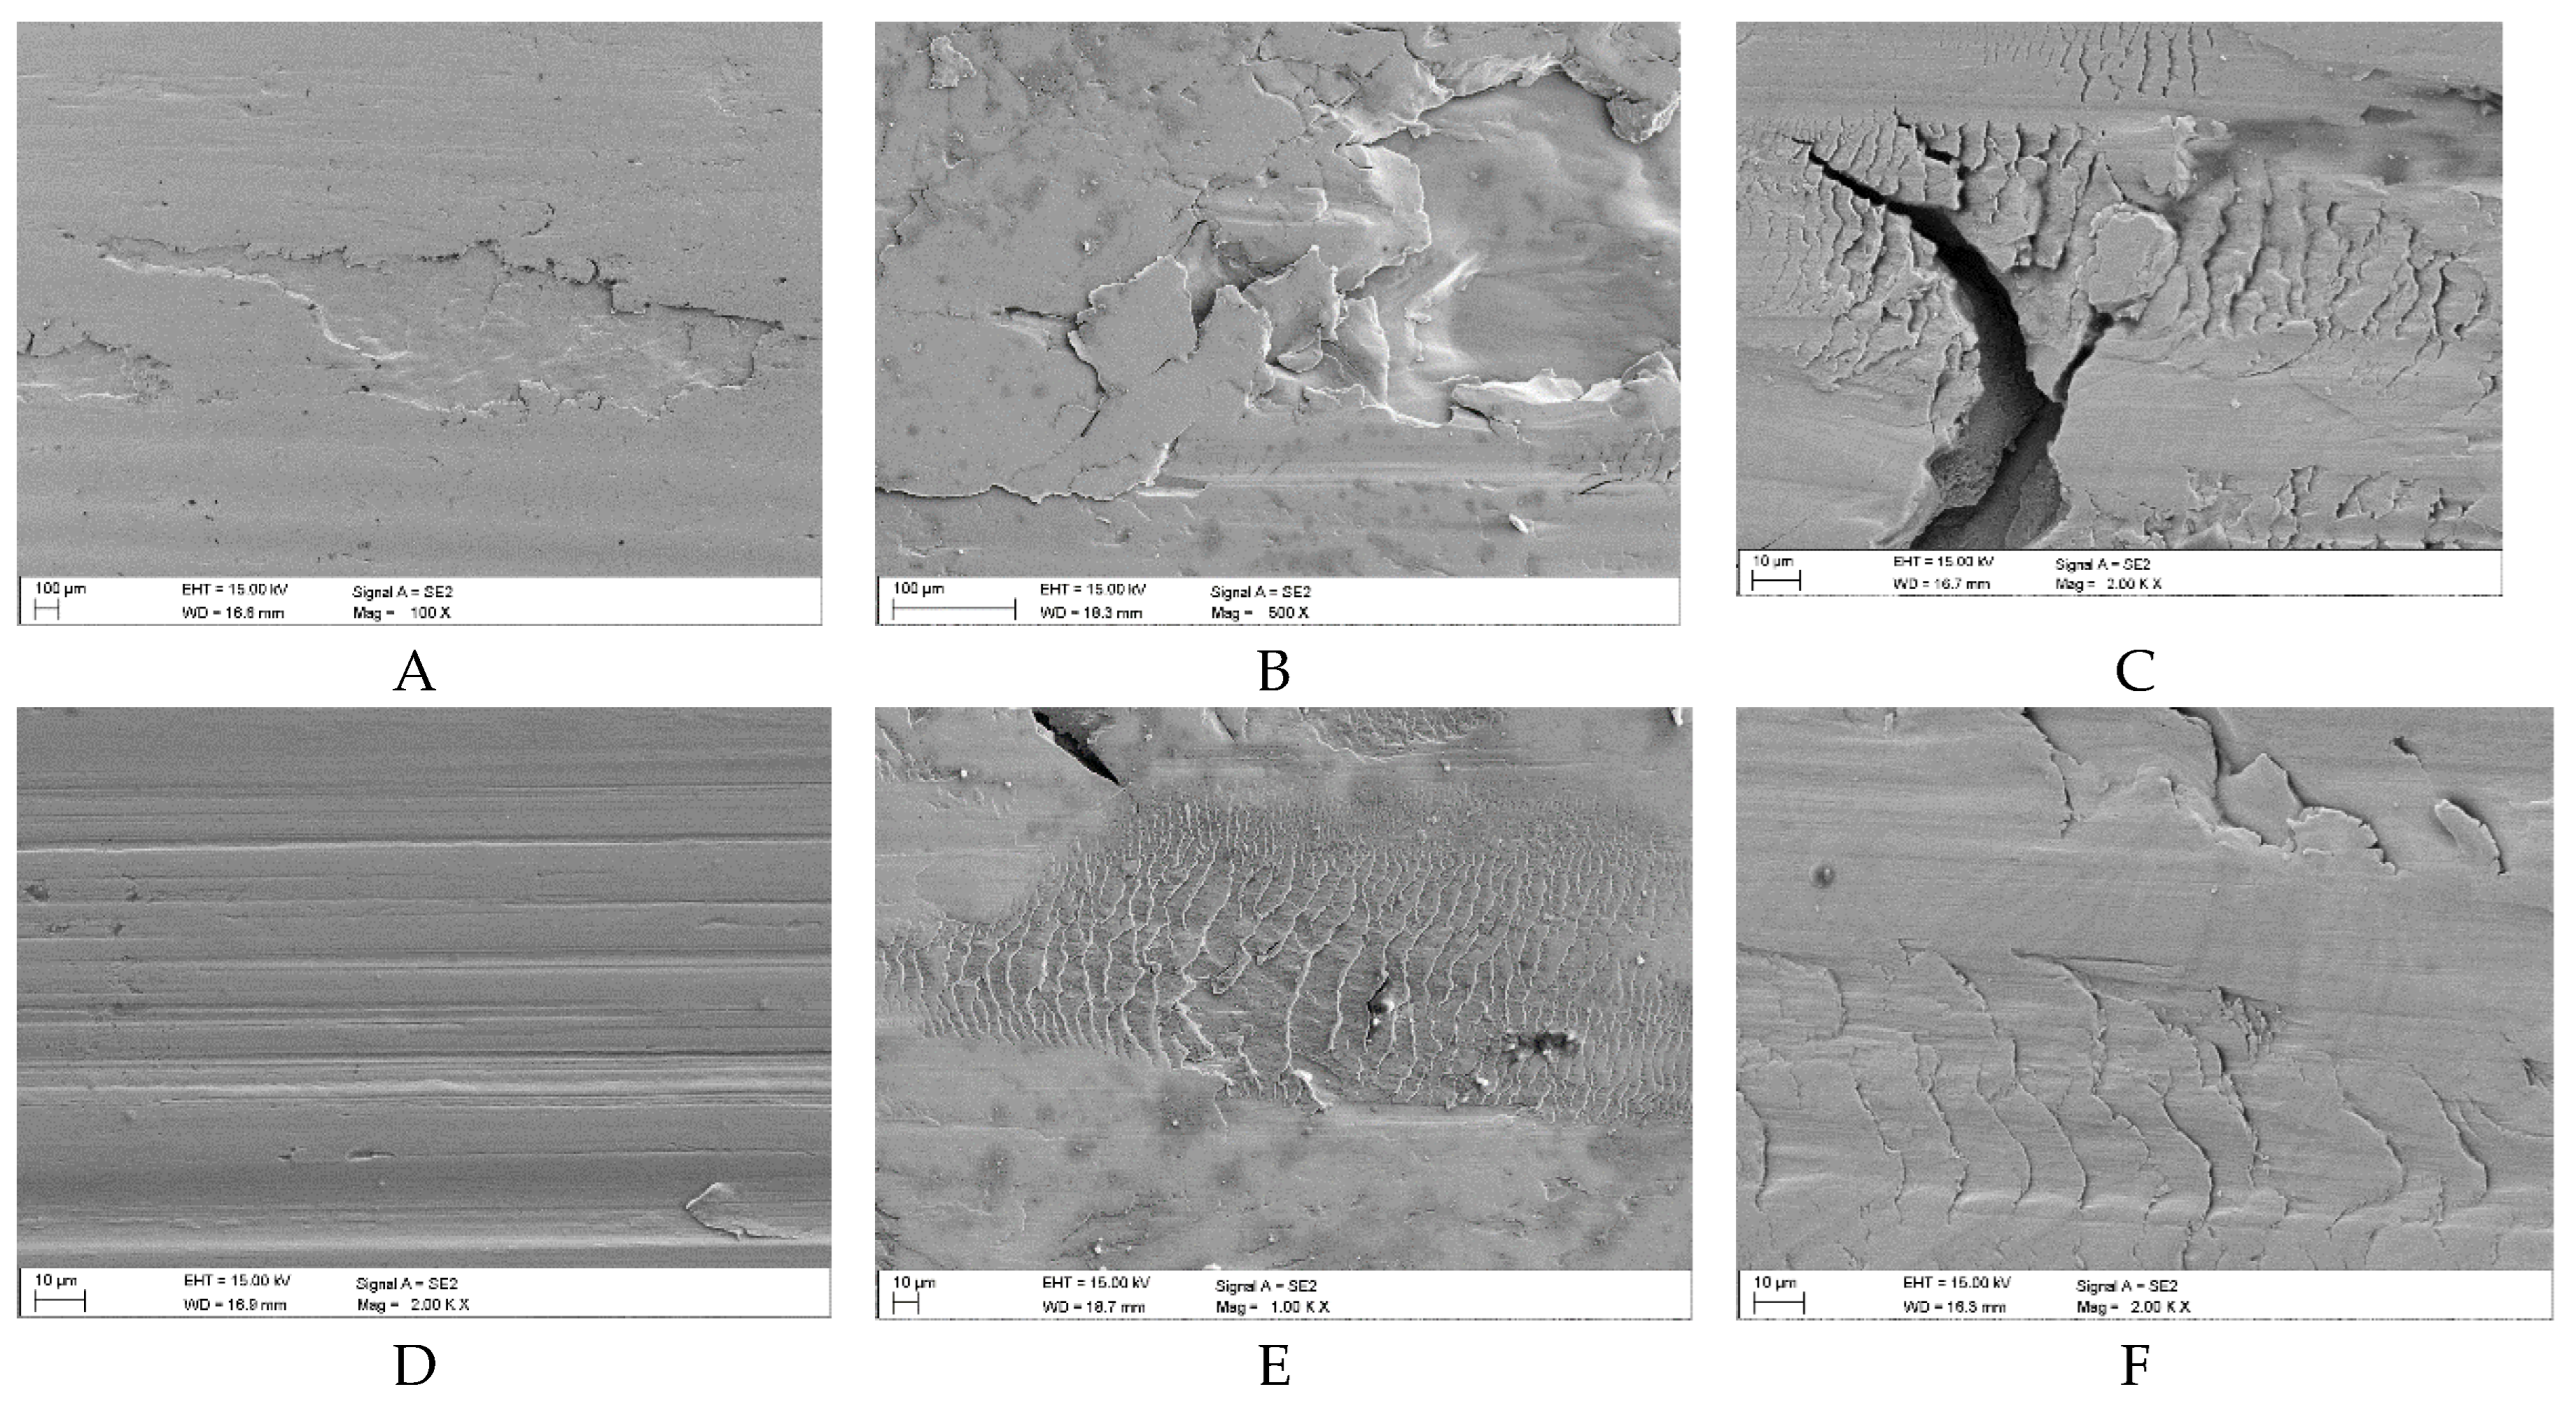
Figure 11.
Results of profilometric tests of the surface of steel lubricated with pure oil (Variant 0) in the area of spalling: A – 3D image of spalling, B – cross-section of spalling area, C – longitudinal section of spalling area.
Figure 11.
Results of profilometric tests of the surface of steel lubricated with pure oil (Variant 0) in the area of spalling: A – 3D image of spalling, B – cross-section of spalling area, C – longitudinal section of spalling area.
Figure 12.
Sample surface defects following wear tests in the presence of a mixture of oil and coal with an ash content of λp = 9.24% (Variant 1): A, B – surface spalling (delamination) with visible fragments of flat coal grains, C – surface scratches with a small amount of coal grain, D – surface texturing typical of developing pits with a visible thin layer of coal, E – properly developed pitting phase with traces of coal particles, F – final pitting phase in the form of spalling (SEM).
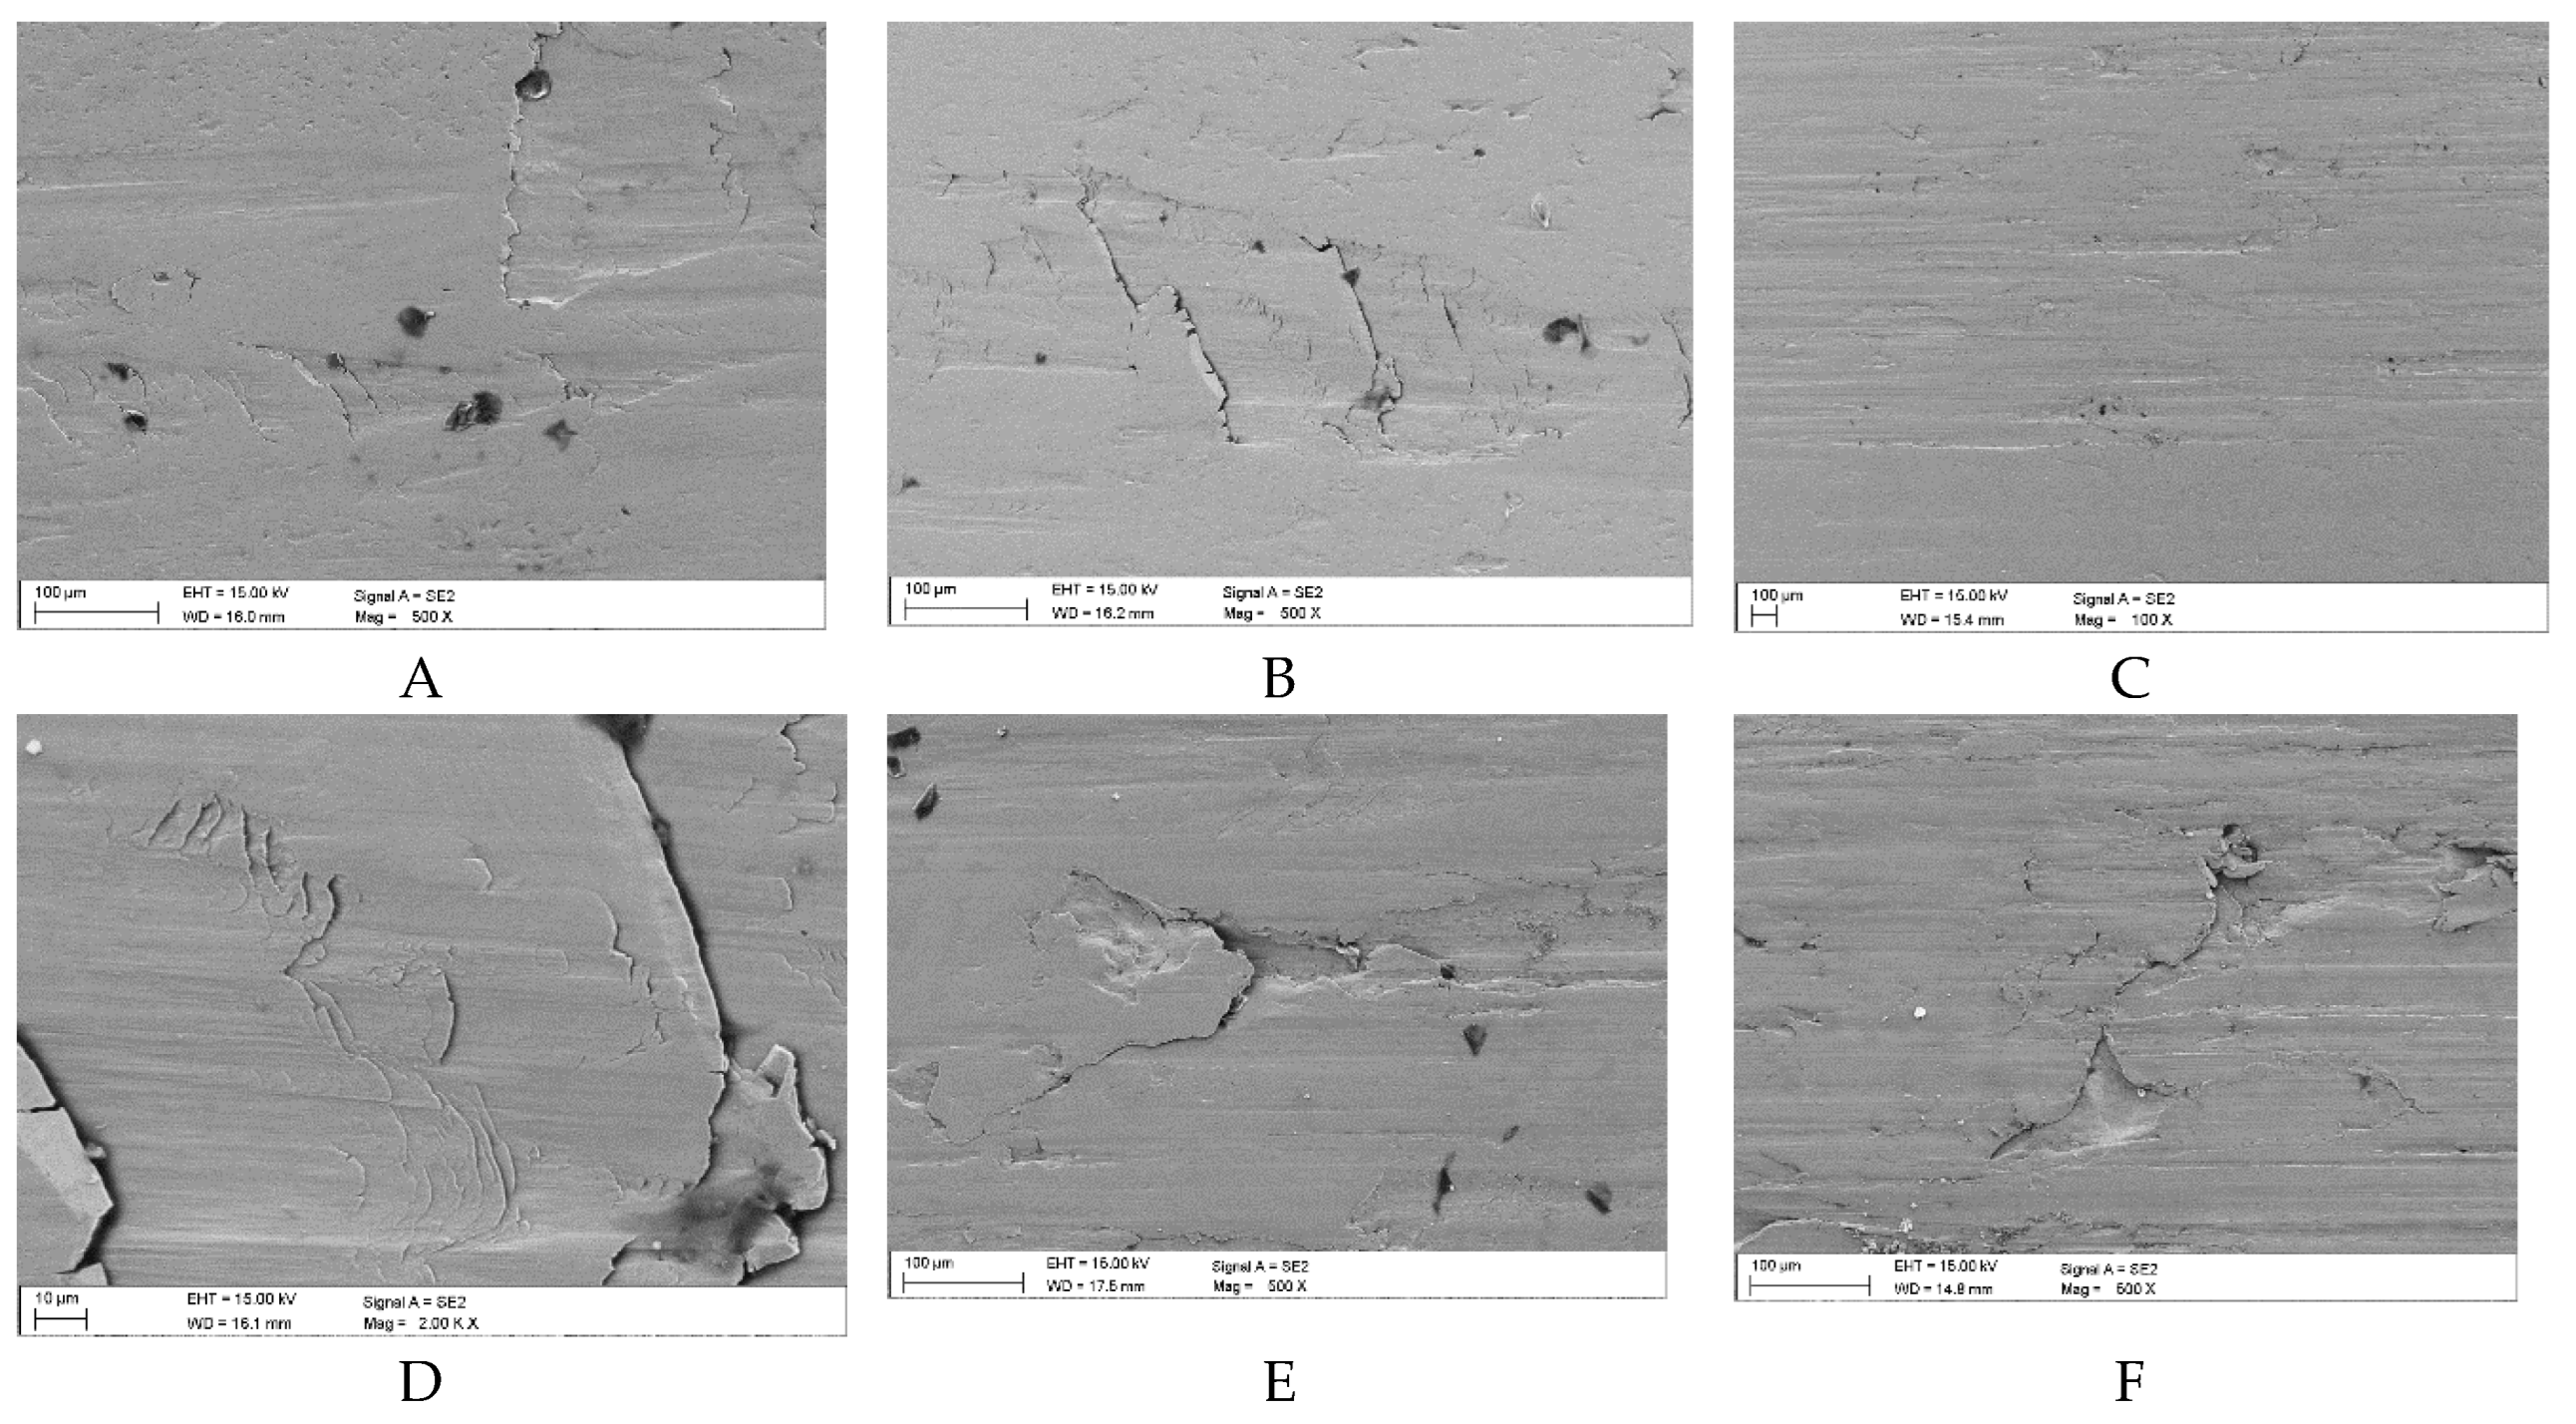
Figure 13.
Results of profilometric tests of steel surface lubricated with oil contaminated with coal with an ash content of λp = 9.24% (Variant 1): A – 3D image of spalling, B – cross-section of the spalling area, C – longitudinal section of the spalling area.
Figure 13.
Results of profilometric tests of steel surface lubricated with oil contaminated with coal with an ash content of λp = 9.24% (Variant 1): A – 3D image of spalling, B – cross-section of the spalling area, C – longitudinal section of the spalling area.
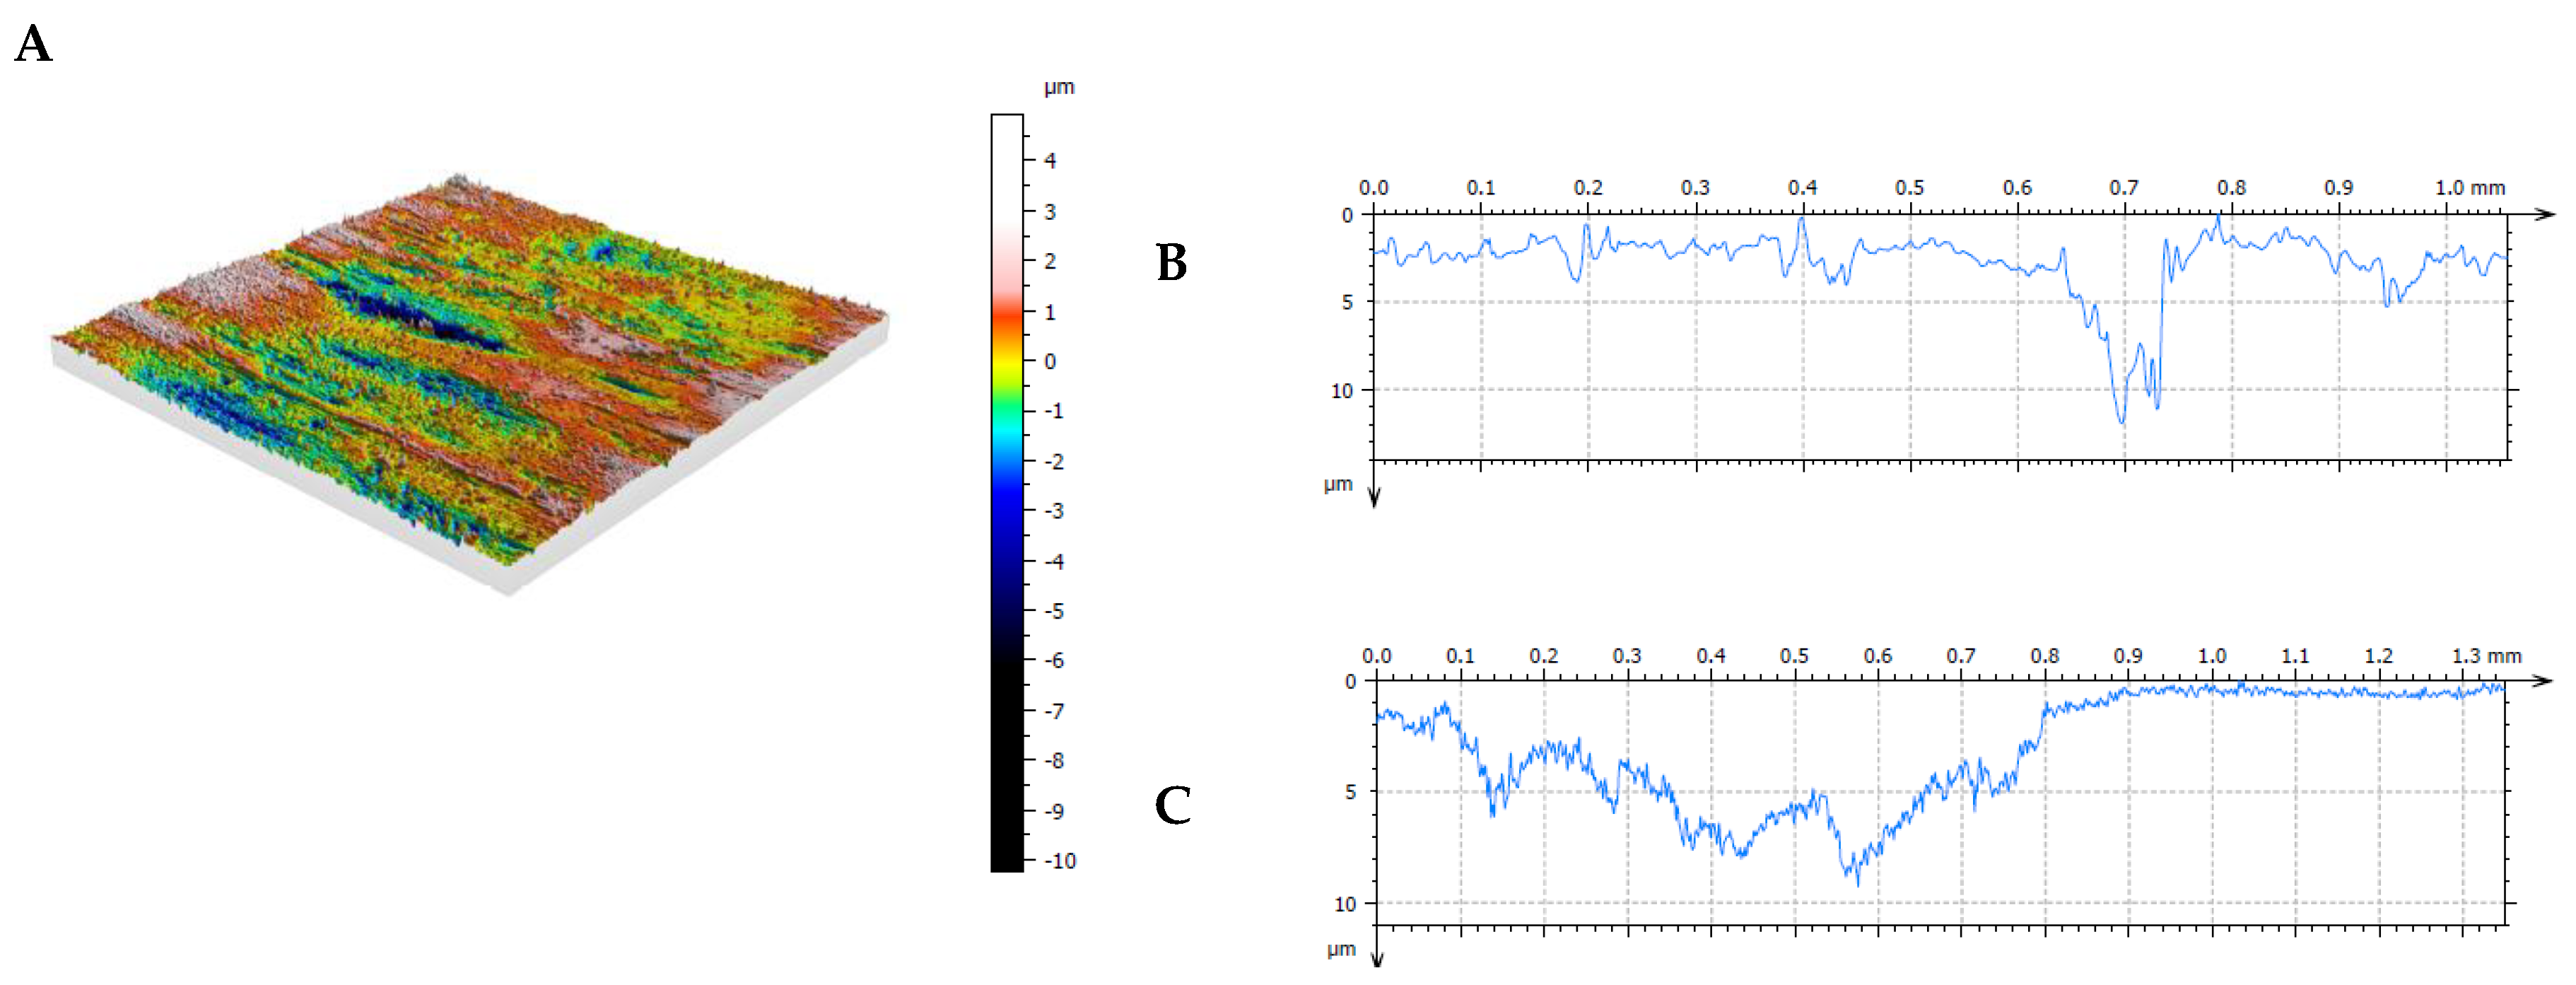
Figure 14.
Sample surface defects following wear tests in the presence of a mixture of oil and coal with an ash content of λp = 29.15% (Variant 2): A, B – surface spalling (delamination) with visible fine coal grain fragments, C – surface scratches with numerous flat coal grains, D – fragments of superficial coal film, E, F – delamination edges with visible cracks and traces of coal particles (SEM).
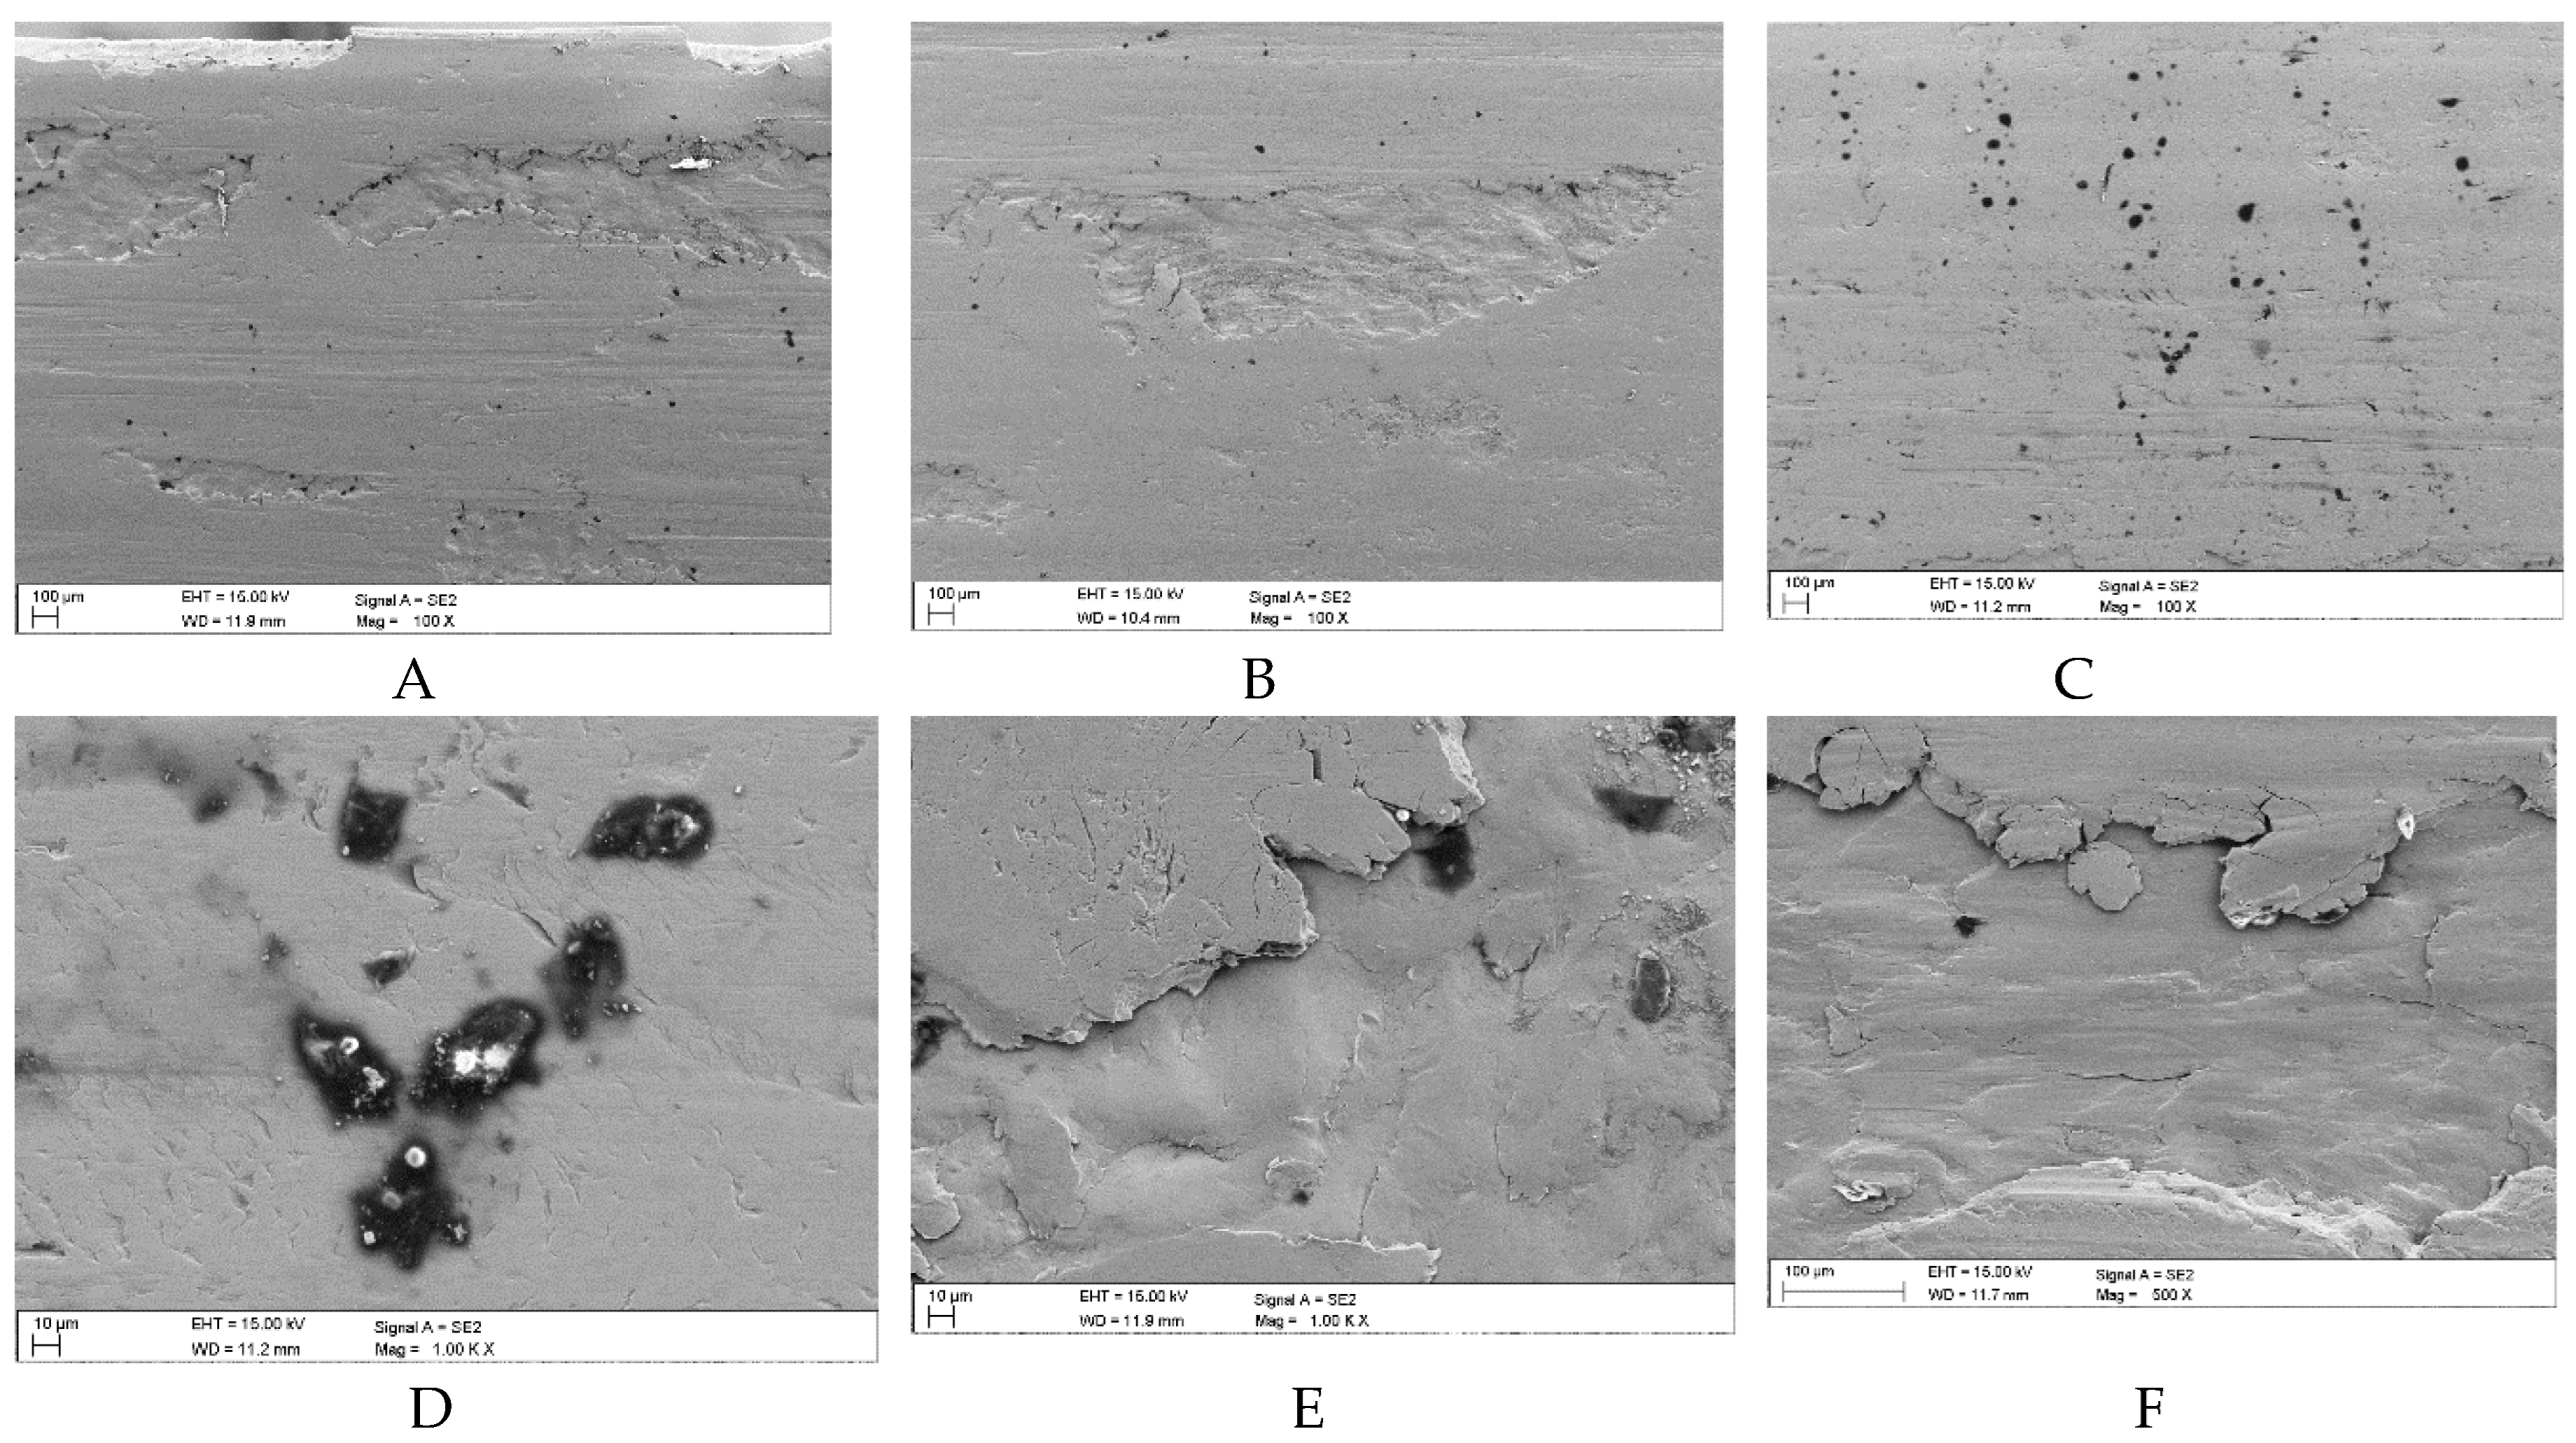
Figure 15.
Sample surface defects following wear tests in the presence of a mixture of oil and coal with an ash content of λp = 55.28% (Variant 3): A, B – surface spalling (delamination) with visible small fragments of coal grains, C – initial and final phase of pitting with traces of surface scratches (SEM).
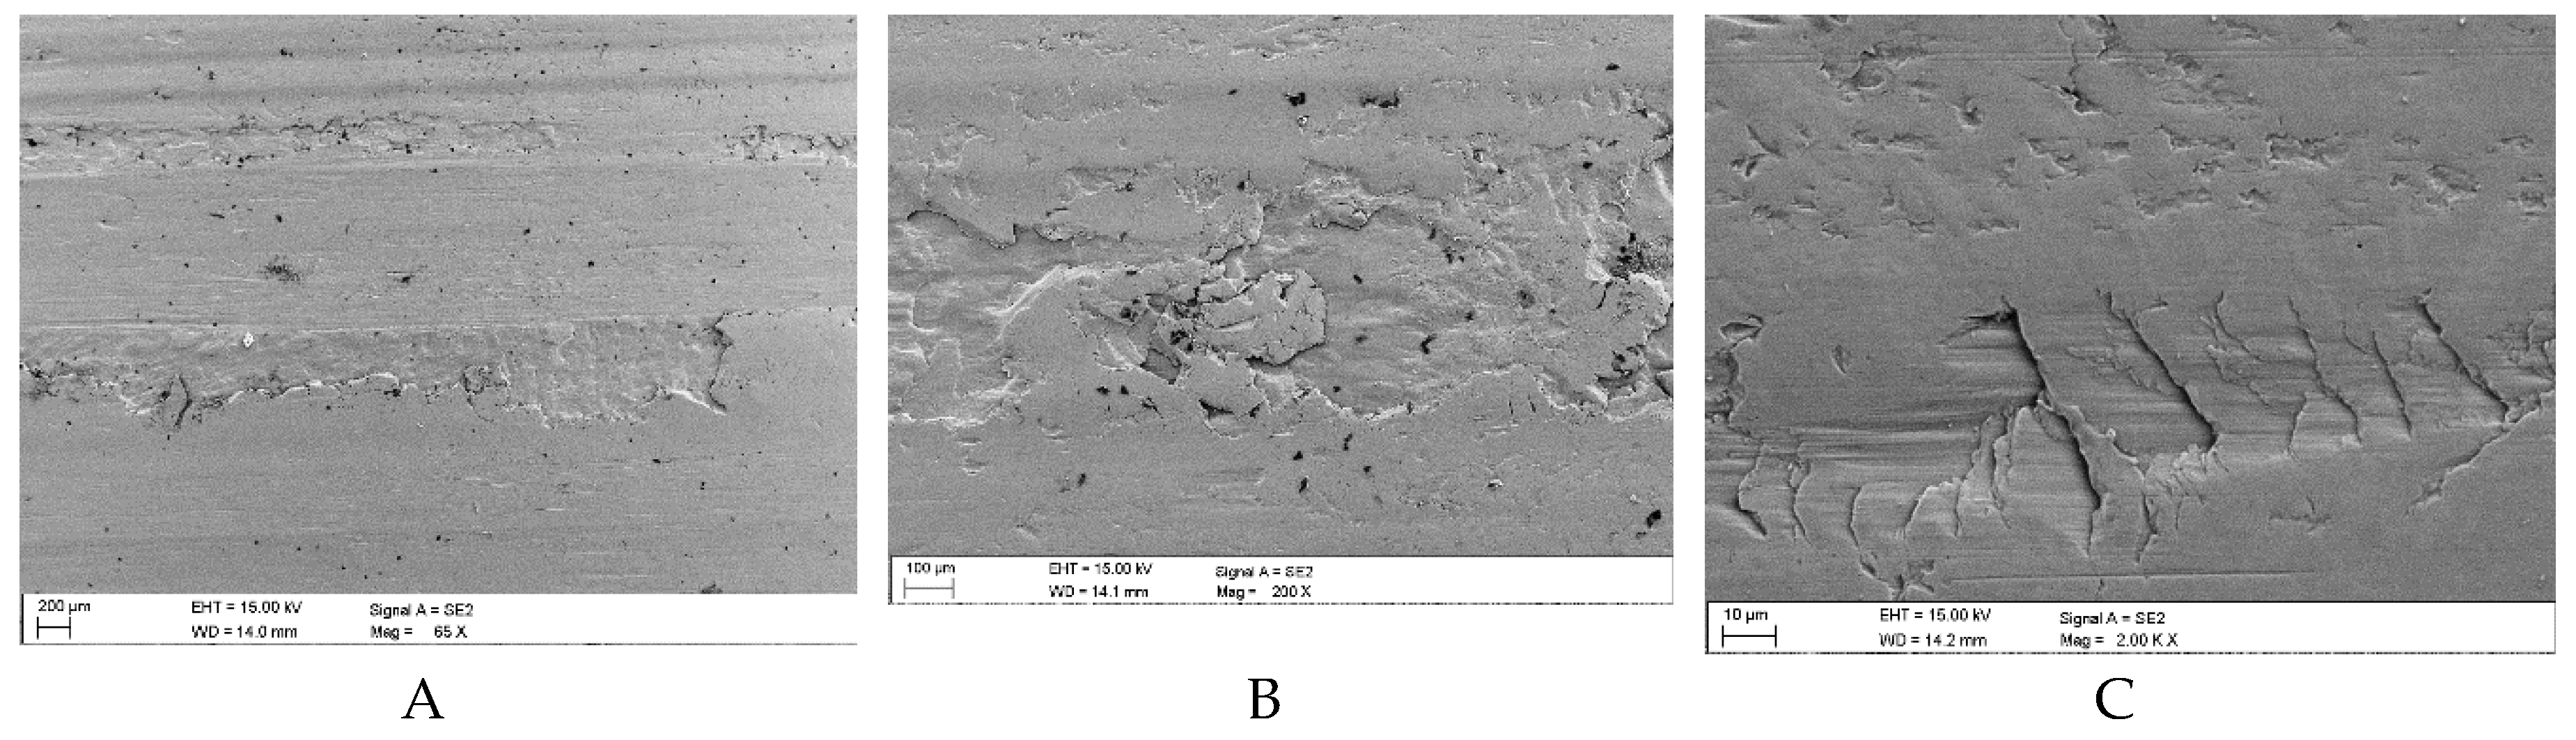
Figure 16.
Sample surface defects following wear tests in the presence of a mixture of oil and coal with an ash content of λp = 89.78% (Variant 5): A, B – surface spalling (delamination) with visible small fragments of claystone arranged the edge, C – surface crack against the background of shallow surface scratches (SEM).
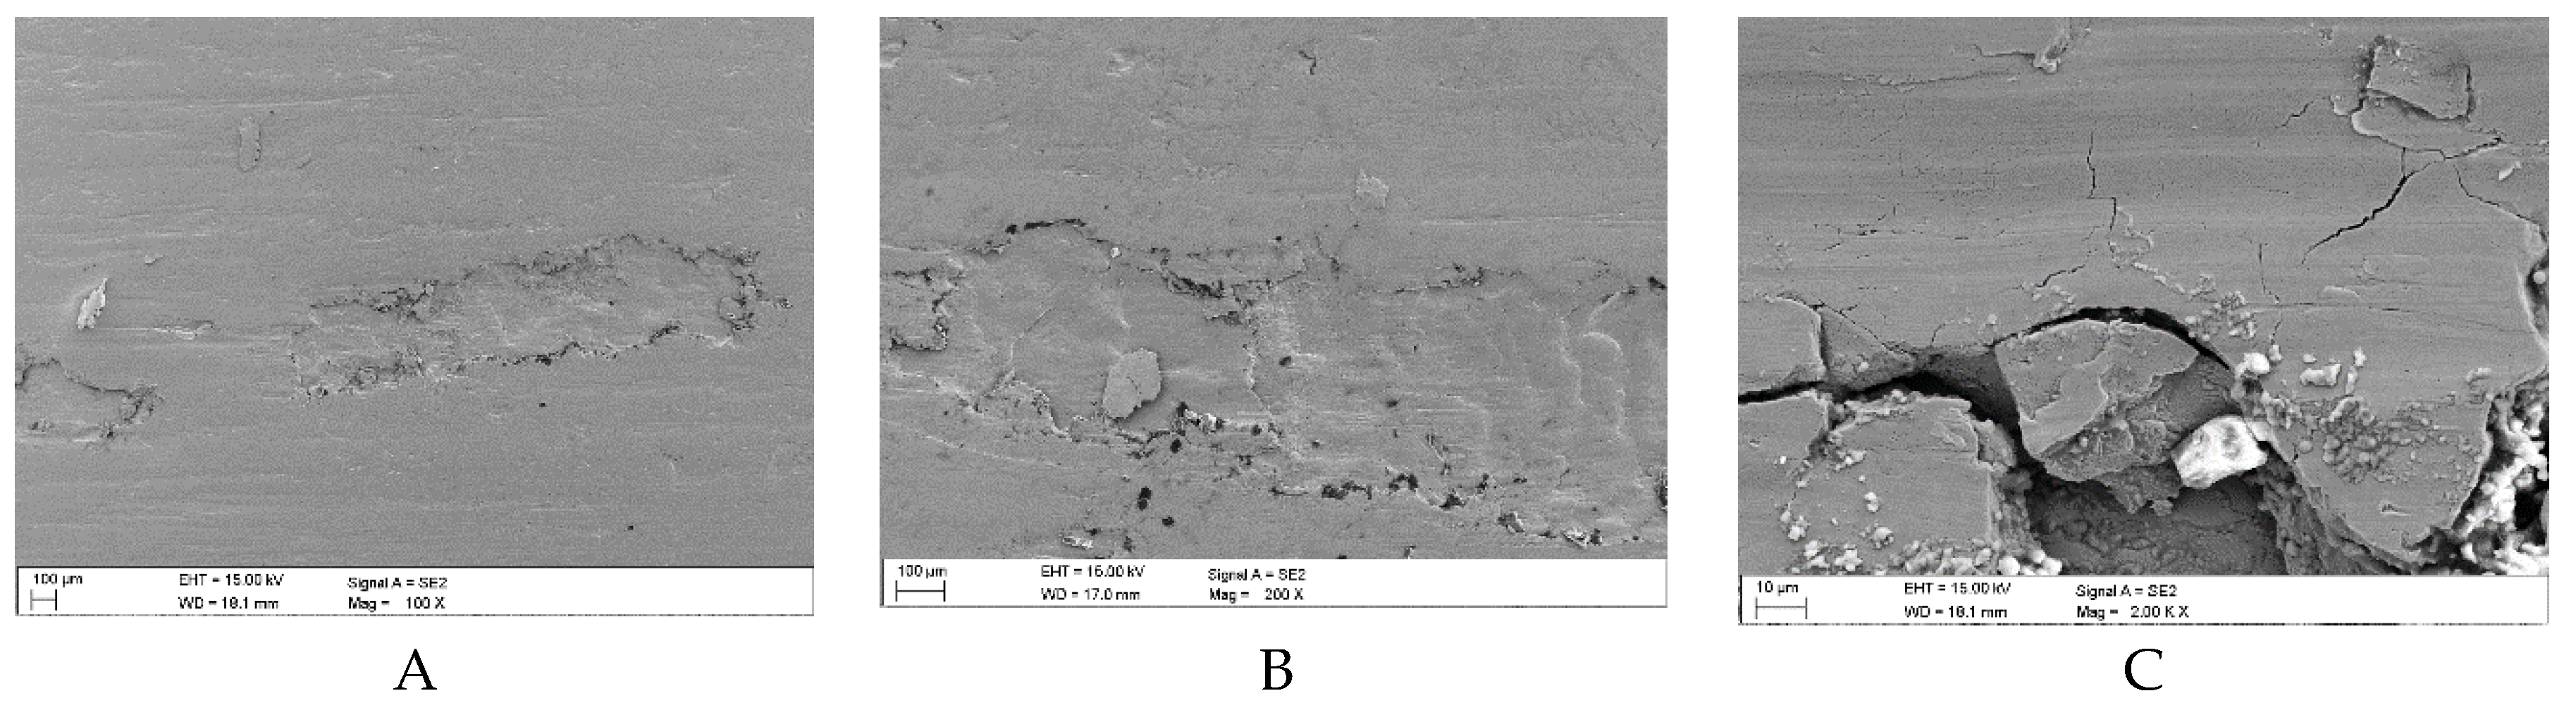
Figure 17.
Results of profilometric tests of steel surface lubricated with oil contaminated with coal with an ash content of λp = 29.15% (Variant 2) in the spalling area: A – 3D image of spalling, B – cross-section of the spalling area, C – longitudinal section of the spalling area.
Figure 17.
Results of profilometric tests of steel surface lubricated with oil contaminated with coal with an ash content of λp = 29.15% (Variant 2) in the spalling area: A – 3D image of spalling, B – cross-section of the spalling area, C – longitudinal section of the spalling area.
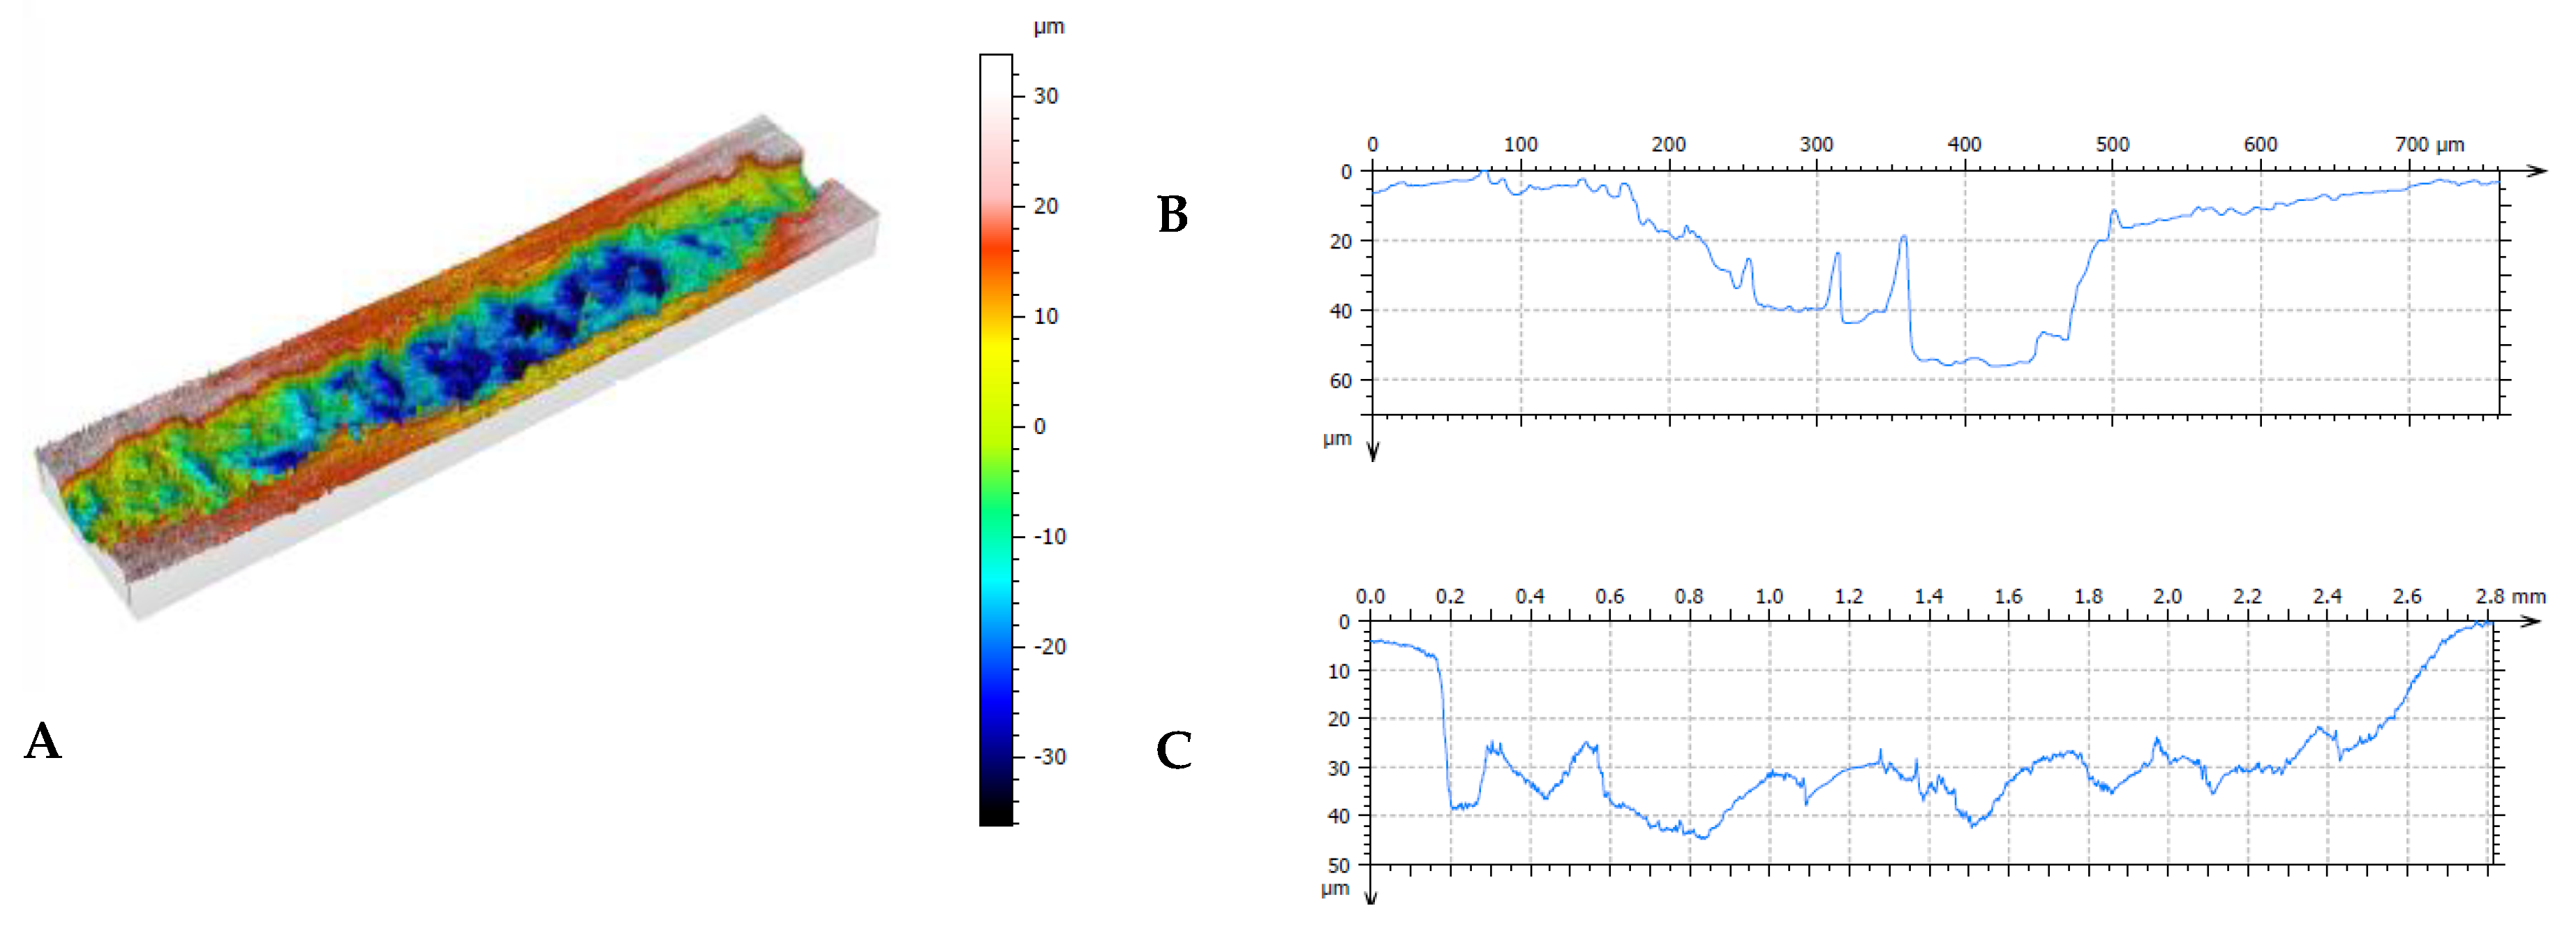
Figure 18.
Results of profilometric tests of steel surface lubricated with oil contaminated with coal with an ash content of λp = 55.28% (Variant 3) in the spalling area: A – 3D image of spalling, B – cross-section of the spalling area, C – longitudinal section of the spalling area.
Figure 18.
Results of profilometric tests of steel surface lubricated with oil contaminated with coal with an ash content of λp = 55.28% (Variant 3) in the spalling area: A – 3D image of spalling, B – cross-section of the spalling area, C – longitudinal section of the spalling area.
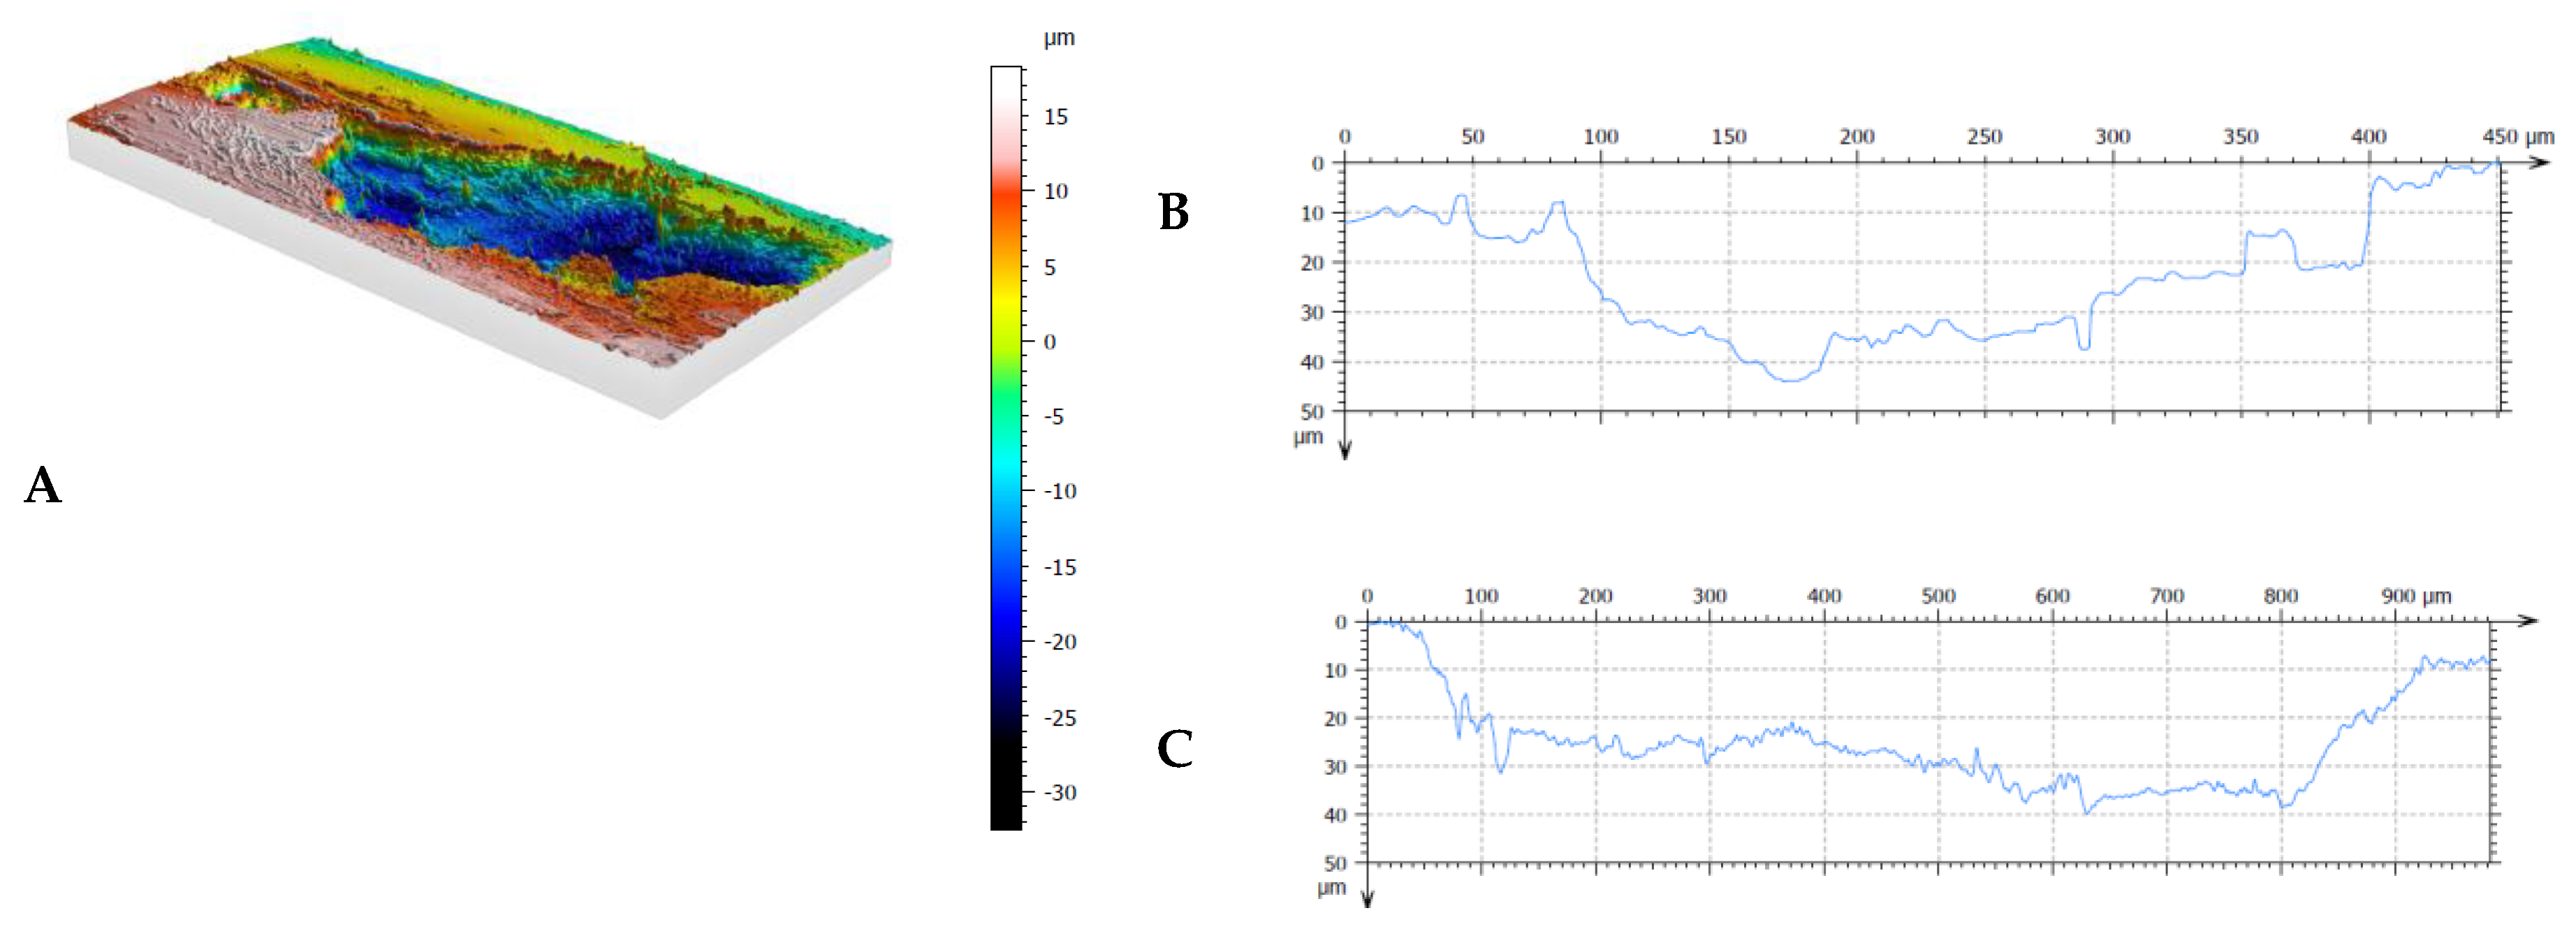
Figure 19.
Results of profilometric tests of steel surface lubricated with oil contaminated with coal with an ash content of λp = 89.78% (Variant 5) in the spalling area: A – 3D image of spalling, B – cross-section of the spalling area, C – longitudinal section of the spalling area.
Figure 19.
Results of profilometric tests of steel surface lubricated with oil contaminated with coal with an ash content of λp = 89.78% (Variant 5) in the spalling area: A – 3D image of spalling, B – cross-section of the spalling area, C – longitudinal section of the spalling area.
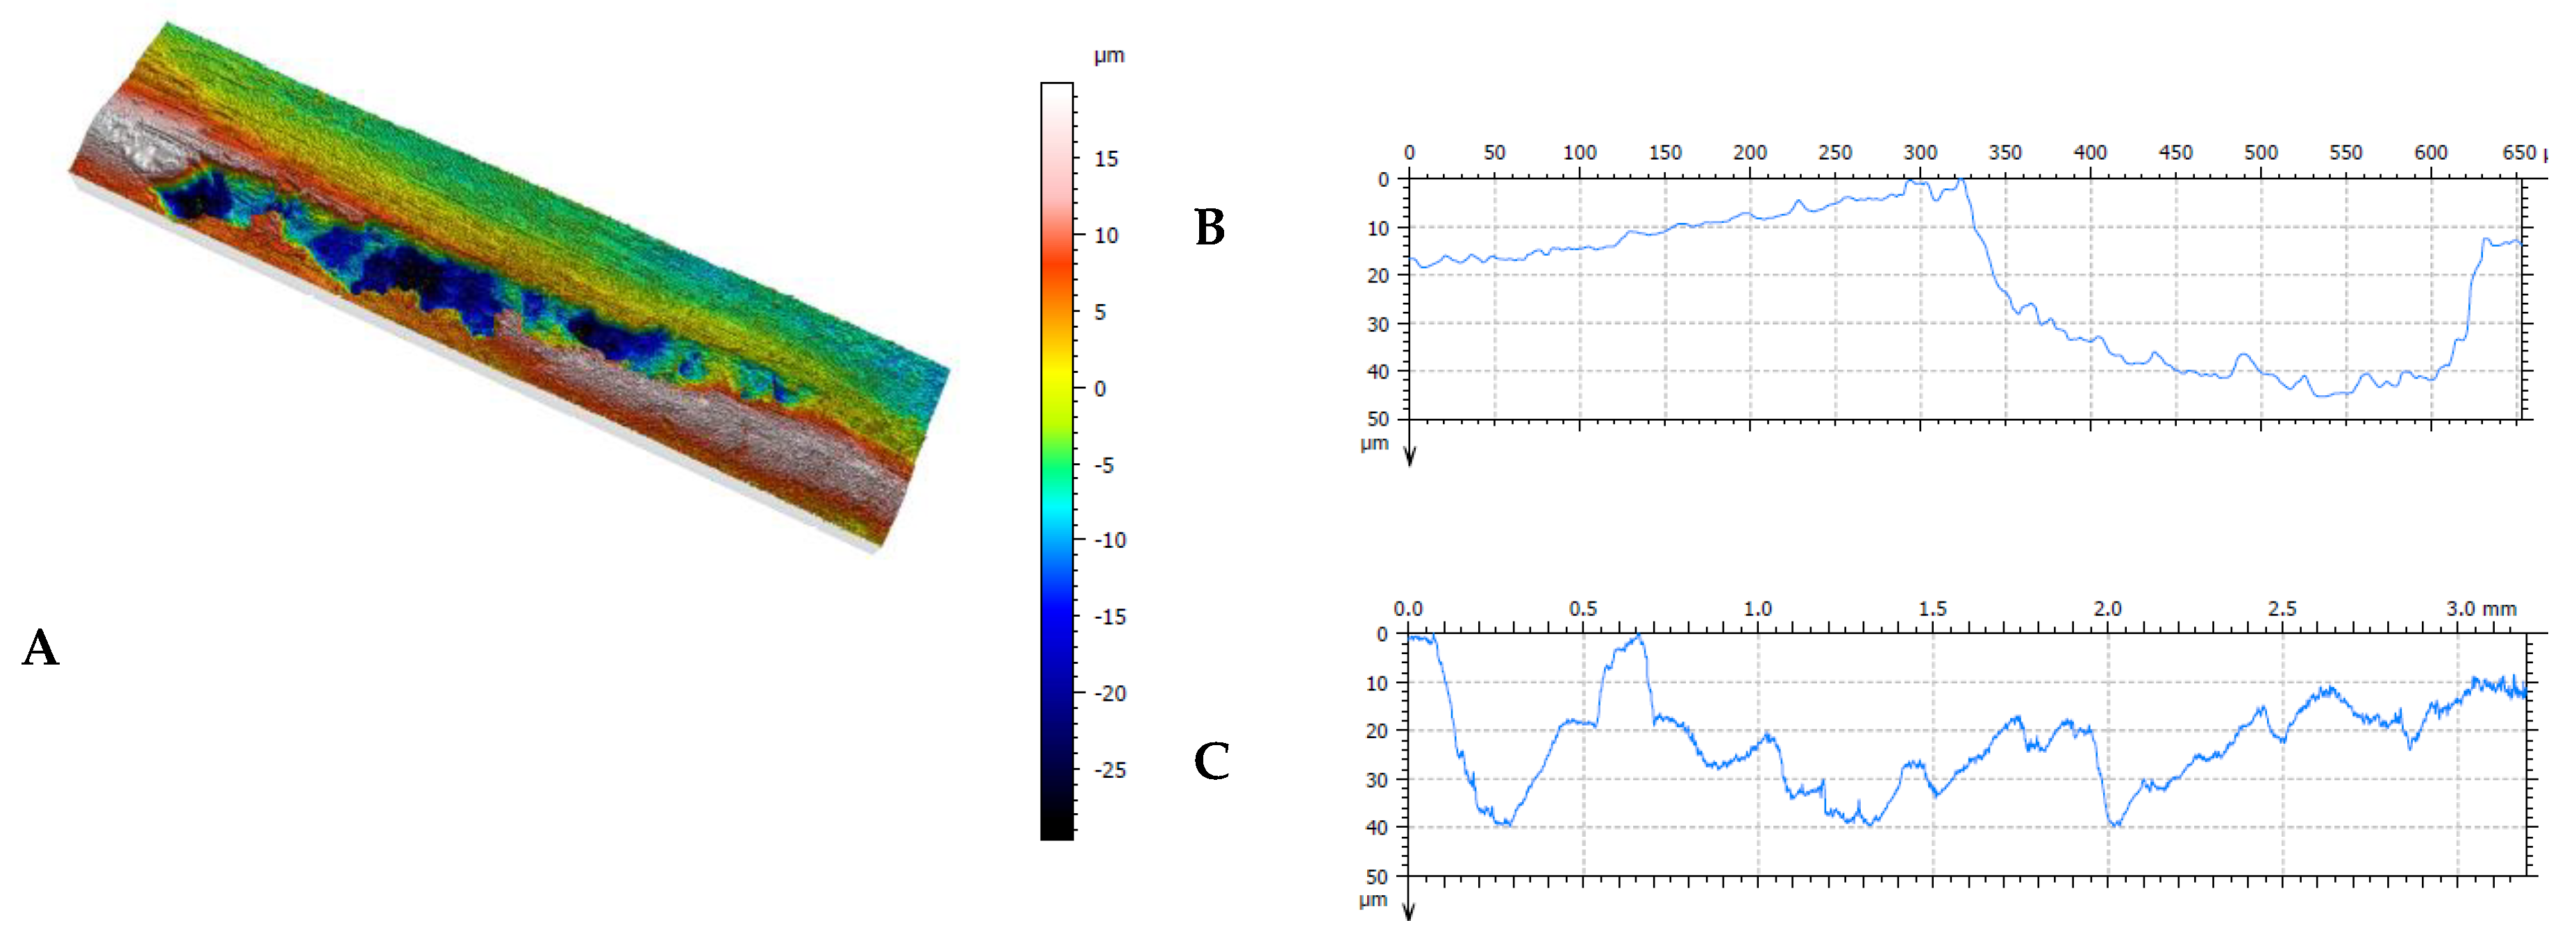
Figure 20.
Schematic diagram of a friction node lubricated with oil with graphite additive.
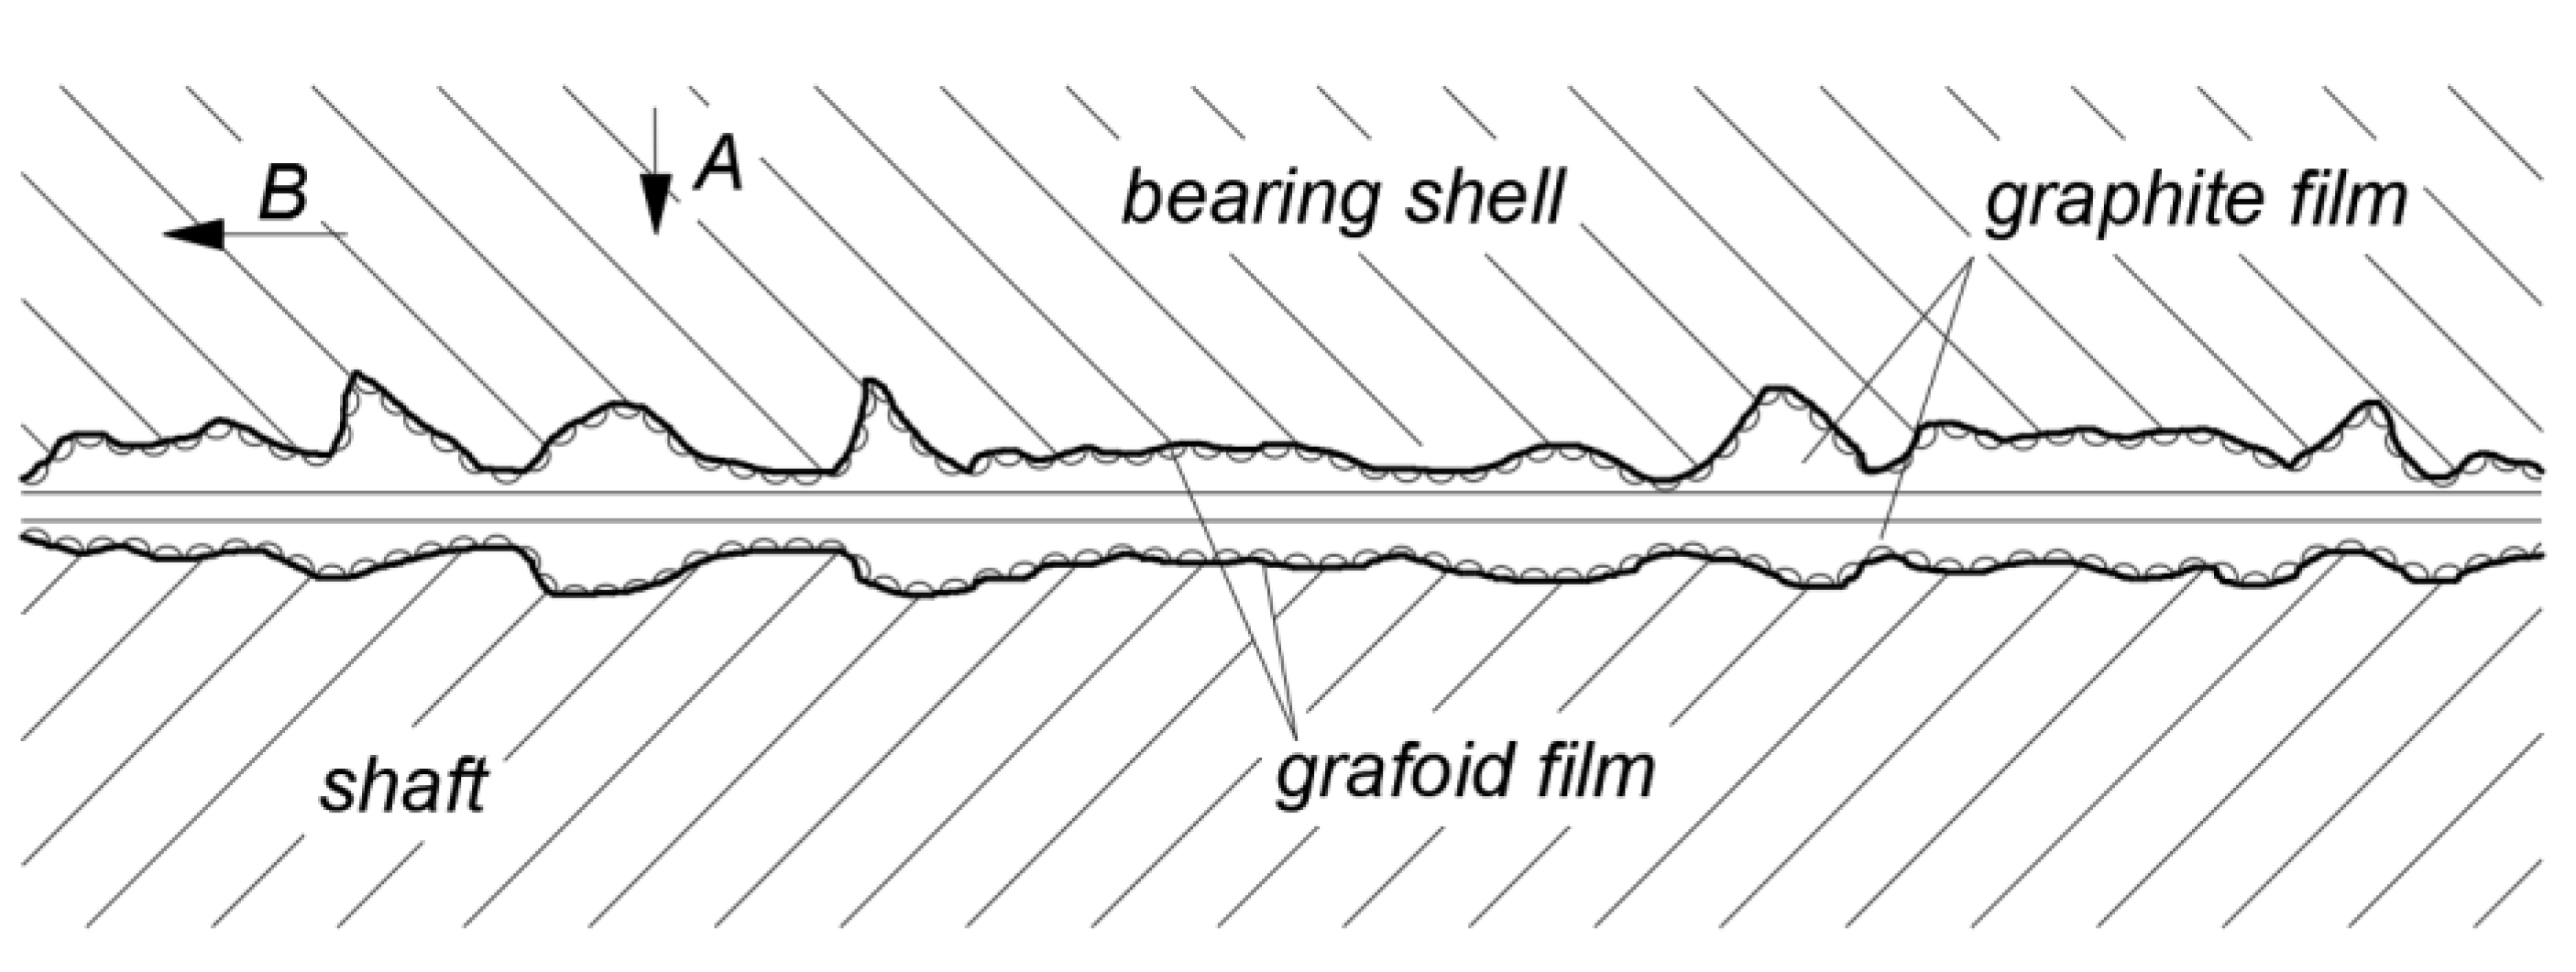

Table 1.
Concentration, type, and size of particles in lubricating oil, retrieved from different operating environments; based on [35].
Table 1.
Concentration, type, and size of particles in lubricating oil, retrieved from different operating environments; based on [35].
| Oil Sampling Location | Concentration, g/dm3 | Grain Size Range, 10-6 m |
Contamination Type | Source |
|---|---|---|---|---|
| Paper mill | 0.4 | 0÷150 | Cu, Si, Silicates | [36] |
| Motor vehicle sump | 1÷2 | 0÷250 | C, Fe | [36] |
| Various bearing lubricants | 0.3÷1.5 | 0÷250 | Fe, Al, Cu, Sn, SiC, sand | [37] |
| Various | 0÷100 | Al, Ag, Cr, Zn, Fe | [38] | |
| Motor vehicles | 0.3 | 0÷120 | Al, Cu, Fe, Pb | [38] |
| Aircraft gas turbines | 1÷2 | 0÷200 | Fe, C, silicates | [39] |
Table 2.
Theoretical maximum flash temperatures during ductile debris extrusion in a typical line, rolling-sliding, elastohydrodynamic contact. Counterface hardness is 800HV. (Adapted from the work of Nikas [65,66]).
| Particle Diameter (µm) | Particle Hardness (HV) | Maximum Flash Temperature (°C) | |
|---|---|---|---|
| Surface 1 | Surface 2 | ||
| 5 | 100 | 93 | 17 |
| 5 | 200 | 185 | 34 |
| 5 | 400 | 350 | 68 |
| 10 | 100 | 211 | 103 |
| 10 | 200 | 415 | 182 |
| 10 | 400 | 760 | 318 |
| 20 | 100 | 1350 | 846 |
| 20 | 200 | 1560 | 962 |
| 20 | 400 | 1830 | 1120 |
Table 3.
Chemical composition of the 42CrMo-4 steel [mass%].
| C | Si | Mn | S | P |
| 0.343 ± 0.012 | 0.54 ± 0.02 | 1.07 ± 0.03 | 0.014 ± 0.002 | 0.007± 0.001 |
| Cr | Cu | Ni | Mo | Al |
| 0.433 ± 0.01 | 0.0729 ± 0.004 | 0.418 ± 0.02 | 0.235 ± 0.01 | 0.0639 ± 0.004 |
Table 4.
List of lubricating oil mixtures as well as coal and coal-mineral contaminants examined.
| Variant no. | Oil Tested | Mass Fraction of Abrasive, % |
Grain Diameter |
|---|---|---|---|
| 0 | Class VG 220 mineral oil | 0 % | |
| 1 | 1% | 0÷100 μm | |
| 2 | 1% | ||
| 3 | 1% | ||
| 4 | 1% | ||
| 5 | 1% |
Table 5.
List of parameters characterising clean and contaminated lubricating oil.
| Parameters | Variant 0 | Mean for Variant 1÷5 |
|---|---|---|
| Kinematic viscosity at 40°C | 189 mm2/s | 195.4 mm2/s |
| Kinematic viscosity at 100°C | 16.42 mm2/s | 16.6 mm2/s |
| Density at 15°C | 880 kg/m3 | 890 kg/m3 |
Table 6.
Results of calculations of minimum oil film thickness hmin and relative oil film thickness λ for the roller-roller combination.
Table 6.
Results of calculations of minimum oil film thickness hmin and relative oil film thickness λ for the roller-roller combination.
| Parameters | Variant 0 | Mean for Variant 1÷5 |
|---|---|---|
| Minimum oil film thickness hmin | 0.212 μm | 0.218μm |
| Relative oil film thickness λ | 0.445 μm | 0.456 μm |
Table 7.
Results of calculations of Hertzian pressure and related parameters.
| Hertzian pressure | -420.166 N/mm² |
| Half pressure width b | 0.074 mm |
| Maximum shear stress | 126.169 N/mm² |
| Distance at maximum shear stress | 0.058 mm |
Table 8.
Chemical analysis of test samples.
| Component | Variant no. | |||||
|---|---|---|---|---|---|---|
| 1 | 2 | 1 | 4 | 1 | ||
| C, % | 71,8 ± 2,9 | 51,2 ± 2,1 | 30,2 ± 1,2 | 5,08 ± 0,51 | 1,75 ± 0,18 | |
| S, % | 1,15 ± 0,17 | 1,02 ± 0,15 | 1,19 ± 0,18 | 0,14 ± 0,05 | 0,09 ± 0,04 | |
| SiO2 , % | 3,72 ± 0,19 | 15,75 ± 0,79 | 31,16 ± 0,78 | 50,06 ± 1,25 | 57,42 ± 1,44 | |
| Al2O3, % | 2,65 ± 0,13 | 6,50 ± 0,32 | 12,62 ± 0,63 | 20,13 ± 1,01 | 24,90 ± 1,24 | |
| Fe2O3, % | 1,10 ± 0,11 | 1,90 ± 0,19 | 3,99 ± 0,20 | 8,87 ± 0,44 | 2,29 ± 0,11 | |
| TiO2 , % | 0,10 ± 0,05 | 0,30 ± 0,15 | 0,55 ± 0,27 | 0,83 ± 0,42 | 0,58 ± 0,29 | |
| MnO, % | 0,02 ± 0,01 | 0,03 ± 0,02 | 0,10 ± 0,05 | 0,22 ± 0,11 | 0,03 ± 0,01 | |
| CaO, % | 0,57 ± 0,28 | 1,36 ± 0,14 | 1,69 ± 0,17 | 0,66 ± 0,33 | 0,13 ± 0,06 | |
| MgO, % | 0,31 ± 0,15 | 0,94 ± 0,47 | 1,57 ± 0,16 | 1,94 ± 0,19 | 0,85 ± 0,42 | |
| Na2O, % | 0,20 ± 0,10 | 0,08 ± 0,04 | 0,23 ± 0,11 | 0,26 ± 0,13 | 0,94 ± 0,47 | |
| K2O, % | 0,14 ± 0,07 | 0,73 ± 0,36 | 1,71 ± 0,17 | 2,79 ± 0,14 | 2,78 ± 0,14 | |
| P2O5, % | 0,10 ± 0,05 | 0,03 ± 0,02 | 0,13 ± 0,06 | 0,22 ± 0,11 | 0,07 ± 0,04 | |
| Ash, % | 9,24%±0,51 | 29,15%±0,51 | 55,28%±0,51 | 85,93%±0,51 | 89,78%±0,51 | |
Disclaimer/Publisher’s Note: The statements, opinions and data contained in all publications are solely those of the individual author(s) and contributor(s) and not of MDPI and/or the editor(s). MDPI and/or the editor(s) disclaim responsibility for any injury to people or property resulting from any ideas, methods, instructions or products referred to in the content. |
© 2025 by the authors. Licensee MDPI, Basel, Switzerland. This article is an open access article distributed under the terms and conditions of the Creative Commons Attribution (CC BY) license (http://creativecommons.org/licenses/by/4.0/).
Copyright: This open access article is published under a Creative Commons CC BY 4.0 license, which permit the free download, distribution, and reuse, provided that the author and preprint are cited in any reuse.


