Submitted:
05 November 2025
Posted:
06 November 2025
You are already at the latest version
Abstract
This study investigates the dielectric relaxation dynamics of lithium aluminosilicate (LAS) glass-ceramics using the Debye and Cole–Cole relaxation frameworks to elucidate their high-frequency dielectric behaviour. Numerical simulations were performed in a MATLAB environment across a wide range of frequencies and temperatures, employing the Debye, Cole–Cole, and Arrhenius models to characterize polarization and relaxation processes. The Debye model revealed a noticeable frequency dependence, with the dielectric constant (ε^') exhibiting high values at low frequencies and progressively decreasing with increasing frequency, while the dielectric loss (ε^'') exhibited a characteristic relaxation peak associated with the condition ωτ=1. Temperature-dependent analysis indicated that ε^' increased with temperature due to enhanced dipolar mobility, whereas ε^'' decreased, suggesting reduced energy dissipation at elevated temperatures. The Cole–Cole model predicted slightly higher dielectric constants but demonstrated similar overall trends, capturing the non-ideal relaxation behaviour characteristic of LAS. Activation energies obtained from Arrhenius analysis ranged from 0.046–0.476 eV (Debye) and 0.045–0.464 eV (Cole–Cole), aligning closely with reported literature values. These findings highlight the distributed and thermally activated nature of dipolar and ionic relaxation in LAS glass-ceramics.
Keywords:
relaxation dynamics
; lithium aluminosilicate
; high-frequency
; dielectric
; behaviour
1. Introduction
The fifth-generation (5G) mobile network, which represents the evolutionary step beyond fourth-generation (4G) technology, is primarily characterized by its reliance on millimeter-wave spectra to achieve enhanced data rates and reduced dormancy. However, studies have shown that materials incorporated in mobile phones and other electronic devices can affect the efficiency of the 5G signal transmission because of their dielectric loss characteristics [1,2,3]. In an effort to enhance transmission efficiency and minimize dielectric losses in 5G networks, researchers across the globe are investigating the high-frequency dielectric behaviour of different materials. Notably, glass-ceramics in particular have drawn significant attention among these materials based on their broad usage in electronic equipment.
Glass-ceramics are hybrid materials consisting of ceramic phases obtained through a glass-melting process followed by controlled crystallization [4]. These materials demonstrate significant decrease in pore volume, with their dielectric constant being dictated not predominantly by pore density but rather by parameters including crystal phase, degree of crystallinity, grain morphology, and the chemical composition of the residual glass phase [5,6,7]. However, under conditions of limited crystallinity, the contribution of the residual glass phase becomes more prominent, leading to increased dielectric loss [8,9]. This suggests that under reduced crystallinity, the residual glass phase becomes the prevailing factor governing the dielectric response, resulting in a pronounced increase in dielectric losses. As a result, the material demonstrates lower dielectric effectiveness under high-frequency operation, posing challenges for its integration into electronic and telecommunication technologies.
Lithium aluminosilicate (LAS) glass-ceramics are recognized as low-loss dielectric materials, known by their low dielectric losses in combination with excellent thermal and mechanical stability. These attributes render them highly promising for integration into microwave and high-frequency device applications [10]. Lithium aluminosilicate (LAS) glass-ceramics exhibits low-loss dielectric characteristics when a high degree of crystallinity is achieved; however, their dielectric performance deteriorates markedly in the presence of a significant residual glass phase. Their dielectric response has been shown to depend strongly on the relaxation of mobile ions (Li⁺, O²⁻) and structural dipoles arising from Al–O and Si–O bonds under alternating fields [11,12]. This suggests that a comprehensive understanding of these relaxation mechanisms, together with their corresponding activation energies, is essential for optimizing LAS ceramics for advanced applications in telecommunication systems, high-power electronics, and energy storage technologies. Although lithium aluminosilicate (LAS) has been widely studied as a structural ceramic owing to its outstanding thermal stability and mechanical strength, the dielectric relaxation dynamics that govern its high-frequency response remain inadequately understood. Therefore, the present study investigates the activation energies associated with dipolar and ionic relaxation processes through the analysis of Arrhenius plots of relaxation time (τ) as a function of inverse temperature (1/T), employing both the Debye and Cole–Cole relaxation models.
2. Theoretical Background
Studies have demonstrated that, under an alternating electric field, fundamental atomic models reveal that the dielectric constant of a material is a complex quantity comprising real and imaginary components. The real component represents the energy stored within the dielectric medium, while the imaginary component corresponds to the energy dissipated as heat due to the time-dependent polarization of atoms and molecules [13,14]. Beginning with the Debye relaxation model, which describes the dielectric loss peak, the complex permittivity for a single Debye relaxation process is expressed as:
where, , and and are donate static and high-frequency permittivity. Now to separate the real and the imaginary components, the numerator and denominator of Equation (1) is multiplied by , that is:
Simplying the Equation (2) gives the real part of the dielectric constant as:
And the imaginary component becomes
In Equation (4), let such that . The dielectric loss reaches its maximum when To determine this condition, Equation (4) is differentiated with respect to the angular frequency ω, and the resulting expression is set equal to zero.
This implies that Thus at the loss peak,
In Equation (6), where . Therefore, Equation (6) becomes
At the microscopic scale, dipole reorientation and ion hopping are thermally activated processes. According to transition-state theory and the theory of activated rate processes, the overall rate is determined by the product of the attempt frequency and the probability of overcoming the potential energy barrier [15]. The relation follows an Arrhenius-type behaviour given by:
where is relaxation time, is the characteristic attempt time, is the activation energy, is the Boltzmann constant, and T is the temperature. Taking the natural logarithm on Equation (8) gives:
The situation, however, differs for real dielectric systems such as LiAlSiO₄ ceramics, glass-ceramics, and nanofluids, where the polarization entities do not relax uniformly. In such materials, a distribution of relaxation times exists rather than a single characteristic time, rendering the ideal Debye model inadequate. To account for this non-uniform relaxation behaviour, Cole and Cole (1941) introduced an empirical modification integrating a broadening parameter, α (0 ≤ α < 1), which describes the deviation from ideal Debye relaxation [16]. The Cole-Cole permittivity is expressed as thus:
where stands for the Debye behaviour and distributed relaxation times represent the non-Debye. The real and imaginary components of the Cole-Cole relaxation model is given by:
and the imaginary component is:
To determine the activation energy in materials exhibiting a broad distribution of relaxation times, the effective or central activation energy was evaluated based on the characteristic relaxation time derived from the Cole–Cole model. The effective activation energy, , representing the dominant energy barrier associated with the relaxation process, is expressed as:
3. Methodology
The dielectric relaxation characteristics of lithium aluminosilicate (LAS) glass-ceramics were analyzed through simulations based on the Debye, Cole-Cole relaxation and Arrhenius models, executed within the MATLAB interactive computational environment to evaluate the temperature-dependent relaxation dynamics. The specific parameters adopted for the simulation process are compiled and presented in Table 1.
4. Simulation Procedure
The dielectric relaxation behaviour of lithium aluminosilicate (LAS) glass-ceramics was simulated in MATLAB to analyzed the temperature- and frequency- dependent dielectric response. The Debye relaxation and Arrhenius models were applied to describe dipolar relaxation dynamics and thermally activated processes, respectively. The simulation procedure began with the definition of essential physical constants and material parameters (Table 1), including permittivity, temperature, and relaxation-related variables. The frequency domain was subsequently established and converted into angular frequency for numerical computation.
The real (ε′) and imaginary (ε″) components of the complex permittivity were calculated using the Debye and Cole-Cole equations (Equations (3), (4), (11), and (12)), representing the energy storage and loss mechanisms, respectively. The relaxation time (τ) was determined from Equation (7), and its temperature dependence was analyzed using the Arrhenius relation (Equations (9) and (13)). A linear fit of ln(τ) versus 1/T provided the activation energy (Eₐ) and pre-exponential factor (τ₀) from the slope and intercept, respectively, based on Eₐ = slope × k and τ₀ = exp(intercept). Subsequently, plots of ε′, ε″, and τ as functions of frequency and temperature were generated to elucidate the relaxation behaviour and verify the theoretical models.
5. Results and Discussion
The parameters listed in Table 1 were fitted to the Debye and Cole–Cole relaxation models to analyze the dielectric behaviour as a function of frequency. Equations (3), (4), (11), and (12) were employed to simulate this response, while the Arrhenius model was utilized to evaluate the activation energy, effective energy barrier, pre-exponential factor, and intercept across different temperature ranges (100–200 °C, 200–300 °C, 300–400 °C, and 400–500 °C). The examination of dipolar reorientation, defect-induced dipolar relaxation, and ionic hopping mechanisms within these temperature intervals was carried within the temperature ranges.
5.1. Dielectric Response as a Function of Frequency Based on Debye Relaxation Model
The dielectric constant and dielectric loss were simulated over successive temperature ranges (100–200 °C, 200–300 °C, 300–400 °C, and 400–500 °C) using the Debye relaxation model Equations (3) and (4). The corresponding results are presented in Figure 1a–b, Figure 2a–b, Figure 3a–b, and Figure 4a–b, respectively.
The frequency-dependent dielectric behaviour at different temperatures in Debye model is presented in (Figures 1a–b, 2a–b, 3a–b, and 4a–b), respectively. As shown in (Figures 1a–4a), the dielectric constant exhibits higher values at low frequencies, indicating that polarization mechanisms (interfacial, dipolar, ionic, and electronic) have sufficient time to align with the applied electric field. This behaviour is consistent with findings reported in previous studies [19,20], which indicate that the frequency-dependent dielectric response originates from the combined effects of interfacial, dipolar, ionic, and electronic polarization mechanisms. However, with increasing frequency, certain polarization processes are unable to follow the rapid field oscillations, resulting in a marked decrease in the dielectric constant. This observation is also consistent with previous reports, which show that with increasing frequency, dipolar polarization arising from reorienting dipoles initially becomes significant but diminishes when the dipoles can no longer respond to the rapidly alternating electric field [21,22,23]. Even at higher frequencies, ionic and electronic polarizations remain operative; however, despite their rapid response to the alternating field, their relatively small contribution to polarization leads to characteristic decline in the dielectric constant [24].
The dielectric constant of lithium aluminosilicate (LAS) increases progressively with temperature (Figures 1a–4a). This enhancement is attributed to the thermally activated nature of polarization processes, as the dielectric constant is proportional to the extent of polarization developed under an applied electric field. At elevated temperatures, dipoles and ionic species possess greater thermal energy, allowing them to reorient or migrate more easily in response to the alternating field. In LAS, the increased mobility of Li⁺ ions and defect–dipole complexes (Li⁺–O⁻) enhances both dipolar and ionic polarization contributions, thereby leading to a higher dielectric constant [25,26].
The dielectric loss behaviour was studied across different frequency and temperature ranges in Debye relaxation model. In this model, the dielectric loss exhibited a similar frequency-dependent trend: it remained relatively low at low frequencies, increased sharply to a maximum at the characteristic (or relaxation) frequency, and subsequently decreased with further increase in frequency. This peak behaviour arises from the dominance of different polarization mechanisms at distinct frequency regimes. At low frequencies, interfacial and dipolar polarizations contribute significantly, whereas at higher frequencies, these mechanisms fail to follow the rapidly oscillating field, leading to a reduction in dielectric loss. Such behaviour is consistent with previous findings reported in the literature [27,28].
The temperature-dependent behaviour of dielectric loss studied in the Debye model; the dielectric loss was relatively high at lower temperatures but decreased remarkably with increasing temperature (Figures 1b–4b). This trend arises because, at low temperatures, the relaxation time is large, and dipoles reorient more slowly, resulting in greater energy dissipation. As temperature increases, thermal activation enhances dipole mobility, allowing them to follow the alternating electric field more effectively and thereby reducing dielectric loss. Such behaviour is typical of materials with thermally activated dipoles, where relaxation becomes more complete at higher temperatures [29,30,31].
5.2. Dielectric Response as a Function of Frequency Based on Cole-Cole Relaxation Model
The dielectric constant and dielectric loss factor were simulated over the same frequency and temperature ranges using the Cole–Cole relaxation model (Equations (11) and (12)). The corresponding variations in dielectric constant and loss factor are presented in Figure 5a–b, Figure 6a–b, Figure 7a–b, and Figure 8a–b, respectively.
The variation of dielectric constant with frequency follows a similar trend to that predicted by the Debye relaxation model. However, under the Cole–Cole framework, the dielectric constant exhibits minimal change with increasing temperature (Figures 5a–8a). This behaviour likely arises from the underlying polarization mechanisms. In lithium aluminosilicate (LAS), the dominant dipolar entities are Li⁺–O⁻ defect pairs, which possess relatively low dipole moment densities and are partially immobilized within the rigid aluminosilicate network [32]. Consequently, temperature elevation does not substantially alter the number of active dipoles contributing to polarization, leading to a nearly temperature-invariant dielectric constant. Additionally, a relatively large Cole–Cole broadening parameter (α) indicates a wide distribution of relaxation times, which smooths out sharp temperature-dependent variations and produces an averaged dielectric response rather than a distinct temperature sensitivity [33].
The dielectric loss behaviour of lithium aluminosilicate (LAS) ceramics, analyzed using the Cole–Cole relaxation model, exhibited low losses at low frequencies, a pronounced peak at the characteristic (relaxation) frequency, and a gradual decline at higher frequencies similar to the Debye response (Figures 5b–8b). The loss maximum occurs when , signifying that the relaxation rate of dipoles or ions matches the frequency of the applied electric field, leading to maximum energy dissipation. In LAS, this loss peak is primarily associated with Li⁺ ion migration and defect-dipole reorientation (Li⁺–O⁻ pairs or Li⁺ vacancies) [34]. The Cole–Cole model further indicates a distribution of relaxation times arising from structural heterogeneity, where not all dipoles or ions relax simultaneously.
The temperature-dependent behaviour of dielectric loss exhibited slight differences between the Debye and Cole–Cole models. In the Debye model, the dielectric loss was relatively high at lower temperatures but decreased remarkably with increasing temperature (Figures 1b–4b). This trend arises because, at low temperatures, the relaxation time is large, and dipoles reorient more slowly, resulting in greater energy dissipation. As temperature increases, thermal activation enhances dipole mobility, allowing them to follow the alternating electric field more effectively and thereby reducing dielectric loss. Such behaviour is typical of materials with thermally activated dipoles, where relaxation becomes more complete at higher temperatures.
In contrast, the Cole–Cole model, which accounts for a distribution of relaxation times, exhibits a more gradual or non-monotonic temperature dependence of ε″ (Figures 5b–8b). The broad distribution of relaxation processes causes overlapping contributions, effectively smoothing out the sharp temperature variations observed in the Debye-type response.
5.3. Arrhenius Analysis Based on the Debye Relaxation Model
5.4. Arrhenius Analysis Based on the Cole-Cole Relaxation Model
The same datasets were subsequently fitted using the Cole–Cole relaxation model (Equation (13)) to evaluate the temperature-dependent relaxation dynamics, with the resulting Arrhenius plots shown in Figure 13, Figure 14, Figure 15 and Figure 16.
The activation energy of lithium aluminosilicate (LAS) glass-ceramics was examined within the temperature range of 100–500 °C using both the Debye (Figure 9, Figure 10, Figure 11 and Figure 12) and Cole–Cole (Figure 13, Figure 14, Figure 15 and Figure 16) relaxation models. Within the Debye framework, the activation energy values ranged from 0.046 eV to 0.476 eV, while those derived from the Cole–Cole model varied between 0.045 eV and 0.464 eV. These values are in close agreement with those previously reported by Lin and Zhang (2001) [35], further validating the reliability of the present analysis. These variations in activation energy provide insight into the underlying relaxation mechanisms governing the dielectric response of the LAS system. The activation energy derived from the Arrhenius plots of relaxation time (τ) corresponds to the potential barrier associated with dipolar or ionic motion. At lower temperatures (100–200 °C), the dielectric relaxation is predominantly governed by dipolar reorientation or localized ionic hopping within the glassy matrix. As the temperature increases, ionic hopping processes become increasingly significant, while at higher temperatures, the relaxation behavior is dominated by long-range ionic migration across the aluminosilicate network [36].
The activation energies obtained from the Debye relaxation model were slightly higher than those derived from the Cole–Cole model. Studies have established that the Debye relaxation model represents the most fundamental and idealized description of dielectric relaxation, assuming a single, well-defined relaxation time and, consequently, a unique activation energy [37,38]. The relatively high apparent activation energy predicted by the Debye model in this work may likely arises from its inherent simplifications. Specifically, the model is constructed on restrictive assumptions which includes, the dipoles that are independent, non-interacting entities exhibiting a uniform relaxation time and a simple exponential decay behaviour [39,41]. In contrast, the Cole–Cole model combines a distribution of relaxation times associated with structural disorder and heterogeneous local environments, allowing partial or localized dipole reorientations with lower energy barriers. Consequently, the effective activation energy estimated from the Cole–Cole model is comparatively smaller.
6. Conclusions
The dielectric constant of lithium aluminosilicate (LAS) glass-ceramics decreased with increasing frequency in both the Debye and Cole–Cole relaxation models, demonstrating typical dielectric dispersion behaviour. In the Debye model, values were higher at low frequencies and showed moderate temperature dependence, reflecting enhanced dipole mobility at elevated temperatures (Figures 1a–4a). In contrast, the Cole–Cole model exhibited minimal temperature variation, consistent with a broad distribution of relaxation times that smooths out sharp thermal effects (5a -8a). These results suggest that while both models describe the general relaxation behaviour, the Cole–Cole model more accurately represents the non-ideal dielectric response of defect-rich LAS glass-ceramics.
As shown in Figures 1b–4b (Debye model) and Figures 5b–8b (Cole–Cole model), the dielectric loss ( ) of LAS ceramics exhibits distinct relaxation peaks that shift with temperature, reflecting thermally activated dipolar and ionic dynamics. Within the Cole–Cole framework, the appearance of a broad peak indicates a distribution of relaxation times rather than a single Debye-type process. This broadening arises from structural heterogeneities and the presence of multiple polarization mechanisms such as Li⁺ ion hopping and defect–dipole (Li⁺–O⁻) reorientation. The temperature-dependent shift of the peak toward higher frequencies signifies that these dipolar and ionic species acquire sufficient thermal energy to reorient more rapidly under the alternating electric field.
The activation energies obtained from the Arrhenius plots of ln(τ) versus 1/T, which range from 0.046 eV to 0.476 eV, correspond to distinct relaxation regions where the lower values are indicative of localized dipolar reorientation, while the higher values reflect long-range ionic migration processes. This broad energy distribution underscores the non-Debye relaxation behaviour of LAS ceramics. Accordingly, the Cole–Cole model provides an accurate description of this behaviour by accounting for the distribution of relaxation times arising from structural disorder and heterogeneous local environments, thereby revealing that the dielectric response of LAS is governed by a continuum of thermally activated relaxation mechanisms contributing to the observed dielectric dispersion.
References
- Li, M., Kong, L.,Wang, W., Ma, Y., & Jiang, H. Microstructure, Dielectric Properties and Bond Characteristics of Lithium Aluminosilicate Glass-Ceramics with Various Li/Na Molar Ratio, Cryst.2023, 13, 1647.
- Li, Y., Liu, J., Jin, C., Lin, H., & Shen, J. Experimental study and mechanism analysis of functional nanocrystalline cellulose to improve the electromagnetic transmission performance of ordinary Portland cement, Cem. Conc. Comp. 2023, 143, 105272.
- Rodriguez-Cano, R., Perini, S., & Lanagan, M. Dielectric Characterization of Materials at 5G mm-Wave Frequencies, 18th edition of the European Conference on Antennas and Propagation (EuCAP) IEEE, 2024,.
- Liu, S.; Wang, J.; Ding, J.; Hao, H.; Zhao, L.; Xia, S. Crystallization, microstructure and dielectric properties of the SrO-BaONb2O5-Al2O3-SiO2 based glass ceramics added with ZrO2. Ceram. Int. 2019, 45, 4003–4008.
- Ihyadn, A., Mezzane, D., Amjoud, M. B., Lahmar, A., Bih, L., Alimoussa, A., Luk’yanchuk, I., & El Marssi, M. Crystallization, dielectric, and energy storage properties of phosphate glass–ceramics. J App Mat Sci & Engg. Res, 2024, 8(1), 01-09.
- Yoon, S.O.; Shim, S.H.; Kim, K.S.; Park, J.G.; Kim, S. Low-temperature preparation and microwave dielectric properties of ZBS glass–Al2O3 composites. Ceram. Int. 2009, 35, 1271–1275.
- Fang, Y.; Li, L.; Xiao, Q.; Chen, X.M. Preparation and microwave dielectric properties of cristobalite ceramics. Ceram. Int. 2012, 38, 4511–4515.
- Wang, J., Xin, Z., Hao, H., Wang, Q., Sun, X., & Liu, S. Reinforced dielectric properties and energy storage performance of BaO–Na2O–Nb2O5–SiO2–TiO2–ZrO2 dielectric glass ceramics, Ceram. Int. 2024, 50(10), 17283-17290.
- Ren, Q., Liu, C., Liu, T., Zhang, Y., Ouyang, Y., & Lu, A. Influence of nucleating agents on crystallization and electrical properties of SiO2–MgO–MgF2–K2O mica glass-ceramics, Ceram. Int. 2021, 47(18), 25997-26009.
- Venkateswaren, C., Screemoolanadhan, H., & Vaish, R. Lithium aluminosilicate (LAS) Glass-Ceramics: a review of recent progress, Int. Maters. Rev. 2021, 67(7): 1-38.
- Vigier, M., Deniard, P., Gautron, E., Gautier N., Genevois, C., Ory, S., Allix, M., Kacem, I. B., & Jobic, S. Microstructural insights on lithium aluminum silicate (LAS) glass ceramics. Ceram. Int., 2024, 50 (16), 29011-29015.
- Kumar A, Kaity S, Chakrabarti A, Chatterjee S, Shekhawat MS, Molla AR. Optical and Mechanical Properties of Lithium Aluminosilicate Glass-ceramics. J. Cond. Matt. 2023, 1(01):20-3. Available from: https://jcm.thecmrs.in/index.php/j/article/view/5.
- Prokopchuk, A.; Zozulia, I., Didenko, Y.; Tatarchuk, D, Heuer, H., Poplavko, Y. Dielectric Permittivity Model for Polymer–Filler Composite Materials by the Example of Ni- and Graphite-Filled Composites for High-Frequency Absorbing Coatings. Coatings 2021, 11, 172. https://doi.org/10.3390/coatings11020172.
- Onimisi, M.Y., and Ikyumbur, J.T. Comparative Analysis of Dielectric Constant and Loss Factor of Pure Butan-1-ol and Ethanol, A. J. Matt. Phys. 2015, 5(3): 69-75.
- Das, A. and Schweizer, K.S. Microscopic theory of activated ion hopping in polymerized ionic liquids and glasses, J Chem Phys, 2025, 162 (19), 194906.
- Sasaki, K., Wake, K., & Watanabe, S. Development of best-fit Cole—Cole parameters for measurement data from biological tissues and organs between 1 MHz and 20 GHz, Rad. Sc., 2014, 49(7).
- Mohr, P.J., Newell, D.B., & Taylor, B.N. CODATA Recommended Values of the Fundamental Physical Constants, 2022, Rev. Mod. Phys., 97, 2025.
- Mohr, P.J., Newell, D.B., & Taylor, B.N. CODATA Recommended Values of the Fundamental Physical Constants:2014, arXiv:1507. 07956v1 [physics. atomic-ph.], 2015.
- Afandiyeva, I.M., Bulbul, .M.M, Altindal, S., & Bengi, S. Frequency dependent dielectric properties and electrical conductivity of platinum silicide/Si contact structures with diffusion barrier, M. Eng., 2012, 93, 50–55.
- Sevgili, O., Azizian, Y, & Altindal, S. Frequency and Voltage Dependence of Electrical and Dielectric Properties in Metal-Interfacial Layer-Semiconductor (MIS) Type Structures, Phys. B Cond. Matt., 2020, 587:412122.
- Lu, H., Xy, Z., & Zhang, H. Influence of the relaxation of Maxwell-Wagner-Sillars polarization and dc conductivity on the dielectric behaviors of nylon 1010, J. Appl. Phys., 2006, 100(5), 054104-054104-7.
- Wang, T., Hu, J., Yang, H., Jin, L., Wei, X., Li, C., Wen, F., & Lin, Y. Dielectric relaxation and Maxwell-Wagner interface polarization in Nb 2 O 5 doped 0.65BiFeO 3 –0.35BaTiO 3 ceramics, J. Appl. Phys., 2017, 121(8), 084103.
- Samet, M., Kallel, A., & Serghei A. Maxwell-Wagner-Sillars interfacial polarization in dielectric spectra of composite materials: Scaling laws and applications, J. Comp. Maters., 2022, 56(20), 3197-3217.
- Dakin, T.W. Conduction and Polarization Mechanisms and Trends in Dielectric, IEEE Ele. Ins. Mag., 2006, 22(5), 11-28.
- Singh, S., Kaur, A., Kaur, P., & Singh, L. High-Temperature Dielectric Relaxation and Electric Conduction Mechanisms in a LaCoO3-Modified Na0.5Bi0.5TiO3 System, ACS Omega, 2023, 8, 25623−25638.
- Chinnu, V., Sreemoolanadhan, H., & Vaish, R. Lithium aluminosilicate (LAS) glass-ceramics: a review of recent progress, Int’l. Maters. Revs., 2021, 67(7), 1-38.
- Narang, S.B. and Pubby, K. Nickel Spinel Ferrites: A review, J. Mag. & Mag. Maters., 2021, 519, 167163.
- Habeeb, M.A., Hashim, A., & Rabee, B.H. Study the Electrical Properties of PS-CaO Composites, A J Sc. Resear., 2012, 72, 5-9.
- Ronne, C., Thranea, L., Astrand, P., Wallqvist, A., Mikkelsen, K.V., & Keiding, S.R. Investigation of the Temperature Dependence of Dielectric Relaxation in Liquid Water by THz Reflection Spectroscopy and Molecular Dynamics Simulation, J. Chem. Phys., 1997, 107(14), 5319 – 5331.
- Didenko, Y.V., Poplavko, Y.M., & Tatarchuk, D.D. Temperature Dependences of Losses in High Frequency Dielectrics, Elect. and Comms., 2014, 19(4), 28 -35.
- Singh, S., Kaur, A., Kaur, P., & Singh, L. High-Temperature Dielectric Relaxation and Electric Conduction Mechanisms in a LaCoO3-Modified Na 0.5Bi0.5 TiO3System, ACS Omega 2023,8, 25623−25638.
- Wang, W., Zheng, D., Hu, M., Saeed, S., Liu, H., Kong, Y., Zhang, L., & Xu, J. Effect of Defects on Spontaneous Polarization in Pure and Doped LiNbO3: First-Principles Calculations, Maters. 2019, 12, 100.
- Puzenko, A., Ishai, P.B., & Feldman, Y. Cole-Cole Broadening in Dielectric Relaxation and Strange Kinetics, Phys. Rev. Letts., 2010, 105(3), 037601.
- Long, C., Fan, H., & Li, M. A ferroelectric polarization contribution from defect dipoles in acceptor Aurivillius oxide, (Na,Bi)0.47(Li,Ce)0.03Bi2Ta1.97Sc0.03O8.97, Appl. Phys. Letts., 2013, 103, 192908.
- Lin, G.C. and Zhang, J.X. A new method of calculating the activation energy of relaxor ferroelectrics, Ferroelectrics, 2001, 256(1), 69 -80.
- Da Silva, M.J., Pontuschka, W.M., Bartolome, J.F., Jasinski, P., Karczewski, J., & Reise, S.T. Ionic conductivity behavior by activated hopping conductivity (AHC) of barium aluminoborosilicate glass–ceramic system designed for SOFC sealing, J. Europ. Ceram. Soc. 39, 2019, 3103–3111.
- Alvarez, F., Arbe, A., & Colmenero, J. The Debye’s model for dielectric relaxation of liquid water and the role of cross-dipolar correlations. A MD -simulations study, J. Chem. Phys,2023, 159, 134505.
- Wang, M. and Cao, M. Perspectives on metal-organic framework-derived microwave absorption materials, J. Maters. Sc. & Tech., 2025, 214, 37-52.
- Pittini-Yamada, Y., Daneshvari, D., Pittini, R., Vaucher, S., Rohr, L., Leparoux, S., & Leuenberger, H. Cole–Cole plot analysis of dielectric behavior of monoalkyl ethers of polyethylene glycol (C n E m), Europ. Poly. J., 2008, 44(4), 1191 - 1199.
- Kharroubi, M., Assad, H., Gacem, L., & Henn, F. Study of Dielectric Relaxation Phenomena of Na2ZnP2O7 Diphosphate Glass Dopped with Cobalt (II) By Impedance Spectroscopy, IJETAE, 4(7) 2014.
- Liliya, B. and Nataliya, K. Modeling of Dielectric Permittivity of the Erythrocytes Membrane as a Three-layer model. http://dx.doi.org/10.30525/978-9934-571-31-2_2 2018. Assessed on 24/10/2025.
Figure 1.
(a) Variation of dielectric constant with frequency in the temperature range of 100–200 °C; (b) corresponding dielectric loss factor as a function of frequency within the same temperature interval.
Figure 1.
(a) Variation of dielectric constant with frequency in the temperature range of 100–200 °C; (b) corresponding dielectric loss factor as a function of frequency within the same temperature interval.
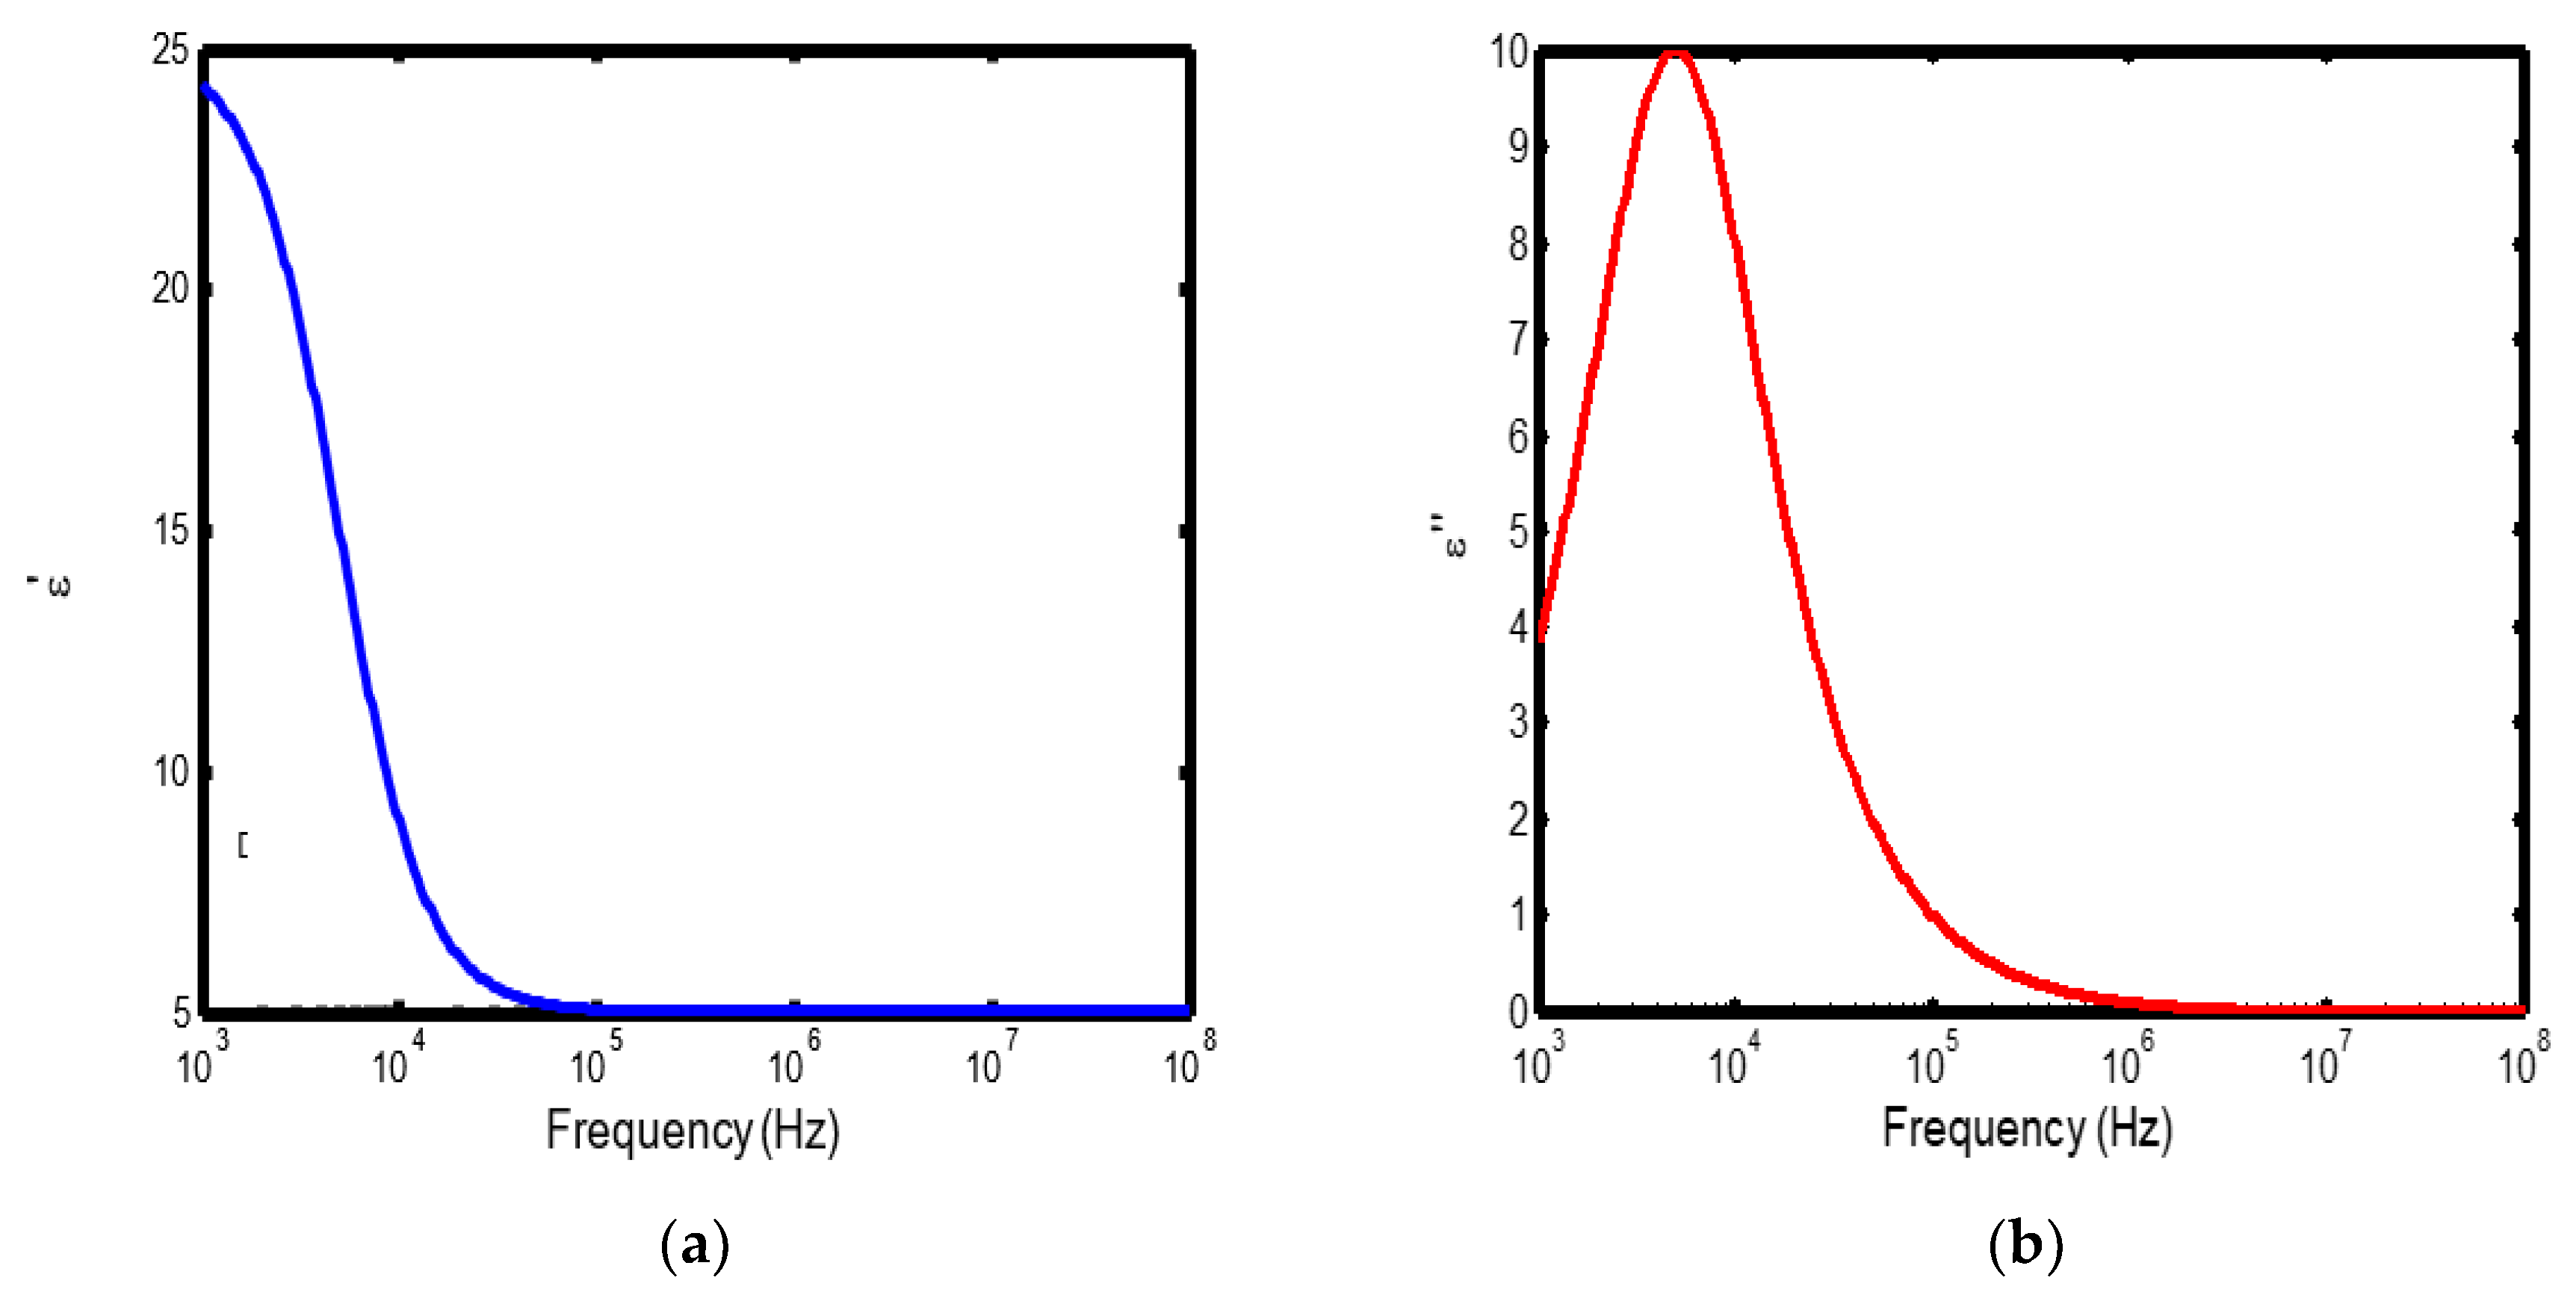
Figure 2.
(a) Variation of dielectric constant with frequency in the temperature range of 200–300 °C; (b) corresponding dielectric loss factor as a function of frequency within the same temperature interval.
Figure 2.
(a) Variation of dielectric constant with frequency in the temperature range of 200–300 °C; (b) corresponding dielectric loss factor as a function of frequency within the same temperature interval.
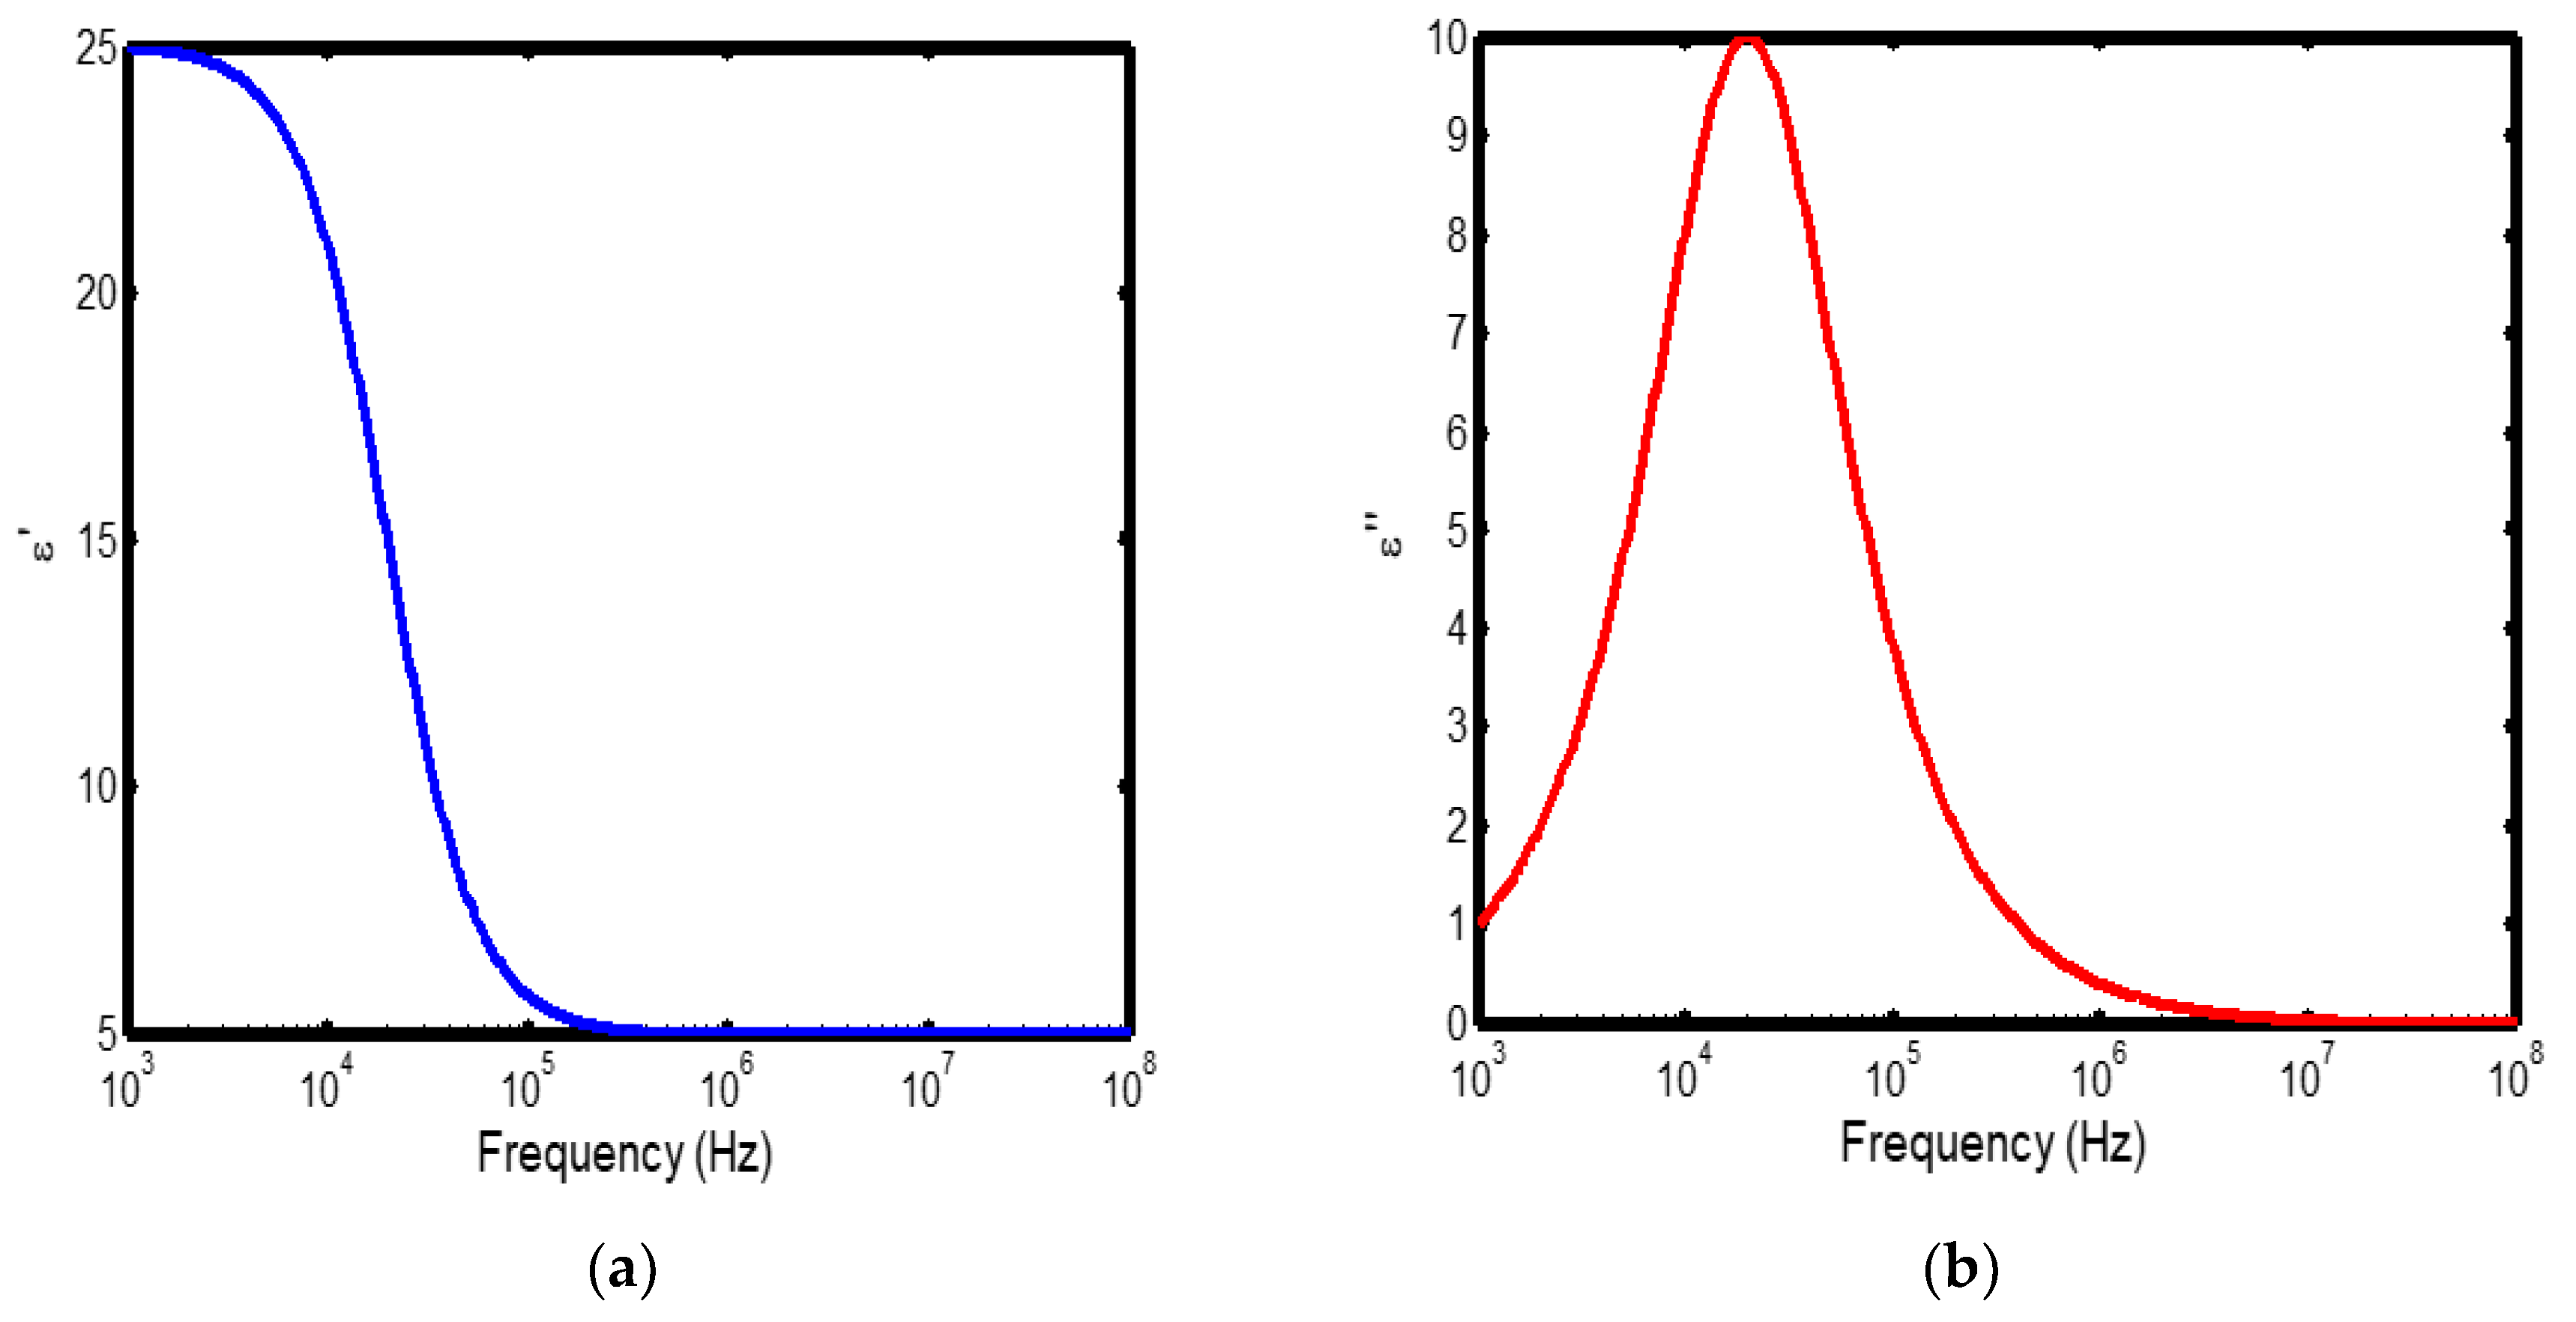
Figure 3.
(a) Variation of dielectric constant with frequency in the temperature range of 300–400 °C; (b) corresponding dielectric loss factor as a function of frequency within the same temperature interval.
Figure 3.
(a) Variation of dielectric constant with frequency in the temperature range of 300–400 °C; (b) corresponding dielectric loss factor as a function of frequency within the same temperature interval.
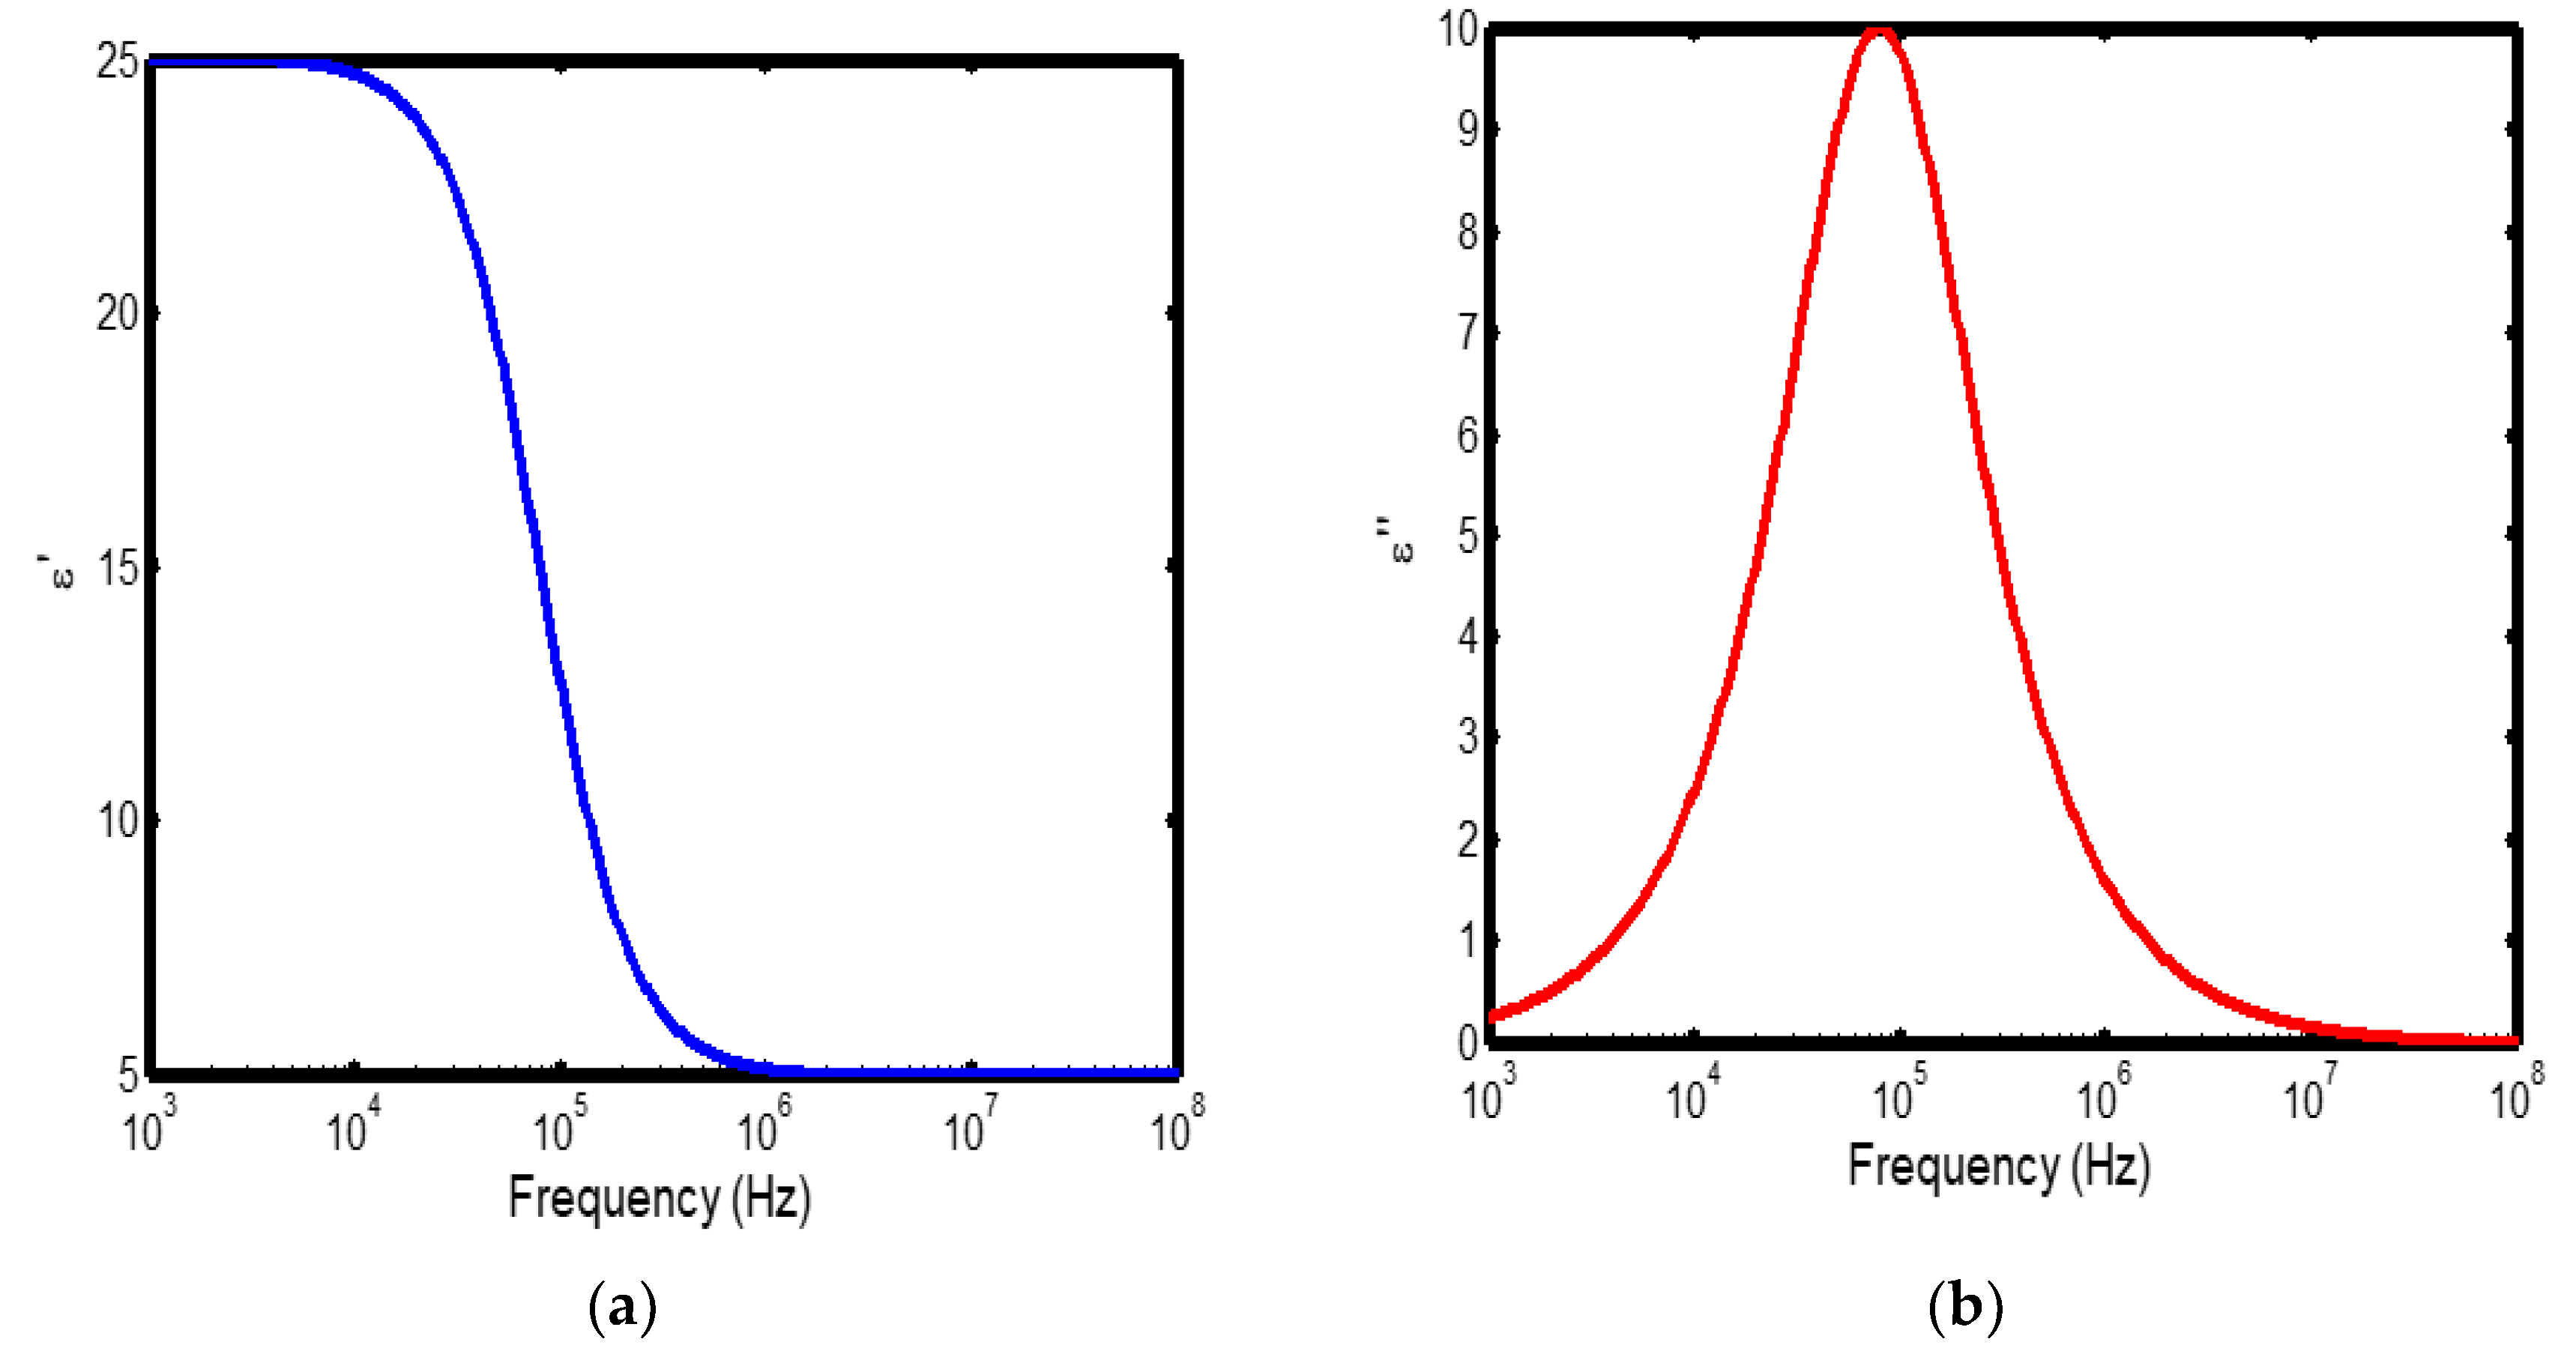
Figure 4.
(a) Variation of dielectric constant with frequency in the temperature range of 400–500 °C; (b) corresponding dielectric loss factor as a function of frequency within the same temperature interval.
Figure 4.
(a) Variation of dielectric constant with frequency in the temperature range of 400–500 °C; (b) corresponding dielectric loss factor as a function of frequency within the same temperature interval.
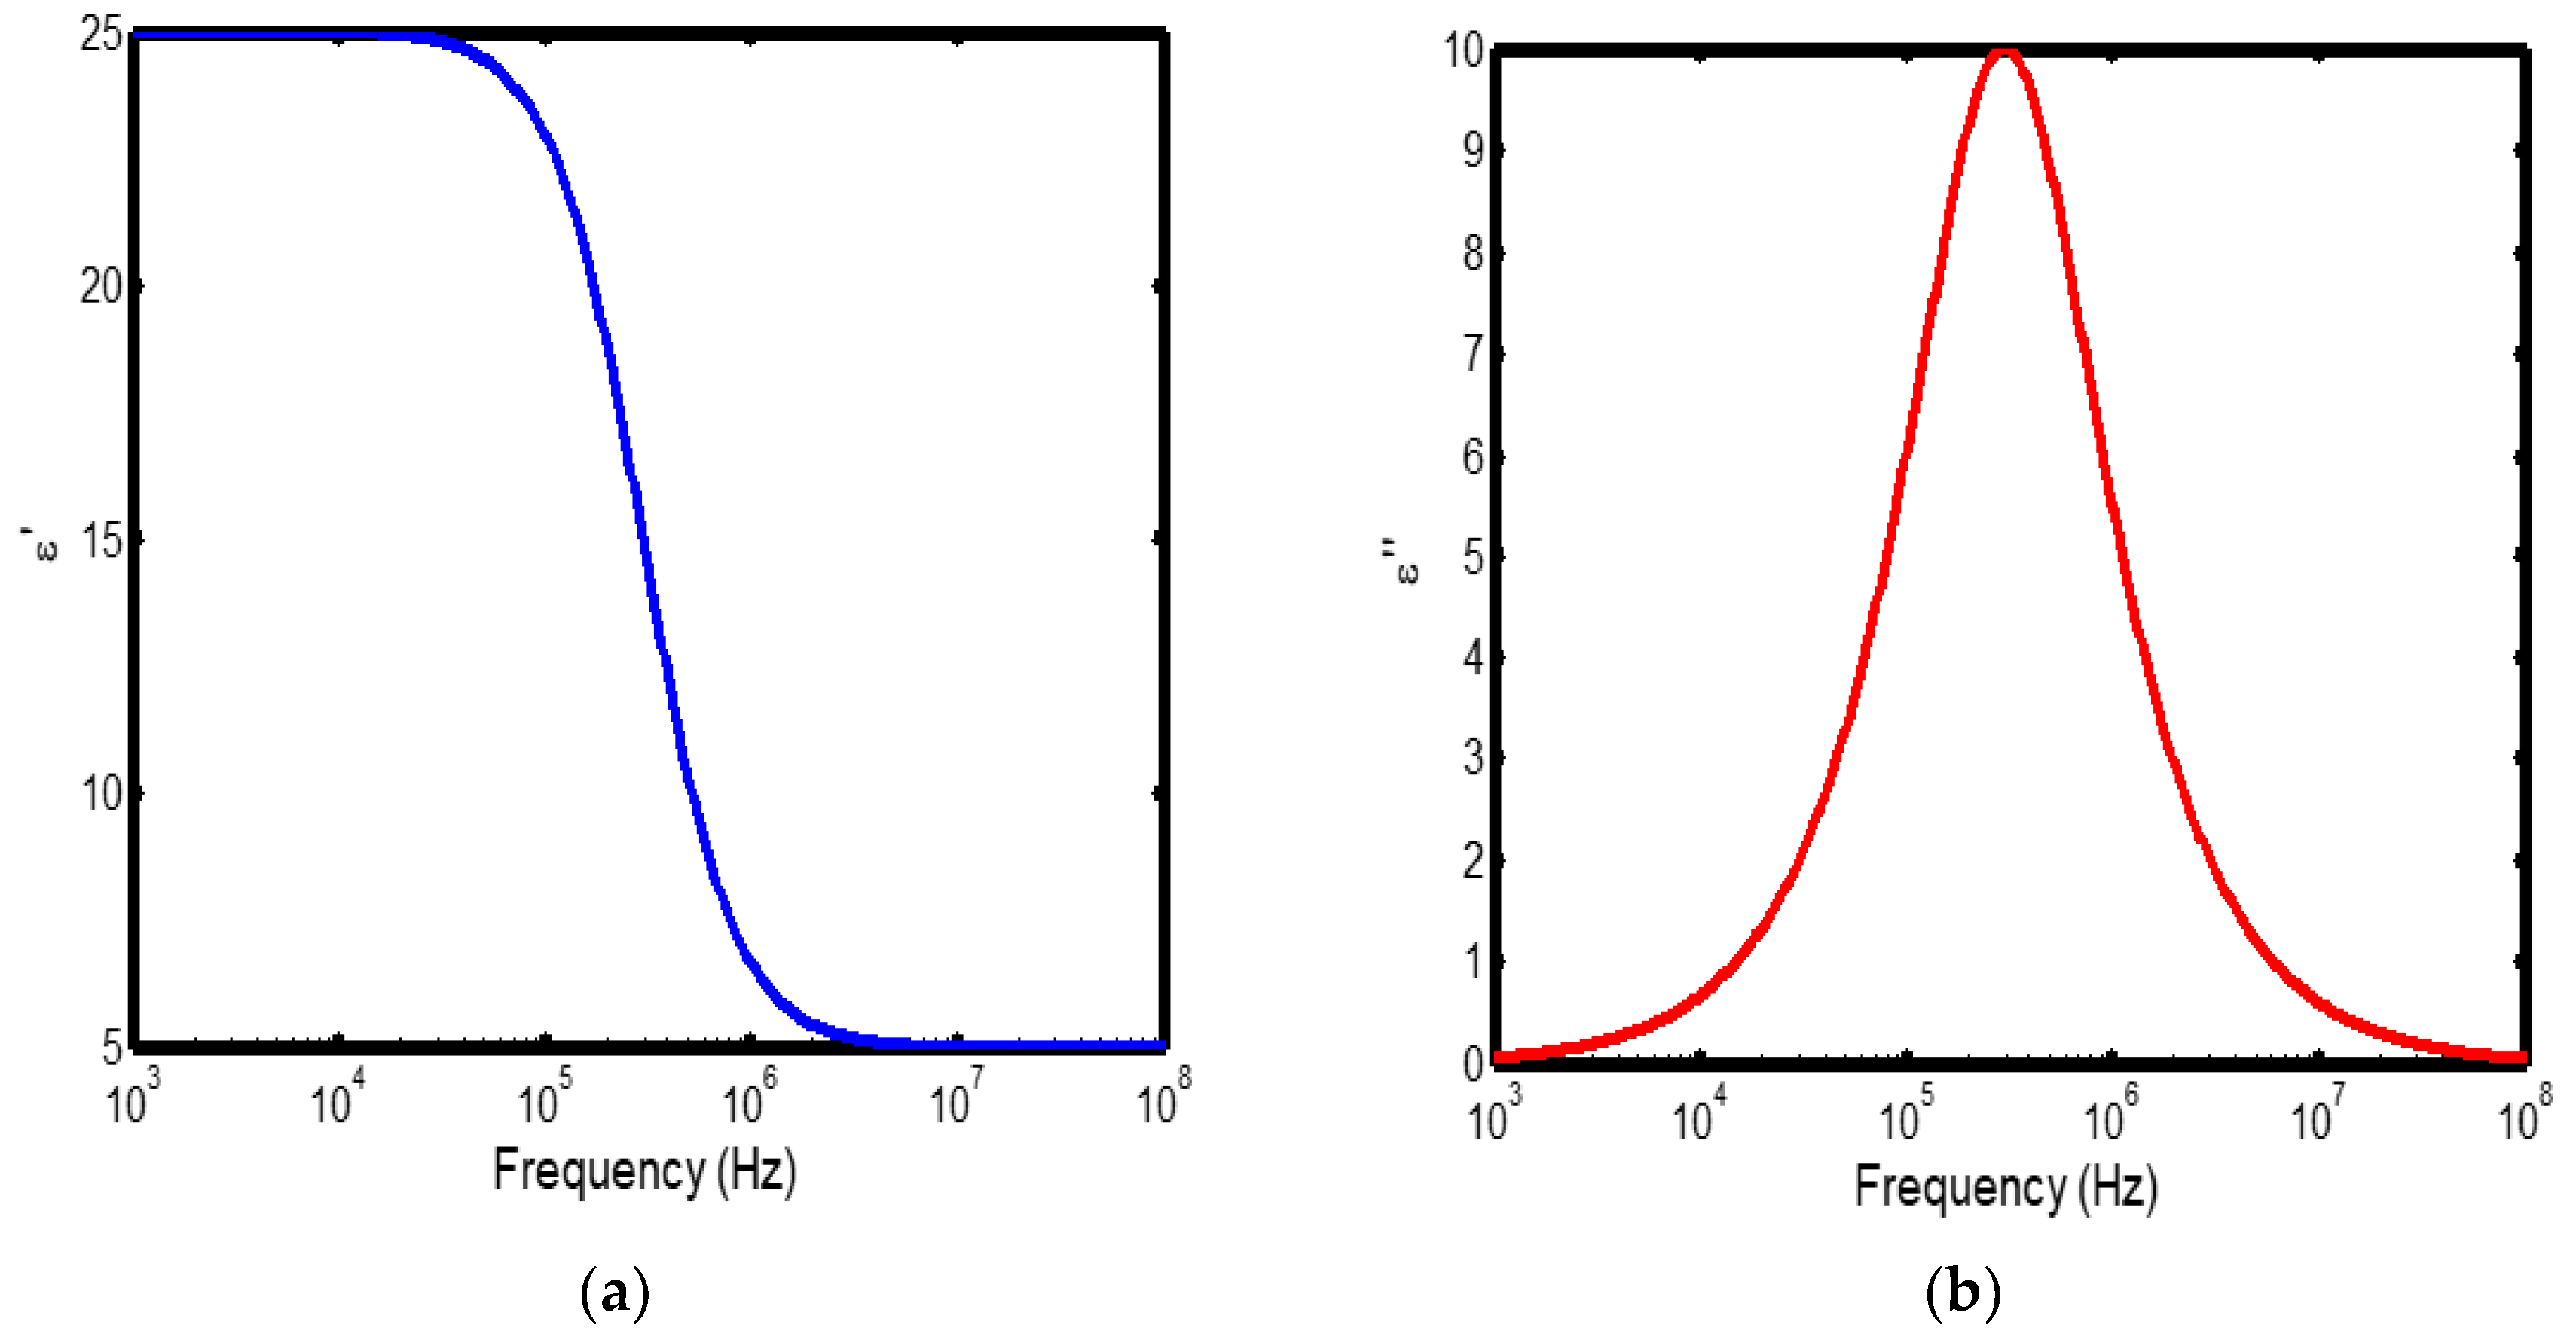
Figure 5.
(a) Variation of dielectric constant with frequency in the temperature range of 100–200 °C; (b) corresponding dielectric loss factor as a function of frequency within the same temperature interval, based on the Cole–Cole relaxation model.
Figure 5.
(a) Variation of dielectric constant with frequency in the temperature range of 100–200 °C; (b) corresponding dielectric loss factor as a function of frequency within the same temperature interval, based on the Cole–Cole relaxation model.
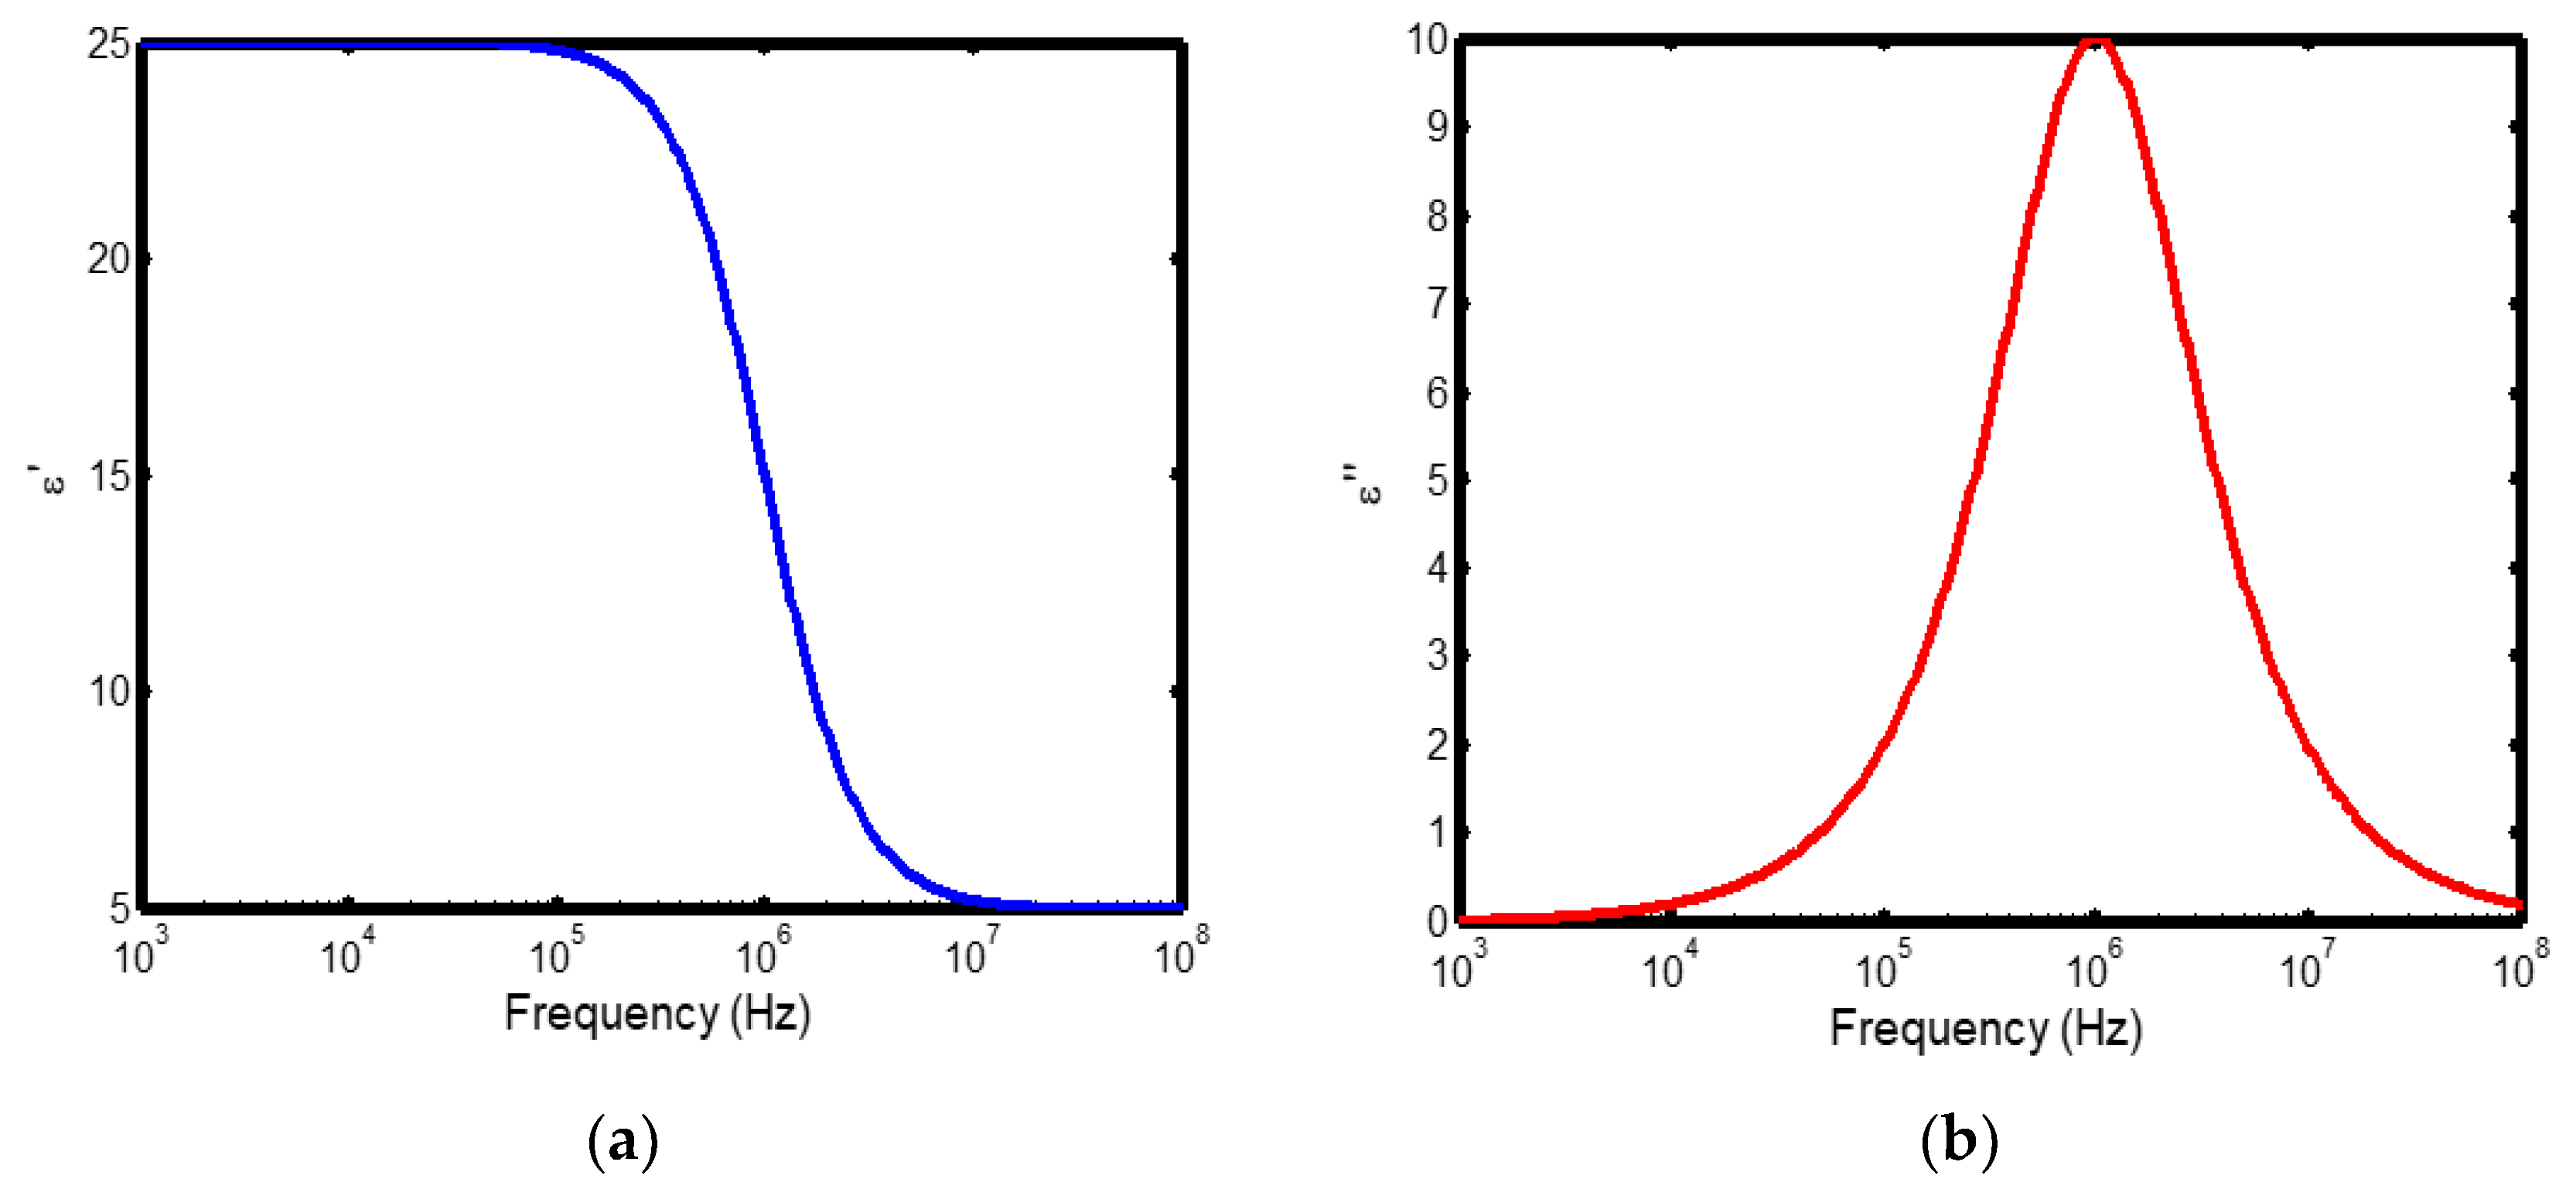
Figure 6.
(a) Variation of dielectric constant with frequency in the temperature range of 200–300 °C; (b) corresponding dielectric loss factor as a function of frequency within the same temperature interval, based on the Cole–Cole relaxation model.
Figure 6.
(a) Variation of dielectric constant with frequency in the temperature range of 200–300 °C; (b) corresponding dielectric loss factor as a function of frequency within the same temperature interval, based on the Cole–Cole relaxation model.
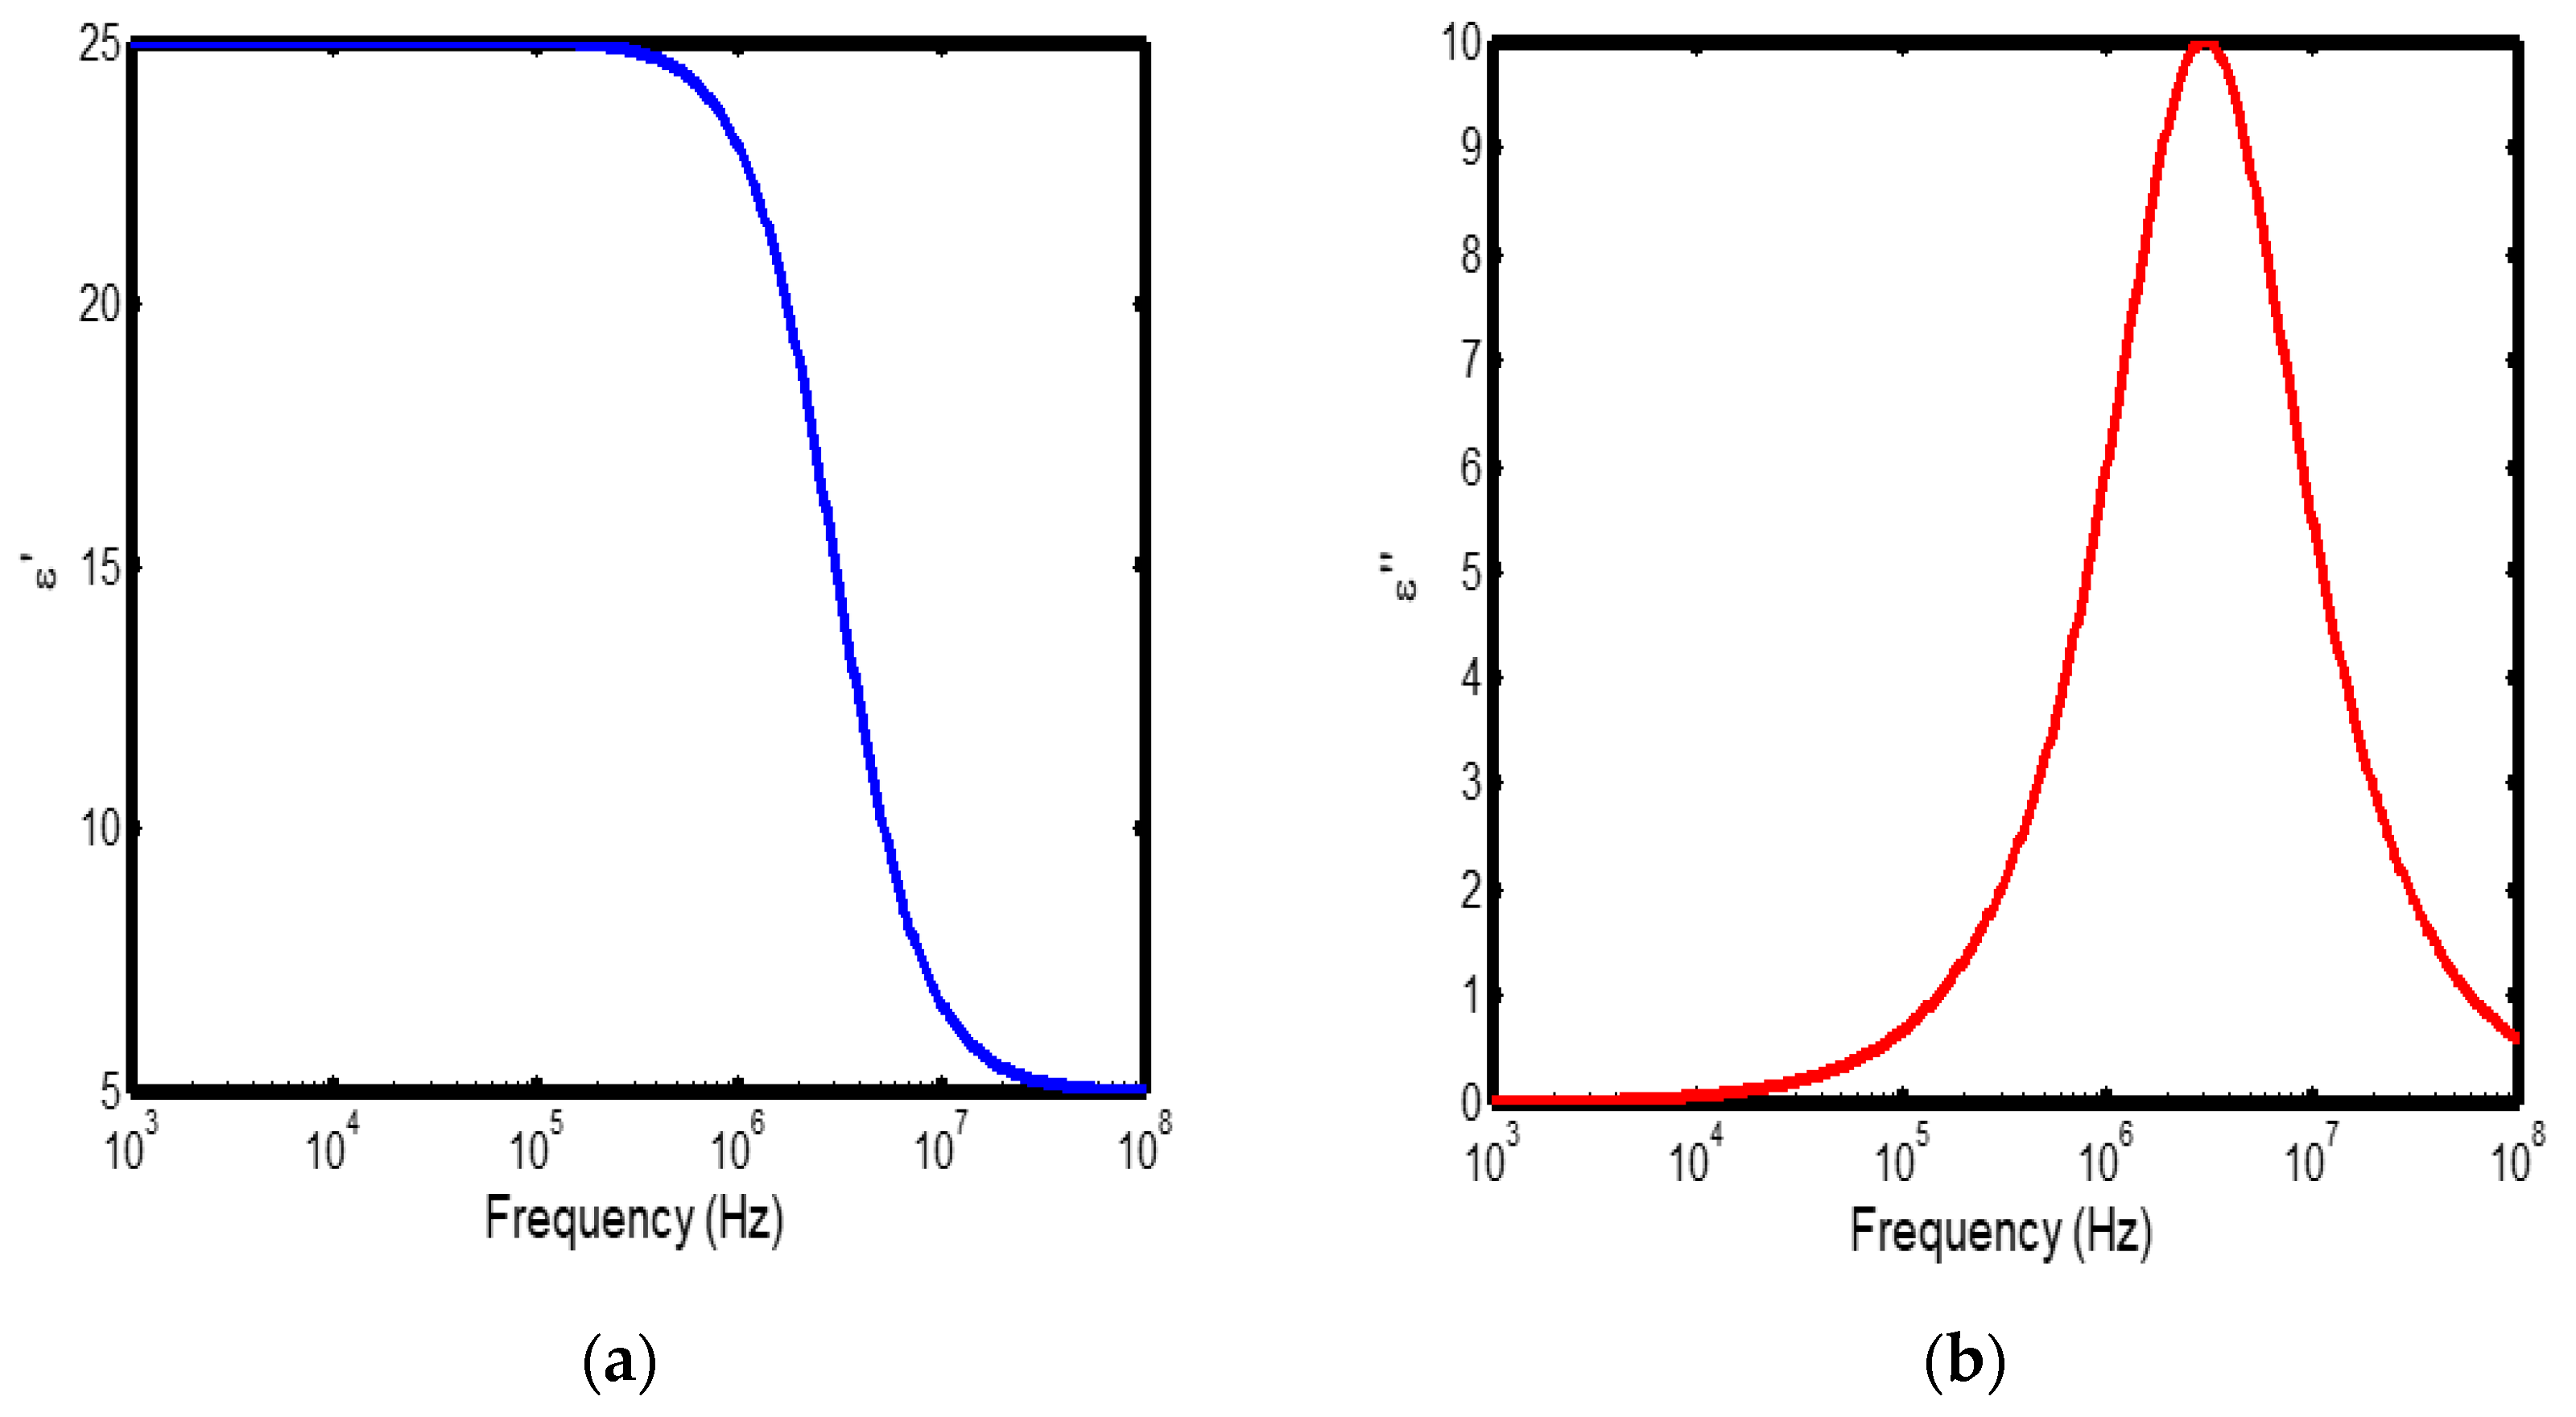
Figure 7.
(a) Variation of dielectric constant with frequency in the temperature range of 300–400 °C; (b) corresponding dielectric loss factor as a function of frequency within the same temperature interval, based on the Cole–Cole relaxation model.
Figure 7.
(a) Variation of dielectric constant with frequency in the temperature range of 300–400 °C; (b) corresponding dielectric loss factor as a function of frequency within the same temperature interval, based on the Cole–Cole relaxation model.
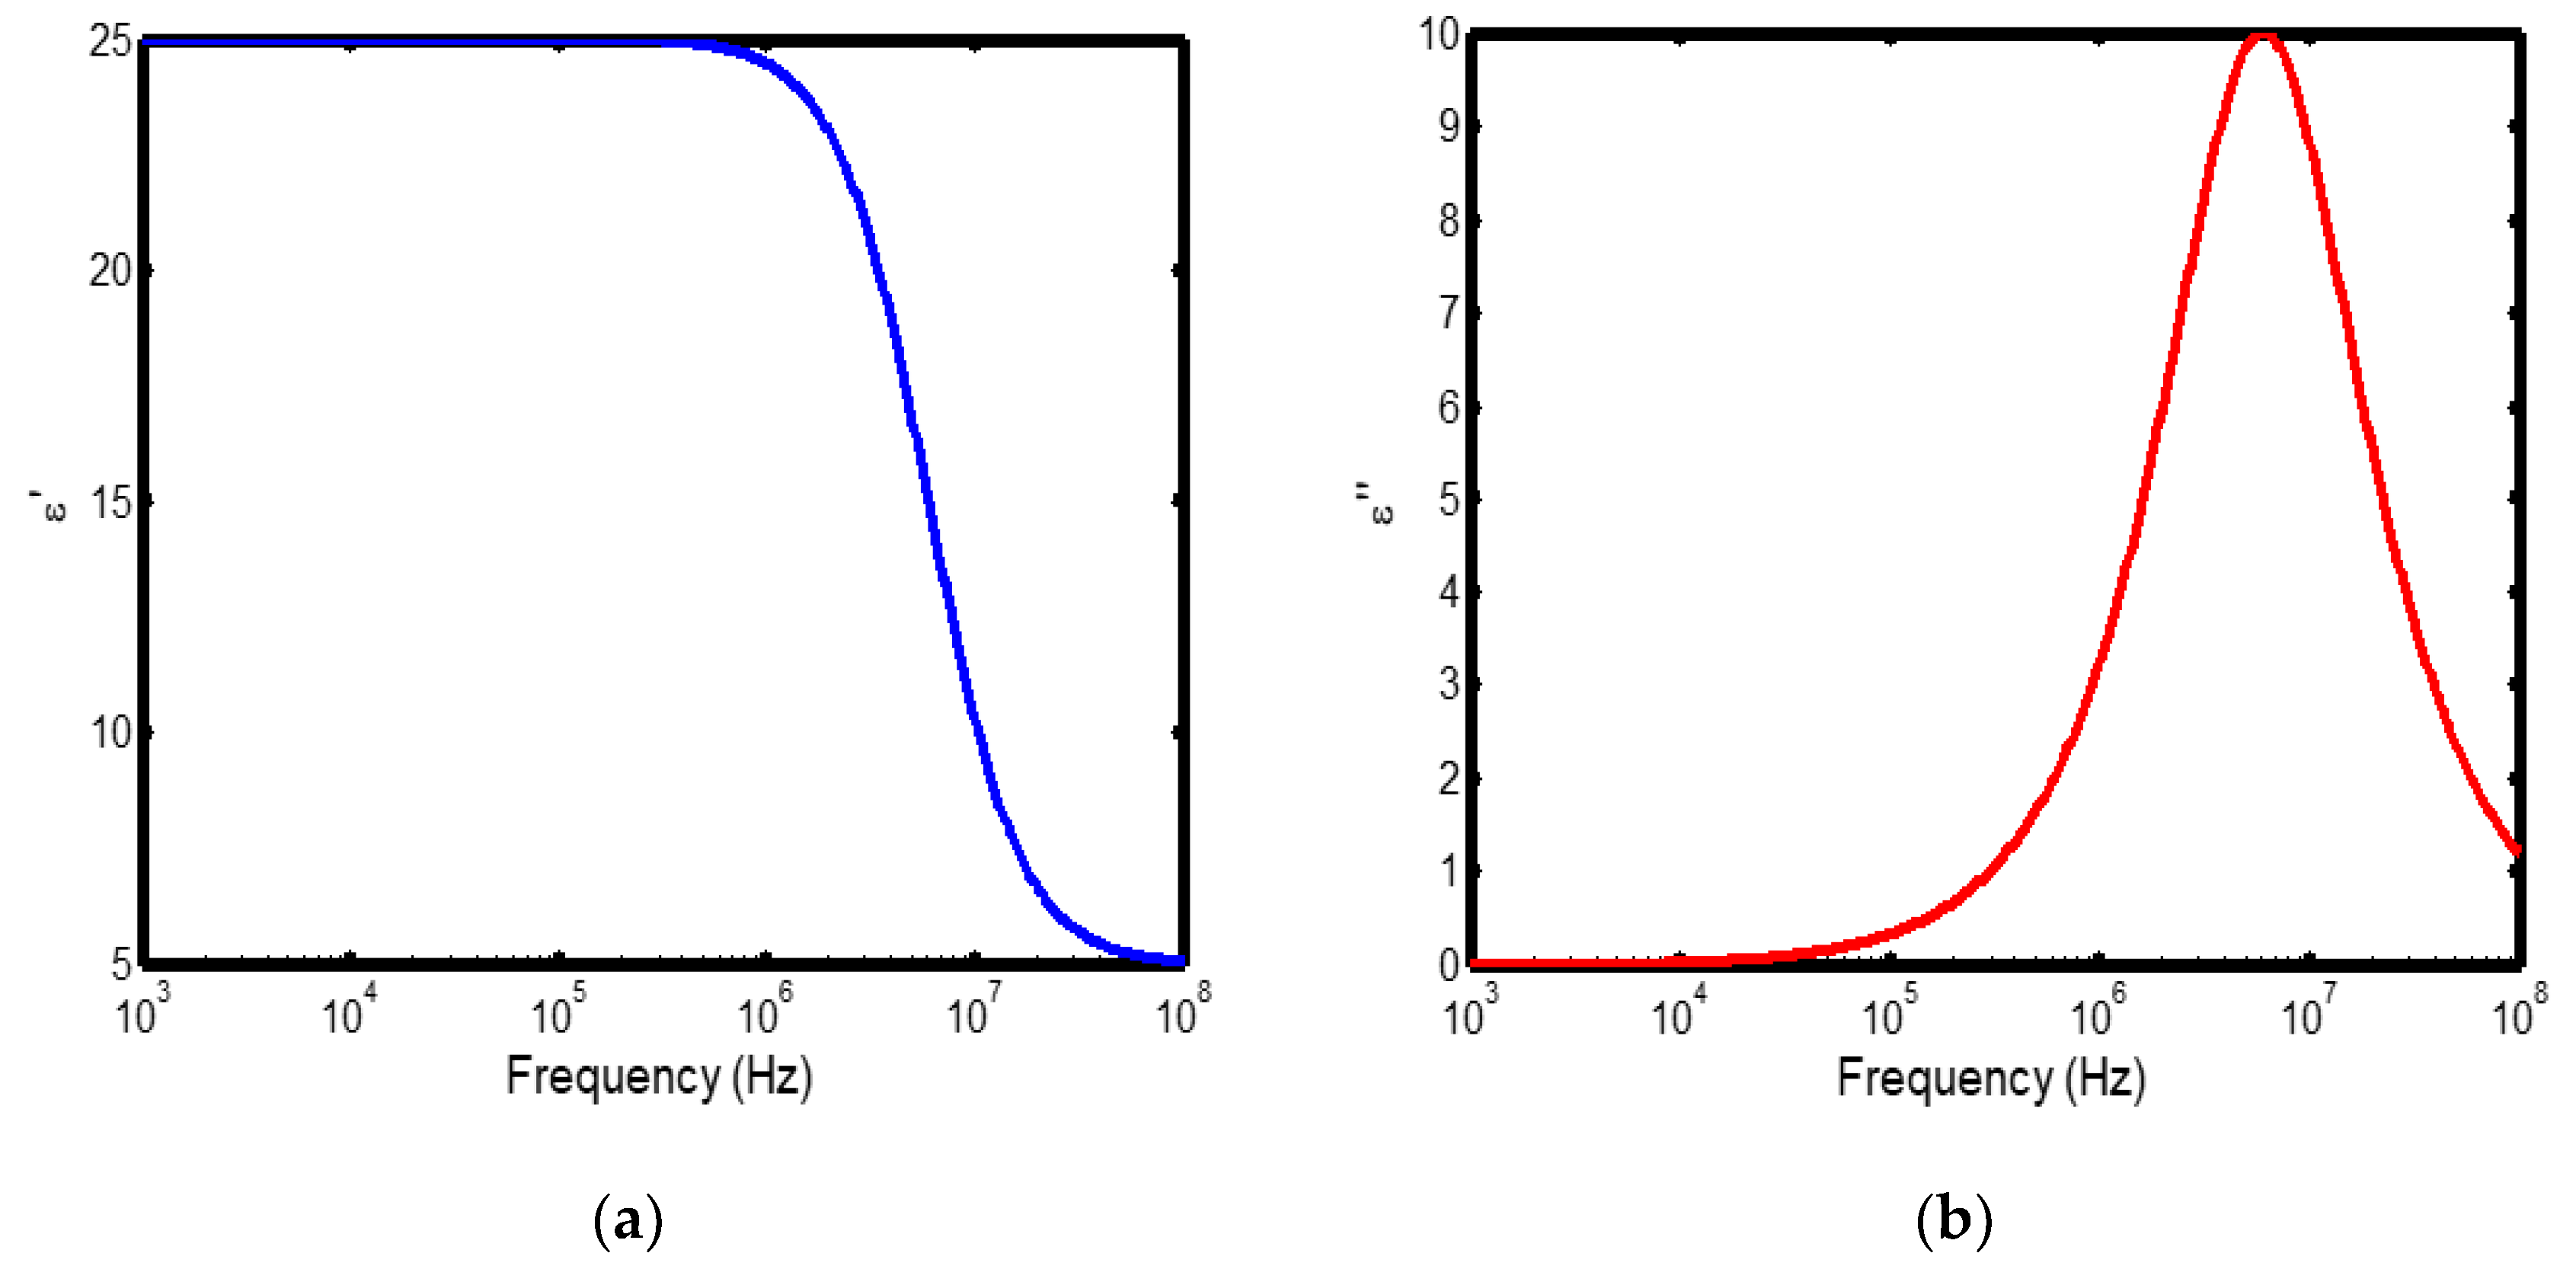
Figure 8.
(a) Variation of dielectric constant with frequency in the temperature range of 400–500 °C; (b) corresponding dielectric loss factor as a function of frequency within the same temperature interval, based on the Cole–Cole relaxation model.
Figure 8.
(a) Variation of dielectric constant with frequency in the temperature range of 400–500 °C; (b) corresponding dielectric loss factor as a function of frequency within the same temperature interval, based on the Cole–Cole relaxation model.
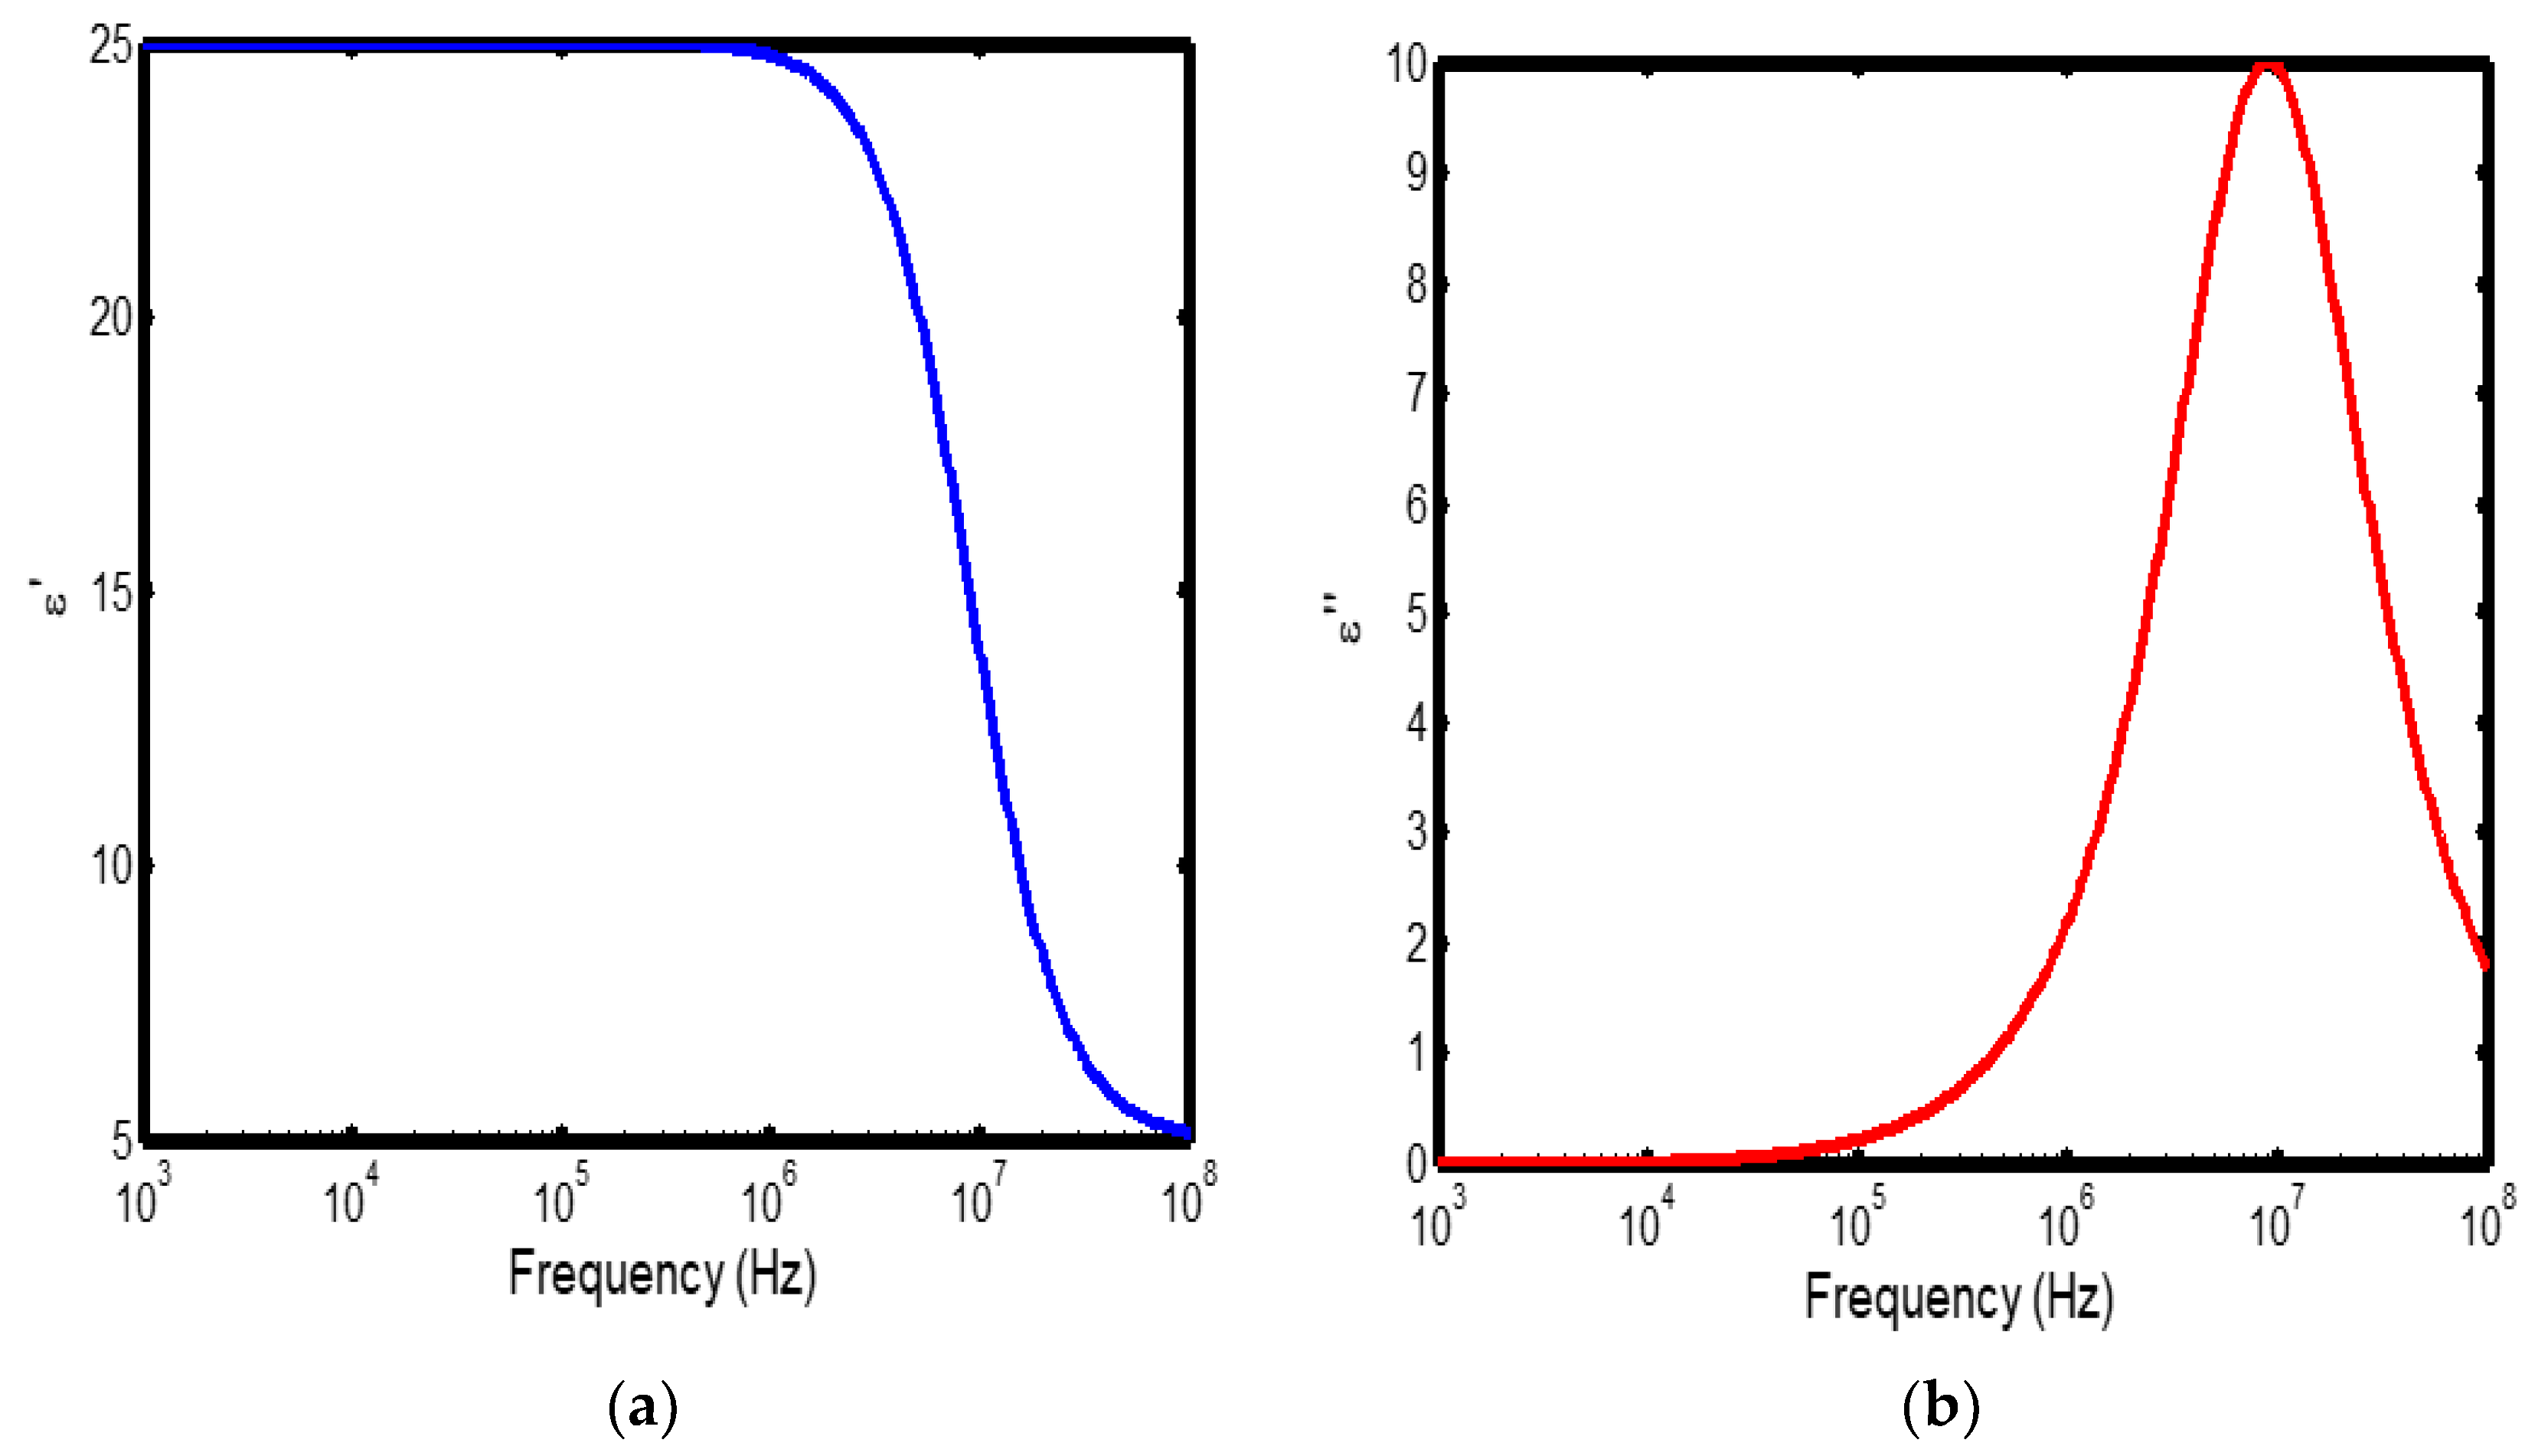
Figure 9.
Arrhenius plot of relaxation time (ln τ) versus inverse temperature (1/T) in the range of 100–200 °C, based on the Debye relaxation model.
Figure 9.
Arrhenius plot of relaxation time (ln τ) versus inverse temperature (1/T) in the range of 100–200 °C, based on the Debye relaxation model.
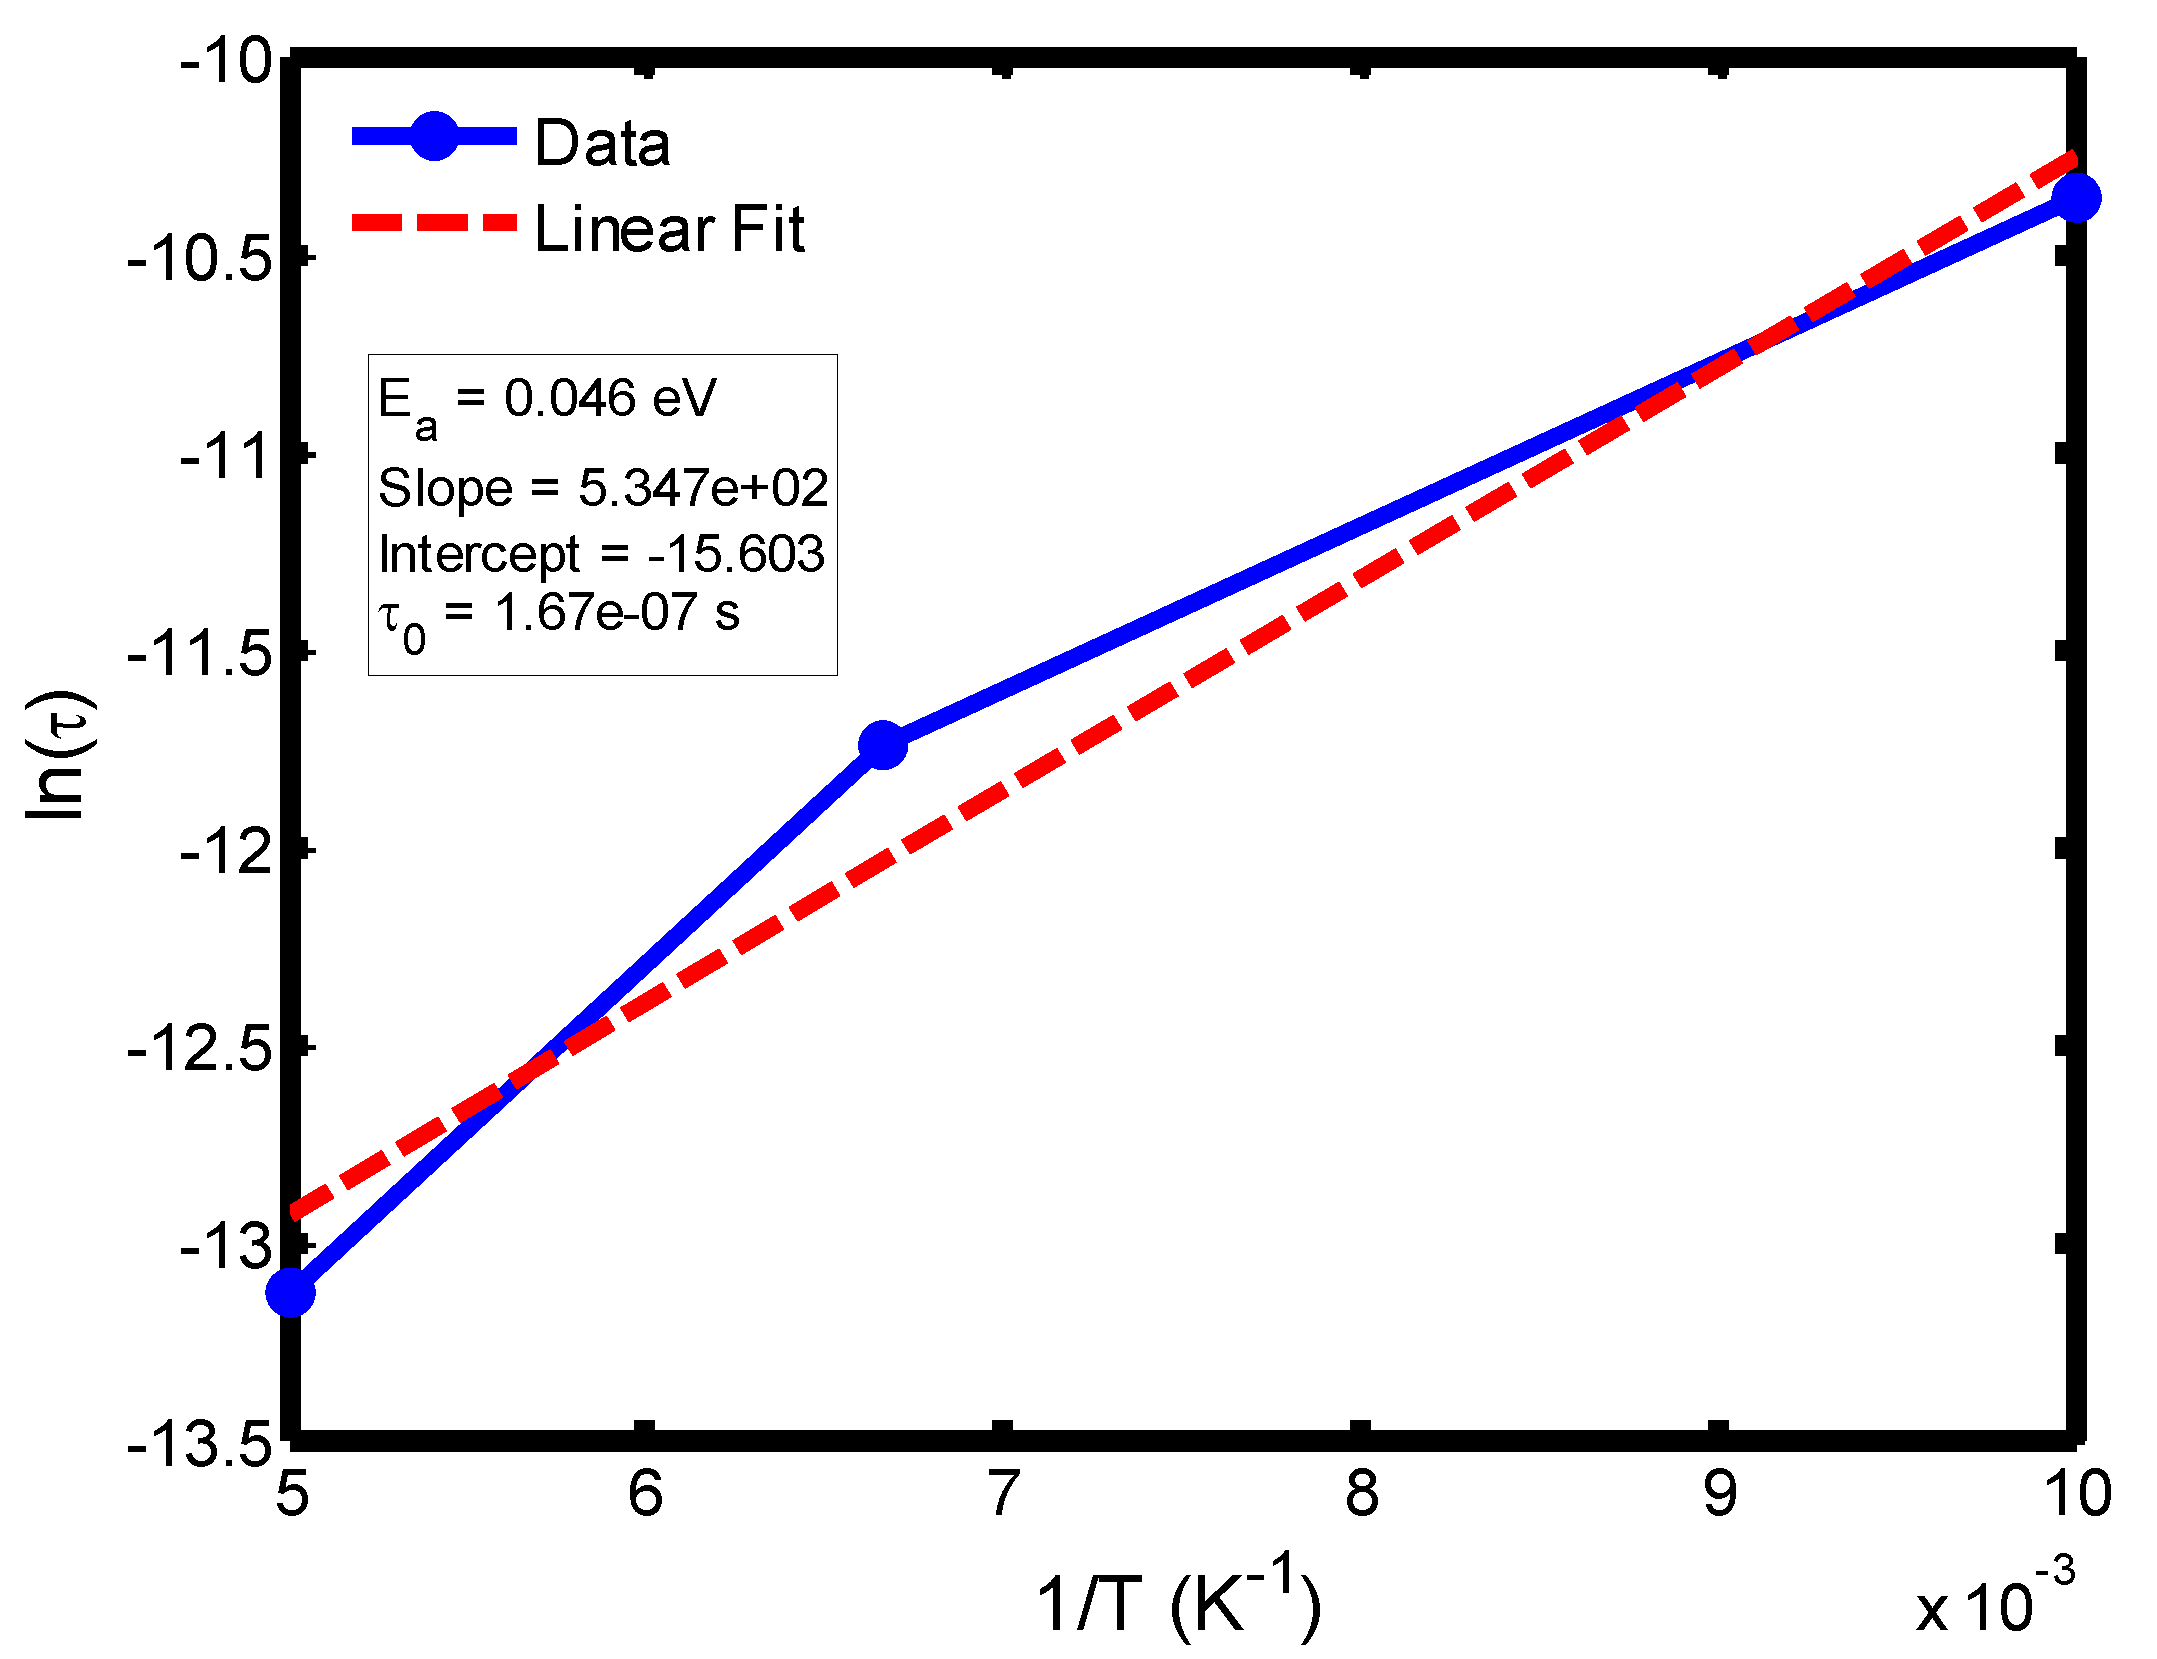
Figure 10.
Arrhenius plot of relaxation time (ln τ) versus inverse temperature (1/T) in the range of 200–300 °C, based on the Debye relaxation model.
Figure 10.
Arrhenius plot of relaxation time (ln τ) versus inverse temperature (1/T) in the range of 200–300 °C, based on the Debye relaxation model.
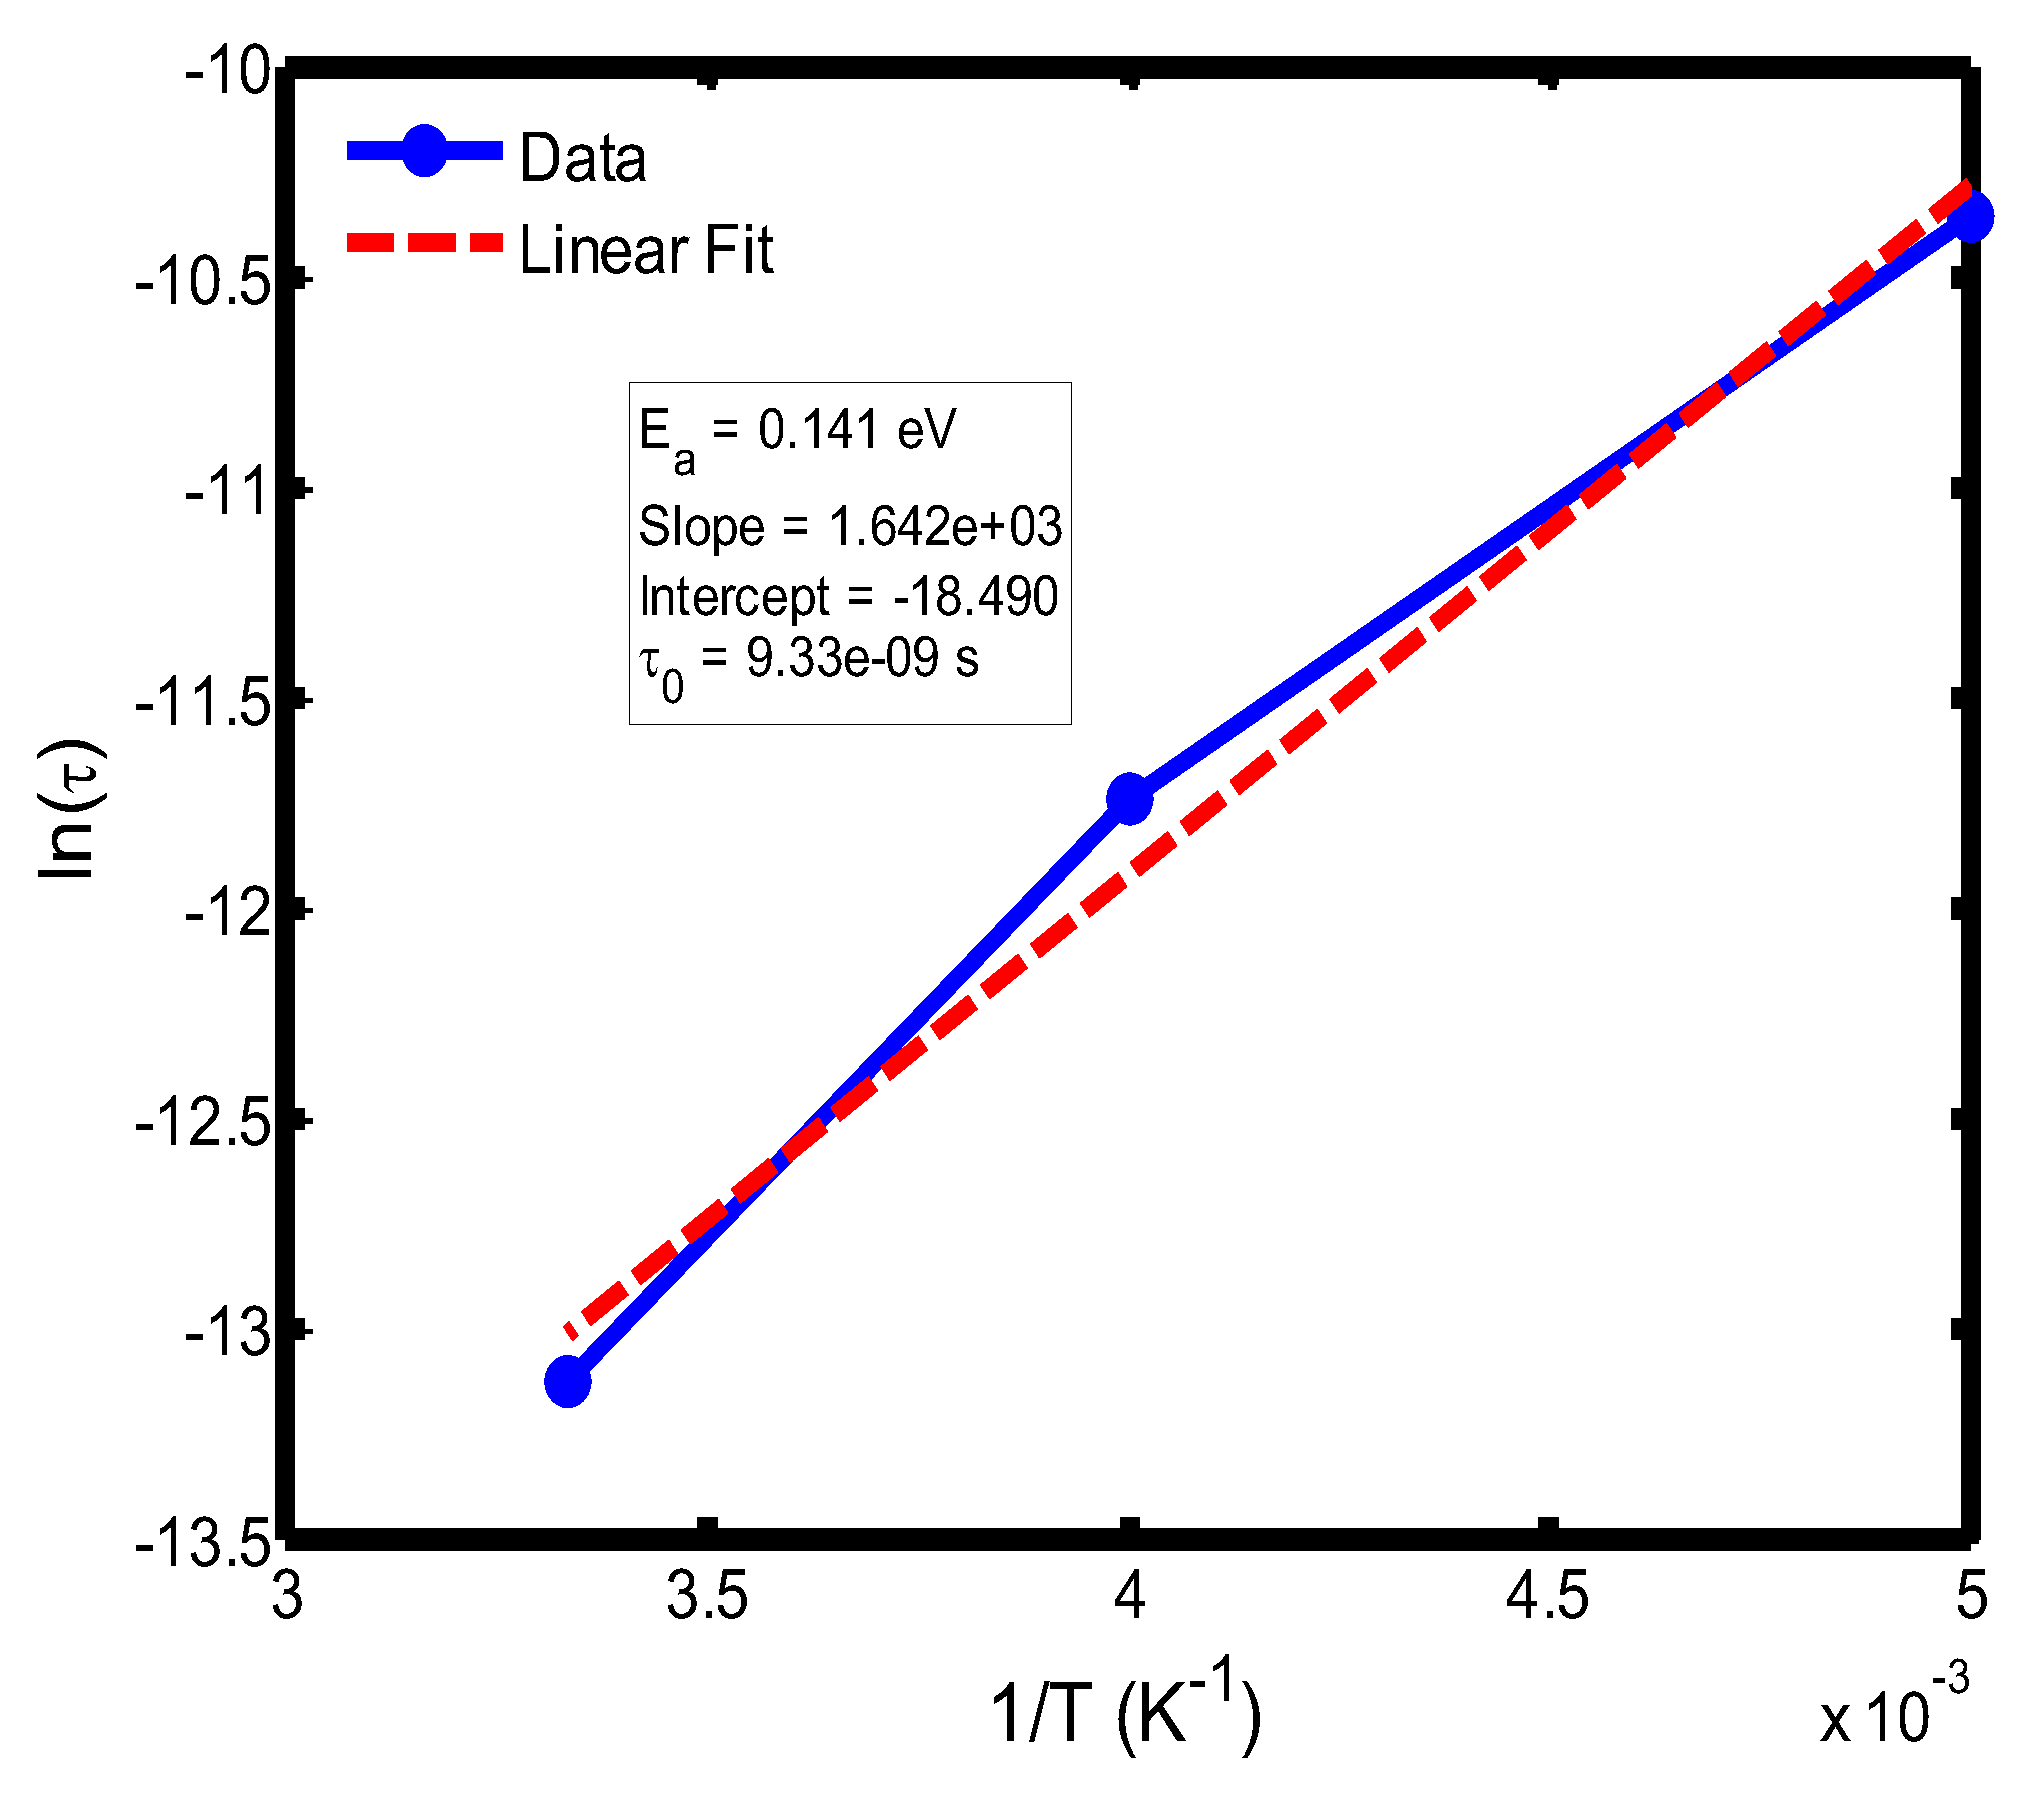
Figure 11.
Arrhenius plot of relaxation time (ln τ) versus inverse temperature (1/T) in the range of 300–400 °C, based on the Debye relaxation model.
Figure 11.
Arrhenius plot of relaxation time (ln τ) versus inverse temperature (1/T) in the range of 300–400 °C, based on the Debye relaxation model.
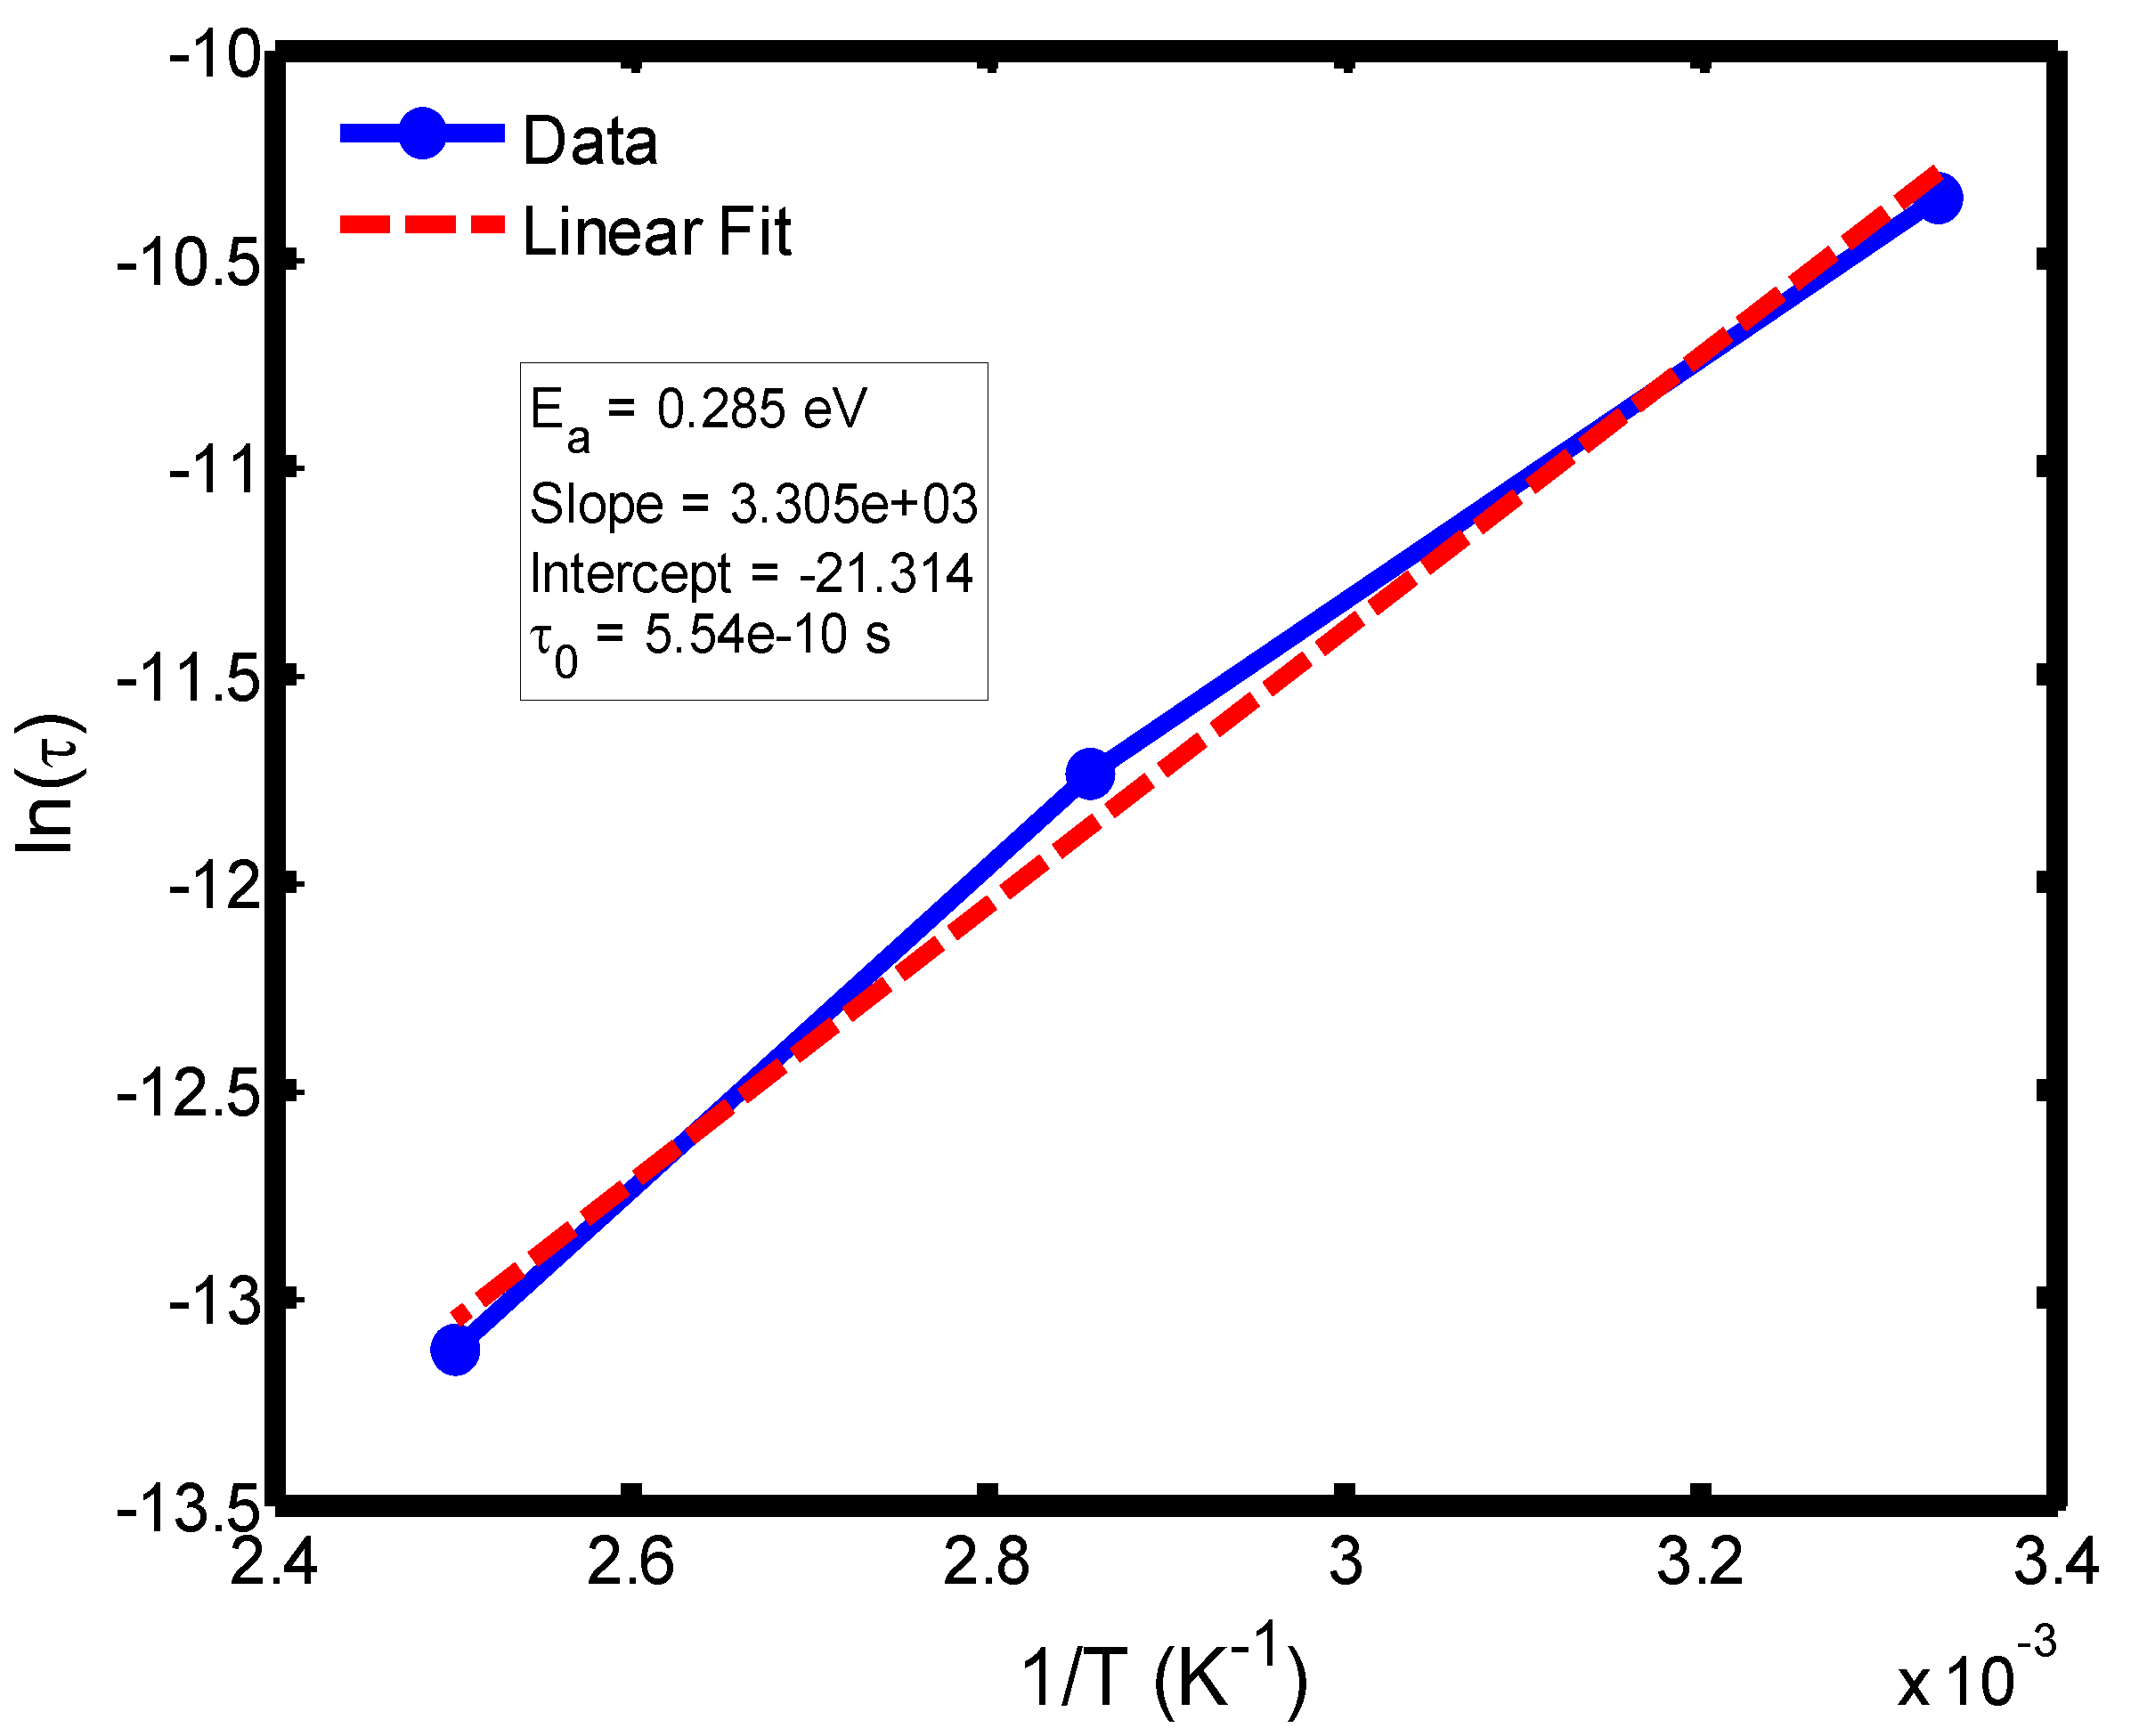
Figure 12.
Arrhenius plot of relaxation time (ln τ) versus inverse temperature (1/T) in the range of 400–500 °C, based on the Debye relaxation model.
Figure 12.
Arrhenius plot of relaxation time (ln τ) versus inverse temperature (1/T) in the range of 400–500 °C, based on the Debye relaxation model.
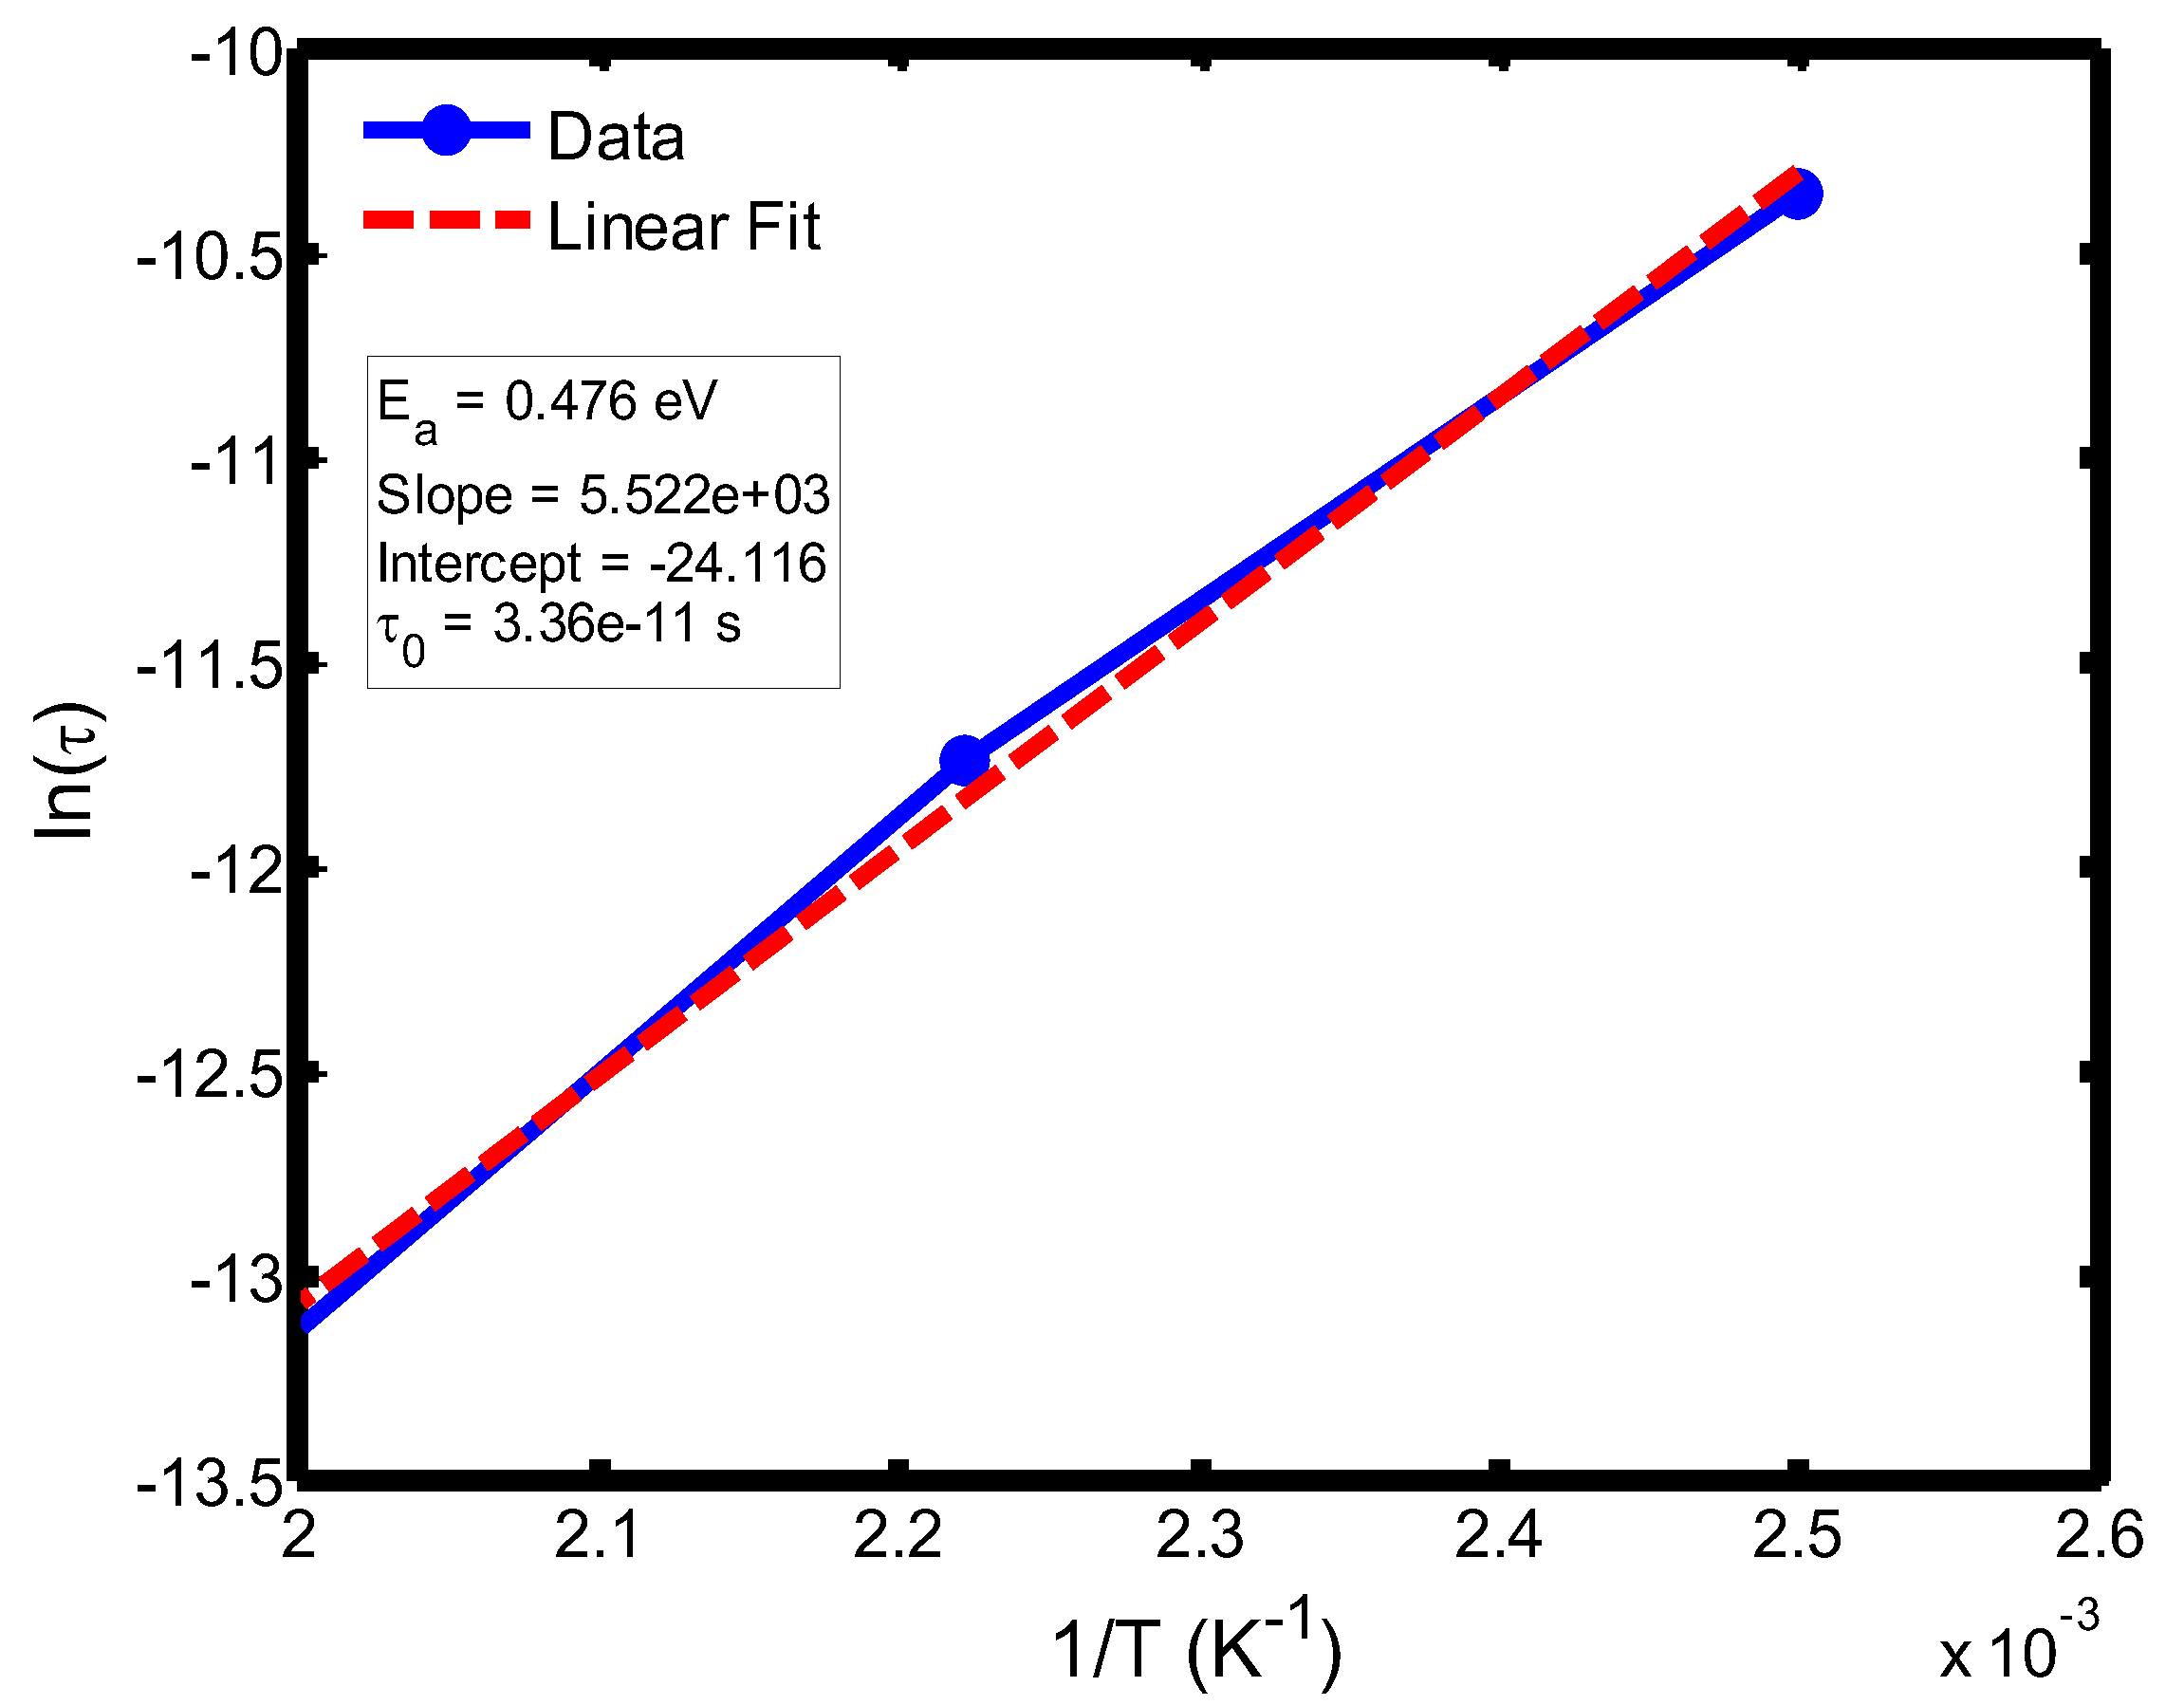
Figure 13.
Arrhenius plot of ln(τ) versus 1/T for the temperature range of 100–200 °C, obtained from the Cole–Cole relaxation model. The activation energy (Eₐ) and pre-exponential factor (τ₀) were extracted from the slope and intercept of the linear fit, respectively.
Figure 13.
Arrhenius plot of ln(τ) versus 1/T for the temperature range of 100–200 °C, obtained from the Cole–Cole relaxation model. The activation energy (Eₐ) and pre-exponential factor (τ₀) were extracted from the slope and intercept of the linear fit, respectively.
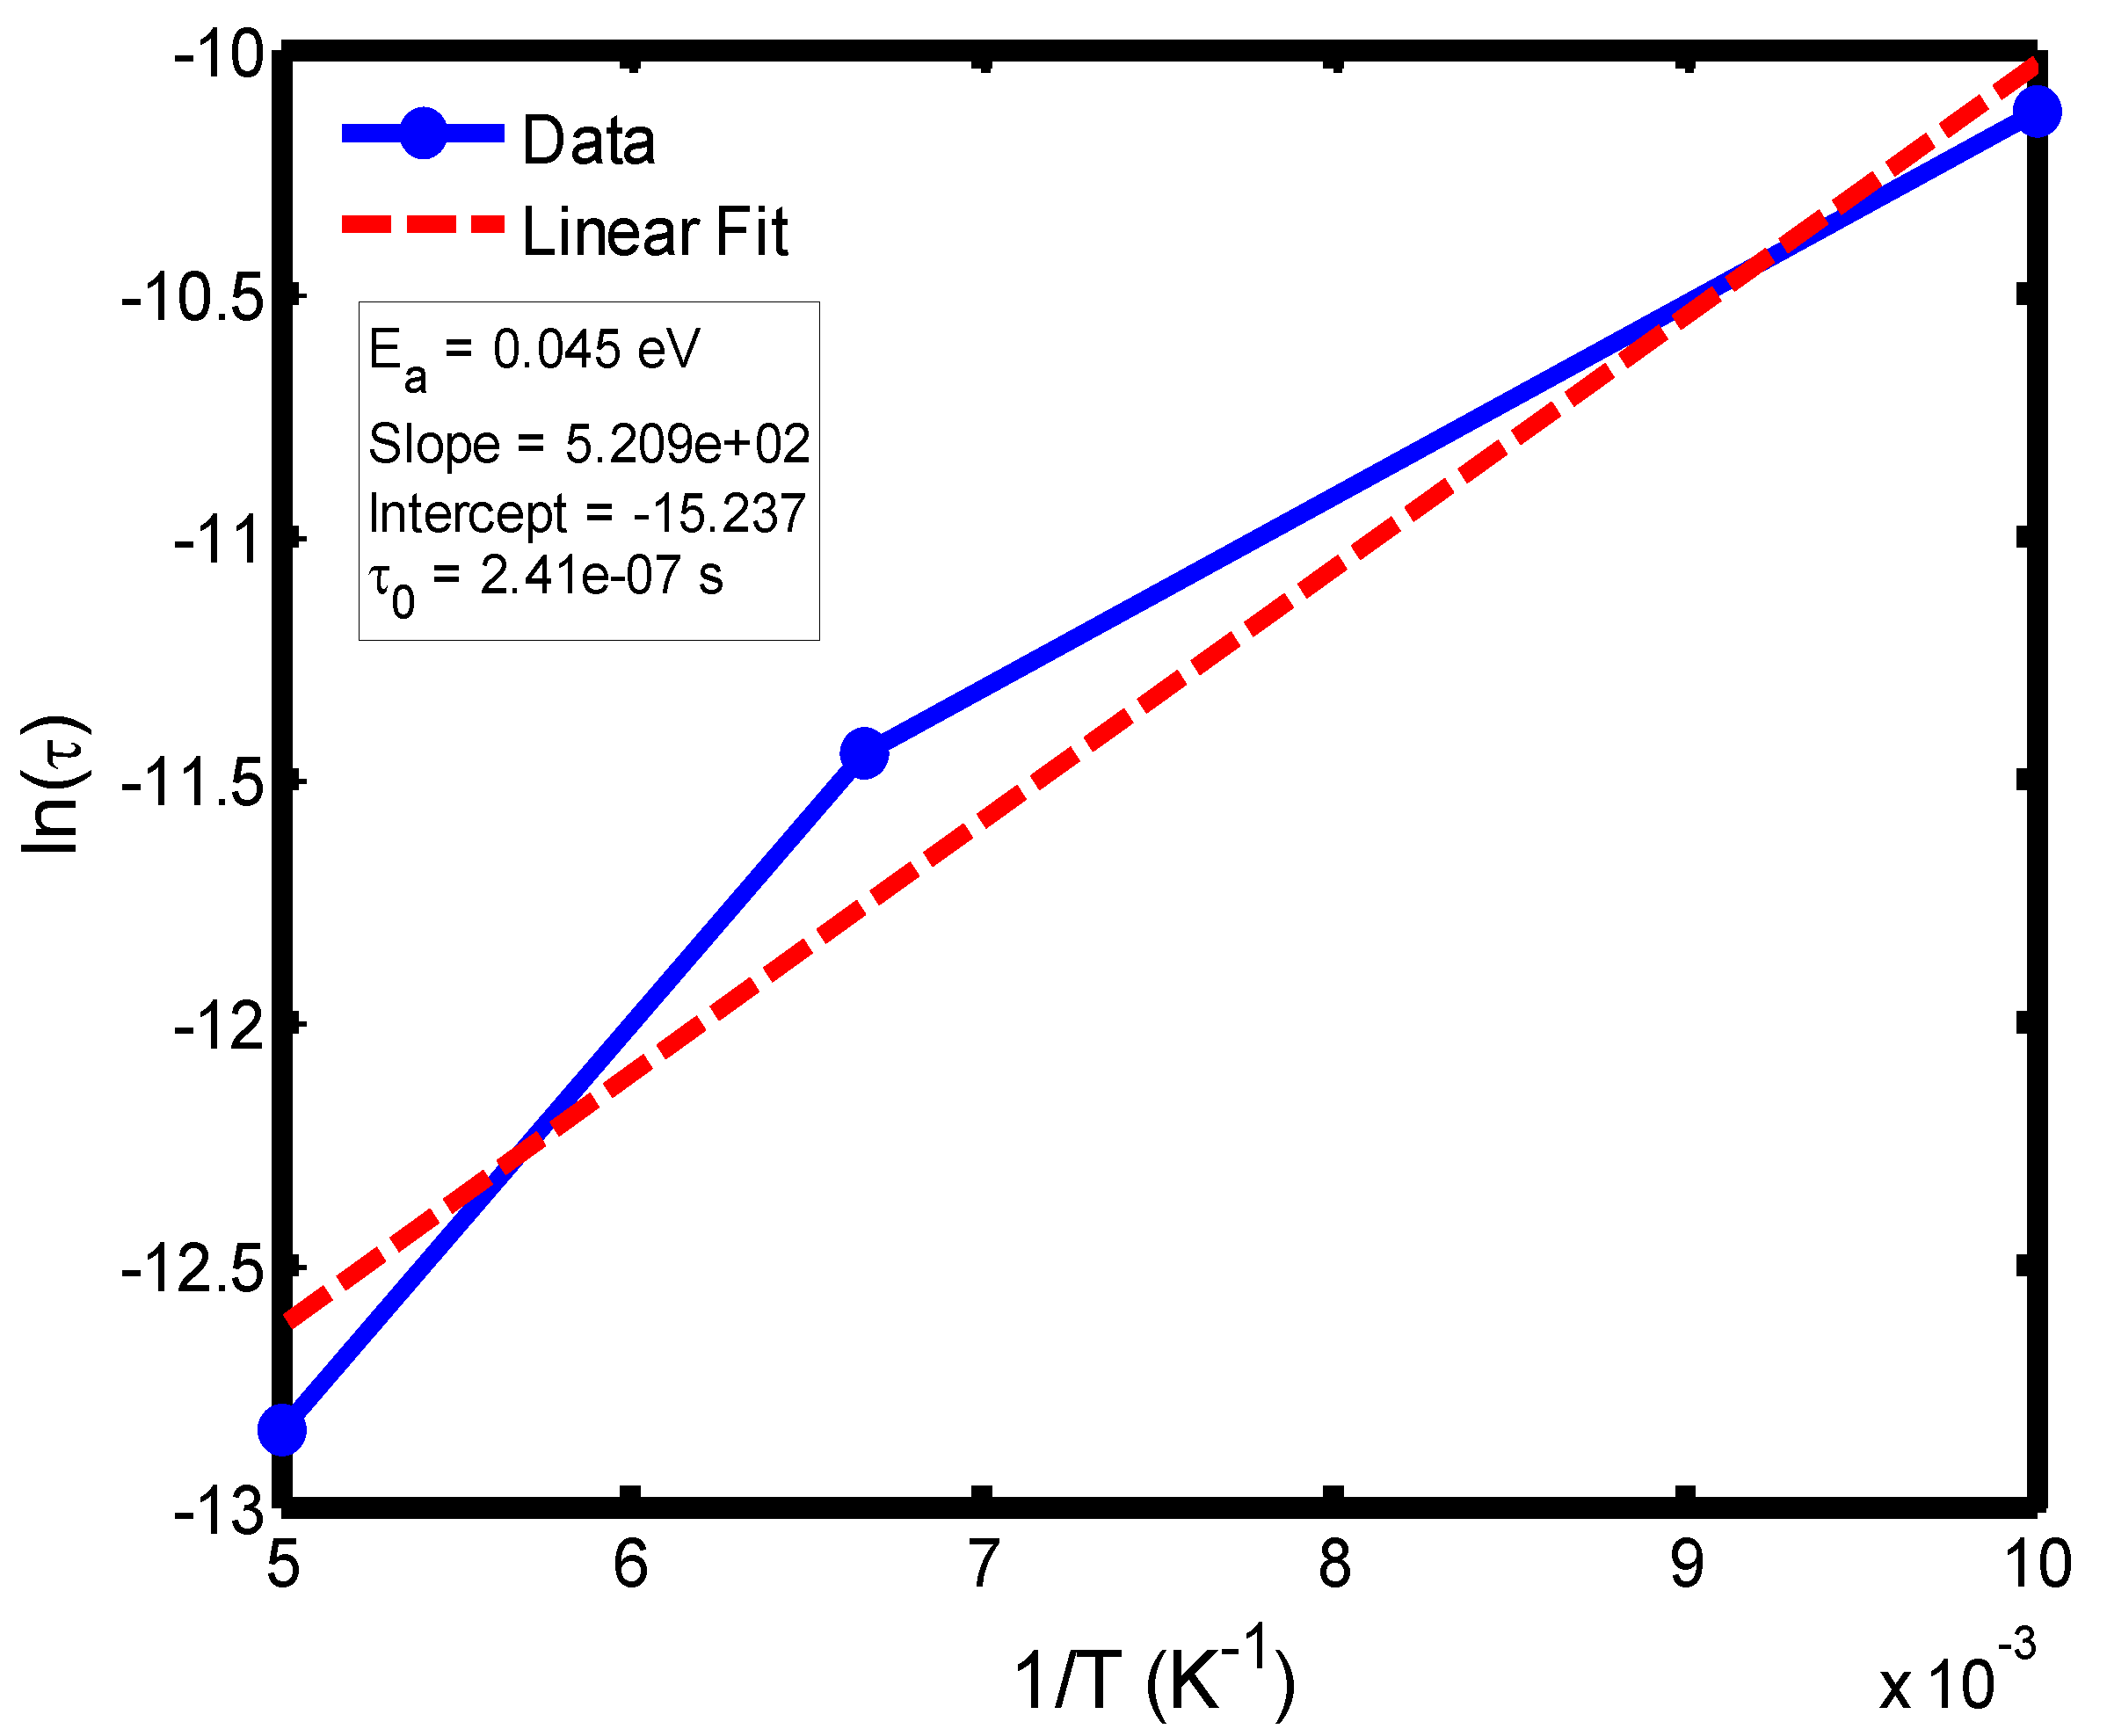
Figure 14.
Arrhenius plot of ln(τ) versus 1/T for the temperature range of 200–300 °C, based on the Cole–Cole relaxation model. The activation energy and pre-exponential factor were determined from the corresponding linear regression parameters.
Figure 14.
Arrhenius plot of ln(τ) versus 1/T for the temperature range of 200–300 °C, based on the Cole–Cole relaxation model. The activation energy and pre-exponential factor were determined from the corresponding linear regression parameters.
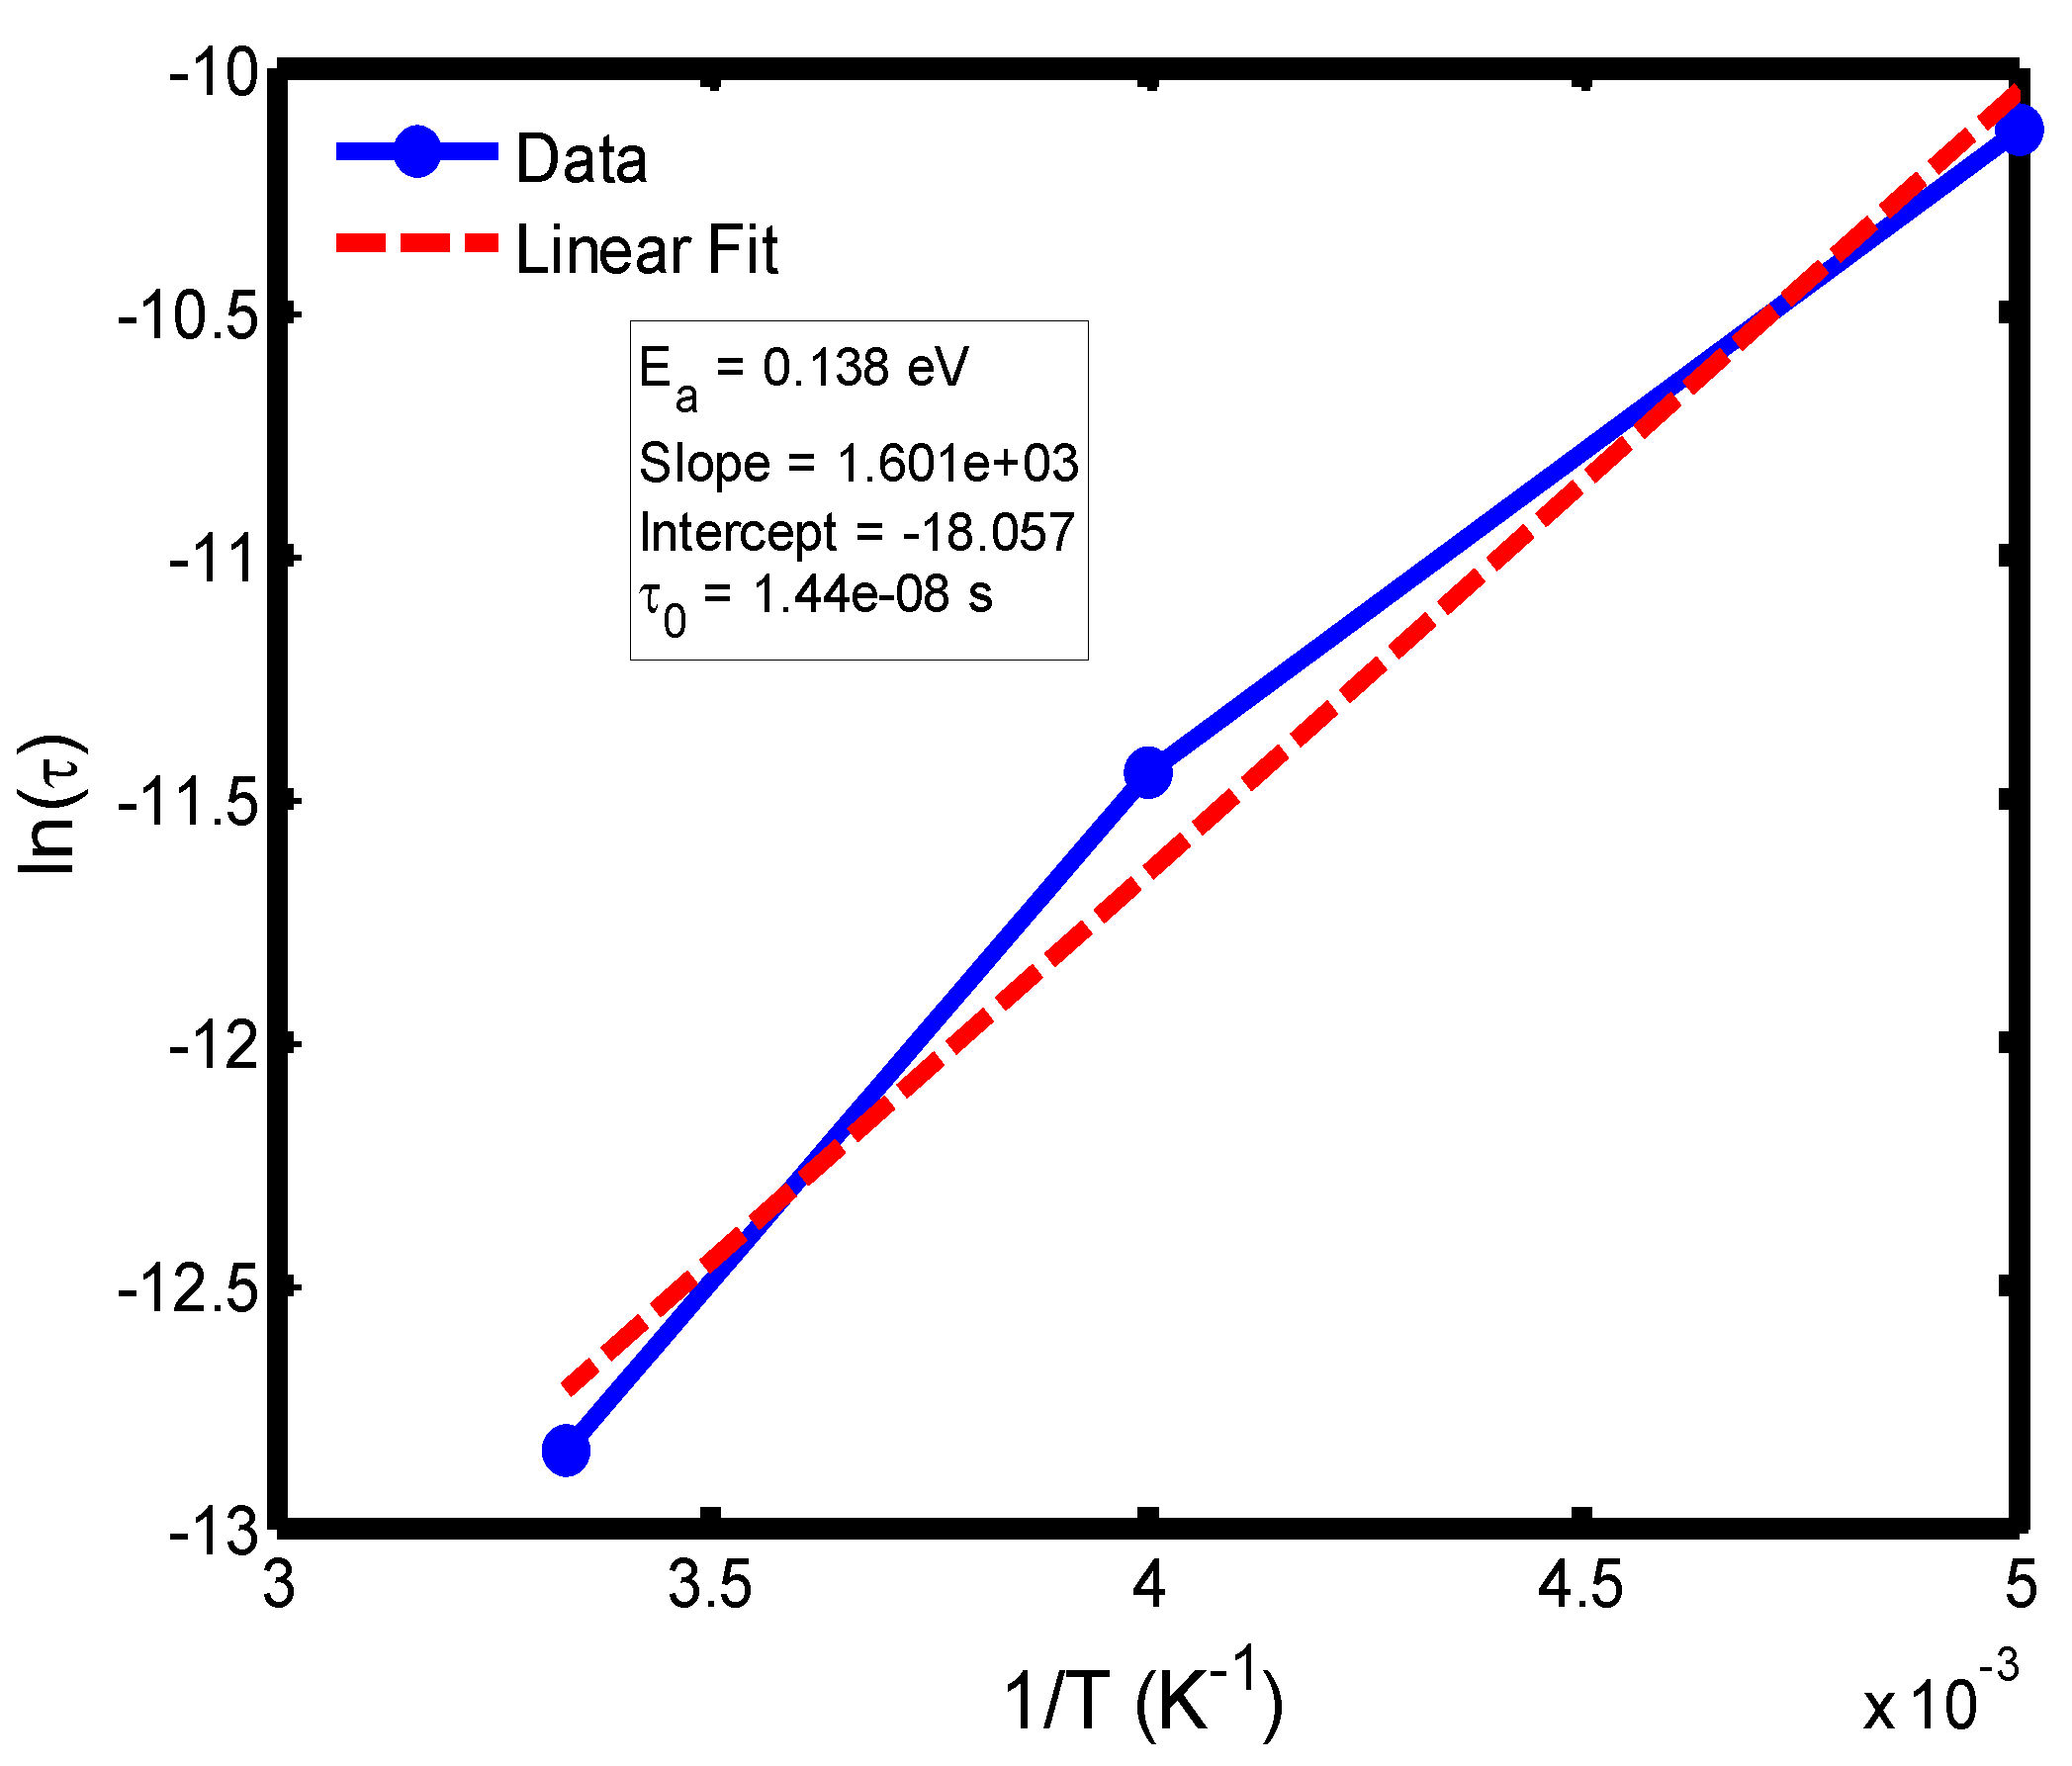
Figure 15.
Arrhenius plot of ln(τ) versus 1/T for the temperature range of 300–400 °C, derived from the Cole–Cole relaxation model. The slope and intercept of the fitted line yield the activation energy (Eₐ) and pre-exponential factor (τ₀), respectively.
Figure 15.
Arrhenius plot of ln(τ) versus 1/T for the temperature range of 300–400 °C, derived from the Cole–Cole relaxation model. The slope and intercept of the fitted line yield the activation energy (Eₐ) and pre-exponential factor (τ₀), respectively.
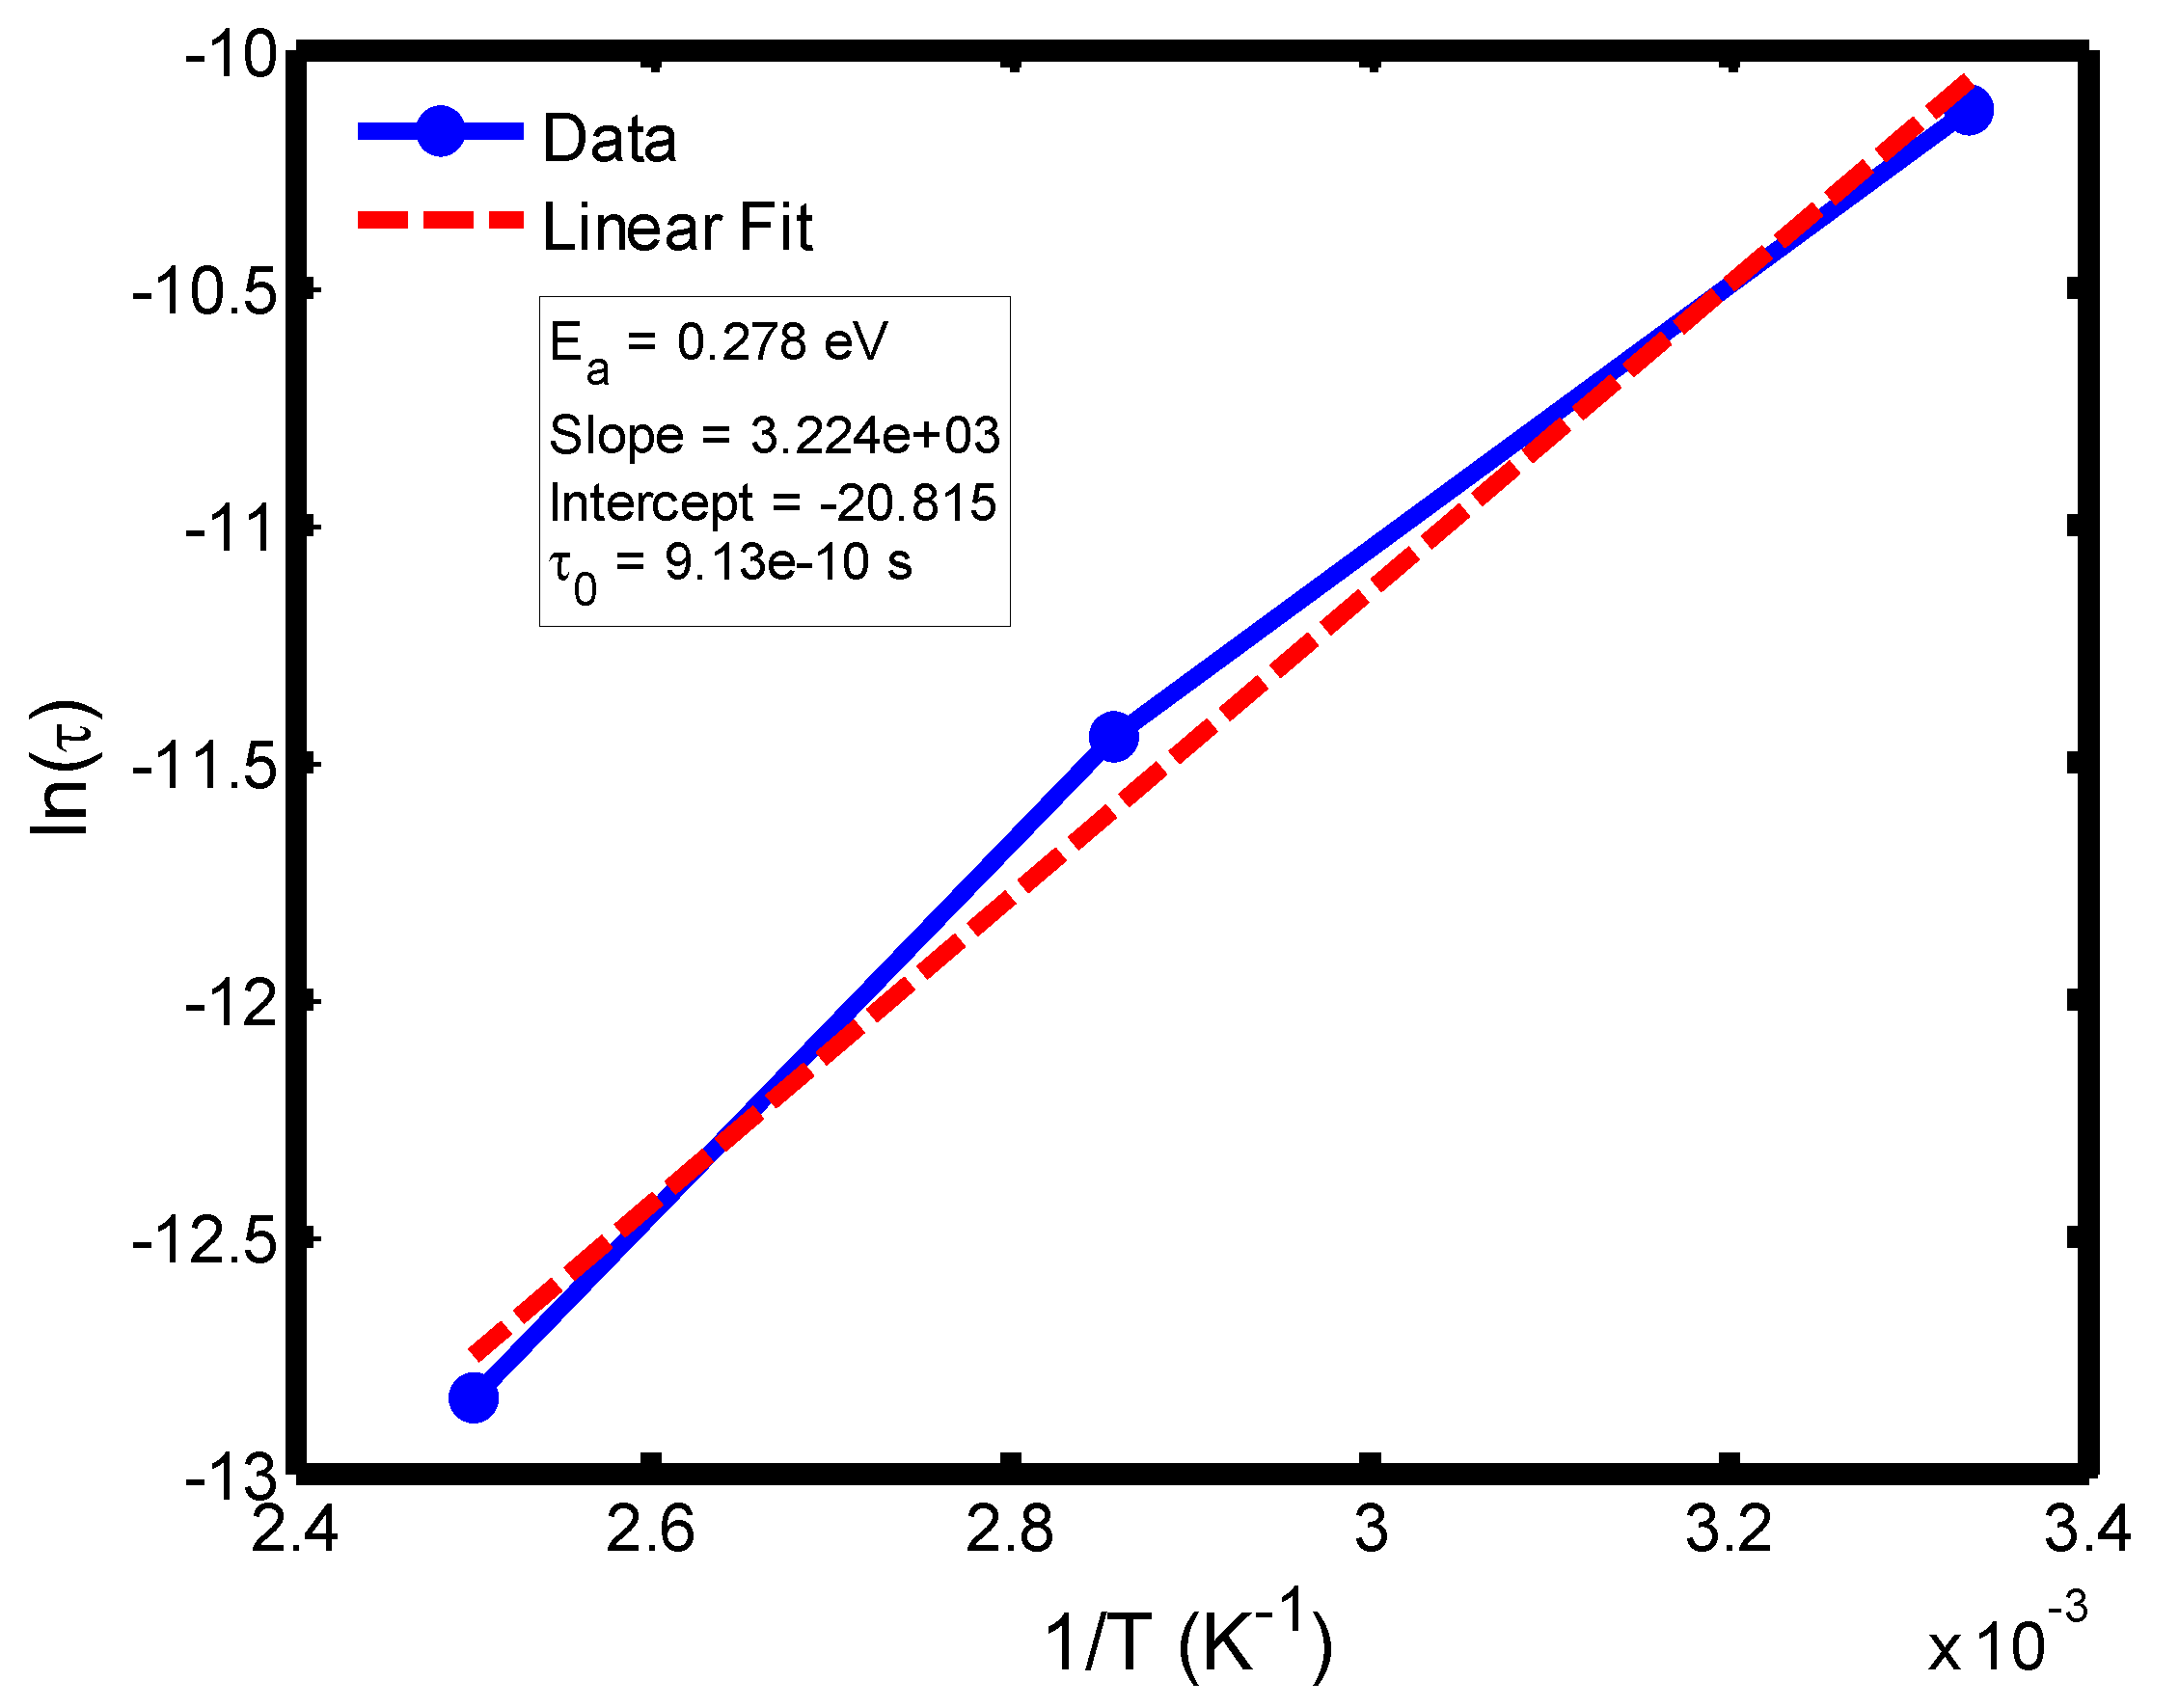
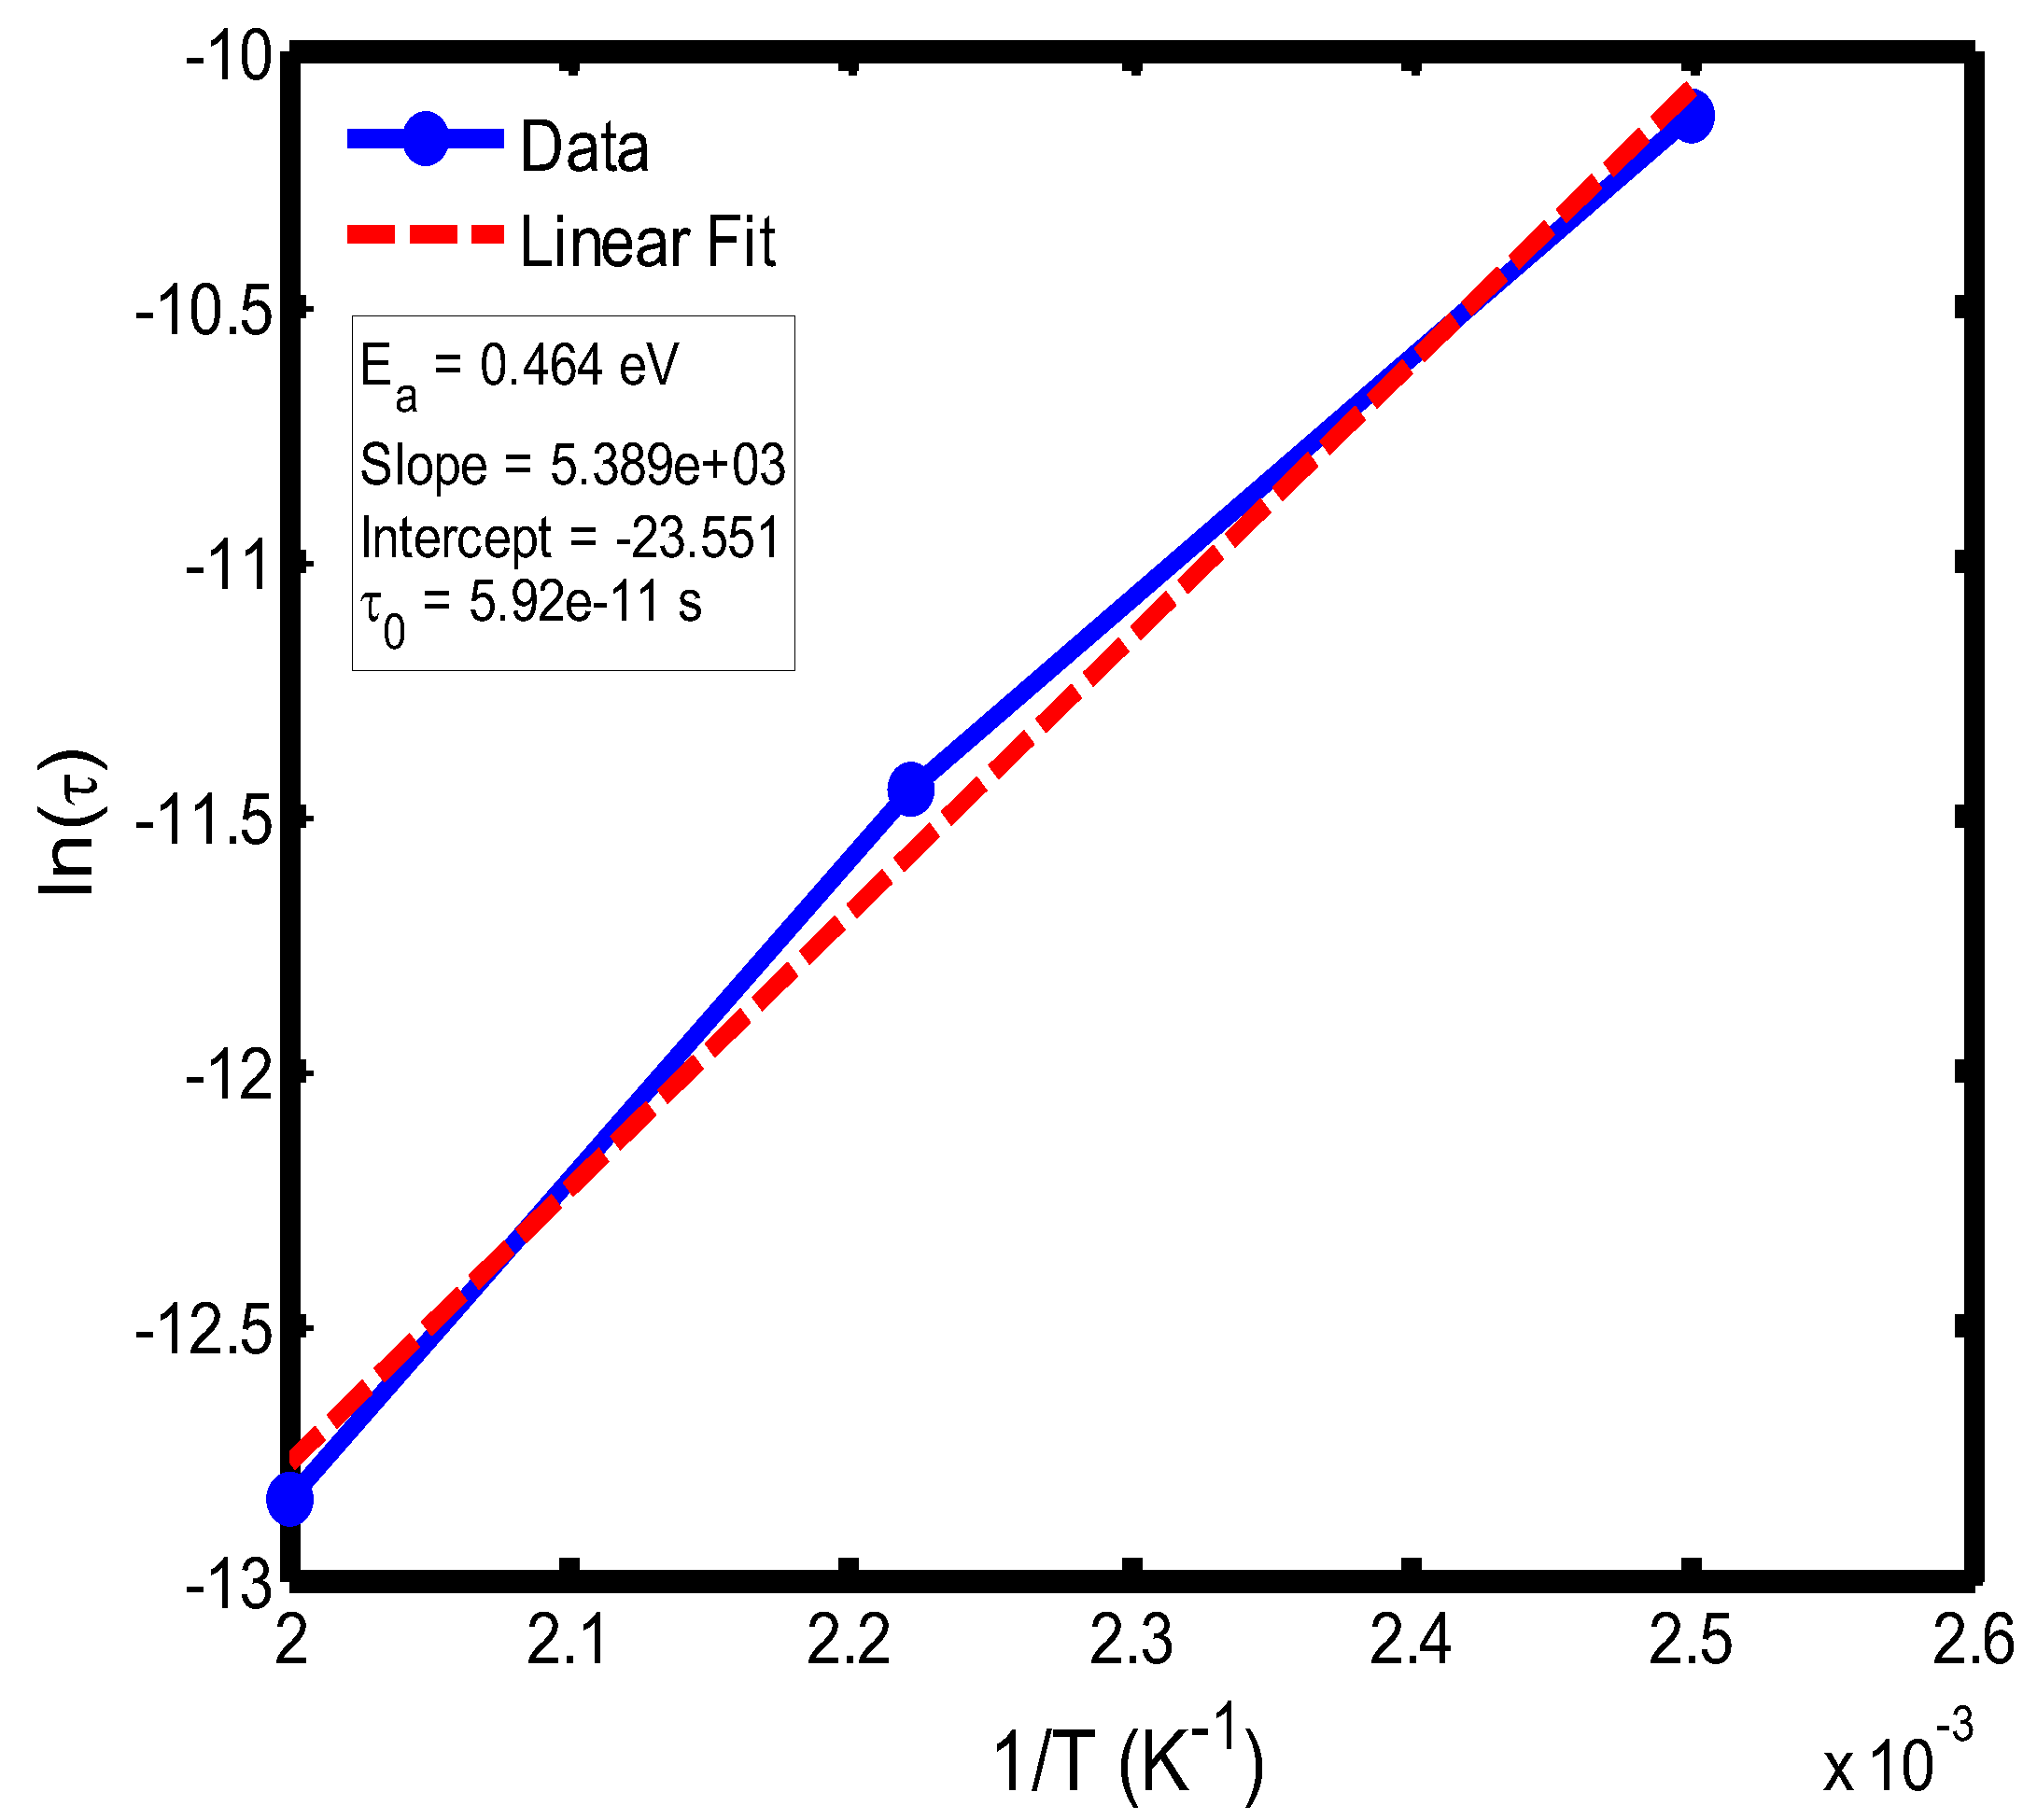
Figure 16.
Arrhenius plot of ln(τ) versus 1/T for the temperature range of 400–500 °C, obtained using the Cole–Cole relaxation model. The extracted activation energy and pre-exponential factor describe the effective thermal activation behavior of the relaxation process.
Figure 16.
Arrhenius plot of ln(τ) versus 1/T for the temperature range of 400–500 °C, obtained using the Cole–Cole relaxation model. The extracted activation energy and pre-exponential factor describe the effective thermal activation behavior of the relaxation process.

| Parameter | Symbol | Value | Unit |
| Boltzmann constant | K | 8.617×10⁻⁵ | eV·K⁻¹ |
| Vacuum permittivity | ε0 | 8.854×10⁻¹² | F·m⁻¹ |
| Static dielectric constant | εs | 25 | — |
| High-frequency dielectric constant | ε∞ | 5 | — |
| Relaxation time | Τ | 1.0×10⁻⁶ | s |
| Frequency range | F | 103–108 | Hz |
| Angular frequency | ω=2πf | — | rad·s⁻¹ |
| Temperature range | T | 100 – 500 | K |
| Peak loss frequency | fmax | 1×10⁵–3.2×10⁶ | Hz |
| Relaxation time from loss peak | τ=1/(2πfmax) | 1.6×10⁻⁷–5.0×10⁻⁸ | s |
| Activation energy | Ea | 0.30 – 0.45 | eV |
| Pre-exponential factor | τ0 | 10−12–10−14 | s |
| Number of frequency points | — | 400 | — |
Disclaimer/Publisher’s Note: The statements, opinions and data contained in all publications are solely those of the individual author(s) and contributor(s) and not of MDPI and/or the editor(s). MDPI and/or the editor(s) disclaim responsibility for any injury to people or property resulting from any ideas, methods, instructions or products referred to in the content. |
© 2025 by the authors. Licensee MDPI, Basel, Switzerland. This article is an open access article distributed under the terms and conditions of the Creative Commons Attribution (CC BY) license (http://creativecommons.org/licenses/by/4.0/).
Copyright: This open access article is published under a Creative Commons CC BY 4.0 license, which permit the free download, distribution, and reuse, provided that the author and preprint are cited in any reuse.


