
Submitted:
31 January 2025
Posted:
03 February 2025
You are already at the latest version
Abstract
The report discusses the impact of nanoparticles on the previtreous behavior of glass-forming systems. The presented studies were carried out via broadband dielectric spectroscopy (BDS) in nanocolloids composed of nematogenic liquid crystalline (LC) mixture E7 and paraelectric BaTiO3 nanoparticles. Tests started in the isotropic liquid phase, showing critical-like dielectric constant changes associated with prenematic fluctuations and weakly discontinuous isotropic–nematic phase transition. Subsequently, evolutions of the dielectric constant, two primary relaxation times (related to τ and α τ' processes), and DC electric conductivity are considered in the nematic phase, down to the glass temperature Tg. The prevalence of the portrayal via the ‘double exponential’ MYEGA equation is shown for dynamic properties. Monitoring of the dielectric constant revealed the exogenic impact of nanoparticles, leading to the permanent arrangement of rod-like LC molecules. For the primary loss curve, critical-like changes of its maximum (peak) are evidenced: peak''∝1T-Tg* for Tg<T<Tg+25K, where Tg*<Tg is the extrapolated singular temperature. Such behavior is shown for both pure E7 and nanocolloids. The heuristic model commenting on this unique behavior is presented. It recalls a hypothetical link between the glass transition and a hidden near-critical phase transition, avoiding a symmetry change.
Keywords:
glass transition
; previtreous behavior
; liquid crystals
; nematic
; nanoparticles
; dielectric constant
; primary relaxation time
; electric conductivity
; loss curve maximum
; critical phenomena
1. Introduction
At the turn of the 20th and 21st centuries, the glass transition problem was noted among the grand challenges of 21st-century Science. A cognitive breakthrough was expected in the subsequent decade. The year 2025 has just begun, and the understanding of the glass transition remains puzzling [1,2,3,4,5,6,7,8,9,10,11,12,13,14,15,16]. The exceptional interest can be linked to universalistic features observed in the previtreous domain on approaching the glass temperature (), for microscopically different systems. One can recall: (i) non-Arrhenius changes of primary relaxation time (), viscosity (η), or DC electric conductivity (); (ii) decoupling between translational and orientational dynamics; (iii) the non-Debye distribution of the primary relaxation time, (iv) the dynamic crossover, often linked to the “magic” time scale , (v) the secondary relaxation emerging for , and related to the time-scale [6,7,8,9,11]. Characteristic changes of heat capacity related to the configurational entropy [8,9,17,18], or still puzzling “dynamic heterogeneities” are also noteworthy. The latter is associated with hypothetical multimolecular assemblies, whose direct detection seems to be limited to physical properties related to 4-point correlation function, such as nonlinear dielectric spectroscopy (NDS) or nonlinear dielectric effect (NDE) – methods related to changes of dielectric permittivity under the strong electric field [6,19,20,21,22,23,24].
The glass transition occurring on cooling from the deeply supercooled liquid to the amorphous solid is “diffused” in some temperature range, distinguishing the phenomenon from standard continuous or discontinuous phase transitions occurring at precisely defined temperatures. The conventional metric of the glass temperature is the center of the ‘diffused domain’ between the deeply supercooled liquid and amorphous solid, detected in heat capacity or density scans at a standard cooling rate. It correlates with values determined from primary relaxation time () or viscosity () evolution: or . Notably, in the range changes in the primary relaxation time or viscosity values reach 10 decades [4,5,6,7,8,9,10,11,16,17,18]. Therefore, experimental methods able to record such enormous time scales in single scans can be dedicated to testing previtreous phenomena. This is a generic feature of broadband dielectric spectroscopy (BDS) [6,7,8,9,10,11].
Several models outlining possible glass transition foundations have emerged [4,5,7,8,9,10,11,12]. However, their experimental validation remains problematic. None of them has managed to address quantitatively a set of universalistic properties recalled above. The most common model validation is the reference to Super-Arrhenius (SA) changes of dynamic properties, primarily by deriving its most popular replacement equation – the Vogel-Fulcher-Tamman (VFT) dependence [7,8,9,10,11,12,25,26,27]:
where the left side is the general SA equation and the right one is the VFT relation; is the temperature-dependent apparent activation energy, , denotes the extrapolated VFT singular temperature; the amplitude ; is the fragility strength coefficient, considered the metric of the discrepancy from the basic Arrhenius description related to .
When comparing the general SA and VFT equations, for the latter one obtains the following activation energy approximation:
where is the measure of the relative temperature distance from the VFT singular temperature.
Despite the impressive success of the VFT equation in parameterizing experimental data, up to the status of the universalistic symbol of the previtreous dynamics, it can only be considered the effective parameterization tool, as explicitly shown in refs. [11,28]. Questioning the informal paradigm of the VFT relation “universality” significantly increased the glass transition cognitive impasse. One can expect that inspiration from new experimental results beyond the dominant canon can be essential for progress. It is the case of high-pressure exogenic impact studies, developed mainly via BDS studies for the last decades [11,29,30,31,32,33,34,35,36].
A cognitive counterpoint can be an endogenic impact factor, such as nanoparticles. However, such experimental evidence is minimal. The most in-depth studies were probably carried out for glycerol + silver nanoparticles nanocolloids, focusing on phenomenal dynamics [37].
This report discusses the influence of nanoparticles on previtreous properties in nanocolloids composed of the E7 liquid crystalline (LC) mixture and paraelectric BaTiO3 nanoparticles. E7 can be supercooled in the nematic phase down to , at any cooling rate [38,39]. In 2000, 135 publications related to nematics and nanoparticles appeared. In 2010, it was 847 reports, and 2560 papers in 2020. In 2024: 3026 reports were published [40]. This boosting interest was primarily motivated by expectations that adding nanoparticles to LC compounds can substantially extend and support omnipresent applications of ‘pure’ LC materials. Nowadays, LC-based nanocolloids are considered a new, specific domain of Liquid Crystal Physics and Materials Engineering. [41,42,43,44,45,46,47,48,49,50,51,52,53,54,55,56,57,58,59,60]. However, the evidence regarding previtreous behavior in LC nanocolloids remains lacking.
This report addresses the mentioned research gaps in general glass transition physics and the specific topics of LC nanocolloids.
2. Materials and Methods
E7 is the eutectic mixture composed of rod-like cyanobiphenyl and cyanoterphenol components, at a specific composition, namely (1) 4-cyano-4’-n-pentyl-biphenyl (5CB, 51%), (2) 4-cyano-4’-n-heptyl-biphenyl (7CB, 25%), (3) 4-cyano-4’-n-oxyoctyl-biphenyl (8OCB, 16%), and (4) 4-cyano-4’’-n-pentyl-p-terphenyl (5CT, 8%). E7 was developed for display applications, with an operational range from to in the nematic phase, supported by convenient dielectric and optical properties. It was first implemented for calculators and watches [61,62,63].
In the given report the E7 mixture was purchased from Synthon, with the top offered quality. Before measurements, it was degassed & purified in subsequent and repeated steps: (i) solidification by freezing, supported by liquid nitrogen, (ii) removal of air and vapors via a vacuum pump, (iii) heating up to ca. i.e., deeply into the isotropic liquid state. The tested samples exhibit the following mesomorphism: Solid Glass - () - Nematic - () - Isotropic Liquid, in agreement with references [38,62,63]. Each rod-like LC compound in the E7 mixture is associated with a significant permanent dipole moment (), approximately parallel to the long molecular axis [38,63].
Tested nanocolloids composed of E7 and BaTiO3. For nanocolloids, the sedimentation of nanoparticles (NPs) can constitute a problem. One can minimize such a parasitic feature by introducing a macromolecular surface agent. However, it can complicate the spectrum registered in BDS scans and influence phase transition temperature. For nanoparticles applied in the given research, avoiding this parasitic impact factor is possible for mass fraction concentrations NPs.
BaTiO3 nanopowder (paraelectric, globular, diameter ) was purchased from US Research Nanomaterials, Inc.: see ref. [64]. Mixtures of the liquid crystal and nanoparticles were sonicated at a temperature above the isotropic–nematic phase transition for 4 hours to obtain homogeneous suspensions.
This report discusses nanocolloids with concentrations of NPs. The stability of nanocolloidal samples was tested by measuring the dielectric constant and electric conductivity in a special capacitor with rectangular plates: 20 mm in length and 5 mm in width, with two sections. Tests were conducted in the isotropic liquid and the nematic phase to the ‘longitudinal’ and ‘transverse’ positions. For concentrations no changes in dielectric properties were noted. A small sedimentation effect appeared for appeared after . This factor can be removed by sine–wave packages () and lasting . It is worth noting that for results presented in the given report, BDS-related scans required less than 5 minutes.
Broadband dielectric spectroscopy (BDS) is the essential experimental tool for studies on glass transition and liquid crystals [65]. The previtreous domain of glass-forming systems is associated with 10-12 decades in the process time scale for temperature in the range . It correlates with the time/frequency BDS scan range. The sensitivity to even weak electric fields is essential for liquid crystals, and it is also generic for BDS.
In this report BDS Novocontrol spectrometer, enabling the high-resolution complex dielectric permittivity scans with 5 – 6 digits resolution was used. Tests were carried out for voltage, offering the optimal resolution. Tested samples were placed in a flat–parallel capacitor made of gold-coated Invar: diameter and the distance between plates . All these yielded the intensity of the applied electric field: , located within the low-intensity limit values. The measurement capacitor was placed within the Quattro Novocontrol temperature control unit, which is coupled to the spectrometer. It enabled temperature resolution during tests from 0.02K to 0.05K. The Novocontrol WinDeta software controlled the measurement process. The final analysis was carried out using ORIGIN 2025 software.
Figure 1 shows master plots presenting dielectric spectra – the real and imaginary parts of dielectric permittivity as a function of frequency. They illustrate the behavior in subsequent phases for E7 and its nanocolloids. Characteristic features and domains are indicated. For they are (i) the static domain, where in a broad range of frequencies – defining the dielectric constant , and (ii) the low frequency (LF) domain with the boost of values. The emerging contribution of ionic contamination is most often cited as an explanation of the latter, but the authors would like to indicate that translational shifts of molecules from their equilibrium positions can yield a similar contribution.
For the imaginary part of dielectric permittivity, primary loss curves, related to the orientation of molecules emerge, are significant, particularly in the nematic phase. Peaks (maxima) of loss curves determine the primary () relaxation time characterizing the ability to the orientation process: , . Branches of the loss curves reflect the distribution of these relaxation times. Jonsher indicated the following scaling of loss curves [66,67]:
where and are coefficients related to the distribution of relaxation times. For a single relaxation time Debye process .
The above relations enable a simple way of estimating the peak frequency and then the relaxation time using the derivative of experimental data and the following relation [11]:
Relations (2), (3) & (4) offer a reliable protocol for determining the primary relaxation times, avoiding the uncertainty associated with the nonlinear fitting. The alternative path is associated with portraying loss curves via the Havriliak-Negami (HN) equation [11,65,68,69]:
where , is the value of permittivity at the high-frequency limit, it is related to the sum of atomic and electronic polarizabilities, is related to the distortion from the DC conductivity limit related to ; Parameters describe the distribution of relaxation times: are for the single relaxation time Debye model.
Jonsher and HN distribution parameters can be linked: and [11,65]. Relaxation time determined via HN equation requires multi-parameter nonlinear fitting, inherently associated with a notable error. Nevertheless, it is the only tool when loss curves overlap, limiting the reliable application of Eqs (2), (3), and (4). The transformation enables determining the DC electric conductivity, manifesting as the horizontal line in the plot vs. . In the DC domain:
3. Results
3.1. Dielectric Constant Changes
The dielectric constant is related to the real part of dielectric permittivity in the static frequency domain, where . Figure 1 shows that for systems tested in the given report, it ranges between ~1 kHz and in the isotropic phase.
For dipolar liquids pattern of changes can indicate the preferred arrangement of permanent dipolar moments coupled to molecules, namely: (i) ‘antiparallel’ for , and (ii) ‘parallel’ for , i.e., they mostly follow the external electric field [70].
Figure 2 presents changes in the dielectric constant for E7 and related nanocolloids, from the isotropic liquid phase down to the glass temperature vicinity. In the isotropic liquid phase, for each concentration of nanoparticles (NPs), the same pattern of pretransitional changes takes place [71,72,73]:
where is the extrapolated continuous phase transition temperature, ; the exponent , where is the heat capacity critical exponent. The value is the metric of the isotropic – nematic (I-N) transition discontinuity, constituting a significant reference for theoretical models.
Such behavior was noted for rod-like LC compounds with a permanent dipole moment approximately parallel to the long molecular axis, like 5CB or 8OCB [72,73]. In the isotropic liquid phase, the pretransitional/precritical growth of prenematic fluctuations is associated with the weakly discontinuous nature of I-N transition [38,39]:
where is the correlation length of pretransitional fluctuations related to the critical exponent with the mean-field value in the given case; approximates the volume of prenematic fluctuations.
Within prenematic fluctuations, the antiparallel arrangement of permanent dipole moments [38,39], leading to the ‘cancellation’ of permanent dipole moments impact, takes place. Consequently, the dielectric constant within fluctuations is significantly smaller than for the isotropic surrounding. One can consider the Contrast Factor (), as the metric for the difference between the physical characterization of fluctuations and their isotropic liquid surrounding. In the given case .
The volume occupied by prenematic fluctuations rapidly grows on approaching phase transition , as shown in Equation (7). The ‘prenematic’ contribution to the total registered value of the dielectric constant can dominate close to the clearing temperature. It is related to the crossover: . Such behavior and the portrayal by Eq. (6) are validated in Figure 3, where the parameterization via the derivative analysis is also shown [73]:
where and the exponent .
Related parameters are given in Table 1. The lack of impact of nanoparticles on values of the clearing temperature () and exponent is notable.
The same behavior was observed in earlier studies in other LC compounds (5CB and 8OCB) based nanocolloids, for which here discussed supercooling is absent [75,76]. A notable influence of nanoparticles on the phase transition discontinuity metric is visible: , from to .
In the nematic phase of rod-like LC materials, the dielectric constant can be tested for two general paths: (i) in non-oriented samples, which is associated with the spontaneous arrangement of molecules and coupled dipole moments, and (ii) in oriented samples with respect to the long molecular axis. The latter can be realized via the strong magnetic field (a few Tesla) or by covering the capacitor plates with a polymeric layer interacting with LC molecules to yield the desired orientation. The latter is dedicated to thin-layer (micrometric) samples. [38,74,75]. These cases are related to the orientation by exogenic impact factors.
One can consider components of dielectric constant in the nematic phase in frames of the Landau – de Gennes model [38,39], recalling the behavior of the order parameter and the ‘diameter’ [76]:
where , is the order parameter (op) metric, and denotes the ‘diameter’, are constant amplitudes; is the hypothetical continuous transition extrapolated from the nematic phase.
High resolution and distortions – sensitive studies in 5CB and 8OCB yield the order parameter and , which indicates tricritical point (TCP) mean-field-type approximation [76].
Linking the above dependencies, one obtains relations modeling the parallel and perpendicular ‘branches’ of the dielectric constant in the nematic phase:
where and are empirical parameters related to Eqs. (9) and (10).
In refs. [77,78], in nanocolloids 8OCB+BaTiO3 and 5CB+ BaTiO3, the arrangement of molecules controlled solely by NPs concentration was shown. Both ‘parallel’ and ‘perpendicular’ permanent endogenic orientations were obtained. For E7 and its nanocolloids up to NPs the fair portrayal via Eq. (11) takes place, as shown in Figure 2. Notable that for ‘pure’ E7 () the decrease of the capacitor gap distorts such pattern, increasing detected values. It was not observed for nanocolloids. For the concentration nanocolloid dielectric constant ‘roughly’ follows the ‘parallel’ pattern (Eq. 12), with distortions near I-N transition and a ‘slight’ discontinuous transition at .
3.2. Primary Relaxation Time in the Previtreous Domain
The dielectric constant is the static (frequency-independent) dielectric property associated with the real part of dielectric permittivity. Dynamic properties explicitly manifest for the imaginary part of dielectric permittivity, as presented in Figure 1. The primary loss curve peak is associated with the ability to re-orient the permanent dipole moment coupled to rod-like molecules. For E7 and related nanocolloids, there are two loss curves (alpha () and alpha’ ()) in the nematic phase, as shown in Figure 1. It can be associated with multicomponent E7 composition. The temperature changes of and primary relaxation times are presented in Figure 4. Notable is their overlapping, i.e., they are almost non-impacted by nanoparticle concentrations.
In ref. [11], the distortions-sensitive analysis of various model equations portraying previtreous dynamics in glass-forming liquids was carried out. It showed the limited validity of the VFT portrayal (Eq. 1) and indicated the universalistic prevalence of the double-exponential MYEGA equation [79,80]:
The fair parameterizations via this relation are shown in Figure 4. They are associated with the following sets of parameters for relaxation, and for primary relaxations.
The comparison of the above relation and the general SA dependence (the left side of Equation (1)) yields the apparent activation energy for the MYEGA equation:
The right side of Equation (13b) indicates the transformation , leading to the apparent activation energy given in Equation (1b). The VFT equation emerges when considering limited to the first term Taylor expansion of MYEGA-related apparent activation energy. The comparison of Eqs. (1) and (13) show the link between VFT and MYEGA equation parameters: , and . Notable that the MYEGA equation is not associated with the finite temperature singularity, which is the inherent feature of the VFT dependence. As shown above, it appears due to the ‘nonlinear terms truncation’ in the Taylor expansion of the exponential term in Eq. (13b).
3.3. Primary Loss Curve Maximum Previtreous Changes
Coordinates of the loss curve maximum define the primary relaxation time () discussed above and the metric of the energy related to this process () [78].
Temperature changes of the primary relaxation time are almost independent from NPs concentration, as visible in Figure 4. The loss curves peaks patterns of changes strongly depend on NPs concentration, as shown in Figure 5 and Figure 6, for and relaxation processes. For process, the addition of nanoparticles first decreases the values of , but for the highest tested concentration, , it strongly rises, as presented in Figure 5. Moreover, the discontinuous transition at appears both for (Figure 4) and (Figure 5). Patterns of changes for and are notably different. However, for both primary processes, a previtreous ‘bending up’ when approaching appears, suggesting a significant change in the energy required for electric field-related reorientation. The reliable estimations of in the immediate vicinity of were possible only for processes, due to its explicit manifestation (Figure 6). As shown by solid curves portraying experimental data, the ‘anomaly’ can be parameterized by the following relation:
where are constant amplitudes.
When recalling Critical Phenomena Physics [81,82], the term in the square bracket (Eq. (14)) can be considered the so-called ‘background effect’, which supports the fact that values of are close to the minimum of occurring ca. 8K above . Using values given in Table 2 one can estimate the ‘discontinuity’ , it is in range from for E7+0.05% BaTiO3 nanocolloid to for E7+0.1% BaTiO3 nanocolloid.
3.4. DC Electric Conductivity in the Isotropic Liquid and Supercooled Nematic
Figure 7 presents the temperature evolution of DC electric conductivity, reflecting translational processes. The non-linear evolution in the Arrhenius scale used in Figure 7 shows the Super-Arrhenius pattern of changes. For all tested NPs concentrations dependencies almost overlap and can be approximated by the counterpart of MYEGA relation [79,80], namely:
Following ref. [83], for vitrifying systems, one can consider the ‘universalistic’ pattern for the steepness index, also representing the apparent activation enthalpy:
where and is the singular temperature.
The above equation also shows the link to ‘relative changes’ of the considered dynamic property in the given case .
Figure 8 validates the portrayal of the apparent activation enthalpy by Eq. (16) for E7 and related nanocolloids, with the convergence when approaching and . Such a description also appears in the isotropic liquid phase, with for pure E7 and for nanocolloid. Recalling the discussion presented in ref. [83] the approximation in the isotropic liquid phase can be linked to the dynamic crossover temperature, matched to a hypothetical ‘magic’ time-scale: namely .
4. Discussion
A particularly puzzling result of this work is the explicit evidence for the anomalous, critical-like (Eq. (14)) behavior of the loss curve maximum in the immediate vicinity of .
Generally, it recalls the long-standing discussion regarding a possible relationship between the glass transition and a hypothetical hidden critical point [9,10,11,84,85,86,87,88,89,90]. The essential problem of these model discussions has been the practical lack of evidence of critical-type pretransitional effects near . In Critical Phenomena Physics [81,82], they are the essential inspiration and reference for model validations.
The results for changes presented in Figure 6 and parameterized via Equation (14), as well as the very recent communication [90], can be considered the unique evidence of the previtreous ‘critical-type’ effect near .
To discuss these results, it is worth recalling the case of Isotropic–Nematic (I-N) weakly discontinuous phase transition, which is also the topic of this report. It is notable, that the isotropic liquid phase above is considered a specific model-system for the glass transition phenomenon [92,93,94,95,96,97].
Let's recall basic features regarding pretransitional effects in the isotropic liquid phase of nematogenic LC:
- Static properties, such as dielectric constant, can show an explicit ‘critical’ anomaly –. However, it appears only for LC systems with the permanent dipole moment approximately parallel to the long molecular axis, yielding contrast factor : see Figure 2 and Figure 3, Equations (6) & (8) above. For LC molecules with the perpendicular (transverse) arrangement of the dipole moment, the pretransitional effect is absent, since [73,76,77,78,91].
- ‘Nonlinear’ properties, coupled to a 4-point correlation function, such as NDE/NDS or the Kerr effect (KE), the pretransitional, ‘critical’ effects are always observed in the isotropic phase [38,76,81,96,97,98]. NDE, NDS, KE are inherently associated with the strong electric field, which impacts fluctuations, and as their surrounding is different, it yields , and then the contribution related to fluctuations is extracted.
Comparing the previtreous domain of glass-formers for cooling , & the isotropic phase of LC nematogens for , one obtains:
- Ad. (2) – Recently, in the previtreous domain, the critical-like behavior of the configurational entropy and the associated contribution of the heat capacity have been evidenced due to the innovative distortions-sensitive analysis. [17]
- Ad. (3) – Recently, hallmarks of dielectric constant pretransitional behavior have been noted for 8*OCB, an LC compound that can be supercooled down to in the isotropic phase [90]. There are extreme problems in such tests since they require scans for extremely low frequencies.
- Ad. (4) Generally, for 4-point correlation functions related to experimental methods like NDS, the response from ‘heterogeneities’ has been registered. However, obtained data do not allow to consider temperature-related pretransitional effects. It is associated with the ultraviscous/ultraslowed features of the previtreous domain, yielding very challenging experimental requirements [9]. Nevertheless, for plastic crystal forming systems, like the Orientationally Disordered Crystals (ODICs) the ‘ultraviscous’ limitation is minimized: for NDE, the explicit critical-type effects have been obtained [23]. Moreover, its description can be correlated with pretransitional effect modeling for the isotropic phase of nematogens [23].
For supercritical and subcritical domains described by the Critical Phenomena Physics, collective precritical fluctuations are essential, shaping pretransitional effects as the phenomenal hallmark. These fluctuations exhibit features of the subsequent, approaching phase. In case of the isotropic liquid phase of LC nematogens, there are prenematic fluctuations in the isotropic liquid surrounding, i.e., symmetries related to fluctuations and their surrounding are different.
Assuming that ‘dynamical heterogeneities’ are related to precritical/pretransitional fluctuations, they should express characterization of the next, approaching phase – in the given case, amorphous solid. Hence, in the previtreous domain, near one can consider solid amorphous fluctuations/heterogeneities submerged in the isotropic ultraviscous/ultraslowed surrounding. There is no symmetry difference between ‘fluctuations’ and surrounding. Within fluctuations, only some bonding that supports solidification appears.
The latter means that for many standard methods, that scan physical properties, the contrast factor , can explain the slightly puzzling evidence of ‘universalistic effects’ in the previtreous domain. Notable that the contrast factor has no meaning for the primary relaxation time DC electric conductivity detected in BDS studies since these properties are related to the averaged response from individual molecules, whose ability to orientation or translation can be only slightly ‘distorted’ by the ‘frustration’ related to the appearance or disappearance of fluctuations/heterogeneities. This can be linked to the Super-Arrhenius and non-Debye dynamics, which are characteristic of both the isotropic phase of LC nematogens and the previtreous domain of glassformers.
One can expect the appearance of pretransitional effect if the response regarding energy requirement for reorientation is essentially different for fluctuations/heterogeneities and their surroundings. It is the case of supercooled E7 where the solidification/vitrification is related to the translational disorder of the locally orientationally ordered nematic phase. It means previtreous/pretransitional fluctuation with a ‘frozen’ prenematic arrangement supported by intermolecular bondings. Such a mechanism could not be effective for non-anisotropic molecular systems, like glycerol – the most standard glass former.
For E7-based nanocolloids the addition of nanoparticles can influence the arrangement and bonding process, changing the values of but not the general pattern, as shown in Figure 6
5. Conclusions
The aim of this report is to fill the research gap for the previtreous behavior in LC-based nanocolloids. BDS studies were carried out in the E7 glass-forming LC mixture composed of rod-like molecules, and in E7 nanocolloids with BaTiO3 nanoparticles dispersion. First, pretransitional changes of dielectric constant in the isotropic liquid phase have been presented. They follow the pattern known for nematogenic compounds with the permanent dipole moment approximately parallel to the long molecular axis for E7 and related nanocoloids. This pretransitional effect is related to prenematic fluctuations due to the weakly discontinuous character of the I-N transition.
The dominant part of studies on the previtreous behavior in glass-forming systems is focused on dynamics, tested via the primary relaxation time and DC electric conductivity.
For E7 and related nanocolloids, the fair portrayal of and changes via the super-Arrhenius MYEGA equation have been shown (Eqs. (13) and (15)). The universalistic pattern of changes for the apparent activation enthalpy is notable, which coincides with the steepness index for the Arrhenius scale presentation. Further, this property can be considered the metric of or relative changes in this scale (Eq. (16)). It is worth recalling that these properties are associated with orientational and translational dynamics, respectively [7,11].
The primary relaxation time is related to the time-scale associated with the primary loss curve peak in spectrum [7,11]. The second coordinate of the peak is the loss curve maximum . It reflects the energy required for the orientation [78]. Surprisingly, the evolution of these properties is hardly, if at all, evidenced in studies on the previtreous dynamics. The results of this report show changes in supercooling E7-based nanocolloids overlaps. Previtreous changes of strongly depend on the concentration of nanoparticles in tested nanocolloids. For this property, the unique critical-like effect near , extending up to , has been found. It is shown in Figure 6, with the parameterization via Equation (14).
All these can indicate a possible milestone significance for studying previtreous phenomena in glassformers composed of anisotropic molecules, where the addition of nanoparticles offers a supplementary possibility of testing the impact of local nano-frustrations.
Author Contributions
A. Drozd-Rzoska: the concept, data analysis, paper writing and figures supplementation; S.J. Rzoska: the concept and participated in the analysis and paper writing; & supervising; J. Łoś:BDS studies and prepared the figures. All authors have read and agreed to the published version of the manuscript.
Funding
This research was funded by the National Center for Science (NCN, Poland), grant number NCN OPUS 2022/45/B/ST5/04005, headed by Sylwester J.Rzoska.
Data Availability Statement
All data are available directly from the authors following reasonable request. They are also deposited in the public open-access REPOD database (Poland)
Conflicts of Interest
The authors declare no conflicts of interest.
References
- Sokolov, A.P. Why the glass transition is still interesting. Science 1995, 273, 1675–1676. [Google Scholar] [CrossRef]
- Debenedetti, P. Stillinger, F. Supercooled liquids and the glass transition. Nature 2001, 410, 259–267. [Google Scholar] [CrossRef]
- Kennedy, D.; Norman, C. What don't we know. Science's 125 Open Questions; in 125th anniversary Science 1st July special issue (2005).
- Wolyness, P.G.; Lubchenko, V. Structural Glasses and Supercooled Liquids: Theory, Experiment, and Applications; J. Wiley & Sons: New York, USA, 2012. [Google Scholar]
- Berthier, L.; Ediger, M. Facets of the glass transition. Physics Today 2016, 69, 40–44. [Google Scholar] [CrossRef]
- Richert, R. Nonlinear Dielectric Spectroscopy; Springer: Berlin, Germany, 2018. [Google Scholar]
- Kremer, F.; Loidl, A. Scaling of Relaxation Processes; Springer: Berlin, USA, 2018. [Google Scholar]
- Ramirez, R. An Introduction to Glass Transition; Nova Sci. Pub: London, UK, 2019. [Google Scholar]
- McKenna, G.B. Glass transition: challenges of extreme time scales and other interesting problems. Rubber Chem. Technol. 2020, 93, 79–120. [Google Scholar] [CrossRef]
- Chamberlin, R.V. An Ising model for supercooled liquids and the glass transition. Symmetry 2022, 14, 2211. [Google Scholar] [CrossRef]
- Drozd-Rzoska, A.; Rzoska, S. J.; Starzonek, S. New scaling paradigm for dynamics in glass-forming systems. Prog. Mater. Sci. 2023, 134, 101074. [Google Scholar] [CrossRef]
- Welch, R. S.; Zanotto, E. D.; Wilkinson, C. J.; Cassar, D. R.; Montazerian, M.; Mauro, J.C. Cracking the Kauzmann paradox. Acta Materialia 2023, 254, 118994. [Google Scholar] [CrossRef]
- Dyre, J.C. Solid-that-flows picture of glass-forming liquids. J. Phys. Chem. Lett. 2024, 15, 1603–1617. [Google Scholar] [CrossRef]
- Costigliola, L.; Hecksher, T.; Dyre, J.C. Glass-forming liquids need facilitation. Proc. Natl. Acad. Sci. USA 2024, 121, e2408798121. [Google Scholar] [CrossRef]
- Böhmer, T.; Pabst, F.; Gabriels, J.P.; Blochowicz, T. Dipolar order controls dielectric response of glass transition. Phys. Rev. Lett. 2024, 132, 206101. [Google Scholar] [CrossRef]
- Lum, H. When physics meets chemistry at the dynamic glass transition. Rep. Prog. Phys. 2025, 87, 032601. [Google Scholar]
- Drozd-Rzoska, A.; Rzoska, S.J.; Starzonek. S. New paradigm for configurational entropy in glass-forming systems. Sci. Rep. 2022, 12, 3058. [Google Scholar] [CrossRef]
- Kojima, S. Dynamic Specific Heat and the Glass Transition; Intech: Rijeka, Croatia, 2023. [Google Scholar]
- Eaves, J.D.; Reichmanm, D.R. Spatial dimension and the dynamics of supercooled liquids. Proc. Natl. Acad. Sci. USA 2009, 106, 15171–15175. [Google Scholar] [CrossRef]
- Garrahan, J.P. Dynamic heterogeneity comes to life. Proc. Natl. Acad. Sci. USA 2011, 108, 4701–4702. [Google Scholar] [CrossRef]
- Rzoska, S.J.; Drozd-Rzoska, A. Dual field nonlinear dielectric spectroscopy in a glass forming EPON 828 epoxy resin. J. Phys.: Condens. Matter 2011, 24, 035101. [Google Scholar] [CrossRef]
- Tah, I.; Karmakar, S. Signature of dynamical heterogeneity in spatial correlations of particles displacement and its temporal evolution in supercooled liquids. Phys. Rev. Research 2020, 2, 022067(R). [Google Scholar] [CrossRef]
- Drozd-Rzoska, A.; Rzoska, S.J.; Szpakiewicz-Szatan, A.; Łoś, J.; Starzonek, S. Supercritical anomalies in liquid ODIC-forming cyclooctanol under the strong electric field. J. Mol. Liq. 2022, 345, 1178491. [Google Scholar] [CrossRef]
- Hasyim, M.R; Mandadapu, K.K. Emergent facilitation and glass dynamics in supercooled liquids. Proc. Natl. Acad. Sci. USA 2024, 121, e2322592121. [Google Scholar] [CrossRef] [PubMed]
- Vogel, H. Temperaturabhängigkeitsgesetz der viskosität von flüssigkeiten. Phys. Zeit. 1921, 22, 645–646. [Google Scholar]
- Fulcher, G.S. Analysis of recent measurements of the viscosity of glasses. J. Am. Ceram. Soc. 1925, 8, 339–335. [Google Scholar] [CrossRef]
- Tammann, G. Glasses as supercooled liquids. J. Soc. Glass Technol. 1925. J. Soc. Glass Technol. 1925, 1925. 9, 166–185. [Google Scholar]
- Tanaka, H. Relation between thermodynamics and kinetics of glass-forming liquids. Phys. Rev. Lett. 2003, 90, 05570. [Google Scholar] [CrossRef] [PubMed]
- Andersson, S.P.; Andersson, O. Relaxation studies of poly(propylene glycol) under high pressure. Macromolecules 1998, 31, 2999–3006. [Google Scholar] [CrossRef]
- Drozd-Rzoska, A.; Rzoska, S. J.; Paluch, M. On the glass transition under extreme pressure J. Chem. Phys. 2007, 126, 164504. [Google Scholar]
- Pronin, A.A.; Kondrin, M.V.; Lyapin, A. G.; Brazkhin, V.V.; Volkov, A.A.; Lunkenheimer, P. Glassy dynamics under superhigh pressure. Phys. Rev. E 2010, 81, 041503. [Google Scholar] [CrossRef]
- Floudas, G. , Paluch, M., Grzybowski, A., Ngai, K. Molecular Dynamics of Glass-Forming Systems: Effects of Pressure; Springer: Berlin, Germany, 2011. [Google Scholar]
- Kondrin, M.V.; Pronin, A.A; .Brazkhin, V.V. Secondary relaxation in supercooled liquid propylene glycol under ultrahigh pressures revealed by dielectric spectroscopy measurements. J. Phys. Chem. B 2018, 122, 9032–9037. [Google Scholar] [CrossRef]
- Bair, S. High Pressure Rheology for Quantitative Elastohydrodynamics; Elsevier: Amsterdam, The Netherlands, 2019. [Google Scholar]
- Drozd-Rzoska. A. Pressure-related universal previtreous behavior of the structural relaxation time and apparent fragility. Front Mat: Glass Sci. 2019, 6, 103. [Google Scholar] [CrossRef]
- Kondrin, M.V.; Pronin, A.A.; Lebed, Y.B.; Brazhkin, V.V. High pressures as an effective tool to separate different contributions to the electrode polarization of polar liquids and solids. J. Phys. Chem. Solids 2024, 182, 111570. [Google Scholar] [CrossRef]
- Starzonek, S.; Rzoska, S.J; . Drozd-Rzoska, A.; Pawlus, S.; Martinez-Garcia, J.-C.; Kistersky, L. Fractional Debye–Stokes–Einstein behaviour in an ultraviscous nanocolloid: glycerol and silver nanoparticles. Soft Matter 2011, 5, 5554–5562. [Google Scholar] [CrossRef]
- Demus, D.; Goodby, J.; Gray, G.W.; Spiess, H.-W.; Vill, V. Handbook of Liquid Crystals: Fundamentals; Wiley-VCH: Weinheim, Germany, 1998. [Google Scholar]
- Collings, P.; Goodby, J.W. Introduction to Liquid Crystals: Chemistry and Physics; CRC Press: Boca Raton, FL, USA, Ed.; Routledge: London, UK, 2019. [Google Scholar]
- Google Scholar search, access 22nd Jan, 2025.
- Lagerwall, J.P.F. Liquid Crystals with Nano and Microparticles; World Scientific: Singapore, 2016. [Google Scholar]
- Dierking, I. Nanomaterials in Liquid Crystals. Nanomaterials 2018, 8, 453. [Google Scholar] [CrossRef]
- Thomas, S.; Kalarikkal, N.; Abraham, A.R. Fundamentals and Properties of Multifunctional Nanomaterials (Micro and Nano Technologies); Elsevier: Amsterdam, The Netherlands, 2021. [Google Scholar]
- Brás; A. R., Frunza; S.; Guerreiro; L.; Fonseca; I.M.; Corma; A.; Frunza, L.; Dionísio; M.; Schönhals. A. Molecular mobility of nematic E7 confined to molecular sieves with a low filling degree. J. Chem. Phys. 2010, 132, 224508. [Google Scholar] [CrossRef]
- Kim, YK.; Senyuk, B.; Lavrentovich, O. Molecular reorientation of a nematic liquid crystal by thermal expansion. Nat. Commun. 2012, 3, 1133. [Google Scholar] [CrossRef] [PubMed]
- Sharma, A.; Kumar, P.; Malik, P. Effect of zinc oxide nanoparticles on dielectric behavior of nematic liquid crystal. AIP Conf. Proc. 2018, 1953, 100037. [Google Scholar]
- Kyrou, C.; Kralj, S.; Panagopoulou, M.; Raptis, Y.; Nounesis, G.; Lelidis, I. Impact of spherical nanoparticles on nematic order parameters. Phys. Rev. E 2018, 97, 042701. [Google Scholar] [CrossRef]
- Garbovskiy, Y. Nanomaterials in liquid crystals as ion-generating and ion-capturing objects. Crystals 2018, 8, 264. [Google Scholar] [CrossRef]
- Selevou, A.; Papamokos, G.; Yildirim, T.; Duran, H.; Steinhart,,M. ; Floudas, G. Eutectic liquid crystal mixture E7 in nanoporous alumina. Effects of confinement on the thermal and concentration fluctuations. RSC Adv. 2019, 9, 37846–37857. [Google Scholar] [CrossRef]
- Derbali, M.; Guesmi, A.; Ben Hamadi, N.; Soltani, T. Dielectric, electrooptic and viscoelastic properties in cybotactic nematic phase doped with ferroelectric nanoparticles. J. Mol. Liq. 2020, 319, 113768. [Google Scholar] [CrossRef]
- Garbovskiy, Y. On the analogy between electrolytes and ion-generating nanomaterials in liquid crystals. Nanomaterials 2020, 10, 403. [Google Scholar] [CrossRef]
- Ambrožic, M.; Pal, K.; Kralj, S.; Holbl, A. Nanoparticle controlled nematic macroscopic properties. J. Mol. Struct. 2021, 1230, 129878. [Google Scholar] [CrossRef]
- Vafaie, R.; Vahedi, A.; Zakerhamidi, M.S.; Tajalli, H. Dielectric and electro-optical properties of 6CHBT nematic liquid crystals doped with MgO nanoparticles. Liquid Crystals 2021, 48, 1417–1428. [Google Scholar] [CrossRef]
- Nasri, R.; Missaoui, T.R.; Hbibi, A.; Soltani, T. Enhanced dielectric properties of nematic liquid crystal doped with ferroelectric nanoparticles. Liquid Crystals 2021, 48, 1429–1437. [Google Scholar] [CrossRef]
- Ranjkesh, A.; Ebrahimpour, N.; Zakerhamidi, M.S.; Seyedahmadian, S.M. Temperature-dependent dielectric property of a nematic liquid crystal doped with two differently–shaped tungsten oxide (W18O49) nanostructures. J. Mol. Liq. 2022, 348, 118024. [Google Scholar] [CrossRef]
- Kovalchuk, O.V.; Kovalchuk, T.M.; Tomašovičová, N.; Timko, M.; Zakutanska, K.; Miakota, D.; Kopčanský, P.; Shevchuk, O.F.; Garbovskiy, Y. Dielectric and electrical properties of nematic liquid crystals 6CB doped with iron oxide nanoparticles. The combined effect of nanodopant concentration and cell thickness. J. Mol. Liq. 2022, 366, 120305. [Google Scholar] [CrossRef]
- Rastogi, A.; Mishra, A.; Pandey, F.P.; Manohar, R.; Parmar, A.S. Enhancing physical characteristics of thermotropic nematic liquid crystals by dispersing in various nanoparticles and their potential applications. Emergent Mater. 2023, 6, 101–136. [Google Scholar] [CrossRef]
- Kyrou, C.; Ambrozic, M.; Tsiourvas, D.; Kralj, S.; Atata, S.B.; Lelidis, I. Effect of quantum dots on the phase behavior and order of 8CB liquid crystals. J. Mol. Liq. 2023, 387, 122568. [Google Scholar] [CrossRef]
- Zid, M.; Cordoyiannis, G.; Kutnjak, Z.; Kralj, S. Criticality controlling mechanisms in nematic liquid crystals. Nanomaterials 2024, 14, 320. [Google Scholar] [CrossRef]
- Okutan, M.; Ozturk, M.; Ye,Silot, G.; Yalcın, O.; Bolívar, P.H. Fullerene C60: Dielectric and elastic properties of E8 nematic liquid crystal. J. Phys.: Condens. Matter 2024, 673, 1417–1428. [Google Scholar] [CrossRef]
- Jones, J.C. The fiftieth anniversary of the liquid crystal display. Liquid Crystals Today 2018, 27, 44–70. [Google Scholar] [CrossRef]
- Raynes, E.P.; Sage, I.C. Chemicals to calculators: the early exploitation of cyanobiphenyl liquid crystals. Liquid Crystals 2015, 42, 722–731. [Google Scholar] [CrossRef]
- De Sousa, F.A. Michels, R.N., Cardoso, P.M.M., De Jesus, M.M.A. Experimental proof of an anomalous behavior in the nematic phase of liquid crystal E7. Mol. Cryst. Liq. Cryst. 2013, 576, 116–117. [Google Scholar] [CrossRef]
- Barium Titanate BaTiO3 Nanoparticles/Nanopowder (BaTiO3, 99.9%, 50nm, cubic). Available online: https://www.us-nano.com/inc/sdetail/532 (accessed on 23 January 2025).
- Kremer, F.; Schönhals, A. Broadband Dielectric Spectroscopy; Springer: Berlin, Germany, 2004. [Google Scholar]
- Jonsher, A.K. Dielectric Relaxation in Solids; Chelsea Dielectric Press: London, UK, 1978. [Google Scholar]
- Jonsher, A.K. Universal relaxation law; Chelsea Dielectric Press: London, UK, 1996. [Google Scholar]
- Havriliak, S.; Negami, S. A complex plane representation of dielectric and mechanical relaxation processes in some polymers. Polymer 1967, 8, 161–210. [Google Scholar] [CrossRef]
- Górska, K.; Horzela, A.; Bratek, Ł.; Dattoli, G.; Penson, K.A. The Havriliak–Negami relaxation and its relatives: the response, relaxation and probability density functions. J. Phys. A: Math. Theor. 2018, 51, 135202. [Google Scholar] [CrossRef]
- Chełkowski, A. Dielectric Physics; PWN-Elsevier: Warsaw, Poland, 1990. [Google Scholar]
- Bradshaw, M.J.; Raynes, E.P. Pre-transitional effects in the electric permittivity of cyano-nematics. Mol. Cryst. Liq. Cryst. Lett. 1981, 72, 73–78. [Google Scholar] [CrossRef]
- Thoen, J.; Menu, G. Temperature dependence of the static relative permittivity of octylcyanobiphenyl (8CB). Mol. Cryst. Liq. Cryst. 1983, 97, 163–176. [Google Scholar] [CrossRef]
- Drozd-Rzoska, A.; Rzoska, S.J.; Zioło, J. Critical behaviour of dielectric permittivity in the isotropic phase of nematogens. Phys. Rev. E 1996, 54, 6452–6456. [Google Scholar] [CrossRef]
- Cummins, P.G.; Dunmur, D.A.; Jessup, N.E. The Dielectric properties of nematic MBBA in the presence of electric and magnetic fields; in: Johnson, J.F. , Porter, R.S., Eds Liquid Crystals and Ordered Fluids; Springer: Boston, MA, USA, 1974. [Google Scholar]
- Mierzwa, M.; Rams-Baron, M.; Capaccioli, S. Pawlus, S.; Paluch, M. How to align a nematic glassy phase – different conditions – different results. J. Mol. Liq. 2019, 280, 314–318. [Google Scholar] [CrossRef]
- Drozd-Rzoska, A. ‘Quasi-tricritical’ and glassy dielectric properties of a nematic liquid crystalline material. Crystals 2020, 10, 297. [Google Scholar] [CrossRef]
- Drozd-Rzoska, A.; Starzonek, S.; Rzoska, S.J.; Kralj, S. Nanoparticle-controlled glassy dynamics in nematogen-based nanocolloids. Phys. Rev. E 2019, 99, 052703. [Google Scholar] [CrossRef] [PubMed]
- Łoś, J.; Drozd-Rzoska, A.; Rzoska, S. J.; Starzonek, S.; Czupryński, K. Fluctuations-driven dielectric properties of liquid crystalline octyloxycyanobiphenyl and its nanocolloids. Soft Matter 2022, 18, 4502–4512. [Google Scholar] [CrossRef]
- Mauro, J.C.; Yue, Y.; Ellison, A.J.; Gupta, P.K.; Allan, D.C. Viscosity of glassforming liquids. Proc. Natl. Acad. Sci. USA 2009, 24, 19780–19784. [Google Scholar] [CrossRef]
- Smedskjaer, M.M.; Mauro, J.C.; Yue, Y.Z. Ionic diffusion and the topological origin of fragility in silicate glasses. J. Chem. Phys. 2009, 131, 244514. [Google Scholar] [CrossRef] [PubMed]
- Anisimov, M.A. Critical Phenomena in Liquids and Liquid Crystals; Gordon and Breach: Reading, UK, 1992. [Google Scholar]
- Honig, J.; Spałek, J. A Primer to the Theory of Critical Phenomena; Elsevier: Amsterdam, The Netherlands, 2018. [Google Scholar]
- Drozd-Rzoska, A. A universal behavior of the apparent fragility in ultraslow glass forming systems. Sci. Rep. 2019, 9, 6816. [Google Scholar] [CrossRef]
- Tanaka, H.; Kawasaki, T.; Shintani, H. ; Critical-like behaviour of glass-forming liquids. Nat. Mater. 2010, 9, 324–331. [Google Scholar] [CrossRef] [PubMed]
- Tanaka, H. Roles of liquid structural ordering in glass transition, crystallization, and water's anomalies. J. Non-Cryst. Solids X 2022, 13, 100076. [Google Scholar] [CrossRef]
- Tong, H.; Tanaka, H. Revealing hidden structural order controlling both fast and slow glass dynamics in supercooled liquids. Phys. Rev. X 2018, 8, 011041. [Google Scholar]
- Franz, S.; Parisi, G.; Tersenghi, F.R. Glassy critical points and the random field Ising model. J. Stat. Mech.: Theory Exp. 2013, 2013, LO2001. [Google Scholar] [CrossRef]
- Tao, P.; Du, C. Xiao, Y.; Zheng, C.. Data-driven detection of critical points of phase transitions in complex systems. Commun Phys. 2023, 6, 311. [Google Scholar] [CrossRef]
- Watanabe, M.; Shi, D.; Kiyama, R.; Maruyama, K.; Nishizawa, Y.; Uchihashi, T.; Gong, J.P.; Nonoyama, T. Phase separation-induced glass transition under critical miscible conditions. Mat. Adv. 2024, 6, 7140–7146. [Google Scholar] [CrossRef]
- Starzonek, S.; Łoś, J.; Rzoska, S.J.; Drozd-Rzoska, A.; Iglič, A. Are critical fluctuations responsible for glass formation? Materials 2024, 17, 3385. [Google Scholar] [CrossRef]
- Drozd-Rzoska, A.; Łoś, J.; Rzoska, S.J. The dominance of pretransitional effects in the liquid crystal based nanocolloids: nematogenic MBBA with the transverse permanent dipole moment and BaTiO3 nanoparticles, Nanomaterials 2024, 14, 655.
- Sengupta, A.; Fayer, M.D. Theory of universal fast orientational dynamics in the isotropic phase of liquid crystals. J. Chem. Phys. 1995, 102, 4193–4202. [Google Scholar] [CrossRef]
- Cang, H.; Li, J.; Novikov, V.N.; Fayer, M.D. Dynamics in supercooled liquids and in the isotropic phase of liquid crystals: A comparison. J. Chem. Phys. 2003, 118, 9303–9311. [Google Scholar] [CrossRef]
- Cang, H.; Li, J.; Novikov, V.N.; Fayer, M.D. Dynamical signature of two “ideal glass transitions” in nematic liquid crystals. J. Chem. Phys. 2003, 119, 10421–10427. [Google Scholar] [CrossRef]
- Letz, M.; Schilling, R.; Latz, A. Ideal glass transition for hard ellipsoids. Phys. Rev. E 2000, 62, 5173–5189. [Google Scholar] [CrossRef] [PubMed]
- Theenhaus, T; Allen, M. P.; Letz, M.; Latz, A.; Schilling, R. Dynamical precursor of nematic order in a dense fluid of hard ellipsoids. Eur. Phys. J. E 2002, 8, 269–279. [Google Scholar] [CrossRef]
- Alhissi, M.; Zumbusch, A.; Fuchs, M. Observation of liquid glass in molecular dynamics simulations J. Chem. Phys. 2024, 160, 164502. [Google Scholar] [CrossRef]
- Rzoska, S. J.; Paluch, M.; Pawlus, S.; Drozd-Rzoska, A.; Jadzyn, J.; Czupryński, K.; Dąbrowski,R. Complex dielectric relaxation in supercooling and superpressing liquid-crystalline chiral isopentycyanobiphenyl. Phys. Rev. E 2003, 68, 031705. [Google Scholar] [CrossRef]
Figure 1.
Complex dielectric permittivity spectra, collected in selected temperatures: for the isotropic liquid phase, for the nematic phase, for the supercooled nematic phase, just above the glass transition, and for the solid glass state. Characteristic features are indicated. Note indications for two primary relaxation processes () and DC electric conductivity (σ).
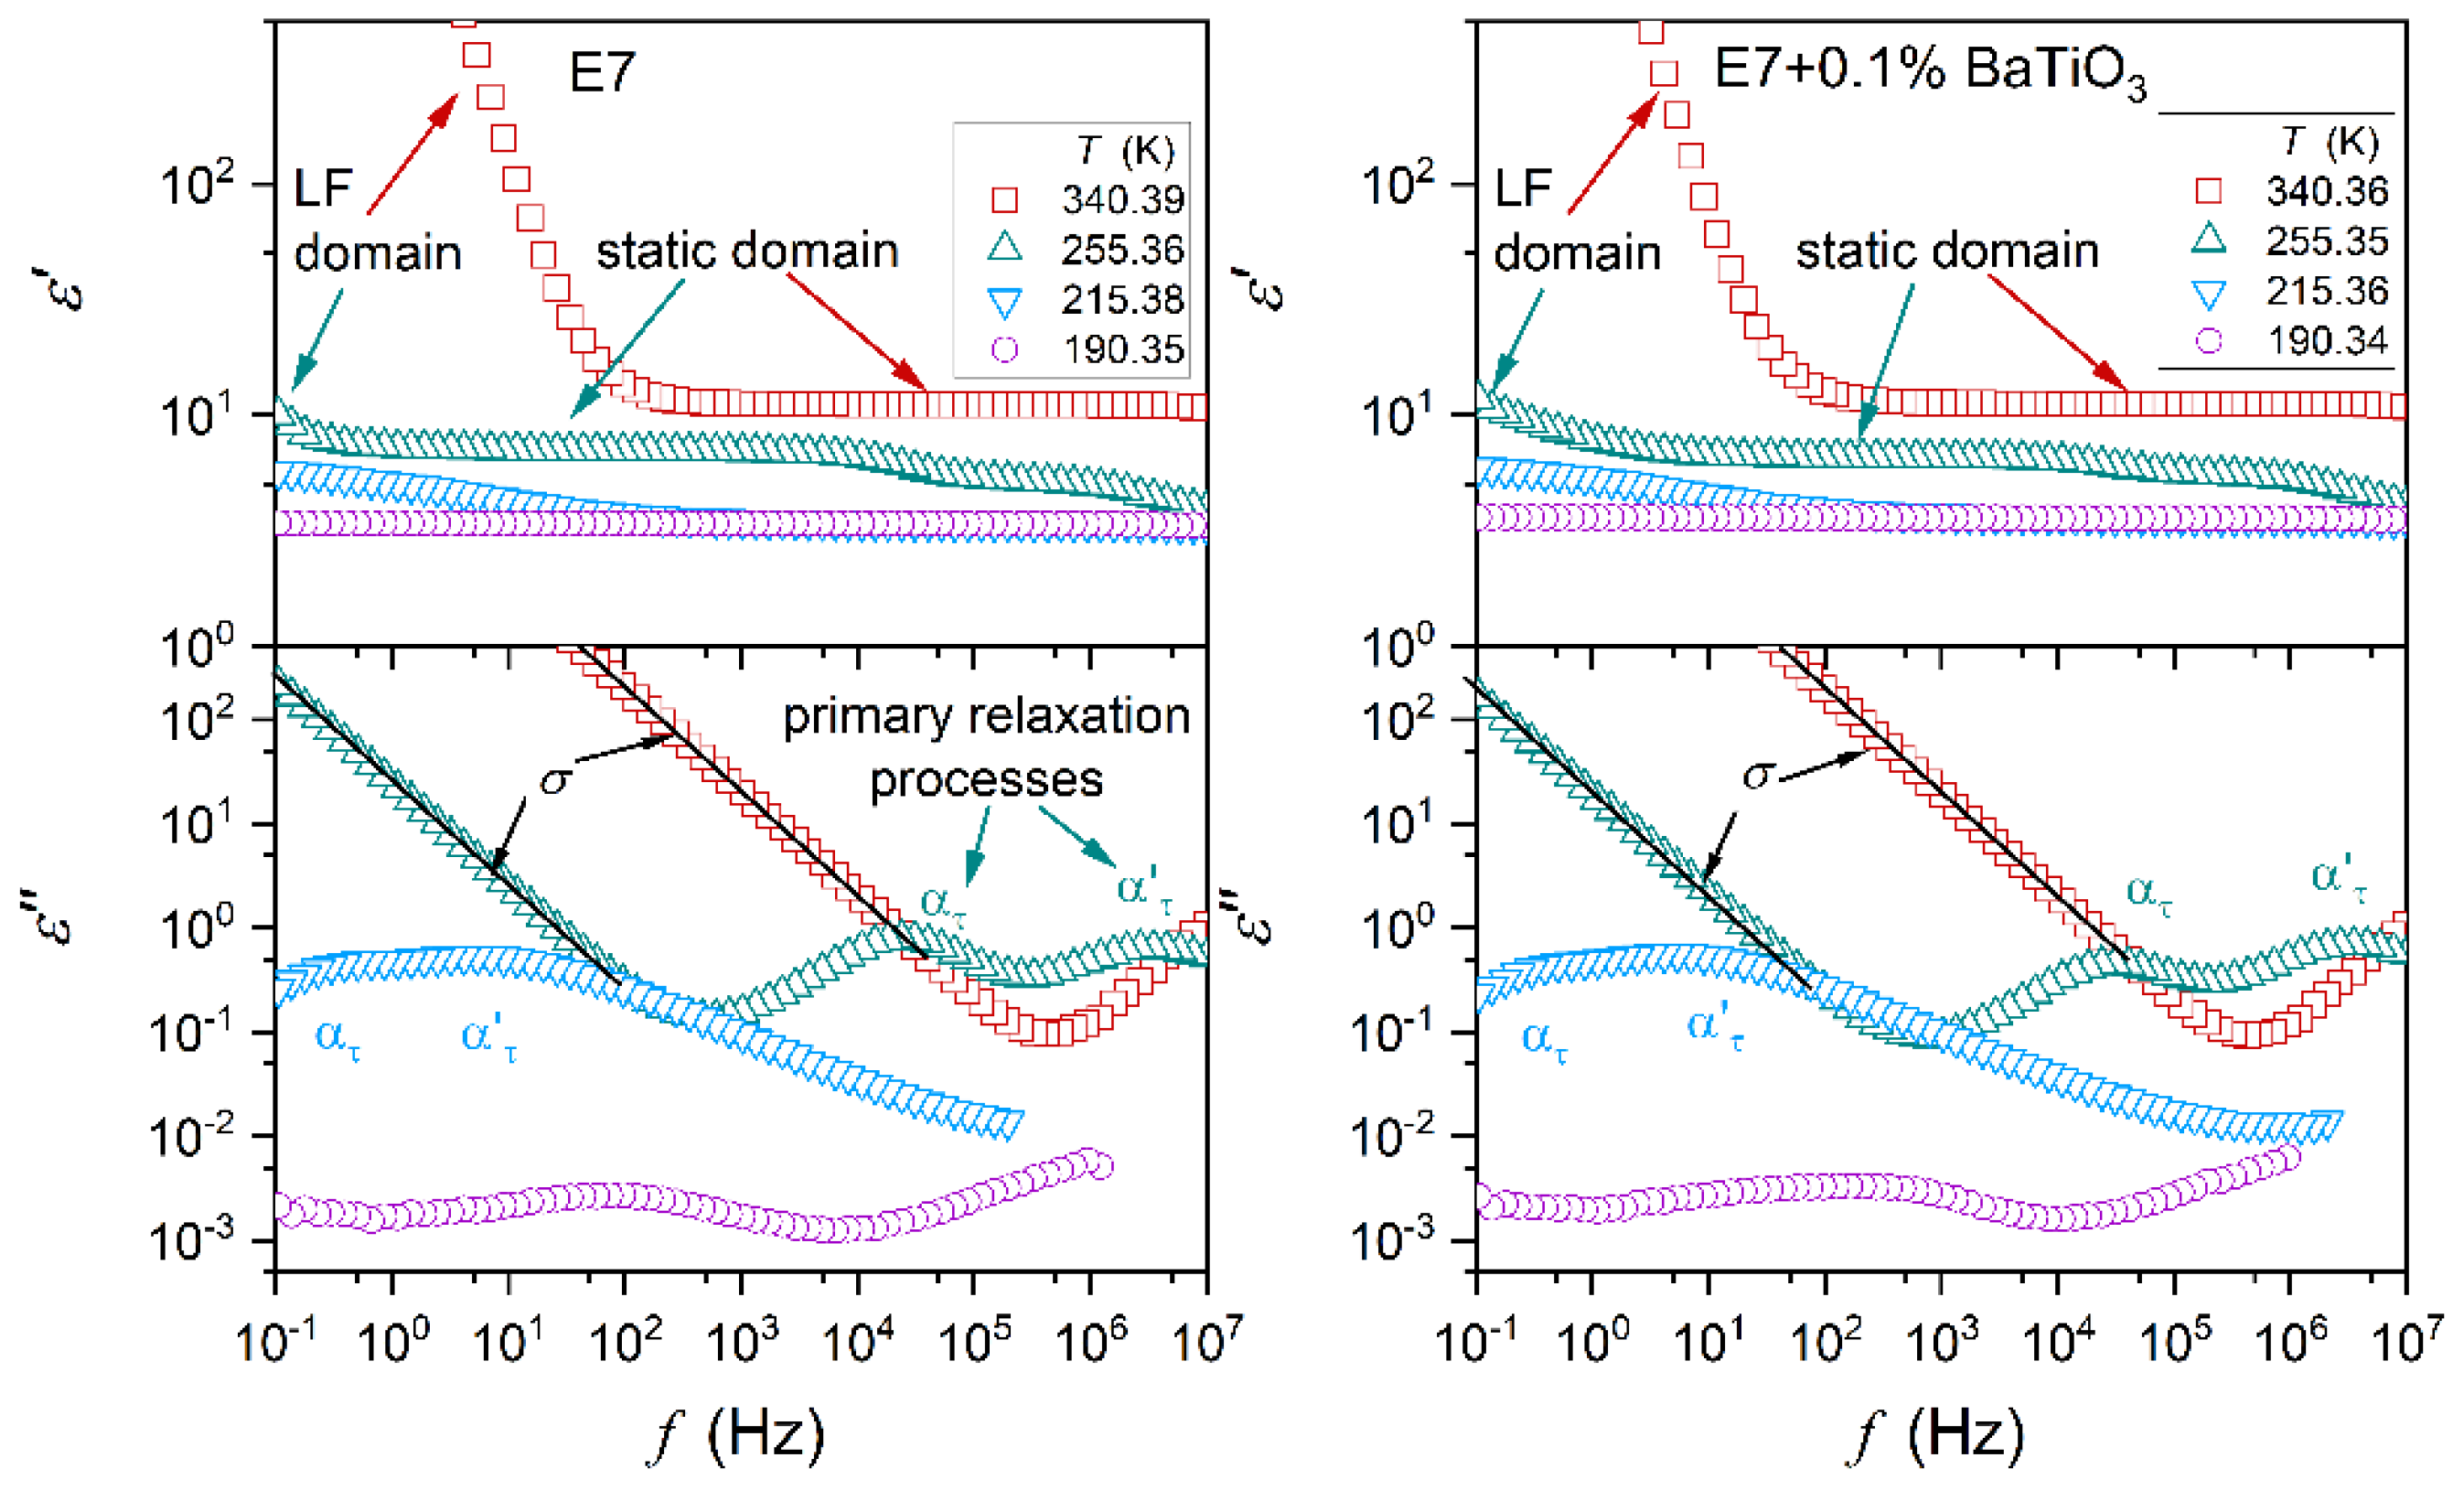
Figure 2.
Dielectric constant changes in the isotropic liquid and nematic phases of E7 and related nanocolloids with BaTiO3 nanoparticles. Concentrations are given in the plot. The solid arrow indicates the clearing temperature at , related to weakly discontinuous I-N phase transition. The dashed arrow indicates a discontinuous change in the dielectric constant for nanocolloid. Curves portraying (brown – up, green – down) data are related to Equations (11) and (12).
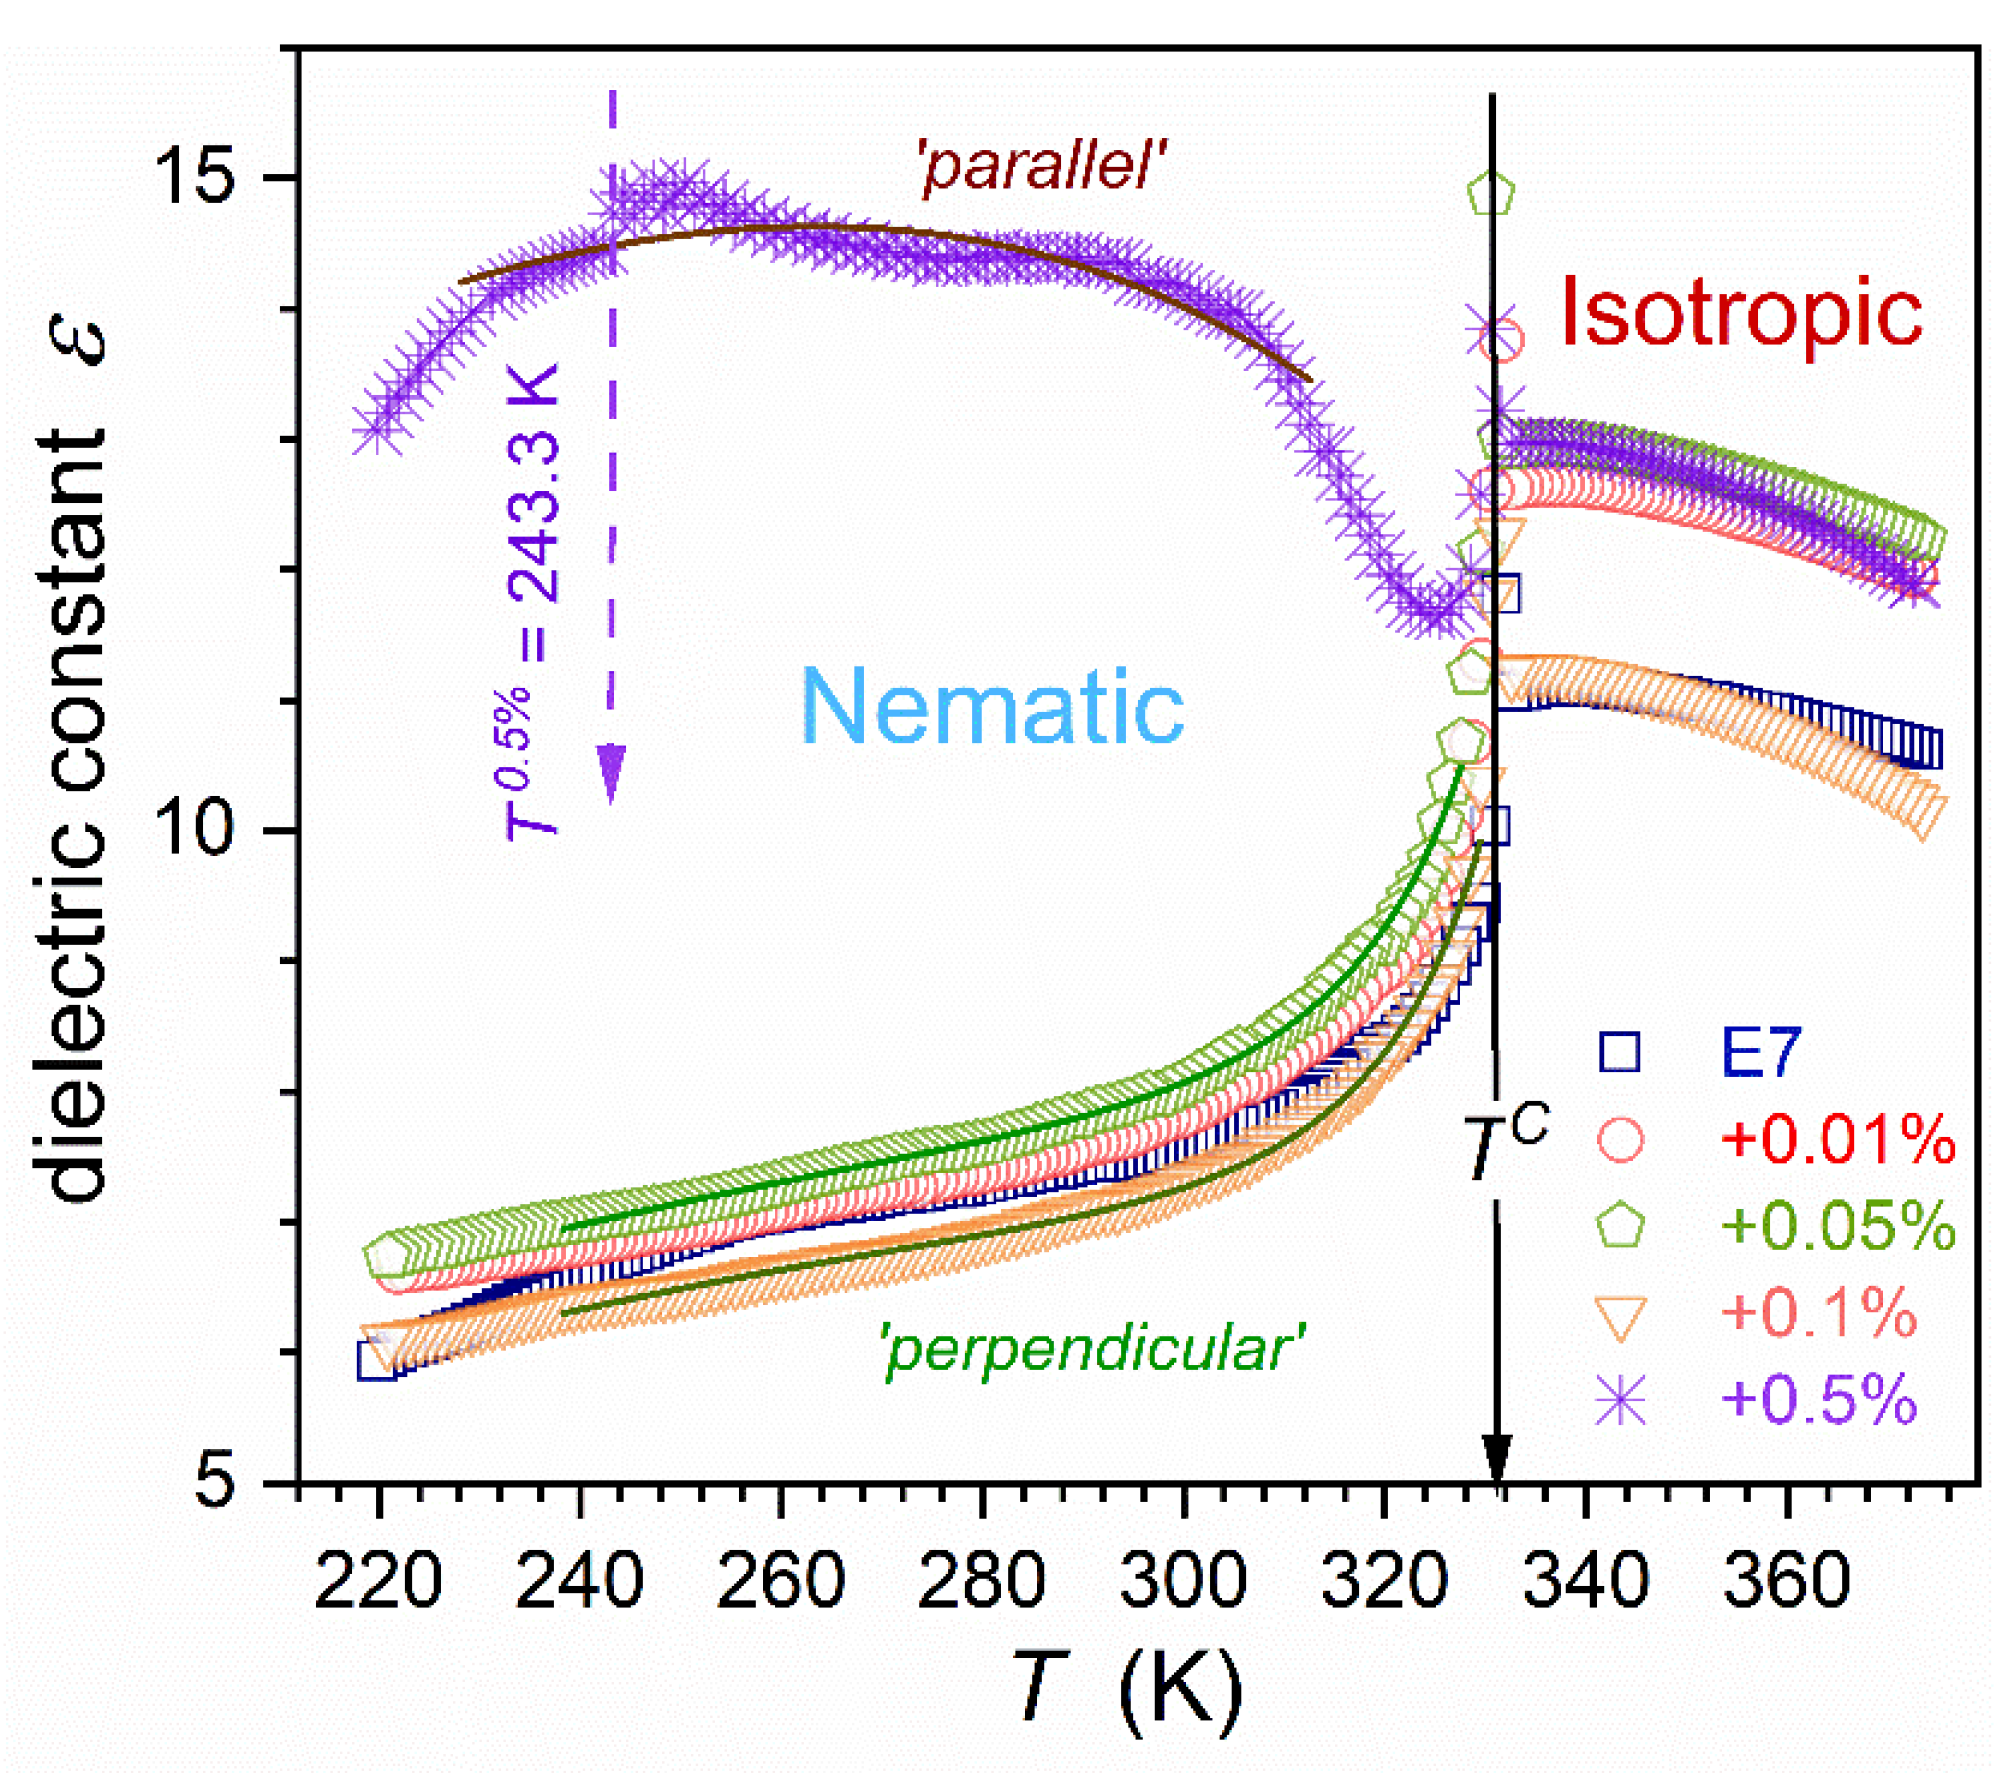
Figure 3.
The derivative of dielectric constant changes in the isotropic phase of E7 and its nanocolloids with BaTiO3 nanoparticles. Portrayals are related to Eq. (8), with parameters given in Table 1.
Figure 3.
The derivative of dielectric constant changes in the isotropic phase of E7 and its nanocolloids with BaTiO3 nanoparticles. Portrayals are related to Eq. (8), with parameters given in Table 1.
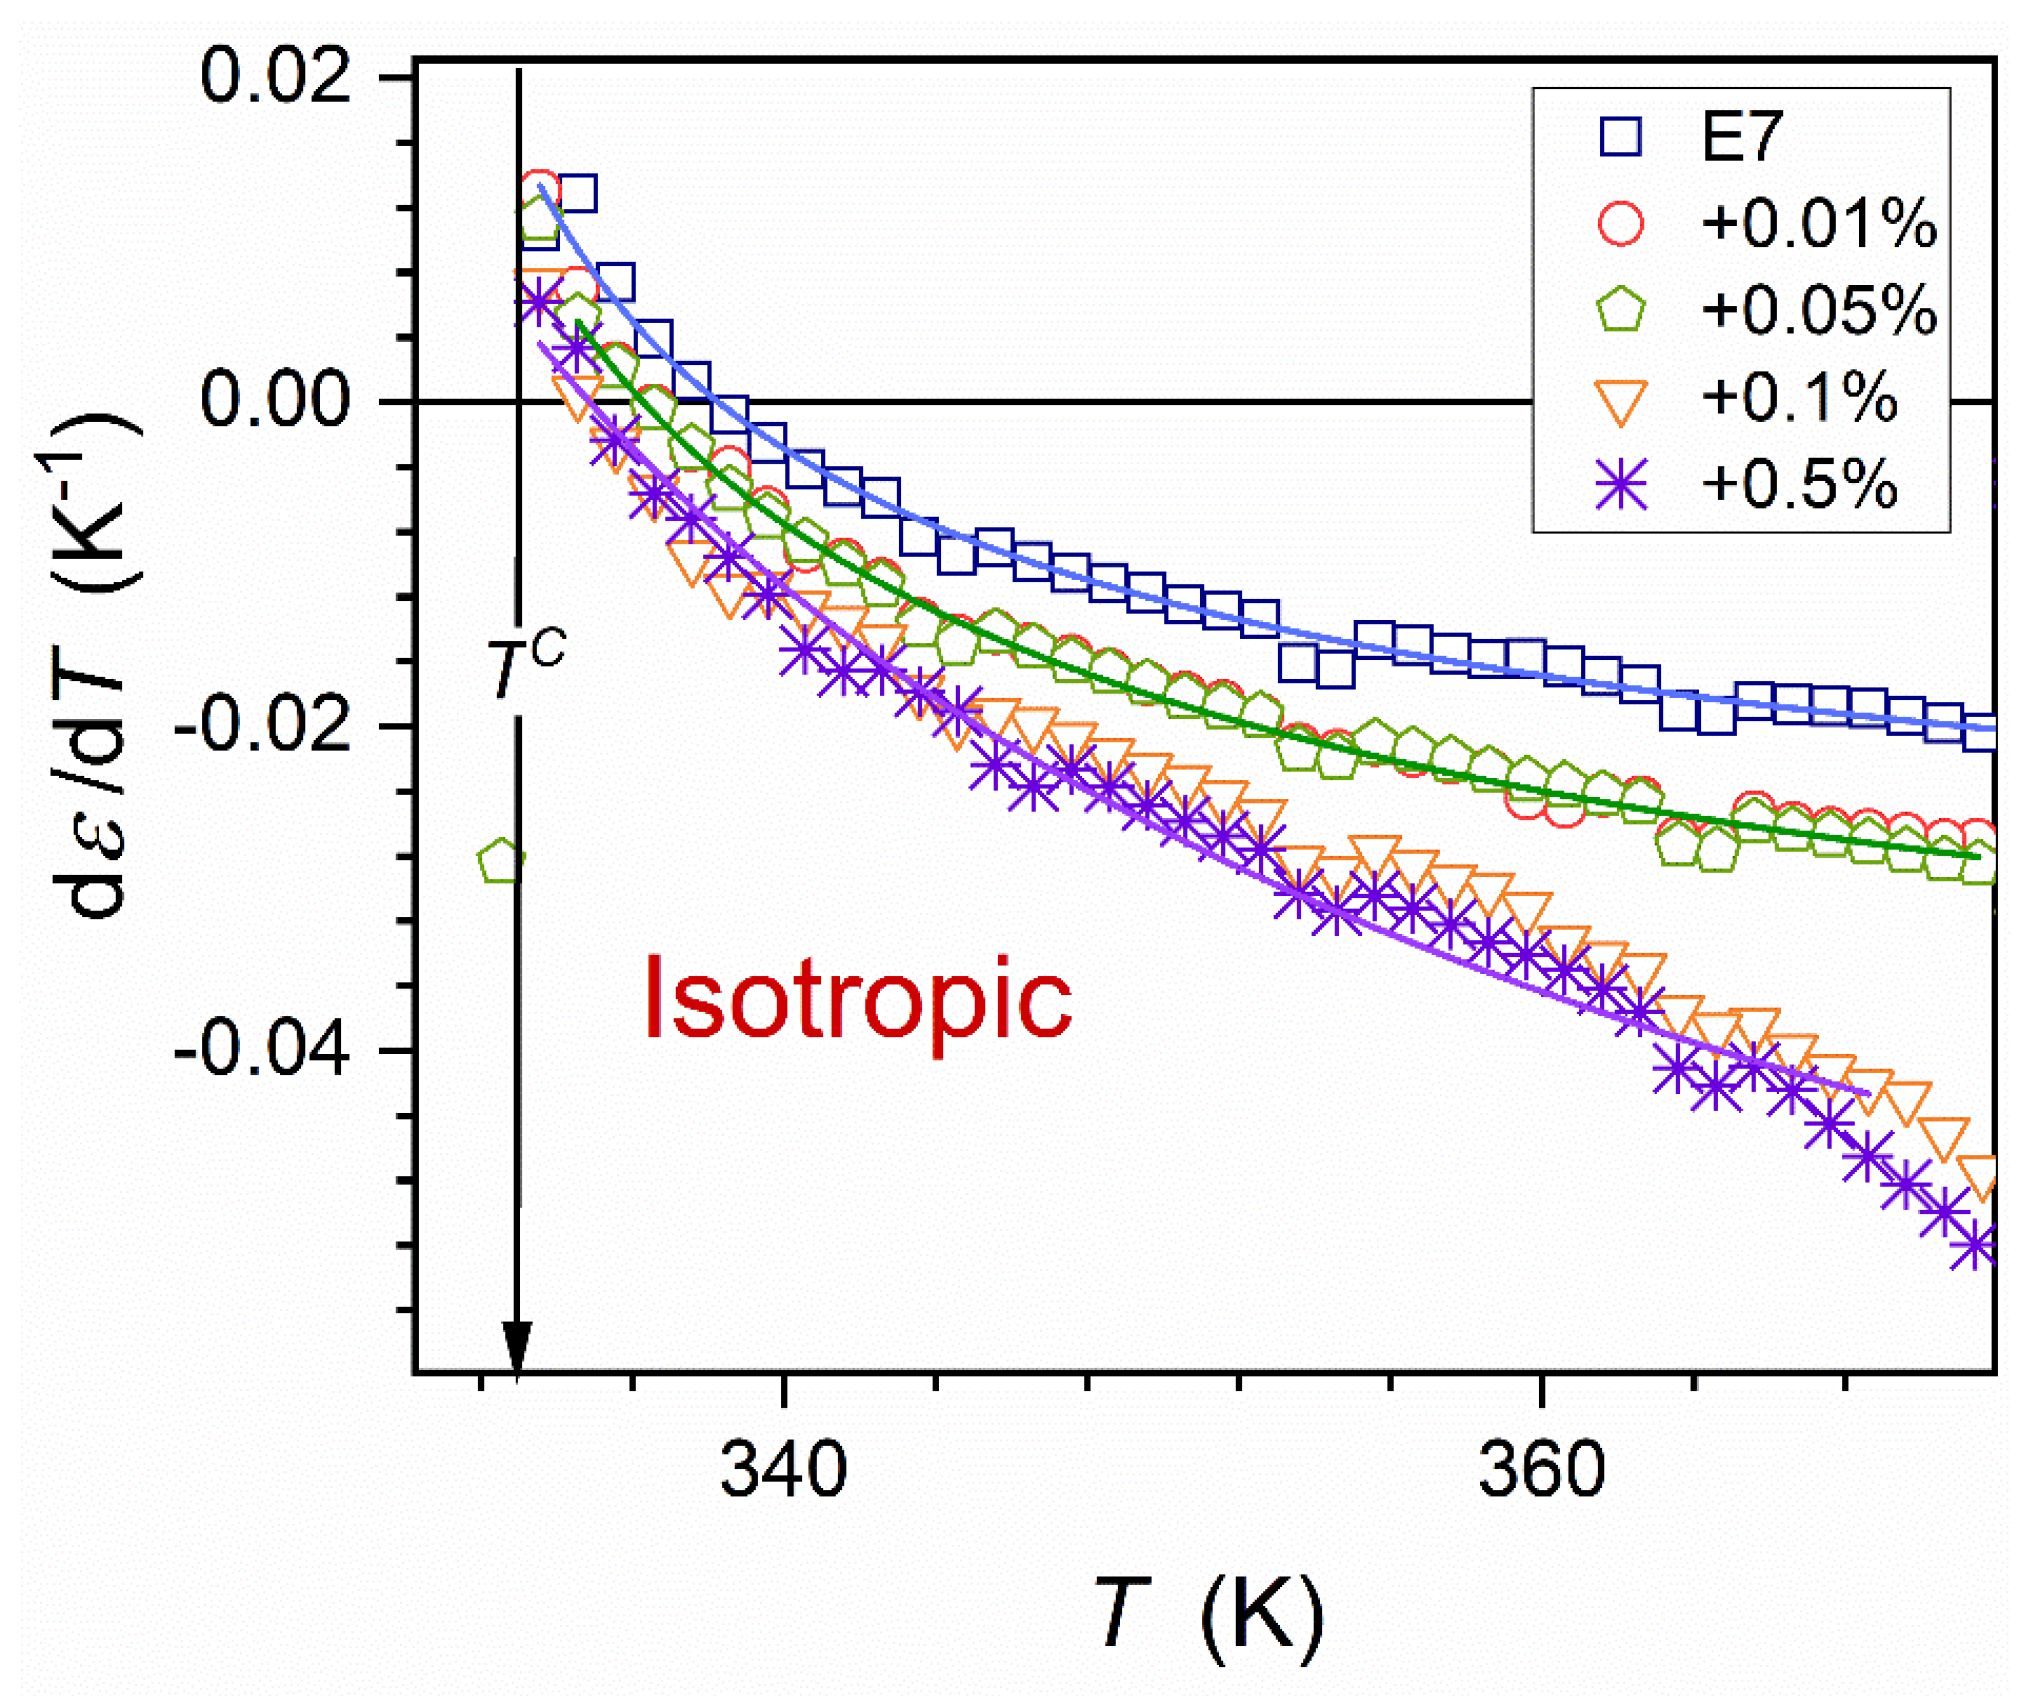
Figure 4.
The primary relaxation times changes for alpha () and alpha’ () processes in the nematic phase of E7 and related nanocolloids with BaTiO3 nanoparticles. is for the glass temperature and denotes the clearing temperature related to the I-N weakly discontinuous phase transition. The nonlinear behavior in the given scale indicates the super-Arrhenius pattern. Curves portraying data are related to Eq. (13).
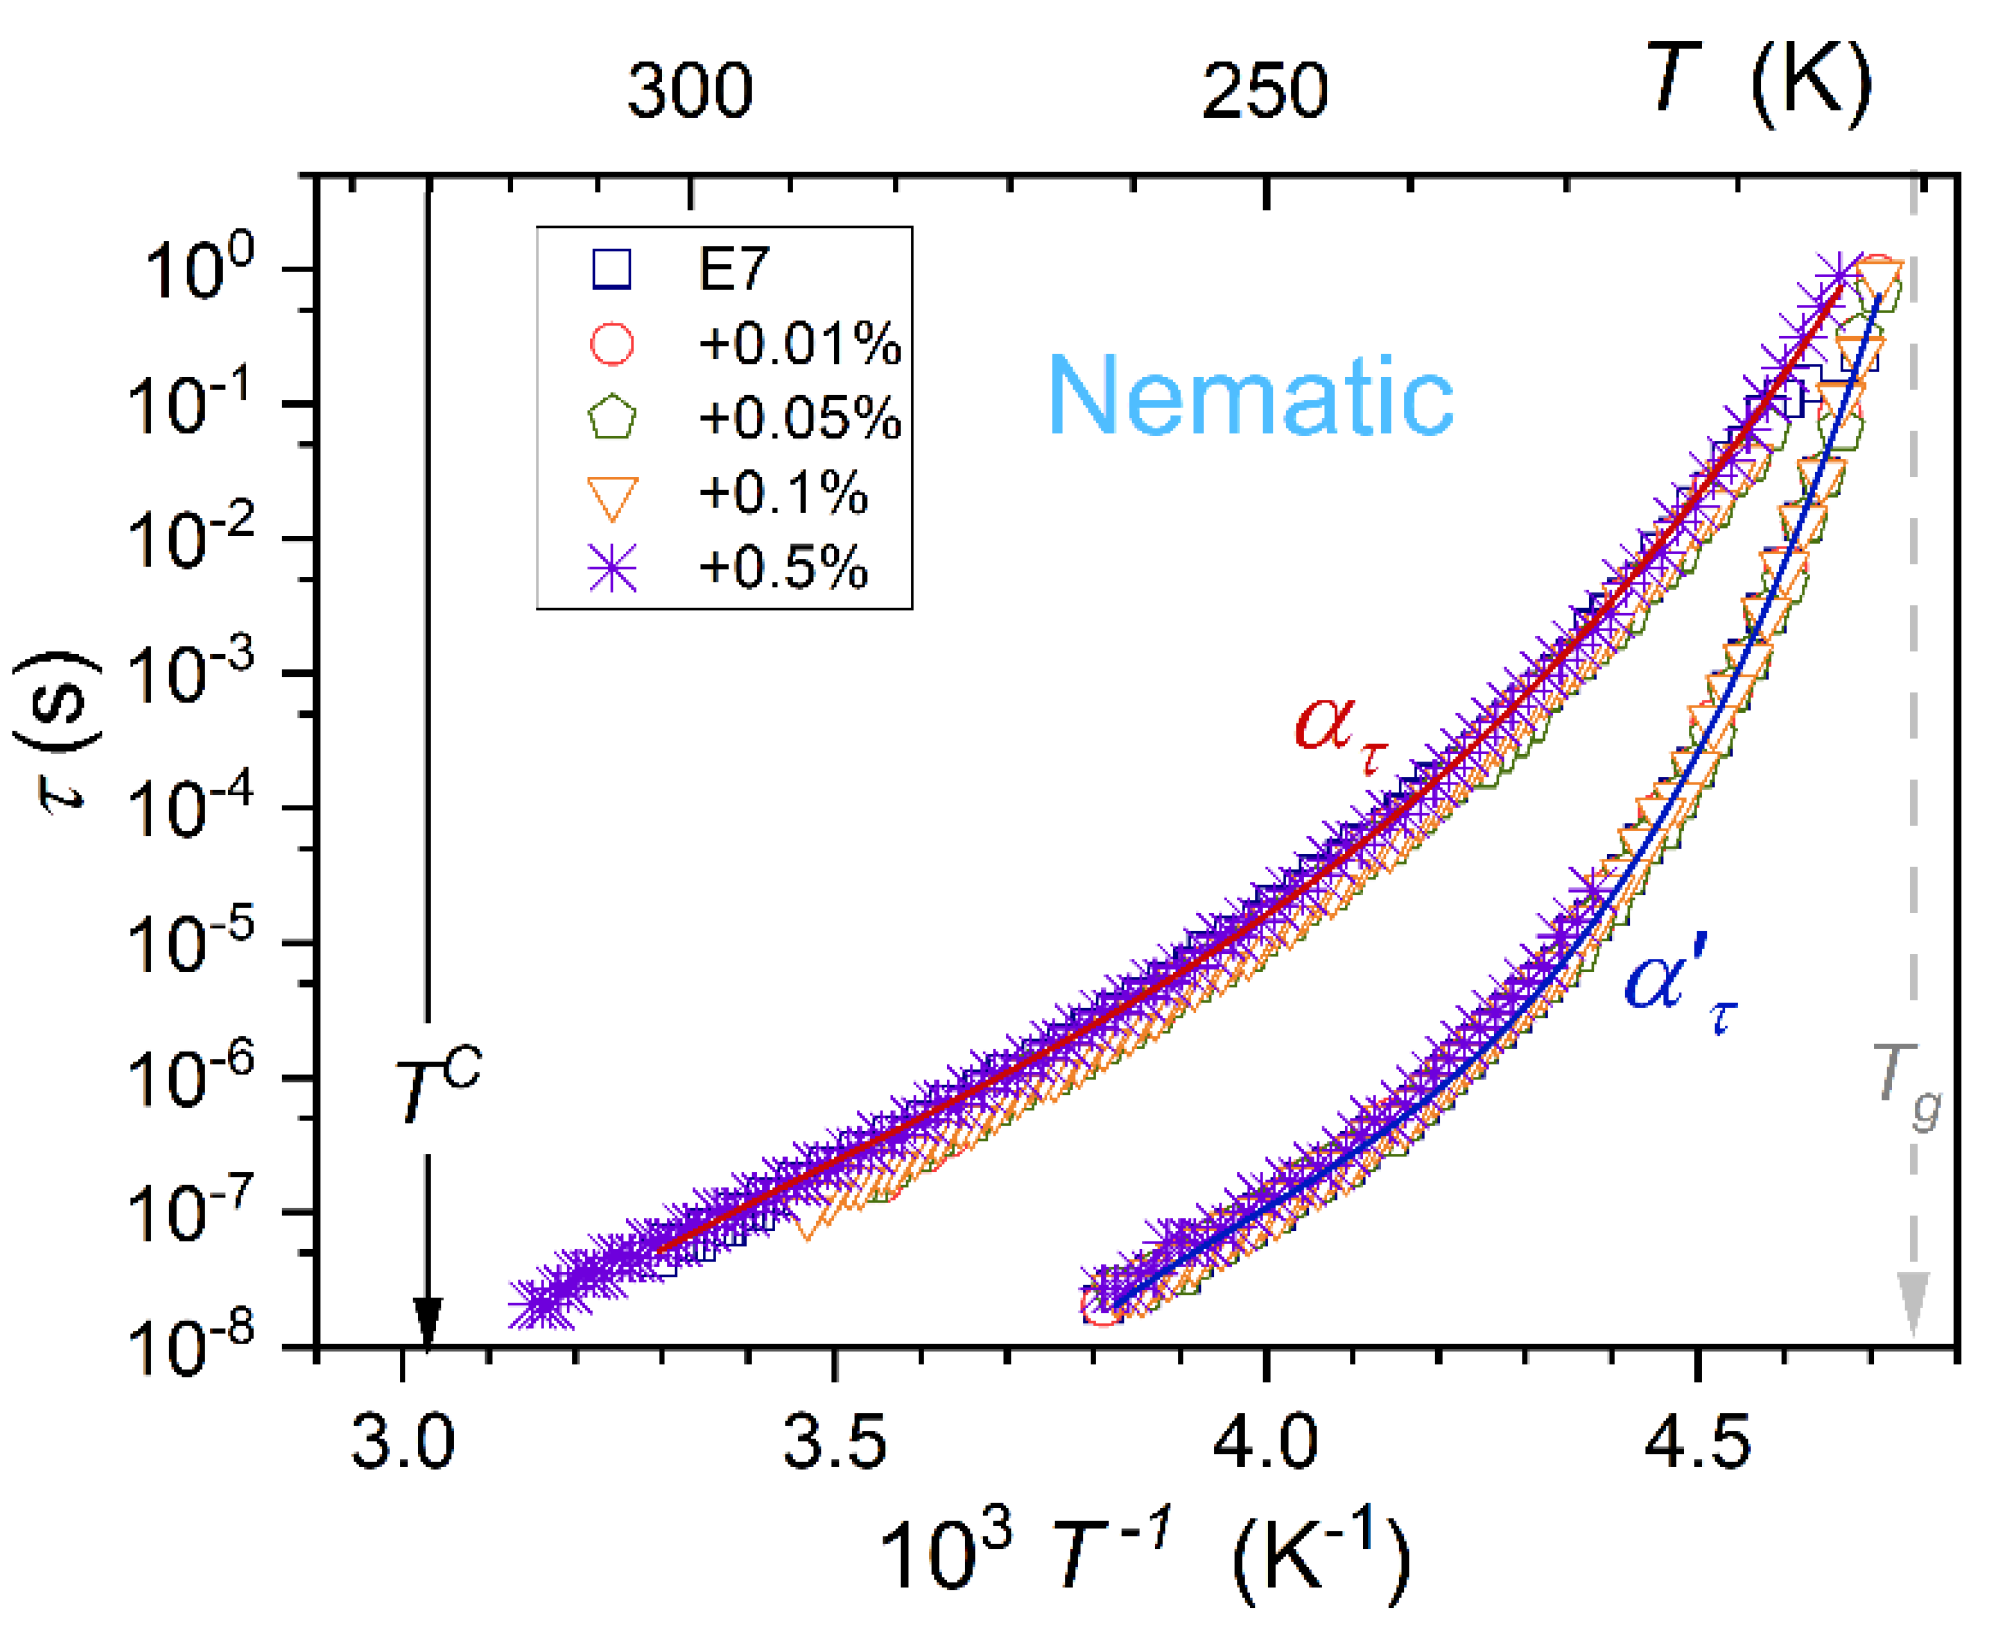
Figure 5.
Evolutions of process primary loss curves maximum in the nematic phase of E7 and nanocolloids with BaTiO3 nanoparticles. The discontinuous change emerging for (mass fraction) concentration is indicated.
Figure 5.
Evolutions of process primary loss curves maximum in the nematic phase of E7 and nanocolloids with BaTiO3 nanoparticles. The discontinuous change emerging for (mass fraction) concentration is indicated.
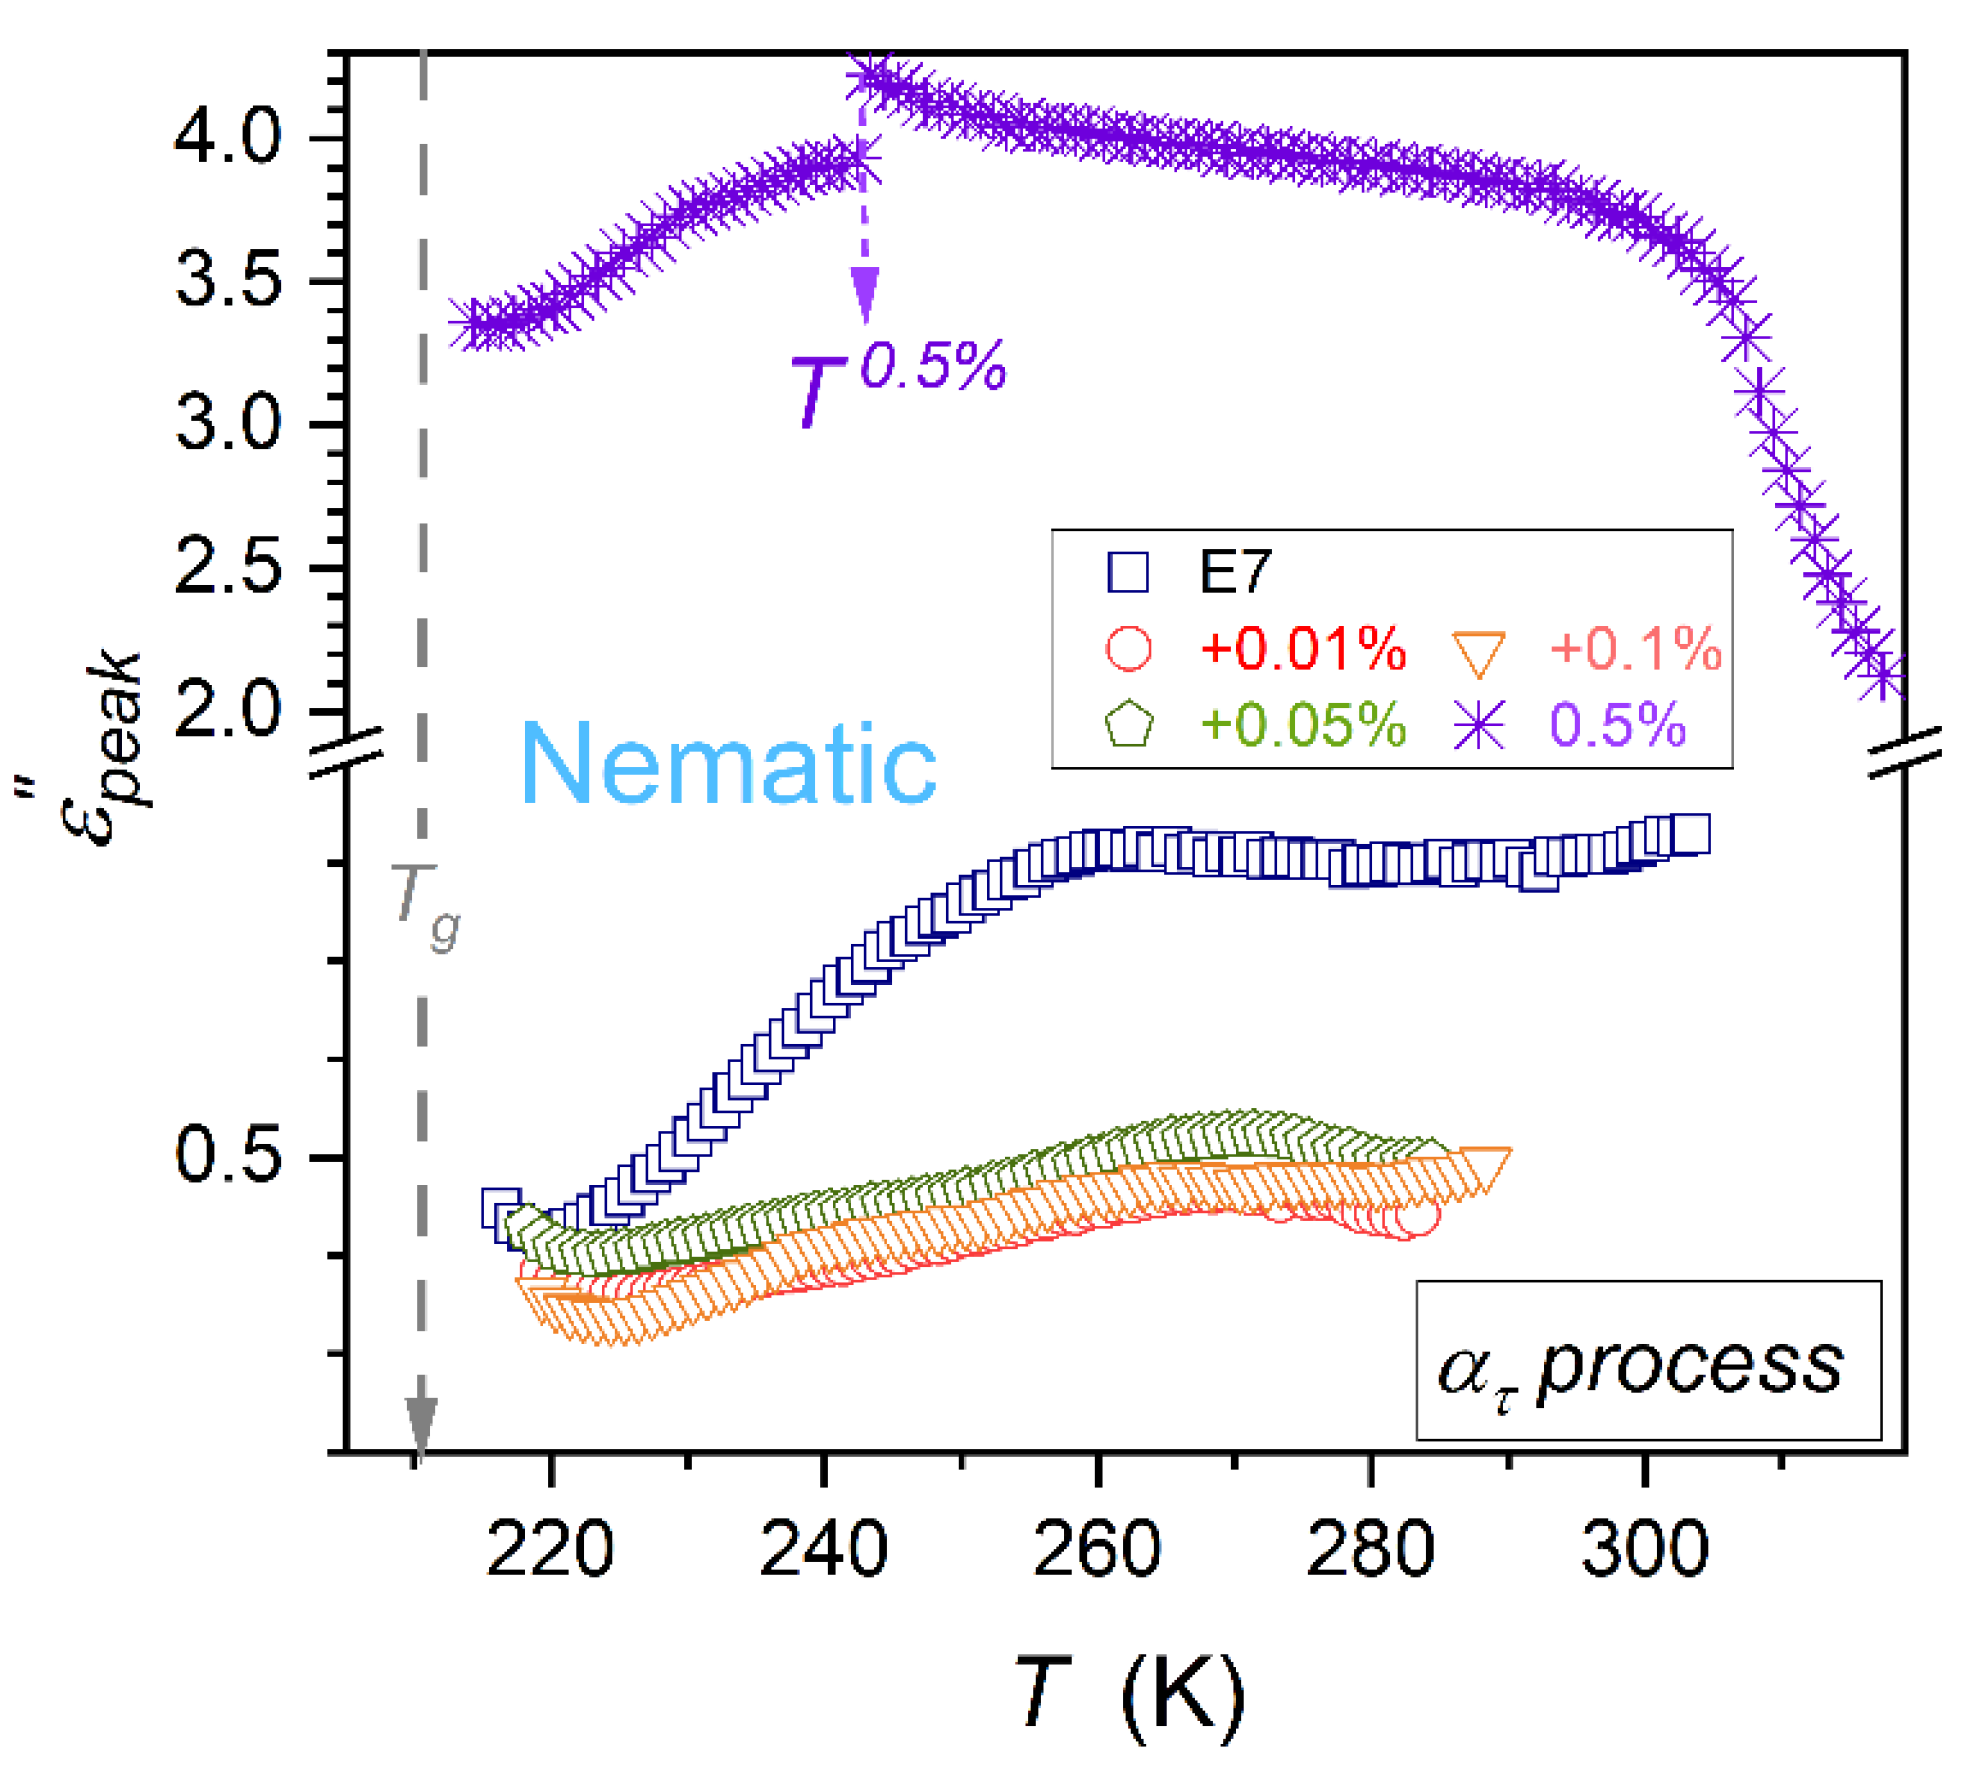
Figure 6.
Evolutions of process primary loss curve maxima in the nematic phase of E7 and related nanocolloids with BaTiO3 nanoparticles in the nematic phase down to the glass temperature. Curves portraying data near are related to Eq. (14), with parameters given in Table 2.
Figure 6.
Evolutions of process primary loss curve maxima in the nematic phase of E7 and related nanocolloids with BaTiO3 nanoparticles in the nematic phase down to the glass temperature. Curves portraying data near are related to Eq. (14), with parameters given in Table 2.
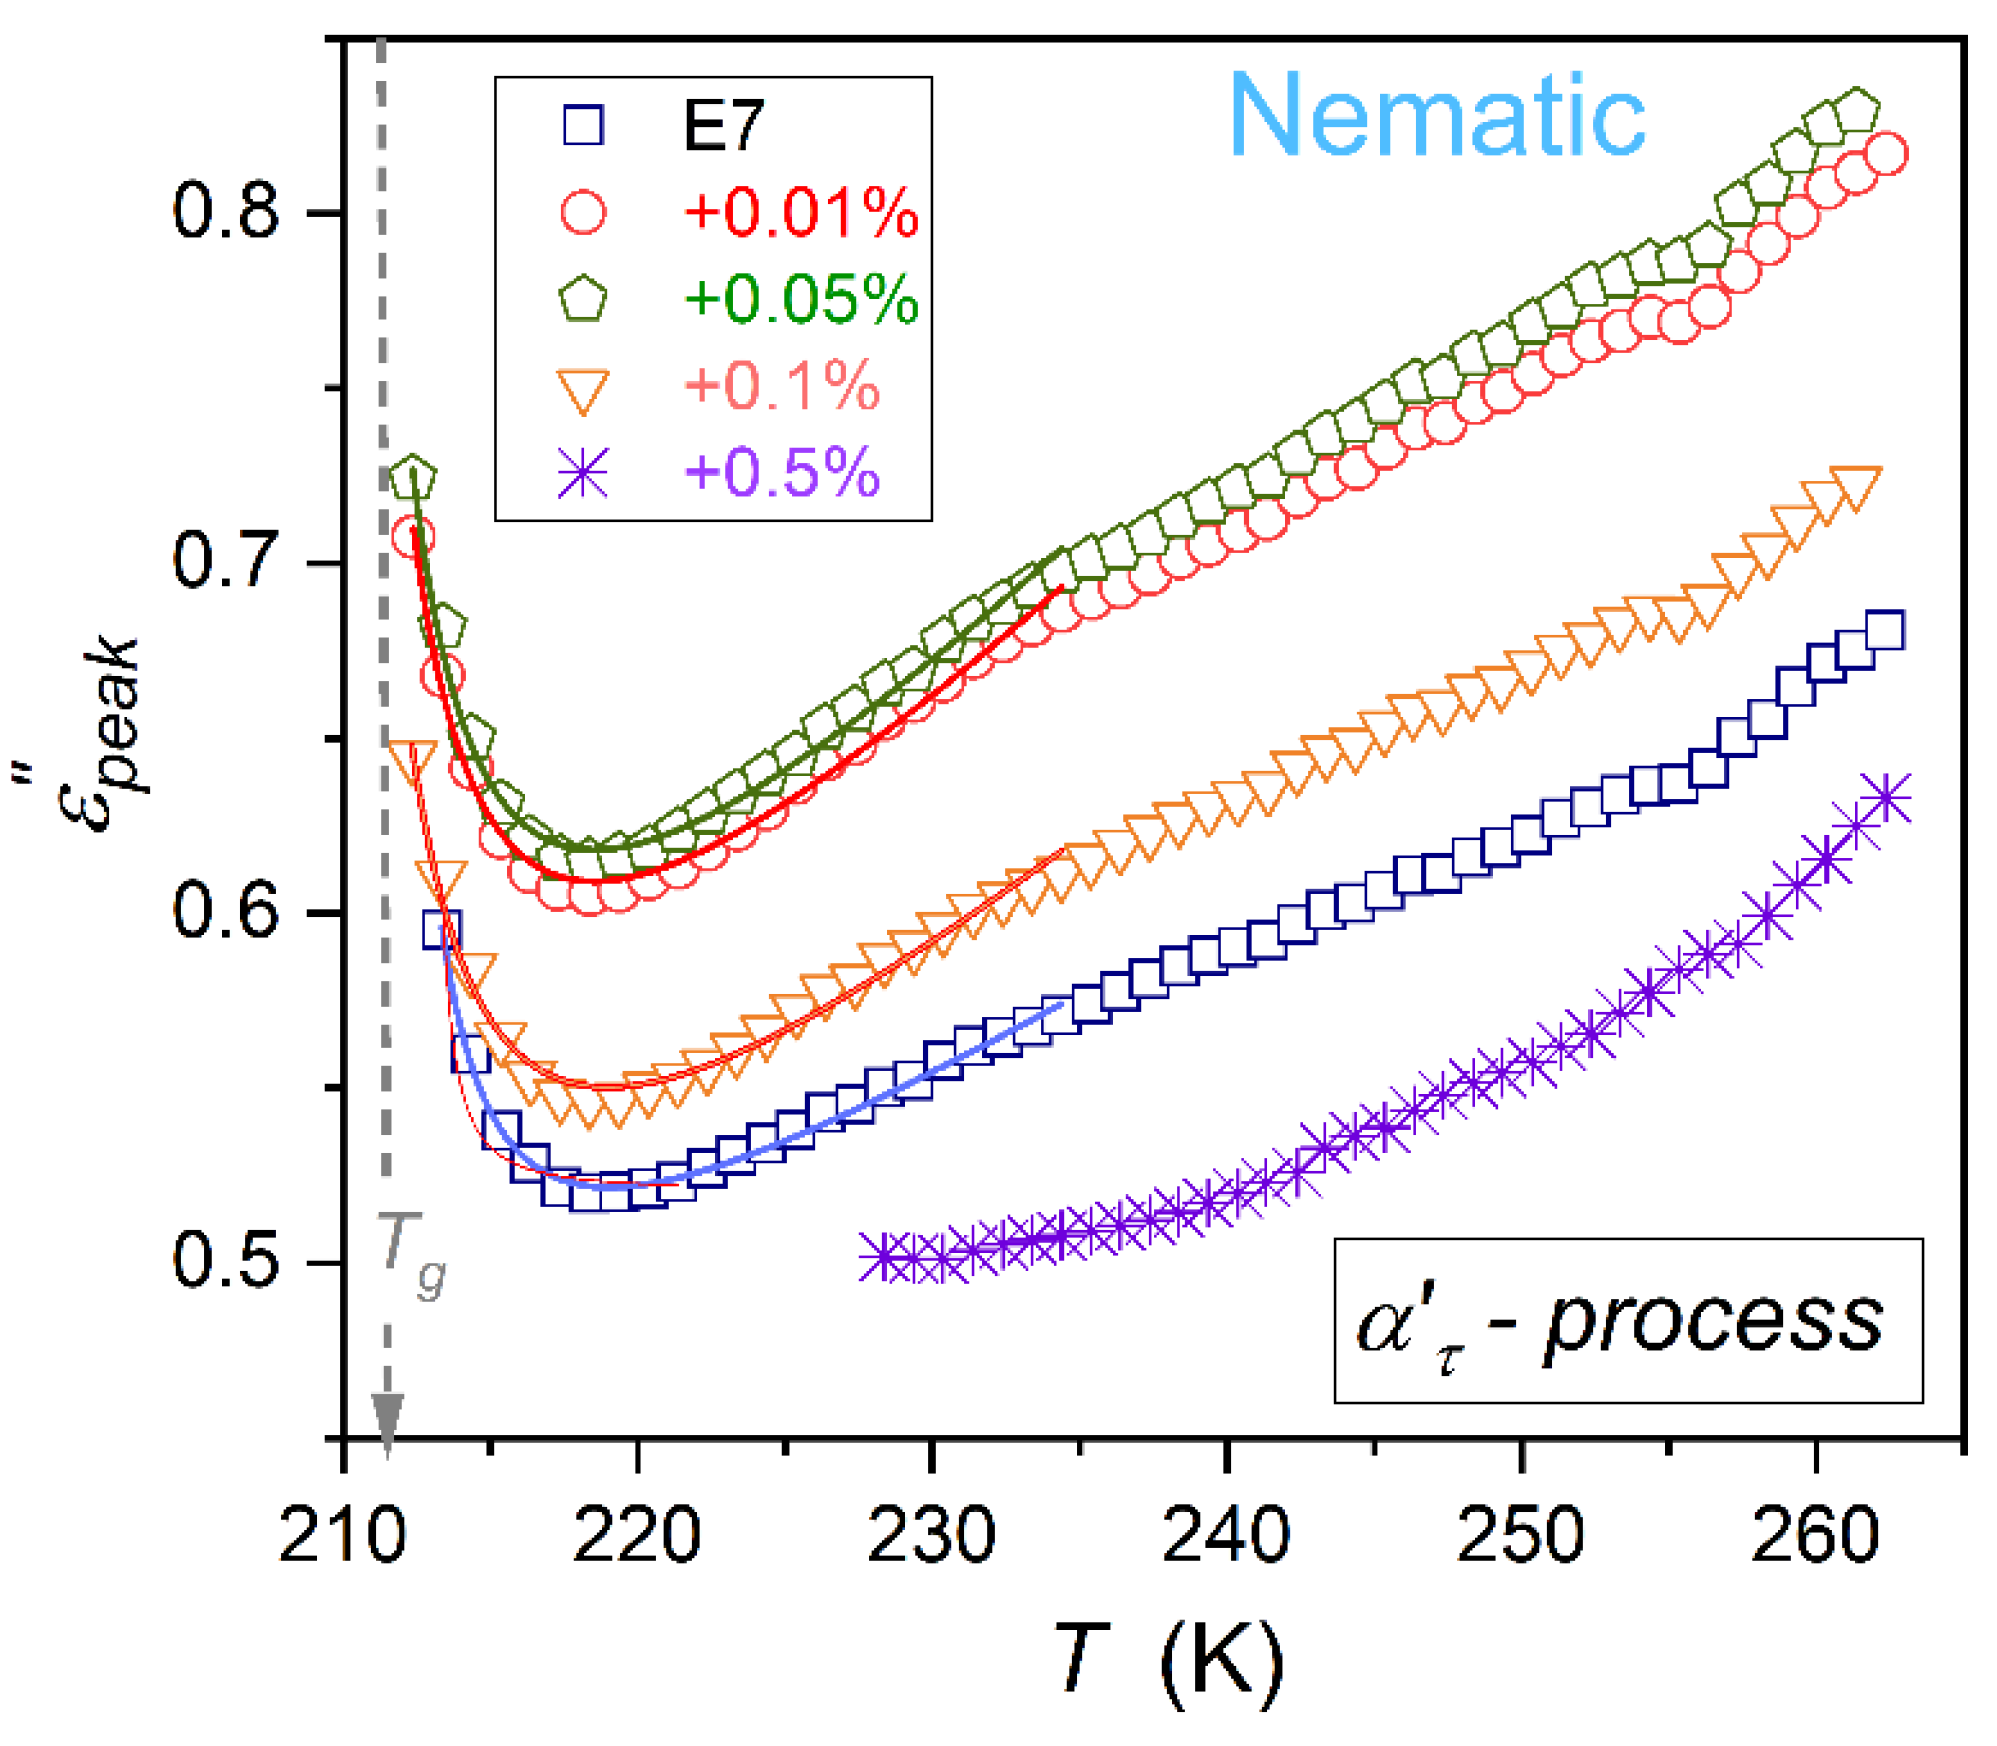
Figure 7.
Arrhenius scale presentation of DC electric conductivity in the isotropic liquid and nematic phases of E7 and nanocolloids with BaTiO3 nanoparticles. Curves are related to Eq. (15).
Figure 7.
Arrhenius scale presentation of DC electric conductivity in the isotropic liquid and nematic phases of E7 and nanocolloids with BaTiO3 nanoparticles. Curves are related to Eq. (15).
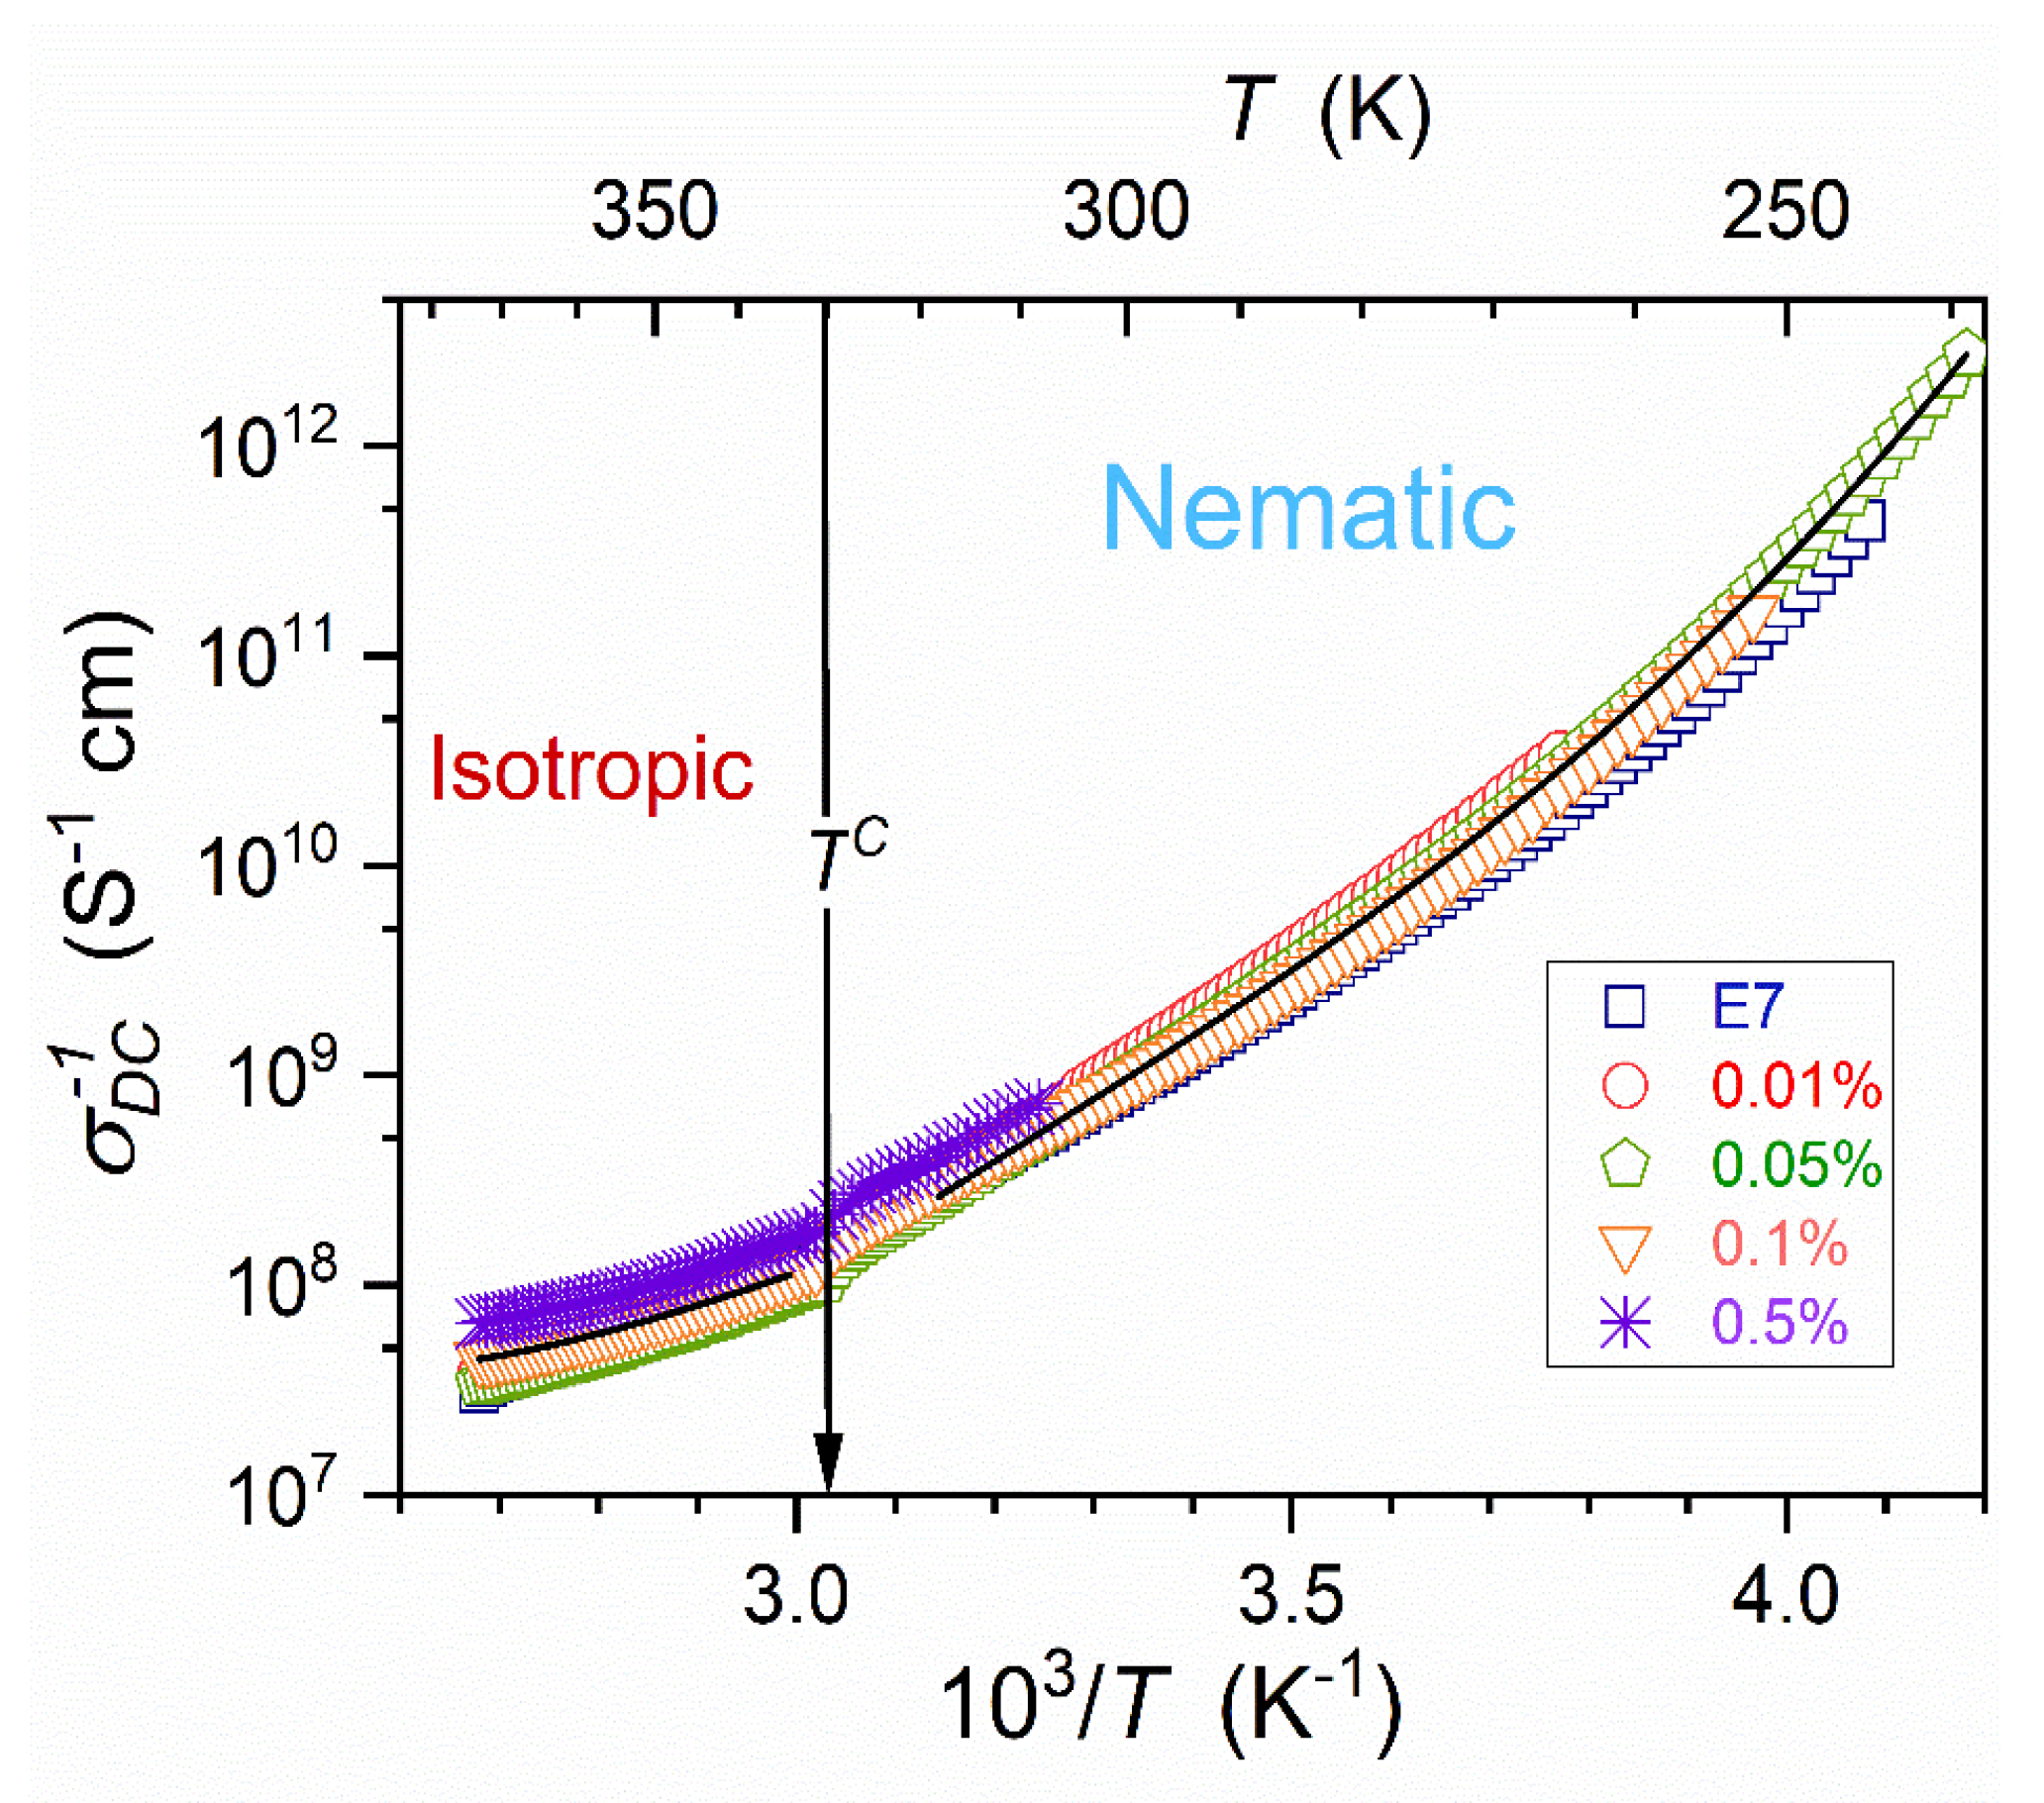
Figure 8.
Temperature changes of the reciprocal of apparent activation enthalpy (steepness index) determined using experimental data given in Figure 7. The lines show the emerging behavior related to Eq. (16).
Figure 8.
Temperature changes of the reciprocal of apparent activation enthalpy (steepness index) determined using experimental data given in Figure 7. The lines show the emerging behavior related to Eq. (16).
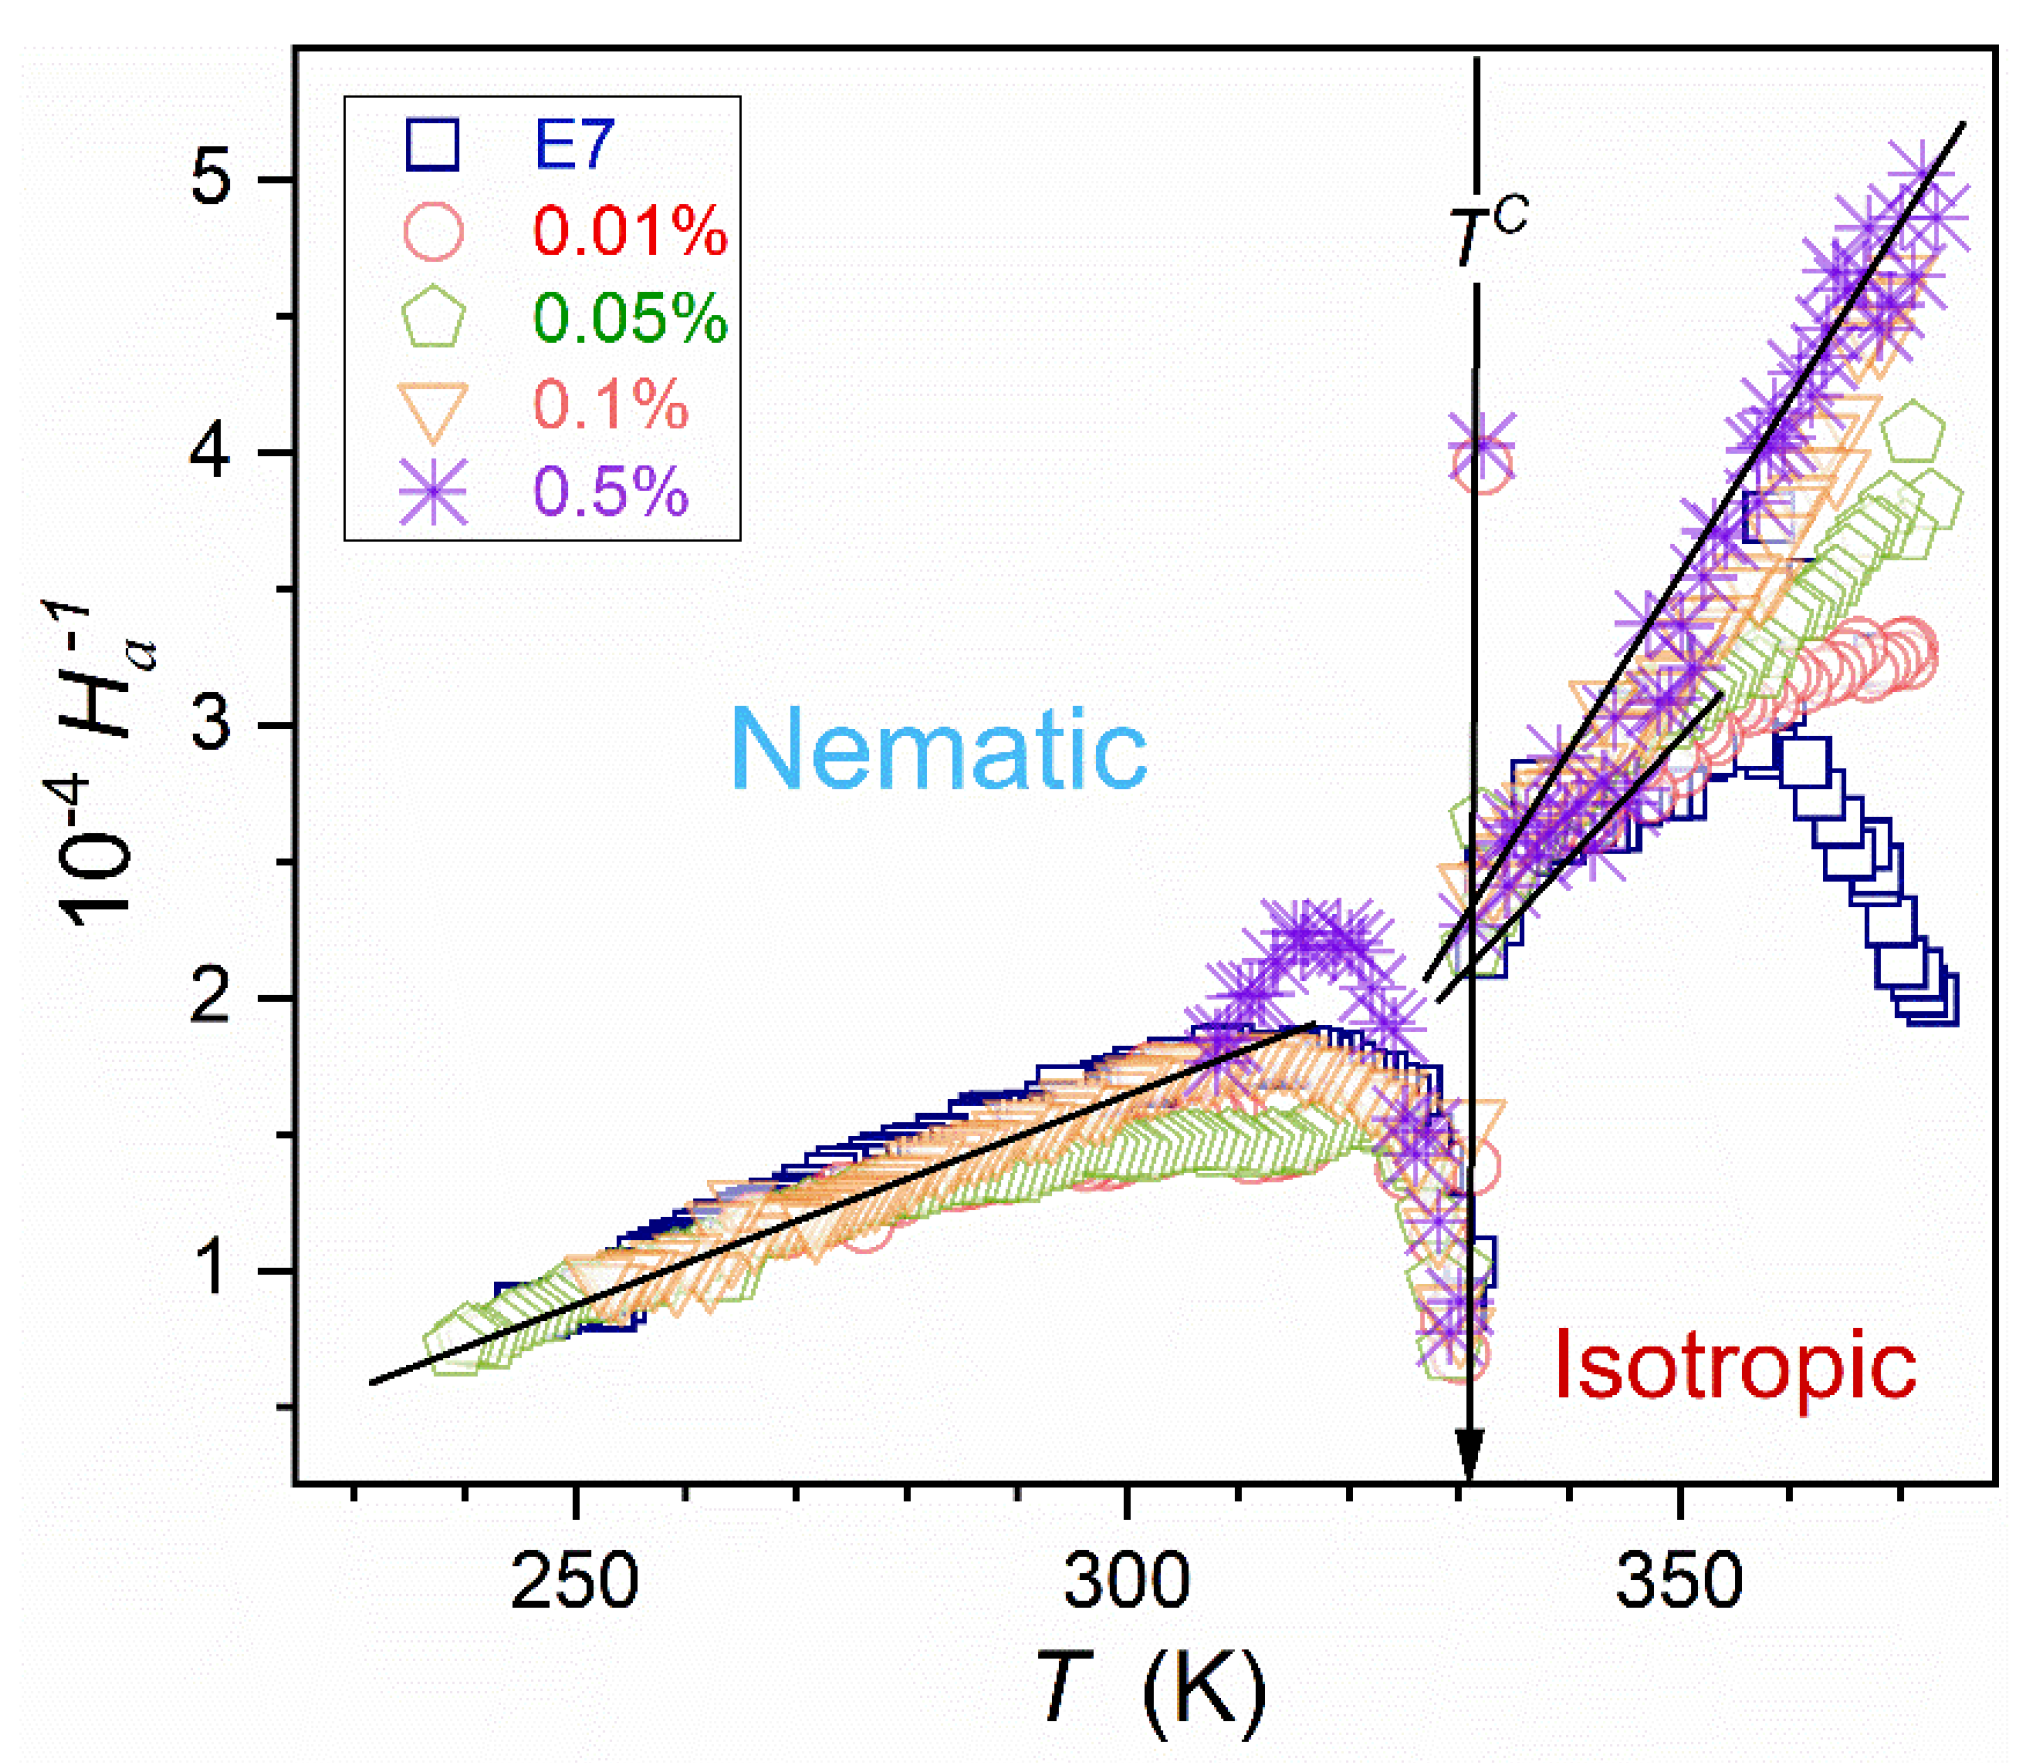

Table 1.
Values of parameters obtained for temperature changes of parameterized by Eq. (8). Results of fitting are shown graphically in Figure 3.
Table 1.
Values of parameters obtained for temperature changes of parameterized by Eq. (8). Results of fitting are shown graphically in Figure 3.
| NPs | ||||
|---|---|---|---|---|
| -0.039 | 0.13 | 329.5 | -1/2 | |
| -0.054 | 0.18 | 327 | -1/2 | |
| -0.10 | 0.46 | 319 | -1/2 | |
| -0.115 | 0.54 | 316 | -1/2 |
Table 2.
Values of parameters related to Eq. (14) and Figure 6, for the pretransitional anomaly near , estimated via the condition .
Table 2.
Values of parameters related to Eq. (14) and Figure 6, for the pretransitional anomaly near , estimated via the condition .
| E7 + NPs (x%) | (K) | ||||
|---|---|---|---|---|---|
| 8.54 | 0.462 | 0.720 | 209.4 | ||
| 8.38 | 0.454 | 0.717 | 209.3 | ||
| 8.20 | 0.440 | 0.714 | 209.5 | ||
| 7.50 | 0.407 | 0.710 | 209.3 |
Disclaimer/Publisher’s Note: The statements, opinions and data contained in all publications are solely those of the individual author(s) and contributor(s) and not of MDPI and/or the editor(s). MDPI and/or the editor(s) disclaim responsibility for any injury to people or property resulting from any ideas, methods, instructions or products referred to in the content. |
© 2025 by the authors. Licensee MDPI, Basel, Switzerland. This article is an open access article distributed under the terms and conditions of the Creative Commons Attribution (CC BY) license (http://creativecommons.org/licenses/by/4.0/).
Copyright: This open access article is published under a Creative Commons CC BY 4.0 license, which permit the free download, distribution, and reuse, provided that the author and preprint are cited in any reuse.


