
Submitted:
31 October 2025
Posted:
04 November 2025
You are already at the latest version
Abstract
Food irradiation is gaining popularity worldwide as a method for extending shelf life and controlling pests and diseases. Post-treatment irradiation doses are usually monitored using instrumental methods, which may be expensive, labor-intensive, time-consuming, and not allow for low-dose detection. We previously proposed a chemical fingerprinting strategy for estimating irradiation doses based on measuring the rate of an indicator reaction. However, the feasibility of dose assessment was demonstrated only for freshly irradiated samples. In this study, we investigated the feasibility of determining the order of magnitude of dose in irradiated raw potato tubers after several days of storage. The samples were extracted with water, and the extracts were introduced into oxidation-reduction and aggregation reactions carried out in a 96-well plate. The reaction rates were monitored by measuring absorbance and fluorescence of the reaction products, followed by chemo-metric processing. The feasibility to estimate doses to an order of magnitude (0, 100, 1000 Gy) was shown for storage time of 0, 2, and 6 days at 4°C. The accuracy of dose recognition on day 6 was at least 97% by using SoftMax regression (SR) or linear discriminant analysis (LDA). Irradiated and non-irradiated samples can be confidently distinguished using partial least square–discriminant analysis (PLS-DA). The reaction-based method of dose assessment is simple, rapid, and does not require sophisticated equipment.
Keywords:
food irradiation
; dose determination
; potatoes
; indicator reaction
; photometry
; fluorimetry
; chemometrics
1. Introduction
Radiation treatment has gained wide application in various fields, including agriculture and food industry that require strict dose control after irradiation [1]. Different irradiation doses are used depending on the purpose: low doses (~50 Gy) stimulate plant growth, medium doses (1–7 kGy) inhibit sprouting and suppress pathogens to extend the shelf life of foods, while high doses (7-10 kGy) can sterilize the sample [2]. The upper dose limit is determined by the organoleptic properties of the samples and is established by ISTM standards based on international experience in irradiating various types of foods [3]. Irradiation of agricultural products is carried out in more than 60 countries, and over 200,000 tons of products were irradiated yearly in Europe alone [4]. Despite the IAEA recommendations to use the Radura label for irradiated products, many industrial centers do not use this symbol, which creates the risk of overexposing imported foods that have not been declared as irradiated. This makes post-irradiation dose assessment a pressing issue.
While meat and fish products require deeper penetration of irradiation since the main purpose of irradiation is to reduce pathogens in the entire volume of the product, roots and crops call for low-energy electrons or photons to treat surface layers of products where most phytopathogens and sprouts can be found [5]. Potatoes are irradiated to inhibit phytopathogens, such as R. Solani, Alternaria and Fusarium, which cause major post-harvest losses, and inhibit sprouting to prolong potato shelf life. To ensure high irradiation efficiency in potato, which have complex geometry, it is important to enable maximum irradiation dose in the surface layers of potatoes and control dose distribution in potato tubers during irradiation [6].
There are multiple processes occurring in irradiated food products. For instance, in potato tubers weight loss, a much lower concentration of ascorbic acid and higher concentrations of sucrose, glucose and fructose are observed as a result of irradiation [7,8]. Irradiation leads to the destruction of glycosidic bonds and oxidative destruction of polysaccharides, formation of carboxyl and carbonyl groups, and a decrease in the viscosity of starch due to its depolymerization [9,10,11]. Increased starch hydrolysis, in turn, can lead to a short-term increase in the intensity of pulp respiration. Concentration of some amino acids can increase during the first day after irradiation, while concentration of other amino acids can decrease [12]. Changes in the chemical composition of the irradiated product may be the result of not only direct exposure to ionizing radiation, but also secondary reactions with reactive oxygen species. [13]. In particular, molecular oxygen, when irradiated, forms ozone, which is capable of attacking a carbon atom in a polysaccharide chain, breaking glycosidic bonds, and also abstracting a hydrogen atom from a carbon atom in a glucose chain to form a hydroxyl radical, which damages carbohydrates, proteins, lipids, and amino acids. The reactive oxygen species OH•, , formed during irradiation also interact with polysaccharides, forming alkyl radicals, which then transform into carbonyl and carboxyl compounds [14]. The formation of new compounds as a result of irradiation can be dose-dependent [15], and the determination of the absorbed dose is possible using chemical analysis methods.
A number of methods are used to identify the fact of irradiation and determine the absorbed dose, each with its own limitations. For example, the electron spin resonance (ESR) is not applicable to products that do not contain solid particles such as cellulose, calcium, or bone; the same pertains to thermoluminescence [16]. The photostimulated luminescence technique places high demands on the storage and illumination conditions of the samples [17]. The use of GC-MS is based on the determination of trace volatile compounds such as alcohols, aldehydes, ketones [18], tyrosine isomers, creatine, trimethylamine oxide, and β-sitosterol [19]; these methods are efficient but have low sample throughput and require expensive instruments. Tests based on measuring antioxidant capacity, such as 2,2-diphenyl-1-picrylhydrazyl (DPPH) and ferric reducing antioxidant power (FRAP) assays, are mostly applicable for doses above 1 kGy [20]. Methods based on the determination of specific markers may not be applicable to all foods, for example, tests for 2-alkylcyclobutanones (ACB) work for products with a fat content of more than 1%, and the test for dihydrothymidine requires isolation and purification of DNA [21]. Most of the mentioned methods rely on stationary instruments and cannot be implemented outside the laboratory. The disadvantages of the methods also include complicated sample pretreatment, long analysis time, and low accuracy in determining small doses [19] that are necessary, for example, to stimulate potato sprouting [22].
For dose estimation in potatoes, most popular were electrochemical and thermoluminescence techniques. To determine a dose of 100 Gy, impedance ratio measurements were used; non-irradiated tubers of the same variety were used as controls [23]. A dielectric method was proposed to assay 50-200 Gy doses in potatoes [24]. Thermoluminescence measurements using mineral particles adhered to tubers were applied for dose detection in potatoes [25,26].
A different group of methods for dose assessment includes fingerprinting techniques: electronic nose and electronic tongue, which are based on the detection of volatile and soluble compounds, respectively, without determining the concentrations of specific markers [27]. Beside dose control, fingerprinting methods are widely used to distinguish between samples with similar composition: detect counterfeits [28], identify manufacturers [29] or pollution sources [30], perform medical diagnostics [31]. We have developed a reaction-based fingerprinting strategy that allows discrimination between samples using indicator reaction profiles [32,33,34,35]. In an effort to develop a universal and easy-to-implement dose assay technique, we applied this strategy to irradiated samples based on redox- and aggregation-type indicator reactions [36,37,38]. The components of the sample formed during irradiation interact with intermediate active particles generated in the course of the reactions, which entails different shape of kinetic curves and allows us to distinguish between the dose values with an accuracy of an order of magnitude. The resulting optical signals (light absorption and fluorescence intensity) are processed using chemometric methods. A distinctive feature of this approach is the use of time-dependent processes, which, unlike “static” methods, provide more information about the samples and allow for more effective detection of subtle differences in their composition. Kinetic-based optical fingerprinting methods are fast, inexpensive, and versatile, they do not require full-spectrum or other complex equipment other than photo cameras and light sources and do not require highly skilled operators.
The majority of shelf-life studies of irradiated potatoes focus on the effect of irradiation on the stability of tubers [39]. The number of publications on the study of the chemical composition of irradiated tubers during storage is limited [40]. Although doses can be determined in potato tubers irradiated 3 days before analysis [23] or even after 20-25 days of storage [24], most studies on determining the irradiation dose in tubers are performed on the day of irradiation and do not examine the dependence of the result on storage time. Our previous studies of dose estimation methods in foods were also performed on freshly irradiated samples [36,37,38]. The purpose of this study was to evaluate the efficiency of the reaction-based fingerprinting strategy for detecting doses in raw potatoes during several days after irradiation. The experimental design and the principle of the kinetic fingerprinting method used are shown in Scheme 1.
2. Materials and Methods
2.1. Object of Study
Potato tubers of the Lina and Agata varieties, 4–5 cm in maximum size, were provided by the Siberian Federal Scientific Center for Agrobiotechnology of the Russian Academy of Sciences (SFNCA RAS). The Lina variety is a medium–early drought-resistant variety with a vegetation period of 75-90 days. The tubers with a starch content of 11.2-18.5% have a yellow and smooth skin and white flesh. The Agata variety is a medium–ripened variety with a vegetation period of 80-85 days. Tubers with a starch content of 12-14% have a yellow and dense skin and white flesh. Both varieties are high-yielding with high shelf life.
2.2. X-Ray Irradiation
The experiment was conducted on two Lina tubers and two Agata tubers. Nine parallelepipeds measuring 15 × 5 × 5 mm3 and weighing 0.5 g, eighteen pieces of each variety, were cut from the center of each potato tuber. Twelve pieces of each variety were placed in a 2-mL × 9-mm polypropylene tube for X-ray irradiation at the doses of 100 and 1000 Gy. Six pieces from three potato tubers of each variety were left as controls.
Irradiation was performed at the Physics Department of Moscow State University using a DRON UM-2 unit with a PUR5/50 power supply and BSV-23 X-ray tube with copper anode (Physics Department at Moscow State University, Russia). The tubes were placed directly in front of a beryllium window of X-ray tube operating at 26 mA and 30 kV. The tubes were irradiated from two opposite sides, either side exposed to an equal dose amounting to a half of the doses applied.
2.3. Dosimetry Control
The dose rate absorbed by the potato samples during X-ray irradiation was estimated using Fricke solution prepared using Mohr’s salt (NH4)2Fe(SO4)276H2O (99% purity), sodium chloride (99.5% purity), and H2SO4 (95-99% purity) and stored in the dark under ambient temperature of 20 °C for 24 h. After the preparation, 0.5 mL of Fricke solution was placed in 2-mL polypropylene tubes and exposed to X-ray irradiation. Since the density of Fricke’s solution is close to the density of potato samples, it can be assumed that the dose rates absorbed by the dosimetry solution coincide with the dose rates absorbed by the potato samples. The dose absorbed by the solution was directly proportional to its absorbance measured on a spectrophotometer UV-3000 (TM Ecoview, Russia) at 304 nm, that increased linearly with the time of exposure as a result of the oxidation of ferrous ions (Fe2+) to ferric ions (Fe3+) caused by irradiation [41]. The calculation of the dose absorbed by Fricke solution was made using the formula:
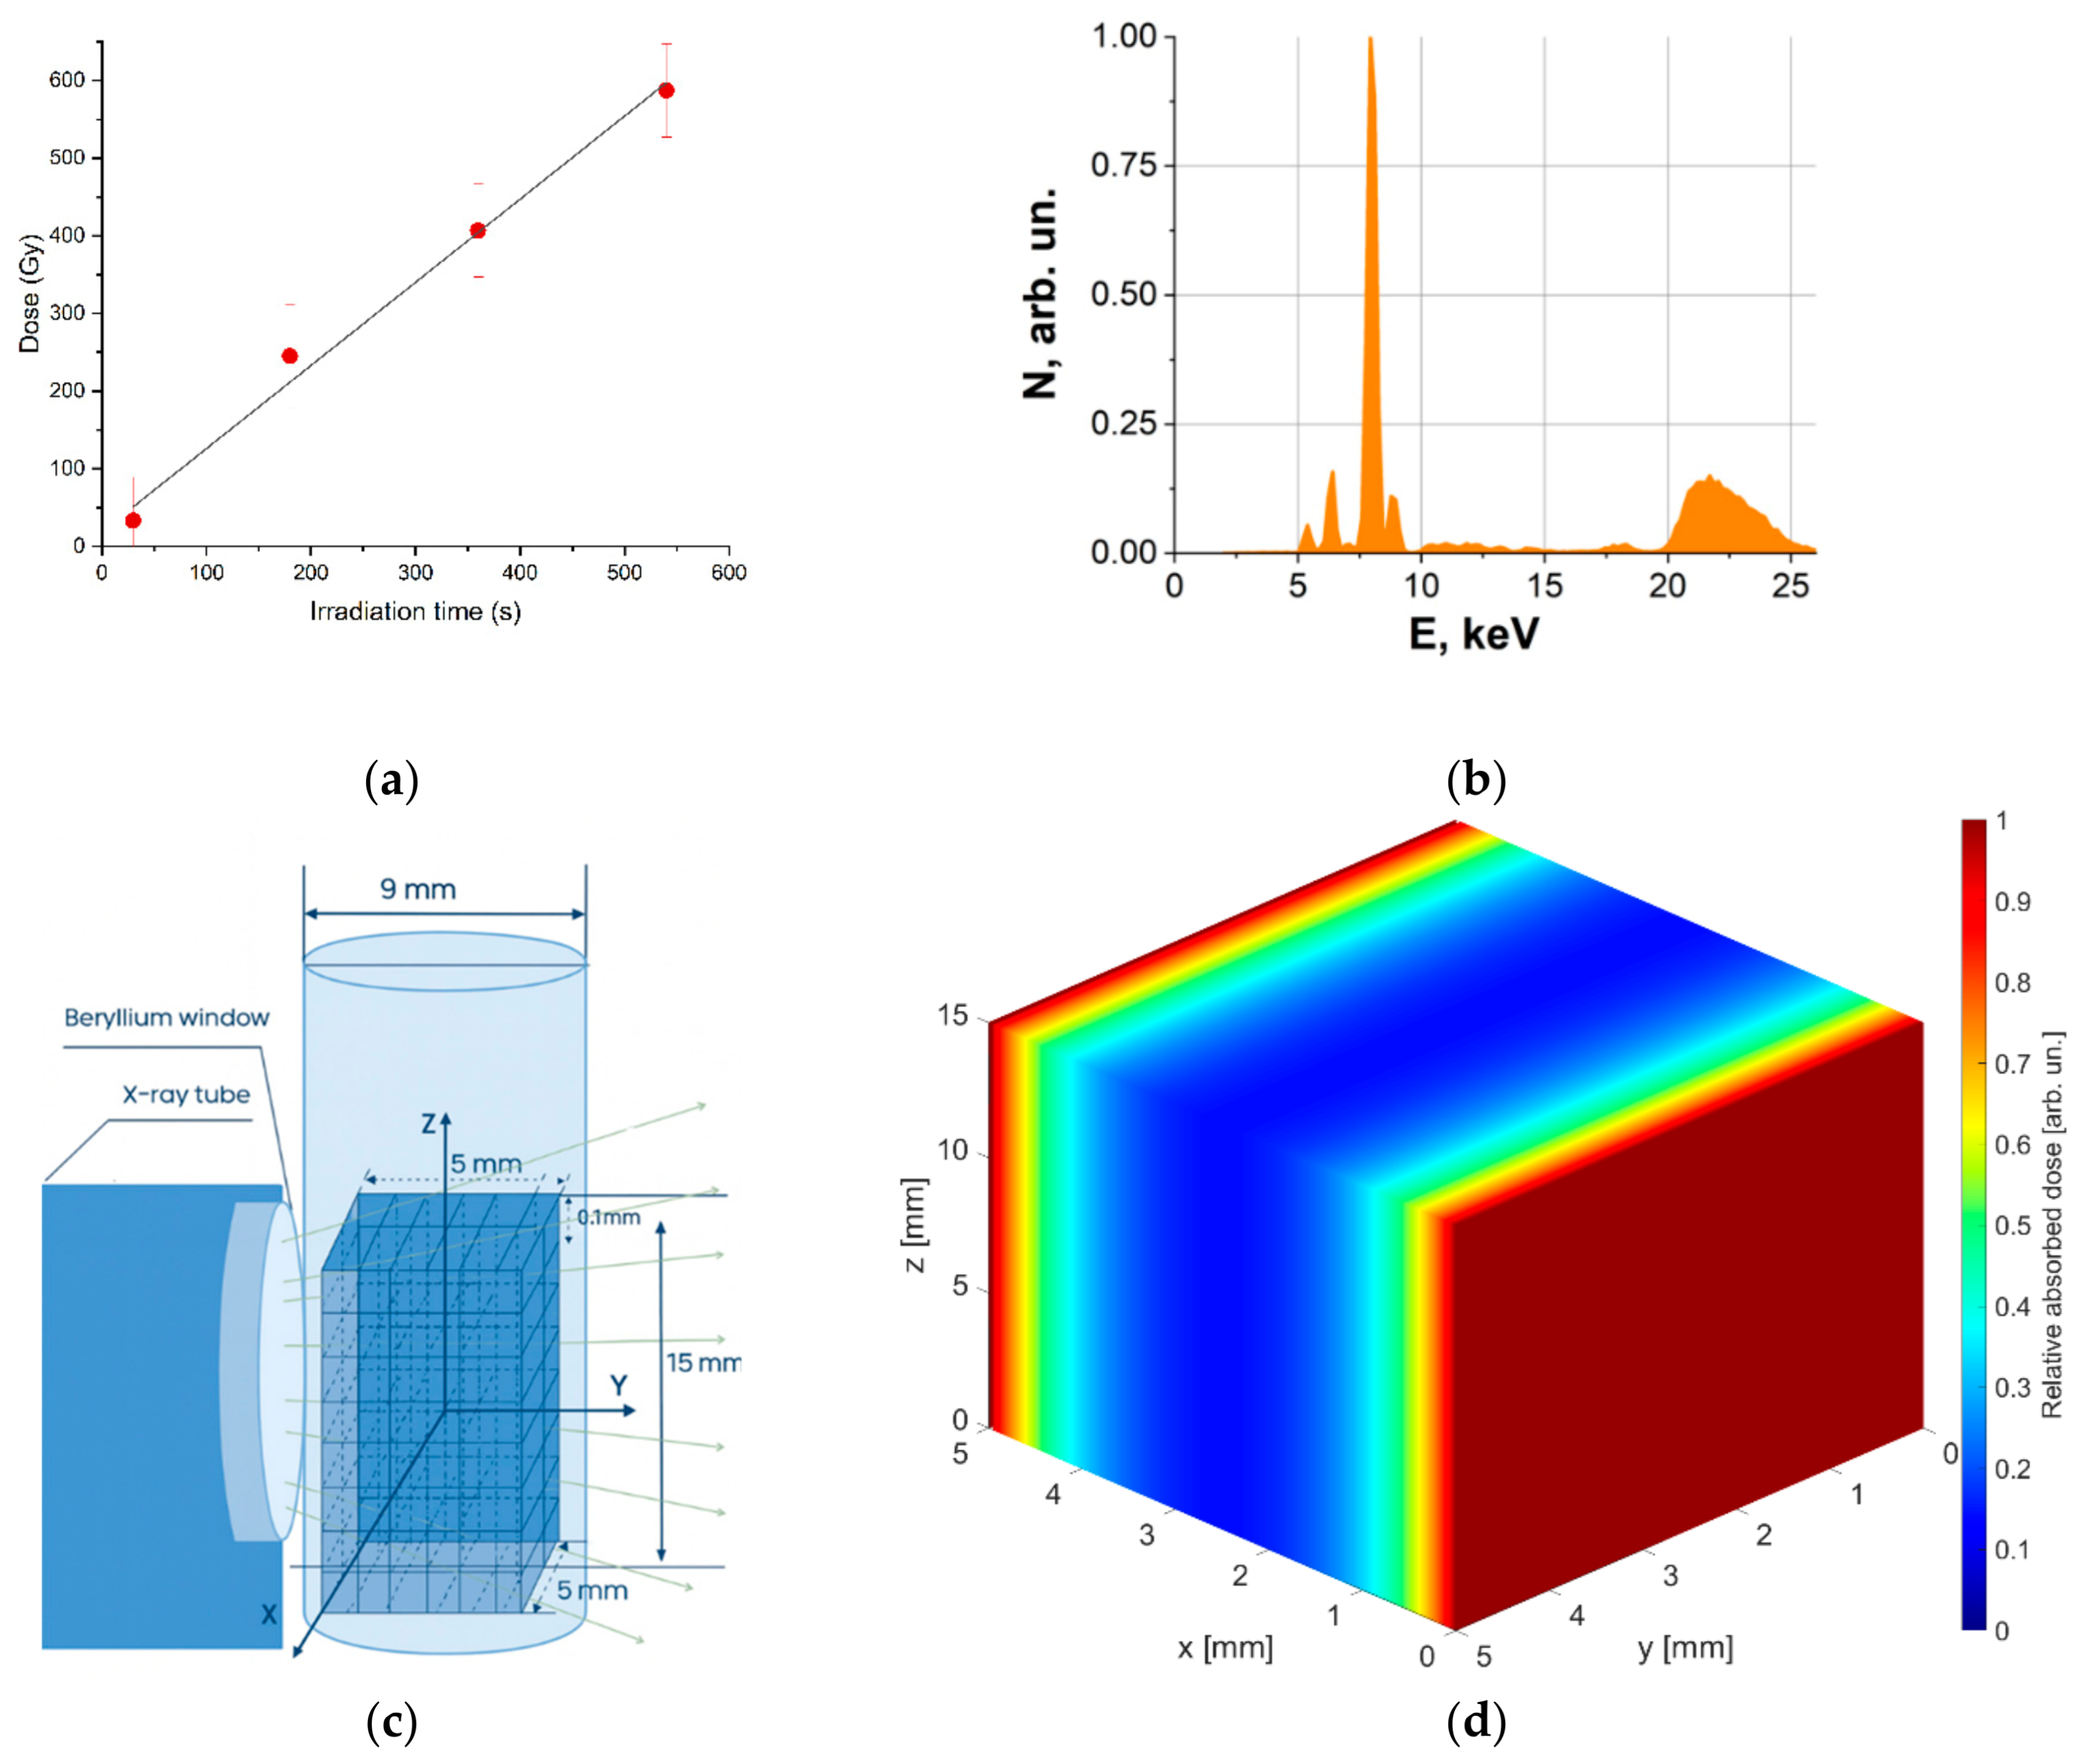
where k = 9.65×10⁶ is a dimensionless coefficient, ε = 2160 L⋅mol−1⋅cm−1 is the molar extinction coefficient of Fe3⁺ ions, l = 1 cm is the length of the optical path in the spectrophotometer cuvette, ρ = 1.024 g⋅cm−3 is the density of the dosimetry solution, and G(Fe3+) = 14.4 ions/100 eV is radiation-chemical yield for photons. Figure 1,a shows the dependency of the dose absorbed by the dosimetry solution on irradiation time. The Fricke solution was irradiated with (1.1±0.1) Gy/s.
To ensure uniform irradiation, each side of the potato samples was exposed to irradiation during an equal amount of time (Table 1). Nine identical samples of each variety were irradiated with each dose.
2.4. Dose Uniformity Control
Irradiation uniformity in potato samples was simulated using GEANT4 software, which is based on the Monte Carlo method [42]. Potato samples were represented as water parallelepipeds with the linear dimensions corresponding to the potato samples and irradiated with 106 photons having energy spectrum shown in Figure 1b.
The irradiation method used in the computer simulation was consistent with the irradiation method used in the experiment (Figure 1c). To obtain dose distribution, water parallelepiped was divided into 150 × 50 × 50 cubic cells with an edge of 0.1 mm, and the dose absorbed by each cell was calculated as:
where is the sum of the energy received by the i-th cell during Ni interactions of photons with water, and mi is the cell mass. The margin of error in the dose was calculated using the formula:
where is the sum of squares of the energy received by the i-th cell for Ni interaction acts. The dose in each cell of the water parallelepiped was divided by the maximum dose value recorded in the water parallelepiped and then the relative dose value in each cell was color-coded to show the dose distribution. The 3D-dose distribution map shown in Figure 1d was built for two-side irradiation of the water parallelepiped simulating the potato sample. As it can be seen from Figure 1d, the dose uniformity in water parallelepiped was 0.2.
However, such dose distribution did not affect the subsequent chemical stage of the experiment, since each of all potato parallelepipeds was used for making the potato extracts. For each irradiation dose, potato extracts were prepared using six pieces from three different potato tubers, two pieces from each tuber of each variety.
After irradiation, the samples were stored at 4 °C, and fingerprinting analysis was performed on the day of irradiation and on the 2nd and 6th days after irradiation in order to estimate the possibility of discrimination of potato samples irradiated with different doses during a few days after irradiation. Two samples from two different potato tubers of each variety, irradiated with each dose (0, 100, and 1000 Gy), were examined on each day to estimate the accuracy of discrimination.
2.5. Sample Preparation
To prepare the samples, test tubes containing potatoes were filled with 940 µL of distilled water and 20 µL of a 0.1 mol/L ascorbic acid solution, which partially prevented the potato pieces from browning as a result of oxidation. The test tubes were then placed in an orbital shaker for 12 h at 120 rpm to obtain an extract for further storage in the refrigerator for the 2 or 6 days of the experiment. The potato extracts were analyzed using redox and aggregation indicator reactions. Five parallel experiments were conducted for each sample, filling five wells of a 96-well plate (Thermo Scientific Nunc F96 MicroWell, white, cat. No. 136101).
To conduct the redox reaction, the following solutions were added to the wells:
1) Phosphate buffer solution, 0.067 M in phosphate, pH 7.4, 30 µL;
2) Cetyltrimethylammonium chloride (CTAB), 0.001 M, 30 µL;
3) Distilled water, 125 µL;
4) Potato extract, 25 µL;
5) CuSO4 solution, 0.001 M, 30 µL;
6) H2O2, 1 M, 30 µL;
7) Dye 2 (Scheme 2), 0.1 g/L, 30 µL.
The dyes were first dissolved in 95% ethanol to obtain a 1 g/L solution, which was stored at 4 °C. On the day of the experiment, this solution was diluted with water to obtain a 0.1 g/L solution in water–ethanol medium (9:1 v/v).
To perform the aggregation reaction, the following solutions were added to the well:
1) HCl, 0.1 M, 30 µL;
2) Distilled water, 145 µL;
3) CTAB, 0.001 M, 70 µL;
4) Potato extract, 25 µL;
5) Dye 1, concentration 0.025 g/L, 30 µL.
The time of reaction start was determined by adding the dye to the wells. After mixing, the absorbance/reflectance of the reaction mixtures and their fluorescence were periodically recorded using excitation at wavelengths of 254, 366, and 660 nm. To obtain visible-light images, the plate was photographed in a Camag Visualizer 2, and for near-infrared emission, a homemade NIR visualizer was used, which included red LEDs (660 nm) as a light source and a Nikon D80 camera with a long-pass light filter, cutting off visible light up to 700 nm [43]. For the aggregation reaction, imaging was performed once, and for the redox reaction, four times (every 10 minutes, counting from the moment the dye was added). Examples of the resulting images are shown in Figure 2.
The images were digitized using ImageJ software to obtain color intensity values for the reaction mixtures. RGB splitting was performed for the visible absorption/reflection images. The results of photographic digitization were presented in the form of data tables, in which the rows corresponded to the samples and their replicates (doses of 0, 100, and 1000 Gy, each dose in two physical samples, each analyzed in five replicates (five wells of the plate), to give a total of 30 observations), and the columns corresponded to the images obtained in two indicator reactions. For the aggregation reaction, R, G and B channels of visible absorbance/reflectance were used (3 columns), along with fluorescence intensities excited at 254, 366 and 660 nm (3 columns). For the redox reaction, total fluorescence intensities for emission excited at 366 and 660 nm (2 wavelengths × 4 timepoints = 8 columns) and for absorbance/reflectance, R, G and B channels at 4 timepoints (12 columns) were processed, which gave a total of 26 data columns. An example of a data table is provided in Supplementary Information (Table S1). Separate data tables were compiled for each potato variety (two varieties in total) and for each day of the experiment (0, 2 and 6). The obtained data were analyzed using the Principal Component Analysis (PCA) and Linear Discriminant Analysis (LDA) methods using the XLSTAT Excel add-in (Lumivero, USA), Partial Least Squares-Discriminant Analysis (PLS-DA) using Unscrambler X (Camo Software/AspenTech, USA), and LDA and SoftMax Regression (SR, an analog of logistic regression) using dedicated software composed by the authors based on Python libraries [44]. The results were visualized as two-dimensional graphs in the coordinates of the principal components PC1–PC2 (for PCA) or factors F1–F2; ellipses in the graphs were drawn for 90% confidence level.
For LDA, SR, and PLS-DA, the data were divided into training and validation sets. Random cross-validation was used to assess the model quality; the validation set included 5 observations out of 30 (17% of all observations in the data table). To assess the feasibility of dose recognition under real-world conditions, k-fold (“leave-one-sample-out”) cross-validation was used, in which whole samples (5 observations belonging to one sample) were sent to the validation set. During the LDA and SR validation process, the program assigned validation set observations to one of three classes (0, 100, and 100 Gy) by calculating the Mahalanobis distance between a point (observation) and a group of points of the corresponding class; an observation was assigned to the class with the minimal distance.
The dose discrimination accuracy A (%) was calculated as the number of correctly assigned observations divided by the total number of observations using the formula: A = corr/ all 100%, where corr is the number of correctly assigned observations of the validation set, and all is the total number of observations in this set. The accuracy values presented in this paper were averaged over all observations in the validation set; their standard deviations ranged from 7% to 24% (0% for a value of 100%).
3. Results and Discussion
3.1. Selection of the Indicator System
Fingerprint methods do not reveal the nature of marker compounds that are responsible for the analytical signal; rather, they represent a “black box” methodology that does not interpret the signals: fine differences in composition result in signal differences that enable the samples to be distinguished. In this work we follow the reaction-based fingerprinting strategy that is based on indicator reactions conducted in the presence of samples.
Our previous data [36] showed the efficiency of some redox and aggregation-type indicator reactions in discriminating between potato doses. Accordingly, two reactions were chosen for this study: the oxidation of dye 1 by hydrogen peroxide, catalyzed by Cu2+ ions, to form colored and fluorescent products; a submicellar amount of surfactant (CTAB) was added to the solution to enhance the fluorescence of the emitting particles, which are poorly soluble in water. The aggregation-type reaction occurred between the anionic components of the sample and CTAB; during the formation of such ion pairs, dye 2 could enter the hydrophobic domains of the resulting nanoparticles with fluorescence enhancement. This mechanism was considered in more detail previously [43]. The signal in the aggregation-type reaction is virtually indepedent of time, for which reason it was measured only once. In contrast, the redox reaction proceeded over time, and four photographs of the plate were taken over 30 min (every 10 min). To construct a data table for chemometric processing, the signals obtained in both reactions were pooled. The general scheme of the experiment is shown in Scheme 1.
3.2. Raw Data and Their Unsupervised Chemometric Processing
Kinetic curves obtained by photographing the reaction mixtures for half an hour vary in shape for different samples, changing with the potato variety, dose, and day after irradiation (Figure 3). The complex shape of the curves and their change with storage time (for example, the signal for the Lina variety decreases with time on day 0 and increases with time on days 2 and 6) may be due to interconversions of organic compounds occurring in the irradiated tubers during storage [15]. The complexity of the profiles may be caused by parallel degradation of the dye into several products, fluorescent and non-fluorescent, as a result of interaction with the oxidant. The rates of these processes may also depend on the composition of the sample, which is dose-dependent.
The raw signal–time profiles (Figure 3) hardly allow to distinguish the doses. To simplify the picture and represent each kinetic curve as a single point on the score plot, we processed the data using principal component analysis (PCA), an unsupervised technique that provides an objective presentation of the data. Using PCA score plots, irradiated Agatha potato samples can be distinguished from non-irradiated ones (Figure 4), while the doses of 100 and 1000 Gy are unseparable by this method. To improve discrimination, supervised methods, SoftMax Regression (SR), Linear Discriminant Analysis (LDA) and Partial Least Squares–Discriminant Analysis (PLS-DA) were further used.
3.3. Supervised Chemometric Processing
Linear Discriminant Analysis (LDA) is a supervised machine learning technique that finds a linear combination of features that best separates classes by maximizing the ratio of between-class variance to within-class variance [45]. Applying LDA to the data allowed us to construct the score plots (Figure 5) demonstrating the ability to discriminate samples by dose for all storage periods and both potato varieties. Quantitative information is presented in Table 2, which lists the dose recognition accuracies. Accuracy values of 100% were considered excellent, 90–99% were considered good, and 80–89% were considered satisfactory.
The left-hand side of Table 2 (both indicator reactions used) shows that the doses in both varieties can be distinguished with good accuracy regardless of storage period, with the exception of day 2 for Lina variety (satisfactory accuracy). However, when only the redox reaction data were processed (the right-hand side of Table 2), the accuracy values were significantly lower, confirming the need to use both reactions to achieve discrimination.
Among the two chemometric techniques used for dose estimation (LDA and SR), SoftMax regression was found to be more effective (higher accuracy values than LDA, as shown in Table 2). SoftMax regression, or multinomial logistic regression, is a generalization of logistic regression for multi-class classification problems. It works by applying the so called softmax activation function to convert scores for each class into probabilities, allowing the model to predict the probability of an input belonging to one of several possible outcomes [46].
The ability to differentiate between the doses revealed that the signal remained dose-discriminating for several days after treatment. This result suggests that exposure to ionizing radiation induces chemical changes in potatoes that are stable over time, and that the compounds responsible for the signal remain stable during storage (they cannot belong, for example, to the class of peroxides, which are rapidly degraded enzymatically).
3.4. Distinguishing Between Irradiated and Non-Irradiated Samples
A separate task is recognizing the fact of radiation treatment itself, which is important, for instance, for detecting fraud or preventing repeated irradiation of the same product. Using our data, we attempted to demonstrate that this task can be accomplished not only immediately after irradiation of samples but also at least several days later. All data were divided into two classes: controls (not irradiated) and both doses (100 and 1000 Gy combined). The results (Table 3) show that for the SR and LDA techniques, this task is easier than recognizing all doses, and the accuracy values are generally higher than those in Table 2.
Moreover, for this two-class discrimination task, another efficient chemometric technique such as Partial Least Squares Discriminant Analysis (PLS-DA) can be used. PLS-DA is a supervised multivariate method that projects high-dimensional data into a lower-dimensional space using latent variables that maximize separation between predefined groups. Similar to SR and LDA and unlike unsupervised methods such as PCA, PLS-DA is aware of the class labels of the samples. The latent variables are chosen to maximize the covariance between predictor variables (e.g., received signals) and response variables (class labels, e.g., doses). PLS-DA typically operates on two classes of data, which allows using this technique to discriminate between non-irradiated and irradiated samples. As a result of calculation, a reference variable y was assigned to each observation, which was equal to 0 for non-irradiated samples and 1 for the irradiated ones. An observation was considered to be correctly classified as ‘non-irradiated’, if the predicted y value was less then 0.5, and as ‘irradiated’, if it exceeded 0.5. The discrimination accuracy was calculated as the number of correctly classified observations to the total number of obervations in the validation set.
The results of applying PLS-DA to the data, as well as similar results for SR and LDA, are presented in Table 3 (left-hand part: ‘random cross-validation’). The recognition accuracy of PLS-DA is 100% for all six cases (both potato varieties and three days), indicating an excellent accuracy of the chemometric model in the differentiation of irradiated and non-irradiated samples for different storage periods.
3.5. Distinguishing Between Doses Using k-Fold Validation
The accuracy values presented above were obtained using random cross-validation, which is useful in verification of the correctness of the chemometric model but is not suitable for the recognition of samples in a real-world experiment. To simulate the recognition of unknowns, cross-validation should involve withdrawal of entire samples (rather than random individual observations) from the dataset and including them in the validation set. In this study, the sample contained 5 parallel runs (5 dataset observations), so groups of five consecutive observations were included in the validation set during k-fold validation. Accuracy was calculated as the ratio of the number of correctly assigned samples to the total number of samples in the validation set. In this study, we only had two physical samples per dose, and using k-fold validation, the model had limited capacity to learn (when one sample was sent to the validation set, the model was trained on the remaining single sample).
For the reasons stated, the accuracy values obtained using k-fold cross-validation (Table 4) are significantly lower than those received with random cross-validation (Table 2). Nevertheless, even under these realistic conditions, accuracy on day 6 did not fall below 97% using SR and LDA for all doses, confirming the feasibility of confidently determining the dose in an unknown sample to an order of magnitude after the specified storage period. In particular, to obtain these results, it was important to evaluate different chemometric techniques: for the Lina variety, the SR method proved to be more effective, while for the Agata variety, the LDA method performed better in k-fold cross-validation.
PLS-DA also allowed using k-fold cross-validation, but only for a two-class analysis, i.e., to distinguish between irradiated and non-irradiated samples (right-hand part of Table 3). For the Agatha variety, all accuracy values equal 100%, while for the Lina variety, they do not exceed 80% on days 0 and 2, although for day 2 higher accuracy is achieved using the SR technique (90%). A tendency is observed that the ability to differentiate doses is not only maintained during storage but may even improve over time. Similarly to the three-class analysis using the LDA/SR techniques, excellent accuracy was achieved on day 6 using PLS-DA, confirming the possibility to confidently determine the dose after a storage period.
4. Conclusions
In this study, we investigated doses in raw potatoes at various times after X-ray irradiation. In addition to the previously demonstrated accurate determination of doses on the day of treatment, we revealed the feasibility of estimating the doses in tubers within six days after irradiation. The kinetic-based fingerprinting method that we use is a simple, affordable and rapid technique that does not require full-spectrum instruments or highly qualified personnel. The results showed that the dose estimation accuracy to an order of magnitude (100 or 1000 Gy or non-irradiated) was at least 97% even on the sixth day of storage. The ability to distinguish irradiated samples from non-irradiated ones on the 6th day was 100%.
These findings are important for the practical application of the proposed methodology, as dose control issues can arise over various storage periods. Indirectly, these results indicate that the chemical changes that are responsible for the signal are stable during storage. If future studies determine that dose analysis is feasible up to several months after irradiation, it will have great practical importance. Experiments with longer shelf-life periods are required to explore this possibility.
Another prospect of developing the method lies in reducing the number of indicator reactions for dose recognition. In this study involving potato tubers, two reactions were used, while for other foods, a single reaction was often sufficient to estimate all doses with an order-of-magnitude accuracy. Selecting the optimal chemometric method is also important: SoftMax regression proved to be the most effective in case of random validation, but work with more practically important k-fold cross-validation showed that linear discriminant analysis can be equally effective for some samples. PLS-DA was unrivaled in solving two-class recognition tasks. Therefore, future studies of reaction-based dose estimation should explore the application of the broadest possible range of chemometric methods.
Supplementary Materials
The following supporting information can be downloaded at the website of this paper posted on Preprints.org, Table S1: A fragment of a data table for Agatha variety (2nd day of storage) representing the intensities of the photographic images of the 96-well plate containing reaction mixtures.
Author Contributions
Yana V. Zubritskaya—Investigation, Writing—original draft. Anna V. Shik: Validation, Investigation, Formal analysis. Irina A. Stepanova: Investigation, Formal analysis. Sergey A. Zolotov: Investigation. Polina Yu. Borshchegovskaya: Writing—original draft, Investigation. Ulyana A. Bliznyuk: Writing—review & editing, Methodology, Conceptualization. Alexander P. Chernyaev: Supervision, Conceptualization. Irina A. Ananieva: Investigation. Igor A. Rodin: Supervision, Funding acquisition. Mikhail K. Beklemishev: Writing—review & editing, Methodology, Conceptualization. All authors have read and agreed to the published version of the manuscript.
Funding
This research was funded by the Russian Science Foundation, grant number 22-63-00075.
Institutional Review Board Statement
Not applicable.
Informed Consent Statement
Not applicable.
Data Availability Statement
The data presented in this study are available from the corresponding author on a reasonable request.
Conflicts of Interest
The authors declare no conflicts of interest.
Abbreviations
The following abbreviations are used in this manuscript:
| LDA | Linear discriminant analysis |
| PLS-DA | Partial least square–discriminant analysis |
| SR | SoftMax regression |
References
- Moreira, R.G.; Castell-Perez, M.E. Chapter 22. Electron-Beam Irradiation. Principles and Applications. In book: Nonthermal Processing Technologies for Food, 2nd ed.; Zhang, H.Q., Balasubramaniam, V.M., Patrick Dunne, C., Yuan, J.T.C., Farkas, D.F., Barbosa-Cánovas, G.V., Eds.; Wiley: Hoboken, NJ, USA, 2026. [Google Scholar] [CrossRef]
- Piri, I.; Babayan, M.; Tavassoli, A.; Javaheri, M. The use of gamma irradiation in agriculture. Afr. J. Microbiol. Res. 2011, 5, 5806–5811. [Google Scholar] [CrossRef]
- Roberts, P.R. Food irradiation: Standards, regulations and world-wide trade. Radiat. Phys. Chem. 2016, 129, 30–34. [Google Scholar] [CrossRef]
- Obodovskiy, I. Radiation: Fundamentals, Applications, Risks, and Safety; Elsevier: Amsterdam, The Netherlands, 2019; ISBN 978-0-444-63979-0. [Google Scholar] [CrossRef]
- Indiarto, R.; Irawan, A.N.; Subroto, E. Meat Irradiation: A Comprehensive Review of Its Impact on Food Quality and Safety. Foods 2023, 12, 1845. [Google Scholar] [CrossRef] [PubMed]
- Kozlova, E.; Bliznyuk, U.; Chernyaev, A.; Borshchegovskaya, P.; Braun, A.; Ipatova, V.; Zolotov, S.; Nikitchenko, A.; Chulikova, N.; Malyuga, A.; et al. Optimization Function for Determining Optimal Dose Range for Beef and Seed Potato Irradiation. Foods 2024, 13, 3729. [Google Scholar] [CrossRef]
- Etemadinasab, H.; Zahedi, M.; Ramin, A.-A.; Kadivar, M.; Shirmardi, S.P. Effects of electron beam irradiation on physicochemical, nutritional properties and storage life of five potato cultivars. Radiat. Phys. Chem. 2020, 177, 109093. [Google Scholar] [CrossRef]
- Schwimmer, S.; Burr, H.K.; Harrington, W.O.; Weston, W.J. Gamma irradiation of potatoes: Effects on sugar content, chip color, germination, greening, and susceptibility to mold. Amer. Potato J. 1957, 34, 31–41. [Google Scholar] [CrossRef]
- Peng, Z.; Wang, X.; Liu, Z.; Zhang, L.; Cheng, L.; Nia, J.; Zuo, Y.; Shu, X.; Wu, D. Modifying the Resistant Starch Content and the Retrogradation Characteristics of Potato Starch Through High-Dose Gamma Irradiation. Gels 2024, 10, 763. [Google Scholar] [CrossRef]
- Teixeira, B.S.; Garcia, R.H.L.; Takinami, P.Y.I.; del Mastro, N.L. Comparison of gamma radiation effects on natural corn and potato starches and modified cassava starch. Radiat. Phys. Chem. 2018, 142, 44–49. [Google Scholar] [CrossRef]
- Kurdziel, M.; Łabanowska, M.; Pietrzyk, S.; Pająk, P.; Królikowska, K.; Szwengiel, A. The effect of UV-B irradiation on structural and functional properties of corn and potato starches and their components. Carbohydr. Polym. 2022, 289, 119439. [Google Scholar] [CrossRef]
- Kodenchery, U.K.; Nair, P.M. Metabolic changes induced by sprout inhibiting dose of γ-irradiation in potatoes. J. Agric. Food Chem. 1972, 20, 282–285. [Google Scholar] [CrossRef]
- Le Caër, S. Water Radiolysis: Influence of Oxide Surfaces on H2 Production under Ionizing Radiation. Water 2011, 3, 235–253. [Google Scholar] [CrossRef]
- Musin, L.; Nigmatullina, L.; Laikov, A.; Morozov, V.; Nizamov, R.; Gainullin, R.; Vasilevskiy, N.; Kamalova, Z.; Nefedova, R.; Borisov, D. Study of the molecular-structural composition of alcoholic extracts of radio-induced potato tubers by mass spectrometry and EPR. Food Chem. 2022, 396, 133665. [Google Scholar] [CrossRef]
- Bliznyuk, U.; Borshchegovskaya, P.; Bolotnik, T.; Ipatova, V.; Kozlov, A.; Nikitchenko, A.; Mezhetova, I.; Chernyaev, A.; Rodin, I.; Kozlova, E. Volatile Compound Markers in Beef Irradiated with Accelerated Electrons. Molecules 2024, 29, 940. [Google Scholar] [CrossRef]
- Chauhan, S.K.; Kumar, R.; Nadanasabapathy, S.; Bawa, A.S. Detection Methods for Irradiated Foods. Compr. Rev. Food Sci. Food Saf. 2009, 8, 4–16. [Google Scholar] [CrossRef]
- Cruz-Zaragoza, E.; Roman-Lopez, J.; Ramos Córdoba, D.; Furetta, C.; Santiago, M.; Marcazzó, J. Luminescence detection and dose assessment of irradiated Yerba Mate (Ilex paraguariensis) tea leaves. Appl. Radiat. Isotopes 2015, 100, 75–78. [Google Scholar] [CrossRef]
- Bliznyuk, U.; Avdyukhina, V.; Borshchegovskaya, P.; Bolotnik, T.; Ipatova, V.; Nikitina, Z.; Nikitchenko, A.; Rodin, I.; Studenikin, F.; Chernyaev, A.; et al. Effect of electron and X-ray irradiation on microbiological and chemical parameters of chilled turkey. Sci. Rep. 2022, 12, 750. [Google Scholar] [CrossRef] [PubMed]
- Zanardi, E.; Caligiani, A.; Novelli, E. New Insights to Detect Irradiated Food: an Overview. Food Anal. Methods 2018, 11, 224–235. [Google Scholar] [CrossRef]
- Suhaj, M.; Rácová, J.; Polovka, M.; Brezová, V. Effect of γ-irradiation on antioxidant activity of black pepper (Piper nigrum L.). Food Chem. 2006, 97, 696–704. [Google Scholar] [CrossRef]
- Fukui, N.; Fujiwara, T.; Furuta, M.; Takatori, S. Detection of gamma-irradiated red peppers using a combination of 5,6-dihydrothymidine and thymidine as irradiation indicator. Rad. Phys. Chem. 2022, 191, 109849. [Google Scholar] [CrossRef]
- Kroupin, P.Y.; Semenov, O.G. Physical methods of pre-planting and postharvest treatment of potato: a review. Rudn. J. Agron. Anim. Ind. 2018, 13, 383–395. [Google Scholar] [CrossRef]
- Hayashi, T.; Todoriki, S.; Otobe, K.; Sugiyama, J. Applicability of Impedance Measuring Method to the Detection of Irradiation Treatment of Potatoes. Nippon Shokuhin Kogyo Gakkaishi 1993, 40, 378–384. [Google Scholar] [CrossRef]
- Felföldi, J.; László, P.; Barabássy, S.; Farkas, J. Dielectric method for detection of irradiation treatment of potatoes. Radiat. Phys. Chem. 1993, 41, 471–480. [Google Scholar] [CrossRef]
- Chung, H.W.; Kwon, J.H. Detection of irradiated potato and garlic by thermoluminescence measurement. Kor. J. Food Sci. Technol. 1988, 30, 283–287. [Google Scholar]
- Todoriki, S.; Kameya, H.; Saito, K.; Hagiwara, S. Detection of Commercially Irradiated Potatoes by Thermoluminescence and Photostimulated Luminescence Analyses. Food Sci. Technol. Res. 2014, 20, 555–561. [Google Scholar] [CrossRef]
- Jo, Y.; Ameer, K.; Chung, N.; Kang, Y.H.; Ahn, D.U.; Kwon, J.H. E-sensing, calibrated PSL, and improved ESR techniques discriminate irradiated fresh grapefruits and lemons. J. Food Sci. Technol. 2020, 57, 364–374. [Google Scholar] [CrossRef]
- Zábrodská, B.; Vorlová, L. Adulteration of honey and available methods for detection—a review. Acta Vet. Brno 2014, 83, 85. [Google Scholar] [CrossRef]
- Zil’berg, R.A.; Yarkaeva, Y.A.; Maksyutova, E.I.; Sidel’nikov, A.V.; Maistrenko, V.N. Voltammetric identification of insulin and its analogues using glassy carbon electrodes modified with polyarylenephthalides. J. Anal. Chem. 2017, 72, 402. [Google Scholar] [CrossRef]
- Bayona, J.M.; Domínguez, C.; Albaigés, J. Analytical developments for oil spill fingerprinting. Trends Environ. Anal. Chem. 2015, 5, 26. [Google Scholar] [CrossRef]
- Kuchmenko, T.; Menzhulina, D.; Shuba, A. Noninvasive Detection of Bacterial Infection in Children Using Piezoelectric E-Nose. Sensors 2022, 22, 8496. [Google Scholar] [CrossRef] [PubMed]
- Stepanova, I.A.; Lebedeva, A.N.; Shik, A.V.; Skorobogatov, E.V.; Beklemishev, M.K. Recognition and determination of sulfonamides by near-IR fluorimetry using their effect on the rate of the catalytic oxidation of a carbocyanine dye by hydrogen peroxide. J. Anal. Chem. 2021, 76, 1397–1405. [Google Scholar] [CrossRef]
- Pypin, A.A.; Shik, A.V.; Stepanova, I.A.; Doroshenko, I.A.; Podrugina, T.A.; Beklemishev, M.K. A reaction-based optical fingerprinting strategy for the recognition of fat-soluble samples: Discrimination of motor oils. Sensors 2023, 23, 7682. [Google Scholar] [CrossRef] [PubMed]
- Shik, A.V.; Stepanova, I.A.; Doroshenko, I.A.; Podrugina, T.A.; Beklemishev, M.K. Carbocyanine-based optical sensor Array for the discrimination of proteins and rennet samples using hypochlorite oxidation. Sensors 2023, 23, 4299. [Google Scholar] [CrossRef] [PubMed]
- Skorobogatov, E.V.; Shik, A.V.; Sobolev, P.V.; Stepanova, I.A.; Orekhov, V.S.; Ustyuzhanin, A.O.; Koksharova, M.V.; Ikhalaynen, Y.A.; Timchenko, Y.V.; Rodin, I.A.; et al. Monitoring different water types for engine oil water-soluble fraction and iron(2+) using a reaction-based optical sensing strategy: A proof-of-concept study. Ind. Eng. Chem. Res. 2024, 63, 12336–12349. [Google Scholar] [CrossRef]
- Shik, A.V.; Skorobogatov, E.V.; Bliznyuk, U.A.; Chernyaev, A.P.; Avdyukhina, V.M.; Borschegovskaya, P.Y.; Zolotov, S.A.; Baytler, M.O.; Doroshenko, I.A.; Podrugina, T.A.; et al. Estimation of doses absorbed by potato tubers under electron beam or X-ray irradiation using an optical fingerprinting strategy. Food Chem. 2023, 414, 135668. [Google Scholar] [CrossRef]
- Shik, A.V.; Sobolev, P.V.; Zubritskaya, Y.V.; Baytler, M.O.; Stepanova, I.A.; Chernyaev, A.P.; Borschegovskaya, P.Y.; Zolotov, S.A.; Doroshenko, I.A.; Podrugina, T.A.; et al. Rapid testing of irradiation dose in beef and potatoes by reaction-based optical sensing technique. J. Food Comp. Anal. 2024, 127, 105946. [Google Scholar] [CrossRef]
- Shik, A.V.; Stepanova, I.A.; Koksharova, M.V.; Doroshenko, I.A.; Podrugina, T.A.; Bliznyuk, U.A.; Borshchegovskaya, P.Y.; Chernyaev, A.P.; Ananieva, I.A.; Rodin, I.A.; et al. Estimation of irradiation doses in chicken samples using a reaction-based fingerprinting method. Food Chem. 2025, 482, 144073. [Google Scholar] [CrossRef]
- Mahto, R.; Das, M. Effect of γ irradiation on the physico-mechanical and chemical properties of potato (Solanum tuberosum L.), cv. ‘Kufri Chandramukhi’ and ‘Kufri Jyoti’, during storage at 12 °C. Rad. Phys. Chem. 2015, 107, 12–18. [Google Scholar] [CrossRef]
- Bergers, W.W.A. Investigation of the contents of phenolic and alkaloidal compounds of gamma irradiated potatoes during storage. Food Chem. 1981, 7, 47–61. [Google Scholar] [CrossRef]
- International Standard ISO/ASTM 51026:15(E). Practice for Using the Fricke Dosimetry System. ISO/ASTM International, 2015. https://standards.iteh.ai/catalog/standards/sist/692200df-b3f5-44ab-9526- 159f54f82c88/iso-astm-51026-2015.
- Geant4. Available online: https://geant4.web.cern.ch/ (accessed on 28 October 2025).
- Zakharenkova, S.A.; Katkova, E.A.; Doroshenko, I.A.; Kriveleva, A.S.; Lebedeva, A.N.; Vidinchuk, T.A.; Shik, A.V.; Abramchuk, S.S.; Podrugina, T.A.; Beklemishev, M.K. Aggregation-based fluorescence amplification strategy: “turn-on” sensing of aminoglycosides using near-IR carbocyanine dyes and pre-micellar surfactants. Spectr. Acta A 2021, 247, 119109. [Google Scholar] [CrossRef] [PubMed]
- LDA_STVAL_0.1. Available online: https://drive.google.com/drive/folders/1f6mzzgxFCEOWpI6fqwfalRTCWV7Y7ZAS?usp=sharing (accessed on 28 October 2025).
- Summarizing the LDA Approach in 5 Steps. Available online: https://sebastianraschka.com/Articles/2014_python_lda.html#summarizing-the-lda-approach-in-5-steps (accessed on 28 October 2025).
- Softmax Regression. Available online: https://ethen8181.github.io/machine-learning/deep_learning/softmax.html#Softmax-Regression (accessed on 28 October 2025).
Scheme 1.
Main stages of the experiment (irradiation of potato tubers, extraction, indicator reactions and data processing).
Scheme 1.
Main stages of the experiment (irradiation of potato tubers, extraction, indicator reactions and data processing).
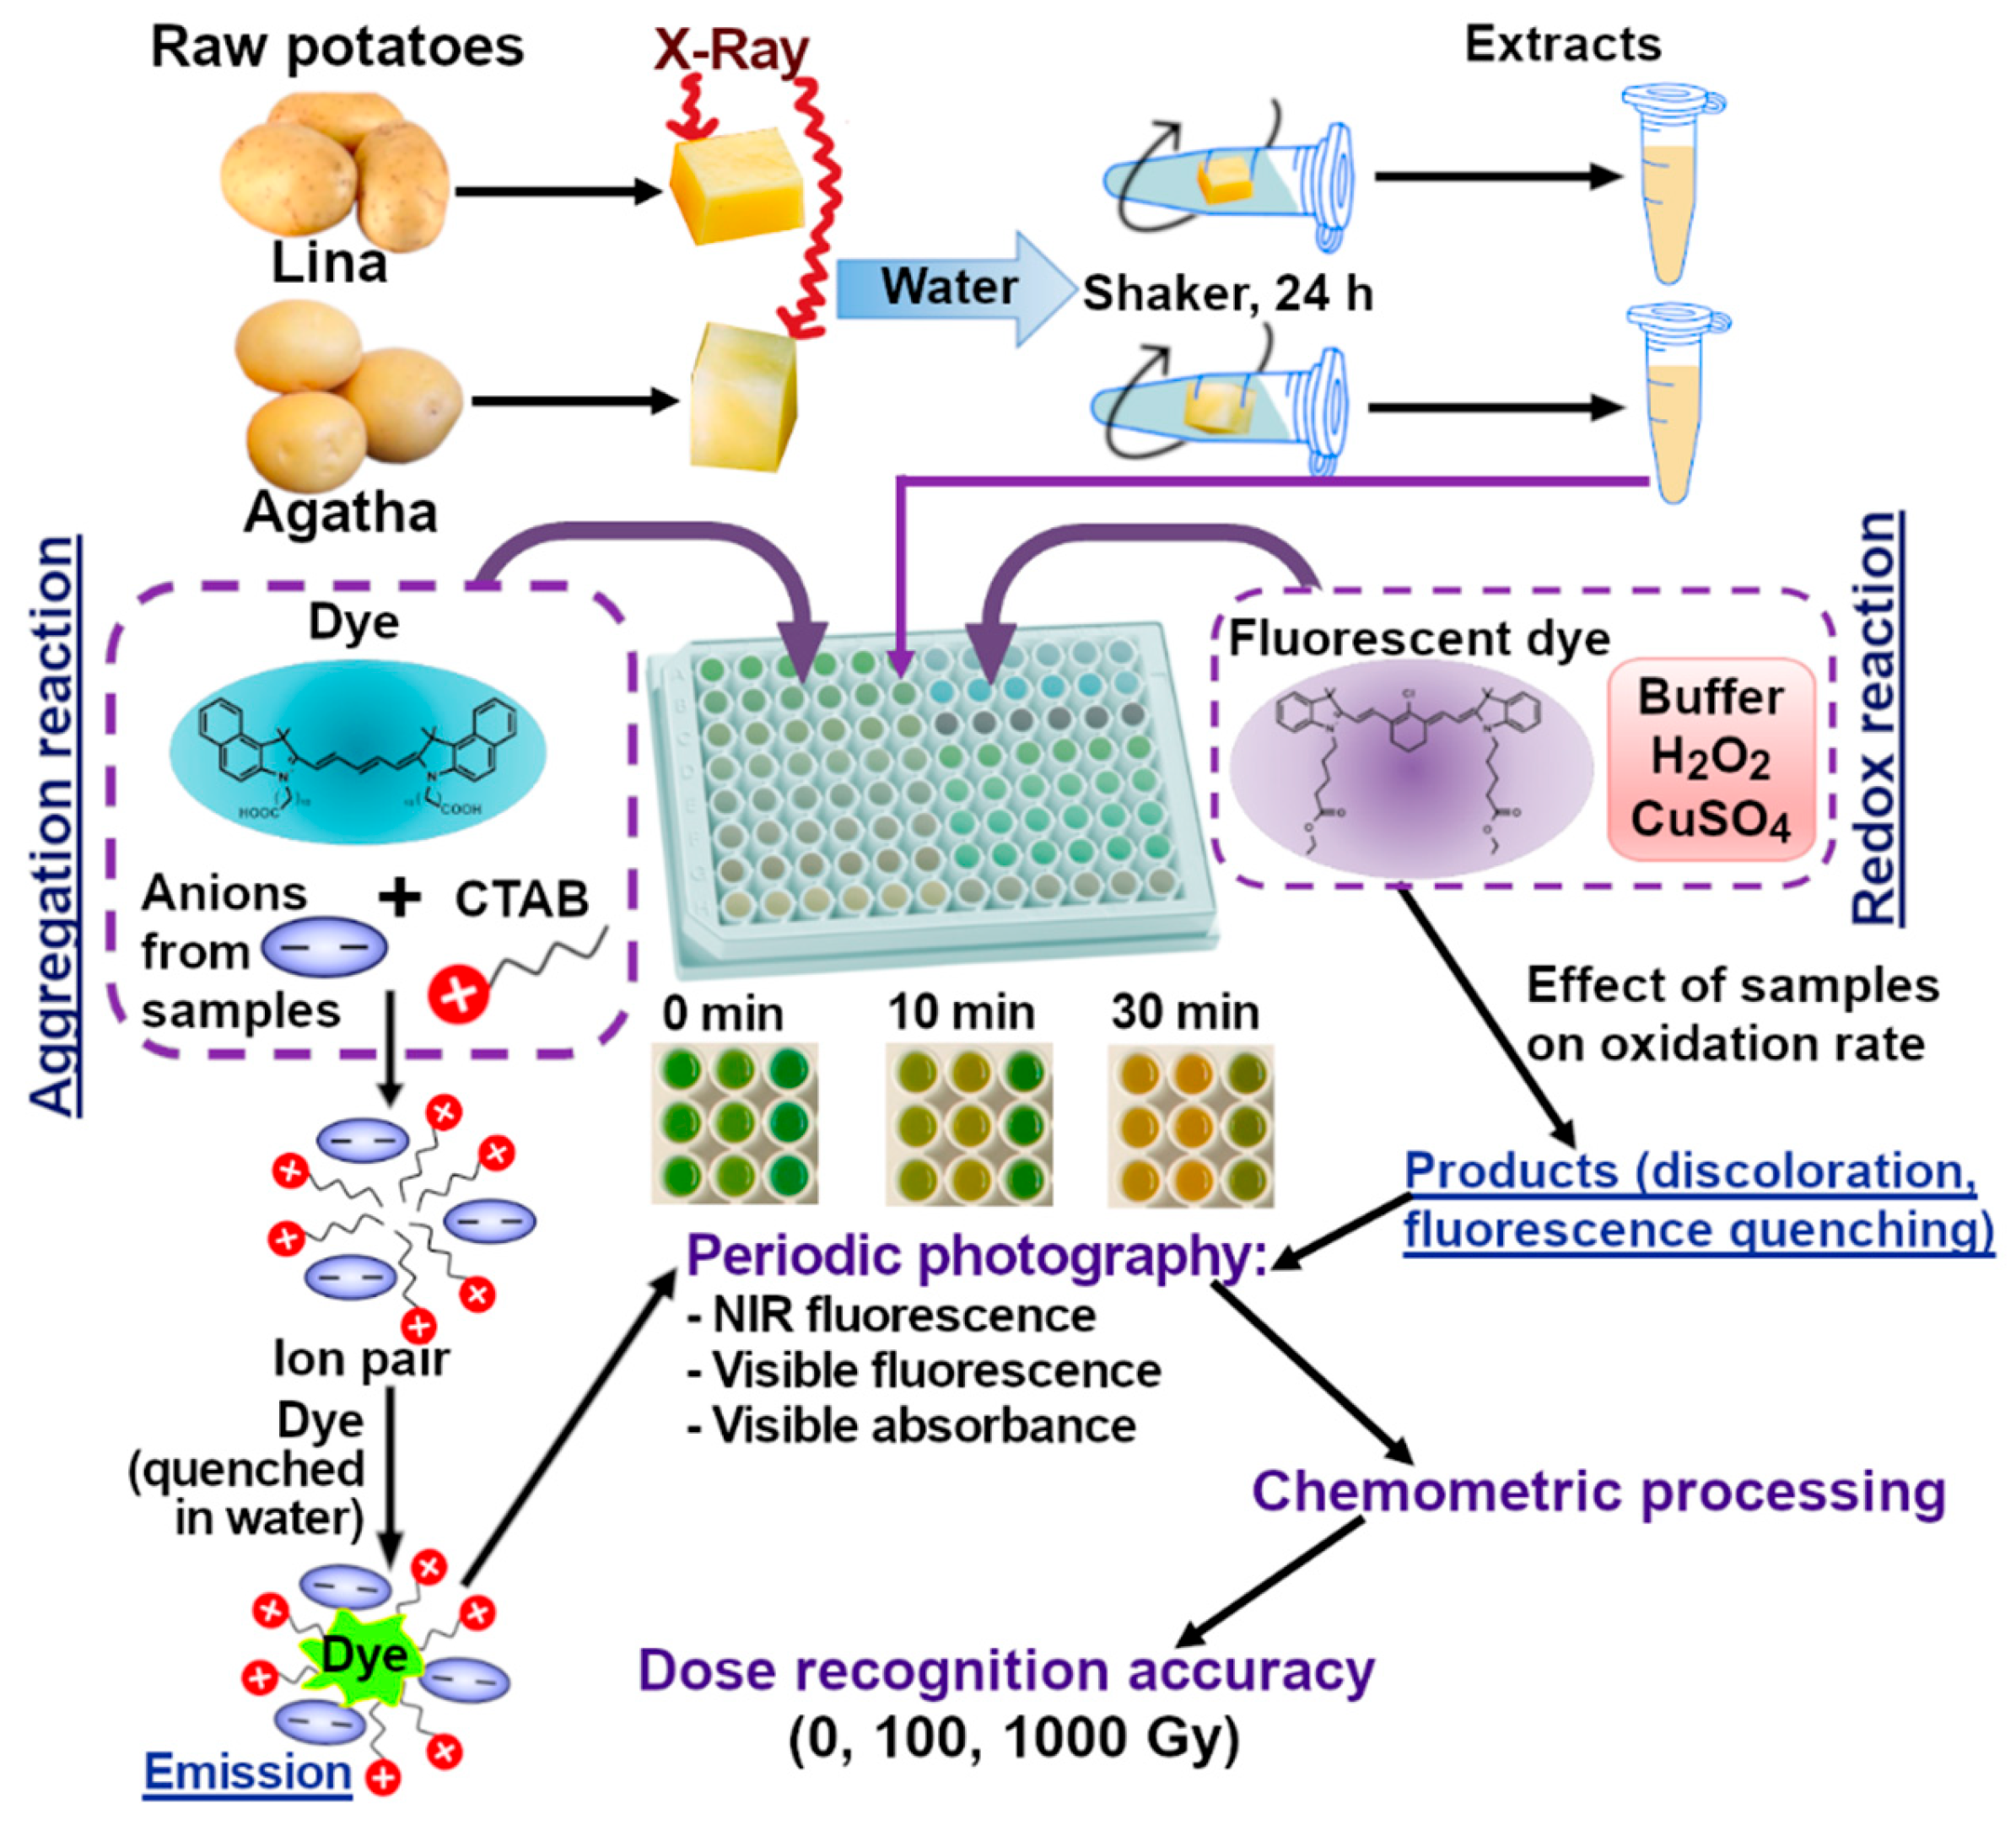
Figure 1.
DRON UM-2 X-ray unit irradiation parameters: (a) Dependence of the dose absorbed by the Fricke solution on irradiation time; (b) The energy spectrum; (c) Simulation of bilateral irradiation of potatoes; (d) Relative dose distribution in a 5 mm thick, 5 mm long and 15 mm high water parallelepiped irradiated with X-rays.
Scheme 2.
Structures of the dyes used for optical fingerprinting of potatoes.
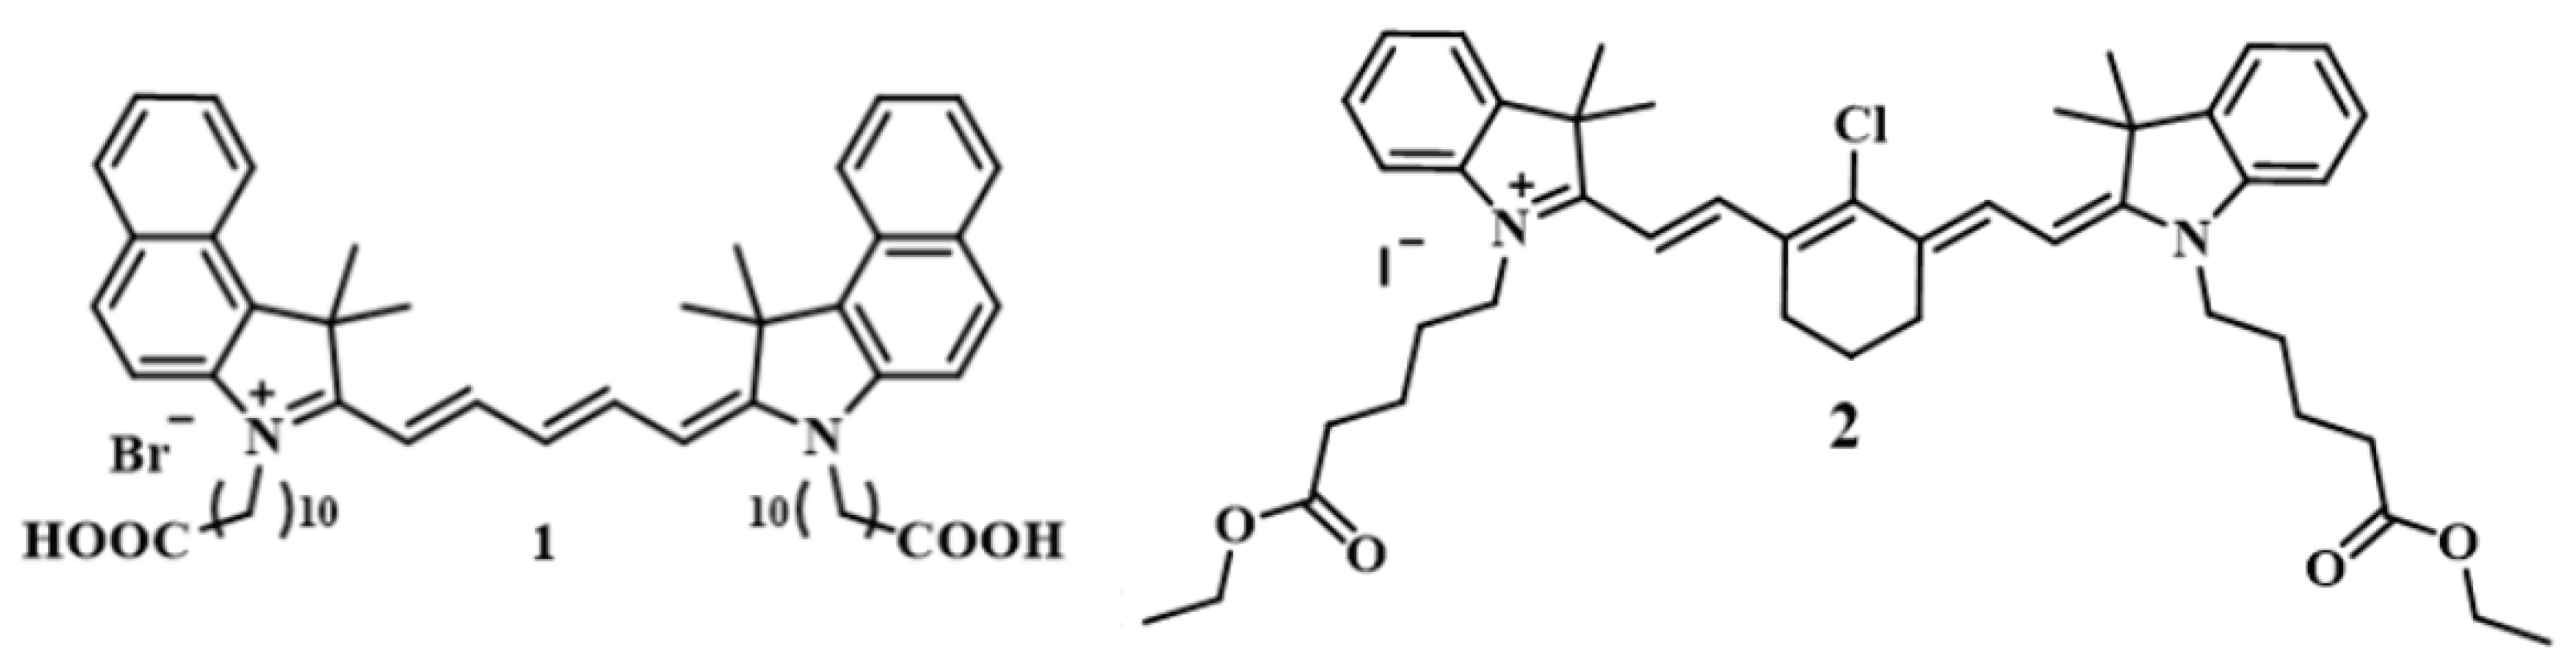
Figure 2.
Examples of photographic images of the reaction mixtures. The indicator reactions were conducted with the samples of irradiated potato samples stored for 6 days. Potato extracts were presented as 2 samples per dose, 6 parallels per sample (wells in columns, from left to right in each photograph): Agata control-1, Agatha control-2, Agatha 100 Gy-1, Agatha 100 Gy-2, Agatha 1 kGy-1, Agatha 1 kGy-2, Lina control-1, Lina control-2, Lina 100 Gy-1, Lina 100 Gy-2, Lina 1 kGy-1, Lina 1 kGy-2.
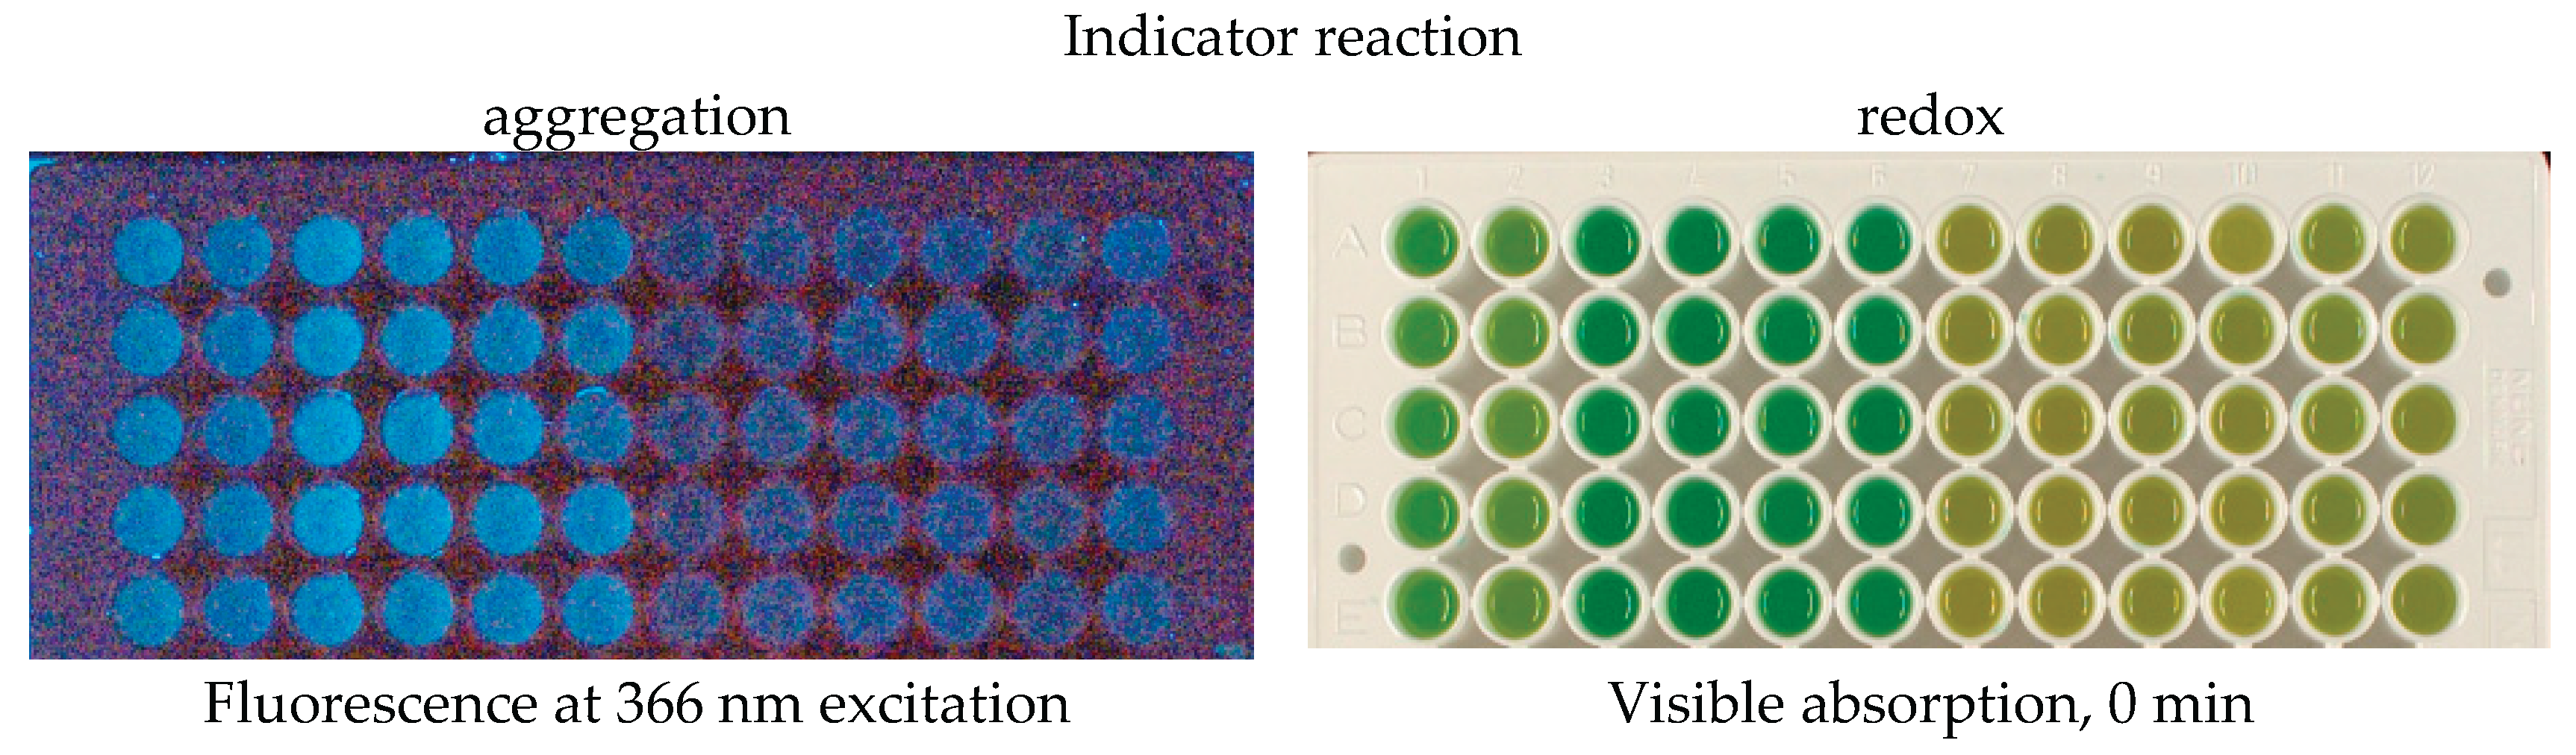
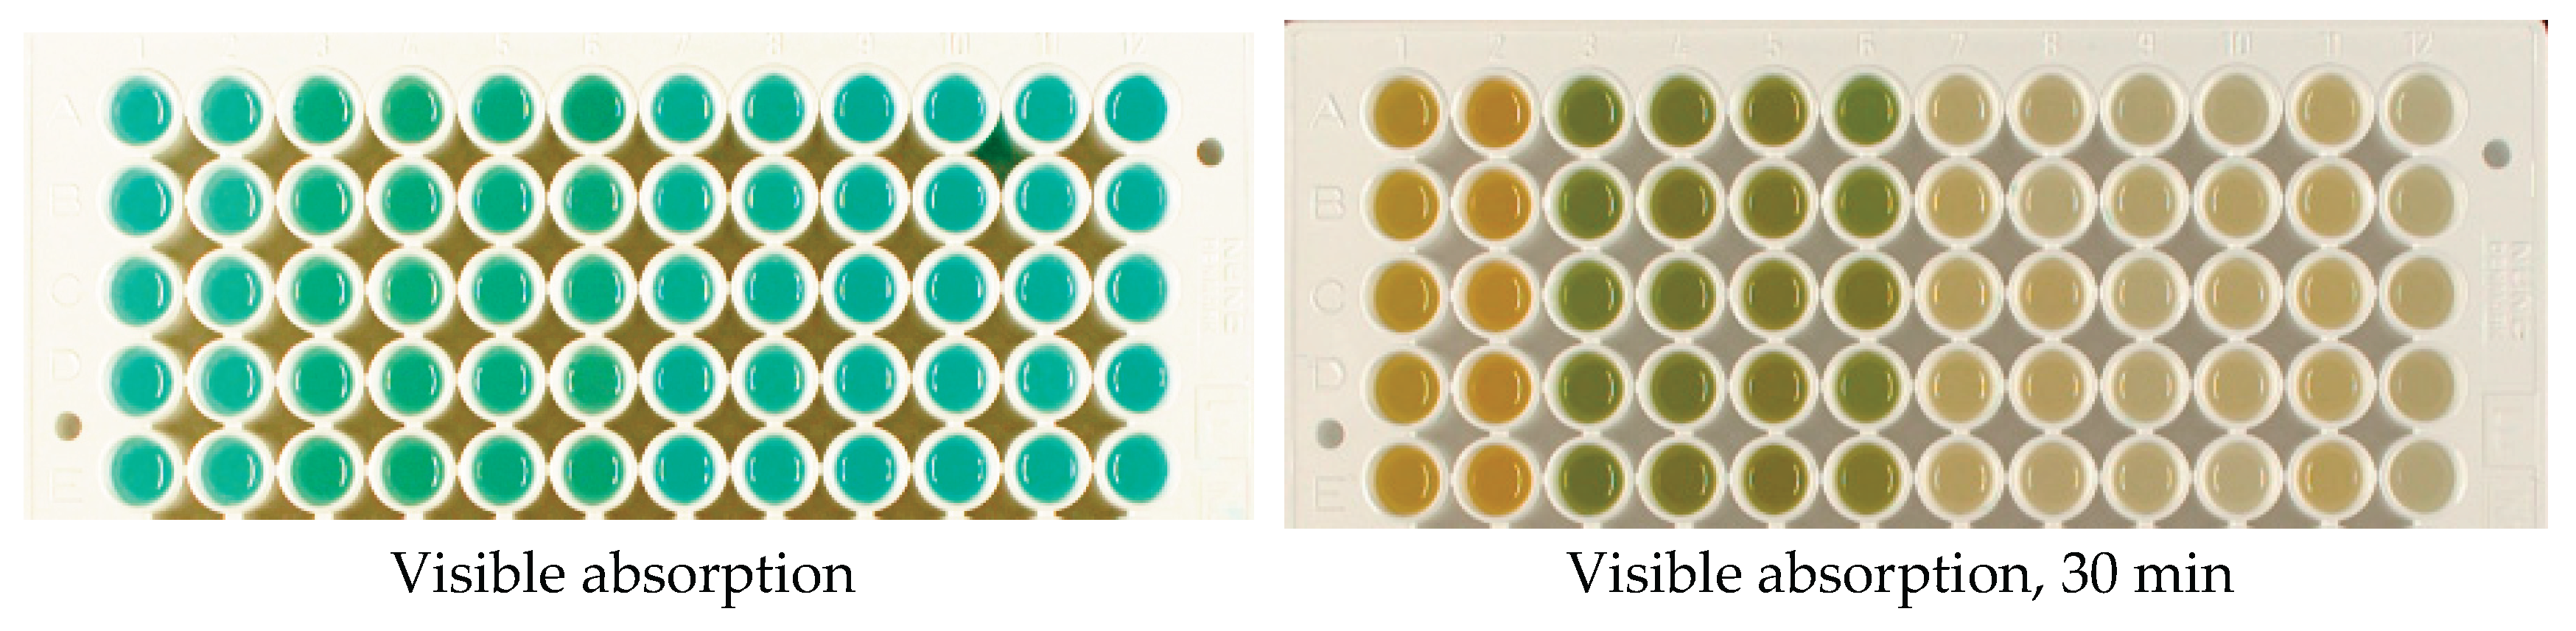
Figure 3.
Time curves of the fluorescence intensity of the reaction mixtures in the near-IR range on the 0th (a,d), 2nd (b,e) and 6th (c,f) day for potato samples of the Lina (a–c) and Agata (d–e) varieties.
Figure 3.
Time curves of the fluorescence intensity of the reaction mixtures in the near-IR range on the 0th (a,d), 2nd (b,e) and 6th (c,f) day for potato samples of the Lina (a–c) and Agata (d–e) varieties.
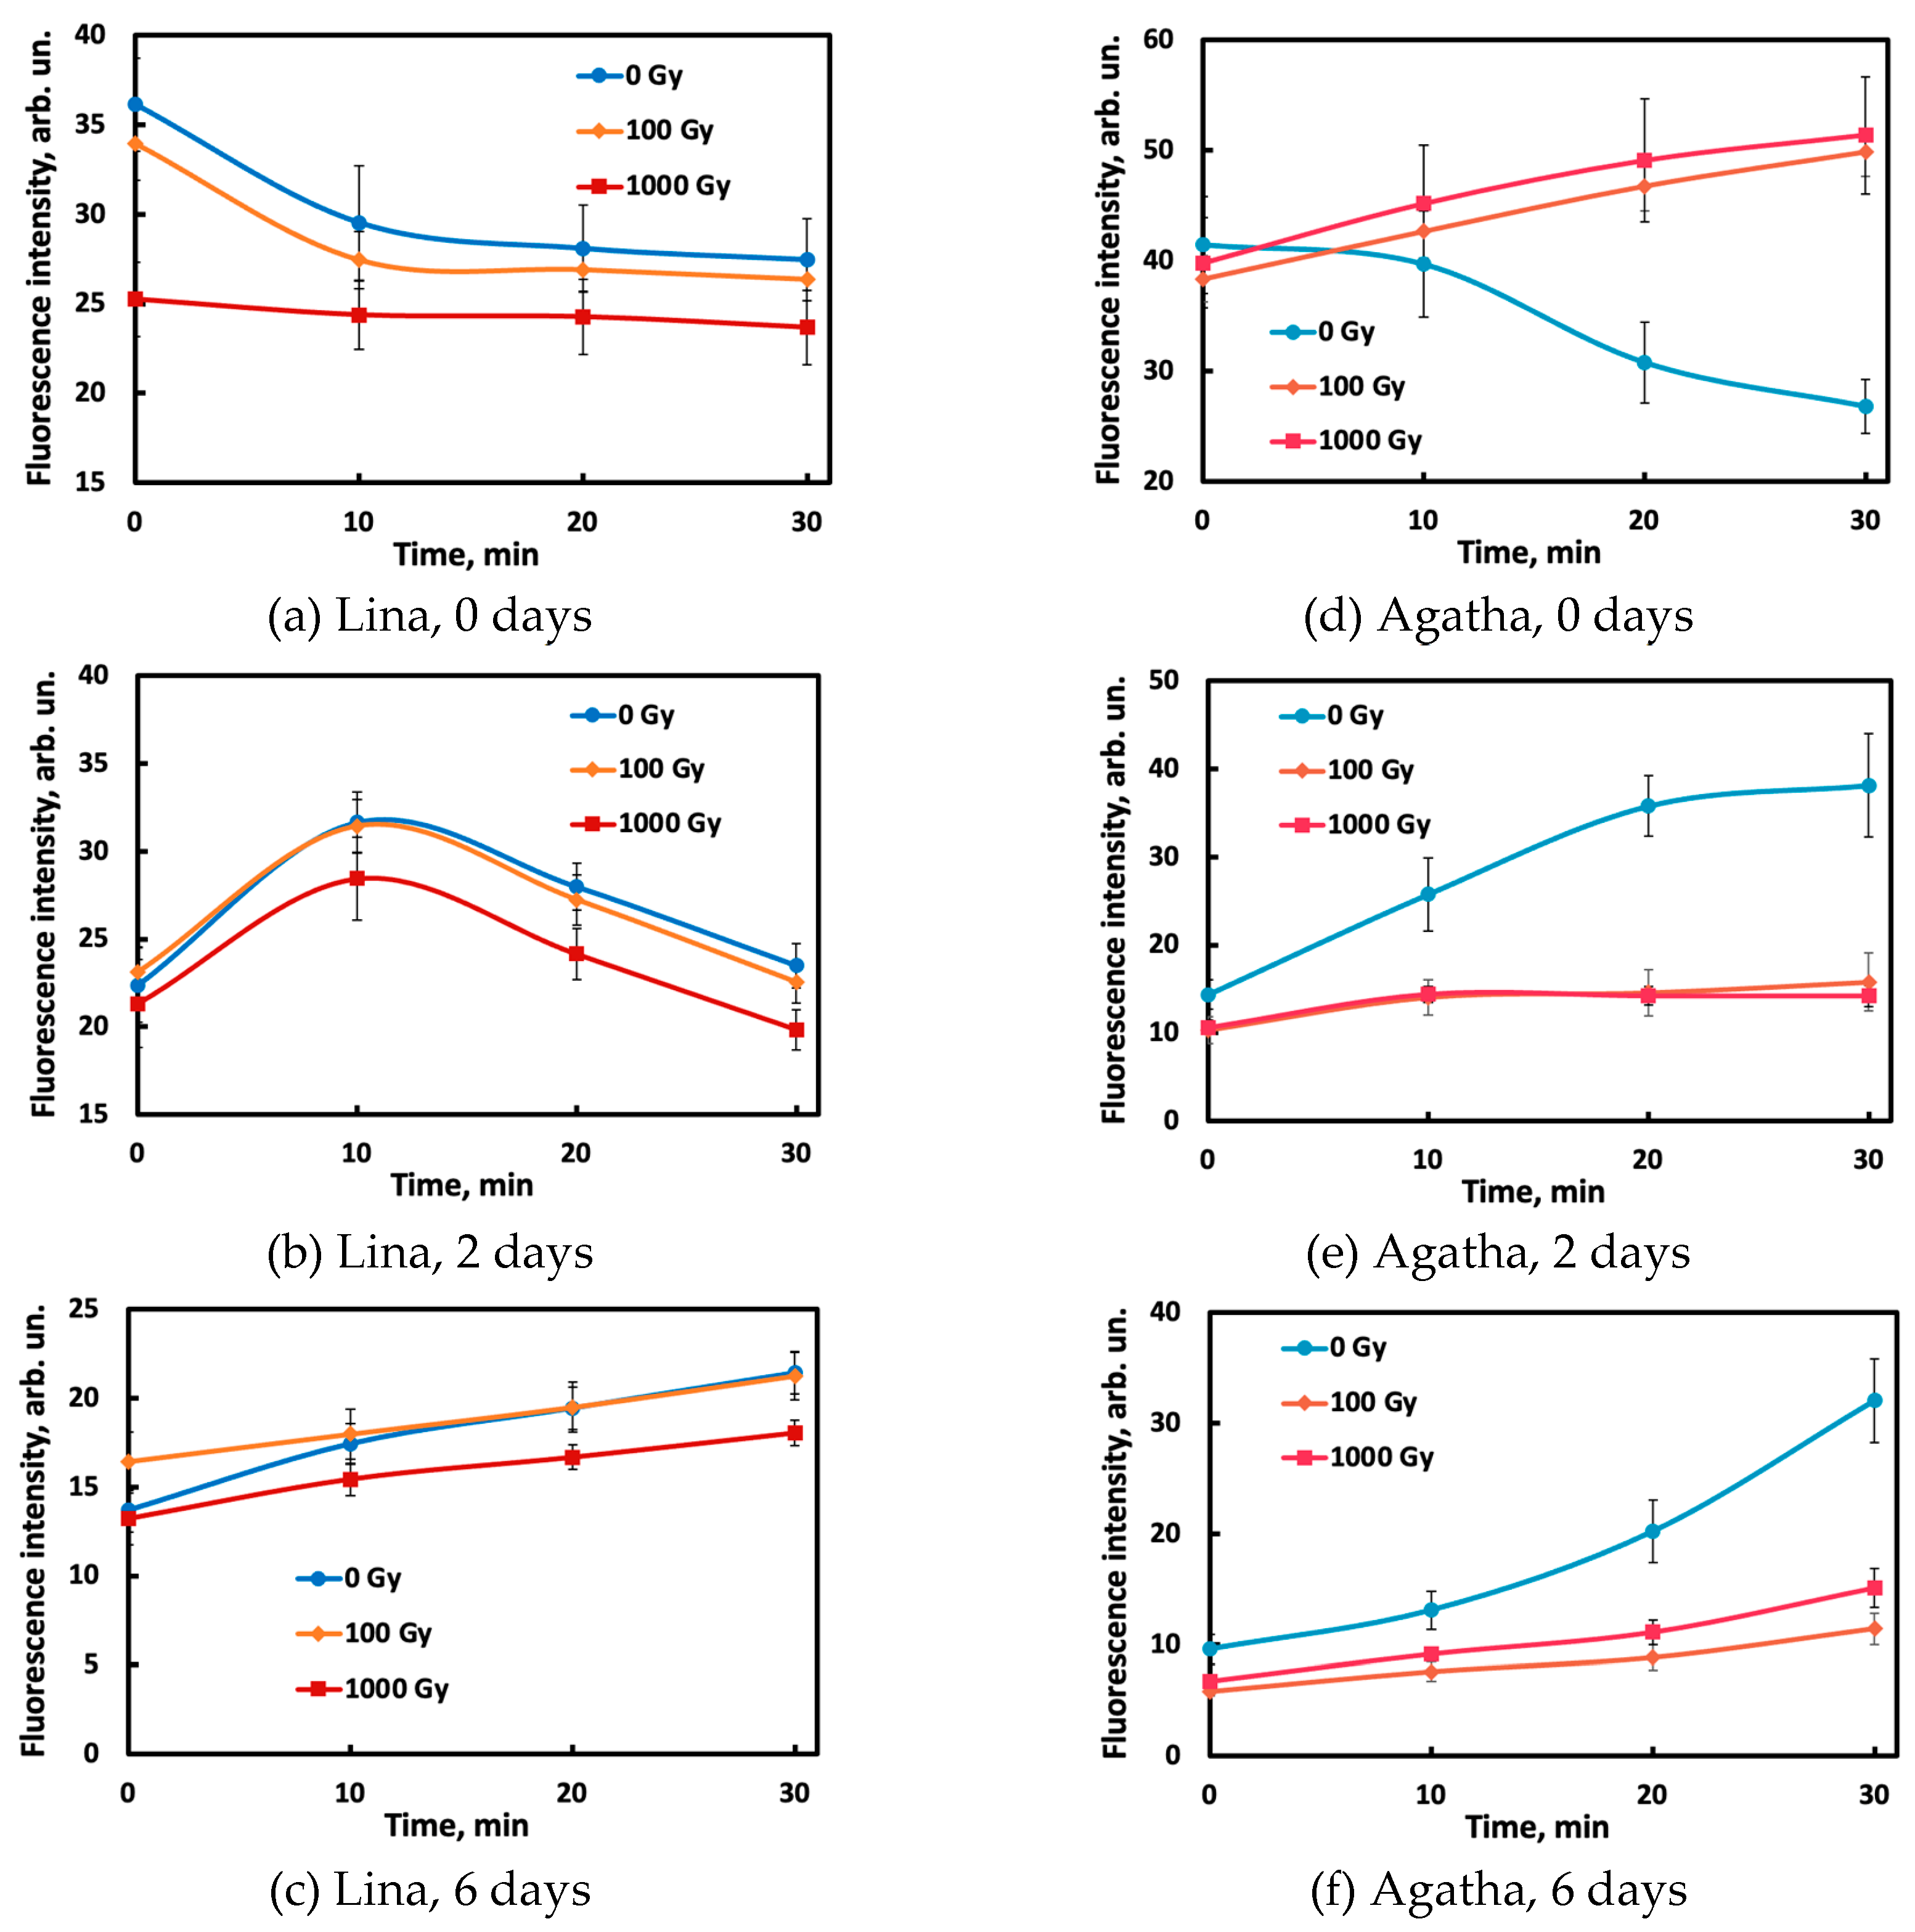
Figure 4.
Principal component analysis (PCA) score plots for 0th (a, d), 2nd (b, e) and 6th (c, f) day for potato samples of the Lina (a–c) and Agata (d–e) varieties.
Figure 4.
Principal component analysis (PCA) score plots for 0th (a, d), 2nd (b, e) and 6th (c, f) day for potato samples of the Lina (a–c) and Agata (d–e) varieties.
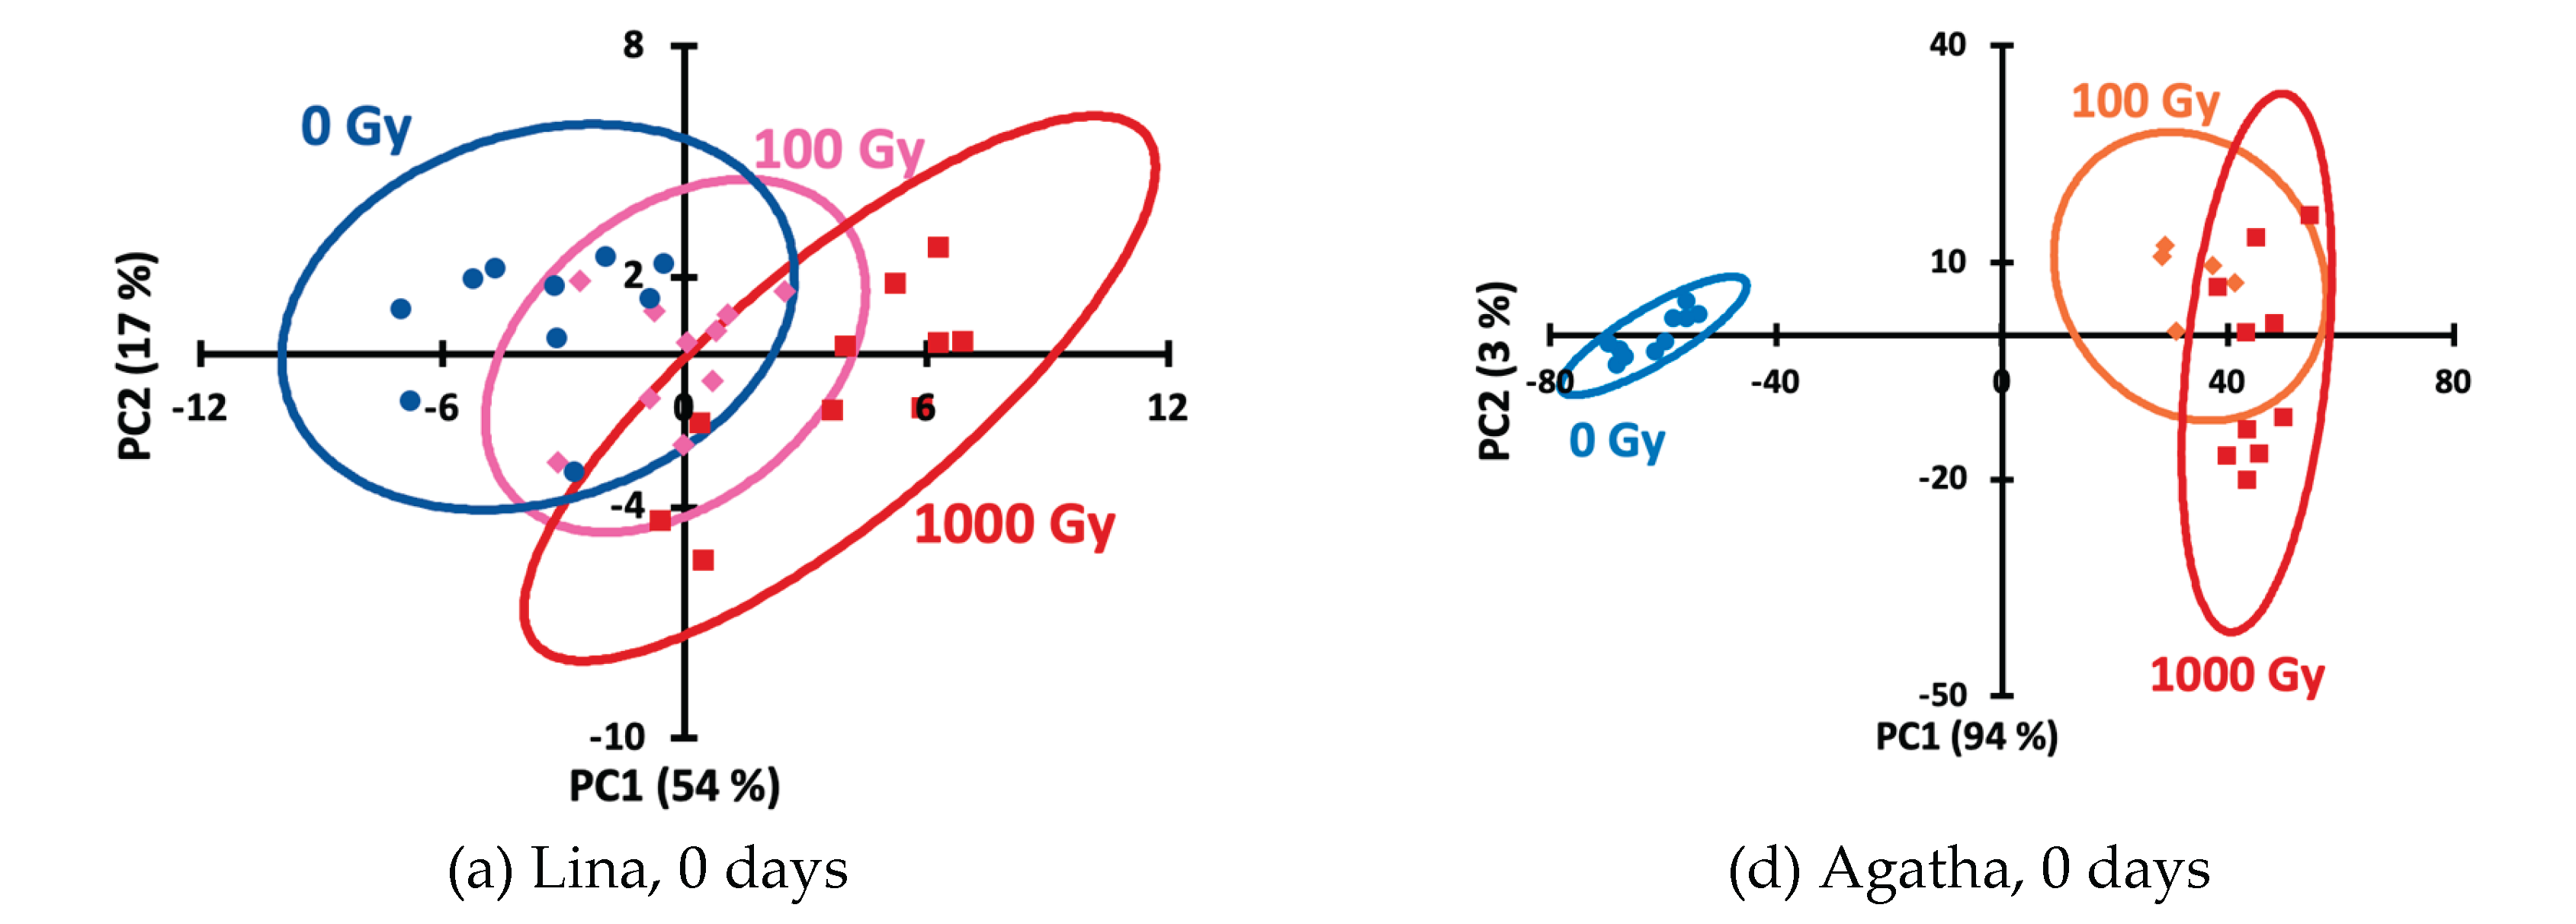
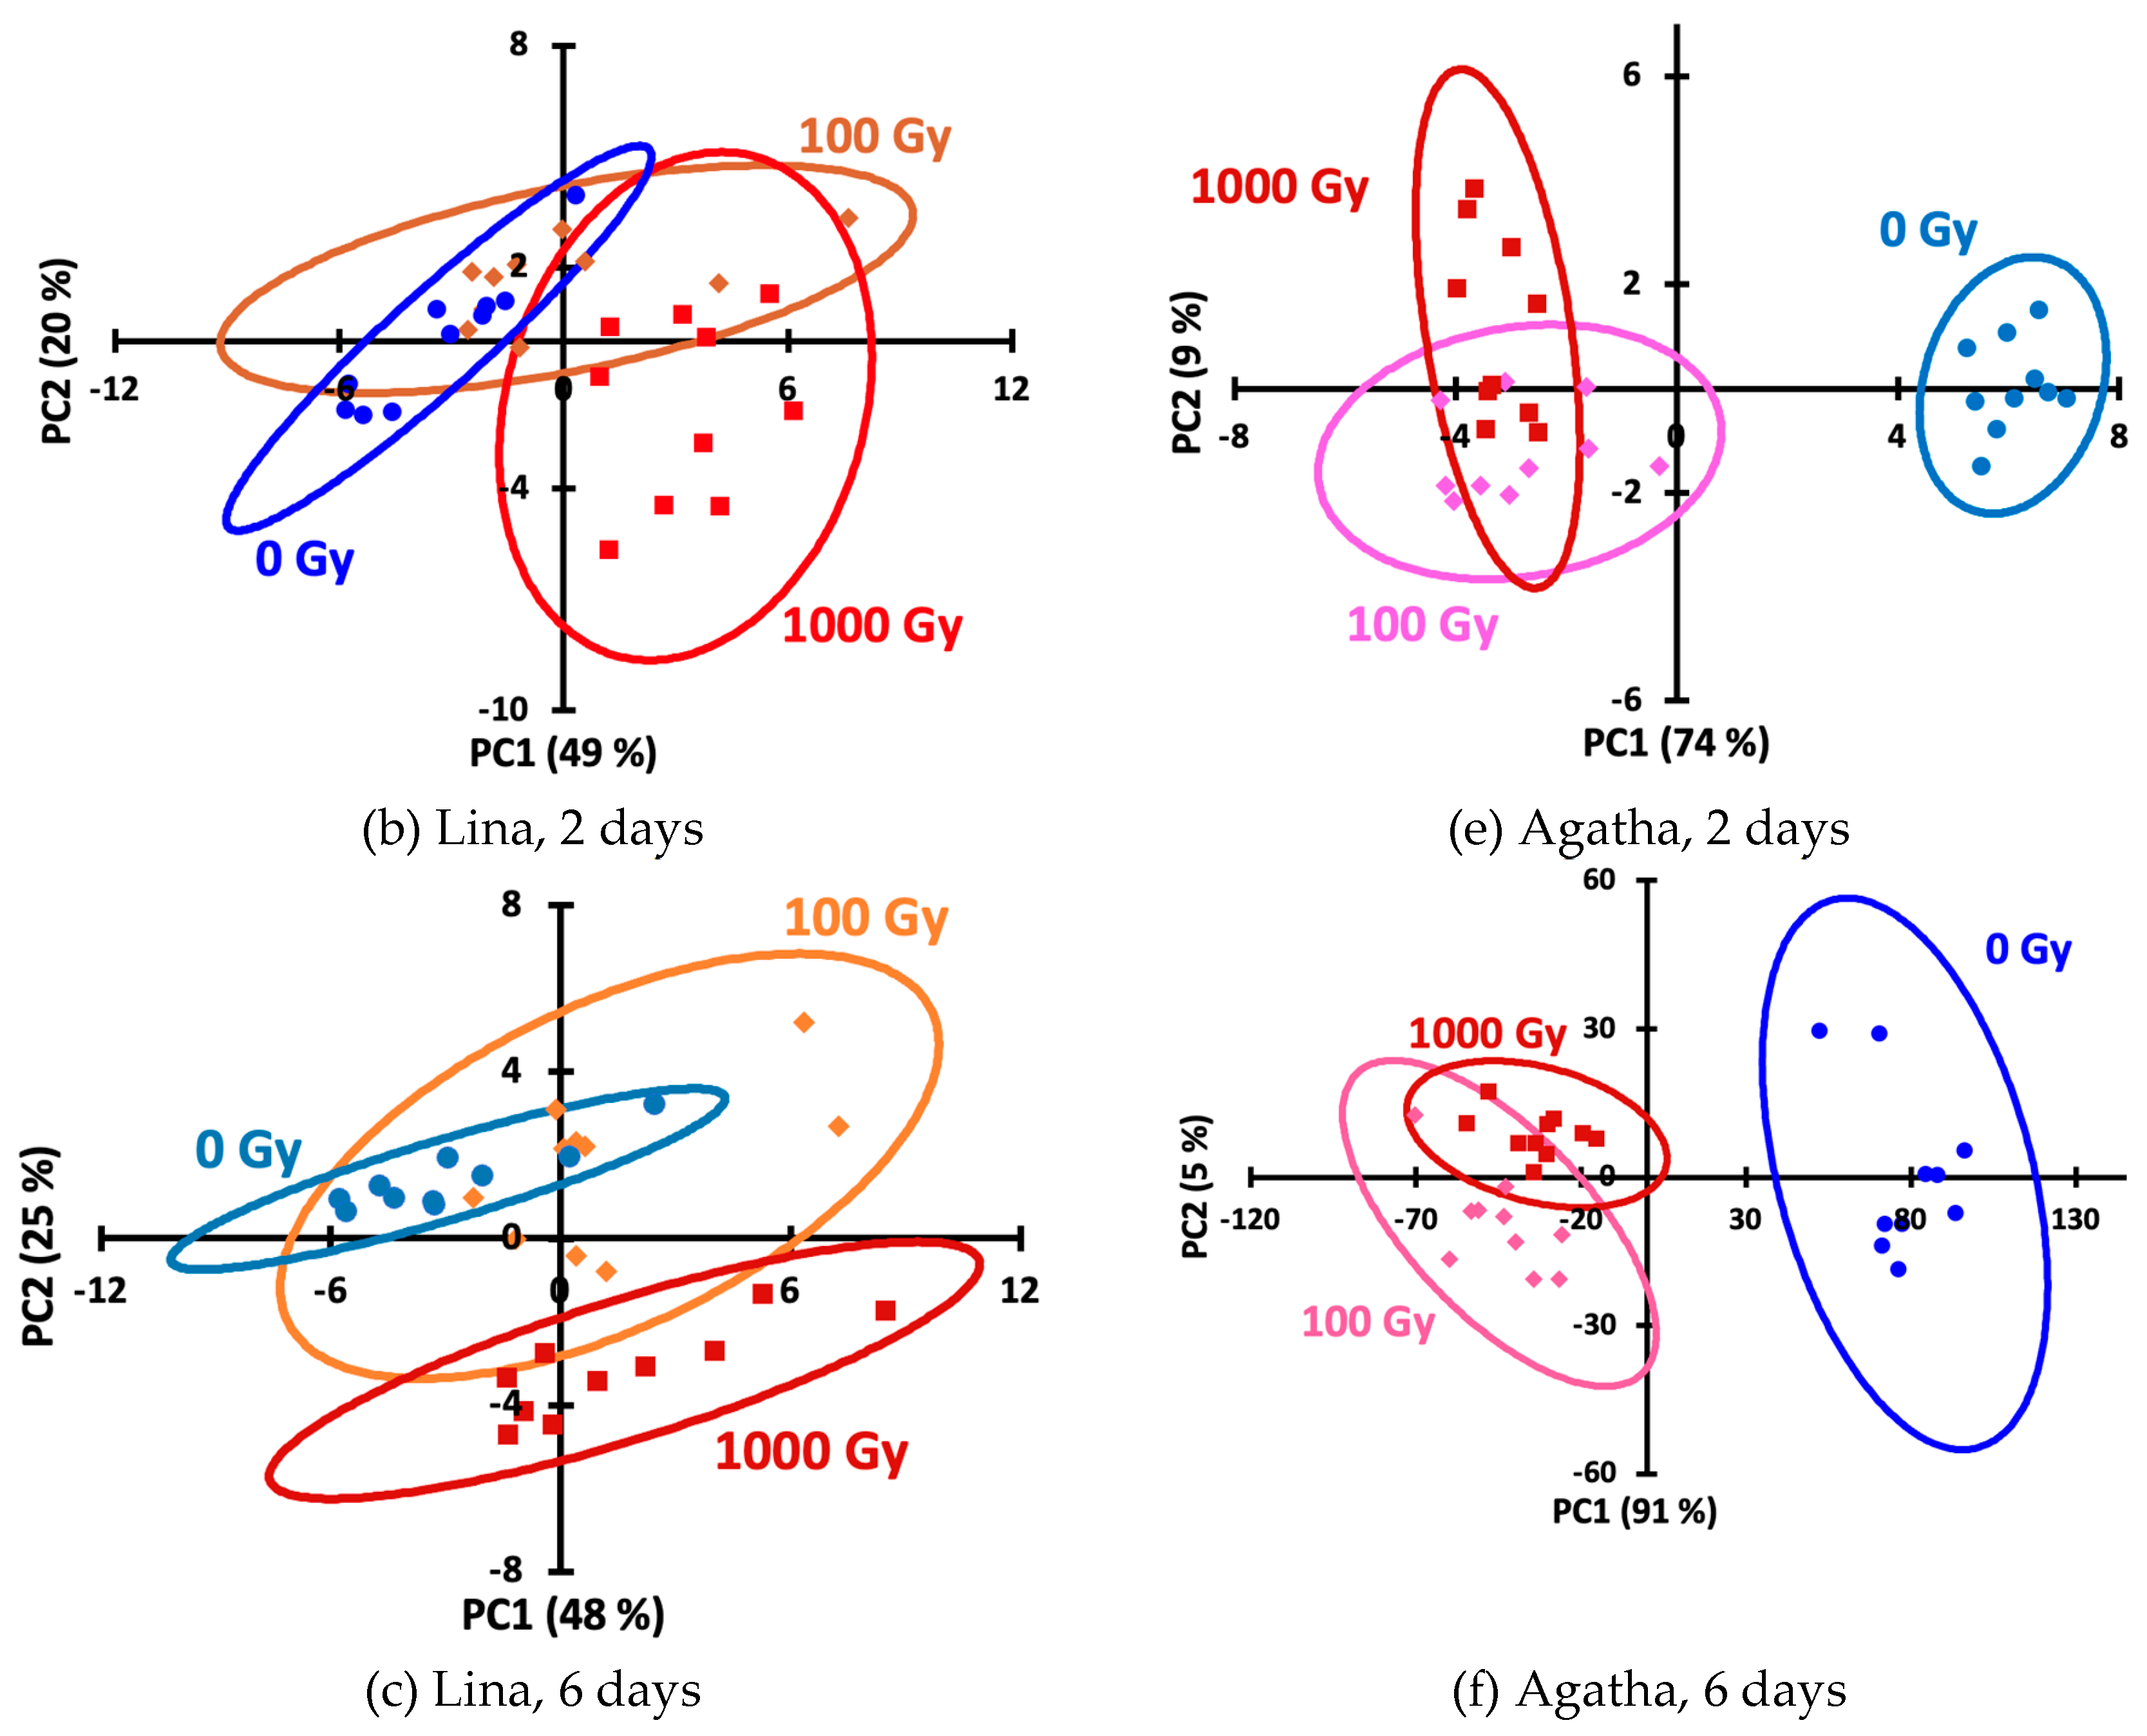
Figure 5.
LDA score plots for days 0 (a,d), 2 (b,e) and 6 (c,f) for Lina (a–c) and Agatha (d–f) variety samples.
Figure 5.
LDA score plots for days 0 (a,d), 2 (b,e) and 6 (c,f) for Lina (a–c) and Agatha (d–f) variety samples.
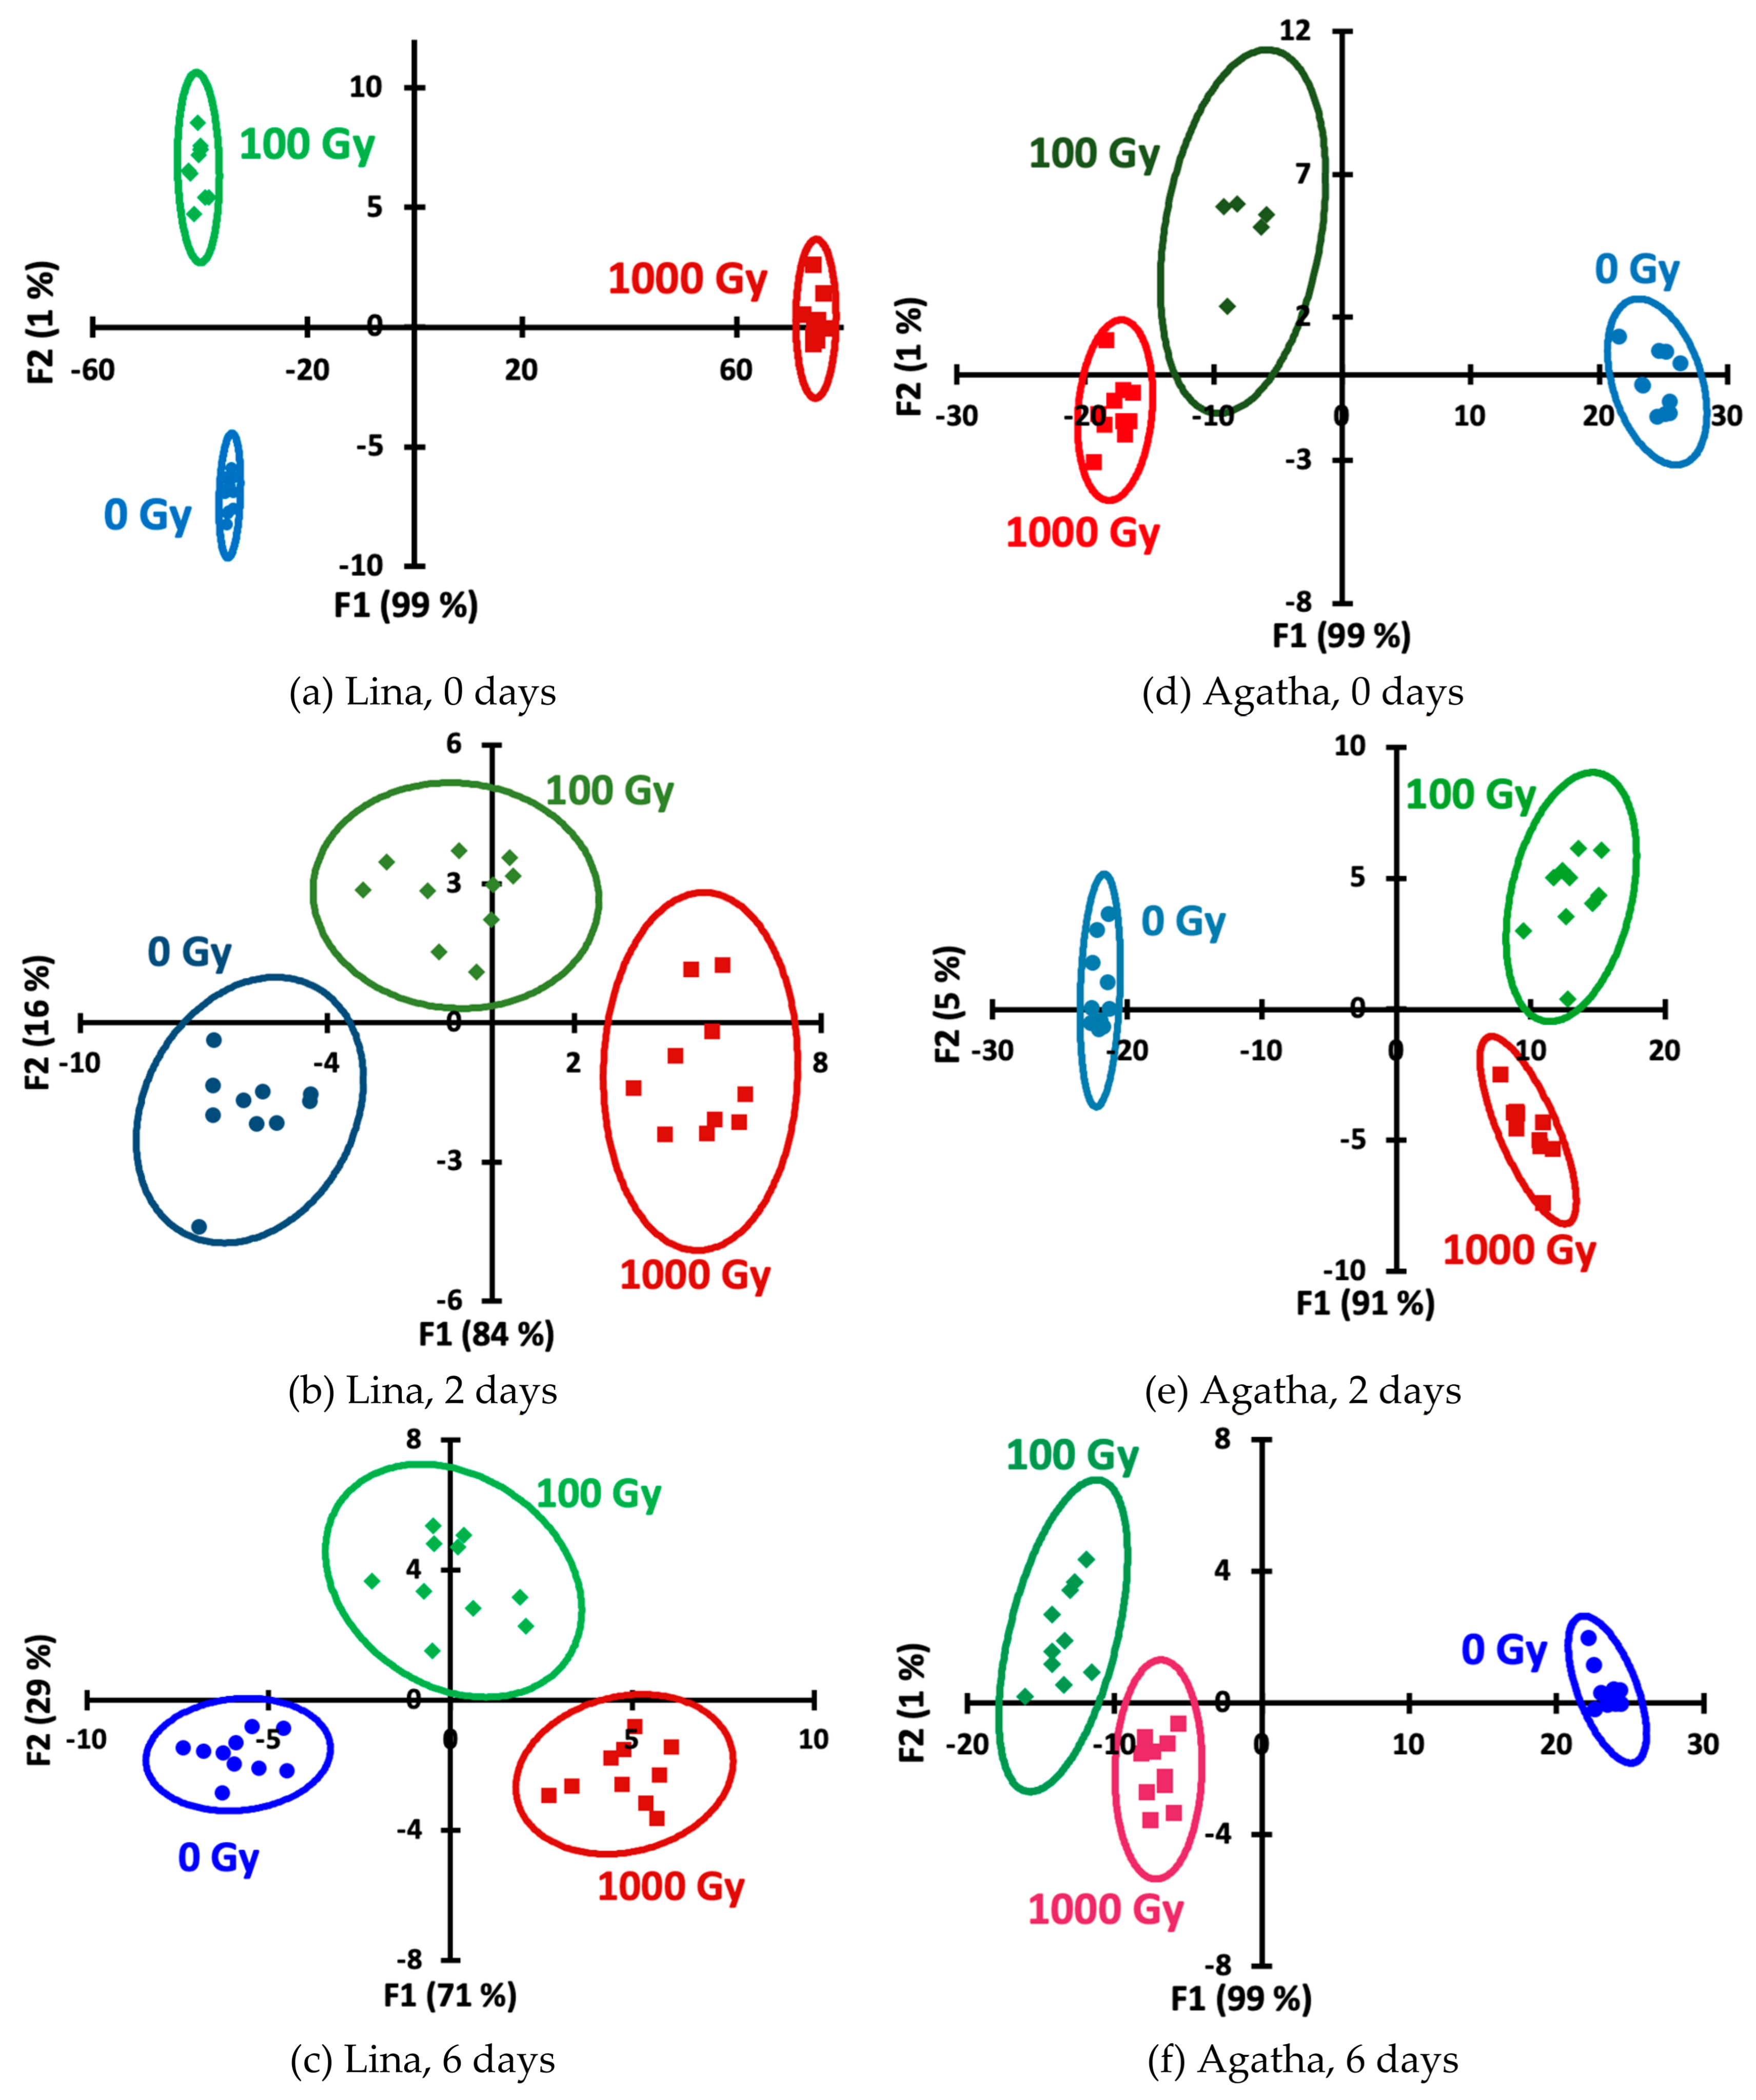

Table 1.
Sample irradiation time and dose.
| Sample | Irradiation time, s | Calculated dose, Gy |
|---|---|---|
| C1, …, C6 | 0 | 0 |
| D1-1, …, D1-6 | 110 | 100 |
| D2-1, …, D2-6 | 920 | 1000 |
Table 2.
Accuracy of recognition (%) of three doses (0, 100 and 1000 Gy) in potato tubers for various storage time, obtained by two chemometric techniques, SR and LDA.
Table 2.
Accuracy of recognition (%) of three doses (0, 100 and 1000 Gy) in potato tubers for various storage time, obtained by two chemometric techniques, SR and LDA.
| Storage day | Using full reaction set (26 data columns) |
Using only the redox reaction (20 data columns) |
||
|---|---|---|---|---|
| SR | LDA | SR | LDA | |
| Lina variety | ||||
| 0 | 93 | 90 | 87 | 70 |
| 2 | 87 | 80 | 93 | 77 |
| 6 | 97 | 63 | 83 | 70 |
| Agatha variety | ||||
| 0 | 100 | 100 | 83 | 63 |
| 2 | 93 | 96 | 93 | 80 |
| 6 | 100 | 97 | 97 | 80 |
Note. Accuracy (%) was calculated as the ratio of the number of correctly assigned observations in the validation set to the total number of observations in it. Values exceeding 90% are shown in bold.
Table 3.
Discrimination accuracy (%) between non-irradiated and irradiated potato samples using two indicator reactions for various storage periods, obtained by three chemometric techniques.
Table 3.
Discrimination accuracy (%) between non-irradiated and irradiated potato samples using two indicator reactions for various storage periods, obtained by three chemometric techniques.
| Day of storage | Cross-validation type | |||||
|---|---|---|---|---|---|---|
| random | k-fold | |||||
| SR | LDA | PLS-DA | SR | LDA | PLS-DA | |
| Lina variety | ||||||
| 0 | 87 | 87 | 100 | 73 | 50 | 80 |
| 2 | 97 | 87 | 100 | 90 | 60 | 80 |
| 6 | 97 | 80 | 100 | 90 | 67 | 100 |
| Agatha variety | ||||||
| 0 | 100 | 100 | 100 | 100 | 100 | 100 |
| 2 | 100 | 100 | 100 | 100 | 100 | 100 |
| 6 | 100 | 93 | 100 | 100 | 100 | 100 |
Note. Accuracy values greater than 90% are shown in bold.
Table 4.
Accuracy of recognition (%) of three doses (0, 100 and 1000 Gy) in potato tubers using full reaction set for various storage time obtained by k-fold cross-validation.
Table 4.
Accuracy of recognition (%) of three doses (0, 100 and 1000 Gy) in potato tubers using full reaction set for various storage time obtained by k-fold cross-validation.
| Storage day | Chemometric technique | |
|---|---|---|
| SR | LDA | |
| Lina variety | ||
| 0 | 60 | 43 |
| 2 | 63 | 53 |
| 6 | 97 | 57 |
| Agatha variety | ||
| 0 | 60* | 100 * |
| 2 | 77 | 53 |
| 6 | 77 | 97 |
* Outliers in visible light photograph intensities for the Agatha 100-Gy sample on day 0 were excluded from the data. For this reason, no k-fold cross-validation was possible with this dose for day 0, and the accuracy values were calculated for 1 kGy and control tubers only.
Disclaimer/Publisher’s Note: The statements, opinions and data contained in all publications are solely those of the individual author(s) and contributor(s) and not of MDPI and/or the editor(s). MDPI and/or the editor(s) disclaim responsibility for any injury to people or property resulting from any ideas, methods, instructions or products referred to in the content. |
© 2025 by the authors. Licensee MDPI, Basel, Switzerland. This article is an open access article distributed under the terms and conditions of the Creative Commons Attribution (CC BY) license (http://creativecommons.org/licenses/by/4.0/).
Copyright: This open access article is published under a Creative Commons CC BY 4.0 license, which permit the free download, distribution, and reuse, provided that the author and preprint are cited in any reuse.


