
Submitted:
07 April 2025
Posted:
08 April 2025
You are already at the latest version
Abstract
The use of thermochromic pigments in food packaging offers several advantages, including improved food safety, waste reduction, and temperature change monitoring. However, little is known about how chemically resilient these materials are, especially regarding optical stability, thermochromic activation, and mechanical integrity following exposure to acidic, alkaline, oil-based, and neutral food-contact environments. This study evaluates the chemical resistance, thermal cycling effects, and mechanical durability of thermochromic pigments-polymer blends. Thermochromic polymer samples were subjected to multiple chemical environments, repeated thermal cycling, and mechanical analysis to assess degradation behavior. The findings show that virgin food-grade polymer with no thermochromic pigment sustains its performance stability throughout chemical exposure with little degradation. However, thermochromic polymer blends experienced reduced thermochromic functionality. This study offers insight into how well thermochromic pigment can be incorporated into intelligent food packaging despite the limitations associated with chemical exposure.
Keywords:
thermochromic pigments
; food packaging
; chemical resistance
; thermal cycling
; mechanical durability
1. Introduction
Assuring food safety and cutting down on waste are two challenges facing the food packaging industry today [1]. Unlike traditional passive materials, thermochromic pigments (TP) actively indicate temperature fluctuations, offering a real-time, cost-effective solution for food safety monitoring [2]. However, their long-term stability in food-contact conditions remains uncertain. This study evaluates TP chemical resistance, thermal stability, and mechanical durability for food packaging, addressing critical gaps in their real-world performance [3].
Traditional food packaging protects food from damage and helps preserve them until they are ready for consumption [4]. Packaging also displays branding and nutritional information while supporting marketing efforts [5]. Ancient packaging included using wooden parts, especially bamboo baskets, wooden containers, and jute sacks, for packaging fruits and vegetables [6]. Over the past few decades, petroleum-based polymer-generated plastic films have been used as a barrier to protect food products from heat, moisture, microorganisms, dust, and dirt particles [7]. These plastic films are cost-effective, lightweight, and convenient materials with excellent barrier properties, resistance to stress and corrosion, and excellent transport and handling capabilities [8,9].
The market for consumables made from plastic has grown significantly [10]. A compound annual growth rate (CAGR) of 7.5% is anticipated for 2025. This would amount to $1,621.51 billion in 2025, up from $1,508.6 billion in 2023 [11]. In Europe, packaging represents the most prominent application of plastic [12]. Approximately half of all plastic products utilized in the food industry, including cutlery, plastic bags, coatings, and packaging materials, are designed for single-use disposal [13]. Over 35 million tons of waste from various plastic products are produced yearly; unfortunately, only 7% are recycled [14].
The increasing demand for functional packaging has driven interest in innovative technologies that respond to environmental stimuli and provide real-time food quality indicators [15]. Smart materials are advanced versions of conventional materials that can be used in many applications across various sectors [16]. These advanced materials are widely used in sensors, coatings, biomedical devices, and adaptive textiles, where environmental responsiveness is essential [17,18,19,20]. Chromogenic materials offer various applications across various sectors because they can undergo reversible or irreversible color changes in response to stimuli such as temperature (thermochromic), light (photochromic), or electric fields (electrochromic) [21]. Thermochromism refers to the phenomenon of color change exhibited by chromic materials in response to variations in temperature [22]. This process occurs due to molecular rearrangements, phase transitions, or electron transfer within the material, leading to visible shifts in color [23]. Thermochromic materials are commonly adopted in smart textiles, food packaging, security printing, and medical indicators, where temperature-sensitive visual indicators are beneficial [24,25,26,27].
Intelligent and active packaging are the two main categories of smart packaging [28]. Intelligent packaging detects changes in food quality within the package using indicators, sensors, and radio frequency identification (RFID) tags, and communicates these changes through visual signals [29]. Active packaging extends a product's shelf life by incorporating absorption and diffusion systems designed to regulate substances such as oxygen, carbon dioxide, and hydroalcoholic solution [30]. Intelligent packaging has become increasingly popular in the modern packaging sector due to its added value, enhanced safety features, and greater potential for marketing and promotional strategy [31]. Driven by growing consumer demands for sustainability, enhanced product safety, and high-quality standards in all areas of the life sciences, the food industry has increasingly adopted intelligent packaging solutions [32,33]. The first notable discovery of thermochromism was documented in 1888 when Friedrich Reinitzer identified the phenomenon in liquid crystals [34].
Thermochromic materials, which are used in a range of industrial applications from food packaging to textiles, can be divided into groups according to their chemical makeup and activation processes [35,36,37]. The main attractiveness of polymer-based thermochromic systems is their broad compatibility with flexible packaging materials [35].
Despite their potential, concerns regarding the functionality of innovative polymer materials have been highlighted in various applications [36]. In food packaging, thermochromic materials are valued for their precise temperature sensitivity [37]; however, concern regarding the effects of repeated thermal cycling on the immediate functionality of thermochromic polymers, particularly their ability to maintain consistent color-changing properties, is evident [38,39]. For TP to endure physical stresses in food packaging without degrading, mechanical integrity is essential, but little is known about how susceptible they are to these forces [40]. The aesthetic quality of TP food packaging requires further investigation, particularly regarding the resistance to surface blemishes [41,42].
Chemical sensitivity is a crucial factor in assessing the performance of TP in food-contact environments, as certain substances can alter polymer structure, affecting color change or degradation [43,44]. Thermochromic polymers used in food packaging are frequently exposed to various chemical agents during their lifecycle, including oils, acids, solvents, alkaline, and food-related substances [45]. Solutions may interact with packaging materials, potentially compromising their structural integrity, appearance, and functional properties and potentially affecting the functionality of thermochromic polymers [46]. Several studies have dealt with thermochromic inks’ low-light fastness issues [47,48,49]. However, research on the chemical resistance of thermochromic plastics in food packaging remains largely underexplored [50].
This study aims to evaluate thermochromic polymers' chemical resistance, thermal cycling effects, and mechanical stability in simulated food-contact environments, addressing existing knowledge gaps.
The specific objectives of this study are:
- To assess thermochromic polymers’ optical stability and thermochromic activation before and after exposure to solutions representative of food-contact environments.
- To determine the impact of repeated thermal cycling on thermochromic behavior post-chemical exposure.
- To review mechanical integrity post-chemical exposure.
This research explores the feasibility of thermochromic polymers for commercial food packaging, seeking to develop durable, chemically stable, and reliable intelligent packaging solutions. By bridging the gap between thermochromic material development and real-world applications, manufacturers can optimize formulations for enhanced environmental resistance and integration into next-generation smart packaging solutions.
2. Materials and Methods
2.1. Materials
Avenue Moulds Solutions Limited (Sligo, Ireland) provided a commercially available food-grade high-density polyethylene (HDPE) (Borealis MG7547S, Vienna, Austria). The material had a density of 0.954 g/cm3 and a melt flow rate (MFR) of 4 g/10 min (190 °C/2.16 kg load). Furthermore, the manufacturer verified the material as appropriate for food contact applications.
Pellets of TP (ThermoBatchTM), which has a reversible temperature transition of 38 °C, were supplied by SpotSee®/LCR Hallcrest Ltd (Chester, UK). The density was 0.508 g/cm3 with an MFI of 15–40 g/10 min. Unless stated otherwise, all testing was carried out at 23 °C ± 2 °C following ISO 527-2:2012 [51], ISO 179-1:2023 [52], and other applicable standards. Results from tensile, impact, and other property evaluations were ensured to be consistent and repeatable under these circumstances.
2.2. Blend Preparation
To achieve homogeneity, binary mixes of TP as the additive and HDPE as the matrix were manually dry-mixed by tumbling in a sealed polyethylene bag for five minutes. The weight of each blend was 2 kg. The components were precisely weighed using a Sartorius LA230P analytical balance with a precision of ±0.0001 g (Sartorius, Dublin, Ireland). A suitable polymeric carrier miscible with the HDPE matrix was present in the green-colored concentrate ThermoBatchTM. To guarantee consistent findings, the samples were conditioned at 23 °C for 24 hours prior to testing after blending. Table 1 displays the mix compositions created for this study.
2.3. Injection Molding
Injection molding is a molding technique that uses an external heating device and a screw to melt the material, which is then injected into a mold to create the desired part while the mold cools [53]. Following ISO 294-1: 2017 [54], injection molding was performed. An Arburg Allrounder 370E 600 E drive injection molding machine (Arburg, Lossburg, Germany) was used to process the blends, as shown in Table 1. Two tensile (type B1) and two impact (type A1) test specimens were produced by the machine using a "two by two" family mold with a double-T runner. The Arburg machine featured a maximum calculated stroke volume of 85 cm3, a maximum clamping force of 600 kN, and a screw diameter of 30 mm. Four temperature controllers controlled the temperature distribution along the barrel, while a fifth controller was used to control the temperature of the nozzle. Starting at 170 °C at the hopper, the temperature profile gradually rose to 210 °C at the nozzle. With an injection pressure of 750 bar, an injection speed of 80 mm/s, and a holding pressure of 400 bar, a cooling duration of 35 s was implemented. A Piovan Technologies THM 120/EN temperature control unit (JL Goor, Wicklow, Ireland) was used to keep the mold at a consistent 30 °C. The shot size of the mold was 52 g. For every blend formulation shown in Table 1, tensile test specimens (ISO 527-2: 2012 specimen type 1BA [51]) were molded. Charpy impact test specimens were also created on the same mold and, when necessary, notched with a Type A V-notch (ISO 179-1 2023: specimen type A1, direction of blow edgewise [52]).
2.4. Chemical Resistance Testing Solutions
To evaluate the chemical resistance of the thermochromic polymer blends, each blend was exposed to a series of solutions representing different food-contact environments. The solutions were selected to simulate real-world exposure scenarios across a broad pH spectrum (2.3–12.5), including acidic, neutral, solvent-based, oil-based, and alkaline conditions.
The pH of each solution was measured using an Orion Model 410a Lab Professional pH meter paired with a Hanna HI 1110B combination pH electrode (Thermofisher Scientific, Leicestershire, England). Before testing, the pH meter was calibrated with standard buffer solutions at pH 4, 7, and 10. The measured pH values were recorded to ensure consistency, and periodic monitoring confirmed that no significant pH drift occurred during exposure.
The solutions tested represented a variety of food-contact conditions. Acidic conditions were simulated using lemon juice (pH 2.3) and orange juice (measured pH 3.8) to replicate highly acidic beverages and fruit-based products. As a baseline reference, neutral conditions were evaluated using tap water (pH 7.0). A 40% hydroalcoholic solution, prepared by diluting ethanol in deionized water (pH 7.2), was used to mimic solvent-based environments typical of alcohol-containing food products. Oil-based conditions were evaluated using vegetable oil (non-aqueous; no pH value) to assess interactions with fatty food components. Alkaline conditions were simulated using a 5% bleach solution (measured pH 12.5) prepared by diluting commercial bleach in deionized water to assess material resistance in highly alkaline environments.
Each thermochromic polymer blend (HDPE100/TP0, HDPE98/TP2, and HDPE92/TP8) was fully submerged in 3 L of the test solution for 24, 48, and 72 hours to simulate both short-term and prolonged exposure. Due to vessel interactions, non-reactive Pyrex® borosilicate glass containers prevented contamination or unintended pH fluctuations. Table 2 summarizes the test solutions, concentrations, measured pH values, and the exposure time durations.
Following exposure, the samples were gently blotted with lint-free absorbent paper and left to air dry under monitored temperature conditions (23 ± 2 °C) in a controlled laboratory environment for 24 hours before subsequent analysis.
2.5. Visual and Spectrophotometric Color Analysis
Spectrophotometry is a method used to measure the interaction of light with materials [55]. The chromatic characteristics and color stability of thermochromic materials exposed to multiple solutions were examined using a portable, handheld sphere spectrophotometer (X-Rite SP62, Grand Rapids, Michigan, USA). The spectrophotometer was calibrated with a white tile and a zero tile in sequence before taking the measurements following the SP60 Series Spectrophotometer user instructions. The color results were presented using the Commission International de l’Eclairage (CIE) chromaticity coordinate system (L*, a*, b*) [56].
In this system, the L* value represents the luminance between black and white and ranges from 0 (black) to 100 (white) [57]. The a* and b* parameters represent chromaticity without specific numerical limits. Negative a* values correspond to green, while positive a* values correspond to red. Similarly, negative b* values correspond to blue, and positive b* values to yellow [58]. The differences (ΔL*, Δa*, and Δb*) indicate the variation between the sample and standard in L*, a*, and b* values [59]. In addition, the total color difference (ΔE*ab) was calculated using Equation (1).
where
is the color difference between two colors;
is the difference in lightness between the two colors;
is the difference in the red-green axis;
is the difference in the yellow-blue axis.
The color coordinates L*, a*, and b* were recorded according to ISO/CIE 11664-4: 2019 [60] using Oncolor™ (v.6.3.4.4 QC-Lite) software. Five replicates were obtained for each group of samples, and the corresponding means and standard deviations were calculated. This coordinate made it possible to determine the color difference associated with the test specimens. The color difference, represented by the distance metric ∆E*ab, was obtained using Equation (1) by comparing the color coordinates of the chemically exposed samples with those of the unexposed food-grade material samples, which served as a reference.
2.6. SEM Analysis
Scanning Electron Microscopy (SEM) is a characterization technique for obtaining high-resolution surface topography of test specimens [61]. SEM is a technique that uses a focused electron beam to scan the surface of a specimen, enabling detailed morphological analysis in three dimensions [62].
Fractured injection-molded impact bars were analyzed using a Tescan Mira SEM (Oxford Instruments, Cambridge, UK) to examine external surface topography and internal fracture morphology. Before imaging, samples were affixed to adhesive conductive tape on aluminum stubs. A gold coating was applied using a Baltec SCD 005 sputter coater (BAL-TEC GmbH, Schalksmühle, Germany) to enhance surface conductivity and optical contrast.
SEM imaging was conducted at 100× magnification to assess surface defects, microcracks, and pigment distribution after subjecting samples to six test solutions. This study emphasized the effects of stress concentration and TP dispersion.
2.7. Moisture Content Analysis
Moisture content testing is crucial in various industries, including food, to ensure product quality, stability, safety, as well as prevent microbial growth, extend shelf life, and maintain material integrity [63,64,65]. In the food sector, controlling moisture is essential to prevent microbial growth, extend shelf life, and maintain material integrity. In this study, moisture content was measured to assess potential material degradation, hygroscopic behavior, and the impact of chemical exposure on thermochromic polymer blends.
A Rolbatch RBMB-210 Moisture Meter (Mettler-Toledo, Ohio, USA) with a measurement resolution of ±0.001 g was used to determine the moisture content of test materials. Accurate evaluation of moisture absorption and retention was made possible by the moisture meter's integrated halogen lamp, which was adjusted to a drying temperature of 120 °C.
To accommodate the moisture analyzer's disposable pan, impact test specimens were granulated using a Rapid 150-21 series rotary granulator (Rapid Granulator, Bredaryd, Sweden). Granules weighing 4 g were placed into the moisture analyzer's disposable pan.
Five replicate specimens were evaluated for each solution to produce statistically significant results.
2.8. Mass Stability
Mass measurements taken prior to testing specimens demonstrate that the mechanical properties are consistent and comparable between tests [66]. To guarantee the comparability of mechanical properties across various solutions, the mass of tensile test specimens was determined using a Mettler TG50 Thermobalance (Mettler-Toledo, Ohio, USA), with a precision of ±0.0001mg. These analyses helped identify potential mass variations resulting from material degradation, leaching, or uptake of solution components during chemical exposure [67,68,69].
2.9. Thermal Cycling
Depending on their chemical makeup, formulation, and intended use, thermochromic polymers exhibit a wide range of transition temperature ranges [70]. Their thermal and optical characteristics were assessed before and after chemical exposure using temperature-controlled reflectance spectroscopy. The experimental setup included a digitally controlled temperature-regulated hotplate (Fisherbrand™ AREX 5, ±0.5 °C accuracy) with a Pt100 external temperature probe (Fisher Scientific Ireland Limited, Dublin, Ireland) to ensure precise and uniform heating and minimize temperature fluctuations that could affect thermochromic activation.
A handheld portable UV-Vis spectrophotometer (Konica Minolta CM-700d, Konica Minolta, Warrington, England) equipped with an integrating sphere was used to quantify reflectance changes as a function of temperature. Color stability testing was conducted on HDPE100/TP0, HDPE98/TP2, and HDPE92/TP8 tensile specimens before and after chemical exposure to assess whether chemical interactions altered thermochromic activation behavior.
To simulate real-world temperature fluctuations, specimens underwent 100 cyclic heating-cooling cycles. In each cycle, the temperature was raised from 23 °C to 50 °C degrees Celsius and then passively cooled to room temperature. Each specimen's surface temperature was tracked in real time by a thermocouple placed in the middle of the sample.
Potential changes in activation temperature brought on by chemical exposure and repetitive thermal cycling were assessed using the manufacturer's stated transition temperature (38 °C) as a guide. Surface temperatures were kept between 33 °C and 43 °C throughout the spectrophotometric examination to guarantee thorough and uniform color changes in every studied specimen. This range was selected to capture the start and finish of the thermochromic reaction while including the whole activation window and avoiding overheating that could result in deterioration.
Spectroscopic reflectance measurements were recorded at regular temperature intervals to quantify variations in optical properties during activation. A visual assessment was conducted before, during, and after thermal cycling to detect potential fading, irreversible color shifts, or degradation in pigment activation.
2.10. Tensile Testing
Tensile testing of polymers is used to evaluate a polymer’s mechanical properties by applying a controlled tensile (pulling) force until the sample breaks [56]. Tensile testing was performed on tensile specimens (specimen type 1BA) per ISO 527-2: 2012 [54] to evaluate the mechanical properties of the polymer blends post-chemical exposure. To evaluate the ductility and toughness of the samples, the analysis examined the maximum tensile stress, Young’s modulus, and tensile strain at break. In order to achieve statistical robustness, five replicate specimens per cycle were used to test each polymer blend, HDPE100/TP0, HDPE98/TP2, and HDPE92/TP8, which had been exposed to the chemical solutions.
The tensile test was conducted using an Instron 3400 tensile tester machine (Instron, Norwood, MA, United States), configured with a 4 kN load cell and Bluehill® software version 4.29 for data gathering. Five specimens, each measuring 170 mm in length, 10 ± 0.2 mm in width, and 4 ± 0.2 mm in thickness, were used to examine each sample. A grip gap of 25.4 mm was maintained to guarantee that the clamping of the samples was even. Measurement testing was carried out using a Mitutoyo Absolute CD-6-ASX caliper (BCS Calibration, Laois, Ireland). Tensile testing was performed at a 10 mm/min strain rate in steady-state conditions.
2.11. Charpy Impact Testing
The Charpy test is a standardized method for assessing a material's impact strength and toughness [71]. A pendulum hammer is released to strike the specimen, and the resulting impact energy is recorded [72]. Charpy impact testing was conducted on ten specimens following ISO 179-1: 2023 [52] using a calibrated CEAST Resil 6545 5.5 Series pendulum impact testing machine (Zwick Roell, Ulm, Germany). Notched and unnotched specimens were tested to evaluate the effect of chemical exposure on impact resistance.
Test specimens, with an average thickness of 12.72 mm (±0.04 mm), were prepared with a Type A V-shaped notch (2 mm depth) using a Zwick/Roell notch cutter (Zwick/Roell, Ulm, Germany). Impact testing was conducted using a 4 J hammer mounted on a swinging pendulum operating at an impact velocity of 2.9 m/s. Each specimen was horizontally centered, ensuring optimal notch alignment with the pendulum arm and positioning away from the impact direction.
The hammer arm was released from an elevated position and struck the specimen. Notched specimens fractured upon impact, whereas unnotched specimens remained intact. The subsequent downward motion of the weighted pendulum enabled the determination of the specimen's impact energy in joules.
The impact absorption energy of each sample was obtained from the impact tester display. The corresponding Charpy impact strength, acU, expressed in kilojoules per square meter (kJ/m2), was calculated for unnotched samples using Equation 2:
where:
Wc is the corrected energy, in joules, absorbed by breaking the test specimen;
h is the thickness, in millimeters, of the test specimen;
b is the width, in millimeters, of the test specimen.
The Charpy impact strength, acN, expressed in kilojoules per square meter (kJ/m2), was determined for the notched samples using the calculation presented in Equation 3:
Where :
Wc is the corrected energy, in joules, absorbed by breaking the test specimen;
h is the thickness, in millimeters, of the test specimen;
bN is the width, in millimeters, of the test specimen.
2.12. Statistical Analyses
For any research activity to reach quantitative conclusions, statistical analysis is necessary [73]. Quantitative analysis is made more rigorous and reliable using systematic and consistent data collection. All data points were kept in the dataset, and no outliers were removed. The sample size for each test was explicitly defined to ensure methodological transparency and reproducibility. Statistical analyses were performed using Minitab® 21.4.1 Statistical Software. Normality testing was carried out on each set of results to see whether to accept or reject the hypothesis and if there was a statistical difference in the results of the samples post-chemical resistance testing. A one-way analysis of variance (ANOVA) was performed for quintuplicate (n=5) and decuplicate (n=10) measurements, with results expressed as mean ± standard deviation. Post hoc comparisons were conducted using the Tukey method, and statistical significance was determined at p < 0.05, with a 95% confidence level. The conclusions considered statistical significance and practical relevance to ensure meaningful interpretation of the data.
3. Results
3.1. Visual and Spectrophotometric Color Analysis
Photographs were taken after samples had been exposed to the various test solutions at 0, 24, 48, and 72 hours to document color changes. Figure 1 and Figure 2 show that specimens exposed to lemon and orange juice exhibited progressive discoloration over time. By 72 hours, HDPE100/TP0 (white) showed minimal change, whereas HDPE98/TP2 and HDPE92/TP8 (green) displayed increasing lightening, with HDPE98/TP2 exhibiting the most significant shift. The loss of green hue suggests prolonged acid exposure degrades TP, indicating potential limitations for food packaging applications.
Figure 3 and Figure 4 illustrate the limited impact of tap water and hydroalcoholic solution on color stability. Throughout the 72-hour exposure, only minimal color change was observed in any formulation, suggesting that these solutions interact minimally with the polymer matrix and TP.
As shown in Figure 5, vegetable oil exposure resulted in slight fading of green shades in HDPE98/TP2 and HDPE92/TP8 by 72 hours. However, this effect was less pronounced than that observed with acidic solutions. The fading may be attributed to surface interactions [74], oil absorption [75], or changes in light reflection rather than pigment degradation [76].
Figure 6 demonstrates the most pronounced color fading in HDPE98/TP2 and HDPE92/TP8 after bleach solution exposure. By 72 hours, the green color had noticeably faded, indicating that bleach interacts with TP or the polymer matrix, leading to chemical oxidation or pigment breakdown [77]. HDPE100/TP0 showed little to no visible change, likely due to the absence of colorants in its formulation. The results confirm that oxidizing agents accelerate pigment degradation, affecting long-term material stability [78].
Table 3 presents the total color difference (ΔE*ab) for thermochromic polymer specimens subjected to different test solutions. The ΔE*ab values in Table 3 support the visual observations. HDPE100/TP0 exhibited minimal changes (ΔE*ab 0.11–1.89), while HDPE98/TP2 and HDPE92/TP8 displayed more noticeable color shifts (ΔE*ab 0.31–3.75), especially in response to acidic and oxidizing solutions. A one-way ANOVA was performed on ΔE*ab values at 24, 48, and 72 hours to assess whether the observed color differences over time were statistically significant within each solution and specimen group. The findings confirmed that extended exposure increases pigment degradation by showing substantial differences (p < 0.05) in HDPE92/TP8 samples exposed to acidic and oxidizing solutions, specifically HDPE92/TP8 in orange juice, bleach, and lemon juice.
3.2. SEM Analysis
SEM examination of the injection-molded bars’ fracture morphology and surface topography was conducted at 100× after exposure to various test substances for 0, 24, 48, and 72 hours. SEM analyses revealed minimal microstructural degradation in HDPE98/TP2 and HDPE92/TP8, while HDPE100/TP0 exhibited relatively stable morphology across all exposure conditions and time points.
As shown in Figure 7, HDPE100/TP0 exhibited minimal signs of degradation across all test substances exposures at 100× magnification. In longer-time exposure applications, the virgin polymer blend's structural stability was confirmed by the smooth fracture surfaces that showed no discernible microcracks or pigment clustering. Given its constant morphology, HDPE100/TP0 is a suitable choice for high-durability applications, suggesting that it maintains its mechanical integrity after exposure to various test substances.
In contrast, HDPE98/TP2 (Figure 8) displayed moderate degradation, with noticeable surface roughness and pigment clustering emerging after chemical exposure. Localized microcracks and roughened fracture edges were observed in orange juice, lemon juice, and bleach solution test specimens, suggesting early mechanical weakening.
The most severe degradation was seen in HDPE92/TP8 (Figure 9), which showed widespread cracking, pigment grouping, and roughness with the acidic and oxidizing agent environments. Brittle failure and mechanical instability resulted from the uneven dispersion of TP acting as stress concentration spots, speeding up the initiation and spread of cracks [79].
While the material remains suitable for limited-use applications, such as dry food packaging, outer packaging layers, and tamper-evident seals and caps, its potential embrittlement during food-contact chemical environments may reduce long-term structural performance.
3.3. Moisture Content Analysis
Table 4 summarizes the moisture content results for the polymer blends (HDPE100/TP0, HDPE98/TP2, and HDPE92/TP8) before and after exposure to test substances. The moisture content values represent the mean of five replicate specimens per test solutions exposure.
The control samples (HDPE100/TP0) showed low inherent moisture absorption while maintaining a constant moisture content. These moisture content findings support HDPE's hydrophobic properties, which prevent water absorption in typical circumstances.
Acidic solutions (lemon and orange juice) increased moisture content over time, with HDPE98/TP2 and HDPE92/TP8 absorbing more than HDPE100/TP0, likely due to acid-induced surface interactions, minor swelling, or increased roughness [80]. Tap water caused a moderate rise in moisture content, lower than acidic solutions, reinforcing the more significant permeability effect of acids [81]. Due to its low polarity, hydroalcoholic solution produced very little change in moisture content [82]. Vegetable oil showed little absorption, proving that non-polar substances do not help hydrophobic polymers absorb moisture [83]. Bleach solution increased moisture, especially in HDPE98/TP2 and HDPE92/TP8, possibly because of oxidative effects, although not as much as in acidic solutions. Materials' surface properties can be altered by oxidation, which may increase the materials' affinity for water and increase their capacity to absorb moisture [84]. While HDPE98/TP2 and HDPE92/TP8 showed somewhat higher absorption, HDPE100/TP0 retained the least moisture throughout all exposures, indicating that thermochromic masterbatch may have a minimal impact on moisture interaction.
A one-way ANOVA revealed a statistically significant effect of chemical exposure on the moisture content of HDPE92/TP8 after 72 h. Tukey's test indicated that samples exposed to orange juice, lemon juice, and bleach solution had significantly higher moisture uptake than the control, tap water, hydroalcoholic solution, and vegetable oil. These findings suggest acidic environments promote greater water absorption, likely due to polymer matrix interaction or surface degradation.
3.4. Mass Stability
Table 5 summarizes the mass measurements of tensile test specimens for the polymer blends (HDPE100/TP0, HDPE98/TP2, and HDPE92/TP8) across six test solutions. The mass values represent the mean of five replicate specimens per test solution.
The control samples for all three specimens maintained a consistent mass of 3.724 g, demonstrating no measurable weight change under standard conditions. Exposure to lemon juice, orange juice, and bleach solution resulted in a slight but noticeable increase in mass over time for HDPE98/TP2 and HDPE92/TP8, while HDPE100/TP0 showed less pronounced changes but was still present. This increase suggests that the acidic environment contributed to slight surface absorption or minor interactions with the TP, particularly in specimens containing higher pigment concentrations. The increase in mass aligns with moisture uptake results, reinforcing the idea that acidic solutions interact with the polymer matrix to a small extent.
Tap water showed modest mass gain, while hydroalcoholic solution and vegetable oil had negligible effects, reinforcing HDPE's hydrophobic nature. The stability of HDPE100/TP0 suggests minimal interaction with chemicals, while higher TP concentrations in HDPE98/TP2 and HDPE92/TP8 led to more significant variations. These trends align with moisture uptake data, confirming that acids and bleach solution induce the most noticeable changes, while hydroalcoholic solution and oil have minimal impact.
All specimens showed total mass increases, indicating that these thermochromic polymer blends maintain stability when exposed to different chemical environments. These findings point to possible appropriateness for uses where a small amount of mass loss is acceptable and exposure to chemical solutions is necessary.
A one-way ANOVA showed a statistically significant effect of chemical exposure on the mass of HDPE92/TP8 after 72 hours (p < 0.05). Tukey’s post hoc test indicated that samples exposed to orange juice, lemon juice, and bleach solution had significantly higher mass than the control, suggesting uptake due to surface interaction or fluid retention. In contrast, samples exposed to hydroalcoholic solution, tap water, and vegetable oil showed no significant difference from the control, indicating limited mass transfer or polymer interaction in non-polar or neutral environments. No significant differences were observed across polymer formulations, indicating that pigment concentration alone did not affect the extent of mass change. These findings suggest that environmental chemistry, rather than blend composition, primarily drives surface-level interactions that influence absorption.
3.4. Thermal Cycling
Table 6 presents the effect of one hundred thermal cycles on the activation temperature of three polymer blends (HDPE100/TP0, HDPE98/TP2, and HDPE92/TP8) before and after exposure to various test solutions.
Chemical exposure impacts the activation temperature of thermochromic polymers to differing degrees, depending on the type of solution (see Table 6). All control samples maintained their stability at 38.1 °C across all formulations, demonstrating the dependability of the thermochromic activation temperature.
Because acidic solutions, such as orange juice, break down the pigment [85] or polymer matrix [86] they generate the most noticeable drop in activation temperature (-4.2 °C). According to the idea that neutral aqueous solutions have little effect on the stability of polymers, tap water had little effect on HDPE92/TP8, causing only a -0.7 °C change [87].
After hydroalcoholic solution exposure, the activation temperature shifted (-0.9 °C), suggesting that minor polymer-pigment interactions or solvation effects may impact pigment performance. Since vegetable oil is non-polar, it has a more negligible influence than an acidic solution (-1.3 °C).
Bleach solution exposure caused a significant decrease in activation temperature (-2.4 °C), indicating oxidative degradation of TP. This noteworthy decrease confirms earlier research that bleach solution increases pigment deterioration, which may change transition kinetics and lessen thermochromic response stability.
Similar patterns were shown by HDPE98/TP2 and HDPE92/TP8 across all formulations, confirming that the thermochromic masterbatch—rather than the polymer composition—is the main element affecting reaction changes. The information demonstrates that whereas neutral and non-polar compounds cause only minor changes in thermal stability, aggressive chemicals (such as lemon and orange juice) have a major impact.
3.5. Tensile Testing
Table 7 summarizes the tensile properties of HDPE100/TP0 over 0, 24, 48, and 72 hours. The analysis considers tensile strain at break, maximum tensile stress, and Young’s modulus, providing insight into the material’s structural response under different conditions.
HDPE100/TP0 maintains stable tensile properties across most chemical exposures, with water, hydroalcoholic solution, and vegetable oil causing minimal changes. Lemon and orange juice initially reduce tensile strain and Young’s modulus but show recovery over time, suggesting minor polymer interactions. Bleach solution exposure results in progressive degradation, with the most significant drop in Young’s modulus (694.36 MPa at 72 hours), indicating a loss of stiffness and potential plasticization of the matrix. HDPE100/TP0 remains mechanically robust, but acidic and oxidative environments may impact long-term performance in food packaging applications.
HDPE98/TP2 (Table 8) exhibits moderate variations in tensile properties across different chemical exposures over 72 hours. Lemon and orange juice initially increase tensile strain and Young’s modulus, but a decline at 72 hours suggests potential acid-induced polymer relaxation. Tap water and hydroalcoholic solution exposure reduces tensile strain, indicating minor softening, while maximum stress remains stable. Vegetable oil causes minor fluctuations, suggesting limited polymer interaction. Bleach solution exposure initially increases tensile strain but leads to irregular trends in mechanical properties, possibly due to oxidative effects.
HDPE92/TP8 (Table 9) shows notable variations in tensile properties across different chemical exposures over 72 hours. Lemon and orange juice cause fluctuations in tensile strain and Young’s modulus, suggesting acid-induced polymer interactions, with initial increases followed by declines. Tap water maintains stability, with only minor variations in Young’s modulus and tensile strain. Hydroalcoholic solution exposure results in inconsistent trends, with an early drop in Young’s modulus but recovery by 72 hours, indicating potential plasticization effects. Vegetable oil exposure leads to minimal changes, while bleach solution exposure progressively reduces tensile properties, suggesting oxidative degradation. HDPE92/TP8 remains structurally stable but exhibits greater susceptibility to acid and oxidative conditions than HDPE100/TP0 and HDPE98/TP2.
These results highlight a strong correlation between chemical exposure and variations in stability and resistance to degradation. Acidic and oxidative exposures induce polymer interactions that, in some cases, progressively reduce tensile properties [88,89].
HDPE100/TP0 demonstrates the highest chemical resilience, maintaining consistent impact strength and tensile properties across all test conditions, with minimal structural changes over time. HDPE98/TP2 exhibits moderate stability, with minor reductions in tensile strain and Young’s modulus in acidic and oxidative environments, indicating some degree of polymer interaction. HDPE92/TP8 shows the most pronounced variations, particularly under acidic and oxidative exposure, where progressive reductions in Young’s modulus and tensile strain suggest greater susceptibility to chemical-induced degradation. These findings indicate that HDPE100/TP0 is the most suitable for long-term applications in chemically exposed environments. At the same time, HDPE98/TP2 and HDPE92/TP8 may require further stabilization in acidic or oxidative conditions, particularly in food packaging applications.
Across all tensile testing metrics (tensile strain at break, maximum tensile stress, and Young’s modulus), one-way ANOVA and Tukey HSD analysis showed no statistically significant differences (p > 0.05) between polymer types or chemical exposures at 72 hours. Despite minor variations observed descriptively—particularly under acidic and oxidative environments—the statistical results indicate these changes are insignificant. This suggests that all three polymer blends (HDPE100/TP0, HDPE98/TP2, HDPE92/TP8) maintain consistent mechanical performance after short-term chemical exposure, reinforcing their suitability for applications requiring short-term structural stability.
3.6. Charpy Impact Testing
Using both notched and unnotched samples, the impact strength of different polymer blends was assessed with exposure to various chemical food-contact conditions. The results in Table 10 demonstrate that HDPE100/TP0 maintains stable impact strength across all chemical exposures over 72 hours, with unnotched values remaining consistently above 99.2 kJ/m2 and unnotched values remaining consistently above 23.1 kJ/m2. Minor variations observed in lemon and orange juice suggest only surface-level interactions rather than structural degradation. However, the impact strength of hydroalcoholic solution is marginally increased, potentially due to plasticization effects, while tap water and hydroalcoholic solution exposure do not exhibit any significant effects. The high chemical resistance of HDPE100/TP0 is further reinforced by the negligible changes that occur as a consequence of exposure to vegetable oil and bleach solution. Bleach solution-exposed samples stabilize at 99.80 kJ/m².
For HDPE98/TP2, the results (Table 11) show slightly more significant variations in impact strength over 72 hours compared to HDPE100/TP0. While the initial values remain high, there is a noticeable reduction in impact strength after prolonged exposure to acidic solutions, mainly orange juice, where values decrease over time. This reduction suggests some interaction between the TP and the acidic environment, potentially affecting the polymer’s structural integrity. While all formulations maintained high-impact values, HDPE98/TP2 and HDPE92/TP8 showed more significant declines under acidic exposure than HDPE100/TP0. In contrast, neutral and non-polar chemicals caused negligible change in all cases.
HDPE92/TP8 (Table 12) exhibits the most significant reduction in impact strength following chemical exposure, particularly in lemon and orange juice, suggesting acid-induced pigment degradation. This effect correlates with its higher TP concentration, indicating that increased pigment loading may accelerate structural changes in acidic environments. Water and hydroalcoholic solution cause minor fluctuations without significant degradation, while vegetable oil and bleach solution maintain stable impact strength. The observed weakening in acidic solutions suggests potential limitations for prolonged exposure to acidic food products, as higher pigment concentrations may compromise mechanical stability.
These findings suggest that HDPE100/TP0 offers the most remarkable chemical stability, while HDPE98/TP2 and HDPE92/TP8 show increasing susceptibility to acidic degradation, particularly in higher pigment concentrations. This study highlights the trade-off between thermochromic functionality and long-term mechanical durability, an important consideration for food packaging and chemical-exposed applications.
One-way ANOVA results revealed significant differences in unnotched and notched impact strength across the three polymer blends. HDPE100/TP0 consistently demonstrated the highest mechanical performance, with significantly greater unnotched and notched impact values than HDPE92/TP8. HDPE98/TP2 showed intermediate behavior, closely aligning with HDPE100/TP0 in notched tests but showing a slight reduction in unnotched strength. The decline in impact resistance with increasing pigment concentration—particularly under notched conditions—suggests that higher thermochromic loading may contribute to reduced fracture toughness, likely due to pigment-induced microstructural changes.
4. Conclusion
The chemical resistance, thermal stability, and mechanical durability of thermochromic polymers in food-contact environments were comprehensively assessed in this study. Important data regarding the stability and efficacy of food-grade thermochromic polymer blends in food packaging applications was obtained by subjecting them to six chemical solutions.
The results revealed that oxidative and acidic solutions affected the material's absorption properties. The thermal cycling results showed that the most significant reductions were caused by bleach solution and hydroalcoholic solution, which resulted in minor activation temperature shifts in chemically exposed samples. The highest stability was demonstrated by HDPE100/TP0 in all conditions, as evidenced by tensile and impact strength testing. At the same time, HDPE98/TP2 and HDPE92/TP8 showed minor but measurable reductions in mechanical performance, particularly after prolonged exposure to acidic and oxidative environments.
While HDPE98/TP2 and HDPE92/TP8 showed greater vulnerability to chemically induced alterations, particularly under acidic and oxidative environments, HDPE100/TP0 showed the highest overall chemical resilience. Further stabilization methods are required to extend the shelf life of thermochromic masterbatch-containing polymers in food packaging to improve food safety monitoring and preserve material integrity. Overall findings indicate that while HDPE98/TP2 / HDPE98/TP8 remains chemically durable, the TP may introduce some vulnerability under acidic, aqueous acidic, and alkaline solutions conditions.
Author Contributions
Conceptualization, C.B.; methodology, C.B.; writing—original draft preparation, C.B.; writing—review and editing, C.B., D.M.C. and G.B.; supervision, J.G. and L.M.G.. All authors have read and agreed to the published version of the manuscript.
Funding
This research received no external funding.
Data Availability Statement
Not applicable.
Acknowledgments
Not applicable.
Conflicts of Interest
The authors declare no conflicts of interest.
References
- Ahmed, Md.W.; Haque, Md.A.; Mohibbullah, Md.; Khan, Md.S.I.; Islam, M.A.; Mondal, Md.H.T.; Ahmmed, R. A Review on Active Packaging for Quality and Safety of Foods: Current Trends, Applications, Prospects and Challenges. Food Packaging and Shelf Life 2022, 33, 100913. [CrossRef]
- Mohammadian, E.; Alizadeh-Sani, M.; Jafari, S.M. Smart Monitoring of Gas/Temperature Changes within Food Packaging Based on Natural Colorants. Comp Rev Food Sci Food Safe 2020, 19, 2885–2931. [CrossRef]
- Sarkar, S.; Aparna, K. Food Packaging and Storage. In; 2020; pp. 27–51 ISBN 978-93-90420-92-6.
- Yan, M.R.; Hsieh, S.; Ricacho, N. Innovative Food Packaging, Food Quality and Safety, and Consumer Perspectives. Processes 2022, 10, 747. [CrossRef]
- Jones, A.; Neal, B.; Reeve, B.; Ni Mhurchu, C.; Thow, A.M. Front-of-Pack Nutrition Labelling to Promote Healthier Diets: Current Practice and Opportunities to Strengthen Regulation Worldwide. BMJ Glob Health 2019, 4, e001882. [CrossRef]
- Verma, M.K.; Shakya, S.; Kumar, P.; Madhavi, J.; Murugaiyan, J.; Rao, M.V.R. Trends in Packaging Material for Food Products: Historical Background, Current Scenario, and Future Prospects. J Food Sci Technol 2021, 58, 4069–4082. [CrossRef]
- Gupta, V.; Biswas, D.; Roy, S. A Comprehensive Review of Biodegradable Polymer-Based Films and Coatings and Their Food Packaging Applications. Materials 2022, 15, 5899. [CrossRef]
- Mohamadi, M. Plastic Types and Applications. In Plastic Waste Treatment and Management; Hasanzadeh, R., Mojaver, P., Eds.; Engineering Materials; Springer Nature Switzerland: Cham, 2023; pp. 1–19 ISBN 978-3-031-31159-8.
- AlMaadeed, M.A.A.; Ponnamma, D.; El-Samak, A.A. Polymers to Improve the World and Lifestyle: Physical, Mechanical, and Chemical Needs. In Polymer Science and Innovative Applications; Elsevier, 2020; pp. 1–19 ISBN 978-0-12-816808-0.
- Wang, C.; Liu, Y.; Chen, W.; Zhu, B.; Qu, S.; Xu, M. Critical Review of Global Plastics Stock and Flow Data. J of Industrial Ecology 2021, 25, 1300–1317. [CrossRef]
- The Busines Research Company Plastics And Rubber Products Global Market Report 2025 – By Type (Rubber Products, Plastic Products), By End-User Industry (Automotive & Transportation, Electrical & Electronics, Medical, Construction, Other End Users) – Market Size, Trends, And Global Forecast 2025-2034; Global Market Reports; The Business Research Company: London, United Kingdom, 2025; p. 400;
- White, A.; Lockyer, S. Removing Plastic Packaging from Fresh Produce – What’s the Impact? Nutrition Bulletin 2020, 45, 35–50. [CrossRef]
- Kc, U.; Eo, A.; Ke, O.; N, N. Environmental and Public Health Impacts of Plastic Wastes Due to Healthcare and Food Products Packages: A Review. J Environ Sci Public Health 2021, 05. [CrossRef]
- Saalah, S.; Saallah, S.; Rajin, M.; Yaser, A.Z. Management of Biodegradable Plastic Waste: A Review. In Advances in Waste Processing Technology; Yaser, A.Z., Ed.; Springer Singapore: Singapore, 2020; pp. 127–143 ISBN 978-981-15-4820-8.
- Dodero, A.; Escher, A.; Bertucci, S.; Castellano, M.; Lova, P. Intelligent Packaging for Real-Time Monitoring of Food-Quality: Current and Future Developments. Applied Sciences 2021, 11, 3532. [CrossRef]
- Sadeghi, K.; Yoon, J.Y.; Seo, J. Chromogenic Polymers and Their Packaging Applications: A Review. Polymer Reviews 2020, 60, 442–492. [CrossRef]
- Saber, D.; Abd El-Aziz, K. Advanced Materials Used in Wearable Health Care Devices and Medical Textiles in the Battle against Coronavirus (COVID-19): A Review. Journal of Industrial Textiles 2022, 51, 246S-271S. [CrossRef]
- Halonen, N.; Pálvölgyi, P.S.; Bassani, A.; Fiorentini, C.; Nair, R.; Spigno, G.; Kordas, K. Bio-Based Smart Materials for Food Packaging and Sensors – A Review. Front. Mater. 2020, 7, 82. [CrossRef]
- Udoh, I.I.; Shi, H.; Daniel, E.F.; Li, J.; Gu, S.; Liu, F.; Han, E.-H. Active Anticorrosion and Self-Healing Coatings: A Review with Focus on Multi-Action Smart Coating Strategies. Journal of Materials Science & Technology 2022, 116, 224–237. [CrossRef]
- Zaszczyńska, A.; Gradys, A.; Sajkiewicz, P. Progress in the Applications of Smart Piezoelectric Materials for Medical Devices. Polymers 2020, 12, 2754. [CrossRef]
- Behera, A. Chromogenic Materials. In Advanced Materials; Springer International Publishing: Cham, 2022; pp. 157–191 ISBN 978-3-030-80358-2.
- Sadoh, A.; Hossain, S.; Ravindra, N.M. Thermochromic Polymeric Films for Applications in Active Intelligent Packaging—an Overview. Micromachines 2021, 12. [CrossRef]
- Toan, V.N.; Tri, N.M.; Nguyen, X.H.; Nguyen, D.D.; Chung, W.; Chang, S.W.; La, D.D. Exploring the Potential of Organic Thermochromic Materials in Textile Applications. J Mater Sci 2024, 59, 14924–14947. [CrossRef]
- Ramlow, H.; Andrade, K.L.; Immich, A.P.S. Smart Textiles: An Overview of Recent Progress on Chromic Textiles. The Journal of The Textile Institute 2021, 112, 152–171. [CrossRef]
- Versino, F.; Ortega, F.; Monroy, Y.; Rivero, S.; López, O.V.; García, M.A. Sustainable and Bio-Based Food Packaging: A Review on Past and Current Design Innovations. Foods 2023, 12, 1057. [CrossRef]
- Ma, Y.; Yu, Y.; Li, J.; Liu, S.; Huang, W.; Zhao, Q. Stimuli-responsive Photofunctional Materials for Green and Security Printing. InfoMat 2021, 3, 82–100. [CrossRef]
- Jeon, H.S.; Kim, J.H.; Jun, M.B.G.; Jeong, Y.H. Fabrication of Thermochromic Membrane and Its Characteristics for Fever Detection. Materials 2021, 14, 3460. [CrossRef]
- Kumar, J.; Akhila, K.; Kumar, P.; Deshmukh, R.K.; Gaikwad, K.K. Novel Temperature-Sensitive Label Based on Thermochromic Ink for Hot Food Packaging and Serving Applications. Journal of Thermal Analysis and Calorimetry 2023, 148, 6061–6069. [CrossRef]
- Kalpana, S.; Priyadarshini, S.R.; Maria Leena, M.; Moses, J.A.; Anandharamakrishnan, C. Intelligent Packaging: Trends and Applications in Food Systems. Trends in Food Science & Technology 2019, 93, 145–157. [CrossRef]
- Soltani Firouz, M.; Mohi-Alden, K.; Omid, M. A Critical Review on Intelligent and Active Packaging in the Food Industry: Research and Development. Food Research International 2021, 141, 110113. [CrossRef]
- Hanzer, S.J.; Kulčar, R.; Vukoje, M.; Maroševi´c, A.; Dolovski, M. Assessment of Thermochromic Packaging Prints’ Resistance to UV Radiation and Various Chemical Agents. 2023. [CrossRef]
- Müller, P.; Schmid, M. Intelligent Packaging in the Food Sector: A Brief Overview. Foods 2019, 8, 16. [CrossRef]
- Pereira, A.; Marques, M.A.; Alves, J.; Morais, M.; Figueira, J.; V. Pinto, J.; Moreira, F.T.C. Irreversible Colorimetric Bio-Based Curcumin Bilayer Membranes for Smart Food Packaging Temperature Control Applications. RSC Adv. 2024, 14, 8981–8989. [CrossRef]
- Crosby, P.H.N.; Netravali, A.N. Green Thermochromic Materials: A Brief Review. Advanced Sustainable Systems 2022, 6, 2200208. [CrossRef]
- Gupta, R.K. Specialty Polymers: Fundamentals, Properties, Applications and Advances; 1st ed.; CRC Press: Boca Raton, 2022; ISBN 978-1-003-27826-9.
- Vicoveanu, D.; Pîrvu, C. Polymer Composition with Improved Barrier Properties for Thermochromic Applications. 2020.
- Abraham, J. Future of Food Packaging: Intelligent Packaging. In Nanotechnology in Intelligent Food Packaging; Annu, Bhattacharya, T., Ahmed, S., Eds.; Wiley, 2022; pp. 383–417 ISBN 978-1-119-81895-3.
- Chen, T.; Yang, Q.; Fang, C.; Deng, S.; Xu, B. Advanced Design for Stimuli-Reversible Chromic Wearables With Customizable Functionalities. Advanced Materials 2025, 37, 2413665. [CrossRef]
- Kantola, R.; Lassila, L.V.J.; Tolvanen, M.; Valittu, P.K. Color Stability of Thermochromic Pigment in Maxillofacial Silicone. J Adv Prosthodont 2013, 5, 75. [CrossRef]
- Shayan, M.; Koo, M.S.; Abouzeid, R.; She, Y.; Gwon, J.; Wu, Q. Functional Electrospun Polylactic Acid Core-Shell Thermochromic Fibers with Modified Cellulose Nanocrystals for Enhanced Temperature-Responsive Applications. Industrial Crops and Products 2024, 222, 119594. [CrossRef]
- Consumer Satisfaction With Packaging Materials: Kano Model Analysis Approach. Teh. vjesn. 2021, 28. [CrossRef]
- Advances in Processing Technology; Sharma, G.K., Dutt Semwal, A., Kumar Yadav, D., Eds.; CRC Press ; New India Publishing Agency: Abingdon, Oxon ; Boca Raton, FL : New Delhi, 2022; ISBN 978-1-000-50555-9.
- Breheny, C.; Donlon, K.; Harrington, A.; Colbert, D.M.; Nunes Bezerra, G.S.; Geever, L. Thermochromic Polymers in Food Packaging: A Comprehensive Systematic Review and Patent Landscape Analysis. Coatings 2024, 14, 1252. [CrossRef]
- Civan, L.; Kurama, S. A Review: Preparation of Functionalised Materials/Smart Fabrics That Exhibit Thermochromic Behaviour. Mater. Sci. Technolo. 2021, 37, 1865–1877. [CrossRef]
- Agarwal, A.; Shaida, B.; Rastogi, M.; Singh, N.B. Food Packaging Materials with Special Reference to Biopolymers-Properties and Applications. Chemistry Africa 2023, 6, 117–144. [CrossRef]
- Kumar, L.; Ramakanth, D.; Akhila, K.; Gaikwad, K.K. Edible Films and Coatings for Food Packaging Applications: A Review. Environ Chem Lett 2022, 20, 875–900. [CrossRef]
- University of Zagreb, Faculty of Graphic Arts, Zagreb, Croatia; Jamnicki Hanzer, S.; Kulčar, R.; University of Zagreb, Faculty of Graphic Arts, Zagreb, Croatia; Vukoje, M.; University of Zagreb, Faculty of Graphic Arts, Zagreb, Croatia; Širol, P.; University of Zagreb, Faculty of Graphic Arts, Zagreb, Croatia Mechanical and Chemical Resistance of Thermochromic Packaging Prints. In Proceedings of the Proceedings - The Tenth International Symposium GRID 2020; University of Novi Sad, Faculty of technical sciences, Department of graphic engineering and design, November 12 2020; pp. 109–118.
- Jamnicki Hanzer, S.; Kulčar, R.; Vukoje, M.; Marošević Dolovski, A. Assessment of Thermochromic Packaging Prints’ Resistance to UV Radiation and Various Chemical Agents. Polymers 2023, 15, 1208. [CrossRef]
- University of Zagreb Faculty of Graphic Arts, Zagreb, Croatia; Kulčar, R.; Kračun, I.; University of Zagreb Faculty of Graphic Arts, Zagreb, Croatia; Vukoje, M.; University of Zagreb Faculty of Graphic Arts, Zagreb, Croatia; Itrić Ivanda, K.; University of Zagreb Faculty of Graphic Arts, Zagreb, Croatia; Cigula, T.; University of Zagreb Faculty of Graphic Arts, Zagreb, Croatia INVESTIGATION OF THE IMPACT OF CHEMICAL AGENTS AND SUBSTRATES ON THE STABILITY OF THERMOCHROMIC PRINTING INKS. In Proceedings of the Proceedings - The Twelfth International Symposium GRID 2024; UNIVERSITY OF NOVI SAD FACULTY OF TECHNICAL SCIENCES DEPARTMENT OF GRAPHIC ENGINEERING AND DESIGN 21000 Novi Sad, Trg Dositeja Obradovića 6, November 2024.
- Wang, J.; Zeng, S.; Liu, H.; Zheng, Y.; Ma, Y. Thermochromic Behavior of Pigment Red 254 in Nylon 6 Polymer for High-Chromaticity Engineering Plastics. Dyes and Pigments 2025, 233, 112507. [CrossRef]
- International Organization for Standardization ISO. Plastics — Determination of Tensile Properties — Part 2: Test Conditions for Moulding and Extrusion Plastics; ISO 527-2; Geneva, Switzerland, 2012.
- International Organization for Standardization ISO. Plastics — Determination of Charpy Impact Properties — Part 1: Non-Instrumented Impact Test; ISO 179-1; Geneva, Switzerland, 2023.
- College of Mechanical and Electrical Engineering, Beijing University of Chemical Technology, Beijing 100029, China; Fu, H.; Xu, H.; College of Mechanical and Electrical Engineering, Beijing University of Chemical Technology, Beijing 100029, China; Liu, Y.; State Key Laboratory of Organic-Inorganic Composites, Beijing University of Chemical Technology, Beijing, 100029, China; Yang, Z.; Department of Chemical and Biomolecular Engineering, The Ohio State University, Columbus, OH, USA; Department of Radiation Oncology, University of Texas Southwestern Medical Center, Dallas, TX, USA; Kormakov, S.; et al. Overview of Injection Molding Technology for Processing Polymers and Their Composites. ES Mater.Manuf. 2020. [CrossRef]
- International Organization for Standardization (ISO) International Organization for Standardization (ISO). ISO 294-1:2017 – Plastics — Injection Moulding of Test Specimens of Thermoplastic Materials — Part 1: General Principles, and Moulding of Multipurpose and Bar Test Specimens; ISO 294-1:2017; Geneva, Switzerland, 2017.
- Dadi, M.; Yasir, M. Spectroscopy and Spectrophotometry: Principles and Applications for Colorimetric and Related Other Analysis. In Colorimetry; Kumar Samanta, A., Ed.; IntechOpen, 2022 ISBN 978-1-83962-940-2.
- Cinko, U.O.; Becerir, B. Computing Characteristics of Color Difference Formulas for Regular Coordinate Changes in CIELAB Color Space. Textile Research Journal 2024, 00405175241278025. [CrossRef]
- Belasco, R.; Edwards, T.; Munoz, A.J.; Rayo, V.; Buono, M.J. The Effect of Hydration on Urine Color Objectively Evaluated in CIE L*a*b* Color Space. Front. Nutr. 2020, 7, 576974. [CrossRef]
- He, W.; Sun, Y.; Zhang, S.; Li, J.; Feng, J.; Yang, Y.; Meng, H.; Zhang, Z. Correlation between Colour Traits and Intrinsic Quality of Dalbergiae Odoriferae Lignum. Molecules 2023, 28, 7635. [CrossRef]
- Wang, Y.; Chen, G.; Li, W.; Gan, X.; Wang, J. Reflectance Model for Filament Yarn Composed of Different Color Monofilaments. The Journal of The Textile Institute 2021, 112, 2039–2047. [CrossRef]
- ISO/CIE. ISO/CIE 11664-4:2019 - Colorimetry — Part 4: CIE 1976 Lab Colour Space*; ISO/CIE 11664-4; Geneva, Switzerland, 2019.
- Davies, T.E.; Li, H.; Bessette, S.; Gauvin, R.; Patience, G.S.; Dummer, N.F. Experimental Methods in Chemical Engineering: Scanning Electron Microscopy and X -ray Ultra-microscopy— SEM and XuM. Can J Chem Eng 2022, 100, 3145–3159. [CrossRef]
- Lyu, Z.; Yao, L.; Chen, W.; Kalutantirige, F.C.; Chen, Q. Electron Microscopy Studies of Soft Nanomaterials. Chem. Rev. 2023, 123, 4051–4145. [CrossRef]
- Chauhan, I.; Yasir, M.; Verma, M.; Singh, A.P. Nanostructured Lipid Carriers: A Groundbreaking Approach for Transdermal Drug Delivery. Adv Pharm Bull 2020, 10, 150–165. [CrossRef]
- Rotzler, S.; Schneider-Ramelow, M. Washability of E-Textiles: Failure Modes and Influences on Washing Reliability. Textiles 2021, 1, 37–54. [CrossRef]
- Fadiji, T.; Rashvand, M.; Daramola, M.O.; Iwarere, S.A. A Review on Antimicrobial Packaging for Extending the Shelf Life of Food. Processes 2023, 11, 590. [CrossRef]
- Mirbach, B.; Boguslawski, M. How Accurate Can Combined Measurements Be -- Experiment, Simulation, and Theory 2022.
- Szumska, A.A.; Maria, I.P.; Flagg, L.Q.; Savva, A.; Surgailis, J.; Paulsen, B.D.; Moia, D.; Chen, X.; Griggs, S.; Mefford, J.T.; et al. Reversible Electrochemical Charging of N-Type Conjugated Polymer Electrodes in Aqueous Electrolytes. J. Am. Chem. Soc. 2021, 143, 14795–14805. [CrossRef]
- Pielichowski, K.; Njuguna, J.; Majka, T.M. Thermal Degradation of Polymeric Materials; Elsevier, 2022; ISBN 978-0-12-823142-5.
- Bridson, J.H.; Abbel, R.; Smith, D.A.; Northcott, G.L.; Gaw, S. Release of Additives and Non-Intentionally Added Substances from Microplastics under Environmentally Relevant Conditions. Environmental Advances 2023, 12, 100359. [CrossRef]
- Soo, X.Y.D.; Zhang, D.; Tan, S.Y.; Chong, Y.T.; Hui, H.K.; Sng, A.; Wei, F.; Suwardi, A.; Png, Z.M.; Zhu, Q.; et al. Ultra-high Performance Thermochromic Polymers via a Solid-solid Phase Transition Mechanism and Their Applications. Advanced Materials 2024, 2405430. [CrossRef]
- Jia, W.; Pi, A.; Zhao, Z.; Wang, S.; Wei, C.; Jie, Z.; Huang, F. Study on Intrinsic Influence Law of Specimen Size and Loading Speed on Charpy Impact Test. Materials 2022, 15, 3855. [CrossRef]
- Patterson, A.E.; Pereira, T.R.; Allison, J.T.; Messimer, S.L. IZOD Impact Properties of Full-Density Fused Deposition Modeling Polymer Materials with Respect to Raster Angle and Print Orientation. Proceedings of the Institution of Mechanical Engineers, Part C: Journal of Mechanical Engineering Science 2021, 235, 1891–1908. [CrossRef]
- Vandever, C. Introduction to Research Statistical Analysis: An Overview of the Basics. HCA Healthcare Journal of Medicine 2020, 1. [CrossRef]
- Papachristou, E.; Korres, D.; Mamma, D.; Kekos, D.; Tarantili, P.A.; Polyzois, G. Titanium Dioxide/Polysiloxane Composites: Preparation, Characterization and Study of Their Color Stability Using Thermochromic Pigments. Journal of Composites Science 2022, 6, 195. [CrossRef]
- Han, Y.; Yan, X.; Zhao, W. Effect of Thermochromic and Photochromic Microcapsules on the Surface Coating Properties for Metal Substrates. Coatings 2022, 12, 1642. [CrossRef]
- Wang, J.; Xie, M.; An, Y.; Tao, Y.; Sun, J.; Ji, C. All-Season Thermal Regulation with Thermochromic Temperature-Adaptive Radiative Cooling Coatings. Solar Energy Materials and Solar Cells 2022, 246, 111883. [CrossRef]
- White, M.A.; Bourque, A. Colorant, Thermochromic. In Encyclopedia of Color Science and Technology; Shamey, R., Ed.; Springer International Publishing: Cham, 2023; pp. 571–582 ISBN 978-3-030-89861-8.
- Rossi, S.; Simeoni, M.; Quaranta, A. Behavior of Chromogenic Pigments and Influence of Binder in Organic Smart Coatings. Dyes and Pigments 2021, 184, 108879. [CrossRef]
- Dungani, R.; Sumardi, I.; Alamsyah, E.M.; Aditiawati, P.; Karliati, T.; Malik, J.; Sulistyono A Study on Fracture Toughness of Nano-Structured Carbon Black-Filled Epoxy Composites. Polym. Bull. 2021, 78, 6867–6885. [CrossRef]
- Han, W.; Yin, M.; Zhang, W.; Liu, Z.; Wang, N.; Yong, K.T.; An, Q. Acid-Resistance and Self-Repairing Supramolecular Nanoparticle Membranes via Hydrogen-Bonding for Sustainable Molecules Separation. Advanced Science 2021, 8, 2102594. [CrossRef]
- Ramezani Dana, H.; Ebrahimi, F. Synthesis, Properties, and Applications of Polylactic Acid-Based Polymers. Polymer Engineering & Science 2023, 63, 22–43. [CrossRef]
- Feng, W.; Li, M.; Hao, Z.; Zhang, J. Analytical Methods of Isolation and Identification. In Phytochemicals in Human Health; Rao, V., Mans, D., Rao, L., Eds.; IntechOpen, 2020 ISBN 978-1-78985-587-6.
- Bîrleanu, E.; Mihăilă, I.; Topală, I.; Borcia, C.; Borcia, G. Adhesion Properties and Stability of Non-Polar Polymers Treated by Air Atmospheric-Pressure Plasma. Polymers 2023, 15, 2443. [CrossRef]
- Huang, Y.; Yu, Q.; Li, M.; Jin, S.; Fan, J.; Zhao, L.; Yao, Z. Surface Modification of Activated Carbon Fiber by Low-Temperature Oxygen Plasma: Textural Property, Surface Chemistry, and the Effect of Water Vapor Adsorption. Chemical Engineering Journal 2021, 418, 129474. [CrossRef]
- Rakić, V.; and Poklar Ulrih, N. Influence of pH on Color Variation and Stability of Cyanidin and Cyanidin 3-O-β-Glucopyranoside in Aqueous Solution. CyTA - Journal of Food 2021, 19, 174–182. [CrossRef]
- A Review on Degradation Mechanisms of Polylactic Acid: Hydrolytic, Photodegradative, Microbial, and Enzymatic Degradation - Zaaba - 2020 - Polymer Engineering & Science - Wiley Online Library Available online: https://4spepublications.onlinelibrary.wiley.com/doi/abs/10.1002/pen.25511 (accessed on 22 March 2025).
- Jouenne, S. Polymer Flooding in High Temperature, High Salinity Conditions: Selection of Polymer Type and Polymer Chemistry, Thermal Stability. Journal of Petroleum Science and Engineering 2020, 195, 107545. [CrossRef]
- Wang, J.; Li, L.; He, Y.; Song, H.; Chen, X.; Guo, J. The Effect of Thermo-Oxidative Ageing on Crystallization, Dynamic and Static Mechanical Properties of Long Glass Fibre-Reinforced Polyamide 10T Composites. R Soc Open Sci 2018, 5, 172029. [CrossRef]
- García-Caparrós, P.; De Filippis, L.; Gul, A.; Hasanuzzaman, M.; Ozturk, M.; Altay, V.; Lao, M.T. Oxidative Stress and Antioxidant Metabolism under Adverse Environmental Conditions: A Review. Bot. Rev. 2021, 87, 421–466. [CrossRef]
Figure 1.
Visual color changes in (A) HDPE100/TP0, (B) HDPE98/TP2, and (C) HDPE92/TP8 before and after exposure to lemon juice. Each set shows samples in the order: unexposed (control), 24 hours, 48 hours, and 72 hours.
Figure 1.
Visual color changes in (A) HDPE100/TP0, (B) HDPE98/TP2, and (C) HDPE92/TP8 before and after exposure to lemon juice. Each set shows samples in the order: unexposed (control), 24 hours, 48 hours, and 72 hours.
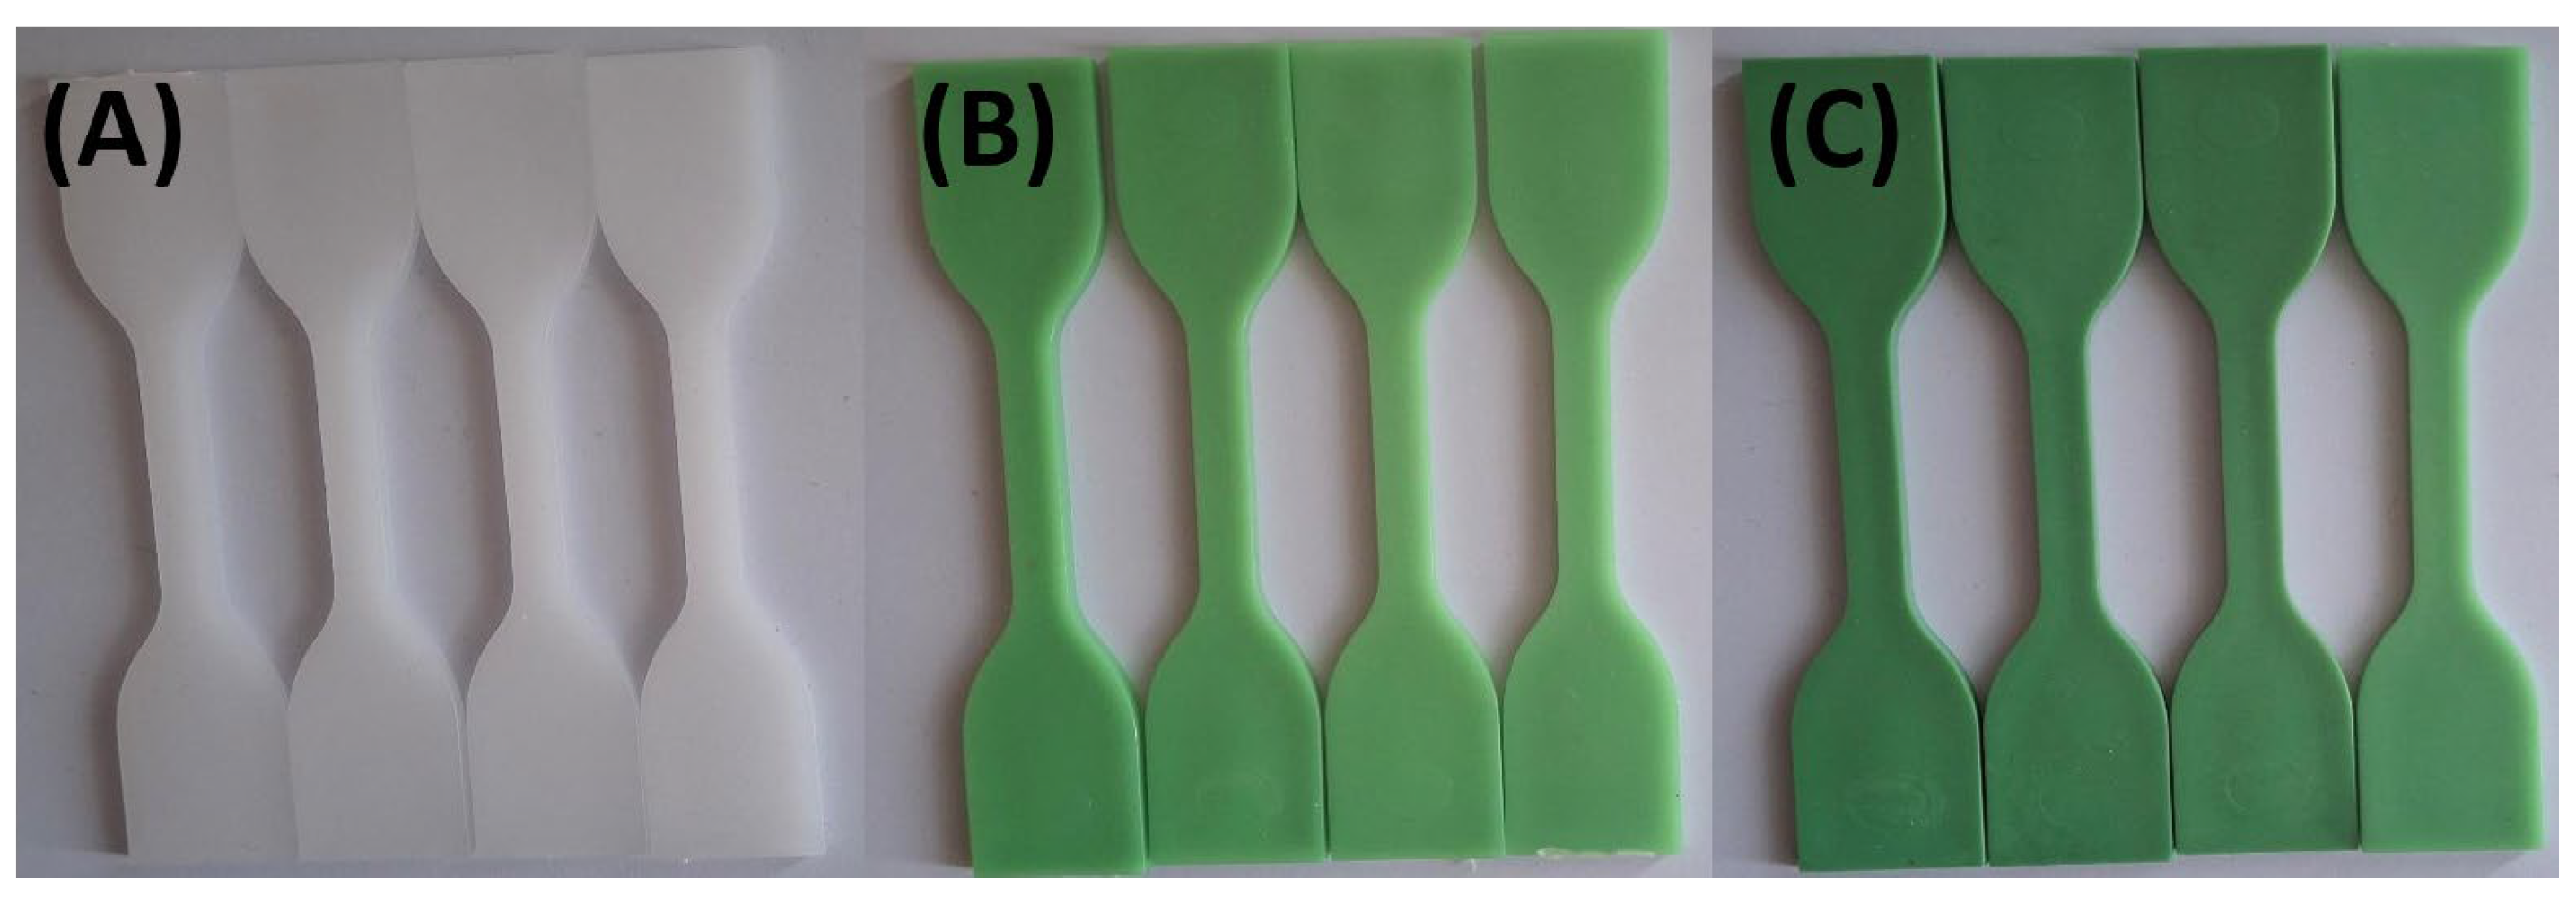
Figure 2.
Visual color changes in (A) HDPE100/TP0, (B) HDPE98/TP2, and (C) HDPE92/TP8 before and after exposure to orange juice. Each set shows samples in the order: unexposed (control), 24 hours, 48 hours, and 72 hours.
Figure 2.
Visual color changes in (A) HDPE100/TP0, (B) HDPE98/TP2, and (C) HDPE92/TP8 before and after exposure to orange juice. Each set shows samples in the order: unexposed (control), 24 hours, 48 hours, and 72 hours.
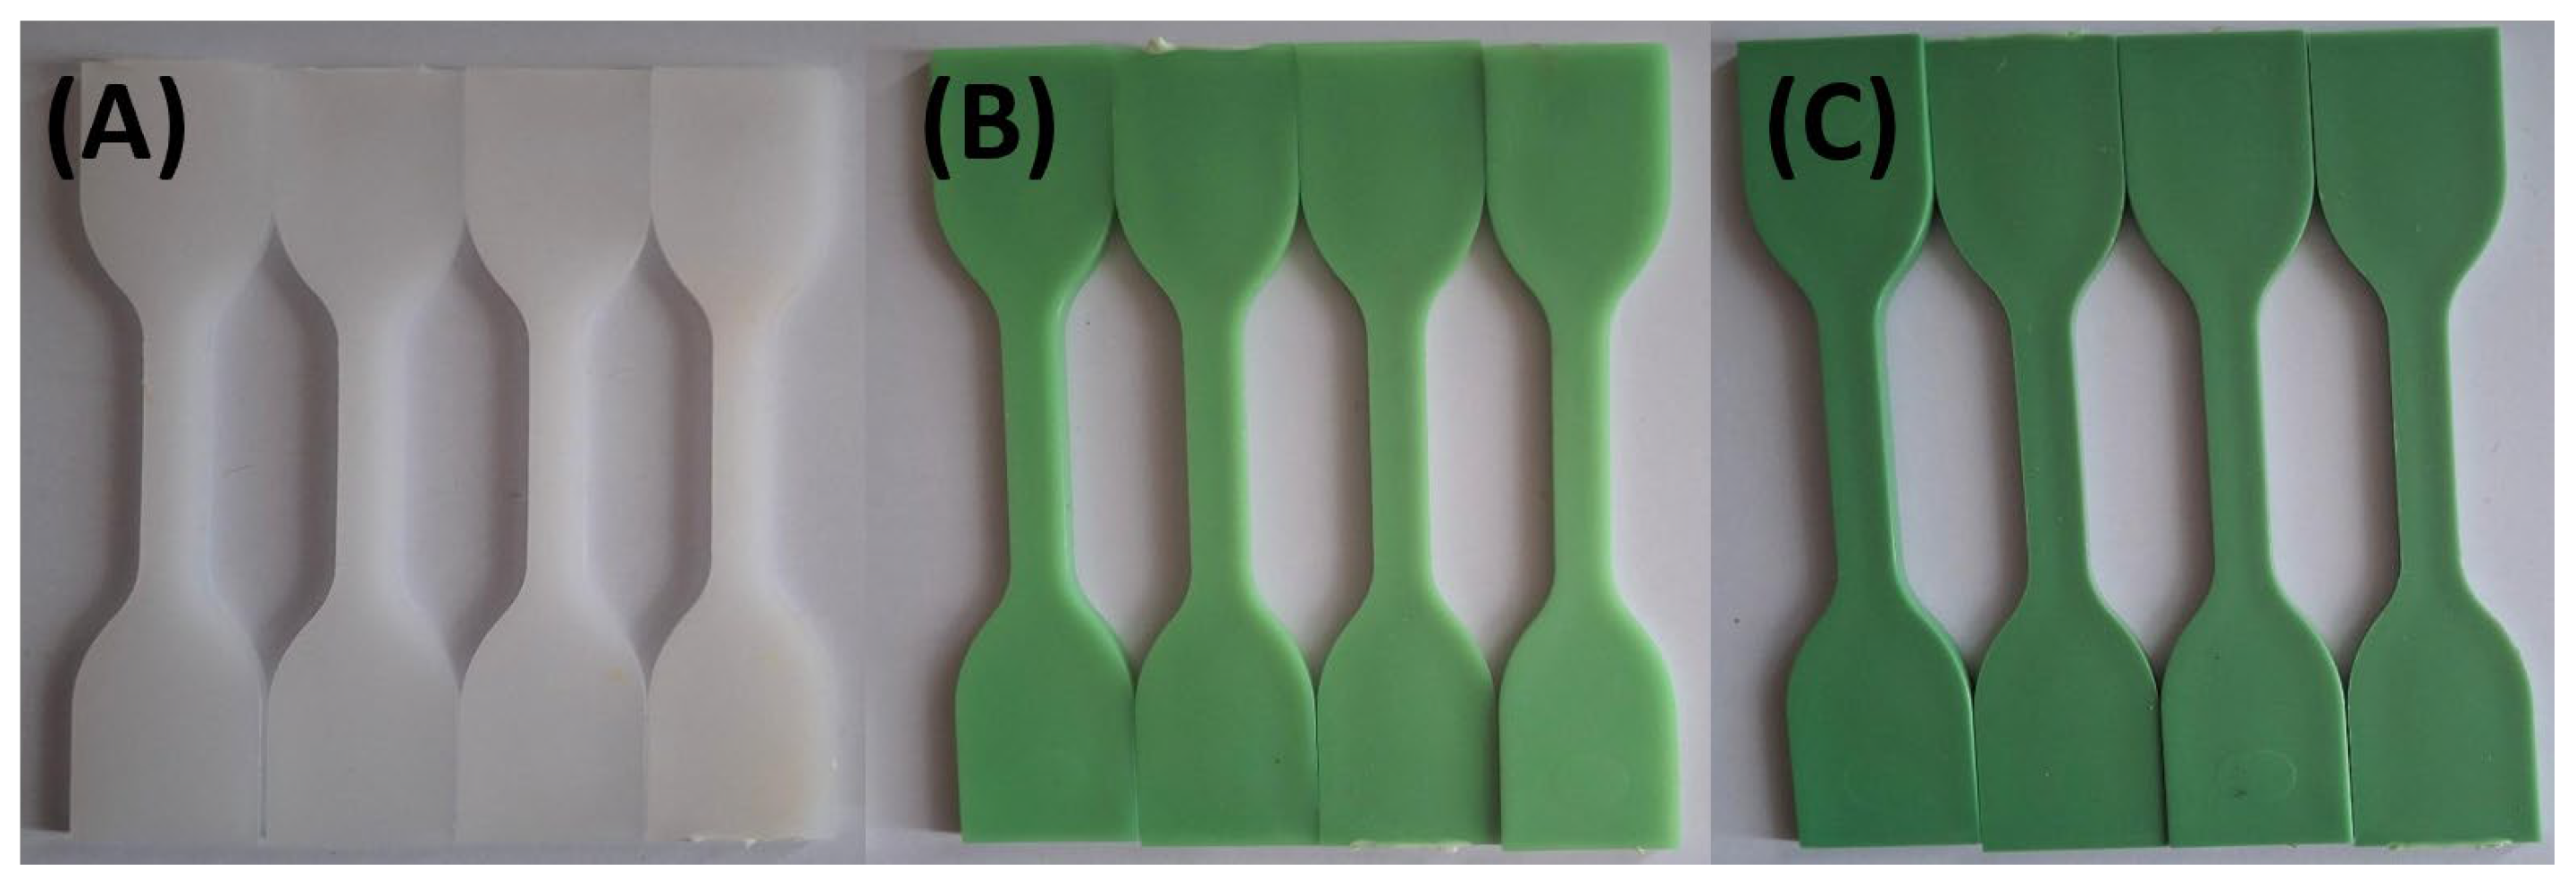
Figure 3.
Visual color changes in (A) HDPE100/TP0, (B) HDPE98/TP2, and (C) HDPE92/TP8 before and after exposure to tap water. Each set shows samples in the order: unexposed (control), 24 hours, 48 hours, and 72 hours.
Figure 3.
Visual color changes in (A) HDPE100/TP0, (B) HDPE98/TP2, and (C) HDPE92/TP8 before and after exposure to tap water. Each set shows samples in the order: unexposed (control), 24 hours, 48 hours, and 72 hours.
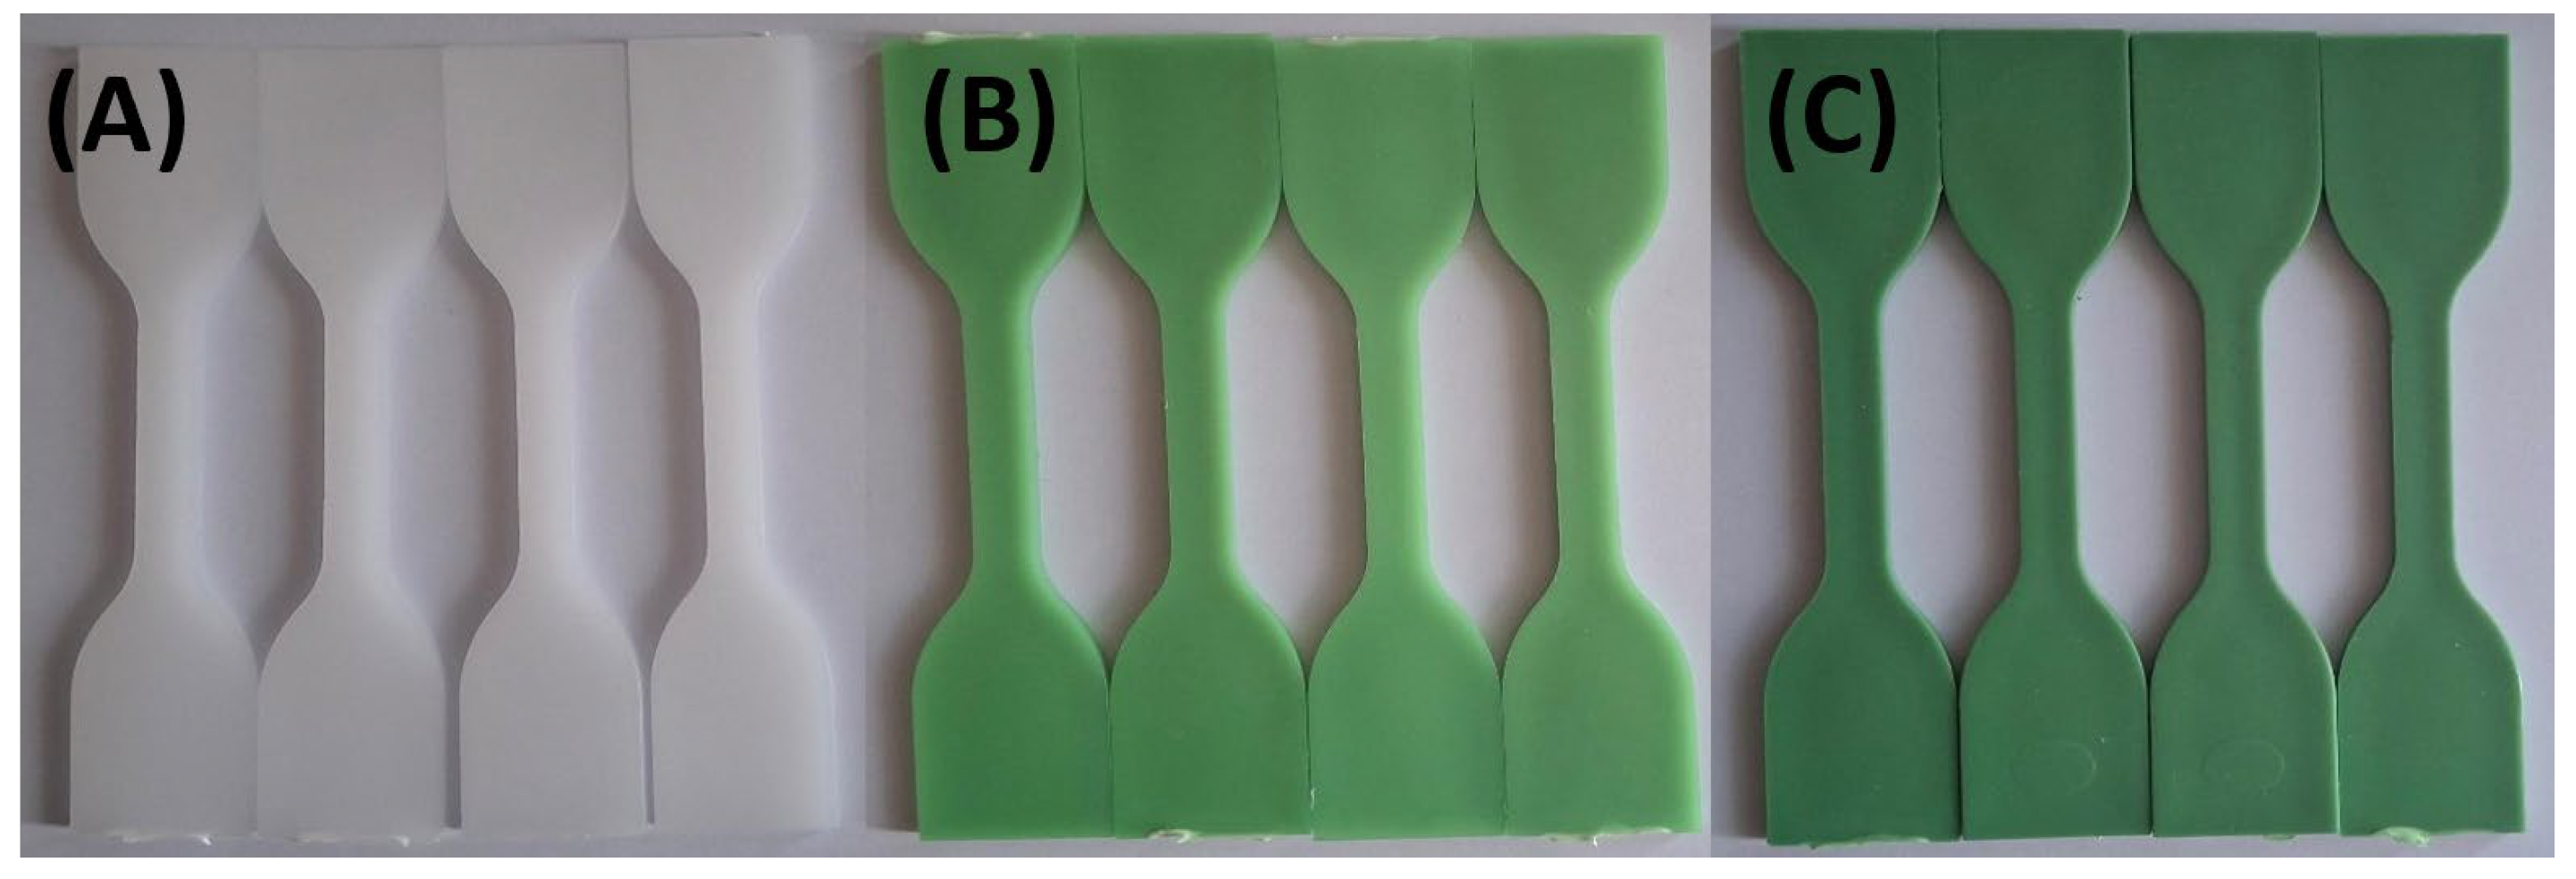
Figure 4.
Visual color changes in (A) HDPE100/TP0, (B) HDPE98/TP2, and (C) HDPE92/TP8 before and after exposure hydroalcoholic solution. Each set shows samples in the order: unexposed (control), 24 hours, 48 hours, and 72 hours.
Figure 4.
Visual color changes in (A) HDPE100/TP0, (B) HDPE98/TP2, and (C) HDPE92/TP8 before and after exposure hydroalcoholic solution. Each set shows samples in the order: unexposed (control), 24 hours, 48 hours, and 72 hours.
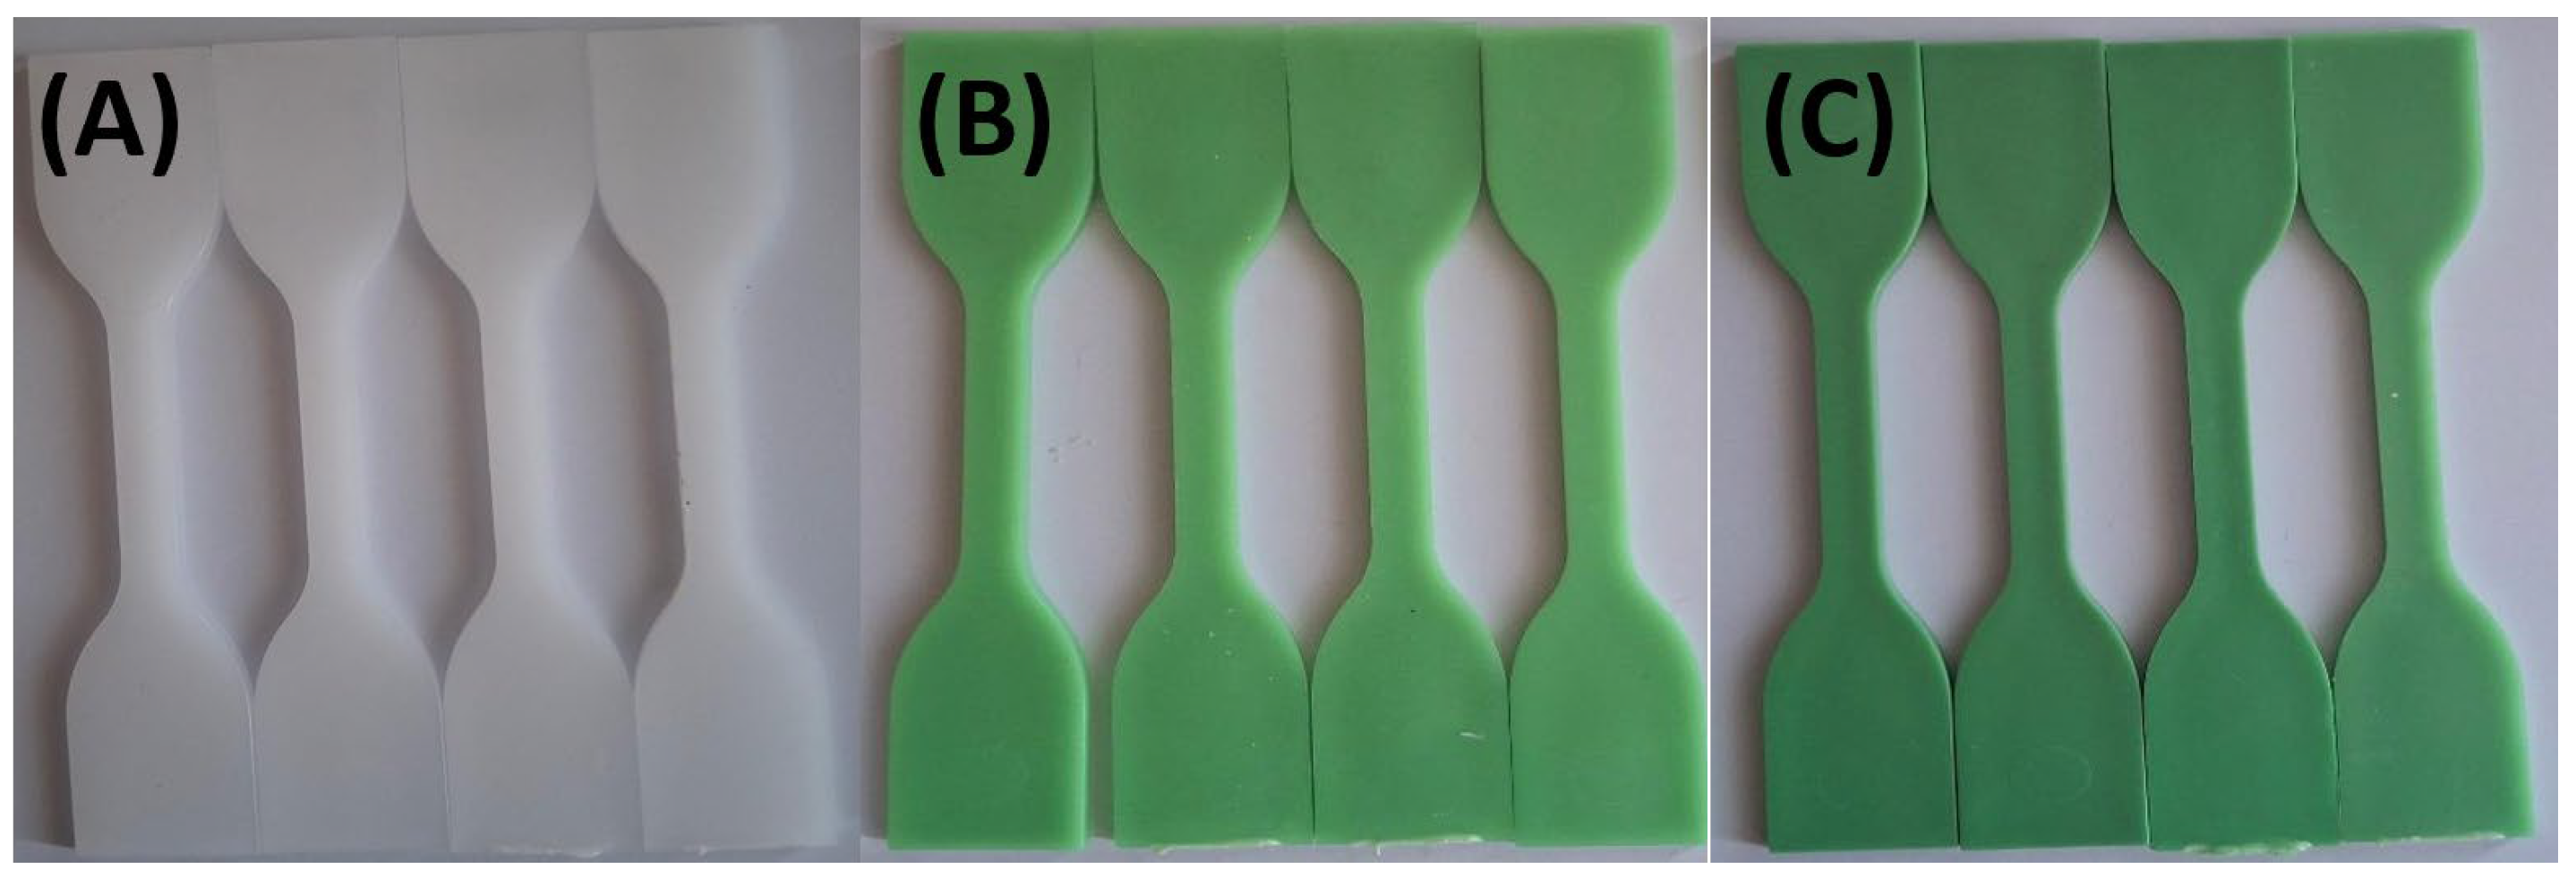
Figure 5.
Visual color changes in (A) HDPE100/TP0, (B) HDPE98/TP2, and (C) HDPE92/TP8 before and after exposure to vegetable oil. Each set shows samples in the order: unexposed (control), 24 hours, 48 hours, and 72 hours.
Figure 5.
Visual color changes in (A) HDPE100/TP0, (B) HDPE98/TP2, and (C) HDPE92/TP8 before and after exposure to vegetable oil. Each set shows samples in the order: unexposed (control), 24 hours, 48 hours, and 72 hours.
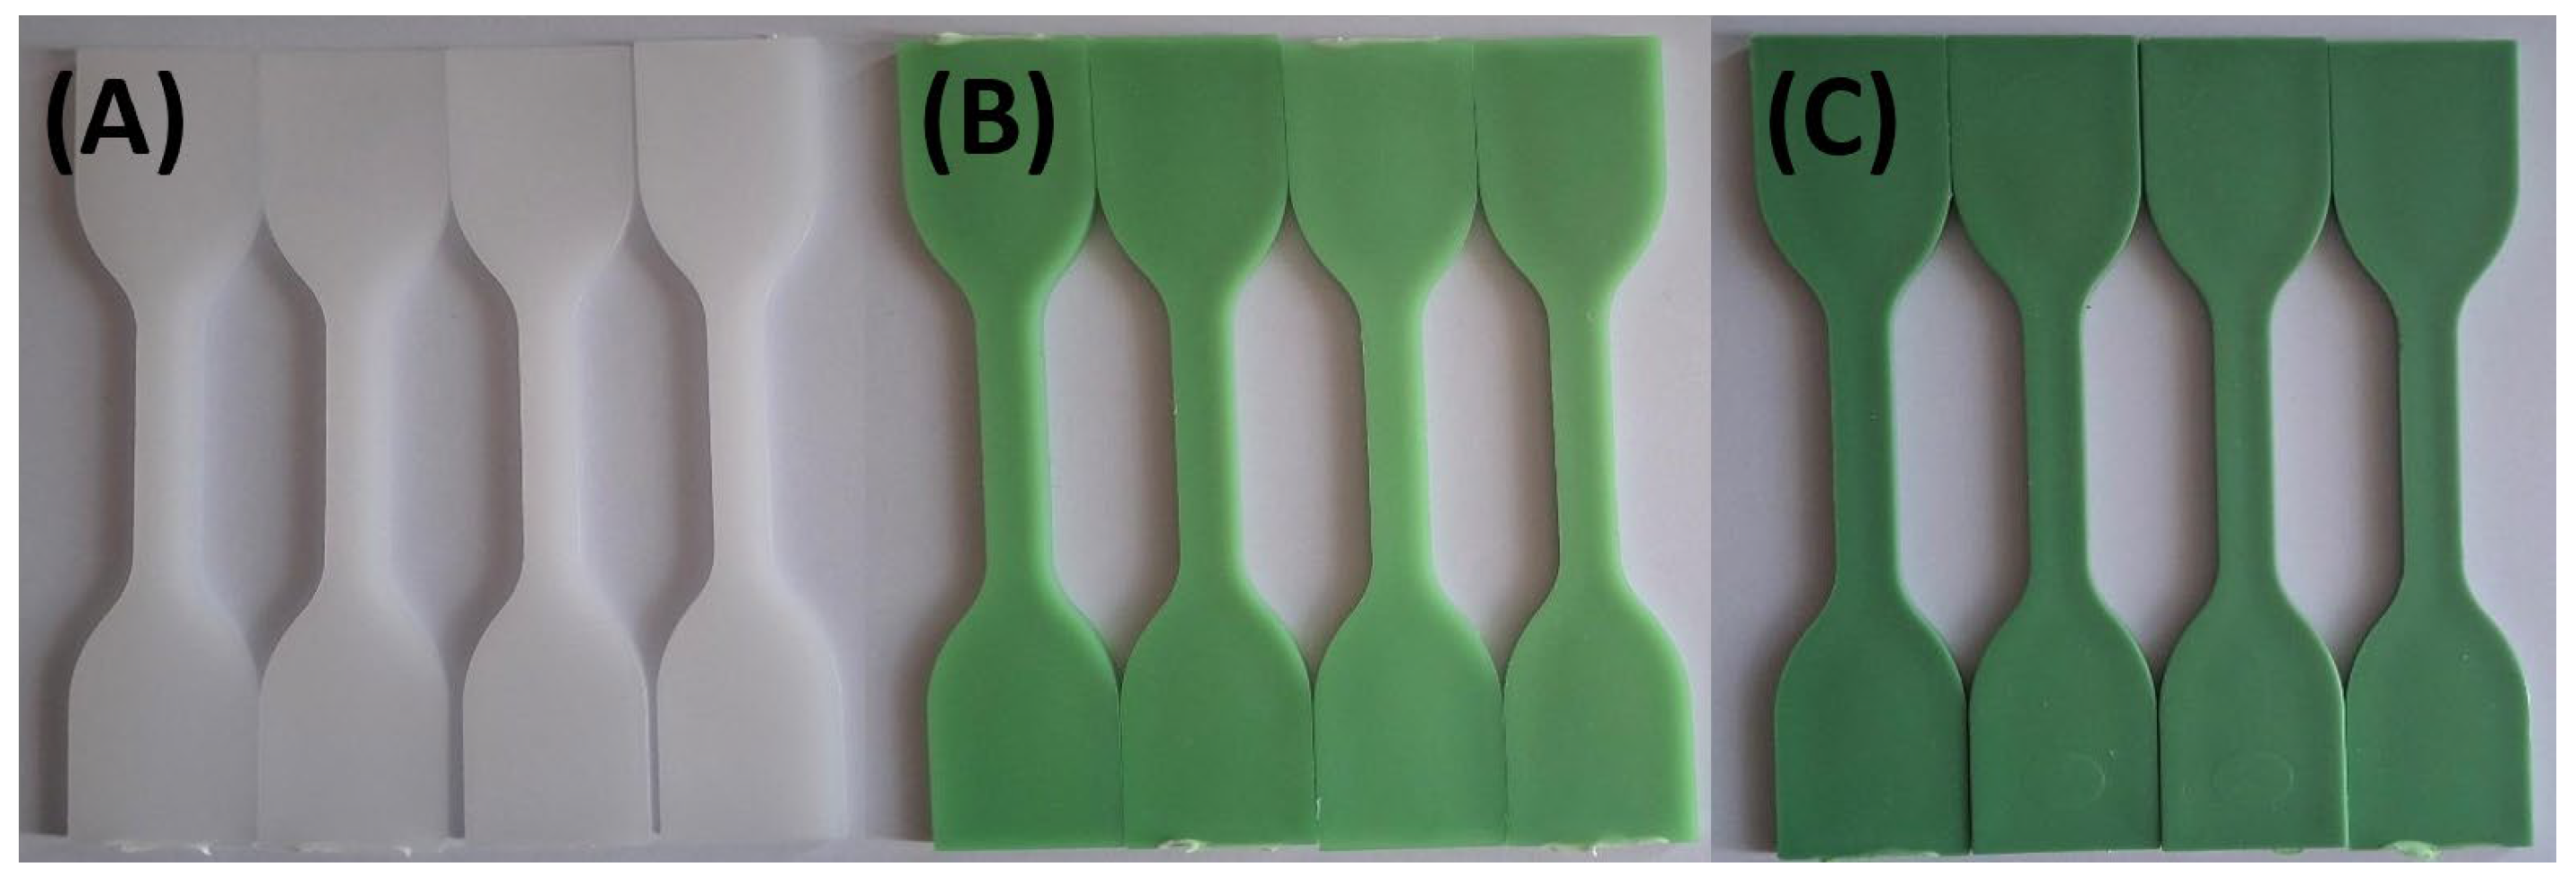
Figure 6.
Visual color changes in (A) HDPE100/TP0, (B) HDPE98/TP2, and (C) HDPE92/TP8 before and after exposure to bleach solution. Each set shows samples in the order: unexposed (control), 24 hours, 48 hours, and 72 hours.
Figure 6.
Visual color changes in (A) HDPE100/TP0, (B) HDPE98/TP2, and (C) HDPE92/TP8 before and after exposure to bleach solution. Each set shows samples in the order: unexposed (control), 24 hours, 48 hours, and 72 hours.
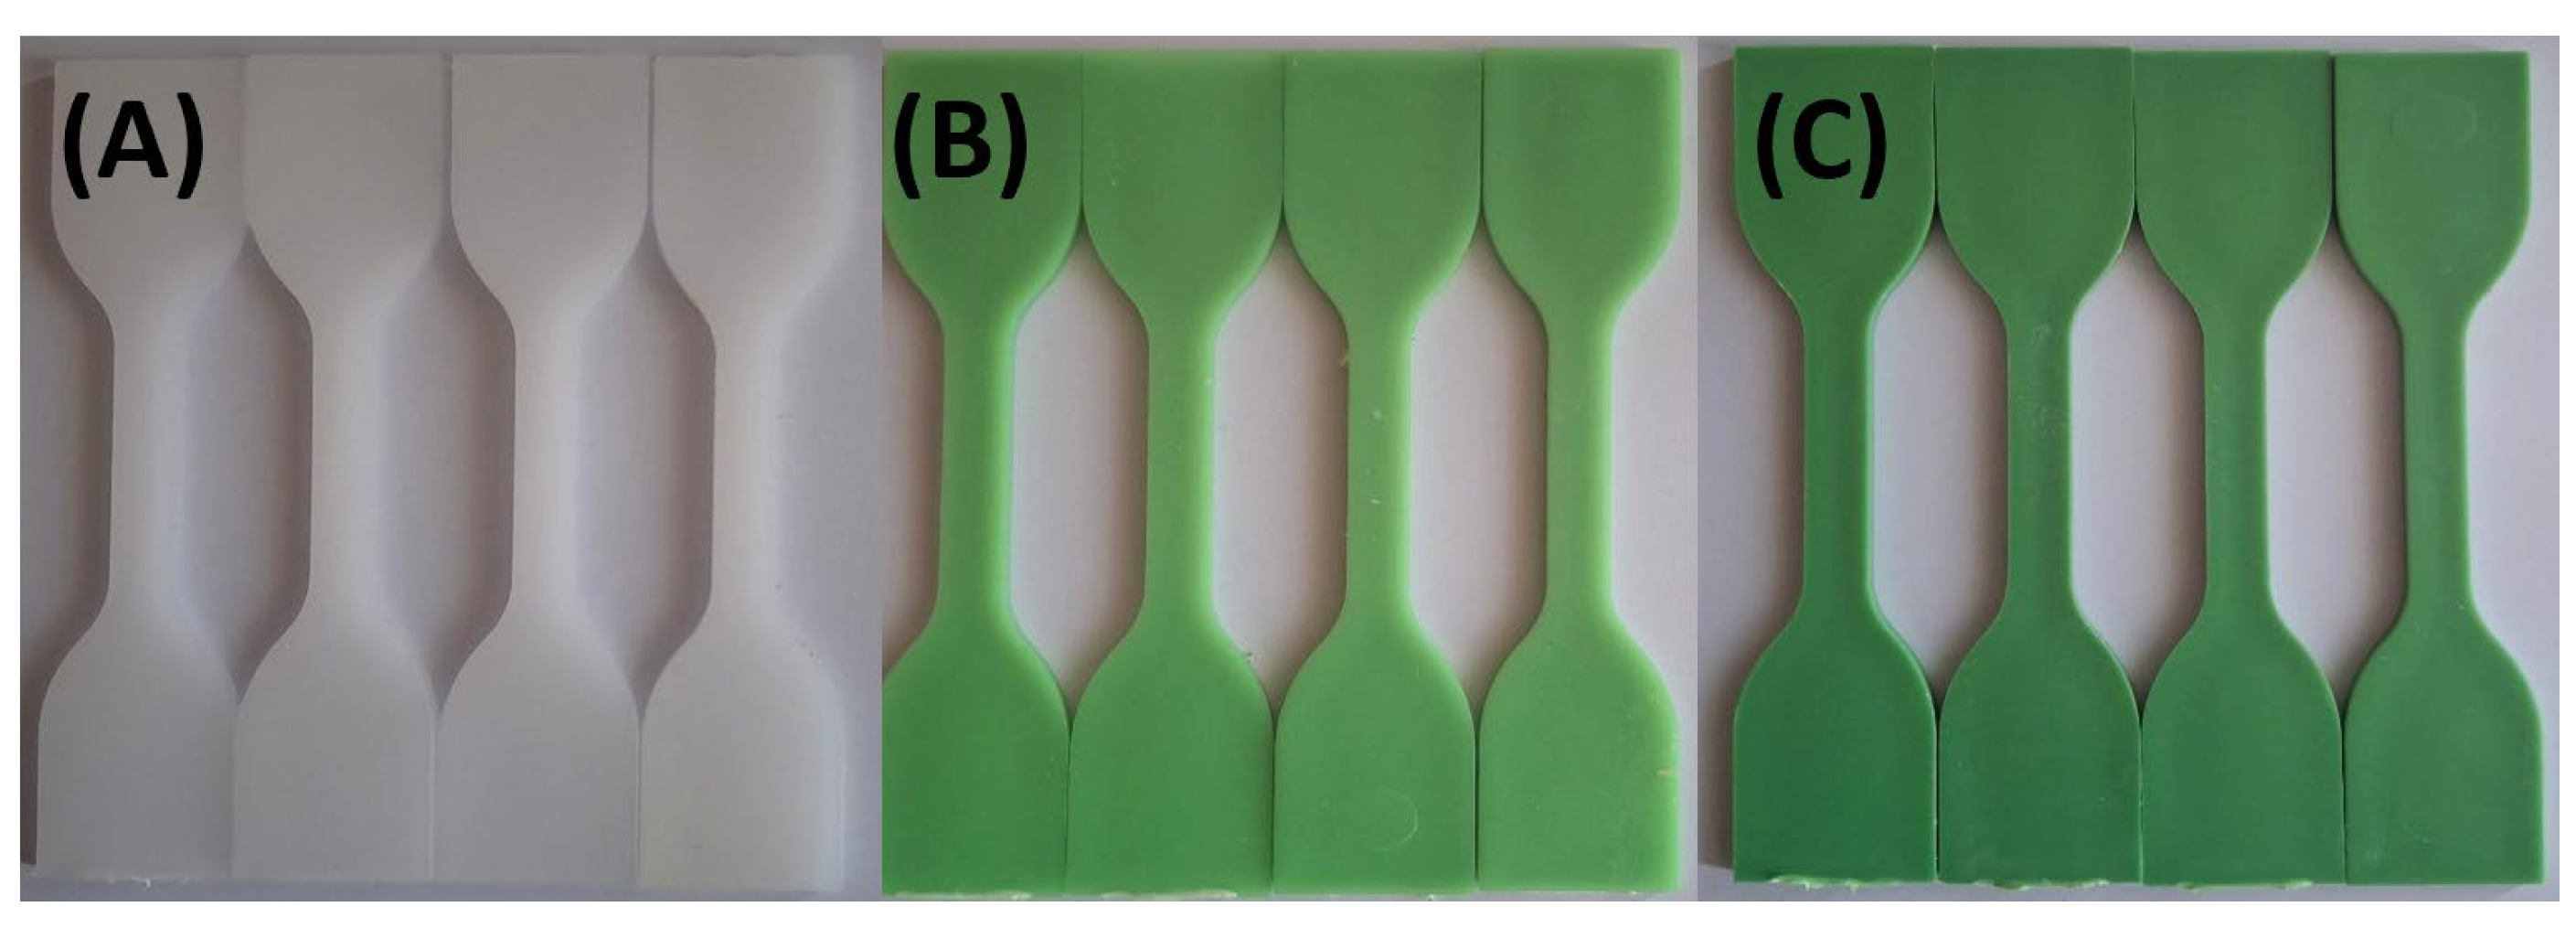
Figure 7.
SEM micrographs of HDPE100/TP0 post-72-hour exposure – 100 × magnification, (A) lemon juice, (B) orange juice, (C) tap water, (D) hydroalcoholic solution, (E) vegetable oil, (F) bleach solution.
Figure 7.
SEM micrographs of HDPE100/TP0 post-72-hour exposure – 100 × magnification, (A) lemon juice, (B) orange juice, (C) tap water, (D) hydroalcoholic solution, (E) vegetable oil, (F) bleach solution.
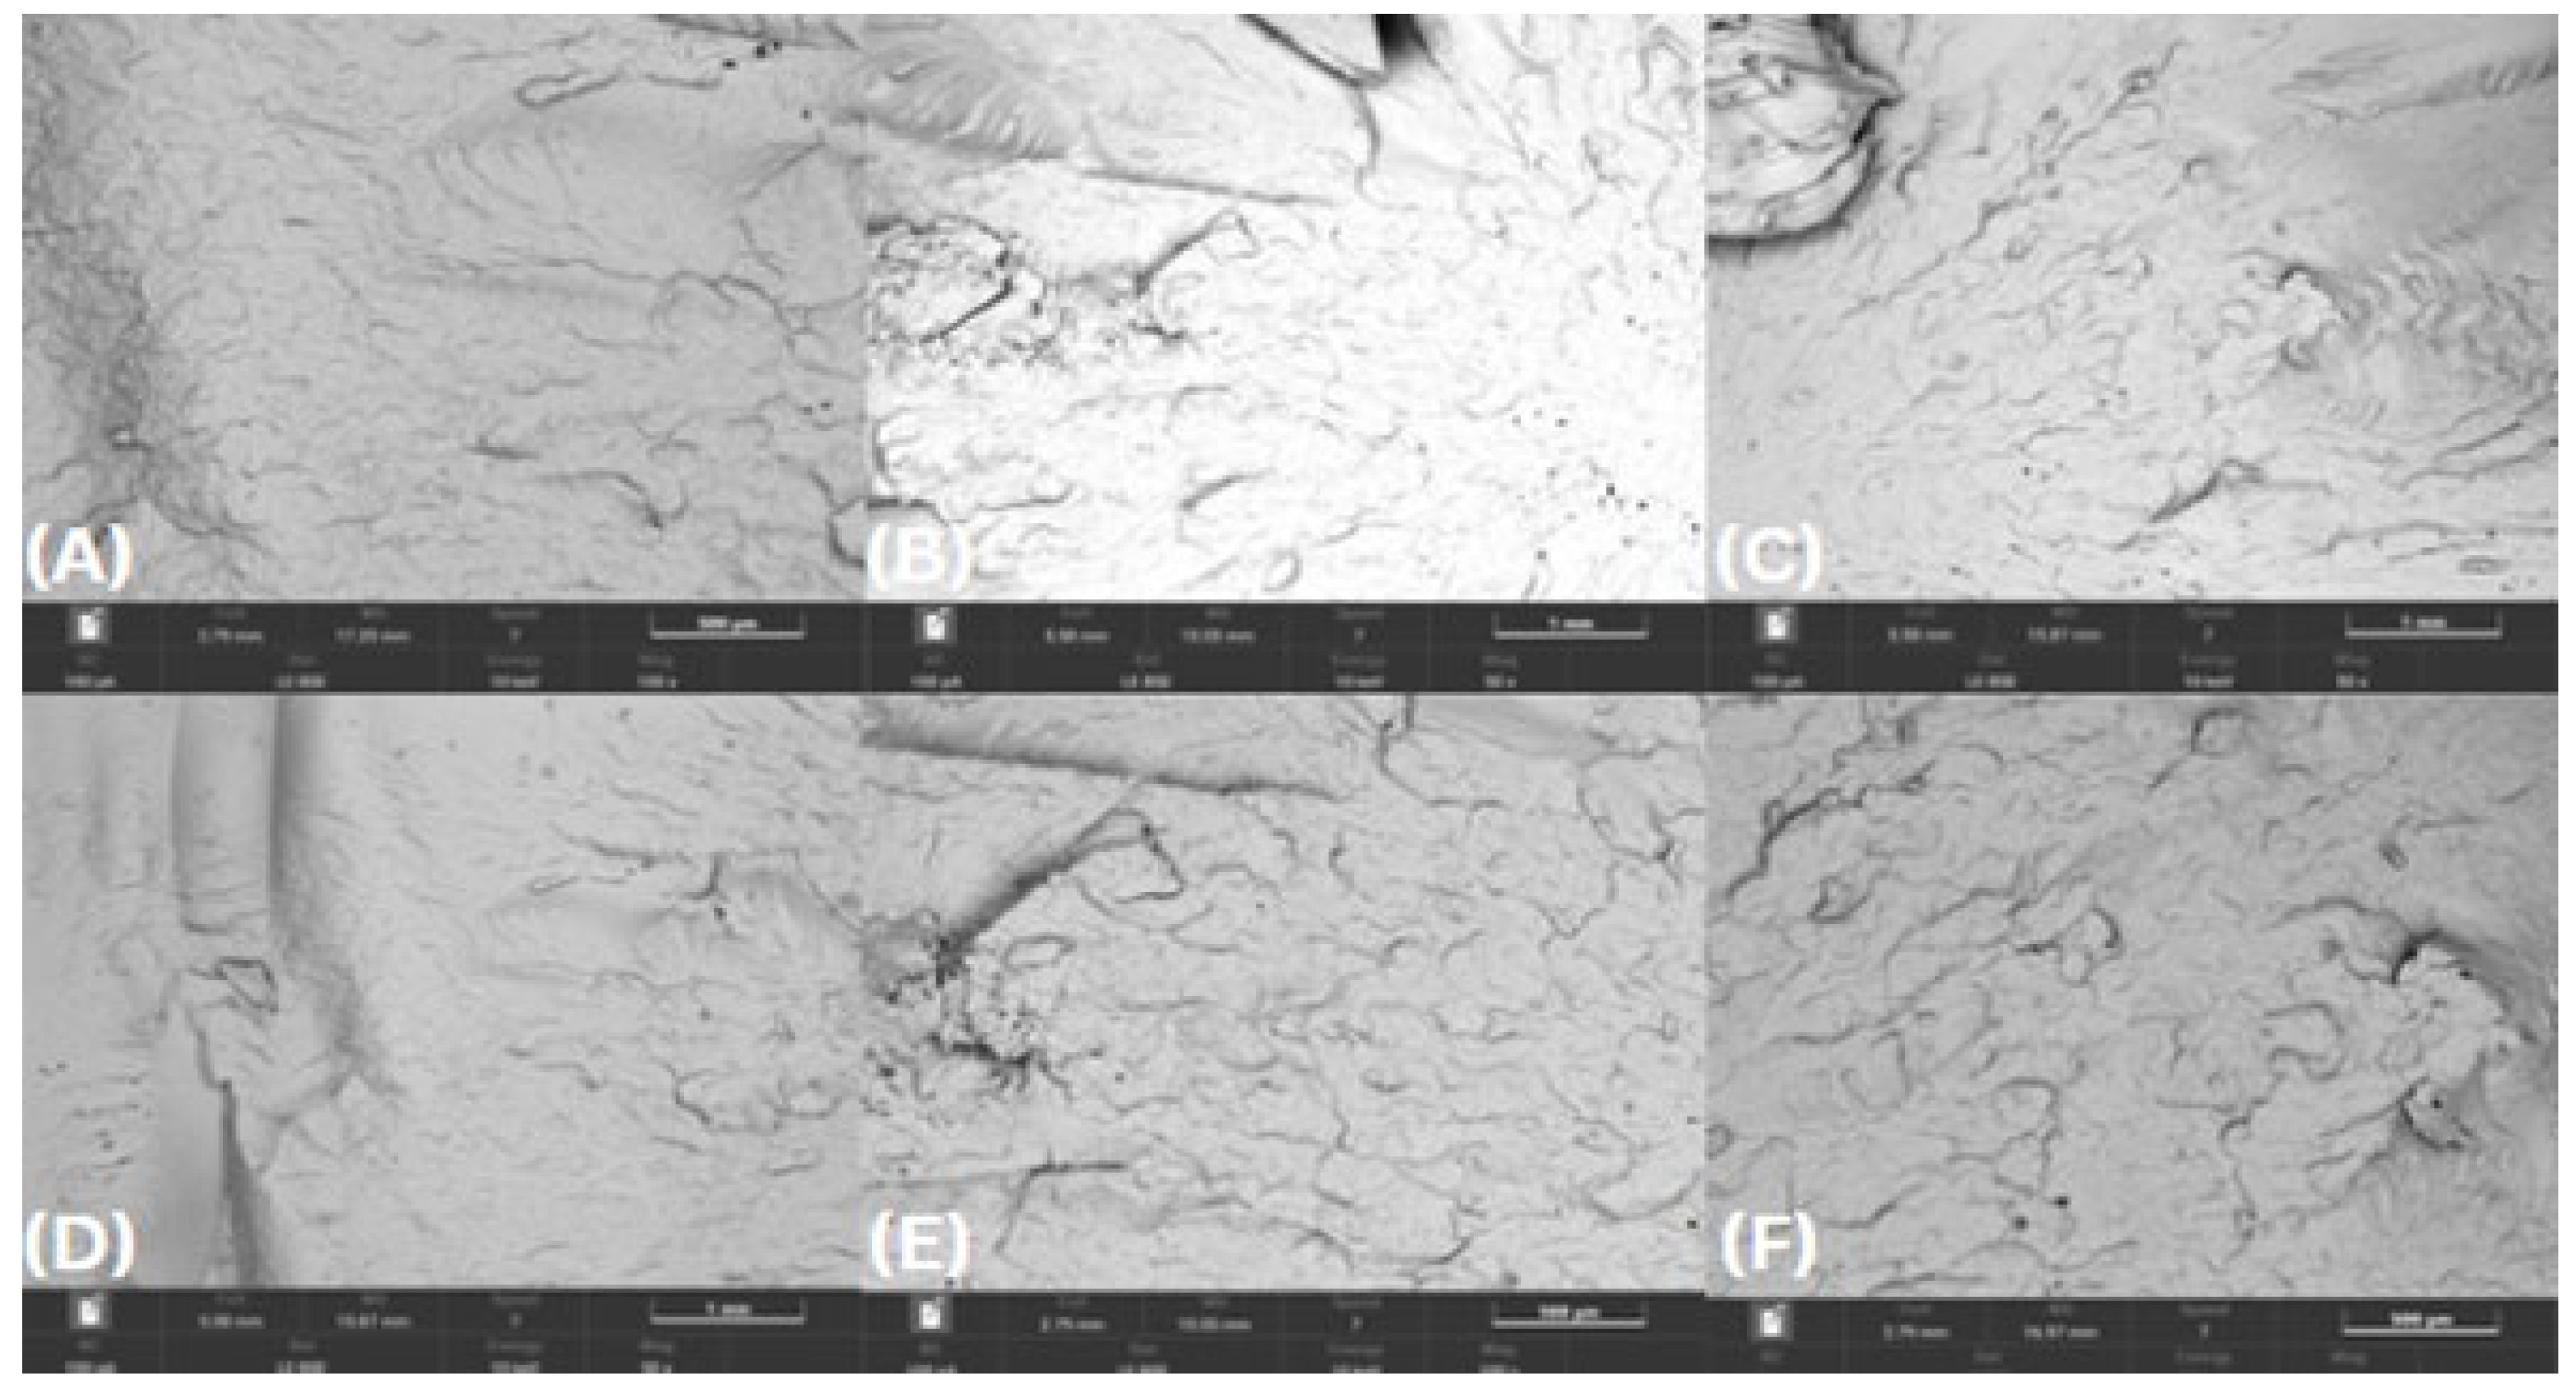
Figure 8.
SEM micrographs of HDPE98/TP2 post-72-hour exposure – 100 × magnification, (A) lemon juice, (B) orange juice, (C) tap water, (D) hydroalcoholic solution, (E) vegetable oil, (F) bleach solution.
Figure 8.
SEM micrographs of HDPE98/TP2 post-72-hour exposure – 100 × magnification, (A) lemon juice, (B) orange juice, (C) tap water, (D) hydroalcoholic solution, (E) vegetable oil, (F) bleach solution.
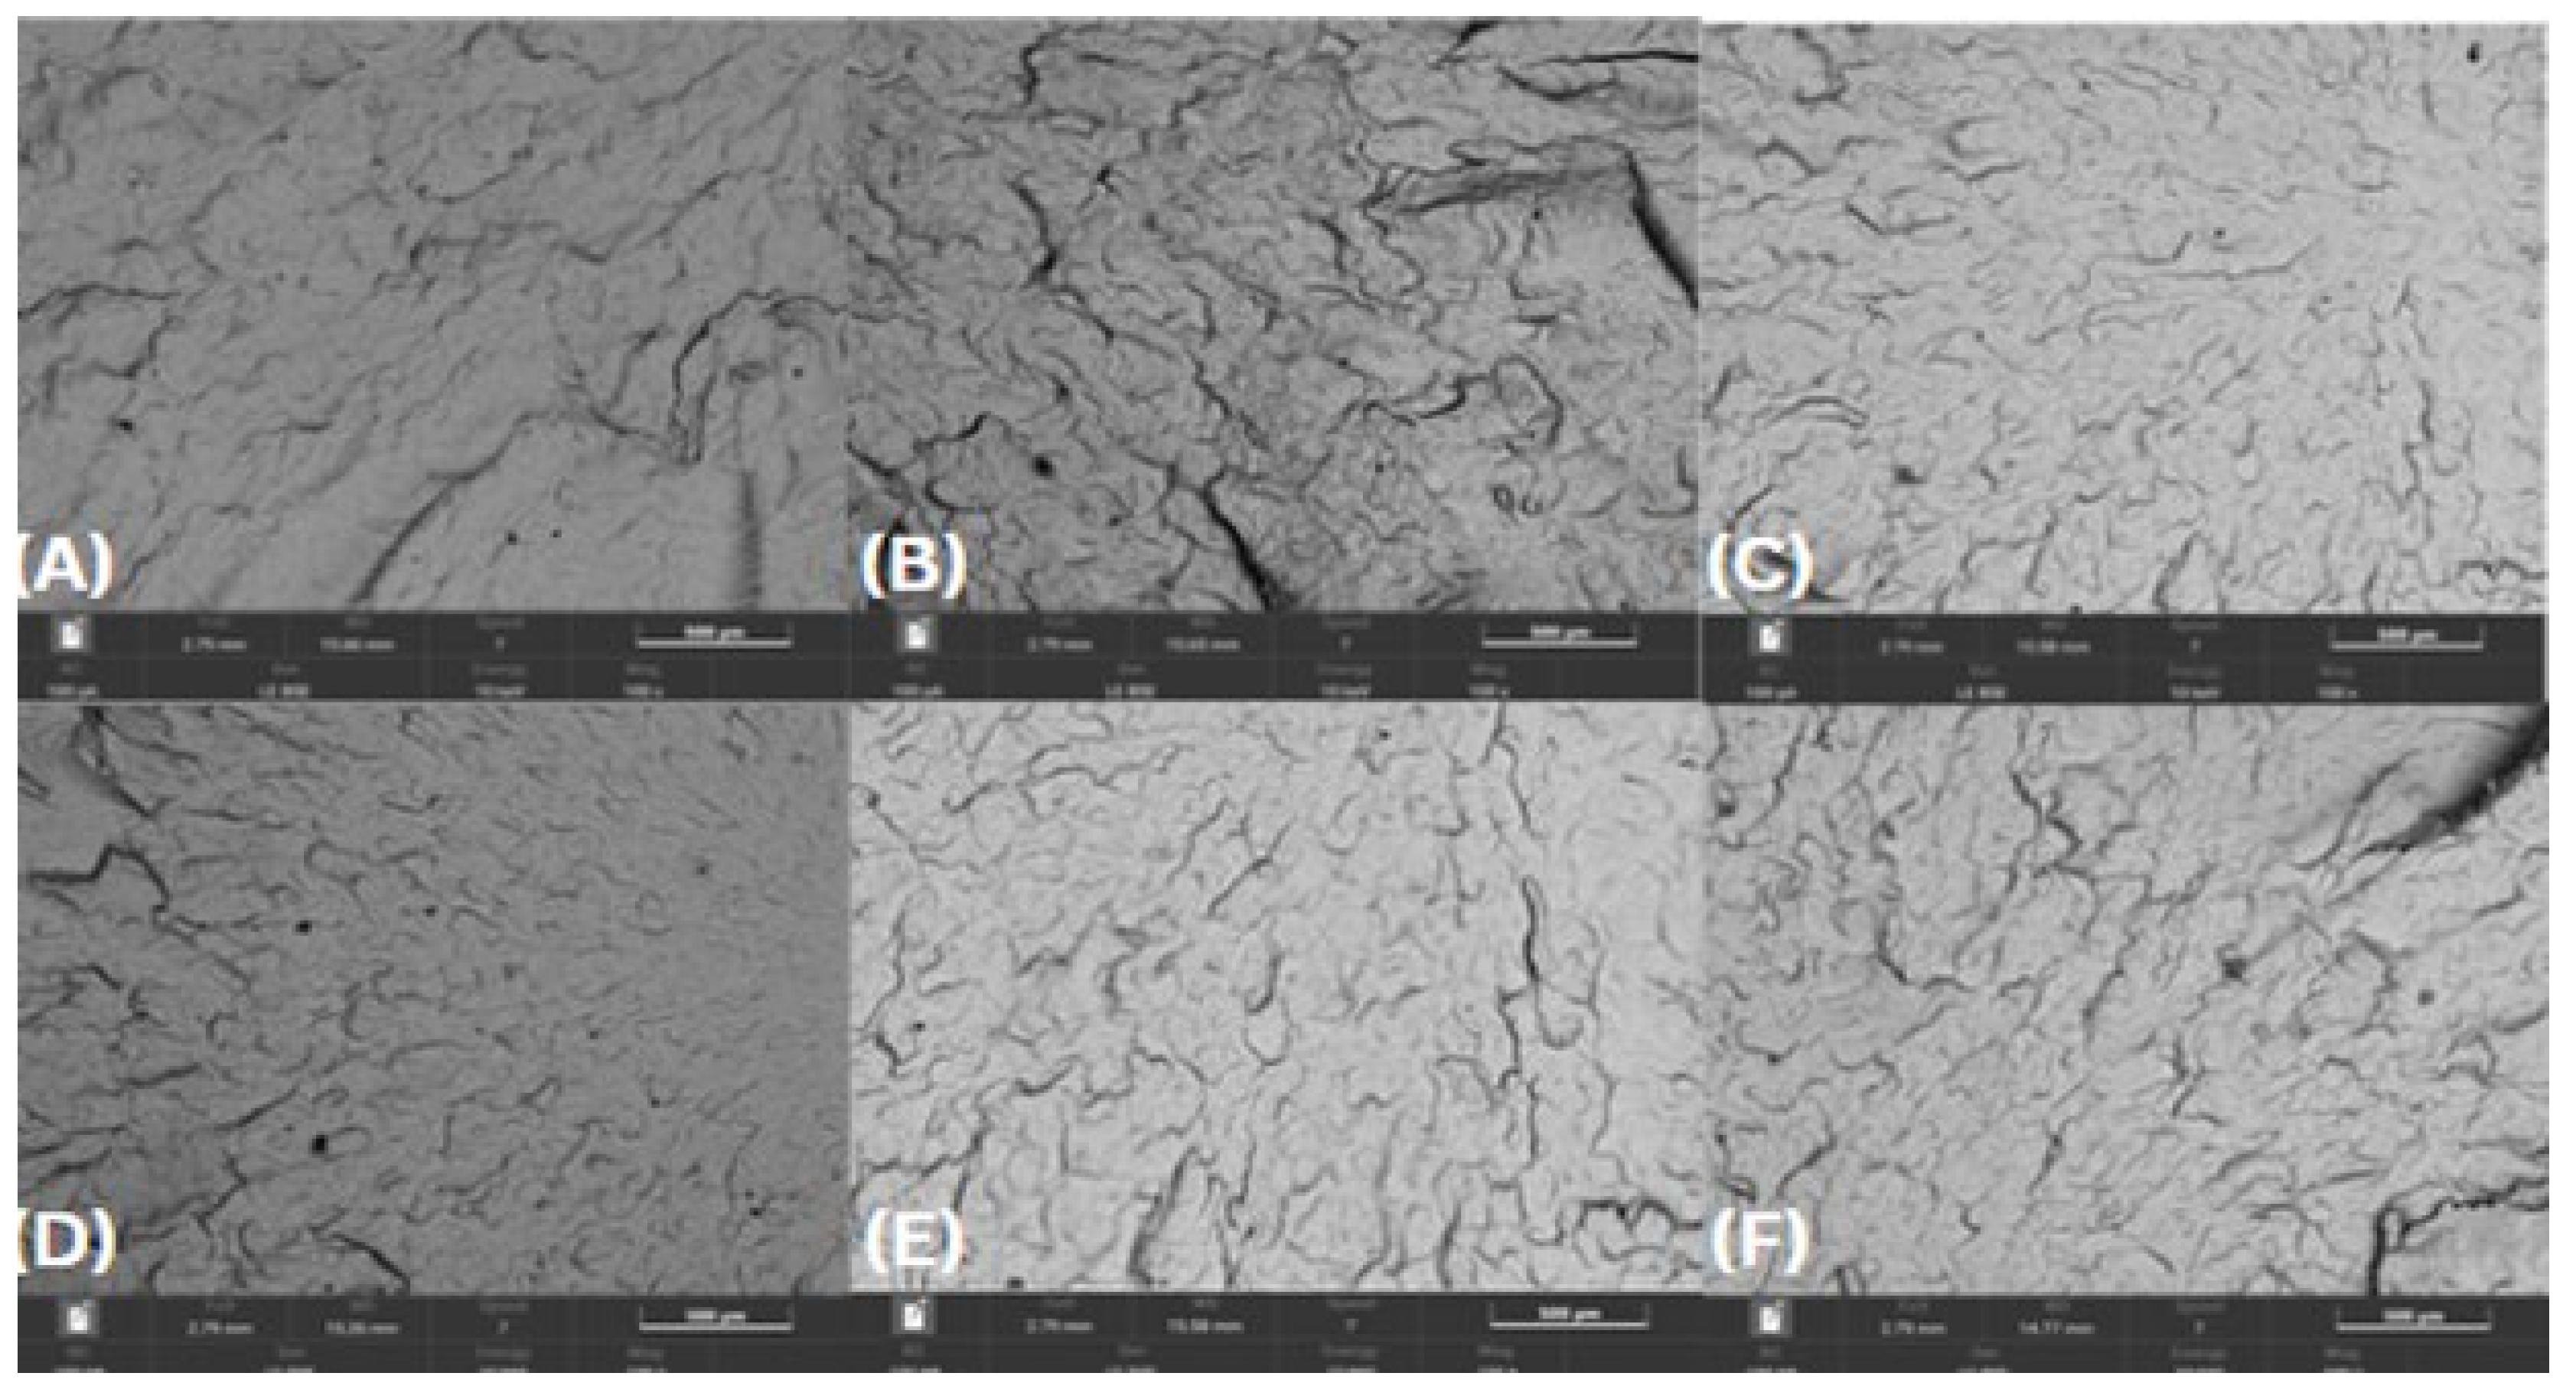
Figure 9.
SEM micrographs of HDPE92/TP8 post-72-hour exposure – 100 × magnification, (A) lemon juice, (B) orange juice, (C) tap water, (D) hydroalcoholic solution, (E) vegetable oil, (F) bleach solution.
Figure 9.
SEM micrographs of HDPE92/TP8 post-72-hour exposure – 100 × magnification, (A) lemon juice, (B) orange juice, (C) tap water, (D) hydroalcoholic solution, (E) vegetable oil, (F) bleach solution.
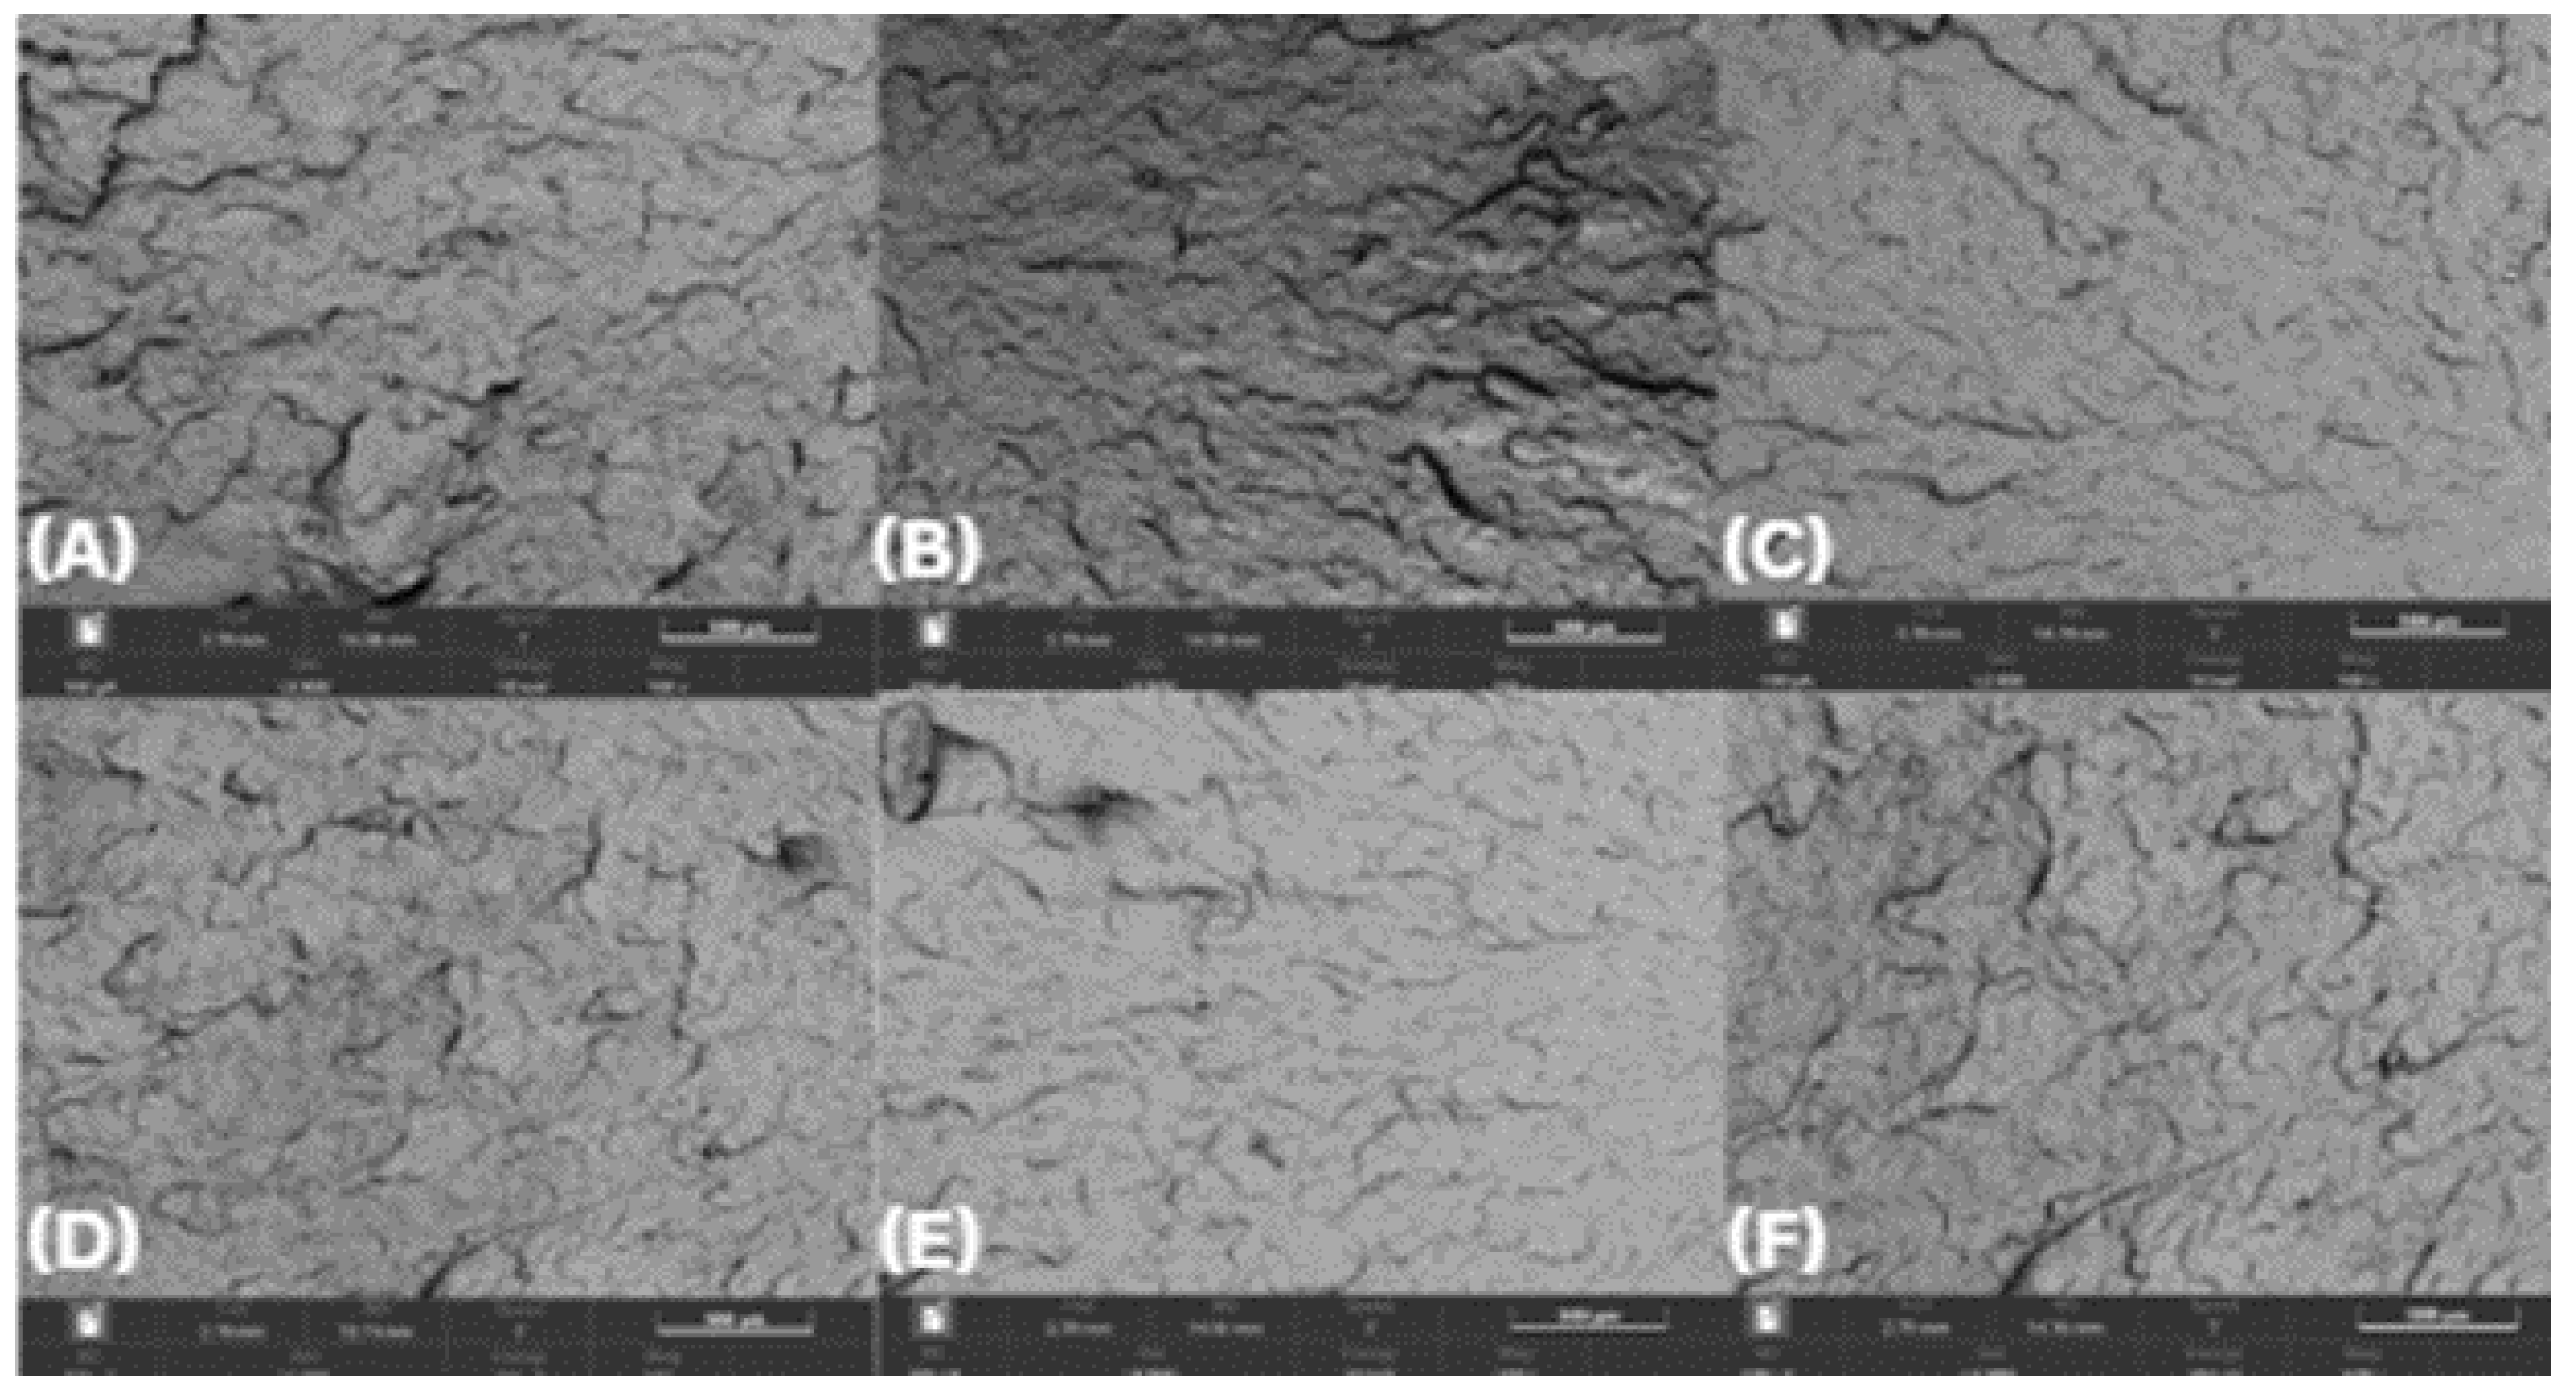

Table 1.
Blend compositions prepared for this study.
| Sample Name | HDPE (wt. %) | TP (wt. %) |
| HDPE100/TP0 | 100 | 0 |
| HDPE98/TP2 | 98 | 2 |
| HDPE92/TP8 | 92 | 8 |
Table 2.
Solution type, test substance, concentration, measured pH, and exposure time for chemical resistance testing.
Table 2.
Solution type, test substance, concentration, measured pH, and exposure time for chemical resistance testing.
| Solution Type | Test Substance | Concentration (%) | Measured pH | Exposure Time (h) |
| Acidic | Lemon juice | 100% | 2.3 | 0, 24, 48, 72 |
| Acidic / Aqueous | Orange juice | 100% | 3.8 | 0, 24, 48, 72 |
| Neutral Solution | Tap water | 100% | 7.0 | 0, 24, 48, 72 |
| Solvent-Based | Hydroalcoholic solution | 40% | 7.2 | 0, 24, 48, 72 |
| Oil-based Solution | Vegetable oil | 100% | N/A | 0, 24, 48, 72 |
| Alkaline Solution | Bleach solution | 5% | 12.5 | 0, 24, 48, 72 |
Table 3.
Total color difference (ΔE*ab) for thermochromic polymer specimens after exposure to food-contact solutions.
Table 3.
Total color difference (ΔE*ab) for thermochromic polymer specimens after exposure to food-contact solutions.
| Specimen ID | Solution Type | ΔE*ab 24 h | ΔE*ab 48 h | ΔE*ab 72 h |
| HDPE100/TP0 | Lemon juice | 0.42 (±0.03) | 1.61 (±0.09) | 1.73 (±0.04) |
| Orange juice | 0.48 (±0.02) | 1.64 (±0.07) | 1.89 (±0.09) | |
| Tap water | 0.11 (±0.01) | 0.19 (±0.01) | 0.23 (±0.02) | |
| Hydroalcoholic solution | 0.22 (±0.09) | 0.31 (±0.07) | 0.42 (±0.05) | |
| Vegetable oil | 0.27 (±0.03) | 0.61 (±0.09) | 0.73 (±0.04) | |
| Bleach solution | 0.40 (±0.11) | 1.51 (±0.06) | 1.66 (±0.03) | |
| HDPE98/TP2 | Lemon juice | 0.92 (±0.11) | 1.61 (±0.14) | 1.94 (±0.19) |
| Orange juice | 1.05 (±0.13) | 1.64 (±0.17) | 2.09 (±0.21) | |
| Tap water | 0.19 (±0.09) | 0.27 (±0.11) | 0.42 (±0.12) | |
| Hydroalcoholic solution | 0.38 (±0.12) | 0.50 (±0.18) | 0.62 (±0.22) | |
| Vegetable oil | 0.42 (±0.23) | 0.61 (±0.19) | 0.93 (±0.14) | |
| Bleach solution | 0.83 (±0.21) | 1.46 (±0.22) | 1.73 (±0.19) | |
| HDPE92/TP8 | Lemon juice | 1.21 (±0.11) | 2.52 (±0.22) | 3.54 (±0.32) |
| Orange juice | 1.37 (±0.12) | 2.76 (±0.17) | 3.75 (±0.29) | |
| Tap water | 0.31 (±0.11) | 0.45 (±0.11) | 0.51 (±0.12) | |
| Hydroalcoholic solution | 0.23 (±0.09) | 0.42 (±0.12) | 0.98 (±0.21) | |
| Vegetable oil | 0.69 (±0.11) | 0.87 (±0.19) | 0.95 (±0.14) | |
| Bleach solution | 1.11 (±0.13) | 2.34 (±0.21) | 3.30 (±0.19) |
Table 4.
The effect of exposure to five different test substances on the moisture content of HDPE100/TP0, HDPE98/TP2, and HDPE92/TP8 after 0, 24, 48, and 72 hours.
Table 4.
The effect of exposure to five different test substances on the moisture content of HDPE100/TP0, HDPE98/TP2, and HDPE92/TP8 after 0, 24, 48, and 72 hours.
| Specimen ID. | Test Substance | Moisture Content (%) (0 Exposure) | Moisture Content (%) (After 24 h) | Moisture Content (%) (After 48 h) | Moisture Content (%) (After 72 h) |
| HDPE100/TP0 | Control | 0.02 (±0.01) | 0.02 (±0.01) | 0.02 (±0.01) | 0.02 (±0.01) |
| Lemon juice | 0.02 (±0.02) | 0.05 (±0.02) | 0.09 (±0.02) | 0.12 (±0.02) | |
| Orange juice | 0.02 (±0.02) | 0.07 (±0.02) | 0.12 (±0.02) | 0.15 (±0.02) | |
| Tap water | 0.02 (±0.01) | 0.04 (±0.01) | 0.06 (±0.01) | 0.08 (±0.01) | |
| Hydroalcoholic solution | 0.02 (±0.01) | 0.02 (±0.01) | 0.06 (±0.01) | 0.08 (±0.01) | |
| Vegetable oil | 0.02 (±0.01) | 0.03 (±0.01) | 0.07 (±0.01) | 0.08 (±0.01) | |
| Bleach solution | 0.02 (±0.02) | 0.04 (±0.02) | 0.08 (±0.02) | 0.10 (±0.02) | |
| HDPE98/TP2 | Control | 0.03 (±0.01) | 0.03 (±0.01) | 0.03 (±0.01) | 0.03 (±0.01) |
| Lemon juice | 0.03 (±0.02) | 0.07 (±0.01) | 0.12 (±0.01) | 0.15 (±0.01) | |
| Orange juice | 0.03 (±0.02) | 0.10 (±0.01) | 0.16 (±0.01) | 0.19 (±0.01) | |
| Tap water | 0.03 (±0.01) | 0.06 (±0.01) | 0.08 (±0.01) | 0.10 (±0.01) | |
| Hydroalcoholic solution | 0.03 (±0.01) | 0.03 (±0.01) | 0.03 (±0.01) | 0.03 (±0.01) | |
| Vegetable oil | 0.03 (±0.01) | 0.03 (±0.01) | 0.03 (±0.01) | 0.03 (±0.01) | |
| Bleach solution | 0.03 (±0.02) | 0.06 (±0.02) | 0.10 (±0.03) | 0.12 (±0.03) | |
| HDPE92/TP8 | Control | 0.04 (±0.01) | 0.04 (±0.01) | 0.04 (±0.01) | 0.04 (±0.01) |
| Lemon juice | 0.04 (±0.02) | 0.09 (±0.02) | 0.15 (±0.02) | 0.18 (±0.02) | |
| Orange juice | 0.04 (±0.02) | 0.12 (±0.03) | 0.19 (±0.03) | 0.22 (±0.03) | |
| Tap water | 0.04 (±0.01) | 0.08 (±0.01) | 0.10 (±0.01) | 0.12 (±0.01) | |
| Hydroalcoholic solution | 0.04 (±0.01) | 0.07 (±0.01) | 0.11 (±0.01) | 0.12 (±0.04) | |
| Vegetable oil | 0.04 (±0.01) | 0.07 (±0.01) | 0.10 (±0.01) | 0.13(±0.03) | |
| Bleach solution | 0.04 (±0.02) | 0.08 (±0.02) | 0.14 (±0.03) | 0.16 (±0.04) |
Table 5.
The effect of different test substances on the mass of HDPE100/TP0, HDPE98/TP2, and HDPE92/TP8 after 0, 24, 48, and 72 hours.
Table 5.
The effect of different test substances on the mass of HDPE100/TP0, HDPE98/TP2, and HDPE92/TP8 after 0, 24, 48, and 72 hours.
| Specimen ID. | Test Substance | Mass Measurement (g) (0 Exposure) | Mass Measurement (g) (After 24 h) | Mass Measurement (g) (After 48 h) | Mass Measurement (g) (After 72 h) |
| HDPE100/TP0 | Control | 3.724 (±0.00) | 3.724 (±0.00) | 3.724 (±0.00) | 3.724 (±0.00) |
| Lemon juice | 3.724 (±0.02) | 3.726 (±0.02) | 3.736 (±0.03) | 3.738 (±0.04) | |
| Orange juice | 3.724 (±0.02) | 3.727 (±0.04) | 3.738 (±0.03) | 3.741 (±0.05) | |
| Tap water | 3.724 (±0.01) | 3.725 (±0.01) | 3.725 (±0.02) | 3.725 (±0.01) | |
| Hydroalcoholic solution | 3.724 (±0.01) | 3.725 (±0.02) | 3.726 (±0.01) | 3.726 (±0.02) | |
| Vegetable oil | 3.724 (±0.01) | 3.725 (±0.02) | 3.726 (±0.02) | 3.726 (±0.02) | |
| Bleach solution | 3.724 (±0.01) | 3.725 (±0.02) | 3.732 (±0.03) | 3.735 (±0.04) | |
| HDPE98/TP2 | Control | 3.724 (±0.00) | 3.724 (±0.00) | 3.724 (±0.00) | 3.724 (±0.00) |
| Lemon juice | 3.724 (±0.02) | 3.727 (±0.02) | 3.730 (±0.03) | 3.732 (±0.04) | |
| Bleach | 3.724 (±0.02) | 3.728 (±0.04) | 3.737 (±0.03) | 3.739 (±0.05) | |
| Tap water | 3.724 (±0.01) | 3.725 (±0.01) | 3.727 (±0.02) | 3.728 (±0.01) | |
| Hydroalcoholic solution | 3.724 (±0.01) | 3.724 (±0.02) | 3.724 (±0.01) | 3.725 (±0.02) | |
| Vegetable oil | 3.724 (±0.01) | 3.725 (±0.02) | 3.725 (±0.02) | 3.726 (±0.02) | |
| Bleach solution | 3.724 (±0.02) | 3.726 (±0.04) | 3.729 (±0.03) | 3.730 (±0.05) | |
| HDPE92/TP8 | Control | 3.724 (±0.00) | 3.724 (±0.00) | 3.724 (±0.00) | 3.724 (±0.00) |
| Lemon juice | 3.724 (±0.01) | 3.728 (±0.02) | 3.730 (±0.03) | 3.733 (±0.04) | |
| Orange juice | 3.724 (±0.02) | 3.729 (±0.02) | 3.732 (±0.03) | 3.733 (±0.04) | |
| Tap water | 3.724 (±0.01) | 3.726 (±0.01) | 3.727 (±0.02) | 3.728 (±0.01) | |
| Hydroalcoholic solution | 3.724 (±0.01) | 3.725 (±0.02) | 3.726 (±0.01) | 3.727 (±0.02) | |
| Vegetable oil | 3.724 (±0.01) | 3.725 (±0.02) | 3.726 (±0.02) | 3.726 (±0.02) | |
| Bleach solution | 3.724 (±0.02) | 3.727 (±0.04) | 3.729(±0.03) | 3.731 (±0.05) |
Table 6.
The effect of different test substances on the activation temperature of HDPE100/TP0, HDPE98/TP2, and HDPE92/TP8 before and after 100 thermal cycles.
Table 6.
The effect of different test substances on the activation temperature of HDPE100/TP0, HDPE98/TP2, and HDPE92/TP8 before and after 100 thermal cycles.
| Specimen ID. | Test Substance | Initial Activation Temp. (°C) | Final Activation Temp. (°C) |
| HDPE98/TP2 | Control | 38.1 | 38.1 |
| Lemon juice | 38.2 | 36.2 | |
| Orange juice | 38.2 | 35.5 | |
| Tap water | 38.3 | 37.9 | |
| Hydroalcoholic solution | 38.2 | 37.6 | |
| Vegetable oil | 38.0 | 37.5 | |
| Bleach solution | 38.2 | 36.4 | |
| HDPE92/TP8 | Control | 38.1 | 38.1 |
| Lemon juice | 38.1 | 35.5 | |
| Orange juice | 38.4 | 34.2 | |
| Tap water | 38.3 | 37.6 | |
| Hydroalcoholic solution | 38.1 | 37.2 | |
| Vegetable oil | 38.2 | 36.9 | |
| Bleach solution | 38.3 | 35.9 |
Table 7.
The effect of different test substances on the tensile strength of HDPE100/TP0 post 0, 24, 48 and 72 hours.
Table 7.
The effect of different test substances on the tensile strength of HDPE100/TP0 post 0, 24, 48 and 72 hours.
| Specimen ID. | Test Substance | Time (h) | Tensile Strain (Displacement at Break) (%) | Maximum Tensile Stress (MPa) | Youngs Modulus (MPa) |
| HDPE100/TP0 | Lemon juice | 0 | 90.27 (±7.89) | 29.85 (±1.32) | 785.83 (±12.30) |
| 24 | 85.26 (±11.23) | 28.26 (±1.48) | 741.55 (±14.41) | ||
| 48 | 80.04 (±12.31) | 28.96 (±1.13) | 716.80 (±11.32) | ||
| 72 | 103.29 (±13.76) | 28.07 (±1.54) | 710.20 (±13.85) | ||
| Orange juice | 0 | 100.84 (±7.11) | 30.80 (±1.21) | 743.49 (±12.23) | |
| 24 | 110.05 (±12.97) | 31.25 (±1.41) | 708.60 (±12.11) | ||
| 48 | 85.27(±10.11) | 32.24 (±1.56) | 760.16 (±12.56) | ||
| 72 | 80.22 (±12.45) | 33.30 (±1.43) | 797.10 (±12.87) | ||
| Tap water | 0 | 80.24 (±7.76) | 28.48 (±1.43) | 741.57 (±13.21) | |
| 24 | 100.41 (±8.56) | 30.88 (±1.76) | 715.07 (±11.99) | ||
| 48 | 101.05 (±9.98) | 29.40 (±1.34) | 782.69 (±12.54) | ||
| 72 | 100.36 (±8.09) | 30.00 (±1.32) | 786.18 (±11.13) | ||
| Hydroalcoholic solution | 0 | 86.73 (±7.09) | 28.38 (±1.21) | 727.93 (±11.83) | |
| 24 | 100.84 (±8.11) | 30.97 (±1.98) | 808.31 (±11.54) | ||
| 48 | 95.61 (±10.12) | 29.17 (±1.56) | 704.57 (±12.12) | ||
| 72 | 90.73 (±11.59) | 33.72 (±1.45) | 797.33 (±12.89) | ||
| Vegetable oil | 0 | 100.38 (±8.12) | 28.69 (±1.65) | 749.32 (±13.32) | |
| 24 | 80.22 (±11.67) | 28.35 (±1.25) | 761.54 (±14.01) | ||
| 48 | 100.37 (±12.21) | 30.31 (±1.71) | 748.11 (±12.03) | ||
| 72 | 95.49 (±9.11) | 31.47 (±2.44) | 750.82 (±13.72) | ||
| Bleach solution | 0 | 100.38 (±9.12) | 28.69 (±1.87) | 749.32 (±11.58) | |
| 24 | 95.28 (±9.78) | 29.61 (±1.94) | 782.14 (±13.91) | ||
| 48 | 90.52(±8.99) | 29.12 (±1.43) | 742.75 (±14.32) | ||
| 72 | 85.56 (±11.45) | 27.60 (±1.02) | 694.36 (±13.98) |
Table 8.
The effect of different test substances on the tensile strength of P98/TP2 post 0, 24, 48 and 72 hours.
Table 8.
The effect of different test substances on the tensile strength of P98/TP2 post 0, 24, 48 and 72 hours.
| Specimen ID. | Test Substance | Time (h) | Tensile Strain (Displacement at Break) (%) | Maximum Tensile Stress (MPa) | Youngs Modulus (MPa) |
| HDPE98/TP2 | 0 | 95.75 (±7.89) | 28.89 (±1.12) | 647.29 (±13.11) | |
| Lemon juice | 24 | 100.55 (±7.31) | 29.60 (±1.54) | 755.85 (±14.23) | |
| 48 | 96.47 (±7.64) | 28.92 (±1.56) | 766.31 (±14.51) | ||
| 72 | 90.45 (±7.19) | 28.55 (±1.93) | 756.33 (±13.25) | ||
| Orange juice | 0 | 100.32 (±8.49) | 33.62 (±1.89) | 816.49 (±14.23) | |
| 24 | 95.24 (±9.34) | 32.87 (±1.54) | 784.96 (±12.65) | ||
| 48 | 96.01 (±10.24) | 31.86 (±1.53) | 765.22 (±12.13) | ||
| 72 | 102.00 (±11.32) | 30.68 (±1.72) | 688.22 (±13.45) | ||
| Tap water | 0 | 95.34 (±7.99) | 28.01 (±1.89) | 662.96 (±14.54) | |
| 24 | 90.28 (±8.63) | 29.16 (±1.31) | 704.47 (±14.39) | ||
| 48 | 85.32 (±9.65) | 31.58 (±1.65) | 708.79 (±14.32) | ||
| 72 | 80.56 (±8.35) | 31.61 (±1.42) | 724.91 (±12.65) | ||
| Hydroalcoholic solution | 0 | 86.73 (±8.65) | 28.38 (±1.89) | 727.93 (±13.90) | |
| 24 | 80.26 (±8.43) | 31.42 (±1.68) | 759.33 (±14.94) | ||
| 48 | 100.90 (±8.12) | 28.03 (±1.75) | 655.97 (±13.10) | ||
| 72 | 95.52 (±8.99) | 30.24 (±1.24) | 662.82 (±14.82) | ||
| Vegetable oil | 0 | 86.73 (±9.47) | 28.38 (±1.48) | 727.93 (±15.12) | |
| 24 | 100.66 (±9.57) | 28.66 (±1.02) | 683.2 (±12.13) | ||
| 48 | 95.55 (±8.62) | 28.66 (±1.49) | 751.81 (±12.63) | ||
| 72 | 90.52 (±9.60) | 31.67 (±1.56) | 729.66 (±12.91) | ||
| Bleach solution | 0 | 80.48 (±10.49) | 30.60 (±1.46) | 707.51 (±13.12) | |
| 24 | 114.13 (±11.94) | 28.17 (±1.95) | 721.67 (±13.34) | ||
| 48 | 100.62 (±10.34) | 31.27 (±1.59) | 751.92 (±13.89) | ||
| 72 | 90.52 (±9.87) | 31.67 (±1.50) | 729.67 (±13.24) |
Table 9.
The effect of different test substances on the tensile strength of HDPE92/TP8 post 0, 24, 48 and 72 hours.
Table 9.
The effect of different test substances on the tensile strength of HDPE92/TP8 post 0, 24, 48 and 72 hours.
| Specimen ID. | Test Substance | Time (h) | Tensile Strain (Displacement at Break) (%) | Maximum Tensile Stress (MPa) | Youngs Modulus (MPa) |
| PR92/TP8 | Lemon juice | 0 | 85.14 (±8.81) | 27.77 (±1.21) | 679.85 (±12.13) |
| 24 | 80.24 (±8.12) | 30.02 (±1.18) | 722.47 (±13.15) | ||
| 48 | 100.56 (±8.31) | 28.63 (±1.17) | 677.96 (±13.26) | ||
| 72 | 95.22 (±8.92) | 32.83 (±1.16) | 746.61 (±13.71) | ||
| Orange juice | 0 | 95.94 (±8.15) | 27.62 (±1.15) | 693.08 (±13.11) | |
| 24 | 90.44 (±8.12) | 28.96 (±1.72) | 680.49 (±12.81) | ||
| 48 | 85.29 (±8.65) | 30.96 (±1.64) | 716.28 (±13.33) | ||
| 72 | 83.73 (±7.38) | 28.64 (±1.27) | 655.66 (±13.82) | ||
| Tap water | 0 | 100.44 (±7.19) | 27.82 (±1.61) | 711.64 (±13.10) | |
| 24 | 96.15 (±8.89) | 28.64 (±1.77) | 715.85 (±13.27) | ||
| 48 | 100.35 (±7.12) | 28.34 (±1.35) | 769.71 (±13.93) | ||
| 72 | 95.64 (±7.38) | 29.03 (±1.82) | 768.21 (±13.41) | ||
| Hydroalcoholic solution | 0 | 101.00 (±7.89) | 28.63 (±1.34) | 729.54 (±13.11) | |
| 24 | 103.65 (±7.23) | 27.99 (±1.78) | 603.05 (±13.31) | ||
| 48 | 92.97 (±7.15) | 27.76 (±1.12) | 679.39 (±13.14) | ||
| 72 | 85.87 (±7.79) | 30.46 (±1.99) | 769.73 (±13.79) | ||
| Vegetable oil | 0 | 90.27 (±7.19) | 29.85 (±1.56) | 785.83 (±13.88) | |
| 24 | 85.25 (±7.68) | 27.58 (±1.38) | 715.51 (±14.76) | ||
| 48 | 80.45 (±7.57) | 27.64 (±1.28) | 744.91 (±14.45) | ||
| 72 | 102.98 (±7.29) | 27.72 (±1.91) | 741.50 (±14.13) | ||
| Bleach solution | 0 | 100.51 (±8.96) | 30.82 (±1.56) | 700.70 (±15.43) | |
| 24 | 95.50 (±8.24) | 28.75 (±1.82) | 705.38 (±15.89) | ||
| 48 | 90.35 (±8.97) | 27.90 (±1.93) | 699.69 (±15.72) | ||
| 72 | 85.30 (±9.19) | 29.64 (±2.26) | 680.35 (±15.11) |
Table 10.
The effect of different test substances on the impact strength of HDPE100/TP0 with and without notch after chemical exposure post 0, 24, 48, and 72 hours.
Table 10.
The effect of different test substances on the impact strength of HDPE100/TP0 with and without notch after chemical exposure post 0, 24, 48, and 72 hours.
| Specimen ID. | Test Substances | Time (h) | Impact Strength (kJ/m2) Unnotched | Impact Strength (kJ/m2) Notched |
| HDPE100/TP0 | Lemon juice | 0 | 99.63 (±1.82) | 23.48 (±1.56) |
| 24 | 99.48 (±1.56) | 23.35 (±1.34) | ||
| 48 | 99.38 (±1.55) | 23.28 (±2.00) | ||
| 72 | 99.28 (±1.98) | 23.15 (±2.56) | ||
| Orange juice | 0 | 99.43 (±1.46) | 23.43 (±1.56) | |
| 24 | 99.38 (±1.76) | 23.28 (±1.65) | ||
| 48 | 99.30 (±2.09) | 23.23 (±1.32) | ||
| 72 | 99.20 (±2.98) | 23.10 (±2.86) | ||
| Tap water | 0 | 99.58 (±1.47) | 23.44 (±1.45) | |
| 24 | 99.43 (±1.95) | 23.38 (±1.72) | ||
| 48 | 99.40 (±1.63) | 23.37 (±1.88) | ||
| 72 | 99.38 (±1.79) | 23.33 (±1.56) | ||
| Hydroalcoholic solution | 0 | 99.68 (±2.56) | 23.36 (±1.06) | |
| 24 | 99.63 (±2.99) | 23.32 (±1.34) | ||
| 48 | 99.63 (±2.66) | 23.28 (±1.32) | ||
| 72 | 99.60 (±2.56) | 23.24 (±1.46) | ||
| Vegetable oil | 0 | 99.88 (±1.57) | 23.33 (±1.21) | |
| 24 | 99.80 (±1.88) | 23.26 (±1.32) | ||
| 48 | 99.78 (±1.65) | 23.21 (±1.11) | ||
| 72 | 99.70 (±1.70) | 23.18 (±1.26) | ||
| Bleach solution | 0 | 99.75 (±1.57) | 23.48 (±1.26) | |
| 24 | 99.70 (±1.64) | 23.37 (±1.45) | ||
| 48 | 99.60 (±1.87) | 23.31 (±1.32) | ||
| 72 | 99.56 (±2.05) | 23.21 (±2.13) |
Table 11.
The effect of different test substances on the impact strength of HDPE98/TP2 with and without notch after chemical exposure post 0, 24, 48, and 72 hours.
Table 11.
The effect of different test substances on the impact strength of HDPE98/TP2 with and without notch after chemical exposure post 0, 24, 48, and 72 hours.
| Specimen ID. | Test Substance | Time (h) | Impact Strength (kJ/m2) Unnotched | Impact Strength (kJ/m2) Notched |
| HDPE98/TP2 | Lemon juice | 0 | 99.68 (±1.87) | 23.48 (±2.56) |
| 24 | 99.40 (±1.99) | 23.35 (±1.34) | ||
| 48 | 99.30 (±1.88) | 23.28 (±2.00) | ||
| 72 | 99.18 (±2.10) | 22.77 (±2.56) | ||
| Orange juice | 0 | 99.48 (±2.11) | 23.44 (±2.42) | |
| 24 | 99.18 (±2.54) | 23.21 (±2.16) | ||
| 48 | 99.20 (±2.96) | 22.79 (±2.57) | ||
| 72 | 99.13 (±2.56) | 22.12 (±3.06) | ||
| Tap water | 0 | 99.60 (±1.80) | 23.44 (±1.36) | |
| 24 | 99.55 (±2.01) | 23.38 (±1.75) | ||
| 48 | 99.48 (±2.29) | 23.25 (±1.43) | ||
| 72 | 99.38 (±1.35) | 23.13 (±1.20) | ||
| Hydroalcoholic solution | 0 | 99.48 (±2.56) | 23.43 (±1.16) | |
| 24 | 99.46 (±2.43) | 23.16 (±1.22) | ||
| 48 | 99.40 (±2.42) | 23.14 (±1.34) | ||
| 72 | 99.35 (±2.76) | 23.02 (±1.97) | ||
| Vegetable oil | 0 | 99.65 (±2.67) | 23.32 (±1.67) | |
| 24 | 99.55 (±2.45) | 23.22 (±1.98) | ||
| 48 | 99.52 (±2.90) | 23.19 (±2.06) | ||
| 72 | 99.45 (±2.56) | 23.14 (±2.33) | ||
| Bleach solution | 0 | 99.60 (±2.67) | 23.31 (±2.46) | |
| 24 | 99.50 (±2.84) | 23.26 (±1.45) | ||
| 48 | 99.40 (±3.57) | 23.12 (±2.64) | ||
| 72 | 99.25 (±2.89) | 22.98 (±2.86) |
Table 12.
The effect of different test substances on the impact strength of HDPE92/TP8 with and without notch after chemical exposure post 0, 24, 48, and 72 hours.
Table 12.
The effect of different test substances on the impact strength of HDPE92/TP8 with and without notch after chemical exposure post 0, 24, 48, and 72 hours.
| Specimen ID. | Test Substance | Time (h) | Impact Strength (kJ/m2) Unnotched | Impact Strength (kJ/m2) Notched |
| HDPE92/TP8 | Lemon juice | 0 | 99.38 (±2.03) | 23.21 (±3.16) |
| 24 | 99.20 (±2.45) | 22.71 (±3.29) | ||
| 48 | 99.11 (±2.54) | 22.31 (±3.11) | ||
| 72 | 99.02 (±2.76) | 22.14 (±3.86) | ||
| Orange juice | 0 | 99.08 (±2.54) | 22.58 (±3.44) | |
| 24 | 98.95 (±2.55) | 22.11 (±3.66) | ||
| 48 | 98.55 (±2.78) | 21.64 (±3.12) | ||
| 72 | 98.13 (±3.10) | 21.02 (±3.96) | ||
| Tap water | 0 | 99.63 (±2.12) | 23.34 (±2.35) | |
| 24 | 99.58 (±2.93) | 23.18 (±2.15) | ||
| 48 | 99.50 (±2.56) | 23.02 (±2.05) | ||
| 72 | 99.50 (±2.74) | 23.00 (±2.03) | ||
| Hydroalcoholic solution | 0 | 99.63 (±2.45) | 23.12 (±1.06) | |
| 24 | 99.58 (±2.63) | 23.06 (±1.22) | ||
| 48 | 99.50 (±2.91) | 23.04 (±1.34) | ||
| 72 | 99.48 (±2.44) | 23.02 (±1.97) | ||
| Vegetable oil | 0 | 99.85 (±2.56) | 23.45 (±1.97) | |
| 24 | 99.80 (±2.76) | 23.40 (±1.96) | ||
| 48 | 99.73 (±2.77) | 23.29 (±2.31) | ||
| 72 | 99.68 (±2.94) | 23.34 (±2.43) | ||
| Bleach solution | 0 | 99.85 (±3.13) | 23.31 (±2.56) | |
| 24 | 99.54 (±3.01) | 23.06 (±1.54) | ||
| 48 | 99.23 (±3.54) | 22.92 (±2.01) | ||
| 72 | 98.97 (±3.56) | 22.64 (±2.86) |
Disclaimer/Publisher’s Note: The statements, opinions and data contained in all publications are solely those of the individual author(s) and contributor(s) and not of MDPI and/or the editor(s). MDPI and/or the editor(s) disclaim responsibility for any injury to people or property resulting from any ideas, methods, instructions or products referred to in the content. |
© 2025 by the authors. Licensee MDPI, Basel, Switzerland. This article is an open access article distributed under the terms and conditions of the Creative Commons Attribution (CC BY) license (http://creativecommons.org/licenses/by/4.0/).
Copyright: This open access article is published under a Creative Commons CC BY 4.0 license, which permit the free download, distribution, and reuse, provided that the author and preprint are cited in any reuse.


