
Submitted:
25 April 2025
Posted:
27 April 2025
You are already at the latest version
Abstract
Food-contact polymers require thermochromic pigments to provide temperature-sensitive visual cues for consumer safety and product integrity. However, their susceptibility to ultraviolet (UV) degradation limits long-term application. This study investigates the UV resistance of food-grade thermochromic polypropylene blends under simulated indoor and outdoor UV exposure for 500 and 1000 hours. Visual properties, colorimetric (CIE Lab*) measurements, mechanical testing (tensile and impact), and mass variation analysis were performed to assess photostability and material integrity. Exposure to UV led to progressive discoloration (ΔE*ab up to 34.07) and significant mechanical deterioration. Tensile strain at break decreased by 48.67%, and notched impact strength dropped by 44.15% after 1000 hours of UV exposure. No measurable mass loss occurred, indicating degradation was confined to surface-level oxidation rather than bulk material erosion or leaching. These findings highlight the need for optimal pigment loading and UV stabilization to extend the shelf life of thermochromic food packaging materials in light-exposed storage and retail environments. The study offers a framework for improving the long-term reliability of smart packaging in the food industry.
Keywords:
thermochromic pigments
; smart packaging
; food packaging
; UV exposure
; photo-oxidation
; mechanical properties
; color stability
1. Introduction
Food packaging is necessary to safeguard food within the distribution chain, from the producer to the customer [1]. Many forms of food packaging exist, including tertiary, secondary, and primary packaging [2]. Various packaging materials preserve the food, including cardboard, plastic, metals, and glass [3]. Consumers are looking for inexpensive disposable packaging that can be frozen, microwaved, and easily disposed [4]. Plastic remains one of the most popular forms of food packaging [5]. The projected global plastic use by 2050 is 500 million tons, with single-use products accounting for the majority, driven by continued growth in plastic consumption [6]. Plastic is strong, affordable, and lightweight [7]. However, concerns exist over its sustainability [8]. In addition, there has been a push for packaging that can prolong the shelf life of food [9].
Thermochromic materials belong to a class of chromogenic substances that exhibit color shifts in reaction to specific external stimuli such as temperature (thermochromism), light (photochromism), or electricity (electrochromism) [10]. Among these, thermochromic systems—particularly those based on leuco dyes or liquid crystals—have gained traction in food packaging due to their responsiveness to subtle temperature changes and ability to communicate spoilage risk visually [11]. The color-changing properties of thermochromic pigment (TP) masterbatches, when added to polymer matrices, make them suitable for rigid and flexible packaging across a broad spectrum of polymer materials and forming processes [12]. Applications such as dairy products, frozen dinners, and pre-cooked meals—where temperature sensitivity is crucial—can particularly benefit from the use of TP [13].
Although thermochromic polymers are innovative, their environmental resilience is inherently limited [14]. Ultraviolet (UV) radiation can degrade organic materials through photochemical processes, leading to chain scission, oxidation, discoloration, and a loss of mechanical properties in polymers [15]. When TP are exposed to UV radiation, the thermochromic phase transition may deteriorate, dye fading may occur, and encapsulation integrity may be compromised [16]. This is particularly troublesome in food packaging applications where thermochromic indicators must remain visible to consumers and functional throughout the product's shelf life [17]. Many TP formulations use microencapsulated leuco dyes that are especially sensitive to photodegradation, which can be triggered even under moderate UV levels found in indoor lighting or direct sunlight [18].
There are several restrictions on the use of TP in food-contact packaging applications. In addition to maintaining optical clarity, preventing chemical component migration into food, and complying with safety regulations, these materials must demonstrate precise and reversible thermochromic activity [19]. Repeated exposure cycles to light [20], temperature fluctuations [21], and mechanical stress [22] can gradually decrease TP performance. Additionally, there are more significant restrictions on the types of polymers and additives that can be used with thermochromic systems as packaging materials are increasingly being made to be recyclable or biodegradable [23]. As a result, there is a growing need for rigorous evaluation of the environmental stability of thermochromic polymers under realistic operating conditions.
Exposure to UV light in indoor and outdoor settings may impact the structural and functional integrity of plastic food packaging [24,25,26,27]. External UV exposure commonly occurs during transportation, storage, and especially retail display—particularly when products are placed near windows, under fluorescent or LED lighting, or in open-air markets exposed to sunlight [28]. Internally, UV exposure may occur in food processing and packaging facilities where UV sterilization is used for hygiene control [29] or from UV-emitting light sources within refrigerators, display cases, or vending machines [30]. Prolonged exposure to UV light can weaken the polymer chains in plastic, resulting in embrittlement, staining, loss of barrier properties, and photofading or reduced responsiveness of functional additives such as thermochromic pigments [31,32]. This underscores the importance of UV resistance in plastic packaging materials for long-term use or light-sensitive applications.
UV light is the electromagnetic spectrum's 200–400 nm region. UV short wave (UV-C) is between 200 and 280 nm, UV medium wave (UV-B) is between 280 and 320 nm, and UV long wave (UV-A) is between 320 and 400 nm [33]. The wavelengths at which light is released from a gas discharge depend on the excitation, ionization, and kinetic energy of the constituent elements and the gas itself [34]. A mixture of excited and non-excited atoms, cations, and electrons produced by applying a high voltage across a gas volume is known as a gas discharge [35]. UV light has great promise for the food processing industry as an alternative to conventional thermal processing [36]. It can be used to pasteurize juices, sanitize food-contact surfaces, extend the shelf life of fresh products, and provide post-lethality treatment for meats, ensuring safety after cooking [37].
Previous studies have addressed recyclability [38], chemical resistance [39], and mechanical behavior of thermochromic materials in food-contact environments. However, little exists on the photostability of TPs [40]. The processes of UV degradation are well established in polymer science [41,42,43]. They typically involve chromophores within the polymer or dye molecule absorbing high-energy UV photons, which initiate free radical reactions that irreversibly alter the chemical structure irrevocably[44]. In TP, this may lead to loss of thermochromic reversibility, loss of overall color, and complete failure of the indicator functionality. Adding UV stabilizers or protective coatings could help reduce the impact of UV on TP [45].
Adding TP into plastic food-contact packaging has the potential to reduce both food and packaging waste while enhancing food safety. However, the vulnerability of TP to UV-induced degradation remains a barrier to large-scale commercialization. This study aims to close the gap between practical, long-lasting packaging solutions and laboratory-scale thermochromic compositions by systematically evaluating the UV resistance of TP in food-contact polymer packaging. To simulate prolonged UV exposure, thermochromic materials were subjected to controlled photodegradation processes in accelerated aging chambers. The optical properties and mechanical strength of the samples were analyzed to assess variations in thermochromic activation, color fastness, and material degradation.
Thus, the findings of this study are expected to inform the design and formulation of more robust thermochromic packaging systems that are capable of withstanding re-al-world environmental conditions. These insights will contribute to the advancement of innovative packaging solutions by guiding manufacturers, researchers, and regulatory bodies looking to incorporate intelligent materials into high-performance, environmentally friendly packaging systems.
2. Materials and Methods
2.1. Materials
Ross Polymer (Athlone, Ireland) provided a commercially available nucleated polypropylene (PP) (Moplen HP548R, LyondellBasell, UK) with a MW 26,000 g/mol and a density of 0.9 g/cm3. The manufacturer certified the material as appropriate for uses involving food contact.
SpotSee®/LCR Hallcrest Ltd. (Chester, UK) provided the thermochromic pigment (ThermoBatchTM) in pellet form with a reversible temperature transition of 41 °C and 0.508 g/cm3 density.
2.2. Blend Preparation
To attain homogeneity, binary mixes of TP as the additive and PP as the matrix were manually dry-mixed by tumbling in a sealed polyethylene bag for 5 min. Each mix weighed 1.5 kg. A Sartorius LA230P analytical balance (accuracy ±0.0001 g) (Sartorius, Dublin, Ireland) was used to weigh the components precisely. A suitable polymeric carrier miscible with the PP matrix was present in the colored concentrate ThermoBatchTM. The samples were conditioned at 23 °C for 24 h before testing following blending to ensure reliable results in subsequent tests. The mix compositions prepared for this study are shown in Table 1.
2.3. Injection Molding
Injection molding is the melting of a polymer in a plasticization unit, followed by injecting the melt into a mold cavity [48]. Shear heat generated by friction between the material, the screw, and the interior of the barrel, along with heat from five external heating bands, was used during the injection molding process to melt the material. The molten polymer was then injected into a mold, which solidified into the desired shape as the mold cooled. Injection molding was carried out in accordance with ISO 294-1: 2017 [49]. The blends, as indicated in Table 1, were processed using an Arburg Allrounder 370E 600 E drive injection molding machine (Arburg, Lossburg, Germany). The machine used a "two by two" family mold with a double-T runner to create two tensile (type B1) and two impact (type A1) test specimens. The Arburg machine had a screw diameter of 30 mm, a maximum clamping force of 600 kN, and a maximum computed stroke volume of 85 cm3.
Four temperature controllers managed the temperature distribution along the barrel, while a fifth controller managed the temperature of the nozzle. The temperature profile steadily increased from 170 °C at the hopper to 210 °C at the nozzle. A 35-second cooling period was used with an injection pressure of 750 bar, an injection speed of 80 mm/s, and a holding pressure of 400 bar. The mold was maintained at a constant 30 °C using a Piovan Technologies THM 120/EN temperature control device (JL Goor, Wicklow, Ireland). The mold's shot size was 52 g. Tensile test specimens (ISO 527-2: 2012 [47] specimen type 1BA) were molded for each blend formulation. When necessary, Charpy impact test specimens were made and notched with a Type A V-notch (ISO 179-1: 2023 [46] specimen type A1, direction of blow edgewise).
2.4. UV Exposure Protocol
UV exposure refers to the exposure of materials or biological systems to UV radiation, a portion of the electromagnetic spectrum with wavelengths shorter than visible light but longer than X-rays [50]. To evaluate the UV resistance of the thermochromic polymer blends, each blend was exposed to simulated indoor and outdoor conditions representative of typical food-contact conditions (Table 2).
Indoor light exposure, mimicking retail display lighting, was simulated using an RS 559-934 UV exposure unit (RS Components Ltd., Northamptonshire, UK), which emits UVA radiation centered around ~360 nm. The spectral output aligns with the emission profile of standard fluorescent lighting, commonly used in commercial settings, and is known to emit low-level UVA. Although the irradiance is lower than full-spectrum sunlight, this UVA range can induce photofading and thermochromic degradation in color-sensitive materials. This setup allowed for assessing the stability of pigment and polymer under extended indoor lighting conditions for 500 and 1000 hours.
Outdoor exposure was simulated using a QUV/Solar Eye (SE) accelerated weathering tester (Q-Lab Corporation, Bolton, UK), which operated at 0.72 W/m² at 340 nm. The system used UVA-340 lamps with Solar Eye® irradiance control to maintain consistent UV intensity throughout the exposure.
UV accelerated aging of polymer specimens was conducted according to ISO 4892-3 [51], using fluorescent UVA lamps (UVA-340 and UVA-360) in QUV/Solar Eye and RS 559-934 devices, respectively. Following UV exposure, samples were conditioned at 23 °C for 24 h under controlled laboratory conditions prior to subsequent analysis.
2.5. ATR-FTIR Analysis (Pre-Exposure)
ATR-FTIR qualitatively identifies structural molecules by transmitting infrared light through a sample, producing absorption at specific frequencies [52]. This technique was used on thermochromic pigment masterbatch (ThermoBatch™) to determine the nature of the carrier polymer used in the additive system. This was done to verify material compatibility with the PP matrix, ensure consistent interpretation of pigment dispersion behavior, assess material compatibility with the PP matrix, and confirm pigment dispersion characteristics [53,54,55].
ATR-FTIR was performed using a PerkinElmer® Spectrum One FT-IR Spectrometer fitted with a universal ATR sampling accessory (PerkinElmer®, MA, USA). All data was recorded at 23 °C, in the spectral range of 4000-650 cm−1, utilizing 16 scans per sample cycle and a fixed universal compression force of 80 N. Subsequent analysis was carried out using PerkinElmer® Spectrum software, version 10.4.3 (PerkinElmer®, MA, USA), which allows for qualitative spectrum data and the generation of custom reports. The spectrums from each material were overlaid with peaks of interest labeled along the spectrum. Similar peaks were isolated and analyzed to conclude the results.
2.6. Visual Assessment
The test specimens were visually inspected at each exposure interval (0, 500, and 1000 hours) following UVA treatment under both indoor-simulated (RS 559-934) and outdoor-simulated (QUV/Solar Eye) conditions. Visual examination was conducted to identify macroscopic changes in surface appearance, discoloration, or pigment fading. High-resolution digital photographs were taken using a Canon EOS 90D DSLR camera (Canon Europa, Amstelveen, Netherlands) with a fixed focal length lens. To ensure accurate and consistent color capture, imaging was performed in a light-controlled environment using LED lighting. To reduce reflections and color distortion, each test specimen was placed against a uniform white background at a specific distance and angle. In addition to the quantitative colorimetric examination outlined in Section 2.7, this method allowed for a qualitative evaluation of the impacts of photofading and surface color retention.
2.7. Color Stability Analysis (CIE L*a*b*)
Spectrophotometry is a technique for measuring how light interacts with materials. A portable spherical spectrophotometer (X-Rite SP62, Grand Rapids, MI, USA) was used to analyze the color stability and chromatic properties of thermochromic materials exposed to different forms of UV radiation. Following the SP60 Series Spectrophotometer user instructions, the spectrophotometer was calibrated using a white tile and a zero tile sequentially before the measurements were taken. The color results were displayed by the Commission International de l'Eclairage (CIE) chromaticity coordinate system (L*, a*, b*).
The brightness between black and white in this system is represented by the L* value, which goes from 0 (black) to 100 (white). Chromaticity is represented by the a* and b* parameters, which have no numerical bounds. Green represents negative a* values, and red represents positive a* values. Likewise, blue is represented by negative b* values, whereas positive b* values represent yellow. The differences show the variations in L*, a*, and b* values between the sample and standard (ΔL*, Δa*, and Δb*). Equation (1) was also used to determine the total color difference (ΔE*ab).
where
is the color difference between two colors;
is the difference in lightness between the two colors;
is the difference in the red-green axis;
is the difference in the yellow-blue axis.
Using OncolorTM (v.6.3.4.4 QC-Lite) (Hunter Associates Laboratory, Inc, Reston, VA, USA), the color coordinates L*, a*, and b* were captured in accordance with ISO/CIE 11664-4: 2019 [56]. For every sample group, ten duplicates were acquired, and the associated means and standard deviations were computed. The color difference connected to the test specimens may be identified thanks to this coordinate. Equation (1) was used to compare the color coordinates of the simulated indoor and outdoor UVA-exposed samples with those of the unexposed food-grade material samples, which were used as a reference, to determine the color difference, which is represented by the distance metric ∆E*ab.
2.8. Tensile Property (Post UV Exposure)
In tensile testing, a regulated tensile (pulling) force is applied until the sample breaks to assess the mechanical properties of the polymer [57]. According to ISO 527-2: 2012 [47], tensile testing was carried out on tensile specimens (specimen type 1BA) to assess the mechanical characteristics of the polymer blends following UV exposure. The examination evaluated the samples' maximum tensile stress, Young's modulus, and tensile strain at break to evaluate their ductility and toughness. Each polymer blend— PP98/TP2 and PP92/TP8 was subjected to UVA exposure and was tested using five replicate specimens to establish statistical robustness.
Tensile testing was conducted exclusively on specimens subjected to UVA exposure using the RS 559-934 (360 nm) indoor-simulated lighting device, as the configuration of the QUV/Solar Eye (340 nm) chamber only accommodated impact test samples. This limitation restricted tensile testing to indoor UVA-aged specimens and corresponding unexposed controls.
An Instron 3400 tensile tester machine (Instron, Norwood, MA, United States) equipped with a 4 kN load cell and Bluehill® software version 4.29 (Instron, Norwood, MA, United States) for data collection was used to analyze the tensile test. Each sample was examined using five specimens, each with dimensions of 170 mm in length, 10 ± 0.2 mm in breadth, and 4 ± 0.2 mm in thickness. To ensure that the samples were clamped evenly, a grip gap of 25.4 mm was kept. A Mitutoyo Absolute CD-6-ASX caliper (BCS Calibration, Laois, Ireland) was used for measurement testing. Tensile tests were conducted under steady-state conditions with a 10 mm/min strain rate.
2.9. Impact Strength Testing (Charpy Method)
A standardized technique for determining a material's impact strength and toughness is the Charpy test [58]. The specimen is struck with a pendulum hammer, and the resulting impact energy is noted. A calibrated CEAST Resil 6545 5.5 Series pendulum impact testing equipment (Zwick Roell, Ulm, Germany) performed Charpy impact testing on 10 specimens by ISO 179-1: 2023 [46]. To assess the influence of UV exposure on impact resistance, tests were conducted on notched and unnotched-equipped specimens. Using a Zwick/Roell notch cutter (Zwick/Roell, Ulm, Germany), test specimens with an average thickness of 12.72 mm (±0.04 mm) were made with a Type A V-shaped notch (2 mm depth). A 4 joule (J) hammer mounted on a swinging pendulum running at an impact velocity of 2.9 m/s was used for impact testing. Each specimen was centered horizontally to get the best notch alignment with the pendulum arm and placement away from the impact direction. The hammer arm, which had been released from an elevated position, struck the specimen. When struck, notched specimens broke, whereas unnotched ones held together. The weighted pendulum's subsequent downward motion allowed the calculation of the specimen's impact energy in joules (J).
The impact tester display determined each sample's impact absorption energy. Equation 2 determined the corresponding Charpy impact strength, acU, for unnotched samples. This value was reported in kilojoules per square meter (kJ/m2):
where
Wc is the corrected energy, in joules, absorbed by breaking the test specimen;
h is the thickness, in millimeters, of the test specimen;
b is the width, in millimeters, of the test specimen.
The Charpy impact strength, acN, expressed in kilojoules per square meter (kJ/m2), was determined for the notched samples using the calculation presented in Equation 3:
where
Wc is the corrected energy, in joules, absorbed by breaking the test specimen;
h is the thickness, in millimeters, of the test specimen;
bN is the width, in millimeters, of the test specimen.
2.10. Mass Variation Measurement
Mass measurements were performed on tensile specimens before and after UV exposure to detect material loss or gain, which may indicate degradation or leaching. A Mettler TG50 Thermobalance (Mettler-Toledo, Columbus, OH, USA) was used to measure the mass of tensile test specimens with a precision of ±0.0001 mg to ensure the comparability of mechanical properties pre-and-post UVA exposure. Potential mass fluctuations brought on by material deterioration or leaching after UV exposure were identified using these investigations.
2.11. Statistical Analyses
Statistical analysis is necessary for any research project to produce quantitative outcomes. Quantitative analysis is more reliable and rigorous when data is collected methodically and consistently. Every data point in the dataset was retained, and no outliers were removed. The sample size for each test was indicated to ensure methodological transparency and reproducibility. Minitab® 21.4.1 Statistical Software (Minitab, LLC, State College, PA, USA) was used for statistical analysis. Normality testing was performed on each set of results to determine whether to accept or reject the hypothesis and whether there was a statistically significant difference in the samples' results following UV resistance testing. For quintuplicate (n=5) and decuplicate (n=10) measurements, a one-way analysis of variance (ANOVA) was conducted; the findings were presented as mean ± standard deviation. The Tukey method was used for post hoc comparisons, and a 95% confidence threshold for statistical significance was established at p < 0.05. The results considered statistical significance and practical relevance to guarantee a meaningful interpretation of the data.
3. Results
3.1. ATR-FTIR Spectral Characterization (Pre-Exposure)
Figure 1 presents the ATR-FTIR spectrum of the unexposed thermochromic pigment masterbatch, showing distinct absorption bands characteristic of an ethylene-vinyl acetate (EVA) copolymer. These include C–H stretching near 2920 and 2850 cm⁻¹, carbonyl (C=O) stretching at ~1740 cm⁻¹, and C–O stretching between 1240 and 1020 cm⁻¹, providing the initial evidence for EVA as the carrier matrix [59].
In Figure 2, the ATR-FTIR spectrum of the thermochromic pigment masterbatch (ThermoBatch™) is overlaid with the reference spectrum for ethylene-vinyl acetate (EVA) copolymer (black), obtained from SpectraBase™/Wiley (CAS No. 24937-78-8; entry A00641.Dx). An intense spectral match between the two indicates that the masterbatch carrier is EVA, a polymer frequently used for pigment dispersion due to its flexibility and compatibility [60]. The highest match (Search Score: 0.980245) was A00641.Dx, described as an “Ethylene/Vinyl Acetate Copolymer,” followed closely by several additional EVA-based materials. The consistency of these matches and their high correlation scores (≥ 0.90) with the acquired spectrum confirms the identity of the polymer as EVA.
The sample spectrum shows prominent absorption bands at 2920 cm⁻¹ and 2850 cm⁻¹, attributed to the asymmetric and symmetric C–H stretching vibrations of methylene groups in the polyethylene backbone. A strong absorption at 1740 cm⁻¹ corresponds to the C=O stretching vibration of the vinyl acetate moiety—this is the key distinguishing feature of EVA compared to pure polyethylene. Additional signals at 1463 cm⁻¹ and 1375 cm⁻¹ are assigned to CH₂ and CH₃ bending, respectively, and a series of bands between 1240 and 1020 cm⁻¹ represent C–O stretching vibrations. The distinct band at 720 cm⁻¹, typical of CH₂ rocking, supports the presence of semi-crystalline polyethylene segments in the copolymer [61].
3.1. Visual Property Results
Figure 3 displays the visual changes observed in impact test specimens of PP98/TP2 and PP92/TP8 blends before and after UVA exposure. These samples were aged using the RS 559-934 chamber, which simulates indoor UV conditions. With an apparent shift from deep violet to mild pink and beige tones, Figure 3 shows a steady loss of color intensity throughout both formulations. This diminished color intensity indicates pigment degradation and polymer surface oxidation over time [62]. The more noticeable fading observed in specimens exposed to longer exposure times supports the time-dependent character of photo-induced discoloration [63].
Figure 4 presents the same formulations aged under outdoor-simulated (QUV/Solar Eye) UVA conditions. Compared to the previously indoor-aged specimens, the QUV-exposed samples exhibit more significant discoloration, particularly after 1000 hours, with some specimens losing most of their original chromatic intensity (Figure 4 (F)). Notably, a square-shaped region of preserved color is visible in samples (B) and (E). This localized retention of the original hue is attributed to the sample mounting method during UV exposure.
As shown in Figure 5, the test specimens were secured into metal frames prior to aging in the QUV weathering chamber. These frames partially covered sections of the specimen surfaces, creating a shadowed region shielded from direct UVA radiation. There is a clear visible contrast between the exposed and protected portions due to the covered areas not experiencing the same level of photodegradation. This phenomenon emphasizes how crucial consistent sample exposure is in UV aging studies. It supports the finding that changes in surface color are closely related to the total amount of UV light received [64,65].
Overall, the visual results correlate well with the quantitative colorimetric data (ΔE*ab values), confirming that both formulations—especially the more pigment-rich PP92/TP8—are susceptible to UV-induced discoloration [66]. These observations underline the need for effective UV stabilization strategies in thermochromic systems intended for environments with prolonged light exposure.
3.3. Color Stability
To document color changes, the injection-molded bars’ color, and surface topography were examined after exposure to UV radiation for 500 and 1000 hours. The total color difference (ΔE*ab) for thermochromic polymer specimens subjected to UVA was performed in ten replicates for each sample condition. Table 3 presents the comparative CIE Lab* parameters and total color difference (ΔE*ab) values for thermochromic polypropylene blends (PP98/TP2 and PP92/TP8) following UVA exposure under indoor (RS 559-934) and outdoor-simulated (QUV/Solar Eye) conditions at 500 and 1000 hours. These values are the mean of ten replicates per condition and reflect the time-dependent progression of surface discoloration and pigment instability.
The measured color changes—expressed as ΔL*, Δa*, Δb*, and ΔE*ab—represent deviations from the initial (0 h) color state and demonstrate the extent of discoloration and pigment shift after 500 and 1000 hours of UVA exposure.
Across both formulations and exposure environments, ΔE*ab values increased with exposure duration, confirming the cumulative effects of UVA-induced photodegradation. Under the RS 559-934 chamber (360 nm), which simulates milder indoor lighting, PP98/TP2 exhibited a moderate color change, with ΔE*ab rising from 19.29 at 500 hours to 23.50 at 1000 hours. The corresponding changes in ΔL* (14.22 → 19.58) and Δa* (8.16 → 6.03) indicate progressive surface lightening and a reduction in red tones, while Δb* increased from 11.38 to 13.53, suggesting enhanced yellowing.
The degradation was more pronounced under QUV/Solar Eye exposure (340 nm). PP98/TP2 exhibited higher ΔE*ab values of 26.36 and 30.29 after 500 and 1000 hours, respectively, corresponding to intensified lightening (ΔL = 24.62 at 1000 h) and continued chromatic shifts.
PP92/TP8 showed a similar but more severe trend. Under RS 559-934 exposure, ΔE*ab increased from 17.82 to 27.57 between 500 and 1000 hours, with a substantial increase in ΔL from 13.14 to 24.78 and a sharp decrease in a* from 7.51 to 3.27, indicating greater fading of red hues. Under QUV exposure, PP92/TP8 reached the highest color difference of all samples: ΔE*ab = 34.07 at 1000 hours, with ΔL* rising to 30.34 and a* decreasing to 4.09. These changes confirm the greater photo-instability of this formulation, likely due to its higher thermochromic pigment loading and associated matrix interactions [67].
The comparative data underscore that outdoor UVA exposure (QUV/Solar Eye) induces more aggressive color degradation than indoor-equivalent UVA exposure (RS 559-934). Additionally, PP92/TP8 continuously displayed larger ΔE*ab values than PP98/TP2 under the same exposure settings, indicating it is more susceptible to discoloration. For long-term aesthetic performance in outdoor packaging and display applications, the study emphasizes the significance of implementing UV stabilization procedures and preserving a balance in thermochromic pigment concentration [68].
Time-dependent color instability was confirmed by the overall increase in ΔE*ab with exposure duration for both interior and exterior UVA settings. Discoloration was more likely to occur in fib the higher pigment-loaded formulation, PP92/TP8, underscoring the need of maximizing pigment concentration and adding potent UV stabilizers in applications needing resilience to prolonged exposure [69].
Separate one-way ANOVA tests were conducted for the two UV exposure conditions—RS 559-934 (360 nm) and QUV/Solar Eye (340 nm)—to evaluate the influence of pigment concentration and exposure duration on total color difference (ΔE*ab). Both tests revealed statistically significant differences across the four exposure groups (p < 0.05). Post hoc Tukey HSD comparisons confirmed that all pairwise differences between 2% and 8% pigment concentrations at 500 and 1000 hours were statistically significant.
3.4. Tensile Properties After UV Exposure
PP98/TP2 (Table 4) exhibits moderate variations in tensile properties across different UV exposures.
The tensile property data presented in Table 4 highlight the degradative effects of indoor UVA exposure on thermochromic polypropylene blends (PP98/TP2 and PP92/TP8) using the RS 559-934 (360 nm) device. Both blends exhibited a progressive reduction in the tensile strain at break and maximum tensile stress with increasing exposure duration, indicating a decline in ductility and tensile strength due to photo-oxidative degradation [70].
For PP98/TP2, strain at break decreased from 95.69% (control) to 81.49% after 500 hours and 60.11% after 1000 hours of UVA exposure. The corresponding maximum tensile stress values declined from 29.45 MPa to 25.64 MPa (-12.94%) over the same period. A similar degradation pattern was observed for PP92/TP8, with strain at break decreasing from 87.25% to 44.79% and tensile stress from 28.89 MPa to 22.31 MPa (-22.77%) following 1000 hours of exposure.
These changes are consistent with chain scission [71] and surface embrittlement [72] induced by prolonged UV exposure. The observed increase in Young’s modulus across both formulations suggests progressive stiffening, likely due to oxidative crosslinking and crystalline rearrangement [73]. A shift toward more brittle behavior is indicated by the mechanical reaction, especially in the pigment-rich PP92/TP8 formulation, which demonstrated larger strain and stress reductions [74]. The necessity for efficient stabilizing techniques to maintain mechanical integrity in thermochromic systems meant for light-exposed applications is highlighted by these findings.
One-way ANOVA was conducted separately for each formulation (PP98/TP2 and PP92/TP8) to evaluate the statistical significance of changes in the tensile strain at break, maximum tensile stress, and Young’s modulus across 0, 500, and 1000 hours of indoor UVA exposure (RS 559-934, 360 nm). The results showed a statistically significant effect of exposure duration on all three mechanical properties (p < 0.001). Post hoc Tukey HSD analysis confirmed that, for PP92/TP8, all time points differed significantly from one another (p < 0.05).
3.5. Impact Strength After UV Exposure
Using notched and unnotched samples, the impact strength of different polymer blends was assessed with exposure to various UV food-contact conditions (Table 5).
The impact strength data presented in Table 5 demonstrate the effect of UVA radiation on the fracture resistance of thermochromic polypropylene blends (PP98/TP2 and PP92/TP8), assessed under both unnotched and notched conditions after exposure to RS 559-934 (360 nm) and QUV/Solar Eye (340 nm) for 500 and 1000 hours. Control specimens exhibited high unnotched impact strength (99.94 kJ/m²) and moderate notched strength (23.52 kJ/m²), consistent with ductile fracture behavior and high energy absorption capacity [75].
A progressive decline in both impact values was observed upon UVA exposure, with more significant reductions under QUV/Solar Eye conditions. For PP98/TP2, RS 559-934 exposure led to a 14.30% and 29.42% decrease in unnotched impact strength after 500 and 1000 hours, respectively, while notched strength declined by 13.61% and 23.69%. Under QUV conditions, losses were more pronounced, with unnotched values dropping to 60.22 kJ/m² (−39.8%) and notched to 15.23 kJ/m² (−35.2%) after 1000 hours.
PP92/TP8 followed a similar but more severe trend. Unnotched impact strength declined by 18.70% and 33.54% after 500 and 1000 hours in the RS chamber, while QUV exposure caused a drop to 52.37 kJ/m² (−47.56%). Notched strength decreased by 19.50% and 31.52% under RS exposure and by 44.15% under QUV, suggesting that higher pigment loading in PP92/TP8 accelerates UV-induced embrittlement.
UVA radiation significantly deteriorates unnotched and notched impact resistance, indicating increased material sensitivity to crack initiation and propagation. The more aggressive degradation observed under QUV/Solar Eye exposure compared to RS 559-934 underscores the critical role of UV source and spectral intensity in accelerating mechanical failure. These findings are consistent with a transition from ductile to brittle failure mechanisms [76], driven by surface oxidation [77], pigment–matrix interactions [78], and polymer chain scission [79], and emphasize the need for enhanced UV stabilization strategies [80] in thermochromic polypropylene systems intended for extended light-exposed service life.
One-way ANOVA was conducted separately on both unnotched and notched impact strength values for PP98/TP2 and PP92/TP8 to determine the statistical significance of differences across exposure durations (0, 500, and 1000 h) and UV conditions (RS 559-934 and QUV/Solar Eye). The analysis revealed statistically significant differences for both specimen types (p < 0.001), confirming that UVA exposure had a measurable effect on fracture resistance. Post hoc Tukey HSD tests indicated that all pairwise comparisons between exposure durations were statistically significant (p < 0.05), demonstrating time-dependent degradation in impact strength.
3.6. Mass Change after UV Exposure
Table 6 summarizes the mass measurements of PP98/TP2 and PP92/TP8 tensile specimens before and after UVA exposure under indoor-simulated (RS 559-934, 360 nm) and outdoor-simulated (QUV/Solar Eye, 340 nm) conditions at 500 and 1000 hours. The mass values represent the mean of five replicate specimens per test scenario.
The absence of mass variation suggests that no significant material loss occurred due to volatilization or surface erosion and that thermochromic pigments and additives remained stably embedded within the polymer matrix. Additionally, the data indicate that no mass gain was observed, ruling out the possibility of moisture absorption or uptake of oxidative species under the applied exposure conditions.
A one-way ANOVA was performed on pre- and post-exposure mass values across all test conditions. The results indicated no statistically significant differences (p > 0.05) in specimen mass after 500 or 1000 hours of UVA exposure under either indoor (RS 559-934) or outdoor (QUV/Solar Eye) conditions.
These results are consistent with the known behavior of polypropylene-based systems, where UV-induced degradation typically affects the surface layer through chain scission and oxidation but does not lead to a significant bulk material loss over moderate exposure periods [81]. The findings support the conclusion that the observed mechanical weakening and color changes result from photo-oxidative molecular changes rather than physical mass depletion or additive leaching [82].
4. Conclusions
This study provides critical insights into the durability of thermochromic polypropylene blends under UVA exposure that are relevant to smart packaging applications. The effects of photodegradation on mechanical and optical properties were systematically assessed by simulating indoor and outdoor UV lighting environments over 500 and 1000 hours. Colorimetric analysis revealed apparent time-dependent discoloration, with the pigment-rich PP92/TP8 blend undergoing the most severe fading. Mechanical testing showed that UV exposure led to pronounced embrittlement and strain and impact resistance reductions, particularly in QUV-exposed samples. However, there was no discernible mass change, suggesting that the deterioration was surface-confined rather than the consequence of bulk erosion or additive leaching.
The results show how achieving thermochromic functionality and maintaining long-term material stability must be balanced. While increasing thermal responsiveness, higher pigment concentrations hasten mechanical deterioration and surface oxidation. These results imply that pigment concentration and UV stabilization techniques need to be adjusted to increase service life in practical food packaging applications.
The findings of this study are expected to inform the design and formulation of more robust thermochromic packaging systems that are capable of withstanding real-world environmental conditions. These insights will contribute to the advancement of innovative packaging solutions by guiding manufacturers, researchers, and regulatory bodies looking to incorporate intelligent materials into high-performance, environmentally friendly packaging systems. Together, these findings lay the groundwork for advancing thermochromic packaging from experimental concept to practical, market-ready solution.
Author Contributions
Conceptualization, C.B.; methodology, C.B.; writing—original draft preparation, C.B.; writing—review and editing, C.B., D.M.C. and G.B.; supervision, J.G. and L.M.G.. All authors have read and agreed to the published version of the manuscript.
Funding
This research received no external funding.
Institutional Review Board Statement
Not applicable.
Data Availability Statement
Data are contained within the article.
Conflicts of Interest
The authors declare no conflicts of interest.
References
- Roy, V.; Srivastava, S.K. The Safety–Quality Dominant View of Food Chain Integrity: Implications for Consumer-centric Food Chain Governance. Int J Management Reviews 2022, 24, 3–24. [CrossRef]
- Saha, N.C. Food Packaging: Concepts and Its Significance. In Food Packaging: Materials,Techniques and Environmental Issues; Saha, N.C., Ghosh, A.K., Garg, M., Sadhu, S.D., Eds.; Springer Nature: Singapore, 2022; pp. 1–45 ISBN 978-981-16-4233-3.
- Ibrahim, I.D.; Hamam, Y.; Sadiku, E.R.; Ndambuki, J.M.; Kupolati, W.K.; Jamiru, T.; Eze, A.A.; Snyman, J. Need for Sustainable Packaging: An Overview. Polymers 2022, 14, 4430. [CrossRef]
- Zhuo, Y.; He, J.; Li, W.; Deng, J.; Lin, Q. A Review on Takeaway Packaging Waste: Types, Ecological Impact, and Disposal Route. Environmental Pollution 2023, 337, 122518. [CrossRef]
- Fasake, V.; Shelake, P.S.; Srivastava, A.; Dashora, K. Characteristics of Different Plastic Materials, Properties and Their Role in Food Packaging. Current Nutrition & Food Science 2021, 17, 944–954. [CrossRef]
- Ncube, L.K.; Ude, A.U.; Ogunmuyiwa, E.N.; Zulkifli, R.; Beas, I.N. An Overview of Plastic Waste Generation and Management in Food Packaging Industries. Recycling 2021, 6, 12. [CrossRef]
- Hahladakis, J.N.; Iacovidou, E.; Gerassimidou, S. Chapter 4 - Plastic Waste in a Circular Economy. In Environmental Materials and Waste (Second Edition); Vara Prasad, M.N., Ed.; Elsevier, 2024; pp. 99–134 ISBN 978-0-443-22069-2.
- Sundqvist-Andberg, H.; Åkerman, M. Sustainability Governance and Contested Plastic Food Packaging – An Integrative Review. Journal of Cleaner Production 2021, 306, 127111. [CrossRef]
- Yan, M.R.; Hsieh, S.; Ricacho, N. Innovative Food Packaging, Food Quality and Safety, and Consumer Perspectives. Processes 2022, 10, 747. [CrossRef]
- Behera, A. Chromogenic Materials. In Advanced Materials; Springer International Publishing: Cham, 2022; pp. 157–191 ISBN 978-3-030-80358-2.
- Hakami, A.; Srinivasan, S.S.; Biswas, P.K.; Krishnegowda, A.; Wallen, S.L.; Stefanakos, E.K. Review on Thermochromic Materials: Development, Characterization, and Applications. J Coat Technol Res 2022, 19, 377–402. [CrossRef]
- Breheny, C.; Donlon, K.; Harrington, A.; Colbert, D.M.; Bezerra, G.S.N.; Geever, L.M. Thermochromic Polymers in Food Packaging: A Comprehensive Systematic Review and Patent Landscape Analysis. Coatings 2024, 14, 1252. [CrossRef]
- Kavuncuoglu, H. Packaging Aspects of Food Analogues. In Food Analogues: Emerging Methods and Challenges; CAN, Ö.P., GÖKSEL SARAÇ, M., ASLAN TÜRKER, D., Eds.; Springer Nature Switzerland: Cham, 2024; pp. 437–463 ISBN 978-3-031-69872-9.
- Supian, A.B.M.; Asyraf, M.R.M.; Syamsir, A.; Najeeb, M.I.; Alhayek, A.; Al-Dala’ien, R.N.; Manar, G.; Atiqah, A. Thermochromic Polymer Nanocomposites for the Heat Detection System: Recent Progress on Properties, Applications, and Challenges. Polymers 2024, 16, 1545. [CrossRef]
- Zhang, X.; Yin, Z.; Xiang, S.; Yan, H.; Tian, H. Degradation of Polymer Materials in the Environment and Its Impact on the Health of Experimental Animals: A Review. Polymers 2024, 16, 2807. [CrossRef]
- Jamnicki Hanzer, S.; Kulčar, R.; Vukoje, M.; Marošević Dolovski, A. Assessment of Thermochromic Packaging Prints’ Resistance to UV Radiation and Various Chemical Agents. Polymers (Basel) 2023, 15, 1208. [CrossRef]
- Thamrin, E.S.; Warsiki, E.; Bindar, Y.; Kartika, I.A. Thermochromic Ink as a Smart Indicator on Cold Product Packaging - Review. IOP Conf. Ser.: Earth Environ. Sci. 2022, 1063, 012021. [CrossRef]
- Nagare, S.M.; Hakami, A.; Biswas, P.K.; Stefanakos, E.K.; Srinivasan, S.S. A Review of Thermochromic Materials for Coating Applications: Production, Protection, and Degradation of Organic Thermochromic Materials. J Coat Technol Res 2025, 22, 91–115. [CrossRef]
- Sadoh, A.; Hossain, S.; Ravindra, N.M. Thermochromic Polymeric Films for Applications in Active Intelligent Packaging—An Overview. Micromachines 2021, 12, 1193. [CrossRef]
- Chen, Z.; Zhang, H.; Duan, H.; Wu, C.; Zhang, S. Long-Term Photo Oxidation Aging Investigation of Temperature-Regulating Bitumen Based on Thermochromic Principle. Fuel 2021, 286, 119403. [CrossRef]
- Tang, J.; Wang, Y.; He, M.; Huang, L.; Wang, X.; Yu, J. Thermochromic Paint with Three-Stage Colour Transition Effect Based on Thermochromic Microcapsules and Its Crosslinking Modification. Coloration Technology n/a. [CrossRef]
- Vanzetto, A.B.; Neves, G.; Alves, T.P.; Moura, J.H.; Bortoli, B.F. de; Santana, L.; Polkowski, R.D. de O. A Systematic Review on Smart Coatings for Automotive Applications.; SAE International: Warrendale, PA, January 8 2024.
- Aldas, M.; Paladines, A.; Valle, V.; Pazmiño, M.; Quiroz, F. Effect of the Prodegradant-Additive Plastics Incorporated on the Polyethylene Recycling. International Journal of Polymer Science 2018, 2018, 1–10. [CrossRef]
- Conradie, W.; Dorfling, C.; Chimphango, A.; Booth, A.M.; Sørensen, L.; Akdogan, G. Investigating the Physicochemical Property Changes of Plastic Packaging Exposed to UV Irradiation and Different Aqueous Environments. Microplastics 2022, 1, 456–476. [CrossRef]
- Doğan, M. Ultraviolet Light Accelerates the Degradation of Polyethylene Plastics. Microscopy Research and Technique 2021, 84, 2774–2783. [CrossRef]
- Ezati, P.; Khan, A.; Priyadarshi, R.; Bhattacharya, T.; Tammina, S.K.; Rhim, J.-W. Biopolymer-Based UV Protection Functional Films for Food Packaging. Food Hydrocolloids 2023, 142, 108771. [CrossRef]
- Gore, A.H.; Prajapat, A.L. Biopolymer Nanocomposites for Sustainable UV Protective Packaging. Front. Mater. 2022, 9, 855727. [CrossRef]
- Alizadeh Sani, M.; Khezerlou, A.; Tavassoli, M.; Abedini, A.H.; McClements, D.J. Development of Sustainable UV-Screening Food Packaging Materials: A Review of Recent Advances. Trends in Food Science & Technology 2024, 145, 104366. [CrossRef]
- Jildeh, Z.B.; Wagner, P.H.; Schöning, M.J. Sterilization of Objects, Products, and Packaging Surfaces and Their Characterization in Different Fields of Industry: The Status in 2020. Physica Status Solidi (a) 2021, 218, 2000732. [CrossRef]
- Finardi, S.; Hoffmann, T.G.; Schmitz, F.R.W.; Bertoli, S.L.; Khayrullin, M.; Neverova, O.; Ponomarev, E.; Goncharov, A.; Kulmakova, N.; Dotsenko, E.; et al. Comprehensive Study of Light-Emitting Diodes (LEDs) and Ultraviolet-LED Lights Application in Food Quality and Safety. J. Pure Appl. Microbiol. 2021, 15, 1125–1135. [CrossRef]
- Guzman-Puyol, S.; Hierrezuelo, J.; Benítez, J.J.; Tedeschi, G.; Porras-Vázquez, J.M.; Heredia, A.; Athanassiou, A.; Romero, D.; Heredia-Guerrero, J.A. Transparent, UV-Blocking, and High Barrier Cellulose-Based Bioplastics with Naringin as Active Food Packaging Materials. International Journal of Biological Macromolecules 2022, 209, 1985–1994. [CrossRef]
- Patil, A.S.; Nille, O.S.; Kolekar, G.B.; Sohn, D.; Gore, A.H. UV-Shielding Biopolymer@Nanocomposites for Sustainable Packaging Applications. In Sustainable Packaging; Muthu, S.S., Ed.; Environmental Footprints and Eco-design of Products and Processes; Springer Singapore: Singapore, 2021; pp. 177–202 ISBN 978-981-16-4608-9.
- Chiozzi, V.; Agriopoulou, S.; Varzakas, T. Advances, Applications, and Comparison of Thermal (Pasteurization, Sterilization, and Aseptic Packaging) against Non-Thermal (Ultrasounds, UV Radiation, Ozonation, High Hydrostatic Pressure) Technologies in Food Processing. Applied Sciences 2022, 12, 2202. [CrossRef]
- Blatchley, E.R. Photochemical Reactors: Theory, Methods, and Ultraviolet Radiation Applications; Wiley: Hoboken, NJ, 2022; ISBN 978-1-119-87135-4.
- Korkut, G.O.; Gunes, G. Ultraviolet Light Technology: Applications for Fresh Produce. In Handbook of Research on Food Processing and Preservation Technologies; Apple Academic Press, 2021 ISBN 978-1-003-15322-1.
- Jadhav, H.B.; Annapure, U.S.; Deshmukh, R.R. Non-Thermal Technologies for Food Processing. Frontiers in Nutrition 2021, 8, 657090. [CrossRef]
- Hamouda, S.A.; Alshawish, N.K.; Abdalla, Y.K.; Ibrahim, M.K. Ultraviolet Radiation: Health Risks and Benefits. Saudi J. Eng. Technol. 2022, 7, 533–541. [CrossRef]
- Breheny, C.; Colbert, D.M.; Bezerra, G.; Geever, J.; Geever, L.M. Towards Sustainable Food Packaging: Mechanical Recycling Effects on Thermochromic Polymers Performance. Polymers 2025, 17, 1042. [CrossRef]
- Breheny, C.; Geever, L.M.; Colbert, D.M.; Bezerra, G.; Geever, J. Evaluating the Chemical Resistance and Performance of Thermochromic Polymers for Food Packaging 2025.
- Crosby, P.H.N.; Netravali, A.N. Green Thermochromic Materials: A Brief Review. Advanced Sustainable Systems 2022, 6, 2200208. [CrossRef]
- Sørensen, L.; Groven, A.S.; Hovsbakken, I.A.; Del Puerto, O.; Krause, D.F.; Sarno, A.; Booth, A.M. UV Degradation of Natural and Synthetic Microfibers Causes Fragmentation and Release of Polymer Degradation Products and Chemical Additives. Science of The Total Environment 2021, 755, 143170. [CrossRef]
- Andrady, A.L.; Barnes, P.W.; Bornman, J.F.; Gouin, T.; Madronich, S.; White, C.C.; Zepp, R.G.; Jansen, M.A.K. Oxidation and Fragmentation of Plastics in a Changing Environment; from UV-Radiation to Biological Degradation. Science of The Total Environment 2022, 851, 158022. [CrossRef]
- El-Hiti, G.A.; Ahmed, D.S.; Yousif, E.; Al-Khazrajy, O.S.A.; Abdallh, M.; Alanazi, S.A. Modifications of Polymers through the Addition of Ultraviolet Absorbers to Reduce the Aging Effect of Accelerated and Natural Irradiation. Polymers 2021, 14, 20. [CrossRef]
- Yousif, E.; Haddad, R. Photodegradation and Photostabilization of Polymers, Especially Polystyrene: Review. Springerplus 2013, 2, 398. [CrossRef]
- Anwer, M.B.; Al-Mashhadani, M.H.; Alsayed, R.; Mohammed, A.H.; Alshareef, S.A.; Alhuwaymil, Z.; Alyami, M.S.S.; Yousif, E. Optimizing PVC Photostability and UV Blocking Capability through Nanoparticles Incorporation: A Comprehensive Review. Vinyl Additive Technology 2025, 31, 259–278. [CrossRef]
- International Organization for Standardization ISO. Plastics — Determination of Charpy Impact Properties — Part 1: Non-Instrumented Impact Test; ISO 179-1; Geneva, Switzerland, 2023.
- International Organization for Standardization ISO. Plastics — Determination of Tensile Properties — Part 2: Test Conditions for Moulding and Extrusion Plastics; ISO 527-2; Geneva, Switzerland, 2012.
- Farooque, R.; Asjad, M.; Rizvi, S.J.A. A Current State of Art Applied to Injection Moulding Manufacturing Process – A Review. Materials Today: Proceedings 2021, 43, 441–446. [CrossRef]
- International Organization for Standardization (ISO) International Organization for Standardization. Plastics — Injection moulding of test specimens of thermoplastic materials — Part 1: General principles, and moulding of multipurpose and bar test specimens; ISO 294-1; Geneva, Switzerland, 2017.
- Silva, M.R.F.; Alves, M.F.R.P.; Cunha, J.P.G.Q.; Costa, J.L.; Silva, C.A.; Fernandes, M.H.V.; Vilarinho, P.M.; Ferreira, P. Nanostructured Transparent Solutions for UV-Shielding: Recent Developments and Future Challenges. Materials Today Physics 2023, 35, 101131. [CrossRef]
- International Organization for Standardization International Organization for Standardization. Plastics — Methods of Exposure to Laboratory Light Sources — Part 3: Fluorescent UV Lamps; ISO 4892-3; Geneva, Switzerland, 2024.
- Kaur, H.; Rana, B.; Tomar, D.; Kaur, S.; Jena, K.C. Fundamentals of ATR-FTIR Spectroscopy and Its Role for Probing In-Situ Molecular-Level Interactions. In Modern Techniques of Spectroscopy; Singh, D.K., Pradhan, M., Materny, A., Eds.; Progress in Optical Science and Photonics; Springer Singapore: Singapore, 2021; Vol. 13, pp. 3–37 ISBN 978-981-336-083-9.
- Nandiyanto, A.B.D.; Ragadhita, R.; Fiandini, M. Interpretation of Fourier Transform Infrared Spectra (FTIR): A Practical Approach in the Polymer/Plastic Thermal Decomposition. Indonesian J. Sci. Technol 2022, 8, 113–126. [CrossRef]
- Siddique, I. Exploring Functional Groups and Molecular Structures: A Comprehensive Analysis Using FTIR Spectroscopy. SSRN Journal 2024. [CrossRef]
- Fiore, T.; Pellerito, C. Infrared Absorption Spectroscopy. In Spectroscopy for Materials Characterization; Agnello, S., Ed.; Wiley, 2021; pp. 129–167 ISBN 978-1-119-69732-9.
- ISO/CIE. ISO/CIE 11664-4:2019 - Colorimetry — Part 4: CIE 1976 Lab Colour Space*; ISO/CIE 11664-4; Geneva, Switzerland, 2019.
- Gdoutos, E.; Konsta-Gdoutos, M. Tensile Testing. In Mechanical Testing of Materials; Gdoutos, E., Konsta-Gdoutos, M., Eds.; Springer Nature Switzerland: Cham, 2024; pp. 1–34 ISBN 978-3-031-45990-0.
- Zainuddin, H.; Ali, M.B.; Zakaria, K.A.; Paijan, L.H.; Mamat, M.F.; Abu Bakar, M.H. Investigation of Impact Properties under Instrumented Charpy Test. J. Eng. Technol. Sci. 2024, 56, 329–339. [CrossRef]
- Ramírez-Hernández, A.; Aguilar-Flores, C.; Aparicio-Saguilán, A. Fingerprint Analysis of FTIR Spectra of Polymers Containing Vinyl Acetate. DYNA 2019, 86, 198–205. [CrossRef]
- Randhawa, K.S. Polymer Composites with Advanced Pigments: Enhancing Properties and Applications. PRT 2024. [CrossRef]
- Smith, B.C. The Infrared Spectra of Polymers II: Polyethylene. Spectroscopy 2021, 24–29. [CrossRef]
- Kotnarowska, D. Influence of Ageing with UV Radiation on Physicochemical Properties of Acrylic-Polyurethane Coatings. JSEMAT 2018, 08, 95–109. [CrossRef]
- Lu, T.; Solis-Ramos, E.; Yi, Y.; Kumosa, M. UV Degradation Model for Polymers and Polymer Matrix Composites. Polymer Degradation and Stability 2018, 154, 203–210. [CrossRef]
- Hedir, A.; Slimani, F.; Moudoud, M.; Lamrous, O.; Touam, T.; Teguar, M.; Haddad, A.; Durmuş, A. Quantifying Time-Dependent Structural and Mechanical Properties of UV-Aged LDPE Power Cables Insulations. Turkish Journal of Chemistry 2022, 46, 956–967. [CrossRef]
- Yurtsever, M.; Öztaş, A.; Mutlu, R. Assessing The Relationship Between Color Change and Tensile Strength In Thermoplastic Polyolefin Outer Sheaths of Low-Voltage Power Cables. Trakya Üniversitesi Mühendislik Bilimleri Dergisi 2024, 25, 11–19. [CrossRef]
- Cheng, Y.; Zhang, X.; Fang, C.; Chen, J.; Wang, Z. Discoloration Mechanism, Structures and Recent Applications of Thermochromic Materials via Different Methods: A Review. Journal of Materials Science & Technology 2018, 34, 2225–2234. [CrossRef]
- Bulderberga, O.; Aniskevich, A. The Effect of UV Exposure on the Service-Life of Thermochromic Microcapsules Integrated into the Epoxy Matrix. ms 2022, 28, 333–339. [CrossRef]
- Kheur, M.; Sethi, T.; Coward, T.; Kakade, D.; Rajkumar, M. Evaluation of the Effect of Ultraviolet Stabilizers on the Change in Color of Pigmented Silicone Elastomer: An in Vitro Study. J Indian Prosthodont Soc 2016, 16, 276. [CrossRef]
- Yan, X.; Qian, X.; Chang, Y.; Lu, R.; Miyakoshi, T. The Effect of Glass Fiber Powder on the Properties of Waterborne Coatings with Thermochromic Ink on a Chinese Fir Surface. Polymers 2019, 11, 1733. [CrossRef]
- Korayem, A.-E.; Mohammadi, H.; Dargazany, R. Experimental Investigation on the Performance Loss of Cross-Linked Polymers During Photo-Oxidative Aging. In Proceedings of the Volume 12: Mechanics of Solids, Structures, and Fluids; American Society of Mechanical Engineers: Virtual, Online, November 16 2020; p. V012T12A002.
- Gewert, B.; Plassmann, M.; Sandblom, O.; MacLeod, M. Identification of Chain Scission Products Released to Water by Plastic Exposed to Ultraviolet Light. Environ. Sci. Technol. Lett. 2018, 5, 272–276. [CrossRef]
- Erdmann, M.; Niebergall, U.; Wachtendorf, V.; Böhning, M. Evaluation of UV-Induced Embrittlement of PE-HD by Charpy Impact Test. Journal of Applied Polymer Science 2020, 137, 49069. [CrossRef]
- Scida, D.; Alix, S.; Buet, S.; Hadi Saidane, E.; Courmont, F.; Behlouli, K.; Ayad, R. Hygrothermal/UV Aging Effect on Visual Aspect and Mechanical Properties of Non-Woven Natural-Fiber Composites. Journal of Renewable Materials 2019, 7, 865–875. [CrossRef]
- Varghese, A.M.; Rangaraj, V.M.; Luckachan, G.; Mittal, V. UV Aging Behavior of Functionalized Mullite Nanofiber-Reinforced Polypropylene. ACS Omega 2020, 5, 27083–27093. [CrossRef]
- Arencón, D.; Velasco, J.I. Fracture Toughness of Polypropylene-Based Particulate Composites. Materials 2009, 2, 2046–2094. [CrossRef]
- Rodriguez, A.K.; Mansoor, B.; Ayoub, G.; Colin, X.; Benzerga, A.A. Effect of UV-Aging on the Mechanical and Fracture Behavior of Low Density Polyethylene. Polymer Degradation and Stability 2020, 180, 109185. [CrossRef]
- Cundiff, K.N.; Madi, Y.; Benzerga, A.A. Photo-Oxidation of Semicrystalline Polymers: Damage Nucleation versus Growth. Polymer 2020, 188, 122090. [CrossRef]
- Wypych, G. Handbook of UV Degradation and Stabilization; Elsevier, 2020; ISBN 978-1-927885-57-4.
- Erdmann, M.; Niebergall, U.; Wachtendorf, V.; Böhning, M. Evaluation of UV-Induced Embrittlement of PE-HD by Charpy Impact Test. Journal of Applied Polymer Science 2020, 137, 49069. [CrossRef]
- Wypych, A.; Wypych, G. Databook of UV Stabilizers; Elsevier, 2025; ISBN 978-1-77467-055-2.
- Chylińska, M.; Kaczmarek, H.; Moszyński, D.; Królikowski, B.; Kowalonek, J. Surface Studies of UV Irradiated Polypropylene Films Modified with Mineral Fillers Designed as Piezoelectric Materials. Polymers 2020, 12, 562. [CrossRef]
- Larché, J.-F.; Bussière, P.-O.; Thérias, S.; Gardette, J.-L. Photooxidation of Polymers: Relating Material Properties to Chemical Changes. Polymer Degradation and Stability 2012, 97, 25–34. [CrossRef]
Figure 1.
ATR-FTIR spectrum of the unexposed sample (magenta), showing characteristic absorption bands consistent with an ethylene-vinyl acetate (EVA) copolymer, including C–H stretching (~2920 and ~2850 cm⁻¹), carbonyl (C=O) stretching (~1740 cm⁻¹), and C–O stretching (~1240–1020 cm⁻¹).
Figure 1.
ATR-FTIR spectrum of the unexposed sample (magenta), showing characteristic absorption bands consistent with an ethylene-vinyl acetate (EVA) copolymer, including C–H stretching (~2920 and ~2850 cm⁻¹), carbonyl (C=O) stretching (~1740 cm⁻¹), and C–O stretching (~1240–1020 cm⁻¹).
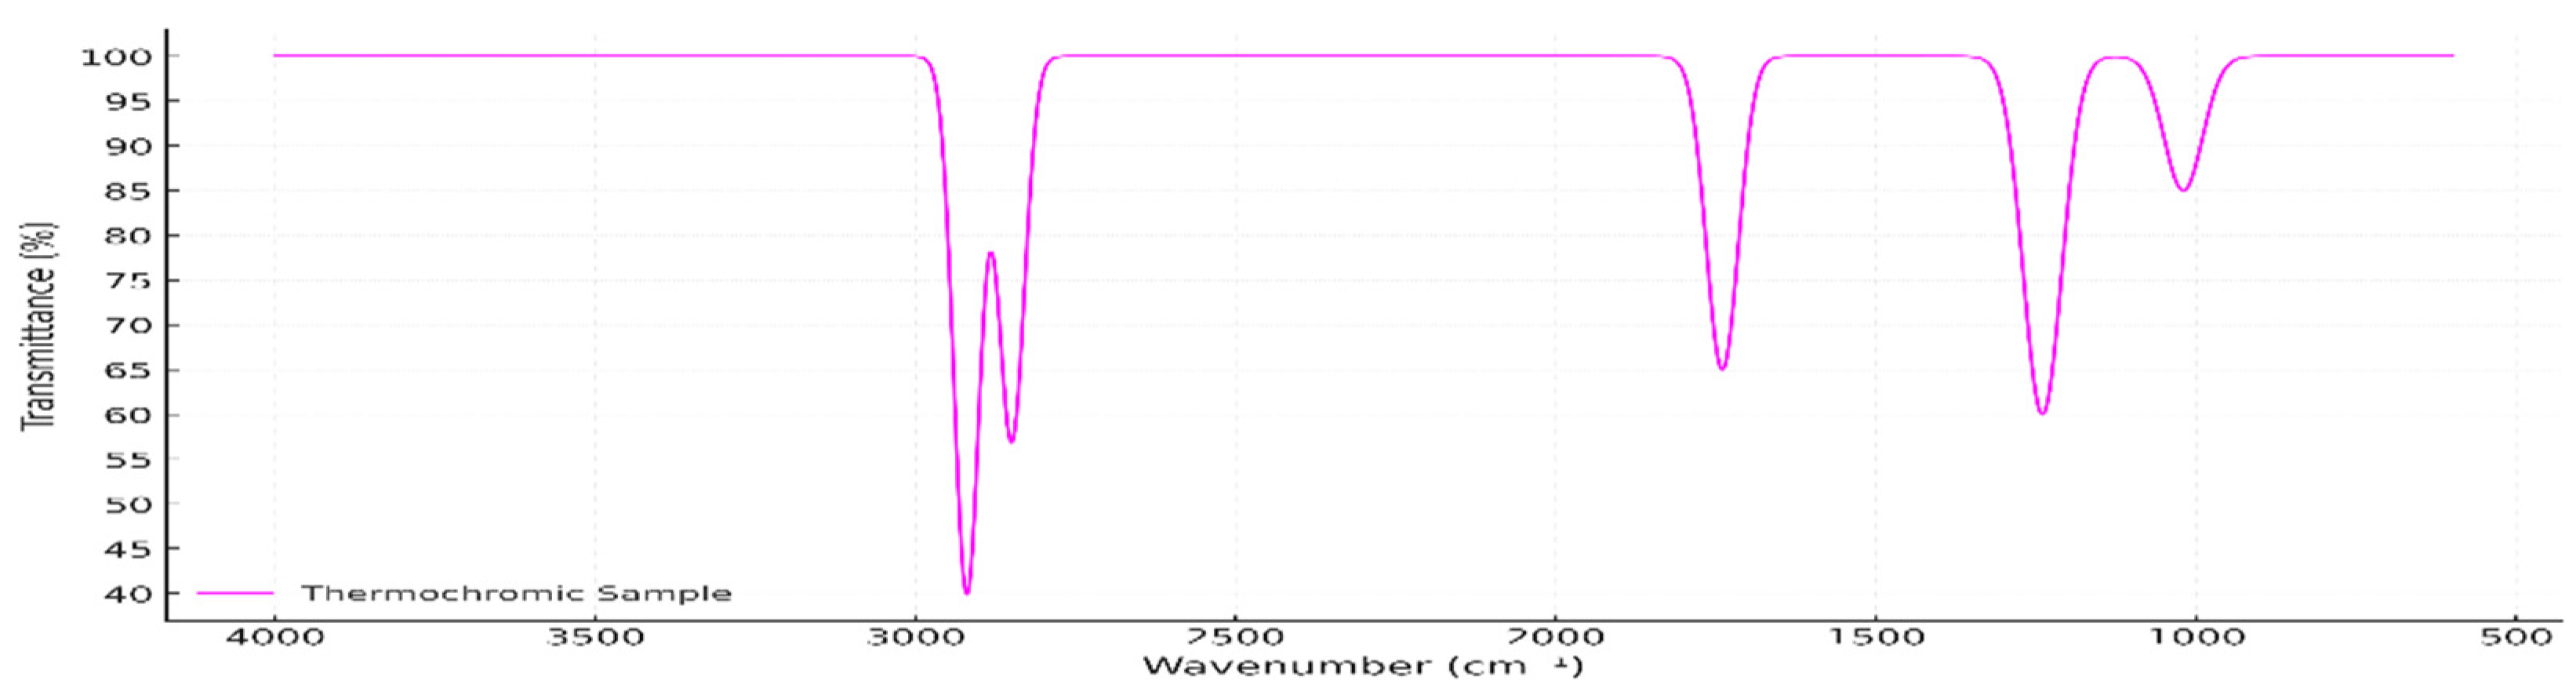
Figure 2.
Overlay of the ATR-FTIR spectrum for ThermoBatch™ (magenta) and EVA reference spectrum (black), confirming the material match.
Figure 2.
Overlay of the ATR-FTIR spectrum for ThermoBatch™ (magenta) and EVA reference spectrum (black), confirming the material match.
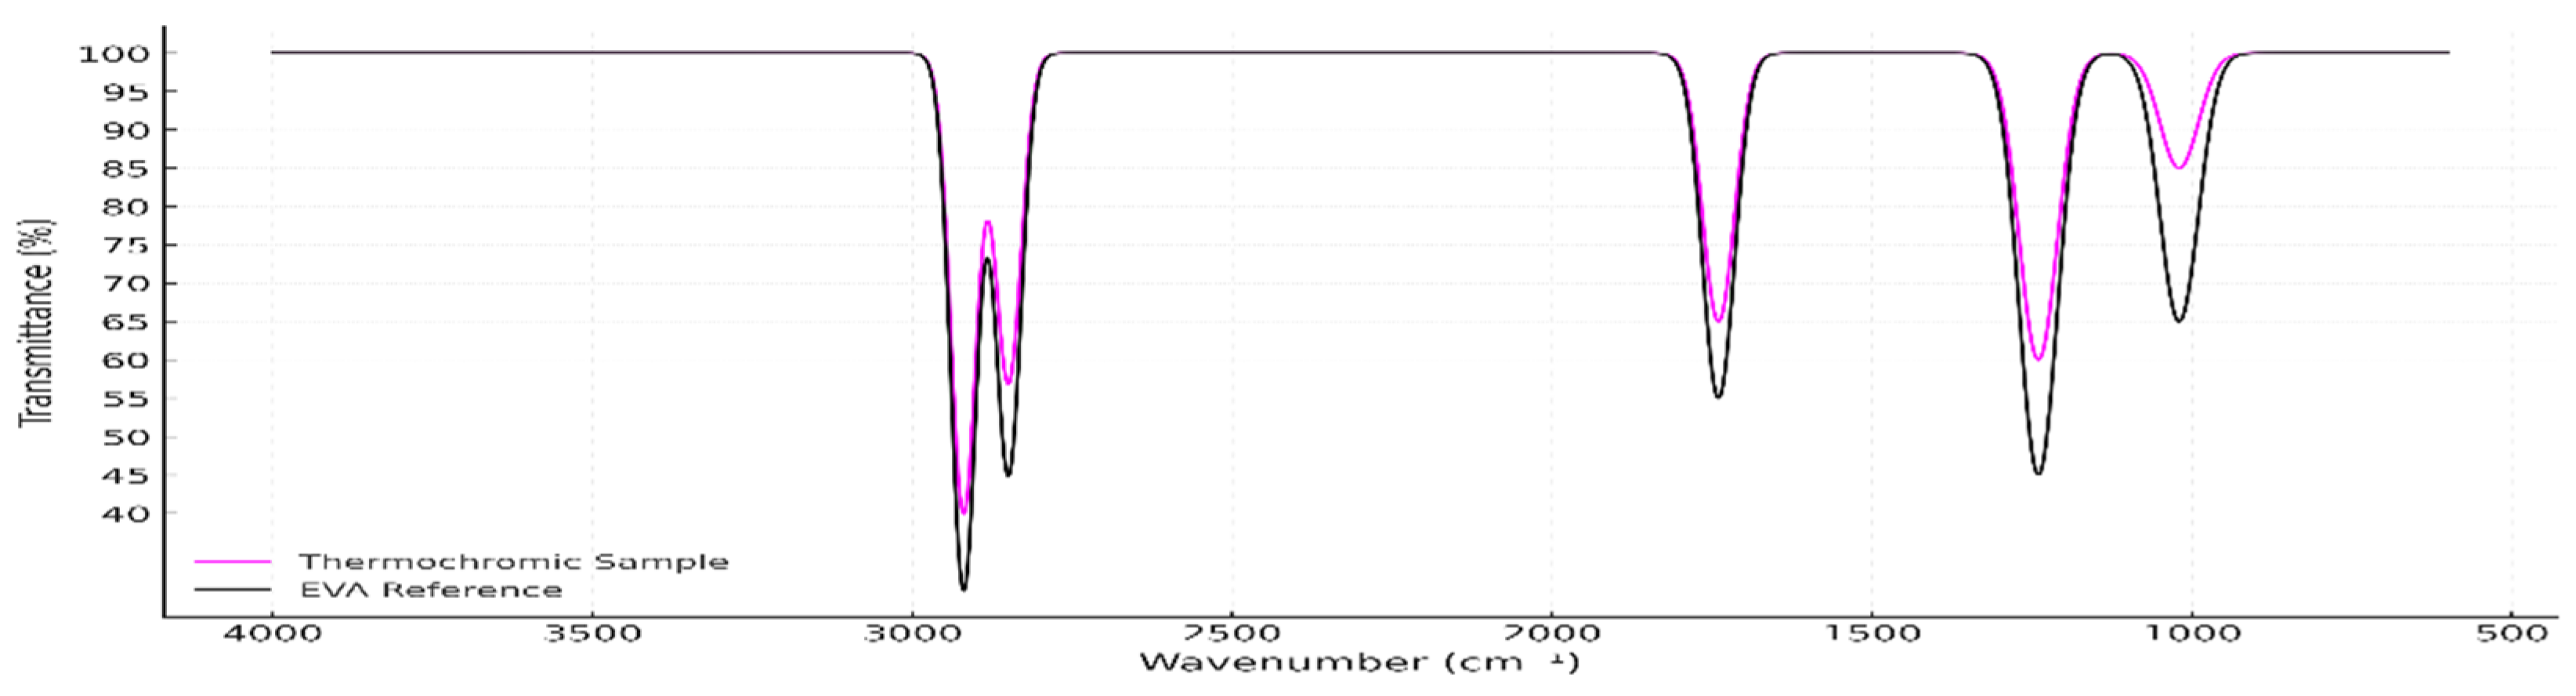
Figure 3.
The visual appearance of PP98/TP2 and PP92/TP8 impact test specimens before and after UV exposure: (A) PP98/TP2 prior to UV exposure; (B) PP98/TP2 after 500 hours of simulated indoor UV exposure; (C) PP98/TP2 after 1000 hours of simulated indoor UV exposure; (D) PP92/TP8 prior to UV exposure; (E) PP92/TP8 after 500 hours of simulated indoor UV exposure; (F) PP92/TP8 after 1000 hours of simulated indoor UV exposure.
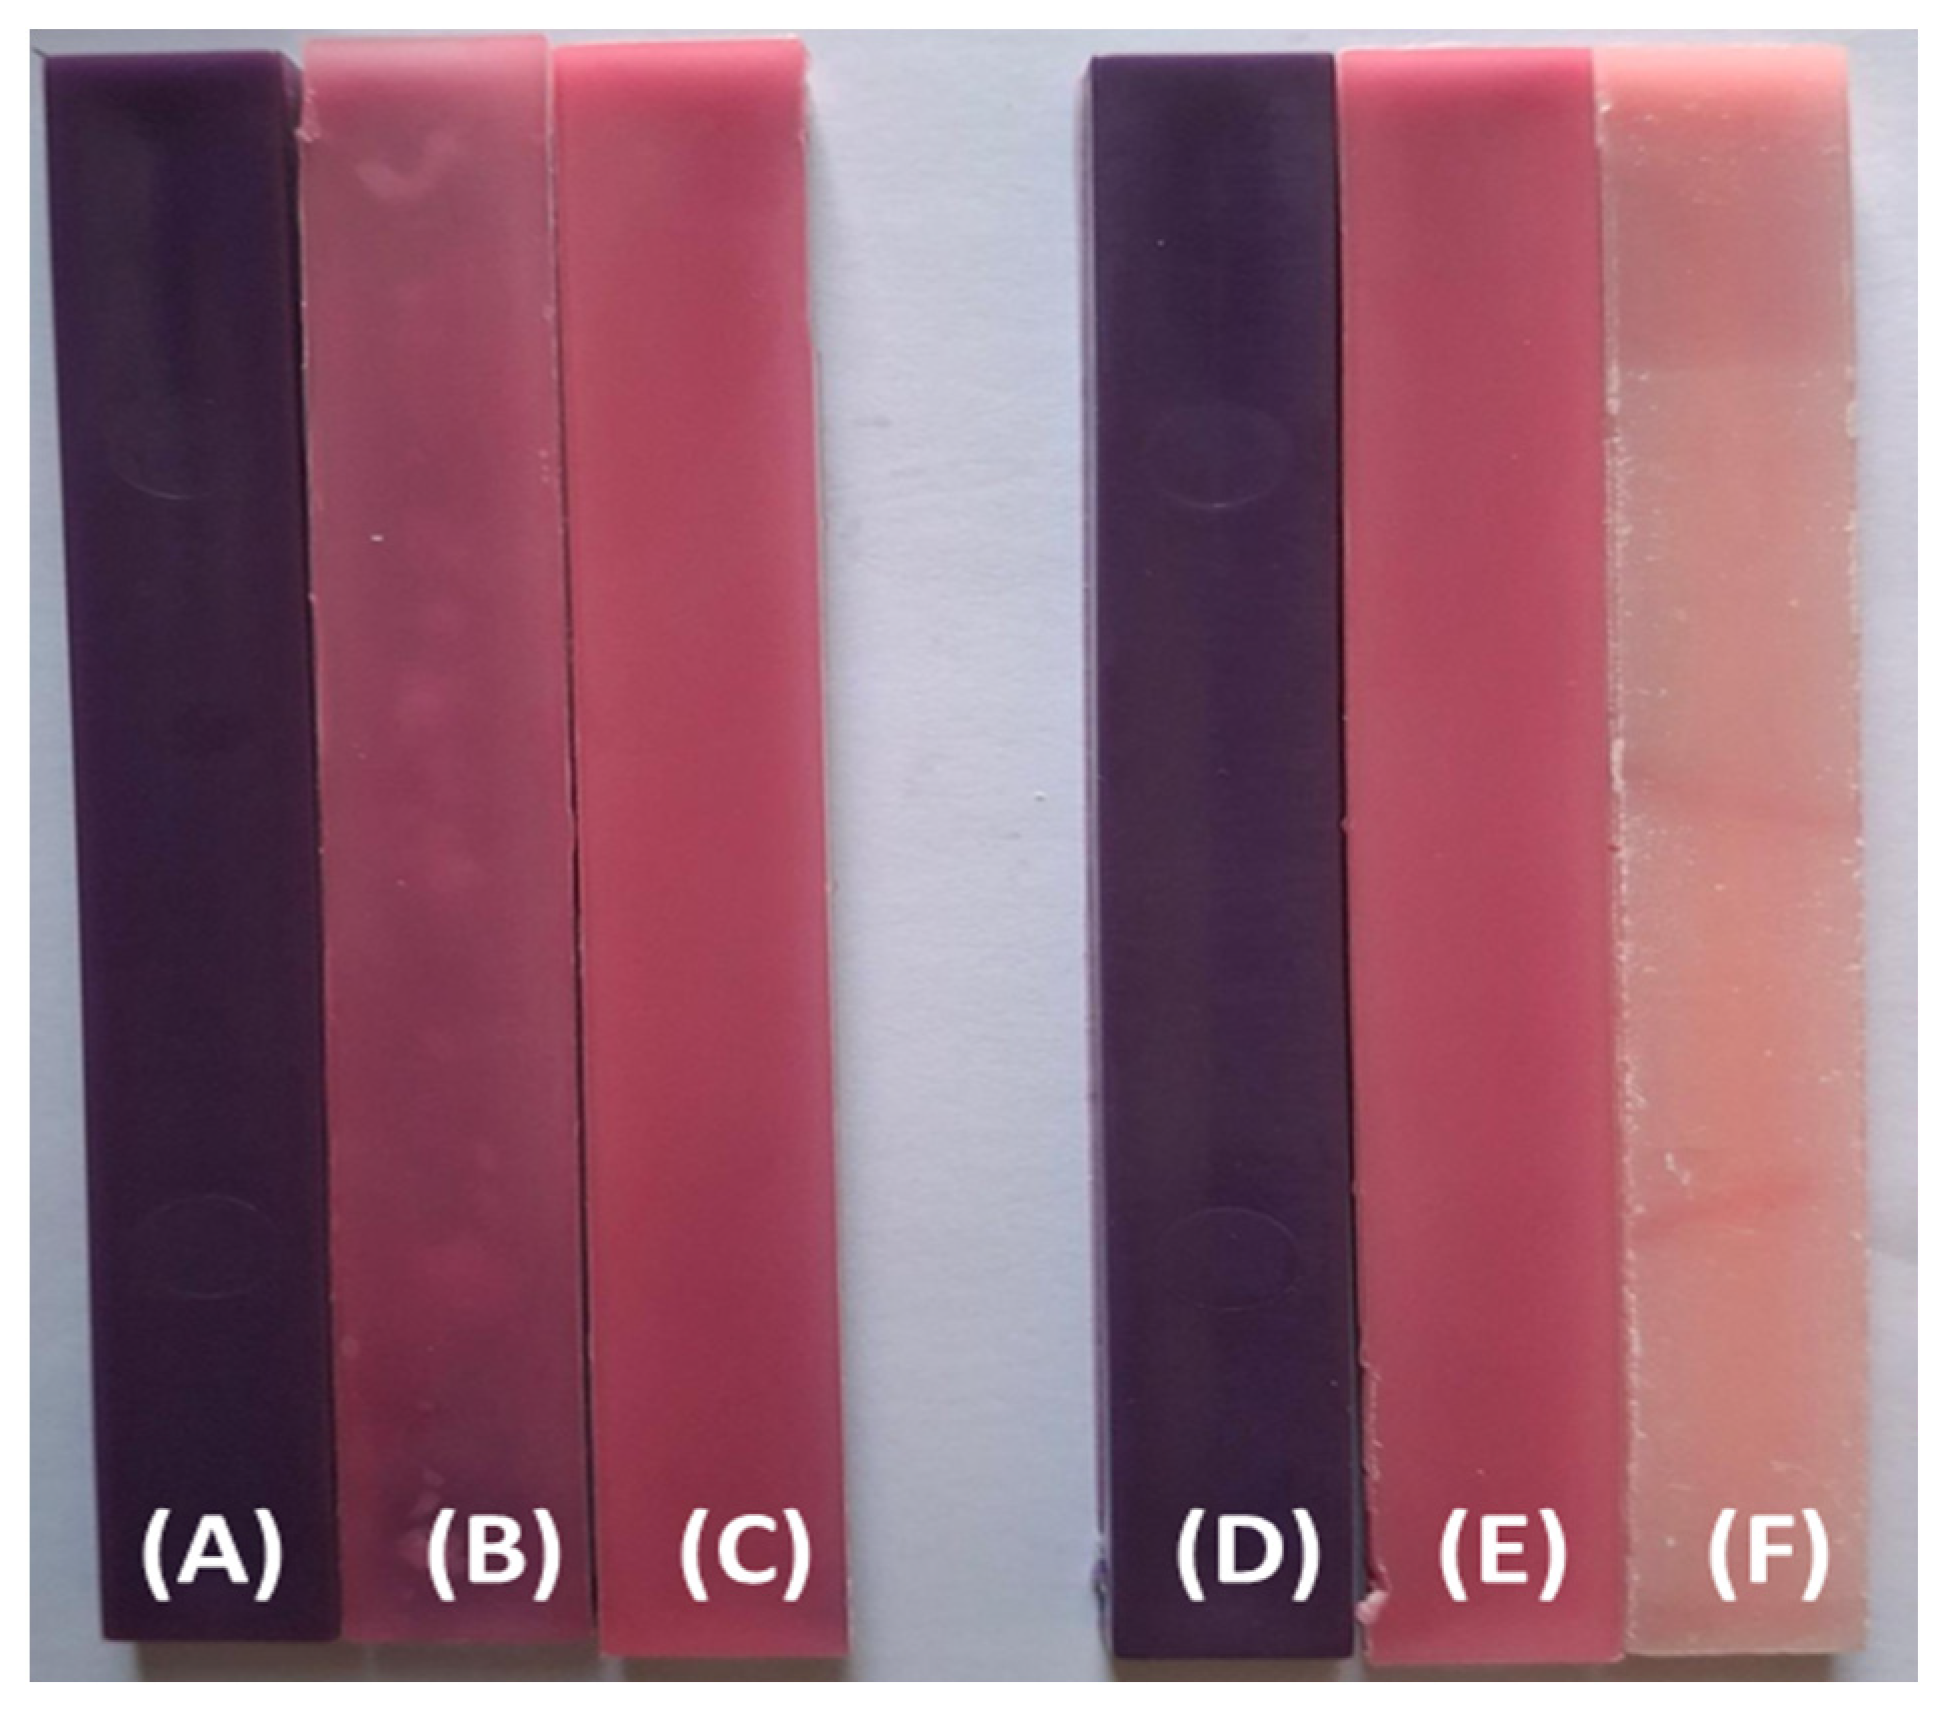
Figure 4.
The visual appearance of PP98/TP2 and PP92/TP8 impact test specimens before and after UV exposure: (A) PP98/TP2 prior to UV exposure; (B) PP98/TP2 after 500 hours of simulated outdoor UV exposure; (C) PP98/TP2 after 1000 hours of simulated outdoor UV exposure; (D) PP92/TP8 prior to UV exposure; (E) PP92/TP8 after 500 hours of simulated outdoor UV exposure; (F) PP92/TP8 after 1000 hours of simulated outdoor UV exposure.
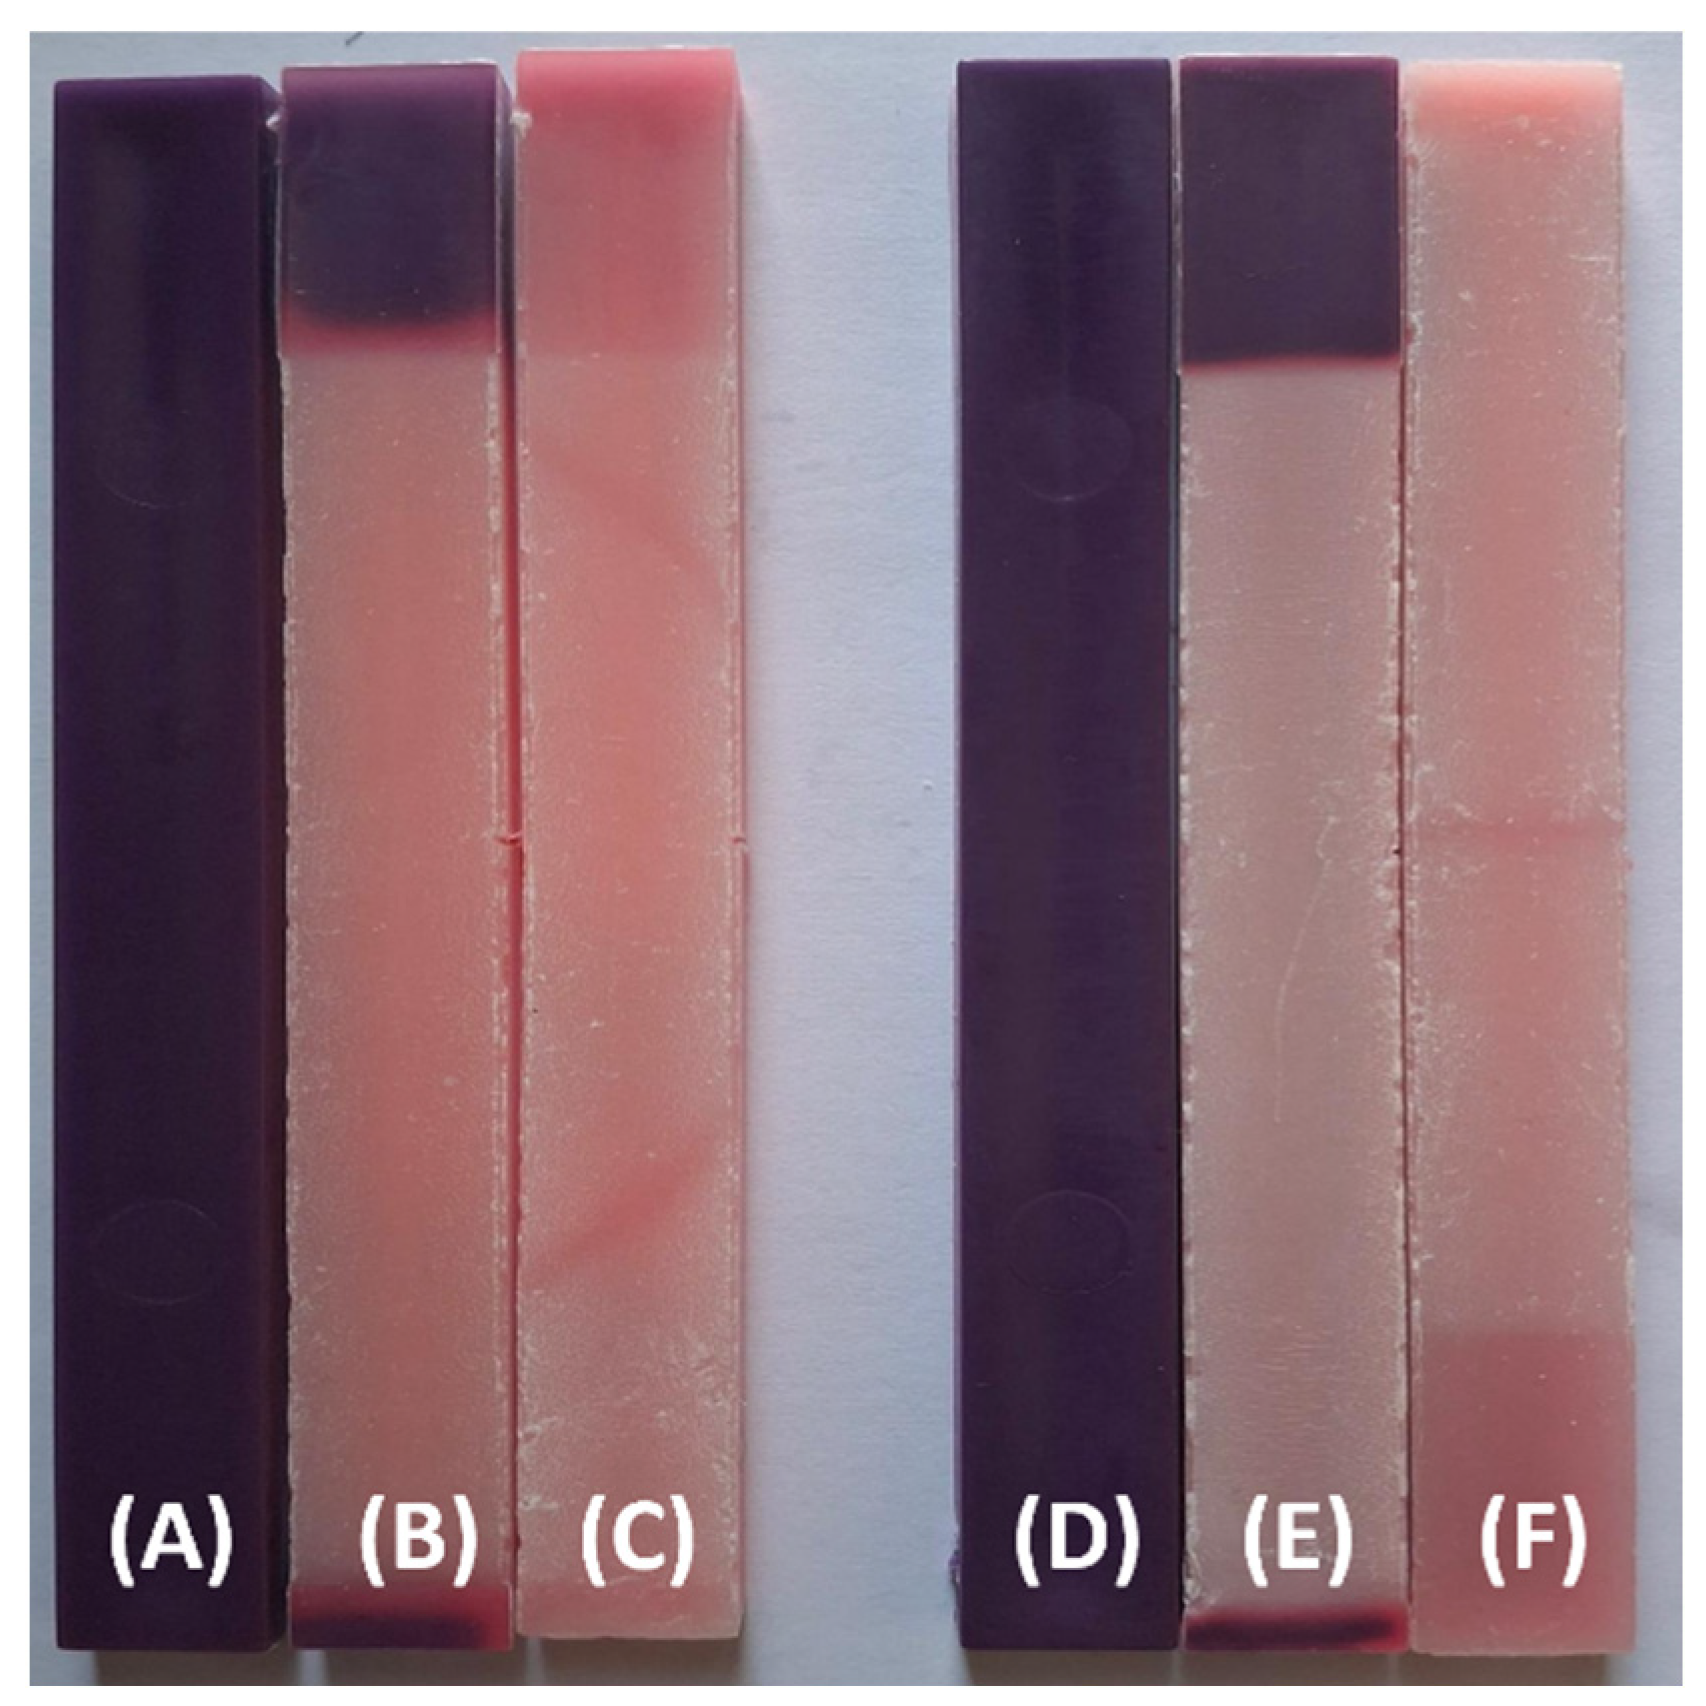
Figure 5.
Samples mounted in metal frames prior to accelerated aging in the QUV weathering chamber.
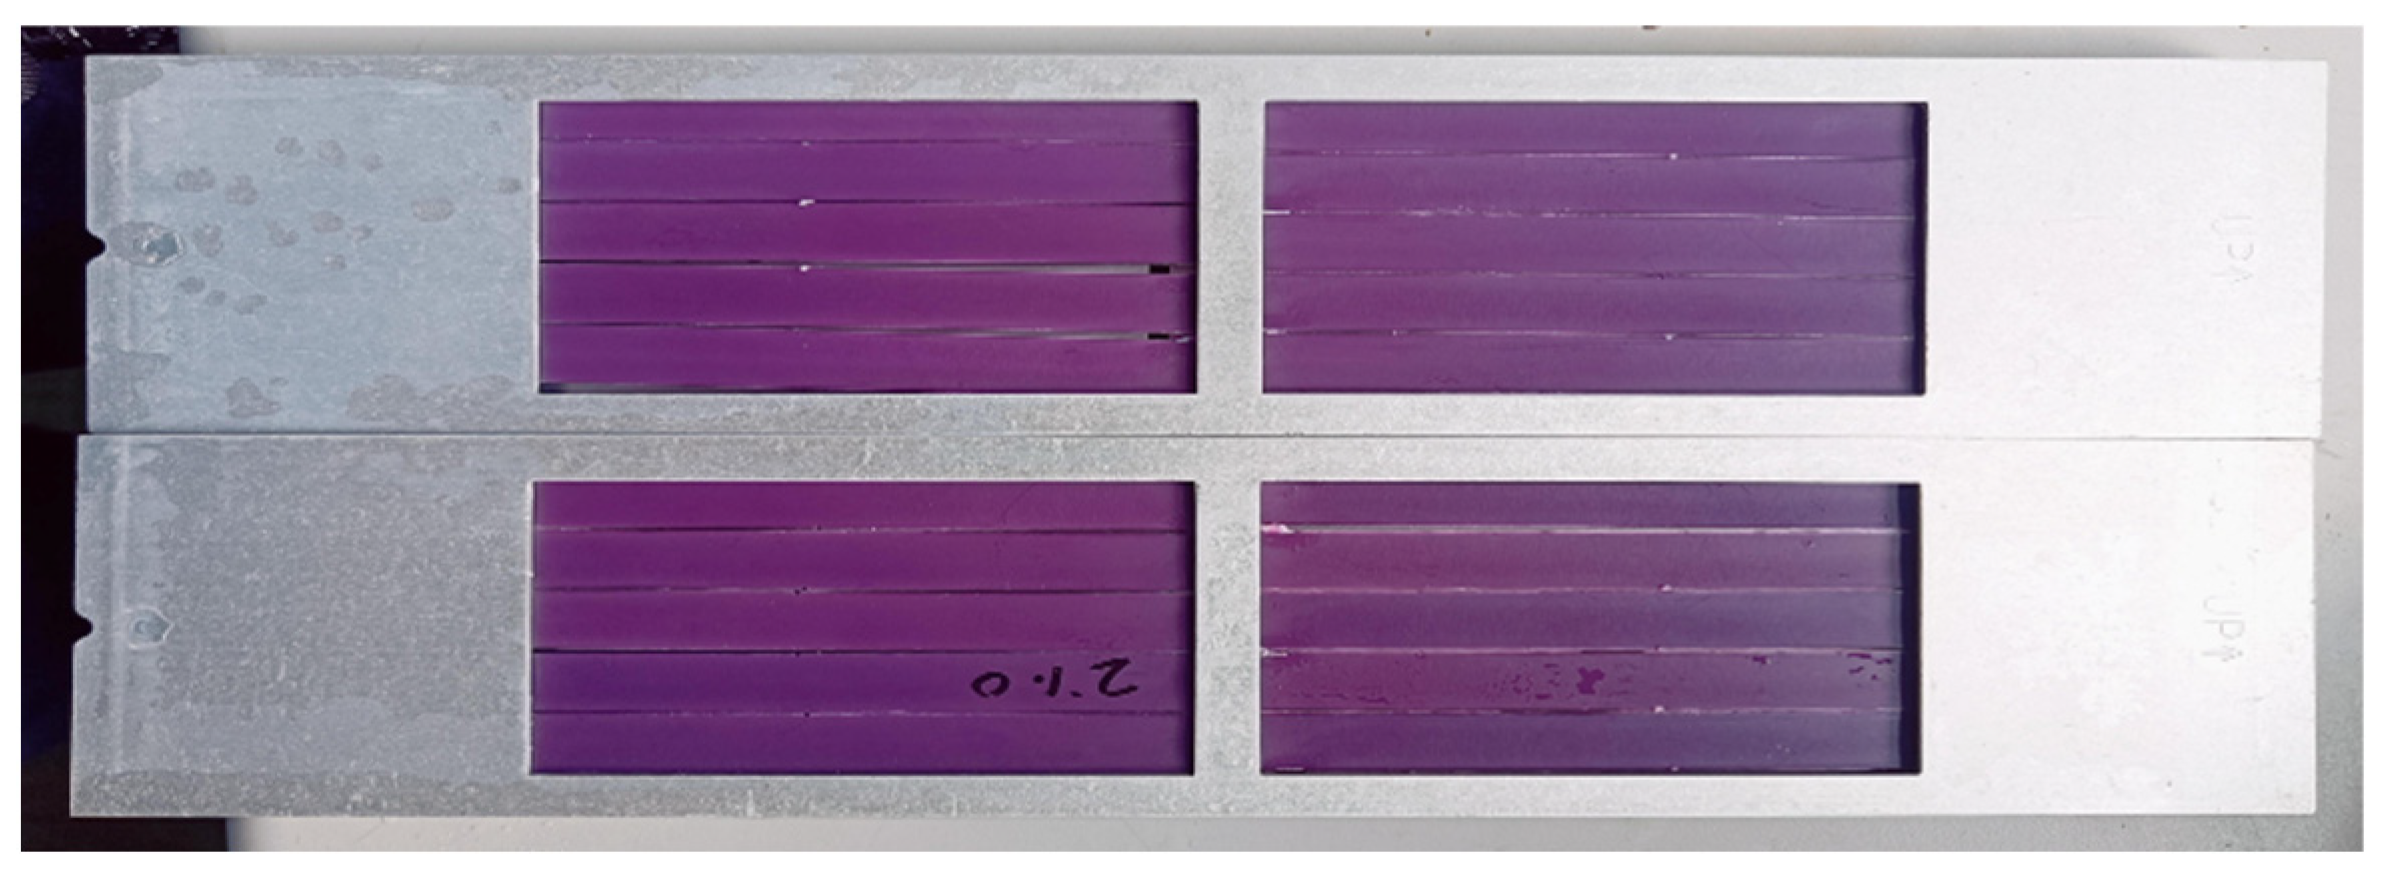

Table 1.
Composition of Thermochromic Polymer Blends Prepared for UV Aging Study.
| Sample Name | PP (wt. %) | TP (wt. %) |
|---|---|---|
| PP98/TP2 | 98 | 2 |
| PP92/TP8 | 92 | 8 |
Table 2.
UV Exposure Devices, Wavelengths, and Test Conditions.
| Device | Wavelength | UV Type | Use Case | Exposure Duration (h) |
|---|---|---|---|---|
| RS 559-934 UV Exposure Unit | 360 nm | UVA | Simulated indoor lighting | 500 h & 1000 h |
| QUV/Solar Eye (SE) | 340 nm | UVA | Simulated outdoor lighting | 500 h & 1000 h |
Table 3.
ΔL*, Δa*, Δb* color parameters and total color difference (ΔE*ab) across UVA radiation (internal).
Table 3.
ΔL*, Δa*, Δb* color parameters and total color difference (ΔE*ab) across UVA radiation (internal).
| Specimen ID. |
UV Device |
Exposure Hours (h) |
ΔL* | Δa* | Δb* | (ΔE*ab) |
|---|---|---|---|---|---|---|
| PP98/TP2 | — | 0 | 0.00 | 0.00 | 0.00 | 0.00 |
| RS 559-934 RS 559-934 |
500 | 14.22 (±0.82) | 8.16 (±1.03) | 11.38 (±0.92) | 19.29 (±1.13) | |
| 1000 | 19.58 (±0.91) | 6.03 (±0.75) | 13.53 (±0.61) | 23.50 (±1.02) | ||
| QUV/SE QUV/SE |
500 | 19.21 (±1.00) | 10.78 (±1.26) | 14.46 (±0.45) | 26.36 (±1.97) | |
| 1000 | 24.62 (±1.06) | 8.07 (±1.01) | 15.65 (±0.48) | 30.29 (±1.08) | ||
|
PP92/TP8 |
— | 0 | 0.00 | 0.00 | 0.00 | 0.00 |
| RS 559-934 RS 559-934 |
500 | 13.14 (±0.53) | 7.51 (±0.86) | 10.81 (±0.15) | 17.82 (±0.91) | |
| 1000 | 24.78 (±0.45) | 3.27 (±0.62) | 12.98 (±0.49) | 27.57 (±0.62) | ||
| QUV/SE QUV/SE |
500 1000 |
17.57 (±0.62) | 10.13 (±0.96) | 13.43 (±0.58) | 24.34 (±1.10) | |
| 30.34 (±0.43) | 4.09 (±0.66) | 14.96 (±0.30) | 34.07 (±0.21) |
Table 4.
The effect of UV exposure on the tensile strength of PP98/TP2 and PP92/TP8 post 0, 500, and 1000 hours.
Table 4.
The effect of UV exposure on the tensile strength of PP98/TP2 and PP92/TP8 post 0, 500, and 1000 hours.
| Specimen ID. |
UV Device | Exposure Hours (h) | Tensile strain at Break (%) | Maximum Tensile Stress (MPa) |
Young’s Modulus (MPa) |
|---|---|---|---|---|---|
| PP98/TP2 | None (Control) | 0 | 95.69 (±3.81) | 29.45 (±0.85) | 653.82 (±9.57) |
| RS 559-934 (360 nm) | 500 | 81.49 (±3.52) | 27.57 (±0.76) | 660.12 (±10.34) | |
| RS 559-934 (360 nm) | 1000 | 60.11 (±3.34) | 25.64 (±0.69) | 672.97 (±11.21) | |
| PP92/TP8 | None (Control) | 0 | 87.25 (±3.63) | 28.89 (±0.81) | 653.10 (±8.72) |
| RS 559-934 (360 nm) | 500 | 72.13 (±3.38) | 26.94 (±0.78) | 660.82 (±9.94) | |
| RS 559-934 (360 nm) | 1000 | 44.79 (±2.92) | 22.31 (±0.73) | 672.33 (±11.06) |
Table 5.
The effect of UV exposure on the impact strength of PP98/TP2 and PP92/TP8 with and without notch after UV exposure post 0, 500, and 1000 hours.
Table 5.
The effect of UV exposure on the impact strength of PP98/TP2 and PP92/TP8 with and without notch after UV exposure post 0, 500, and 1000 hours.
| Specimen ID. |
UV Device | Exposure Hours (h) |
Unnotched Impact Strength (kJ/m2) |
Notched Impact Strength (kJ/m2) |
|---|---|---|---|---|
| PP98/TP2 | None (Control) RS 559-934 (360 nm) RS 559-934 (360 nm) QUV/Solar Eye (340 nm) QUV/Solar Eye (340 nm) |
0 | 99.94 (±2.12) | 23.52 (±1.21) |
| 500 | 85.65 (±2.87) | 20.32 (±1.44) | ||
| 1000 | 70.54 (±3.23) | 17.95 (±1.58) | ||
| 500 | 78.41 (±2.51) | 18.61 (±1.33) | ||
| 1000 | 60.22 (±3.13) | 15.23 (±1.67) | ||
| PP92/TP8 | None (Control) RS 559-934 (360 nm) RS 559-934 (360 nm) QUV/Solar Eye (340 nm) QUV/Solar Eye (340 nm) |
0 | 99.86 (±2.07) | 23.44 (±1.13) |
| 500 | 81.19 (±2.72) | 18.87 (±1.56) | ||
| 1000 | 66.37 (±3.08) | 16.05 (±1.49) | ||
| 500 | 75.04 (±2.95) | 17.22 (±1.32) | ||
| 1000 | 52.37 (±3.43) | 13.09 (±1.58) |
Table 6.
Mass of Tensile Specimens Before and After UV Exposure under Different Conditions.
| Specimen ID. |
Exposure Condition |
Exposure Duration (h) |
Mass Before Exposure (mg) |
Mass After Exposure (mg) |
|---|---|---|---|---|
| PP98/TP2 |
Indoor (360 nm, RS Unit) | 500 h | 3.726 (±0.01) | 3.720 (±0.01) |
| Indoor (360 nm, RS Unit) | 1000 h | 3.731 (±0.01) | 3.725 (±0.01) | |
| Outdoor (340 nm, QUV) | 500 h | 3.738 (±0.01) | 3.734 (±0.01) | |
| Outdoor (340 nm, QUV) | 1000 h | 3.725 (±0.01) | 3.726 (±0.01) | |
| PP92/TP8 | Indoor (360 nm, RS Unit) | 500 h | 3.729 (±0.01) | 3.727 (±0.01) |
| Indoor (360 nm, RS Unit) | 1000 h | 3.732 (±0.01) | 3.730 (±0.01) | |
| Outdoor (340 nm, QUV) | 500 h | 3.731 (±0.01) | 3.729 (±0.01) | |
| Outdoor (340 nm, QUV) | 1000 h | 3.730 (±0.01) | 3.728 (±0.01) |
Disclaimer/Publisher’s Note: The statements, opinions and data contained in all publications are solely those of the individual author(s) and contributor(s) and not of MDPI and/or the editor(s). MDPI and/or the editor(s) disclaim responsibility for any injury to people or property resulting from any ideas, methods, instructions or products referred to in the content. |
© 2025 by the authors. Licensee MDPI, Basel, Switzerland. This article is an open access article distributed under the terms and conditions of the Creative Commons Attribution (CC BY) license (http://creativecommons.org/licenses/by/4.0/).
Copyright: This open access article is published under a Creative Commons CC BY 4.0 license, which permit the free download, distribution, and reuse, provided that the author and preprint are cited in any reuse.


