
Submitted:
03 November 2025
Posted:
04 November 2025
You are already at the latest version
Abstract
This study addresses the critical knowledge gap concerning the environmental sustainability of smallholder dairy systems, which are pivotal to India's milk production. A robust multi-criteria methodology was employed, commencing with an exhaustive literature review to identify a comprehensive suite of environmental sustainability indicators. These indicators encompassed crucial aspects such as land use efficiency, nutrient management, water resource utilization, waste disposal practices, breeding strategies, and energy consumption. Subsequent refinement of this initial indicator set involved rigorous expert review, prioritizing practicality and measurability within the context of smallholder operations. The meticulously selected indicators were then empirically applied to a representative sample of smallholder dairy farms in Haryana. The investigation revealed a direct land use of 0.7 m2 per liter of milk produced. Noteworthy findings pertaining to input consumption included fertilizer application rates of 28 g urea, 14 g diammonium phosphate (DAP), and 0.7 g single super phosphate (SSP) per liter of milk. Furthermore, a substantial water consumption of 1488.23 liters per liter of milk produced was identified. A crucial contribution of this study is the explicit consideration and identification of critical environmental boundaries, a factor often overlooked in previous sustainability assessments. By contrasting the observed resource usage with regional water availability and established critical land-use thresholds, a significant insight emerged: smallholder dairy production in Haryana may currently operate within environmentally sustainable parameters. These findings provide invaluable data for policymakers and stakeholders, serving as a scientific basis for the formulation of regionally appropriate and livelihood-supporting strategies for sustainable dairy production.
Keywords:
environmental sustainability
; land use
; GHG emissions
; pesticide use
; water use
; India
1. Introduction
Livestock products are becoming more and more in demand worldwide (OECD/FAO, 2018) driven by burgeoning human populations, increasing urbanization, and rising income levels, particularly in developing nations. Concurrently, concerns regarding the environmental ramifications of livestock farming have intensified alongside this demand (Steinfeld et al., 2006). Furthermore, because of global warming, the environmental impact of livestock production has become a significant and contentious global problem (Rotz and Rotz, 2020). Indeed, livestock production is recognized as one of the most ecologically detrimental anthropogenic activities (Abbasi et al., 2015). The long-term viability of livestock systems is further challenged by animal disease crises, which adversely affect farm profitability, animal welfare, and environmental integrity (Rigby et al., 2001; Calker, 2005; Napel et al., 2011). Consequently, rapid technological advancements and evolving consumer preferences necessitate sustainable intensification strategies that minimize negative environmental impacts.
Nevertheless, defining sustainability presents considerable challenges. Over the past fifteen years, numerous efforts have sought to define, evaluate, and characterize essential approaches to sustainability (Geng et al., 1990; Munasinghe and Shearer, 1995). A widely accepted framework, or working definition, was proposed by the World Commission on Environment and Development (WCED), which defined sustainable development as “addressing current demands without sacrificing the capacity of future generations to address their own needs” (WCED, 1987). More recently, Linden et al. (2020) concluded that only 33% of sustainability assessment models encompassed all three components of sustainability. Furthermore, Lebacq et al. (2013) have contended that while numerous sustainability indicators and methods have been developed at the farm level, a critical challenge lies in mitigating assessment subjectivity through a transparent selection process, advocating for indicator selection within a data-driven context. The present study aligns with the arguments of Lebacq et al. (2013), and thus, relies on data-driven indicators to assess environmental sustainability.
Despite the growing importance of sustainable livestock systems, comprehensive research assessing the environmental sustainability of dairy farming systems in India remains conspicuously absent. Therefore, this study endeavors to address this critical gap by assessing the sustainability of dairy farming across a range of pertinent indicators.
2. Methodology
The current study was conducted in Haryana, which is located between 270 29’ and 200 55’ N latitude and 730 27’ 8” to 770 26’ 5” E longitude. Haryana has a population of around 2.54 crores, with a density of 573 persons per square kilometre. Haryana province is renowned for its superior Murrah buffalo breed and boasts the third highest per capita milk availability in India. Its robust smallholder dairy production system makes it one of the country’s leading milk producers. The state comprises of 22 districts. The province is geographically divided into three zones (Zone I,II and III) based upon ecology and cropping pattern according to ICAR, (2016).
2.1. Sampling Methodology
To ensure proportionate representation across these zones, a multi-stage sampling technique was employed to select dairy farms. From each zone one district was selected randomly by using simple lottery method. Districts Sonipat, Rohtak and Jhajjar were selected out of zone I, II and III respectively. A total of 120 dairy farms were included in the study, chosen using a simple lottery method. The detailed sampling procedure is visually represented in Figure 1.
2.2. Indicator Selection and Refinement
This study adopted a means-based, data-driven approach for assessing environmental sustainability, aligning with the classification of indicators by Lebacq et al. (2013), which describes four types: means-based, system state, emission, and effect-based.
An initial compilation of 47 potential environmental sustainability indicators was generated through an extensive review of existing literature. These indicators were then subjected to expert validation. A Google Form survey was distributed to scientists, of whom 32 responded, to solicit their expert opinions on the relevance of each indicator for sustainability assessment. Respondents were asked to rate each indicator on a five-point Likert scale, with increasing scores indicating higher relevance. The mean relevancy score was calculated for each indicator, and only 15 indicators were retained if they achieved an 80 percent agreement/relevancy score or higher.
2.3. Contextualization and Operationalization
The contextualization of the sustainability assessment and the operationalization of the selected indicators followed the criteria suggested by Lebacq et al. (2013). The primary purpose of this analysis was to identify critical areas within the current dairy production systems that are likely to pose challenges in the coming decades. This insight aims to facilitate better decision-making for the next couple of decades. The intended end-users of this assessment are scientists and decision-makers.
2.4. Final Indicators for Environmental Sustainability
Ultimately, eleven key indicators were chosen to assess the environmental sustainability of the current production systems: land use, forage area, nutrient use, pesticide use, water use, water availability, energy consumption, fertilizer use, greenhouse gas (GHG) emissions, dung disposal, and breeding practices (Table 1). The operationalisation of these indicators is documented in table ………………...
3. Results
3.1. Land Use and Area under Forage Cultivation
Land use was indirectly estimated based on the quantity of concentrate feed provided to dairy animals. Data on concentrate feeding was directly collected from dairy farmers. Subsequently, the land required for these concentrates was estimated using average crop productivity values obtained from the latest agricultural statistical abstracts of Haryana and India (Figure 2). The area required annually for growing concentrates per animal was estimated as 0.6 acres due to considering cropping intensity and the values per kg of milk turned out to be 0.7 m2. Average milk yield was estimated 9.26 Kg per milch animal per day from primary data collected.
Furthermore, data on forage crops cultivated in the preceding year was gathered. The average annual area under forage crops was estimated at 0.3 acres and per animal it was recorded approximately 0.06 acres. The average yearly area under forage crops per Kg of milk was estimated to be 0.356 m2.
3.2. Fertilizer Use
Information regarding fertilizer use was obtained from respondents on a recall basis, enabling the estimation of fertilizer quantities applied to both animal feed and forage crops. The annual fertilizer consumption for concentrates and forage crops was estimated at 144.24 kg and 14.95 kg per animal, respectively (Figure 3a). More specifically, for every liter of milk produced, the estimated fertilizer usage was 28 grams of urea, 14 grams of diammonium phosphate (DAP), and 0.7 grams of single super phosphate (SSP) (Figure 3b).
3.3. Nutrient Use
Nutrient use was evaluated by quantifying the nitrogen (N) secreted in milk per day. The feed nitrogen use efficiency (NUE) for buffalo milk in India was adopted as 0.14, as suggested by Garg et al. (2016). Nitrogen intake (NI) was considered in terms of total daily nitrogen consumption, calculated as 46% of total daily urea consumption based on data collected for both concentrates and forage crops, totaling 131.1 g of N intake per day. The estimated N secreted in milk was 18.35 g per day, while for manure, the NUE was estimated at 112.75 g per day.
3.4. Pesticide Use
Pesticide use was directly assessed through information gathered from respondents concerning the amount and type of pesticides applied to forage crops, concentrates (grains), and in animal shelters for mite/tick control as presented in table…………………. The quantities for each pesticide type were summed and averaged (Table 2). The term “pesticide” encompasses a diverse group of compounds, including insecticides, fungicides, and herbicides. Pesticides used by respondents in animal shelters were also recorded (Table 3). Approximately 42% of respondents reported not using any pesticides for tick and mite control in animal shelters. The reported quantities were then used to estimate the amounts of pesticides used per liter of milk, based on feeding practices and milk production.
3.5. Water Availability and Use for Dairy Animals
This assessment focused on the volumes of water used in animal farms across five major activities: bathing, drinking, feed preparation, shed cleaning, and spraying in summer (Figure 4). This amounted to approximately 200 liters of water per animal per day. Consequently, the average direct water consumption was estimated at 21.4 liters per liter of milk. Including water used for feed production, the total water consumed (crops+ all other rearing activities) per liter of milk was estimated to be 1488.23 liters. The sources of water utilized for animal rearing were also documented, revealing that supply, underground sources, ponds, and tankers were used to varying percentages (Figure 5).
Respondents’ perceptions regarding water availability and periods of scarcity were also recorded. Nearly 40% of respondents reported water scarcity, with approximately 16% experiencing inadequate water throughout the year. Additionally, about 10% of respondents perceived scarcity in both summer and winter seasons.
3.6. Utilization of Dung as Manure
Farmers were surveyed about the percentage of dung utilized as dung cakes for cooking or as manure. Almost all farmers used at least a portion of the dung for making dung cakes. It was estimated that approximately 58% of the dung was utilized as manure for agriculture, while 42% was used for making dung cakes.
3.7. Breeding Practices
Respondents provided information on their animal breeding methods and progeny records. Approximately 56% of respondents did not maintain progeny records (Figure 6a), and only 22% preferred artificial insemination for their animals (Figure 6b). A limited number of farmers kept progeny records spanning more than one generation.
3.8. Energy Consumption
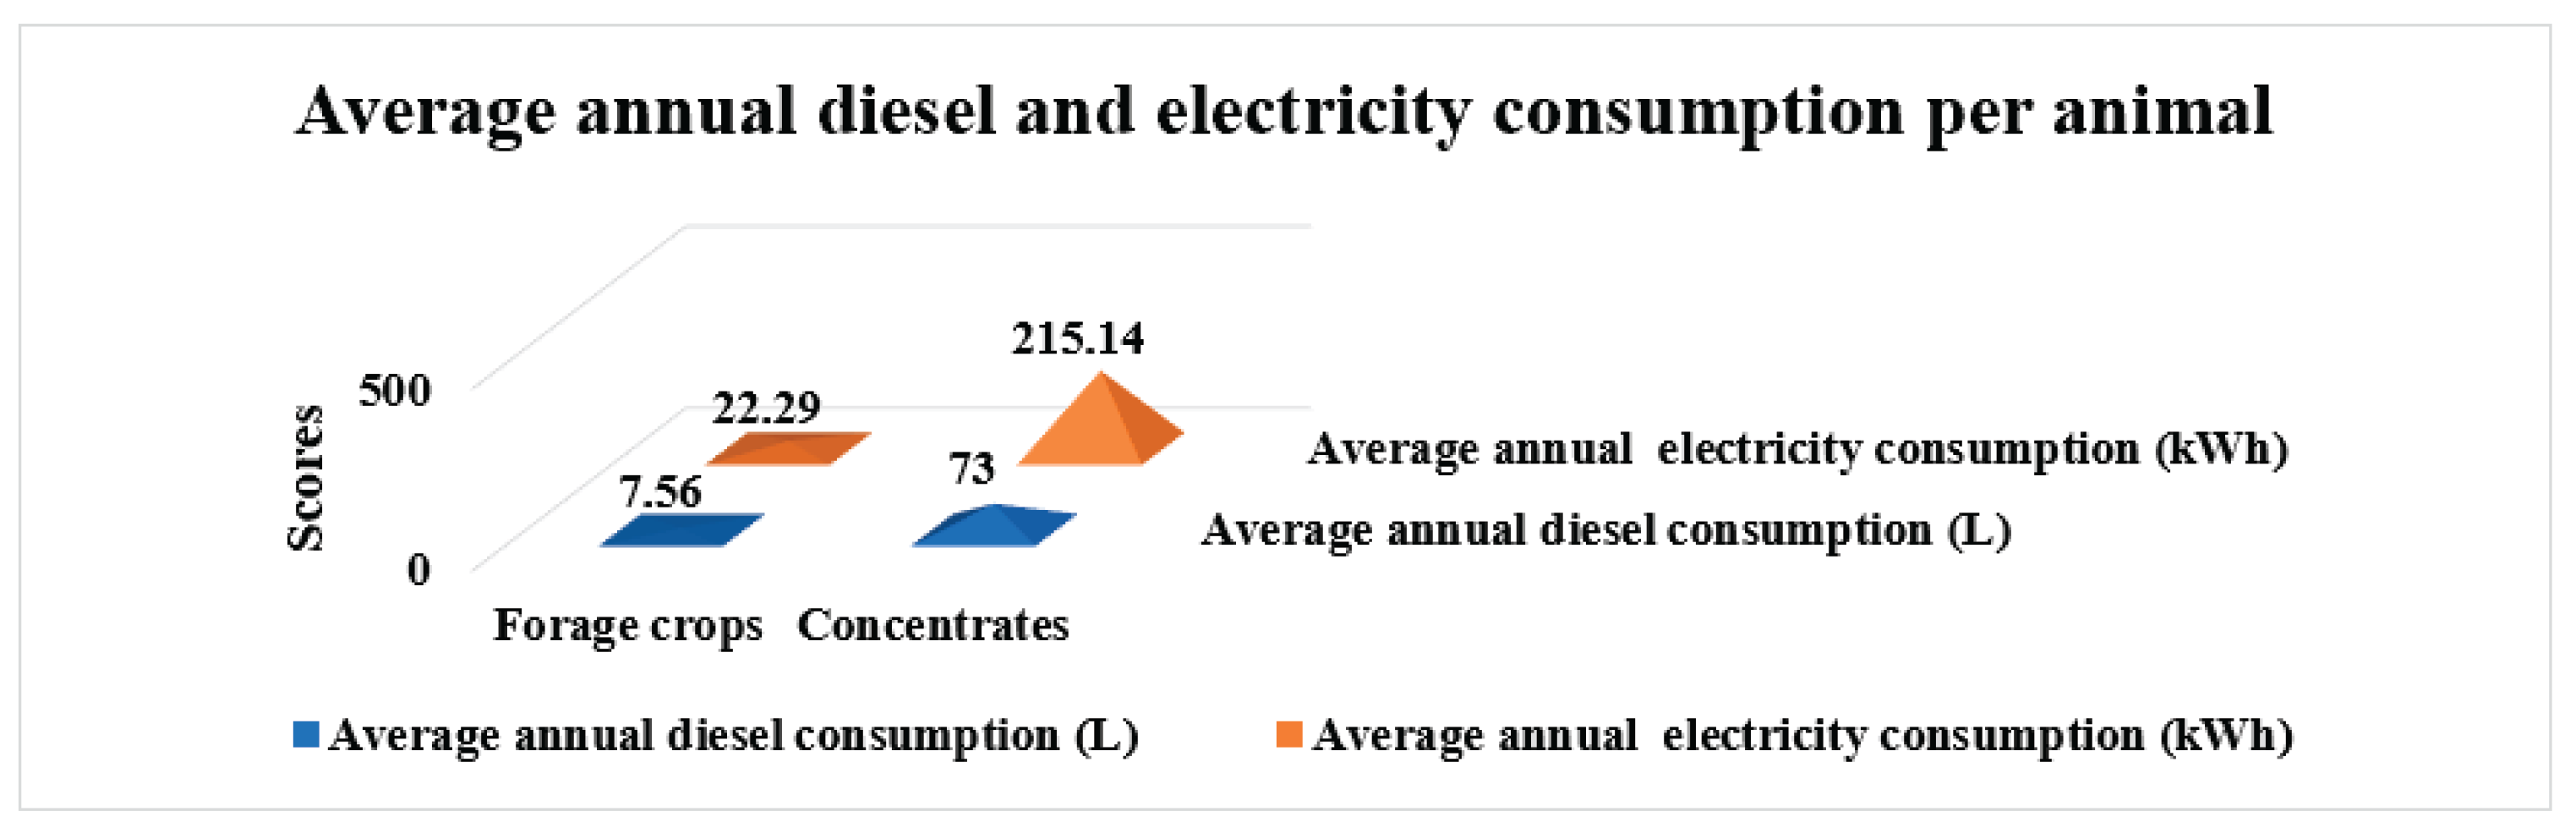
The energy consumed for milk production was estimated based on the diesel and electricity used in the cultivation and irrigation of animal feed crops. The average consumption of diesel and electricity per liter of milk for concentrates was estimated at 22 mL and 0.064 kWh, respectively, while for forage crops, it was 2 mL and 0.007 kWh (Figure 7).
Figure 6.
(a) Percent respondents keeping progeny records (b). Method of breeding preferred by respondents.
Figure 6.
(a) Percent respondents keeping progeny records (b). Method of breeding preferred by respondents.
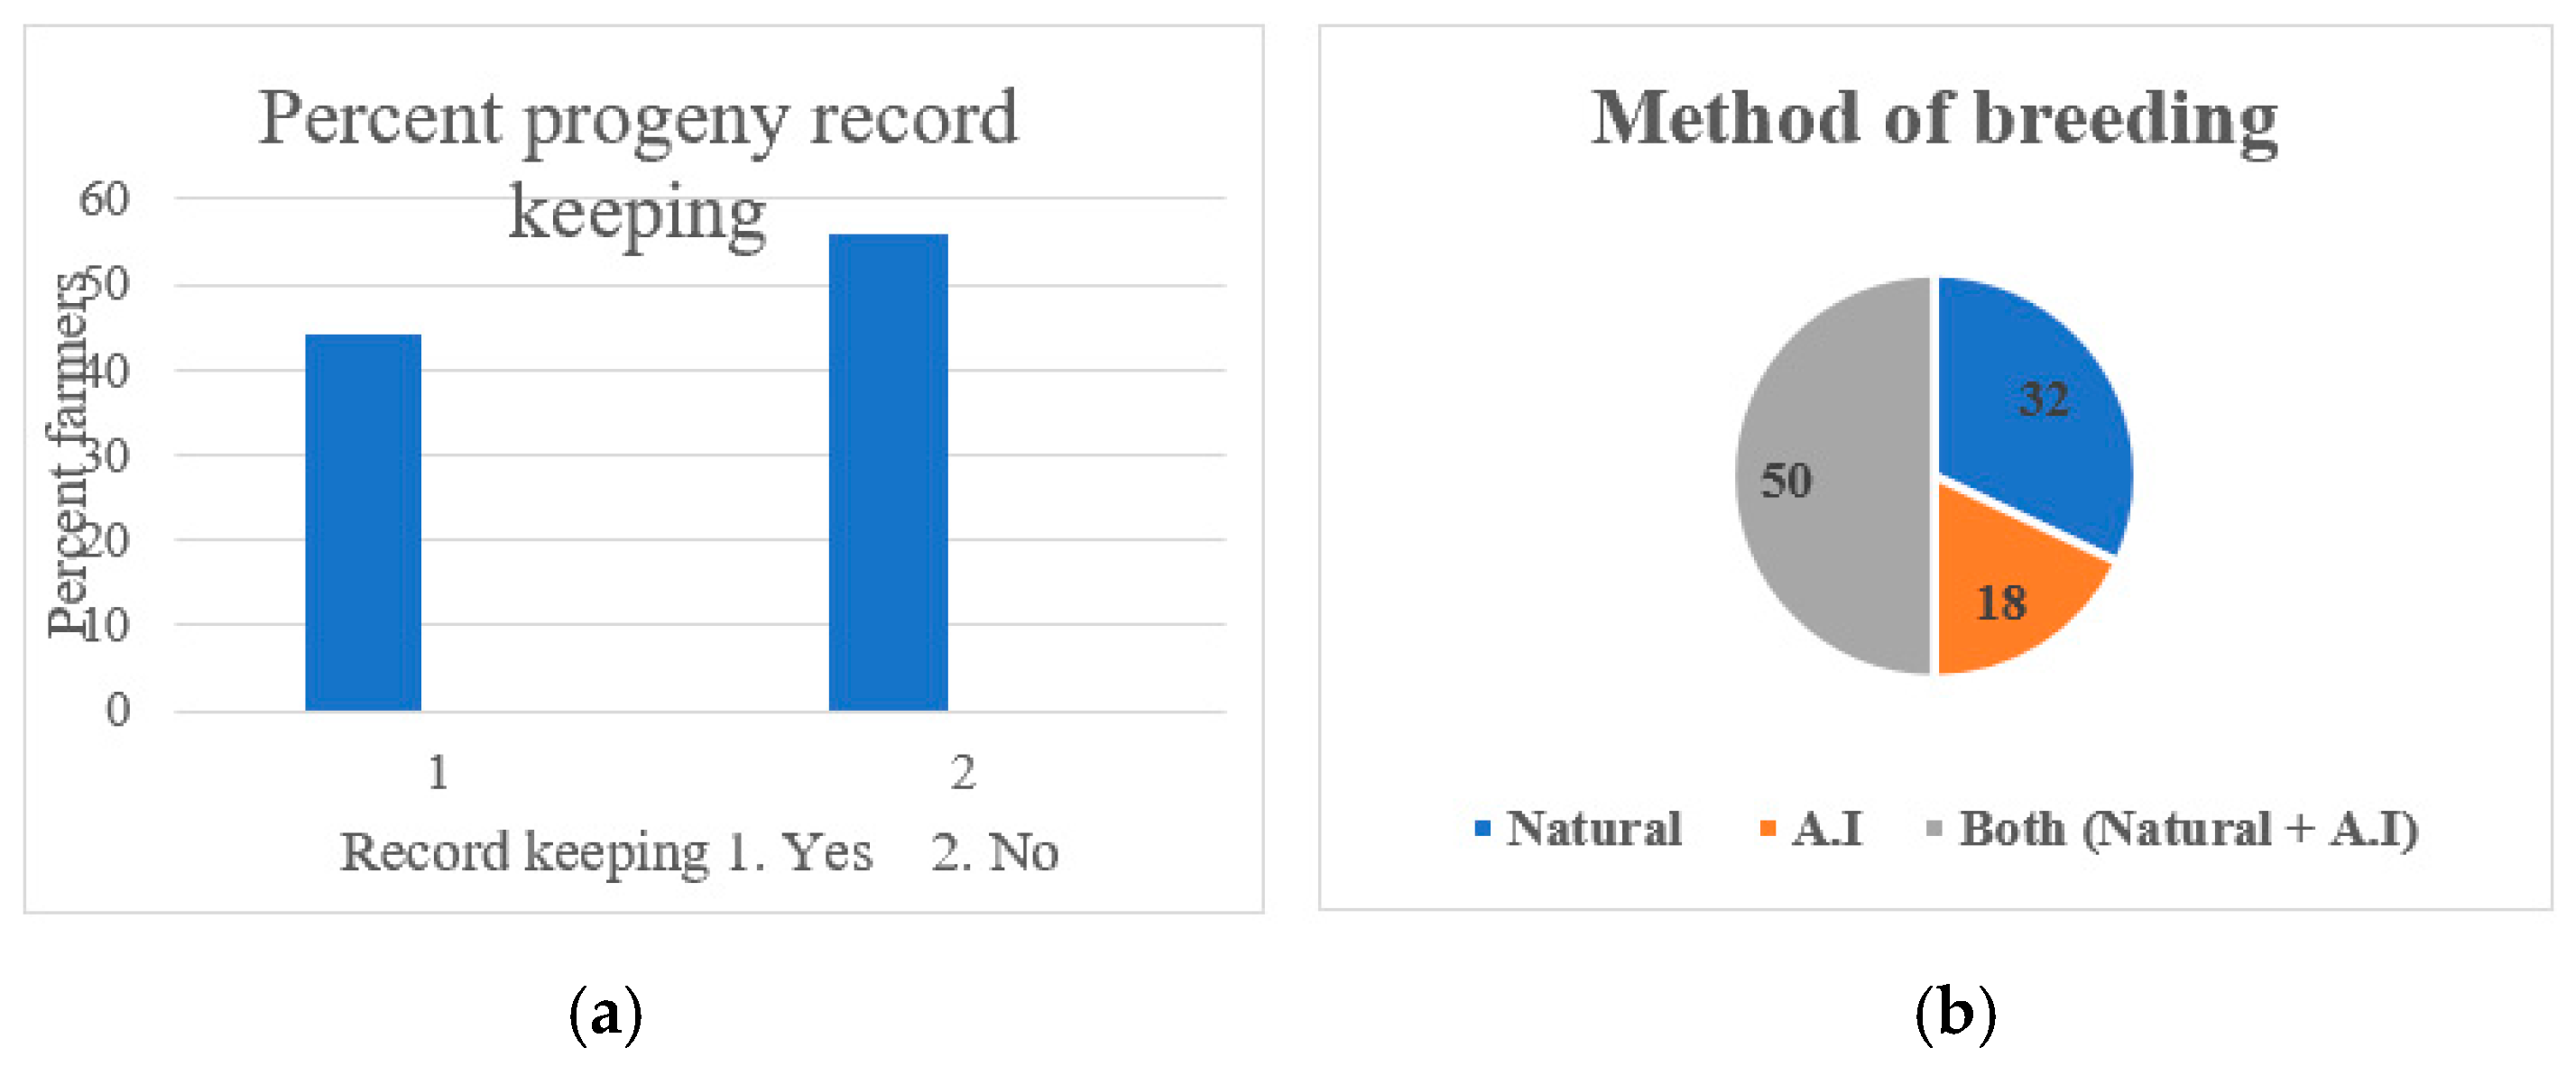
Figure 7.
Figure depicting estimated average annual electricity and diesel consumption per animal for animal feed and forage crops .
Figure 7.
Figure depicting estimated average annual electricity and diesel consumption per animal for animal feed and forage crops .
4. Discussion
4.1. Land Use and Area under Forage Cultivation
Globally, feed crops occupy a substantial portion of arable land, ranging from 33% to 40% according to the Food and Agriculture Organization (FAO). Ritchie (2017a) further asserts that feed production utilizes nearly 80% of the world’s arable land while contributing less than 20% of global caloric needs. This context is critical given projections of global population growth, with an anticipated increase of approximately 3 billion people by 2050 compared to 2010 (Ranganathan et al., 2018), accompanied by significant increases in income levels. Specifically for India, Singh (2019) forecasts the population to reach 1.52 billion by 2030 and 1.70 billion by 2050, solidifying its status as the most populous country. Furthermore, future land competition is expected to be exacerbated by the growing demand for biofuels, driven by persistent concerns about energy security, climate change, and alternative income sources for farming households (Thornton, 2010).
In India, land productivity, water productivity, and labor productivity are projected to increase by factors of four, three, and six, respectively, to meet the diversified needs of the population by 2050 (Chand, 2012). The present study estimates that the total land required for the current dairy animal population in Haryana accounts for approximately 21% of arable land. This figure is notably below the global estimate of 36%. Therefore, if global averages are considered sustainable, the dairy production systems in Haryana appear sustainable from a land-use perspective. However, considering Haryana’s significantly higher population density of 573 persons per square kilometer compared to the global average of 25 persons per square kilometer, continuous efforts to improve the productivity of both crops and livestock are imperative to ensure the future sustainability of these production systems.
4.2. Fertilizer Use
In the 2018–19 crop year, Haryana’s fertilizer consumption was 224.46 kg/ha, notably higher than the all-India average of 133 kg/ha (Ministry of Agriculture & Farmers Welfare, 2019). A deviation from the ideal Nitrogen-Phosphorus-Potassium (NPK) ratio has also been observed, which may be attributed to local requirements based on cropping patterns and soil health. However, as indicated in Figure 3a,b, the annual fertilizer consumption in both concentrates and forage crops for dairy production is not excessively high. From the perspective of fertilizer consumption, the dairy production systems in the state currently appear sustainable.
4.3. Nutrient Use
Nitrogen utilization efficiency (NUE), defined as the proportion of nitrogen in milk to daily nitrogen intake, serves as a crucial policy tool and performance indicator for dairy production. Long-term nitrogen management on dairy farms must prioritize increasing NUE and redirecting nitrogen losses into environmentally benign channels (Klein and Eckard, 2008; Oenema et al., 2009; Powell et al., 2010). While global cereal NUE was reported to be 33% (Omara et al., 2019), India generally exhibits lower NUE due to higher nitrogen consumption. Higher NUE values indicate a more efficient conversion of ration nitrogen to milk protein, consequently leading to reduced nitrogen excretion into the environment via manure.
In the present study, the estimated nitrogen secreted in milk per day was 18.35 g, with daily manure nitrogen estimated at 112.75 g. Earlier studies by Garg et al. (2016) reported feed NUE-milk in India as 0.17 for local cows, 0.23 for crossbreds, and 0.14 for buffaloes. These values are greater than the 0.11-0.13 range derived from smallholder dairy farms in Uttar Pradesh (Powell, 2010), but lower than the 0.29-0.34 range determined under experimental settings in India (Kaushal et al., 2011). Powell et al. (2013) calculated NUE-milk for Asia to range between 2.6% and 36.9%. According to the Fertilizer Association of India, India consumes 17 million tons of nitrogen fertilizer annually (Sangomla, 2017).
Considering these factors, the dairy production systems in Haryana appear partially sustainable in the context of nutrient use. However, nitrogen transformations on dairy farms are complex and interconnected. To enhance nitrogen consumption and control nitrogen losses through the least detrimental pathways to the environment, careful consideration of trade-offs in nitrogen conservation and loss is essential. A whole-farm, holistic approach to nitrogen management is required to optimize nitrogen absorption into products (towards probable NUE), minimize nitrogen loss, and guide nitrogen loss towards environmentally less hazardous pathways. Further research is recommended to accurately understand and estimate actual Nutrient Use Efficiency.
4.4. Pesticide Use
Pesticides have become an undeniable component of modern agriculture. The intensive use of pesticides in agriculture in order to feed the country’s growing population is a major contributor to this environmental degradation (Larsen et al. 2021).India is the fourth-largest producer of agrochemicals globally, but consumes only 0.5 kg per hectare, as compared to Japan (12 kg), Korea (6 kg), and the USA (4.5 kg per hectare) (Kashyap et al, 2024). Approximately 330 insecticide/pesticide compounds are registered for use in the country (CIB & RC, 2023), with insecticides being the most commonly used (65%), followed by herbicides and fungicides. The current investigation also found higher usage of both insecticides and herbicides compared to fungicides in crops (Table 3). However, respondents generally relied on recommendations from dealers/retailers for pesticide application and were often unaware of the associated benefits and drawbacks. While pesticide use in crop husbandry presents complex issues, this discussion is limited to the direct application of pesticides in livestock management and the potential for crop pesticides to transfer through animals. It can be concluded that direct animal husbandry practices do not inherently encourage or involve heavy pesticide use; direct application was limited (Table 3). Nevertheless, livestock can act as potent biomagnifiers, as evidenced by previous findings of pesticide residues in milk samples. Bedi et al. (2018), in a study conducted in Punjab, reported concentrations of pesticides including Lindane, Malathion, p,p’-DDE, Endosulfan sulphate, Cypermethrin, and Fenvalerate in fodder/silage, concentrate feed, milk, and water samples.
Therefore, pesticide use in dairy animals appears sustainable given the smaller quantities directly applied. However, the rapidly evolving consumer preference for pesticide-residue-free products will increasingly pressure producers to reduce the use of such chemicals, even in crops. Focused extension campaigns are advised to educate farmers about residual and other harmful effects of pesticides. Concurrently, there is a need to regulate pesticide use through both education and legislation, as dealers seemingly play a pivotal role in influencing pesticide application in crops.
4.5. Water Use and Water Availability
Livestock production systems consume approximately 8% of global water supply, with feed production accounting for over 90% of this usage (Schlink et al., 2010; Wisser et al., 2024).
According to global estimates, agriculture consumes over 70% of freshwater withdrawals, with livestock feed production accounting for approximately 20% (FAO, 2018). Heinke et al. (2020) in their study estimated that 4,387 km3 of blue and green water is utilised annually for the production of livestock feed, which equals roughly 41% of overall agricultural water consumption. Water is arguably the most critical factor for dairy cattle (Willers et al., 2014). India’s total water demand is projected to increase by 32% by 2050 (Menon and Poti, 2018), while the annual water availability per person continues to decline dramatically, from approximately 5,177 cubic meters in 1951 to 1,720 cubic meters in 2019 (Narayana Moorthy and Alli, 2019).The present study estimated that water is primarily used for animal feed crops (98% of total water consumption), with only 2% directly used for animal rearing activities.
Another dimension of water sustainability is its availability. This study found that only a small fraction of farmers purchased water during periods of scarcity. Furthermore, underground water was minimally utilized directly in animal activities, although it was frequently used for feed crops. The perception of respondents regarding water scarcity was also documented, with nearly 40% of dairy farmers reporting water scarcity. Approximately 10% of dairy farmers reported scarcity in both summer and winter seasons. In the context of direct water consumption, the dairy production systems appear partially sustainable due to the lower quantities of water used directly. However, a large majority of dairy farmers relied on supplied water, the availability of which for animal rearing is likely to diminish in the future given rising human demand and limited overall availability.
4.6. Utilization of Dung as Manure
Animal excrement can be utilized as manure or in the form of dung cakes. Using dung as manure for crops offers environmental advantages by enhancing soil texture, controlling soil salinity and alkalinity, and reducing soil erosion. Traditionally, mixed farming systems have operated in closed loops, where animal dung served as manure and crop byproducts were used as animal feed. However, over 2 billion people worldwide use dried animal dung as fuel (Anonymous, 2010), despite concerns that animal dung can contain higher levels of dioxins and chlorophenols (Anonymous, 2010), disproportionately affecting poor women who are often primary handlers of such fuel. Moreover, cow dung is widely used as fuel, biogas generation, compost, fish feed and fresh application in agricultural fields, with some being wasted (Shaibur et al., 2025). However, putting animal manure to cropland is a suitable and environmentally responsible management strategy for livestock and poultry farmers (Zhang, 2017). In the present study, it was estimated that approximately 58% of dung was utilized as manure for agriculture, with the remaining 42% used for making dung cakes for fuel. Improving the supply of domestic gas or other alternative fuels could potentially enhance the sustainability of dung utilization.
4.7. Breeding Practices
Breeding contributes to an approximate 1% annual decrease in the environmental impact of animal products (Mollenhorst and de Haas, 2019). Selective breeding and improved animal nutrition can enhance the efficiency of livestock farming, thereby reducing the number of animals required to produce the same amount of meat or dairy (Anonymous, 2023). In this study, it was observed that about half of the respondents employed both natural breeding and artificial insemination (AI). Only 22% of dairy farmers preferred artificial insemination. Despite AI facilities being available in all surveyed villages (Figure 4), many farmers did not maintain progeny records, especially for more than one generation. It can be concluded that the breeding practices followed by farmers are currently only partially sustainable.
4.8. Energy Consumption
Intensification and mechanization in agricultural production have led to a consistent increase in the consumption of raw materials and fossil fuels. Energy consumption in the livestock sector is a growing concern, with feed production, housing, and manure management being the primary energy-intensive areas (Bas Paris et al., 2022).In livestock production systems, the primary use of fossil fuels is for the production, distribution, storage, and processing of feed up to the farm gate. According to Veermäe et al. (2012), dairy cattle feed represents the largest input (67−71%) and significantly influences the energy ratio. Kraatz and Berg (2009) assert that feed intake has the most substantial impact on energy optimization, affecting dairy farming’s energy intensity by approximately 50%. According to Costantino and Fabrizio (2019), the energy consumption of the agriculture and livestock sector is predicted to rise in the near future due to the anticipated increase in population (United Nations, 2015) and the forecast rise in agricultural and livestock production (FAO, 2009; FAO, 2011; FAO, 2012). However, the energy consumption, in terms of diesel and electricity, was recorded relatively low in the present study. Therefore, it is concluded that dairy production systems appear sustainable from an energy use perspective.
4.9. Emission of Greenhouse Gases (GHGs)
The agri-food sector alone contributes for almost one-third of global GHG emissions (Rosenzweig et al., 2020; Crippa et al., 2021), causing a detrimental externality on the environment. India ranked 4th with about 7 percent (2.44 billion tons of CO2eq) of global CO2 emissions (Our World in Data, 2022d). The estimated methane emissions from Indian livestock in 2019 were 12.74 Tg yr–1, with enteric fermentation accounting for the largest proportion (11.63 Tg yr–1) and manure management coming in second (1.11 Tg yr–) (Samal et al., 2024). For both animal production efficiency and ecological sustainability, dairy animals should ideally emit less methane relative to the milk they produce. Furthermore, buffaloes constitute over 60% of the livestock population in Punjab and Haryana, making them primary sources of methane (Balhara et al., 2017).
However the amount of GHG emissions from enteric fermentation is projected to increase by 120 × 109 kg in 2050 (Patra, 2014). Consequently, methane emissions from enteric fermentation will continue to contribute significantly to greenhouse gas emissions in the near future.
5. Conclusions
The mixed intensive dairy systems prevalent in the developing world, particularly within the study area, face notable challenges despite their fundamental role in sustainable, pro-poor agricultural development. Beyond market dynamics, technical exigencies, and other pertinent factors, the environmental sustainability of such production systems emerges as a pivotal determinant of their longevity and efficacy.
Findings underscore that the environmental sustainability of dairy production systems in Haryana exhibits discernible variations across multiple dimensions. While aspects such as land utilization, energy consumption, and direct pesticide management manifest degrees of sustainability, significant room for improvement is identified concerning nutrient utilization and recycling, greenhouse gas (GHG) emissions, water resource management, and breeding methodologies.
It is posited that enhancing the environmental sustainability of dairy production systems in Haryana necessitates a multifaceted approach. Such an approach may encompass endeavors aimed at bolstering animal milk productivity, mitigating GHG emissions, embracing breeding practices aligned with long-term objectives, and fostering the optimal utilization of farmyard manure, among other interventions. These pathways stand to enhance the ecological resilience and efficacy of dairy production systems in the region, thereby advancing the overarching goal of sustainable agricultural development.
Author Contributions
AM: Conceptualization, Methodology, Formal Analysis and Investigation, Original draft preparation; GS: Conceptualization, Methodology, Formal Analysis and Investigation, Original draft preparation, supervision; KK and KD: Formal Analysis, Review and Editing, Resources; SK and RS: Resources, Analysis; Funding acquisition: No funding;.
Ethical Approval
The author (together with all co-authors) state that this research article is not currently being considered by more than one journal. The submitted research article is original and has never been published before in any language or format. No animal has been used in the study.
Data Availability Statement
The data pertaining to the current study is stored in the Department of Veterinary and Animal Husbandry Extension Education Department of LUVAS, Hisar. The interested person can obtain data from the Gautam Singh (HoD, VAHEE) by request made through proper channel.
Consent for Publication
The author and co-authors grant their permission for publication.
Acknowledgments
The successful completion of this research would not have been possible without the invaluable support and contributions of several individuals and institutions. We would like to express our sincere gratitude to Head of the department of Veterinary and Animal Husbandry Extension Education for his exceptional guidance, encouragement, and insightful feedback throughout the research process. His expertise in the area of climate change, environmental impact assessment and sustainability was instrumental in shaping the direction and quality of this study. We are also thankful to the farmers who participated in this study by generously sharing their time and information. Their cooperation and willingness to contribute were essential to the success of this research.
Conflicts of Interest
I, the corresponding author, certify that there is no conflict of interest on behalf of all authors.
References
- Aart van der Linden, Evelien M. de Olde, Pim F. Mostert, Imke J.M. de Boer. 2020. A review of European models to assess the sustainability performance of livestock production systems, Agric. Syst. Volume 182, 102842, ISSN 0308-521X. [CrossRef]
- Abbasi T., Abbasi T., Abbasi SA., 2015 Reducing the global environmental impact of livestock production: the minilivestock option, J. Clean. Prod. [CrossRef]
- Anonymous (2010). Solid biofuels. Available athttp://biofuel.org.uk/solid-biofuels.html.Accessed on Jan 12, 2021.
- Anonymous (2023). Sustainable Livestock Management. Retrieved from https://tracextech.com.
- Bakır, H., Ağbulut, Ü., Gürel, A. E., Yıldız, G., Güvenç, U., Soudagar, M. E. M., ... & Afzal, A. (2022). Forecasting of future greenhouse gas emission trajectory for India using energy and economic indexes with various metaheuristic algorithms. Journal of Cleaner Production, 360, 131946. [CrossRef]
- Balhara A.K., Nayan V., Dey A., Singh, K.P., Dahiya S.S., Singh, I., 2017. Climate change and buffalo farming in major milk producing states of India-Present status and need for addressing concerns. Indian j. anim. sci. 87 (4), 403–411. [CrossRef]
- Bedi J. S., Gill J. P. S., Pabhjit, K., Aulakh, R. S., 2018. Pesticide residues in milk and their relationship with pesticide contamination of feedstuffs supplied to dairy cattle in Punjab (India) J. Anim. Feed Sci. 27 (1), 18-25.
- Bockstaller C., Guichard L., Makowski D., Aveline A., Girardin P., Plantureux, S., 2008. Agri-environmental indicators to assess cropping and farming systems- A review. Agron. Sustain. Dev. 28, 139–149. [CrossRef]
- C. Rosenzweig, C. Mbow, L.G. Barioni, T.G. Benton, M. Herrero, M. Krishnapillai, et al. Climate change responses benefit from a global food system approach. Nat Food, 1 (2) (2020), pp. 94-97. doi:10.1038/s43016-020-0031-z.
- Central Insecticides Board and Registration Committee (CIB&RC), 2023. Insecticides registered under the Insecticides Act for use in Household/Publica Helath & Rodent Control. Ministry of Agriculture and Farmers Welfare, Govt of India.
- Chand R., 2012. Agricultural R&D for next generation-ICAR vision 2050. AU Vice-Chancellor and ICAR Directors Meet).
- Costantino, A., & Fabrizio, E. (2019). Energy modelling of livestock houses: The results from the EPAnHaus project. Building Simulation 2019, 16, 4251-4258.
- de Klein C.A.M., Eckard, R.J., 2008. Targeted technologies for nitrous oxide abatement from animal agriculture. Special edition: Proceedings of the 3rd Greenhouse Gases and Animal Agriculture Conference. Aust. J. Exp. Agric.48(2),14– 20. [CrossRef]
- FAO (2009). Global agriculture towards 2050, High Level Expert Forum Issues Paper.
- FAO (2011). Energy-smart food for people and climate – Issue Paper.
- FAO (2012). Energy-Smart Food at FAO: an Overview.
- FAO. 2018. Water use of livestock production systems and supply chains: Guidelines for assessment. Livestock Environmental Assessment and Performance (LEAP) Partnership. Food and Agriculture Organization of the United Nations, Rome, Italy. http://www.fao.org/3/I9692EN/i9692en.pdf. (Accessed 15 June 2020).
- Garg, M.R., Sherasia P.L., Bhandari, B.M., Makkar, H.P.S., 2016. Nitrogen Use Efficiency for Milk Production on Feeding a Balanced Ration and Predicting Manure Nitrogen Excretion in Lactating Cows and Buffaloes under Tropical Conditions. Anim. Nutr. Feed Tech. 16(1), 1-12. [CrossRef]
- Geng, S., Hess, C.E., Auburn, J.,1990. Sustainable agricultural systems: concepts and definitions. J. Agron. Crop Sci. 165(2–3),73-85. [CrossRef]
- Gerber, P. J., Steinfeld, H., Henderson, B., Mottet, A., Opio, C., Dijkman, J., Falcucci, A., Tempio, G., 2013. Tackling climate change through livestock: a global assessment of emissions and mitigation opportunities. Rome: FAO. Available from http://www.fao.org/3/a-i3437e.pdf. Accessed on Dec 3, 2020.
- Heinke, J., Lannerstad, M., Gerten, D., Havlík, P., Herrero, M., Notenbaert, A. M. O., ... & Müller, C. (2020). Water use in global livestock production—opportunities and constraints for increasing water productivity. Water Resources Research, 56(12), e2019WR026995. [CrossRef]
- Herrero, M., et al. 2010. Smart investments in sustainable food production: revisiting mixed crop-livestock systems. Sci.327, 822–825. [CrossRef]
- Kashyap U, Garg S, Arora P (2024) Pesticide pollution in India: environmental and health risks, and policy challenges. Toxicol Rep 13:101801. [CrossRef]
- Kaushal, S., Wadhwa, M., Hundal, J.S., Kaur, K., Bakshi, M.P.S., 2011. Nutritional status of dairy animals of undulating plain zone of Punjab. Ani. Nutr. Feed Tech. 11, 277-284.
- Kraatz, S., Berg, W.E., 2009. Energy Efficiency in Raising Livestock at the Example of Dairy Farming. ASABE Annual International Meeting Grand Sierra Resort and Casino Reno, Nevada June 21 – June 24, An ASABE Meeting Presentation Paper Number: 096715,19.
- Larsen AE, Claire Powers L, McComb S (2021) Identifying and characterizing pesticide use on 9,000 fields of organic agriculture. Nat Commun 12(1):5461. [CrossRef]
- Lebacq, T., Baret, P.V., Stilmant, D., 2013. Sustainability indicators for livestock farming. A review. Agron. Sustain. Dev.33, 11–327. [CrossRef]
- M. Crippa, E. Solazzo, D. Guizzardi, F. Monforti-Ferrario, F.N. Tubiello, A. Leip. Food systems are responsible for a third of global anthropogenic GHG emissions. Nat Food, 2 (3) (2021), pp. 198-209. [CrossRef]
- Mathur, S.C., 1999. Future of Indian pesticides industry in next millennium. Pesti. Info.24 (4), 9–23.
- Menon, V., Poti, L., 2018. A water starved India by 2050. Available at https://www.thehindubusinessline.com. Accessed on Jan 8, 2021.
- Ministry of Agriculture and Farmers welfare. (2019). Unequal use of fertilizers and pesticides. Available at https://pib.gov.in. Accessed on Jan 22, 2021.
- Mollenhorst, H., de Haas, Y., 2019. The contribution of breeding to reducing environmental impact of animal production. (Wageningen Livestock Research Report; No. 1156). Wageningen Livestock Research.
- Munasinghe, M., Shearer., W., 1995. Defining and Measuring Sustainability: The Biogeochemical Foundations. Washington DC: The International Bank for Reconstruction and Development/the World Bank.
- Narayana Moorthy, A., Alli, P., 2019. No time to lose in tackling water crisis. Available at https://www.thehindubusinessline.com. Accessed on Jan 8, 2021.
- OECD/FAO. 2018. OECD-FAO Agricultural Outlook 2018–2027. OECD Publishing, Paris/Food and Agriculture Organization of the United Nations, Rome. http://www.fao.org/3/I9166EN/I9166EN.pdf.
- Oenema, O., Witzke, H.P., Klimont, Z., Lesschen, J.P., Velthof, G.L., 2009. Integrated assessment of promising measures to decrease nitrogen losses from agriculture in EU 27. Agrosystems Geosci. Environ.133, 280– 288. [CrossRef]
- Omara, P., Aula, L., Oyebiyi, F., Raun, W.R., 2019. World Cereal Nitrogen Use Efficiency Trends: Review and Current Knowledge. Agrosystems Geosci. Environ.2 (1), 1-8.
- P.I. Devi, J. Thomas, R.K. Raju.Pesticide consumption in India: A spatiotemporal analysis Agric. Econ. Res. Rev., 30 (2017), pp. 163-172, . [CrossRef]
- Paris, B., Vandorou, F., Tyris, D., Balafoutis, A. T., Vaiopoulos, K., Kyriakarakos, G., ... & Papadakis, G. (2022). Energy use in the EU livestock sector: A review recommending energy efficiency measures and renewable energy sources adoption. Applied Sciences, 12(4), 2142. [CrossRef]
- Patra, A.K., 2014. Trends and Projected Estimates of GHG Emissions from Indian Livestock in Comparisons with GHG Emissions from World and Developing Countries. Asian-Australas J Anim Sci. 27(4), 592–599. [CrossRef]
- Peden, D., Tadesse, G., Misra, A.K., 2007. Water and livestock for human development. In Water for food, water for life: a comprehensive assessment of water management in agriculture, ch. 13 (ed. D. Molden), London, UK: Earthscan; Colombo: IWMI.
- Powell, J.M., 2010. Nitrogen use efficiency: A potential performance indicator and policy tool for dairy farms. Environ. Sci. Policy. 13, 217-228. [CrossRef]
- Ranganathan, J., Waite, R., Searchinger, T., Hanson, C., 2018. How to Sustainably Feed 10 billion People by 2050, in 21 Charts. Available at https://www.wri.org/blog. Accessed on Dec 5, 2020.
- Rigby, D., Woodhouse, P., Young, T., Burton, M., 2001. Analysis constructing a farm level indicator of sustainable agricultural practice. Ecol. Econ. 39, 463 – 478. [CrossRef]
- Ritchie, H., 2017a. How much of the world’s land would we need in order to feed the global population with the average diet of given country. Available at https:// ourworldindata.org/agricultural-land-by -global diets. Accessed on Dec 5, 2020.
- Rotz, A., & Rotz, C. A. (2020). Environmental sustainability of livestock production. Meat and Muscle Biology, 4(2).
- Samal, A., Sahu, S.K., Mishra, A., Mangaraj, P., Pani, S.K., Beig, G. (2024). Assessment and Quantification of Methane Emission from Indian Livestock and Manure Management. Aerosol Air Qual. Res. 24, 230204. [CrossRef]
- Sangomla, A., 2017. We have breached the planetary limit for nitrogen. Available at https://www.downtoearth.org.in. Accessed on Jan 4, 2021.
- Schlink, A. C., Nguyen, M. L., & Viljoen, G. J. (2010). Water requirements for livestock production: a global perspective. Rev. Sci. Tech, 29(3), 603-619. [CrossRef]
- Shaibur, M. R., Al Helal, A. S., Siddique, A. B., Husain, H., Khan, M. W., Sarwar, S., ... & Sakib, M. N. (2025). Cow dung management, biogas production and the uses of bio-slurry for sustainable agriculture. Cleaner Waste Systems, 10, 100201. [CrossRef]
- Singh, P., 2019. Feeding 1.7 Billion. Foundation Day and 26th General Body Meeting. National Academy of Agricultural Sciences. New Delhi, India.
- Steinfeld, H., Gerber, P., Wassenaar, T., Castel, V., Osales, M., de Haan, C., 2006. Livestock’s long shadow: environmental issues and options. Rome. Italy: FAO.
- Ten Napel, J., van der Veen, A. A., Oosting, S.J., Koerkamp, P.W.G., 2011. A conceptual approach to design livestock production systems for robustness to enhance sustainability. Livest. Sci.139 (1-2), 150-160. [CrossRef]
- Thornton, P.K., 2010. Livestock production: recent trends, future prospects. Philos. Trans. R. Soc. B: Biol. Sci. 365, 2853–2867. [CrossRef]
- Thornton, P.K., van de Steeg, J., Notenbaert, A., Herrero, M., 2009. The impacts of climate change on livestock and livestock systems in developing countries: a review of what we know and what we need to know. Agric. Syst. 101 (3), 113–127. [CrossRef]
- United Nations, (2015). World Population Prospects: The 2015 Revision, Key Findings and Advance Tables. Working Paper No. ESA/P/WP.241.
- Van Calker, K.J., Berentsen, P.B.M., Giesen, G.W.J., Huirne, R.B.M., 2005. Identifying and ranking attributes that determine sustainability in Dutch dairy farming. Agric. Human Values. 22(1), 53–63. [CrossRef]
- Veermäe, I., Frorip, J., Kokin, E., Praks, J., Poikalainen, V., Ruus, A., Lepasalu, L., 2012. Energy consumption in animal production. Estonian University of Life Sciences: Tartu, Estonia.
- Willers., Camila., Ferraz., Samantha., Carvalho., Laurine., Rodrigues, Luciano., 2014. Determination of indirect water consumption and suggestions for cleaner production initiatives for the milk-producing sector in a Brazilian middle-sized dairy farming. J. Clean. Prod. 72. [CrossRef]
- Wisser, D., Grogan, D. S., Lanzoni, L., Tempio, G., Cinardi, G., Prusevich, A., & Glidden, S. (2024). Water Use in Livestock Agri-Food Systems and Its Contribution to Local Water Scarcity: A Spatially Distributed Global Analysis. Water, 16(12), 1681. [CrossRef]
- World Commission on Environment and Development (1987). Our Common Future. Oxford University Press: Oxford, UK. pp: 383.
- Zhang, H. (2017). Managing Phosphorus from Animal Manure. Retrieved from https://extension.okstate.edu. Id: PSS-2249.
- Zimmer, D., Renault, D., 2003. Virtual Water in Food production and Trade at global scale: review of methodological issues and preliminary results. In Proceedings expert meeting on virtual water, Delft.
Figure 1.
Sampling procedure followed for selection of respondents.
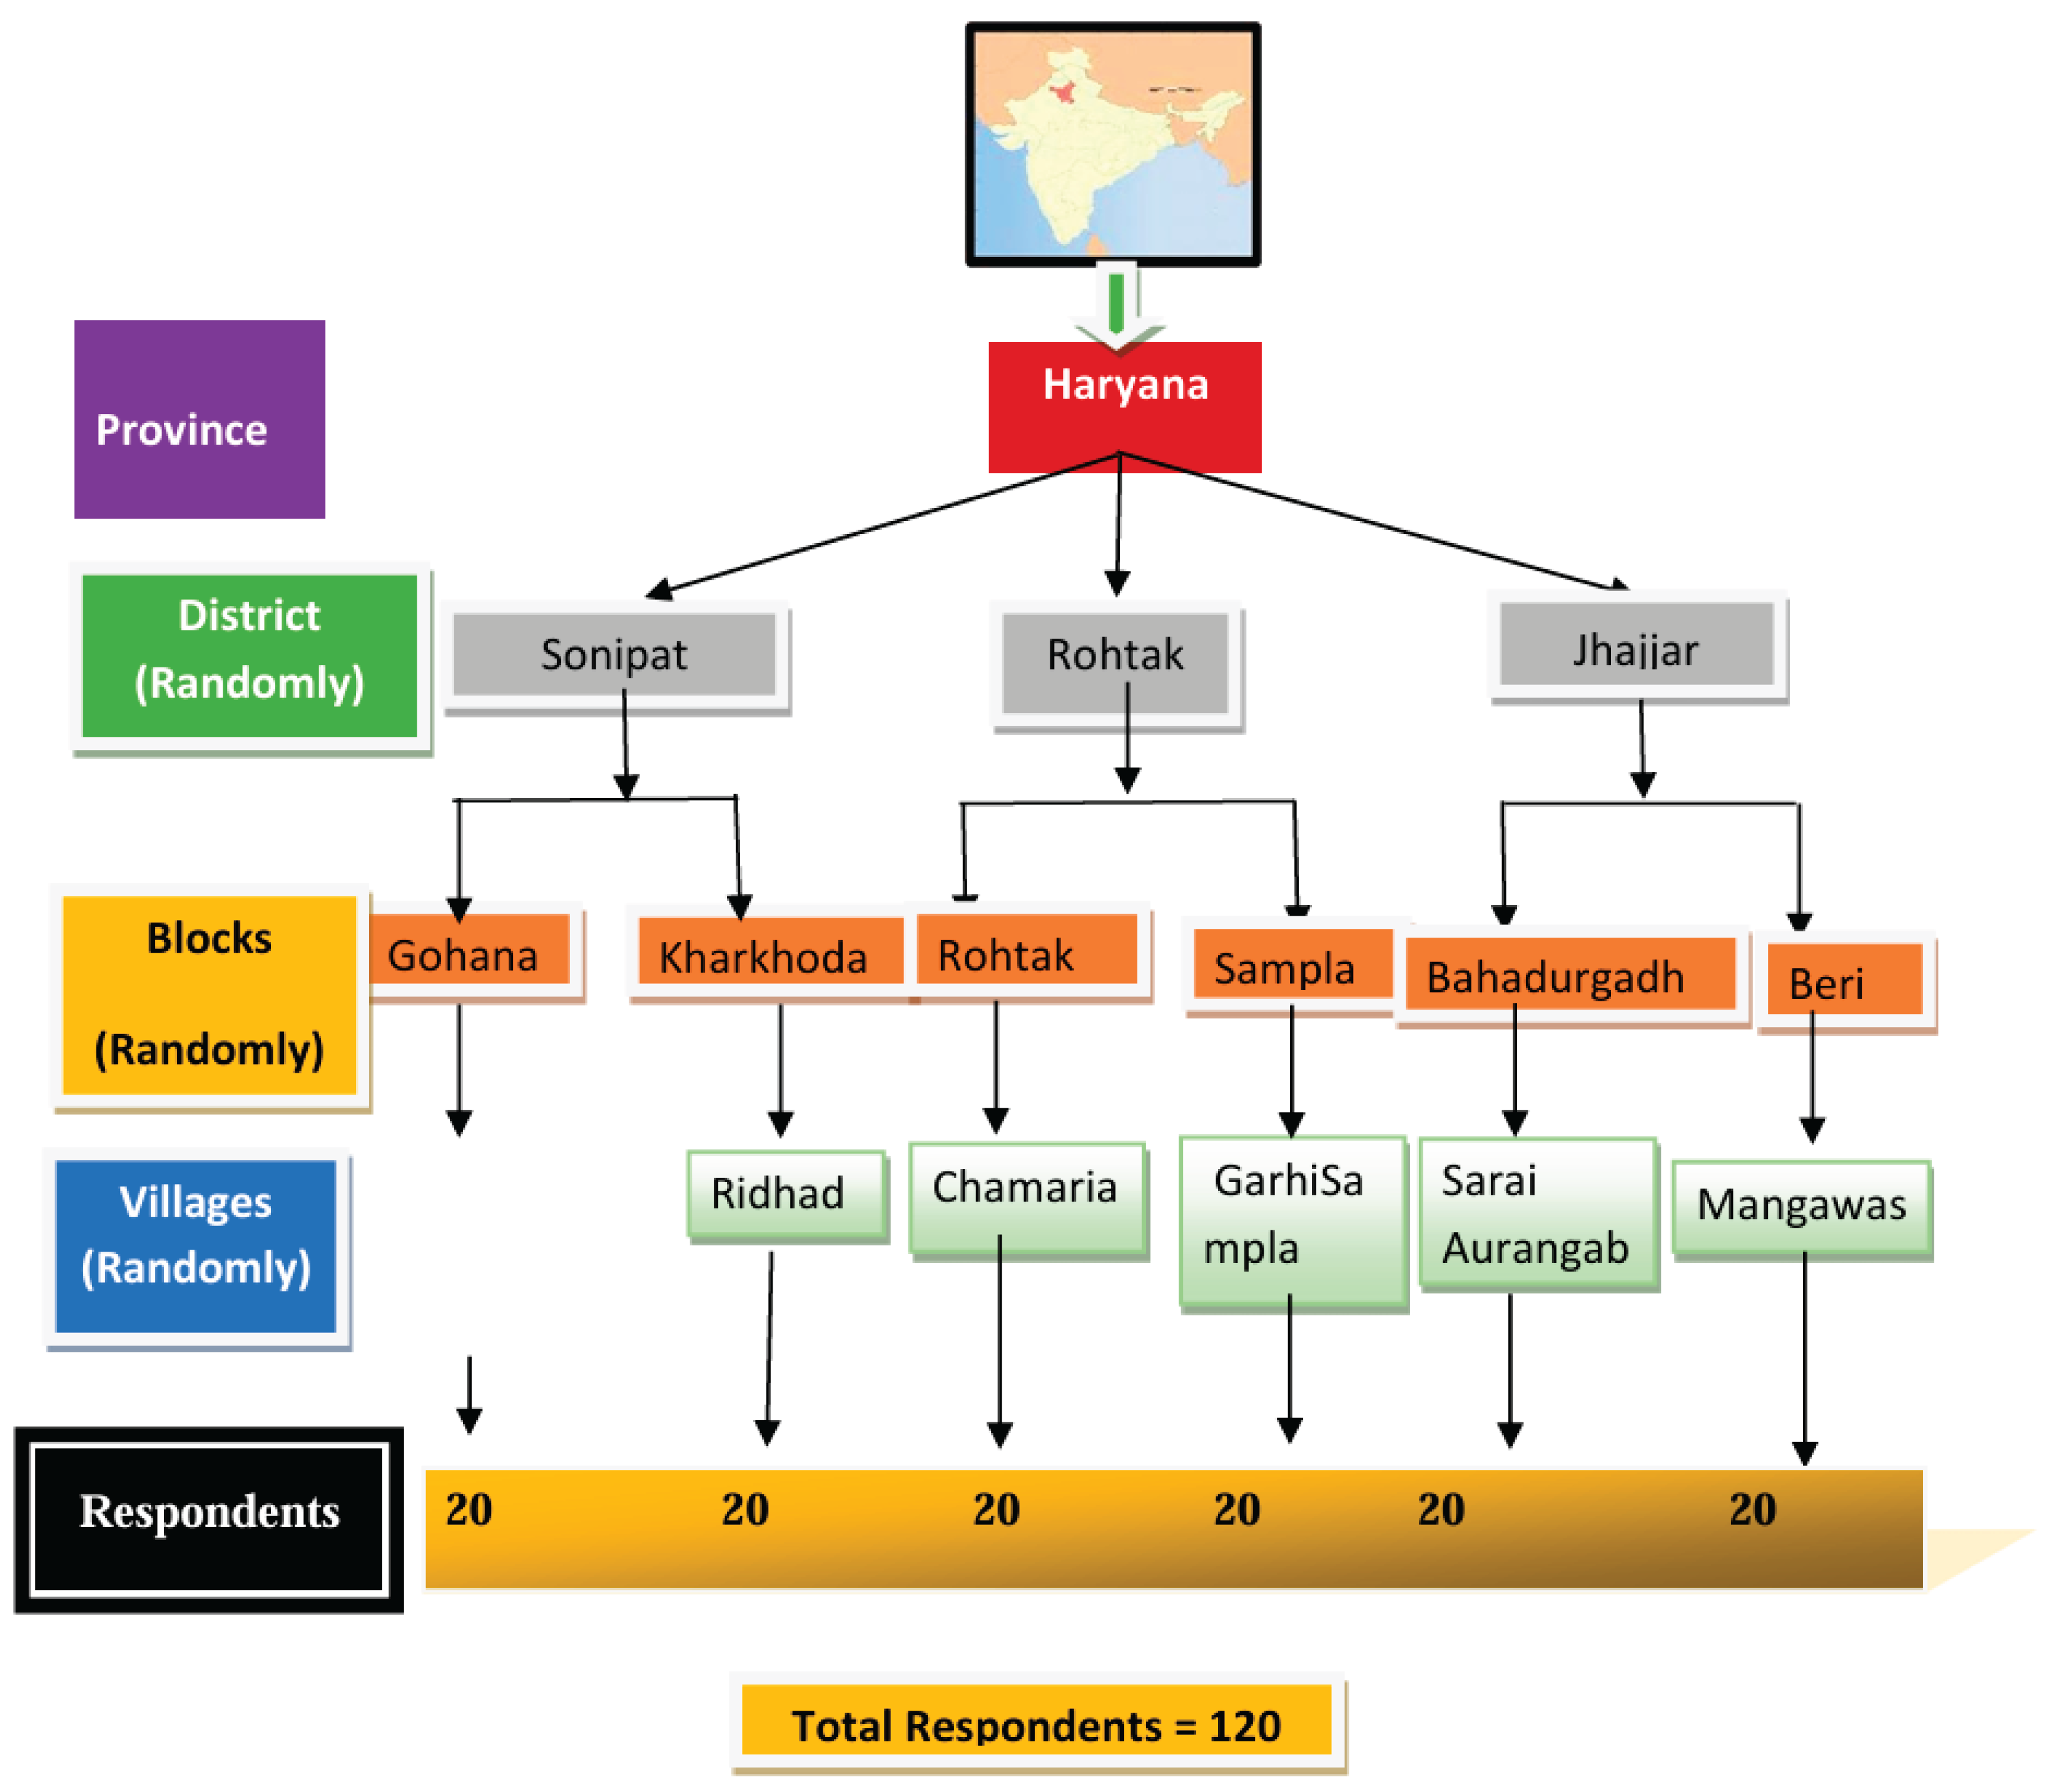
Figure 2.
Estimated Land use for different animal feed crops annually.
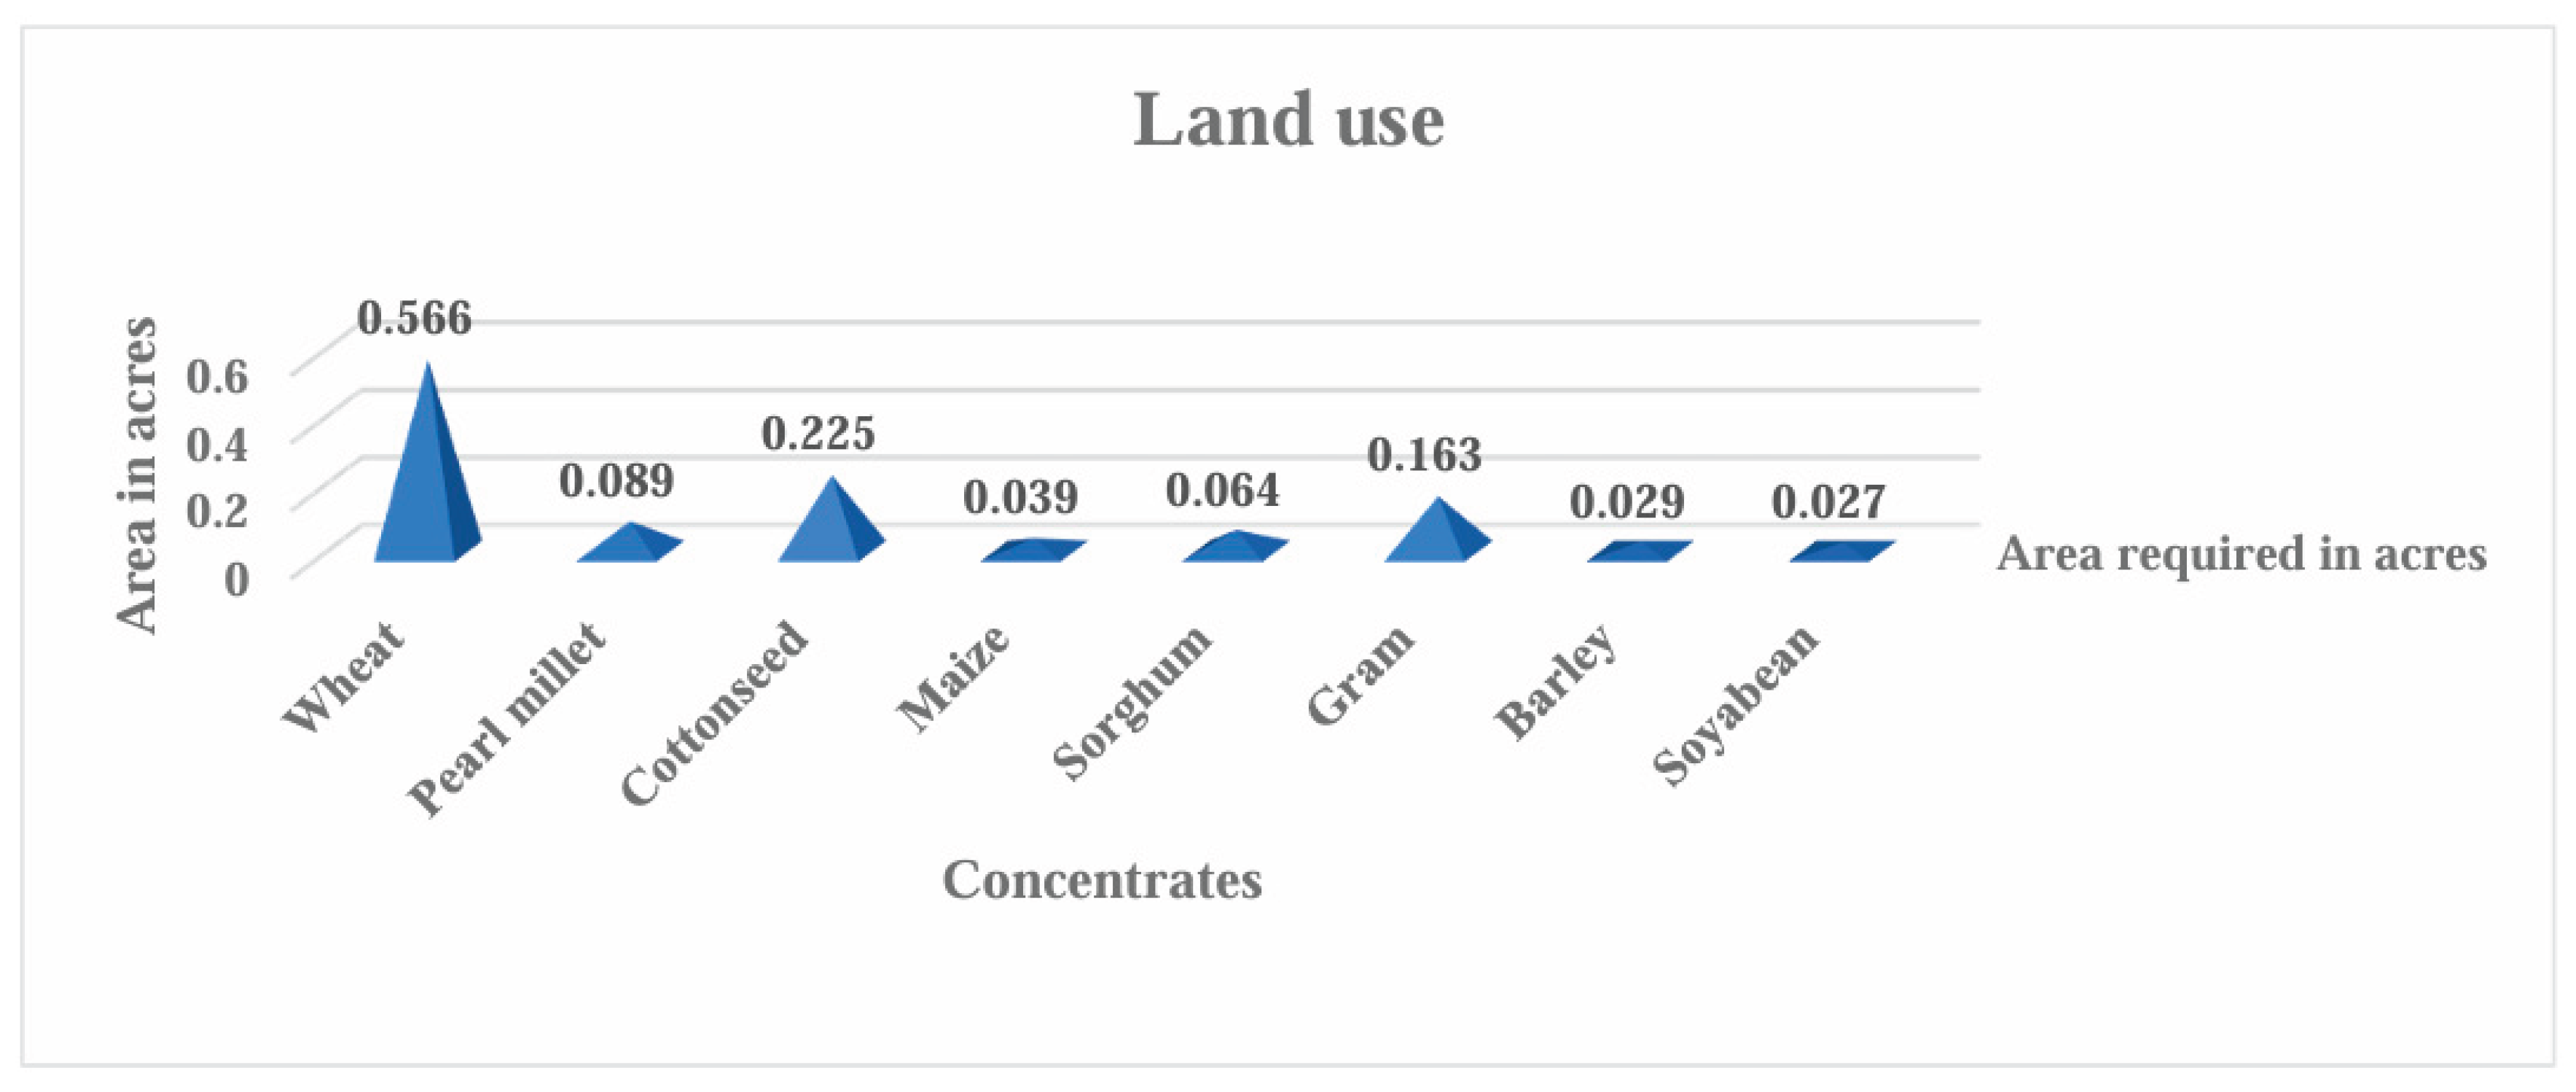
Figure 3.
(a) Estimated annual fertilizers consumption for concentrate and forage crops. (b) Estimated annual fertilizers consumption for concentrate and forage crops.
Figure 3.
(a) Estimated annual fertilizers consumption for concentrate and forage crops. (b) Estimated annual fertilizers consumption for concentrate and forage crops.
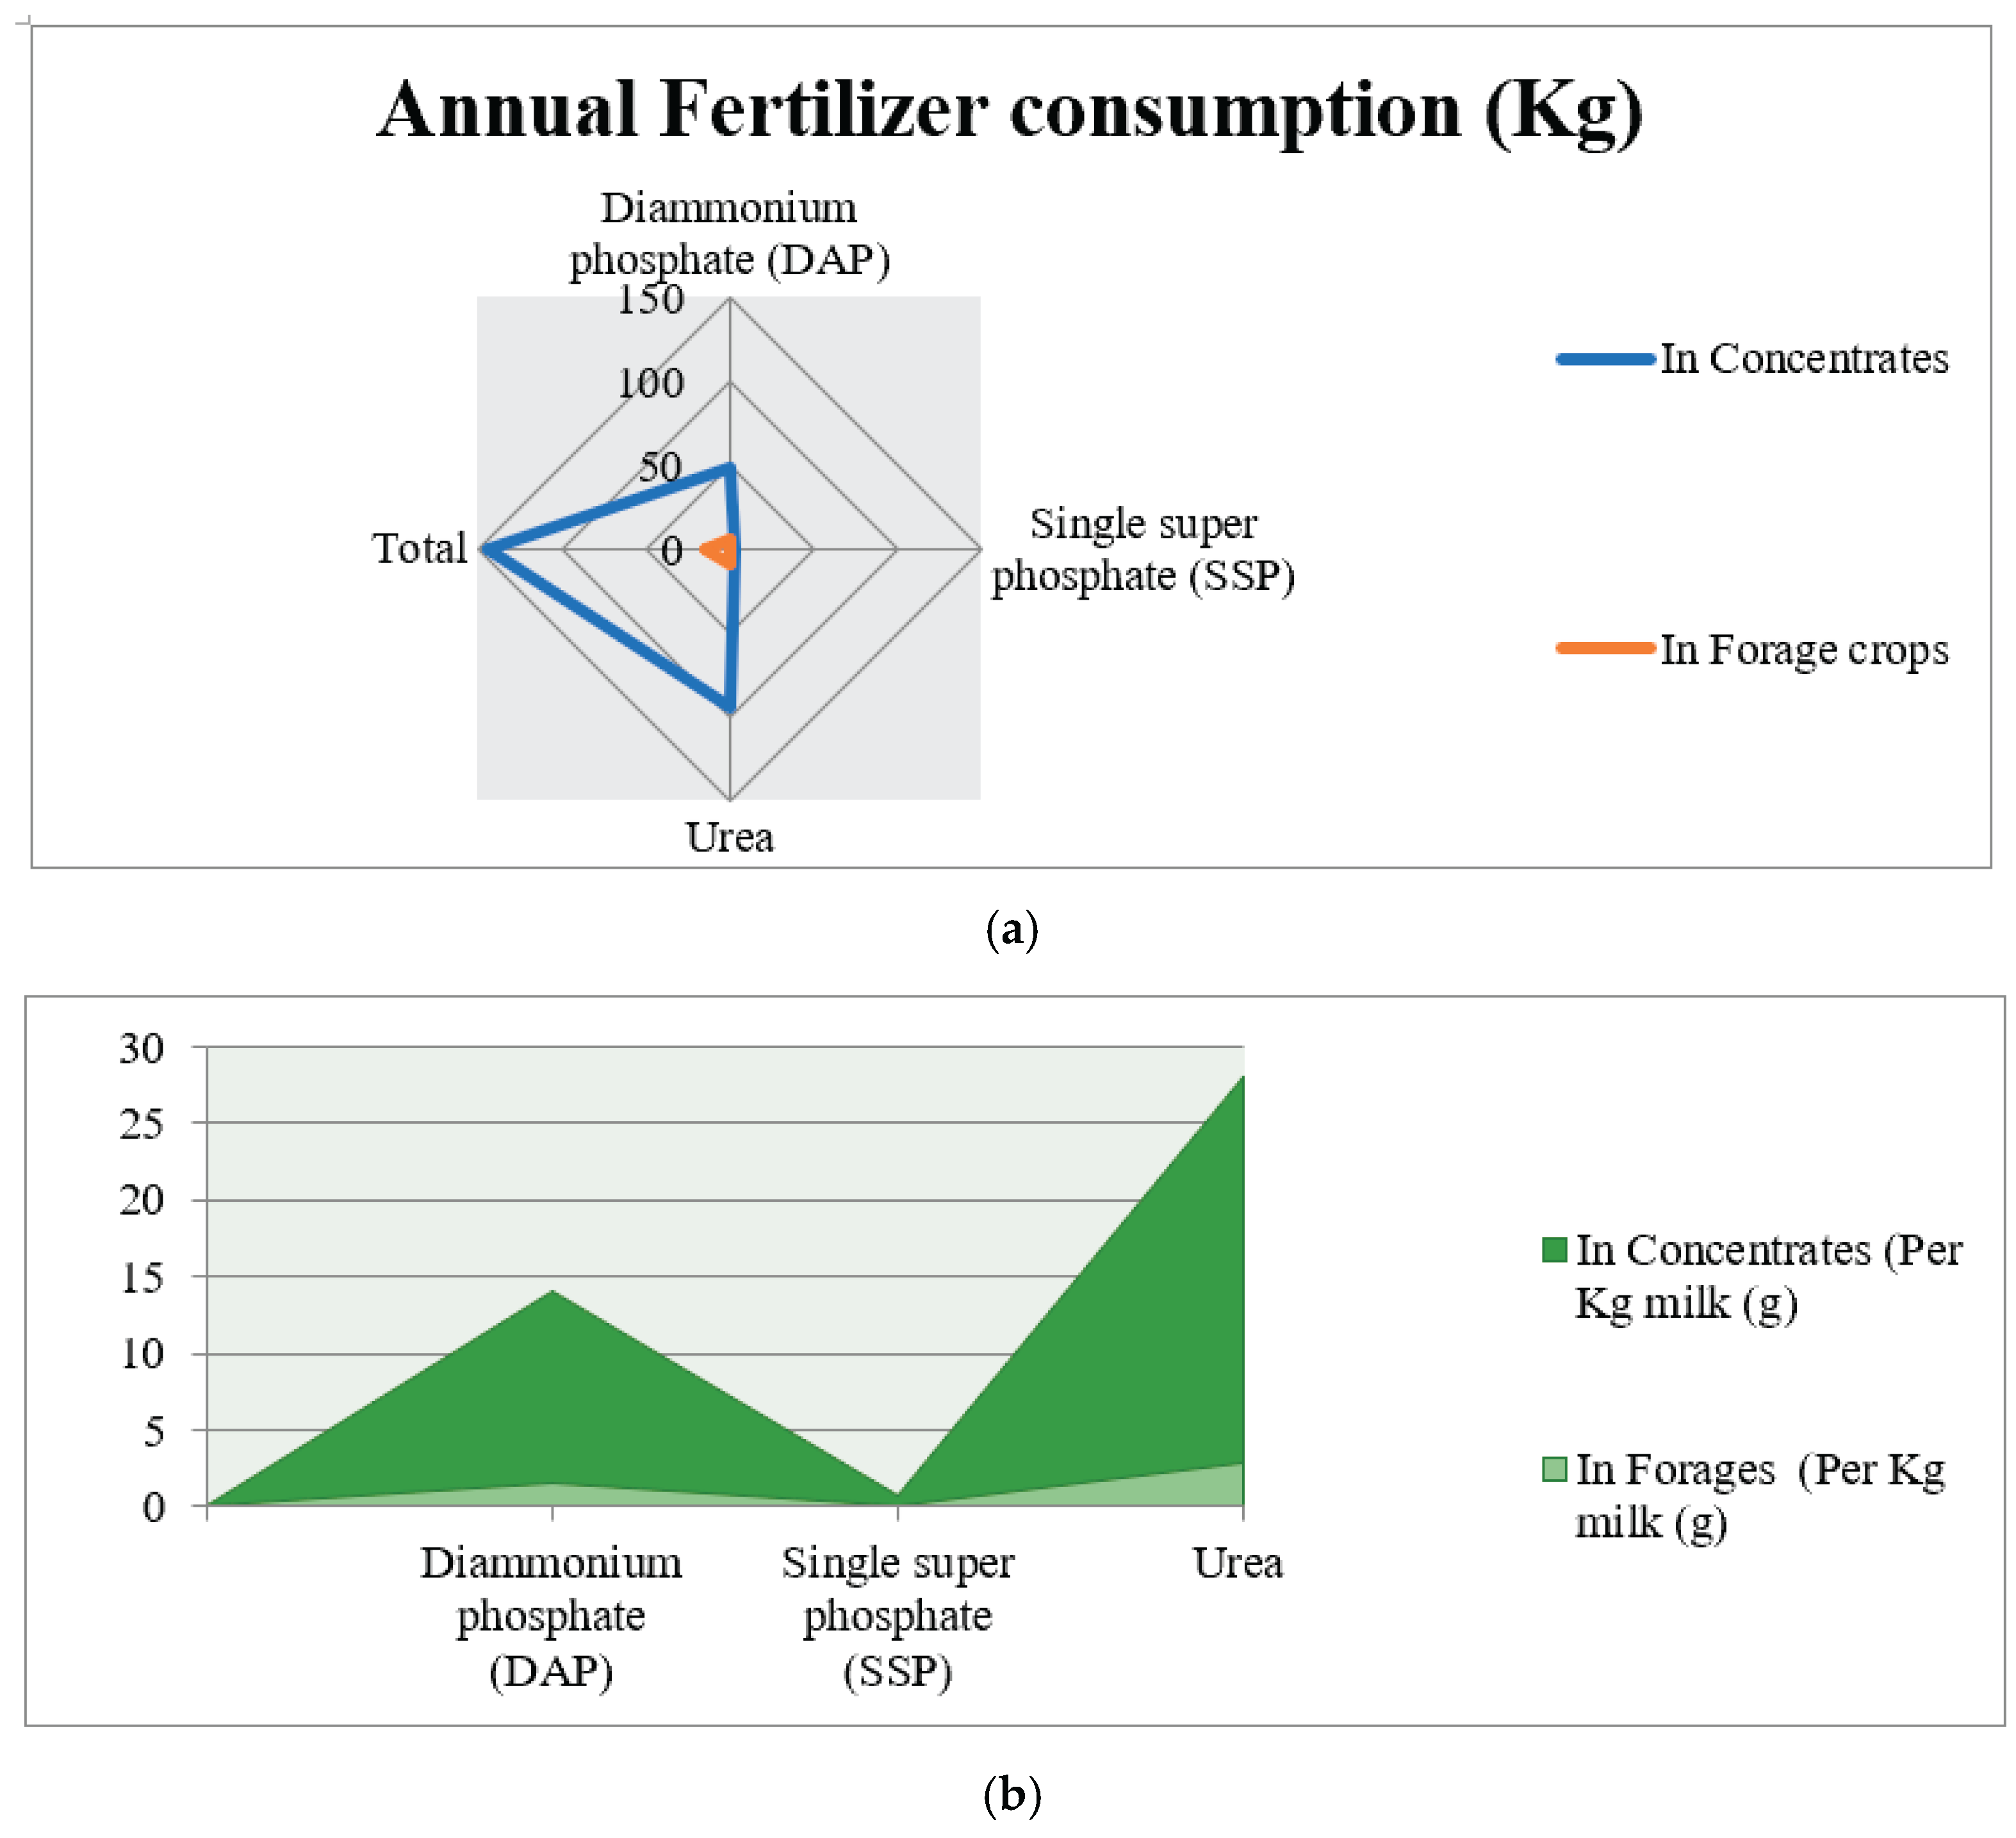
Figure 4.
Average water consumed daily in various animal rearing activities.
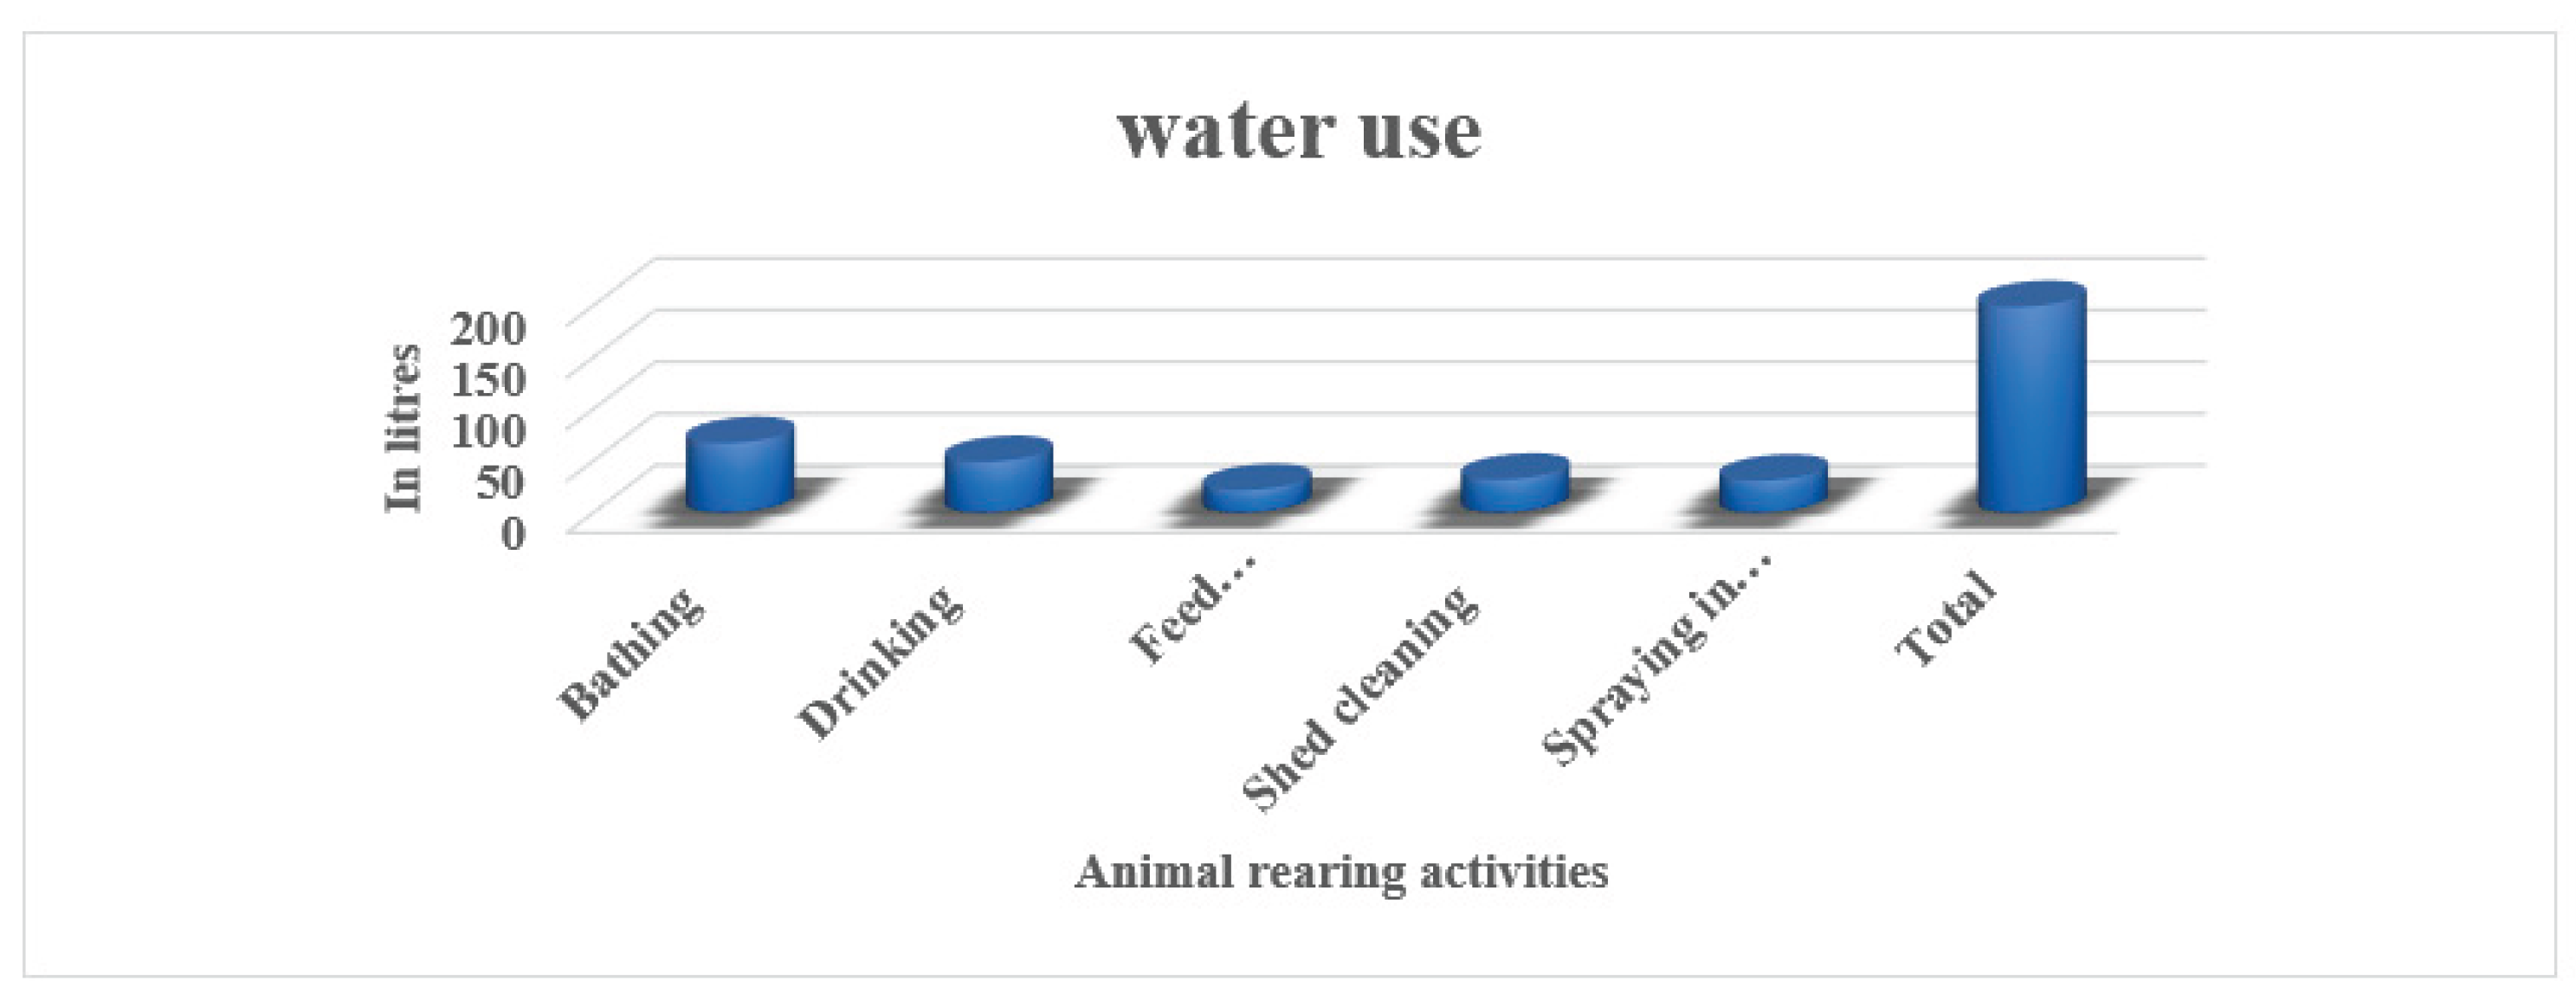
Figure 5.
Percent of different water sources used for animal’s rearing.
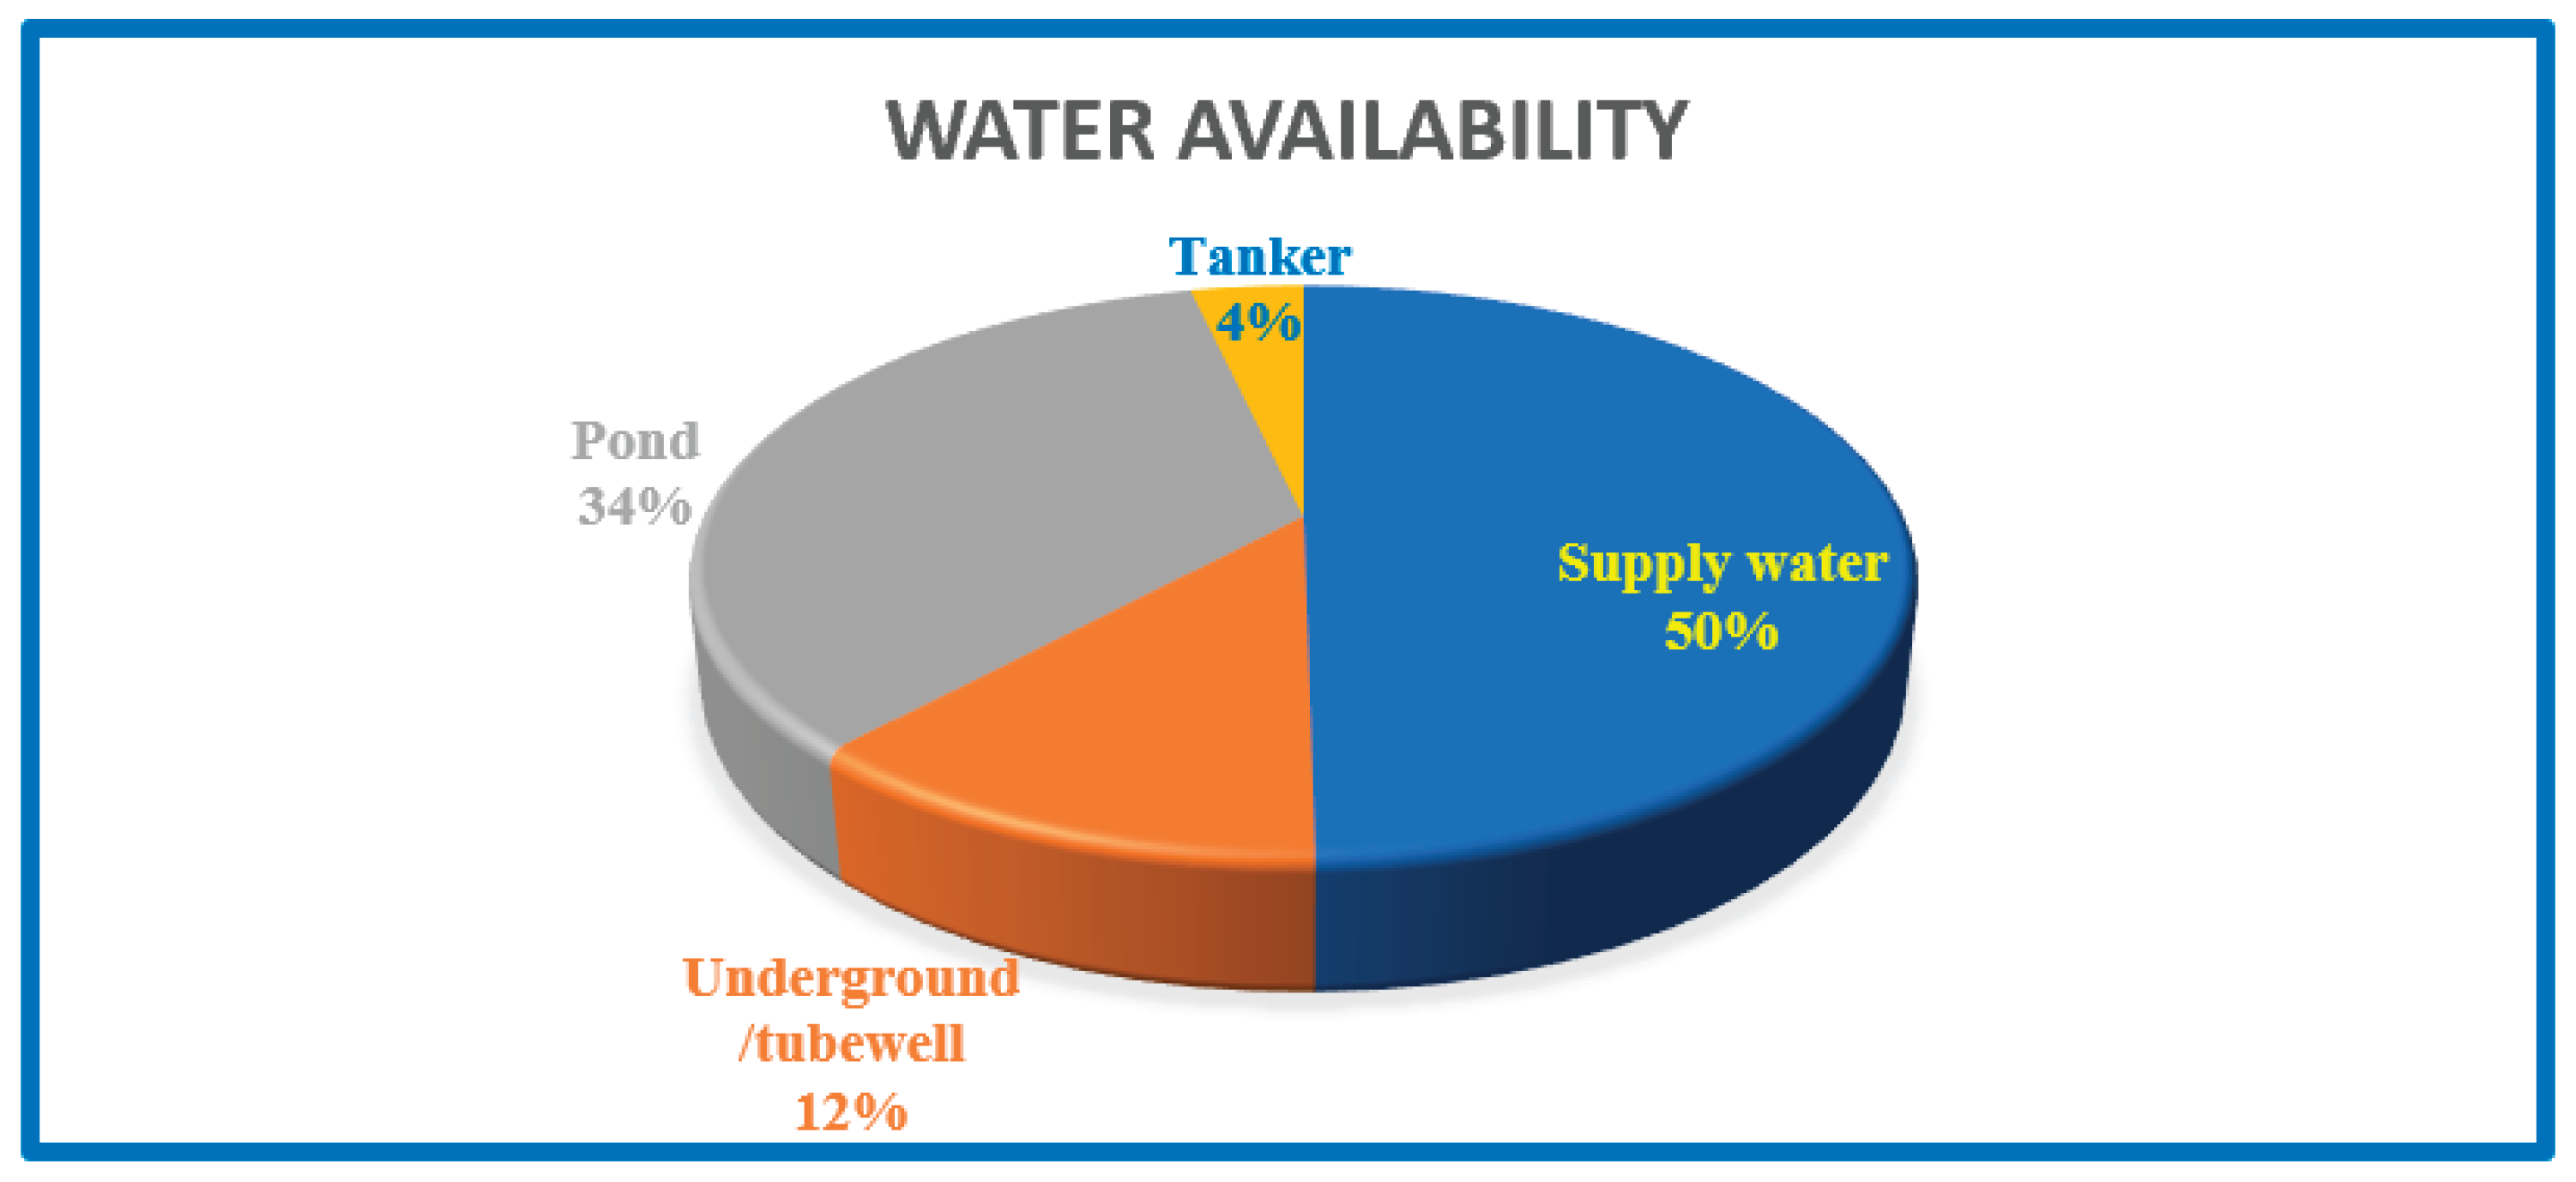

Table 1.
Operationalisation of Indicators used for Environmental sustainability assessment of dairy production systems.
Table 1.
Operationalisation of Indicators used for Environmental sustainability assessment of dairy production systems.
| Sr. no. | Indicators | Operationalisation |
|---|---|---|
| 1. | Land use | Quantity of concentrate fed to dairy animals in kgs and the land required to produce such feeds in acres |
| 2. | Forage area | Area under forage crops in acres |
| 3. | Fertilizer use | Quantity of fertilizers applied in animal feed crops including forage and concentrate |
| 4. | Nutrient use | Estimated Nitrogen secreted in milk |
| 5. | Pesticide use | Pesticides used in animal feed crops and animal houses for mite/tick control |
| 6. | Water use | Volumes of water used in animal farms (activities and crops) |
| 7. | Water availability | Water sources utilized and perception about scarcity of water |
| 8. | Utilization of dung | Percentage of dung used as manure for crop husbandry |
| 9. | Breeding practices | Adoption of breeding practices and availability of infrastructure facilities for AI |
| 10. | Energy consumption | Consumption of water and electricity in animal feed crops |
| 11. | GHGs Emission | Using secondary data |
Data for these indicators were meticulously collected at the farm level from the selected respondents across the study area.
Table 2.
Table depicting summary of estimated pesticide used in grain and forage crops.
| Pesticides used in crops | ||||
|---|---|---|---|---|
| Sr. no. |
Trade (Brand name) | Technical name | Estimated Quantity per animal per annum |
Estimated Quantity per Kg milk |
| Insecticides | ||||
| 1. | Farrate | Lambda-Cyhalothrin 5% E.C. | 0.1 L | 0.03 ml |
| 2. | Coragen | Chlorantraniliprole 18.5% W/W SC | 0.119 L | 0.04 ml |
| 3. | Anth505, Shatrujeet | Chlorpyrifos 50% + Cypermethrin 5% EC | 0.24 L | 0.07 ml |
| 4. | Riddle | Malathion 50% EC | 0.375 kg | 0.11g |
| 5. | Phoskill, Monorin, Monosip | Monocrotophos 36% SL | 0.27 L | 0.08 ml |
| 6. | Phoratops | Phorate 10%CG | 0.6 kg | 0.18g |
| Herbicides | ||||
| 1. | Weednash | 2,4-Dichlorophenoxyacetic acid amine salt 58% SL | 0.30 Kg | 0.09 g |
| 2. | Topik | Clodinafop-Propargyl 15%WP | 0.096 Kg | 0.03g |
| 3. | DuPont Algrip | Metsulfuron methyl 20%WG | 0.005 Kg | 0.001 g |
| 4. | Fateh | 75% WG formulation of Sulfosulfuron | 0.008 Kg +0.3008 L surfactant | .002 g + 0.08 ml surfactant |
| 5. | Total, Satasat | Sulfosulfuron 75%+ Metsulfuron methyl 5% WG | 0.008 kg +0.3008 L surfactant | .002 g + 0.08 ml surfactant |
| 6. | Vesta | ClodinafopPropargyl 15% + Metsulfuron Methyl 1% WP | 0.096 Kg | 0.03 g |
| 7. | Fateh, Leader, Target | Sulfosulfuron 75% WG | 8.067 g | .002 g |
| 8. | Roundup | Glyphosate 41 SL | 0.6 L | .18ml |
| Fungicide | ||||
| 1. | Custodia | Azoxystrobin 11%+Tebuconazole 18.3% w/w SC | 0.178 L | 0.05 ml |
| In Forage crops (Insecticide) | ||||
| 1. |
Superkiller 25%EC, Cypercid-25 |
Cypermethrin 25% EC | 6 ml | .0017 ml |
| Herbicide | ||||
| 1. | Masstaf, Tohfa | Atrazine 50% W.P. | 31 g | .009 grams |
Table 3.
Pesticides used in animal houses.
| Sr. no. |
Name of acaricide | Average amount used annually (ml) |
Frequency (%) |
Estimated Quantity per Kg milk |
|---|---|---|---|---|
| Flumethrin | 39.16 | 12 (10) | 0.0116 | |
| Amitraz | 40.36 | 22(18.3) | 0.0119 | |
| Cypermethrin | 35.38 | 25 (20.8) | 0.01 | |
| Deltamethrin | 66.67 | 19(15.8) | 0.02 | |
| None | 0 | 42(35) |
Disclaimer/Publisher’s Note: The statements, opinions and data contained in all publications are solely those of the individual author(s) and contributor(s) and not of MDPI and/or the editor(s). MDPI and/or the editor(s) disclaim responsibility for any injury to people or property resulting from any ideas, methods, instructions or products referred to in the content. |
© 2025 by the authors. Licensee MDPI, Basel, Switzerland. This article is an open access article distributed under the terms and conditions of the Creative Commons Attribution (CC BY) license (http://creativecommons.org/licenses/by/4.0/).
Copyright: This open access article is published under a Creative Commons CC BY 4.0 license, which permit the free download, distribution, and reuse, provided that the author and preprint are cited in any reuse.


