
Submitted:
04 November 2025
Posted:
04 November 2025
You are already at the latest version
Abstract
This study investigates the performance of various waterproofing techniques based on an in-situ experimental tunnel section. Through optimized design of structural concrete permeability resistance, controlled installation of external waterproof membranes, and rigorous quality management throughout construction, the research systematically elaborates the construction procedures and key control points for different waterproofing methods. A comparative analysis of the waterproofing performance of multiple materials—including polymer-coated waterstops, steel-edged rubber waterstops, and water-swellable sealants combined with grouting pipes—was conducted using both experimental testing and numerical simulation under their respective construction processes. The study focuses on the influence of material selection and construction techniques on waterproofing effectiveness, clarifying the applicable conditions and performance variations among different materials and methods. Results demonstrate that polymer-coated waterstops exhibit significantly superior performance compared to other materials. While self-compacting concrete causes minimal disturbance to waterstops and is thus beneficial for waterproofing, it shows deficiencies in early-age crack resistance. The refined control of construction processes proves decisive for the overall performance of the waterproofing system. Ultimately, this research establishes detailed quality control specifications for both main structural elements and detailed structural components.
Keywords:
mining law
; waterproofing technology
; tunnel lining
; waterstop
1. Introduction
Since the introduction of the South-to-North Water Diversion project to Beijing in 2014, the groundwater level in the city has experienced a continuous recovery, as illustrated in Figure 1. In recent years, with the rising groundwater table, water leakage in the underground structures of existing metro lines has become markedly more pronounced. The number of leakage points has increased by over 80% compared to 2019, reaching nearly 4,000, thereby posing a threat to metro operational safety.The formation of structural leakage creates interconnected seepage channels, leading to the release of water pressure and the development of a dynamic seepage field. This process concentrates surrounding soil and water pressures around these channels, inducing stress concentration and progressive structural damage. As a result, both the number and area of leakage points continue to expand, leading to a continual escalation of the defect severity.
The problem of water leakage in tunnels is influenced by a combination of natural environmental and engineering factors. Local hydrogeological conditions, climatic and temperature variations, as well as fluctuations in groundwater levels induced by annual and historical maximum rainfall, significantly impact tunnel seepage [1]. Groundwater seepage not only directly causes water leakage but may also alter the structure of the surrounding soil, further exacerbating the water-related environment [2].It is essential to deepen research on the mechanisms of concrete cracking, improve construction quality, enhance the bonding performance between materials and structures, and reasonably evaluate the effectiveness of new waterproofing materials [3]. In terms of numerical simulation, finite element-based analyses have revealed that pore water pressure is closely related to the efficiency of drainage systems and the permeability of the lining [4]. A three-dimensional saturated seepage model, under reasonable parameters, can effectively reflect the water head distribution in the lining [5]. By comprehensively considering the permeability coefficients of the lining, grouting layer, and soil in numerical simulations, a comprehensive permeability coefficient and corresponding water leakage prediction method have been proposed. Additionally, the analysis of leakage effects has been accomplished using ABAQUS [6].
Waterproofing materials are critical for metro engineering to resist seepage and ensure long-term operational safety. A comparative study of macro-environmental and aqueous environments was conducted to investigate the differences in the aging processes of polymer materials under these conditions [7]. Currently, widely used waterproofing membranes, coatings, and sealing systems in metro engineering are continuously being optimized, with their impermeability, environmental adaptability, and durability becoming key research focuses in the industry. By exposing neoprene to a marine environment, the variation in its aging performance was analyzed, revealing significant changes in the physical and chemical properties of the rubber material under severe aging conditions. This finding underscores the importance of considering such variations in lifespan predictions [9]. Using thermal analysis techniques, the compressive deformation behavior of rubber materials under hygrothermal conditions was studied [10], and their service life was predicted [11]. A BP neural network-based model was developed to predict the mechanical performance and lifespan of SBS-modified membranes, providing technical support for related engineering applications [12].
In the domain of concrete material design and mix proportion, it has been proposed that reducing the content of cement and water can effectively lower the heat of hydration, improve compactness, and inhibit the formation of interconnected cracks [13]. Emphasis is placed on quality control during diaphragm wall trenching in soft water-rich strata, as well as on underwater concrete pouring and joint waterproofing treatment [14]. Studies have been conducted on the durability of metro structures from perspectives such as carbonation, stray current, and chloride ion erosion, with corresponding service life prediction models established [15]. The incorporation of expansive agents into concrete has been found to reduce shrinkage and the resulting tensile stresses in metro engineering applications, achieving satisfactory engineering outcomes [16]. In the construction of Gongyuanqian Station on Guangzhou Metro Line 2, the addition of Dura fibers to structural concrete significantly enhanced the impermeability of the material [17]. The influence of construction techniques on the waterproofing effectiveness of metro station concrete has been primarily summarized through engineering [18,19,20]. Nevertheless, both engineering practice and theoretical research in this field remain at a developing stage, and the underlying waterproofing mechanisms require further in-depth and systematic investigation.
In summary, to address the frequent leakage issues in operational metro tunnels constructed by the mining method, this paper conducts a systematic investigation of waterproofing technologies based on an existing in-situ full-scale test section. The layout of the test section and monitoring methods are first detailed. Subsequently, relying on experimental data and numerical simulation results, key aspects including the inherent waterproofing performance of structural concrete, the installation process of external waterproofing membranes, and whole-process quality control are systematically examined. By comparing waterproofing performance under different construction conditions, the influence of material selection and process control on waterproofing effectiveness is emphasized. Through comparative analysis of multiple test groups, specifications for structural waterproofing construction and quality control are ultimately established, identifying critical controlling factors for water leakage in metro tunnels. The combined experimental and numerical simulation approach adopted in this study effectively reveals performance variations among different waterproofing techniques, providing reliable technical support for ensuring the safety of tunnel structures during their operational phase.
2. Waterproofing Test for Construction Joints in Mine Tunnels
2.1. Purpose and Content of the Experiment
In response to the increasingly prominent issue of water leakage in metro systems, this study focuses on key aspects such as the inherent waterproofing performance of structural concrete, joint waterproofing, construction techniques, on-site management, and quality control. The objective is to develop multiple critical waterproofing construction technologies during the tunneling phase, enhance the waterproofing capacity of tunnel structures, and ensure their long-term operational safety.The total length of the shaft access channel in the test section is 71.6 m, divided into Test Section 1 (Zones E–G) and Test Section 2 (Zones A–D). These two sections are separated by a deformation joint. The base slab is buried at a depth of 29.34 m, with a standard cross-section measuring 6.68 m in width and 6.82 m in height. The primary lining, with a thickness of 300 mm, was cast using C35 concrete, while the secondary lining, 350 mm thick, was constructed with C40 concrete, as illustrated in Figure 2. Geotechnical investigation within a 40 m depth identified three groundwater levels: phreatic water, interlayer water, and confined water. The corresponding water table depths were measured at -8.5 m, -16.30 m, and -22.40 m, respectively. Within the test section, the hydraulic head above the base slab increases progressively from 0 at Chamber A to approximately 2.2 m at the end wall (G). The measured water depths are about 1.4 m in Chamber F and 1.1 m in Chamber D.
Test Section 1 was designed to validate the inherent waterproofing capability of the concrete structure and the performance of joints (e.g., deformation and construction joints) under the condition of no external waterproofing membrane; Test Section 2 was designed to evaluate the performance and installation techniques of the external waterproofing membrane itself. The experimental grouping scheme is illustrated in the figure below Figure 3.
Test Section 1, with a total length of 22.5 m, was subdivided into four segments (E to G) by means of a deformation joint and circumferential construction joints, each segment measuring approximately 7.5 m in length. Segment E was constructed with conventional concrete, while Segments F to G utilized self-compacting concrete (SCC), enabling a direct comparison of their waterproofing performance.The joints were categorized into two types: construction joints and deformation joints. For the deformation joints, the study focused on comparing the waterproofing effectiveness of conventional steel-edged rubber waterstops versus groutable variants. In the case of construction joints, a comparison was made between commonly used waterstop elements and a novel type. Additionally, grouting pipes were installed in both horizontal and circumferential joints. A specific testing protocol was implemented wherein grouting was not conducted initially; instead, it was activated only upon the occurrence of water leakage, to evaluate the remedial efficacy of the grouting system. The overall experimental design is schematically represented in Figure 4.
Figure 5 presents a cross-sectional profile of the segmented Test Section 2. As shown, the cross-passage of this section has a total length of 27 m and is divided into four modules (A to D). The first module (A) measures approximately 4.5 m in length, while each of the remaining modules (B to D) is about 7.5 m long.This configuration was designed to evaluate the performance of different waterproofing technologies, including waterproof material joints, grouting sockets, and membrane installation techniques. Each module incorporates a distinct waterproofing method, utilizing materials commonly employed in Beijing metro projects as a baseline. A comparative analysis was conducted to assess the effectiveness of the various waterproofing measures. To accurately isolate and evaluate the performance of the primary waterproofing systems, all joint areas across the modules were deliberately constructed without any supplementary waterproofing details. This controlled approach enables a conclusive analysis of the differences in workmanship and waterproofing performance among the different materials and techniques.
2.2. Test Monitoring Plan
Monitoring points for surface settlement, convergence, and crown settlement were installed at six sections spaced 8 m apart, with each section consisting of five surface settlement points, two convergence points, and one crown settlement point. Water pressure monitoring points were arranged at six sections (Section 1 to Section 6), also spaced 8 m apart, with each section equipped with 12 water pressure points. A summary of the monitoring point installation workload is provided in Table 1. The plan and profile views of the monitoring points are illustrated in Figure 6. According to the design specifications, the monitoring frequency was determined based on the distance between the tunnel excavation face and the monitoring sections. Monitoring was conducted once per day when the distance was ≤2B (where B represents the excavation span), once every two days when the distance was ≤5B, and once per week when the distance exceeded 5B. After conditions stabilized, monitoring was reduced to once per month. The frequency was increased in response to any abnormal conditions.
2.3. Test Monitoring Methods and Devices
Pore water pressure monitoring was conducted using vibrating wire piezometers installed via the embedment method. Typically, the sensor can be directly placed in the soil mass; however, when encountering coarse-grained materials with large aggregates, it should be enclosed in a saturated sand bag and protected with additional measures to prevent cable damage. In fine clay soils, the use of a sand bag is unnecessary. In areas subject to frequent compaction or anticipated significant displacement, armored cables are recommended. Cables should be laid in trenches and backfilled with fine-grained aggregates, compacted manually, and sealed at intervals with bentonite to prevent the formation of preferential seepage paths along the cable trench.
Three-dimensional laser scanning technology acquires high-precision spatial information of object surfaces by emitting laser pulses and capturing their reflected signals. The operating principle is based on the time-of-flight (ToF) method: the distance (S) from the scanner to a target point is calculated by measuring the round-trip time of the laser pulse. By combining this distance with the horizontal angle (α) and vertical angle (β) of the laser beam, the 3D coordinates P (X, Y, Z) of the target point are accurately determined, as shown in Figure 7. Additionally, the intensity (reflectance) and RGB texture information of each point can be simultaneously recorded. This technology is characterized by high accuracy, dense point cloud data, high acquisition efficiency, and non-contact operation, enabling rapid collection of large-scale point cloud datasets. It is well-suited for 3D spatial data acquisition and hidden defect detection in underground engineering applications such as metro tunnels, providing a high-resolution data foundation for identifying structural anomalies, including deformation and water leakage.
2.4. Test Results and Analysis
2.4.1. Test of F~G Segment
The cross-sections of test sections F and G use different types of concrete: the secondary lining of section F is made of self-compacting concrete, while section G is cast with a combination of ordinary and self-compacting concrete, without an external waterproof layer. On the left side of both sections, construction joints are equipped with water-swelling waterstops and grouting pipes, while the right side uniformly uses steel-edged rubber waterstops. The specific structure is shown in Figure 8.
Figure 9(a) presents the projection diagram of leakage points and corresponding field photographs for Section G of the test segment. As shown, a total of 10 leakage points were identified in Segment G, comprising 3 at horizontal construction joints, 5 at structural cracks, and 2 at circumferential construction joints. Figure 9(b) shows the projection diagram and field photographs for Section F. It can be observed that 7 leakage points were recorded in Segment F, including 3 at horizontal construction joints, 3 at structural cracks, and 1 at a circumferential construction joint.
2.4.2. Test of Sections D~E
Both trial sections D and E were poured with conventional concrete and had no external waterproof layer. Steel-edged rubber waterstops with grouting pipes were used for the construction joints on the left side of both sections, while the right-side construction joints uniformly used polymer-coated waterstop components. The specific structure is shown in Figure 10.
Figure 11(a) presents the projection diagram and corresponding field photographs of leakage points in Section D of the test segment. As observed, a total of 8 leakage points were identified in Segment D, including 3 at horizontal construction joints, 1 at a structural crack, and 3 at the circumferential joint between Segments C and D. Figure 11(b) illustrates the leakage point projection diagram and field photographs for Section E. In Segment E, 12 leakage points were recorded, comprising 7 at horizontal construction joints, 3 at structural cracks, and 2 at the circumferential joint between Segments D and E.
2.4.3. Test of Sections A~C
Test Sections A to C were all constructed with conventional concrete and featured an external waterproofing system composed of a 1.5-mm-thick EVA membrane integrated with grouting sockets. On the left side of each section, the construction joints received only surface chipping treatment. For the right-side construction joints, Sections A and B also employed surface chipping, while Section C utilized a polymer-coated waterstop element. The detailed structural configuration is illustrated in Figure 12.
Figure 13 shows the projection map of water seepage points on sections A~C of the test segment, as well as field photos. It can be seen that there are a total of 2 water seepage points at location C, both at horizontal construction joints; there is 1 water seepage point in segment B, also at a horizontal construction joint; no water seepage points are observed in segment A.
3. Finite Element Analysis Model
3.1. Model Parameters
A three-dimensional finite element model comprising seven compartments with different waterproofing techniques and materials was developed using ABAQUS. The model was constructed strictly according to the actual dimensions of the field test to investigate waterproofing performance. As shown in Figure 14, the model consists of three components: the excavated soil layer, the supporting chamber, and the waterproofing materials. The specific parameters of the ground soil model are listed in Table 2.The concrete lining was simulated using the Concrete Damaged Plasticity (CDP) model, with a concrete strength grade of C40. The standard cross-sectional length (D1) of the lining is 6,680 mm, and the standard longitudinal length (D2) is 6,820 mm. The steel edge, with a length B2 = 65 mm, was modeled as a rigid body. The rubber section, with a length B1 = 200 mm, was treated as a hyperelastic incompressible material and described using the Mooney-Rivlin constitutive model. The rubber was discretized with C3D8R solid elements. The expression for this constitutive model is as follows:
U=C10(I1-3)+C01(I2-3)
In the equation, U represents the strain energy potential; C10andC01 are material constants; I1 and I2 are the first and second invariants of the strain tensor. The values of C10 and C01 were set to 0.592 MPa and 0.148 MPa, respectively.A "hard" contact algorithm was adopted to simulate the normal behavior between the waterproofing materials and the supporting structure, effectively preventing penetration between the bodies. Surface-to-surface contact was employed to describe the interaction between different supporting structural elements, while the penalty friction method was used to model tangential behavior at the interfaces. The friction coefficient between different supporting structure compartments was defined as 0.6, and that between the supporting structure and the surrounding soil was set to 0.35.
In this study, the initial stress field import method was employed to achieve geostatic stress equilibrium. In the ABAQUS numerical simulation, the spatial position of the phreatic surface was accurately determined based on geological cross-sections. The pore water pressure distribution was defined using the Analytical Field method with a linear distribution function as follows:
P=γ(Y - Y0)
In the equation, the unit weight of water γ is 10,000 N/m³, Y₀ represents the Y-coordinate at the invert of the tunnel, and Y denotes the Y-coordinate of the water table level.
This method provides a key technical approach for accurately representing the in-situ hydrogeological conditions. By establishing a pore water pressure distribution model corresponding to the groundwater level depth, an accurate characterization of the seepage field around the tunnel structure was achieved. This parametric modeling methodology, grounded in hydrogeological conditions, effectively ensures the physical authenticity of the water pressure boundary conditions, thereby significantly enhancing the credibility of the numerical analysis results for the tunnel structure's waterproofing performance.
3.2. Model Validation
This study employs a numerical simulation approach to analyze the mechanical behavior at the contact interfaces of tunnel segment ring joints. Using the contact stress between adjacent compartments as the primary evaluation indicator, the waterproofing performance of joint materials is characterized by extracting the average minimum contact stress values in the ring joint areas. Figure 15 compares the joint failure pressures obtained from the numerical model at the sidewall monitoring points of each section with the experimentally measured pore water pressures. Although the experimental data exhibit some scatter due to limitations in the accuracy of water pressure measurements, leading to partial discrepancies with the numerical results, the overall agreement in both magnitude and variation trends between the simulation and experimental data is satisfactory. This comparison validates the effectiveness of the numerical model developed in this study, demonstrating its capability to accurately simulate the mechanical and sealing behavior of the joints and to reliably assess the sealing performance of tunnel segment joints.
3.3. Distribution Characteristics of Contact Stress at Circumferential Seams
Based on the deployment plan of the pore water pressure gauges in the test section, this study set up corresponding data collection points at the corresponding positions of the annular cross-section in the numerical model, and their spatial distribution is shown in Figure 16.
In order to reveal the distribution characteristics of contact stress at the circumferential joints, based on the numerical simulation results, the distribution of contact stress at the circumferential joints along different contact displacements was extracted for each test segment, as shown in Figure 17.
Comparative analysis based on Figure 33(c) and (e) indicates that the contact stress at the C–D section is significantly greater than that at the E–F section, demonstrating the superior waterproofing performance of the polymer-coated waterstop compared to the steel-edged rubber waterstop. Furthermore, as shown in Figure 33(c) and (d), the waterproofing effectiveness with the EVA membrane as an external waterproofing layer is markedly better than that without an external layer. This conclusion is highly consistent with the experimental results presented earlier.
Analysis of the waterproofing materials at the ring joints under contact displacement reveals the distribution characteristics of contact stress across different parts of the annular section. The results show that the invert area of the horseshoe-shaped section exhibits the highest contact stress, while the vault area shows the lowest. This phenomenon can be attributed to differences in the structural mechanical behavior of the horseshoe-shaped configuration: the invert, serving as the tunnel's base, bears the weight from the overlying structure and vertical ground pressure, placing it in a state of compression with favorable joint closure. Construction operations at the invert—being planar or slightly inclined—facilitate membrane installation, welding, protection, concrete pouring, and compaction, thereby ensuring higher construction quality. Concrete under gravity achieves better compaction in this region. In contrast, the vault is susceptible to unfavorable tensile forces leading to joint opening. During membrane installation or concrete pouring at the vault, workers must operate overhead—similar to "overhead welding" or "overhead pasting"—under restricted workspace and visibility. Such conditions are highly prone to defects including inadequate membrane adhesion, discontinuous welds, and insufficient concrete compaction.
4. Discussion
Conventional evaluation of tunnel waterproofing techniques often relies on isolated case studies or individual test data, making it difficult to systematically analyze the synergistic effects between materials and construction processes. For instance, traditional performance comparisons frequently overlook variations in construction techniques, thereby leading to evaluation results that deviate from actual performance. Without systematic test sections simulating real-world conditions, it is challenging to reveal the long-term performance evolution of materials under coupled complex stress and hydrological interactions.
Therefore, this study utilizes an in-situ full-scale test section to systematically clarify construction procedures and key control points for different waterproofing techniques by optimizing the mix design of inherently waterproof concrete, controlling the installation process of external waterproof membranes, and implementing whole-process quality management. Through integrated experimental testing and numerical simulation, a comparative analysis was conducted on the waterproofing performance of various materials—including polymer-coated waterstops, steel-edged rubber waterstops, and water-swellable sealants combined with grouting pipes—under their corresponding technological conditions.
5. Conclusions
This study conducts a systematic investigation of waterproofing technologies through the establishment of an in-situ test section. Based on the optimization of the inherent waterproofness of structural concrete, controlled installation of external waterproofing membranes, and whole-process quality management, the research employs an integrated analytical approach combining experimental studies and numerical simulations to systematically compare waterproofing performance under different construction conditions, with strict documentation of key process parameters. The main conclusions are as follows:
1. The sections A–C, constructed with an external waterproofing layer, exhibited a significant reduction in the total number of leakage points compared to sections D–G, which lacked such a layer. This confirms the crucial role of the external waterproofing system in enhancing the short-term waterproofing efficiency of the tunnel. A further comparison of the leakage point distribution between the left and right sides of sections F–G revealed a noticeably higher number of leaks on the left side. Combined with the differences in waterproofing details between the corresponding sections, this allows for the conclusion that the waterproofing performance ranks as follows: polymer-coated waterstop > steel-edged rubber waterstop>water-swellable strip combined with grouting pipe. This trend aligns well with the numerical simulation results, collectively validating the performance differences of various waterstop elements in practical engineering applications and providing a reliable basis for the selection and optimization of joint waterproofing designs in tunnels.
2. Numerical simulation of the waterproofing materials at the ring joints under contact displacement reveals the spatial distribution of contact stress in the annular section: the invert area exhibits the maximum contact stress, resulting in optimal waterproofing performance, whereas the vault area shows relatively lower contact stress due to more complex construction conditions, leading to inferior waterproofing effectiveness. This finding verifies the reliability of the experimental data and systematically explains the underlying reasons for the observed differences from the perspectives of both the structural mechanical mechanism and construction techniques.
3. A comparison between the left side of sections D–E and the right side of sections F–G reveals significantly more leakage at the horizontal construction joints in the D–E sections. Considering the waterproofing details and concrete types used in these sections, it is concluded that self-compacting concrete (SCC), requiring no vibration, causes minimal disturbance to waterstops and thus contributes positively to waterproofing effectiveness. However, analysis of structural crack leakage distribution shows that Segment G (with partial SCC) and Segment F (full SCC) exhibit relatively more structural cracks compared to Segments D/E constructed with conventional concrete. This indicates that SCC demonstrates poorer performance in controlling structural cracking, which can be attributed to its insufficient volumetric stability and crack resistance during early-age strength development. Furthermore, the higher number of structural cracks in Segment G compared to Segment F suggests the importance of maintaining material consistency within the same segment, as interfaces between different materials may create potential weak zones prone to cracking.
4. The external waterproofing layer plays a crucial role in the overall waterproofing system. In the mined tunnel sections where EVA membranes are employed as the external waterproofing layer, the grouting socket system should be enhanced to ensure complete and dense grouting, thereby effectively mitigating water migration behind the membrane. Concurrently, it is essential to strengthen quality control of concrete raw materials and the entire construction process. This ensures the full utilization of the inherent waterproofing capability of the concrete structure itself, laying a solid foundation for long-term leakage prevention in stations and running tunnels.
Author Contributions
Methodology, Z.Z.; Software, X.Z.; Supervision, X.X. All authors have read and agreed to the published version of the manuscript.
Funding
This work is supported by the National Key R&D Program of China (Grant No.2023YFC3008902、2023YFB3211002), the National Natural Science Foundation of China (Grant No. 52174155).
Data Availability Statement
The data presented in this study are available on request from the corresponding author.
Acknowledgments
The authors would like to thank the editors and anonymous reviewers for their numerous detailed and inspiring suggestions and comments that helped improving the quality and readability of this paper.
Conflicts of Interest
All authors declare that this research was conducted in the absence of any commercial or financial relationships that could be construed as a potential conflict of interest.
References
- Yoshimura, H.; Schulman J, N.; Sakaki, H. Charge accumulation in a double-barrier resonant-tunneling structure studied by photoluminescence and photoluminescence-excitation spectroscopy. Phys. Rev. Lett, 1990, 64, 2422. [Google Scholar] [CrossRef] [PubMed]
- OKADA, K. , MATSUMOTO Y. Actual state of frost penetration depth in railway tunnel and its analysis against periodic change of atmospheric temperature. Dob. Gak. Ronb, 1990, 1990: 179-186.
- Ye, L.C.; Ye, J. Eleven Questions on Waterproof Concrete Technology for Underground Structures. China Build. Waterproofing 2001, (1), 34–36. [Google Scholar]
- Shin, Y.J.; Song, K.I.; Lee, I.M.; et al. Interaction between Tunnel Supports and Ground Convergence—Consideration of Seepage Forces. Int. J. Rock Mech. Min. Sci. 2011, 48, 394–405. [Google Scholar] [CrossRef]
- Xie, X.S.; Xie, X.H.; Wang, X.D.; et al. Influence of Aquitard on External Water Pressure of Deep-Buried Tunnel Lining. Chin. J. Geotech. Eng. 2020, 42 (S2), 146–150. [Google Scholar]
- Zhang, D.M.; Ran, L.Z.; Yan, J.Y.; et al. Influence of Grouting on Pore Water Pressure Changes Induced by Leakage in Shield Tunnels. Rock Soil Mech. 2017, 38, 3427–3435+3444. [Google Scholar]
- Hsuan, Y.G.; Koerner, R.M. Antioxidant Depletion Lifetime in High Density Polyethylene Geomembranes. J. Geotech. Geoenviron. Eng. 1998, 124, 532–541. [Google Scholar] [CrossRef]
- Le Gac, P.Y.; Le Saux, V.; Paris, M.; et al. Ageing Mechanism and Mechanical Degradation Behaviour of Polychloroprene Rubber in a Marine Environment: Comparison of Accelerated Ageing and Long Term Exposure. Polym. Degrad. Stab. 2012, 97, 288–296. [Google Scholar] [CrossRef]
- Le Saux, V.; Le Gac, P.Y.; Marco, Y.; et al. Limits in the Validity of Arrhenius Predictions for Field Ageing of a Silica Filled Polychloroprene in a Marine Environment. Polym. Degrad. Stab. 2014, 99, 254–261. [Google Scholar] [CrossRef]
- Patel, M.; Singh, B. Evaluation of the Impacts of Phased Excavation of Shield Tunnel on Adjacent Piled Raft Foundation of a Building. In Indian Young Geotechnical Engineers Conference; Springer Nature: Singapore, 2021; 183–196. [Google Scholar]
- Patel, M.; Skinner, A.R. Thermal Ageing Studies on Room-Temperature Vulcanised Polysiloxane Rubbers. Polym. Degrad. Stab. 2001, 73, 399–402. [Google Scholar] [CrossRef]
- Shang, J.L.; Mi, Y.; Zhang, H.; et al. Durability Prediction of Waterproof Materials Using Neural Network Method. Ind. Saf. Environ. Prot. 2010, 36, 59–61. [Google Scholar]
- Zhang, X.S.; Deng, J.W.; Dong, Y.D. Review of Waterproofing Measures for Shanghai Metro Station Structures. China Civ. Eng. J. 2000, (5), 107–110. [Google Scholar]
- Leingartner, M.; Maurer, J.; Ferrein, A.; et al. Evaluation of Sensors and Map** Approaches for Disasters in Tunnels. J. Field Robot. 2016, 33, 1037–1057. [Google Scholar] [CrossRef]
- Huang, B.D. Study on Influencing Factors of Metro Structure Durability and Its Life Prediction. Ph.D. Thesis, Tongji University, Shanghai, China, 2007. [Google Scholar]
- Wu, X.J.; Liu, G.B.; Lu, L.S.; et al. Optimization of Crack Control Criteria for Diaphragm Walls in Metro Stations. Chin. J. Rock Mech. Eng. 2005, 24 (S2), 5395–5399. [Google Scholar]
- Chen, Y.; Diao, T.X. New Construction Technology of the Cave-Pile Method in a Metro Station. Railw. Constr. Technol. 2014, (6), 45–47+97.
- Lin, C.; Wang, X.; Nie, L.; et al. Comprehensive Geophysical Investigation and Analysis of Lining Leakage for Water-Rich Rock Tunnels: A Case Study of Kaiyuan Tunnel, Jinan, China. Geotech. Geol. Eng. 2020, 38, 3449–3468. [Google Scholar] [CrossRef]
- Lu, Z.; Zhu, F.; Shi, L.; et al. Automatic Seepage Detection in Cable Tunnels Using Infrared Thermography. Meas. Sci. Technol. 2019, 30, 115902. [Google Scholar] [CrossRef]
- Multispectral Water Leakage Detection Based on a One-Stage Anchor-Free Modality Fusion Network for Metro Tunnels. Autom. Constr. 2022, 140, 104345. [CrossRef]
Figure 1.
Groundwater Level Recovery Curve.
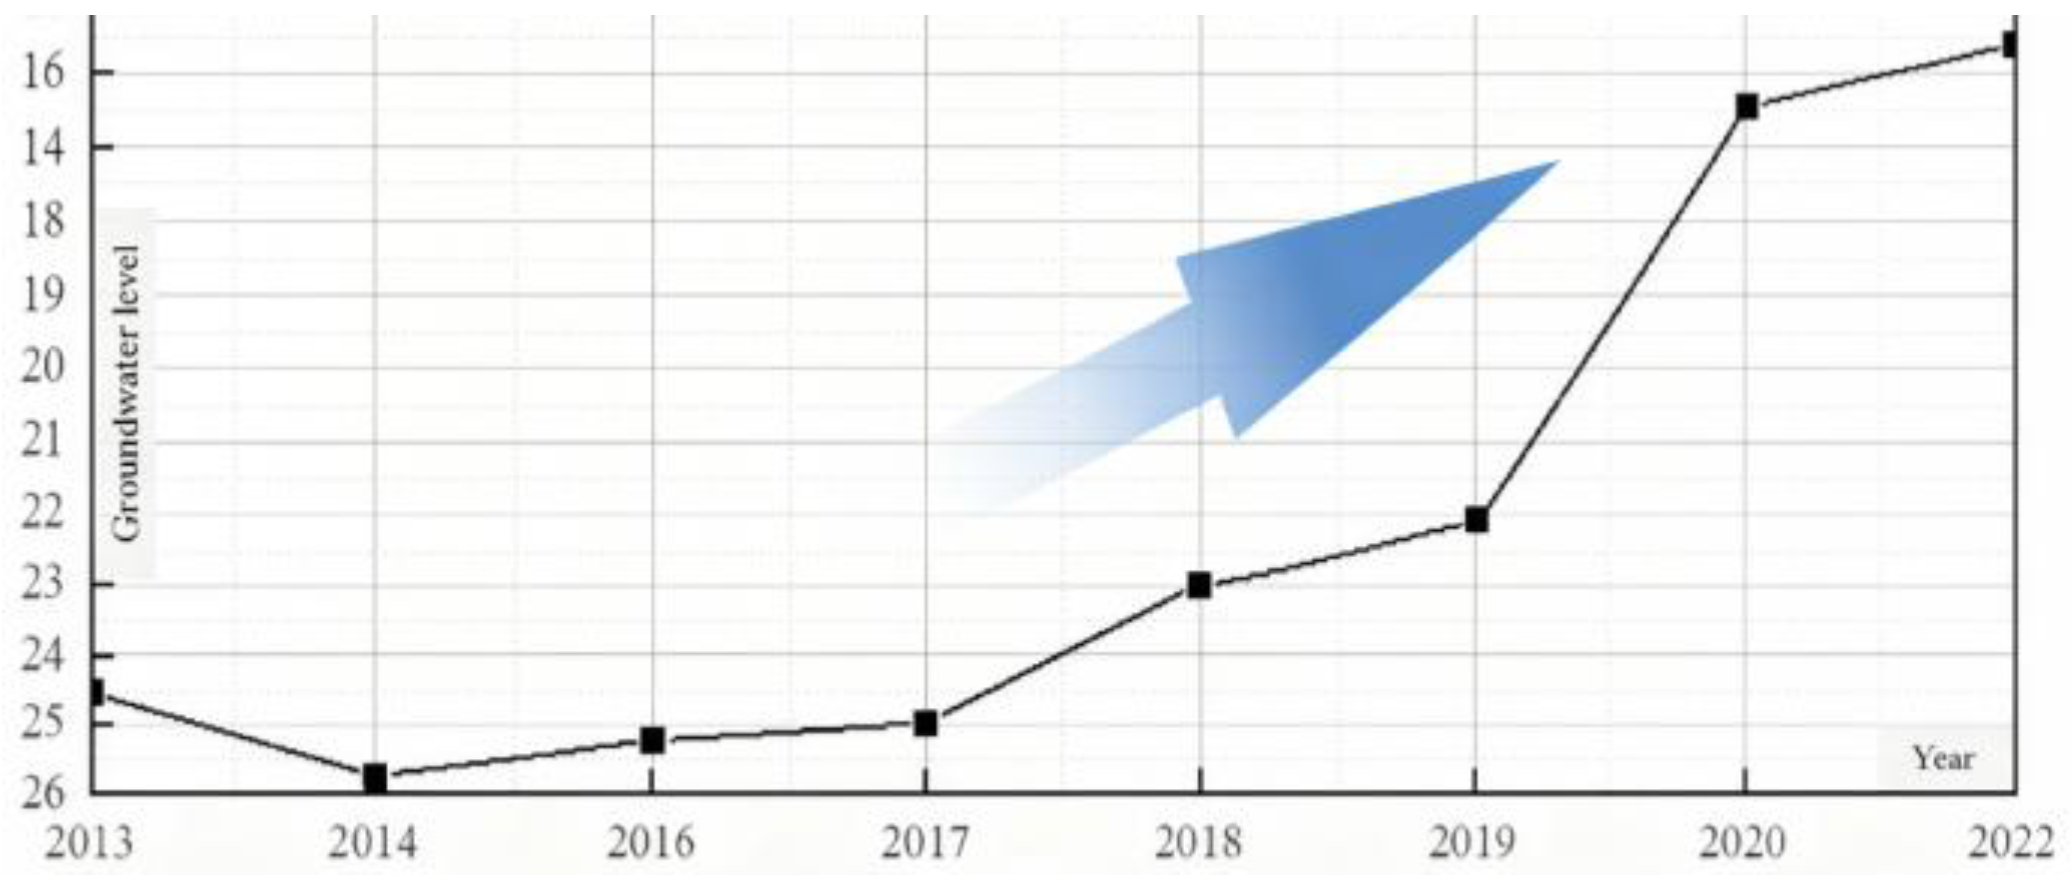
Figure 2.
Standard cross-sectional diagram.
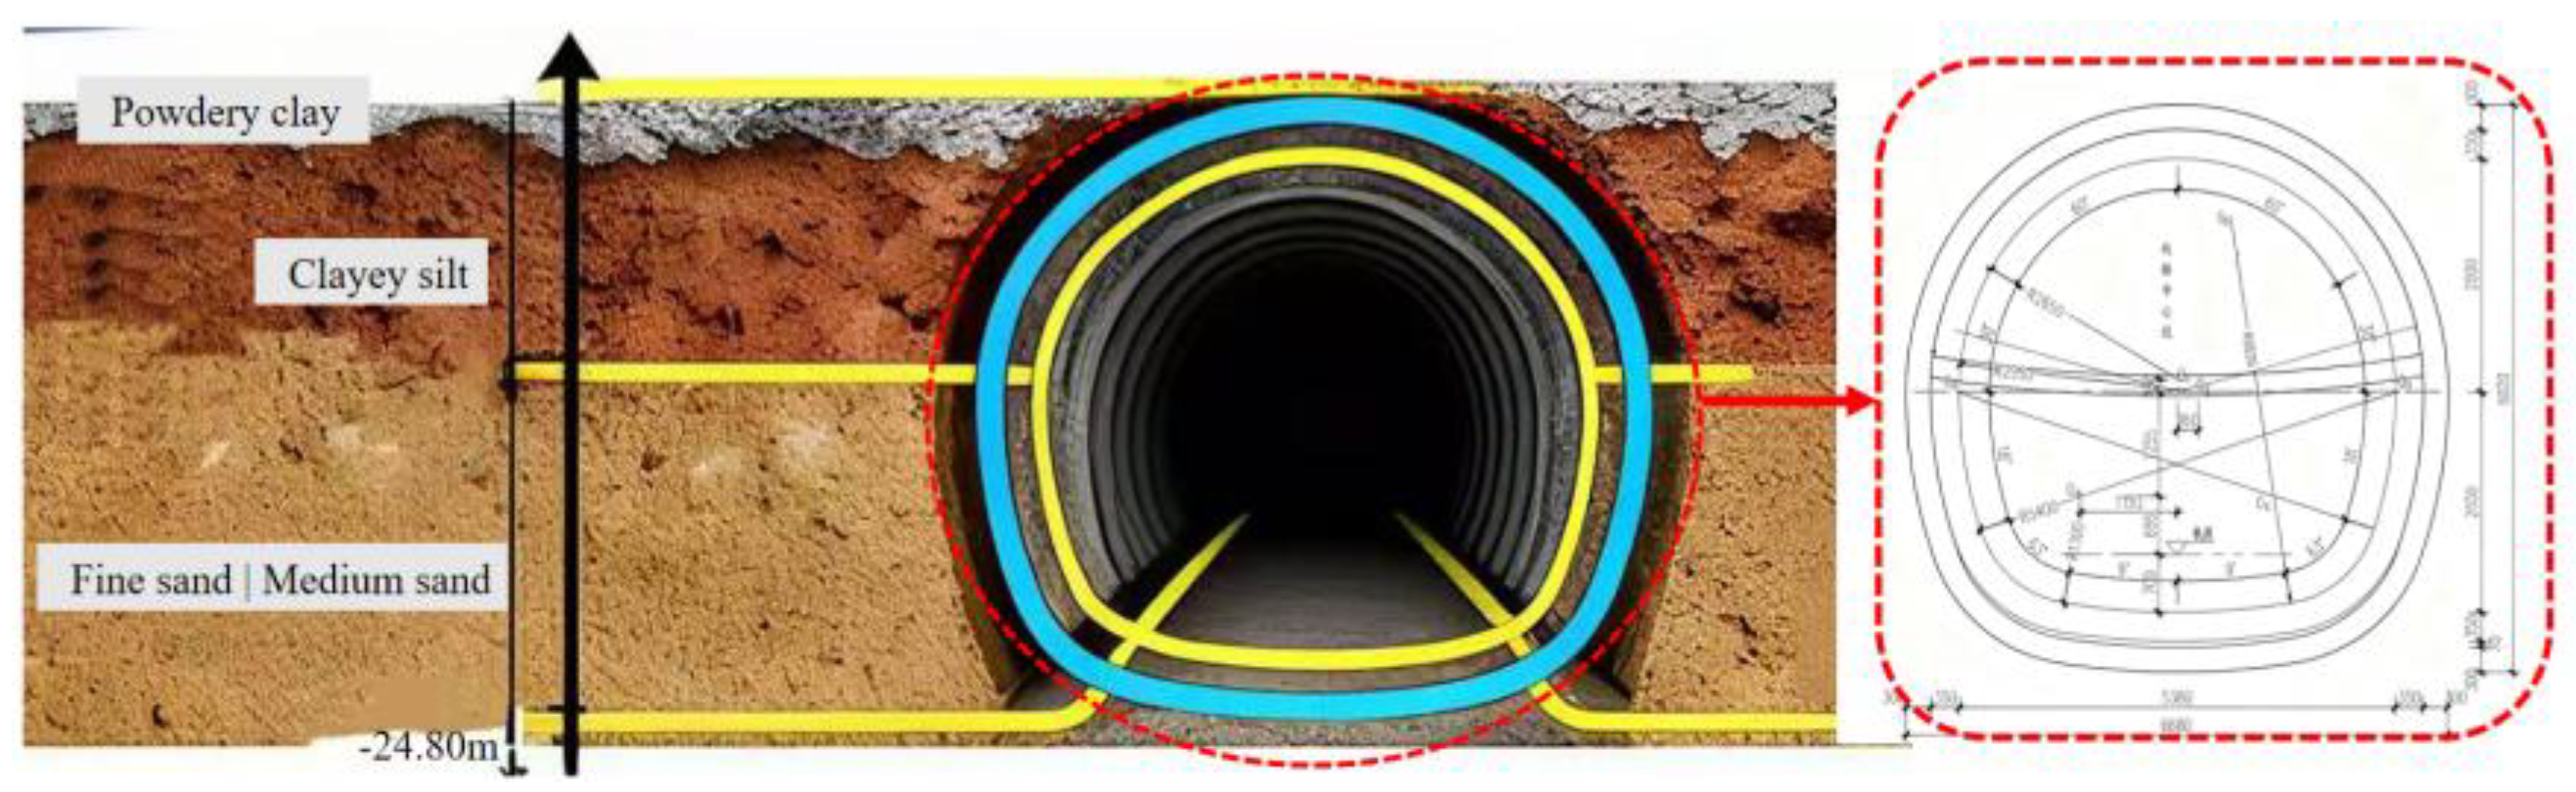
Figure 3.
Overview Diagram of the Test Section.
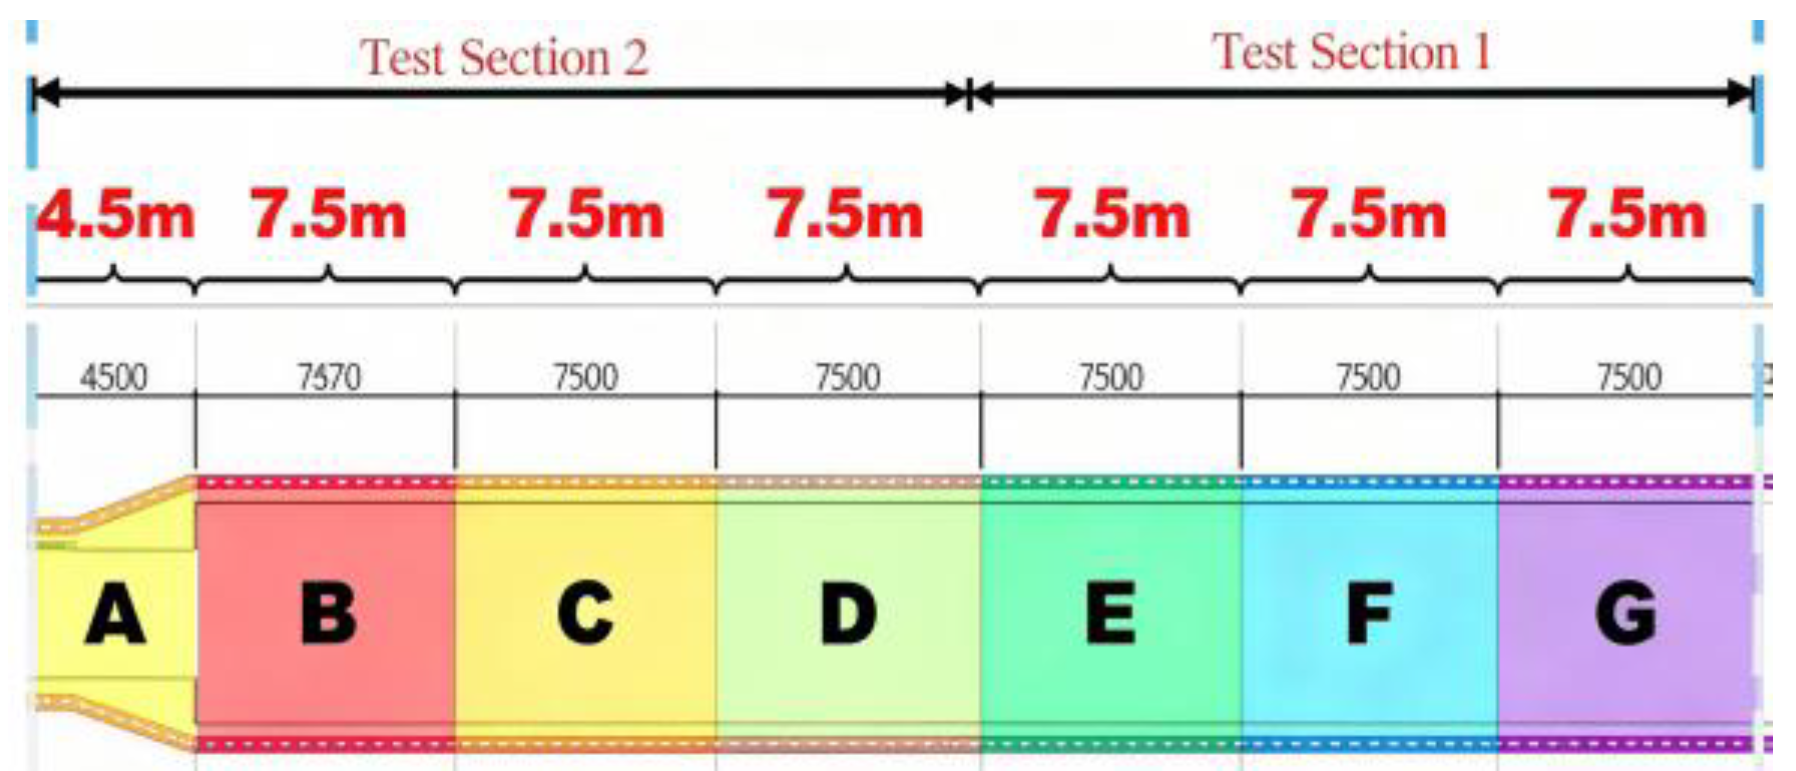
Figure 4.
Segmented Profile Diagram of Test Section 1.
Figure 4.
Segmented Profile Diagram of Test Section 1.
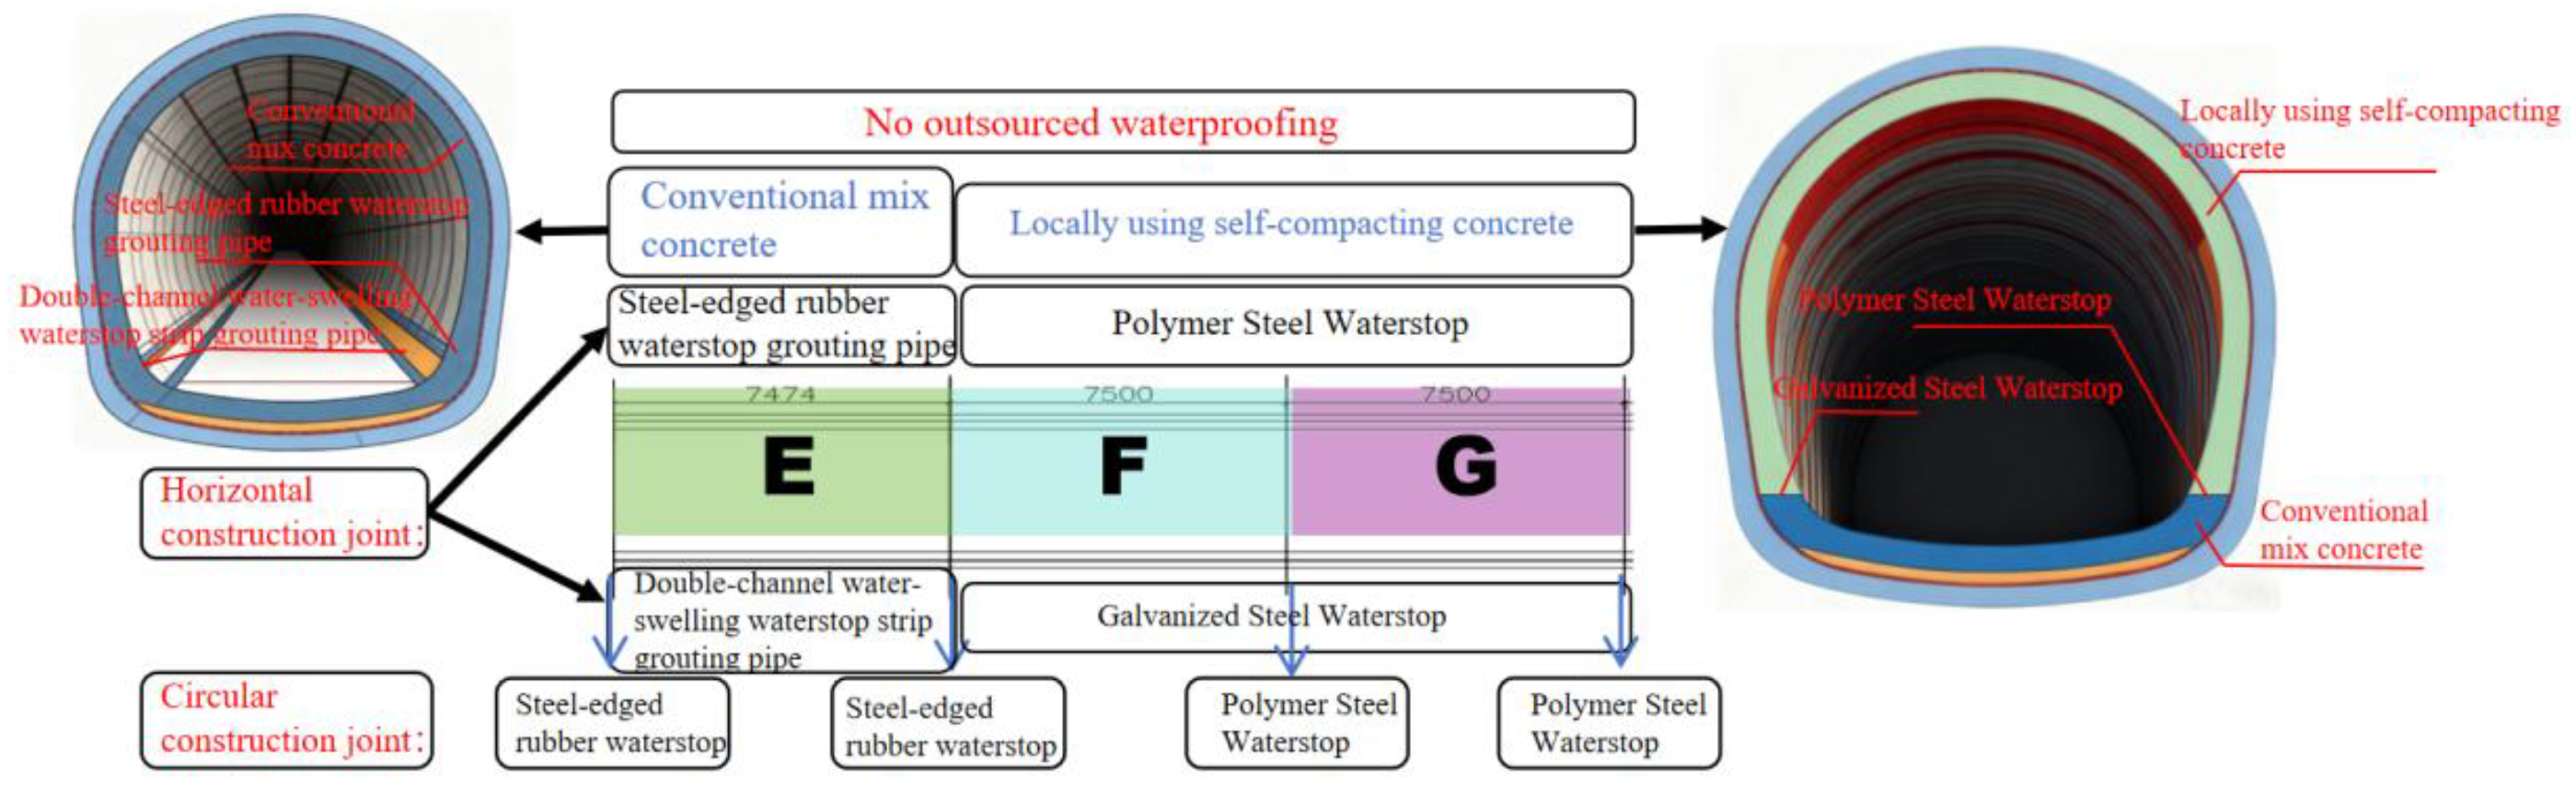
Figure 5.
Segmented Profile Diagram of Test Section 2.
Figure 5.
Segmented Profile Diagram of Test Section 2.
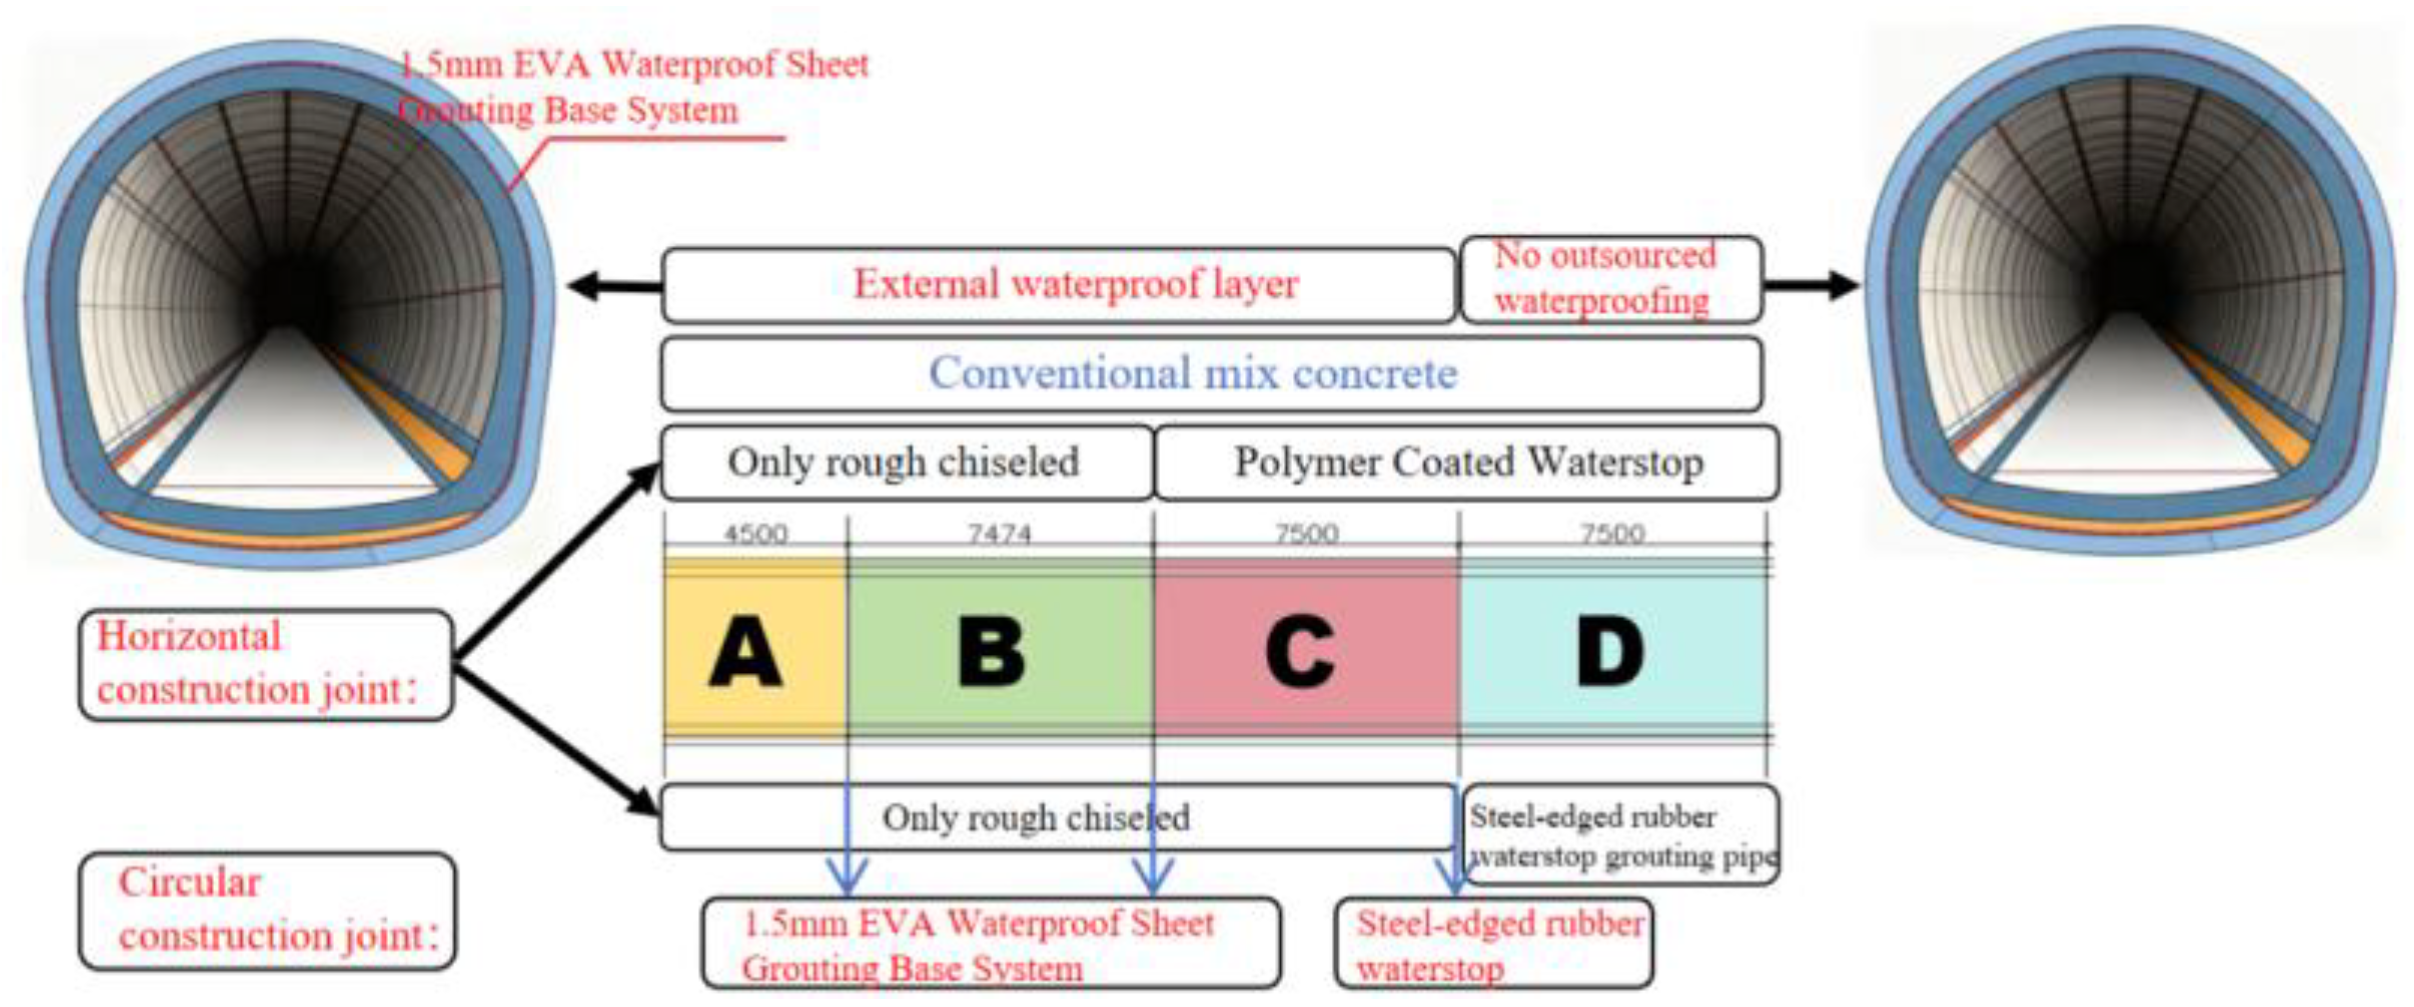
Figure 6.
Point Layout Plan.
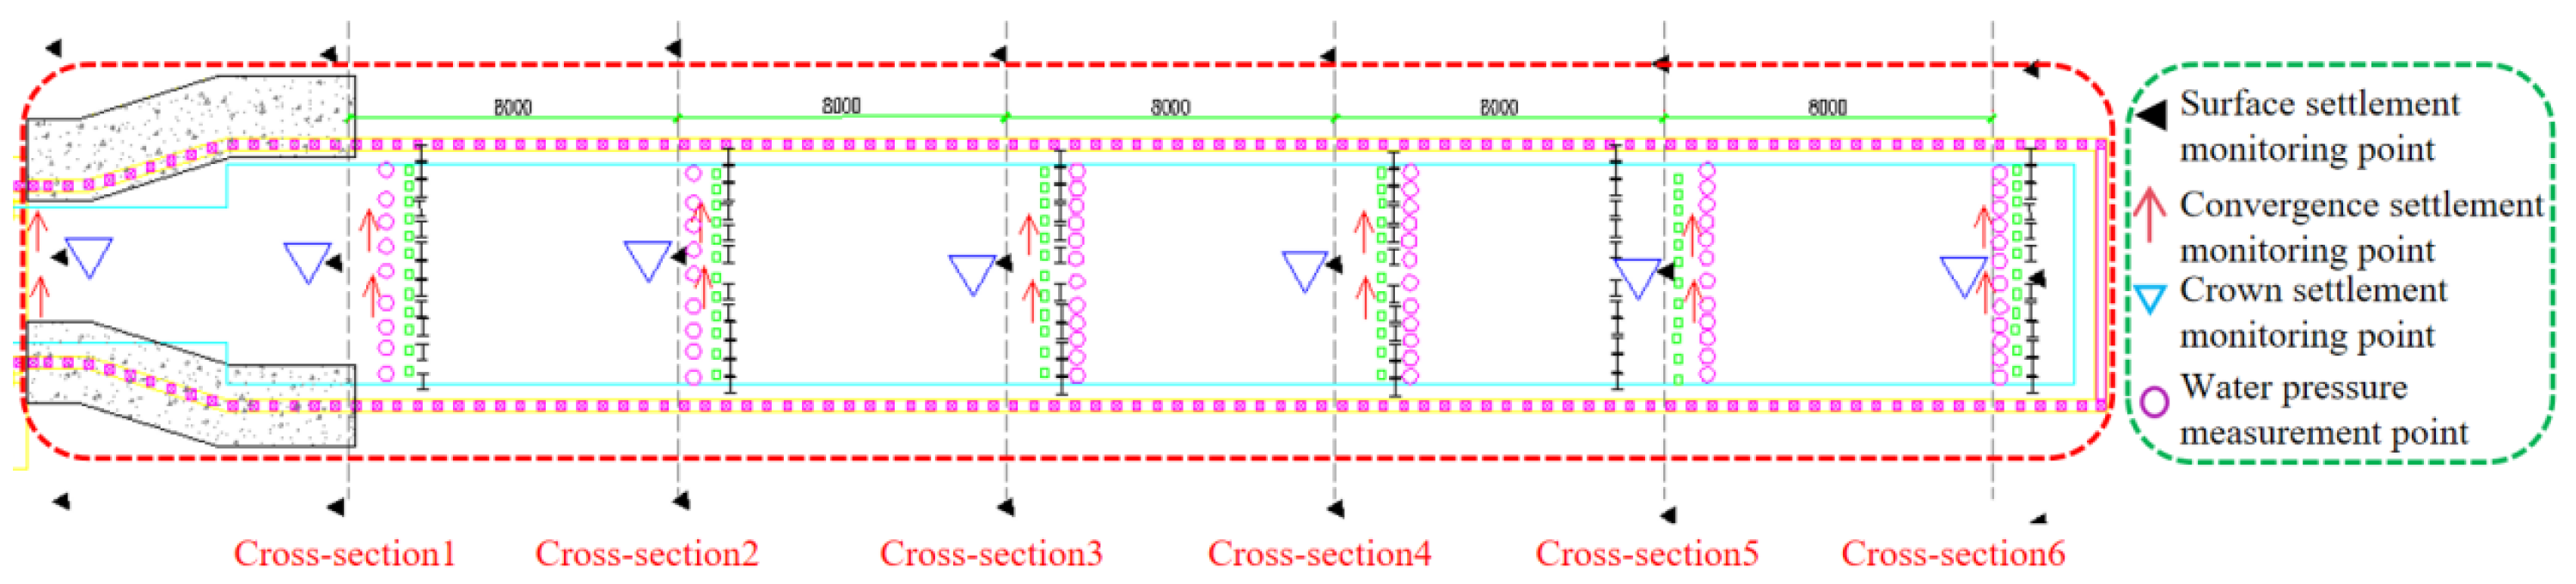
Figure 7.
3D Laser Scanner Device and Principle Diagram.
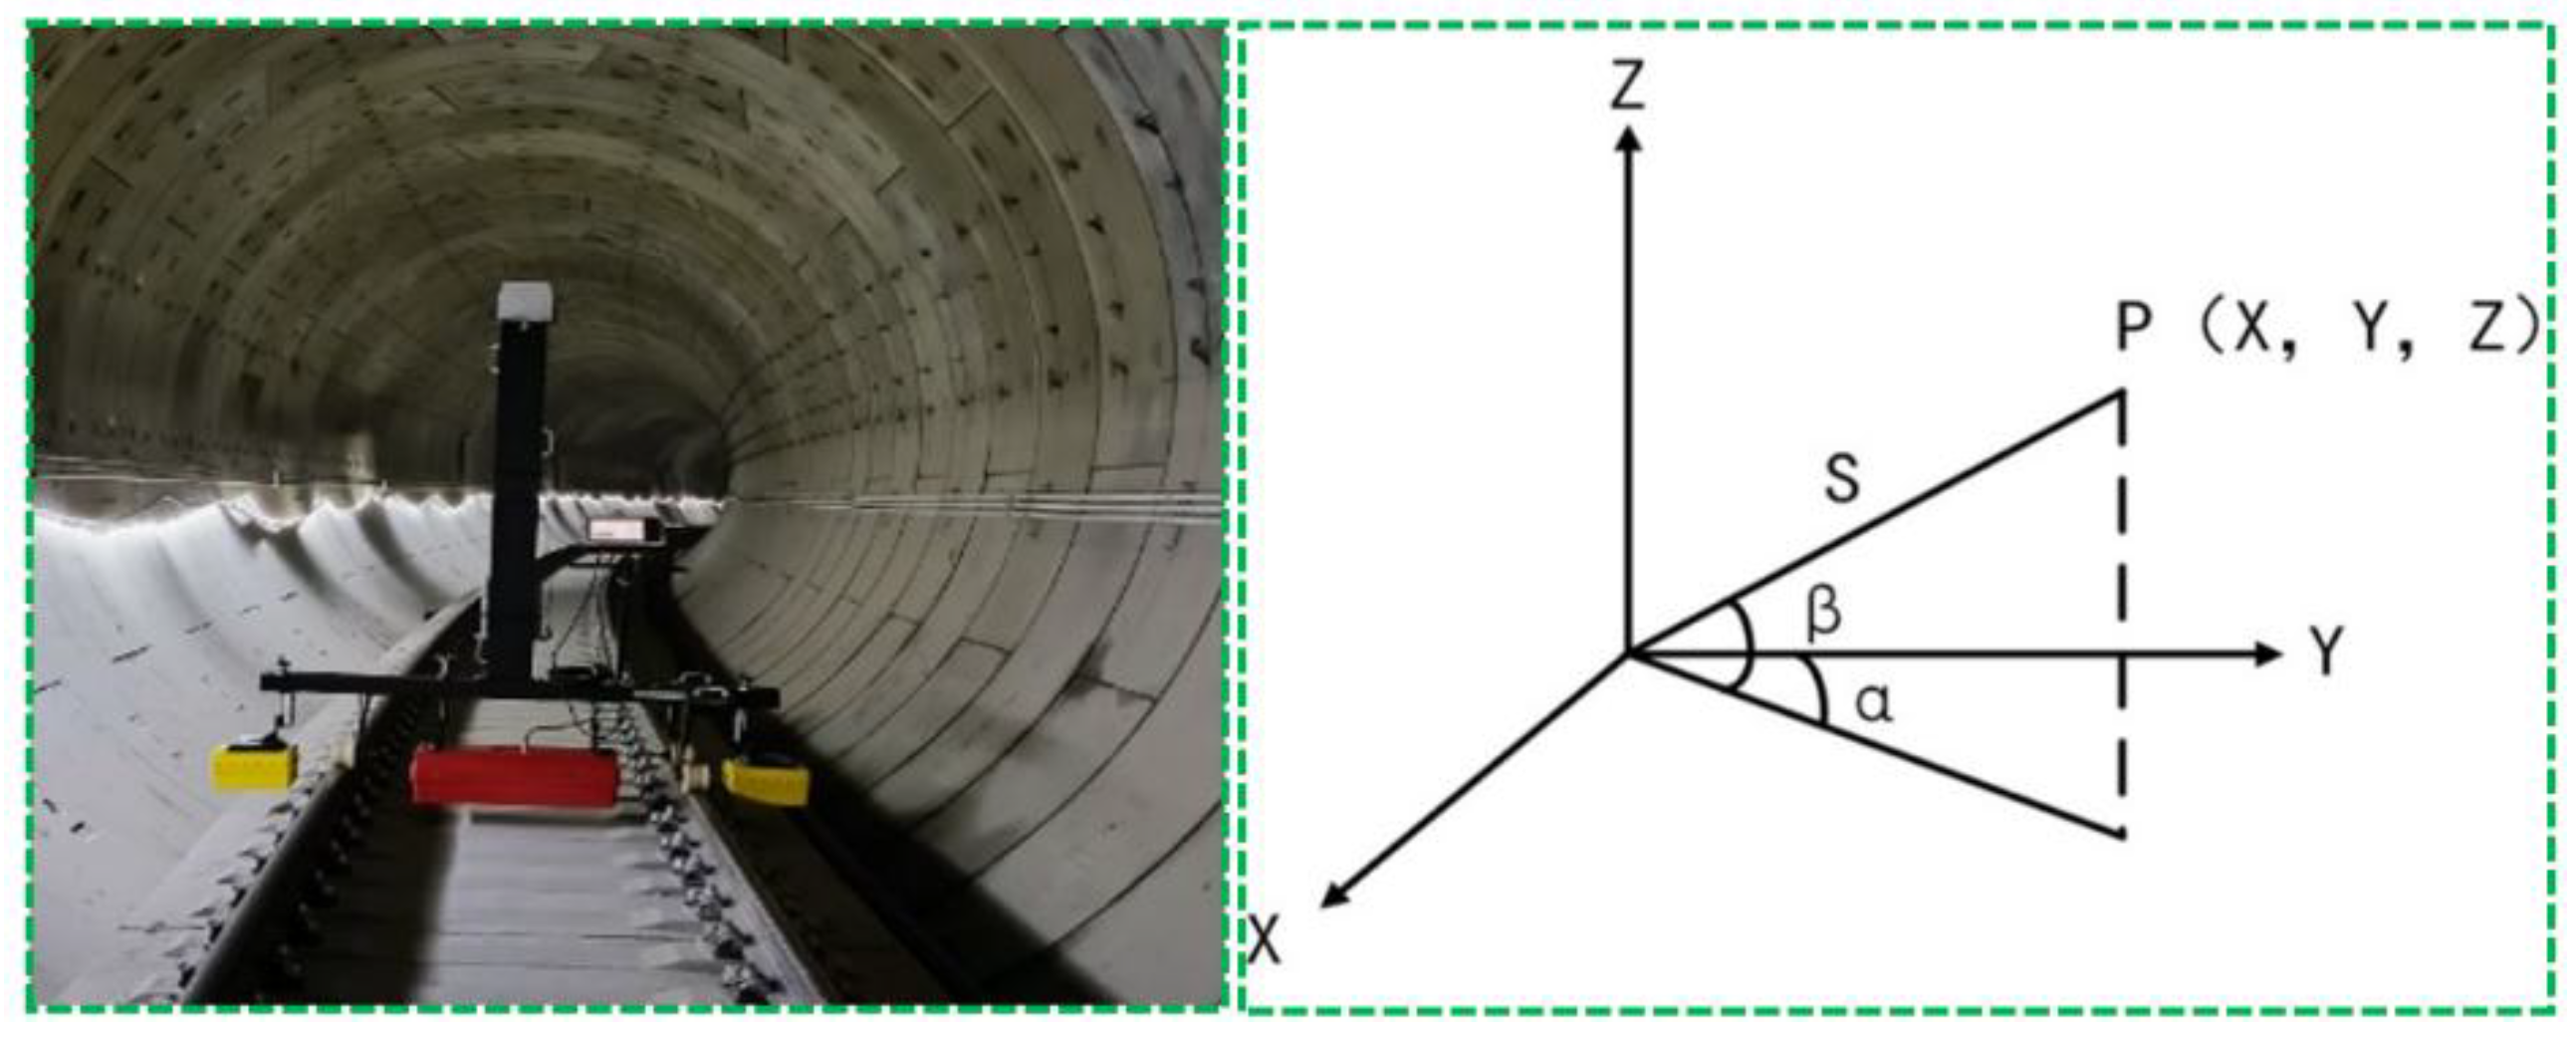
Figure 8.
Selection of materials for F~G section.
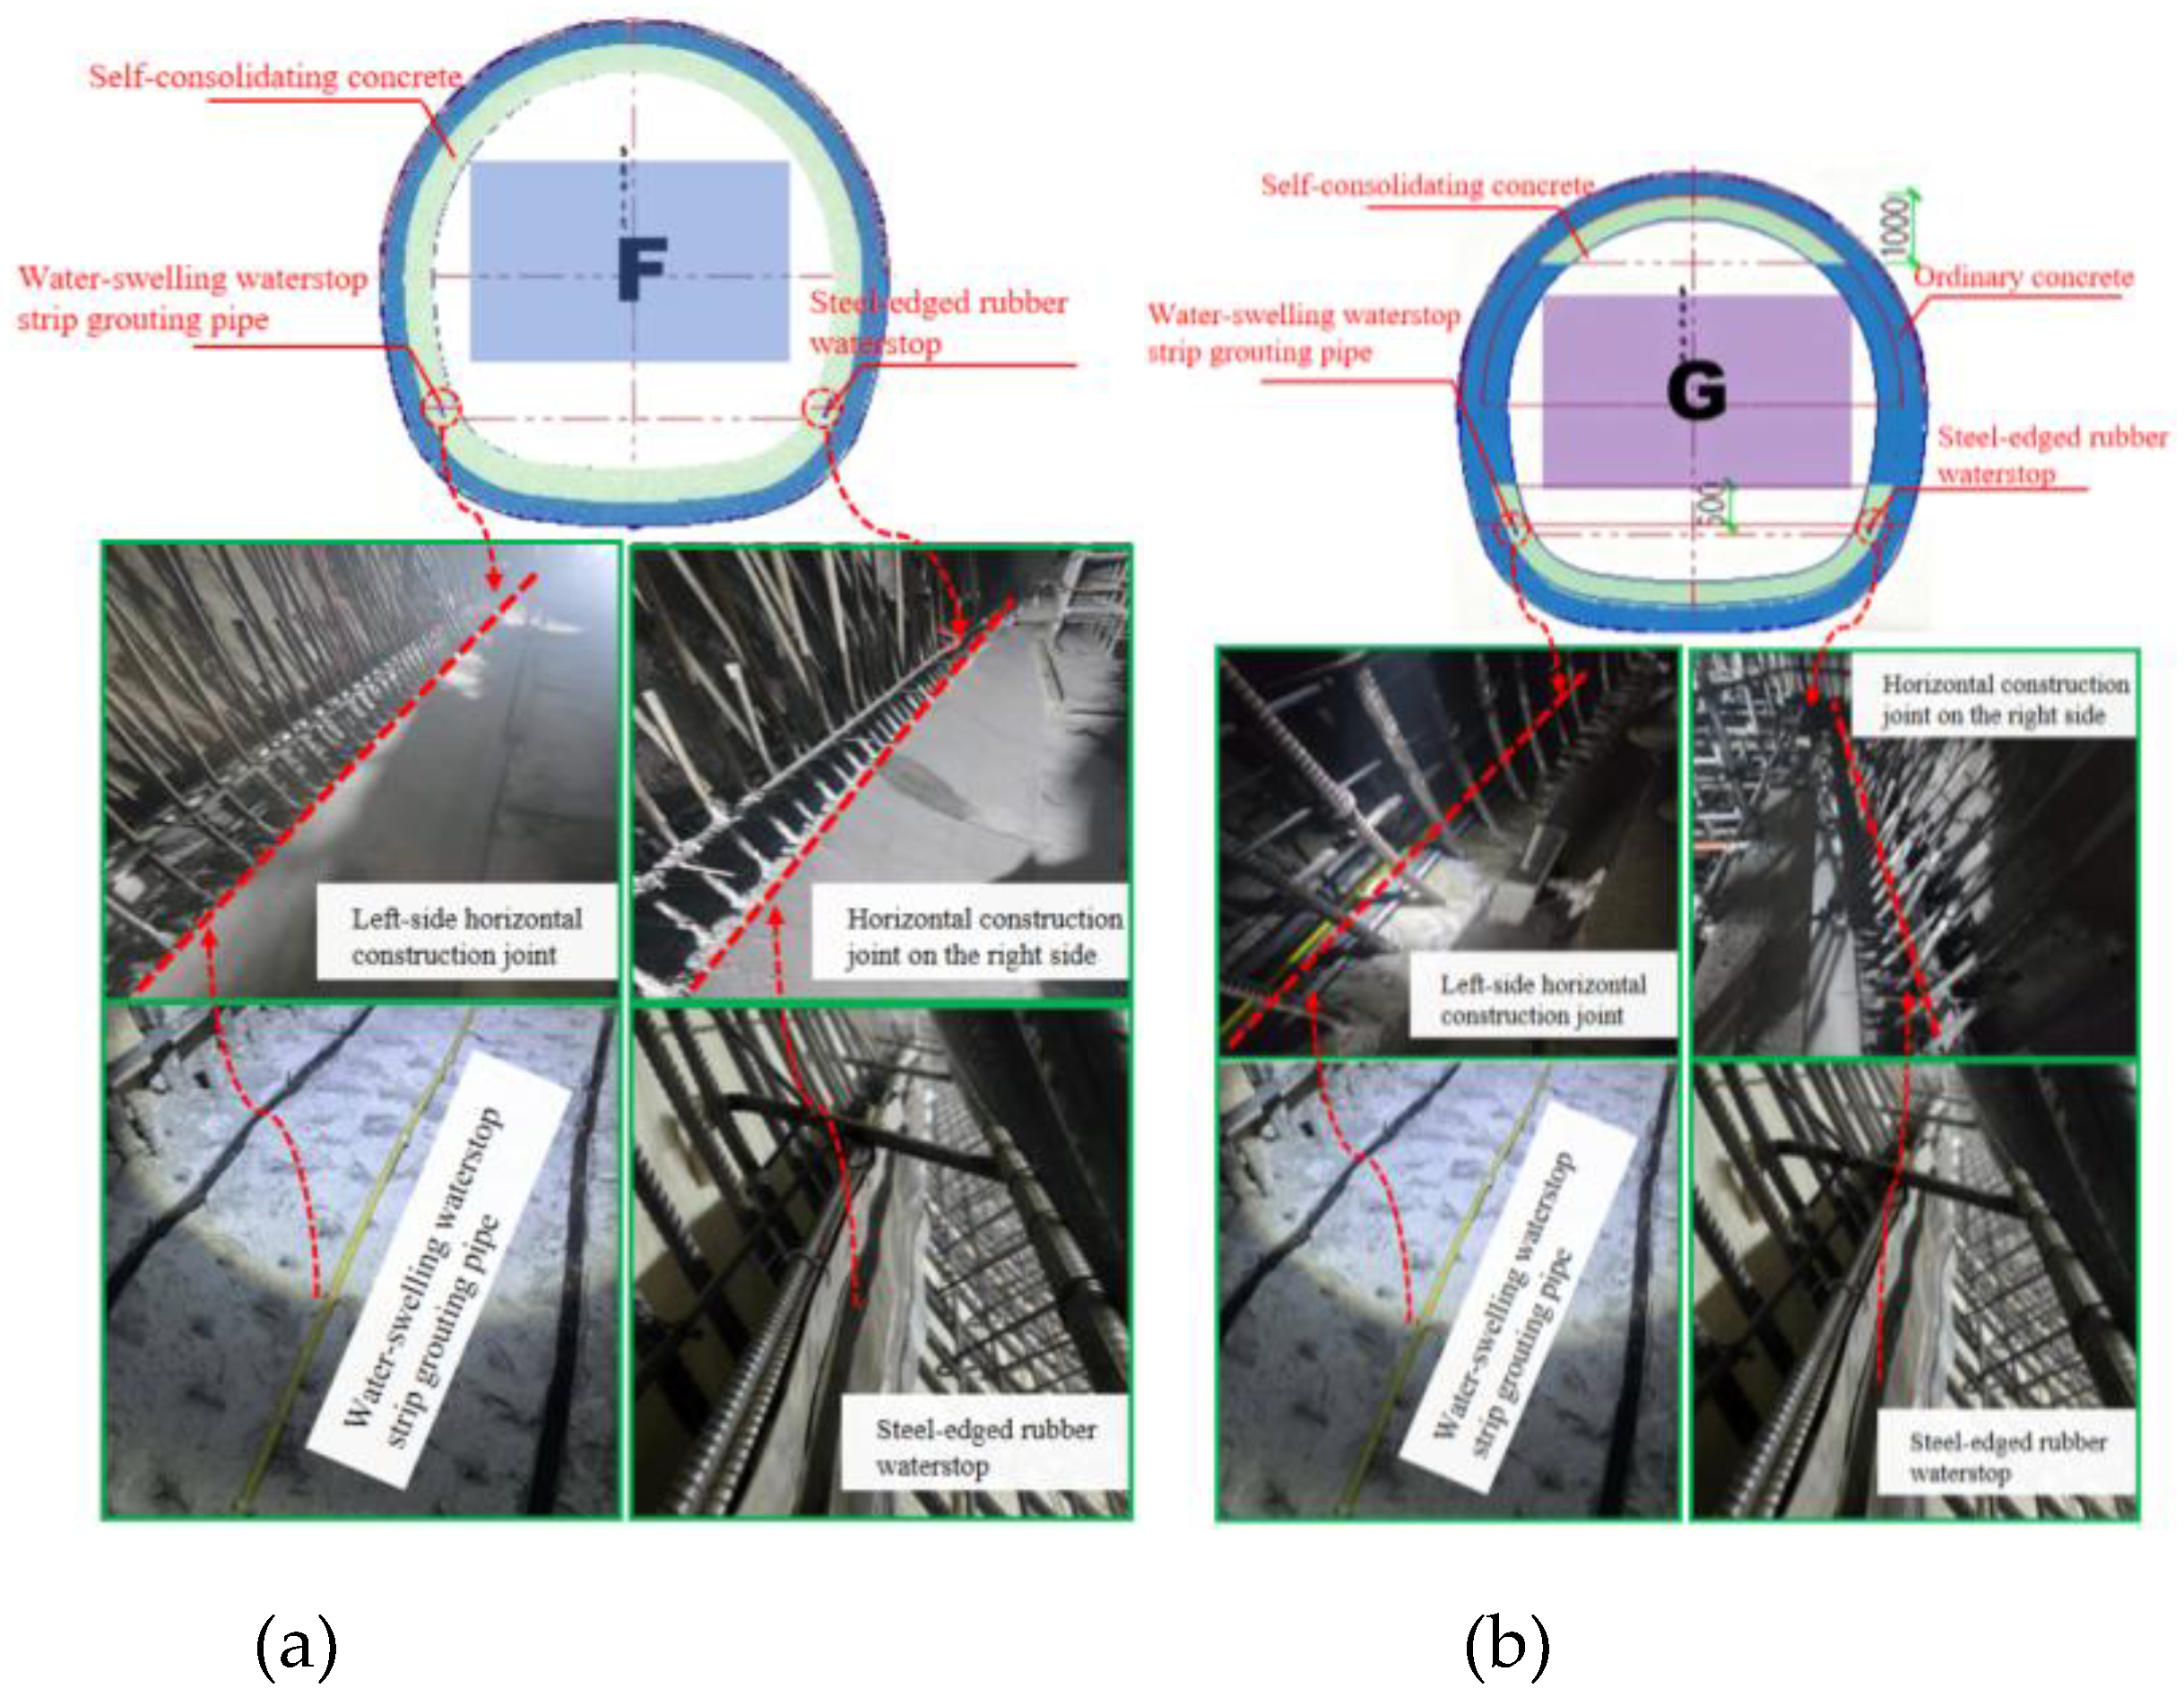
Figure 9.
Selection of materials for F~G section.
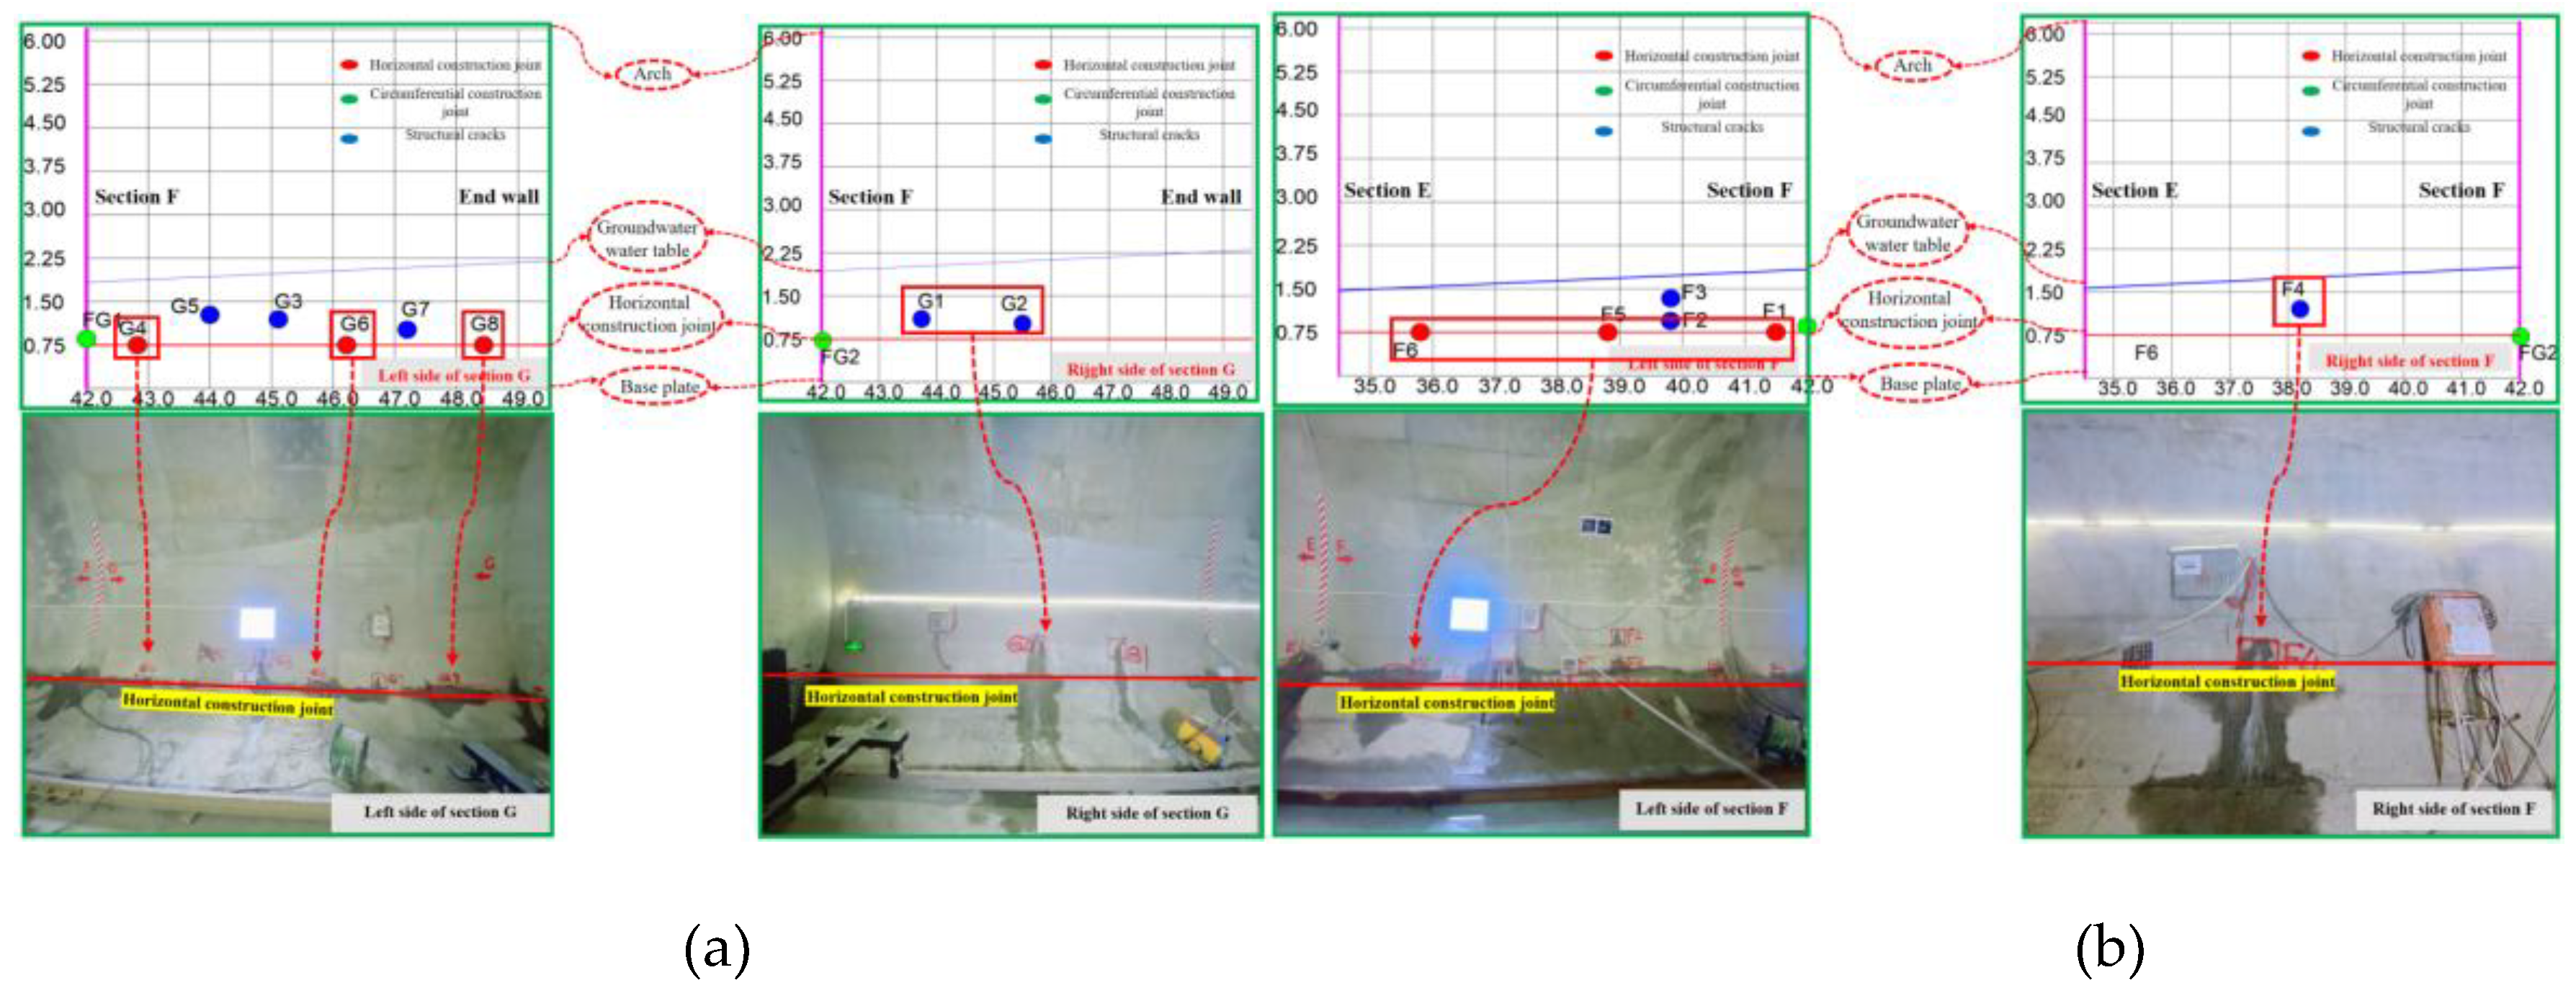
Figure 10.
Selection of materials for D~E section.
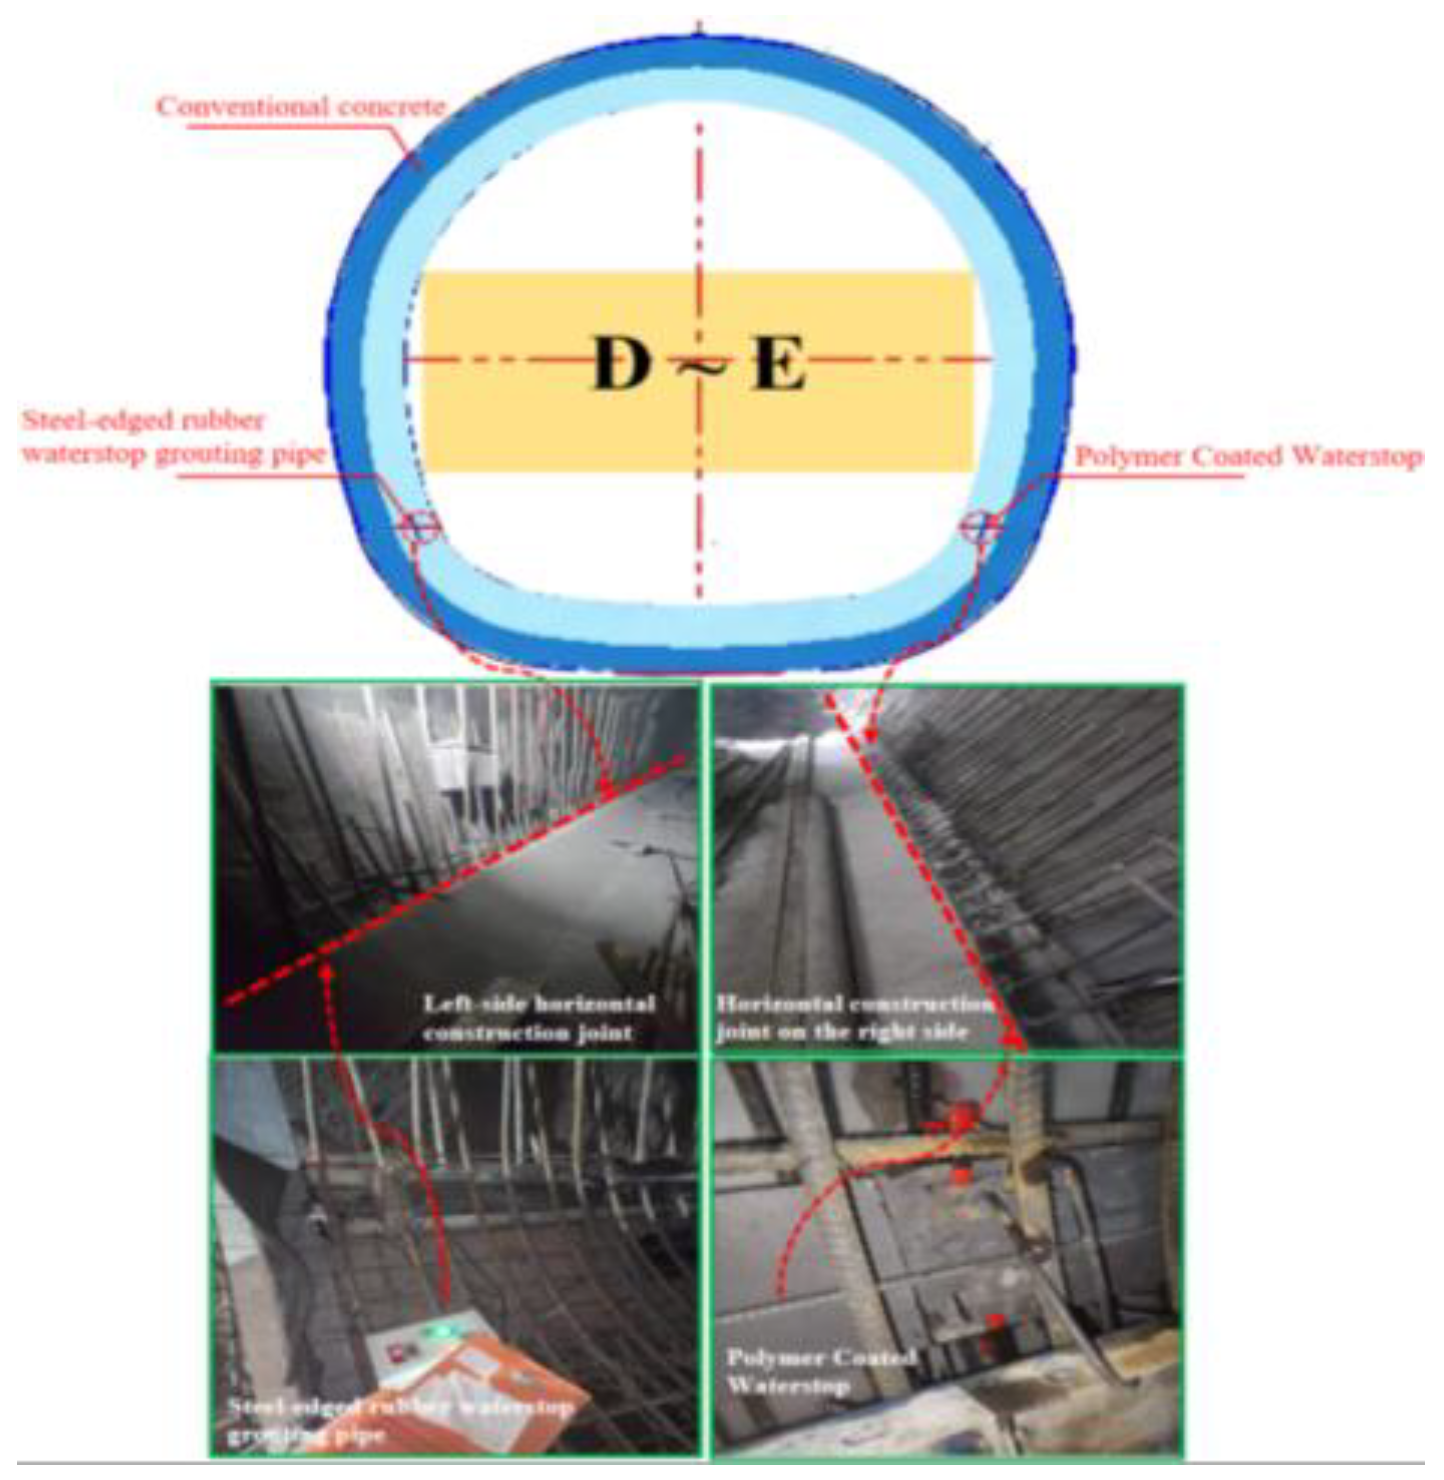
Figure 11.
Selection of materials for D~E section.
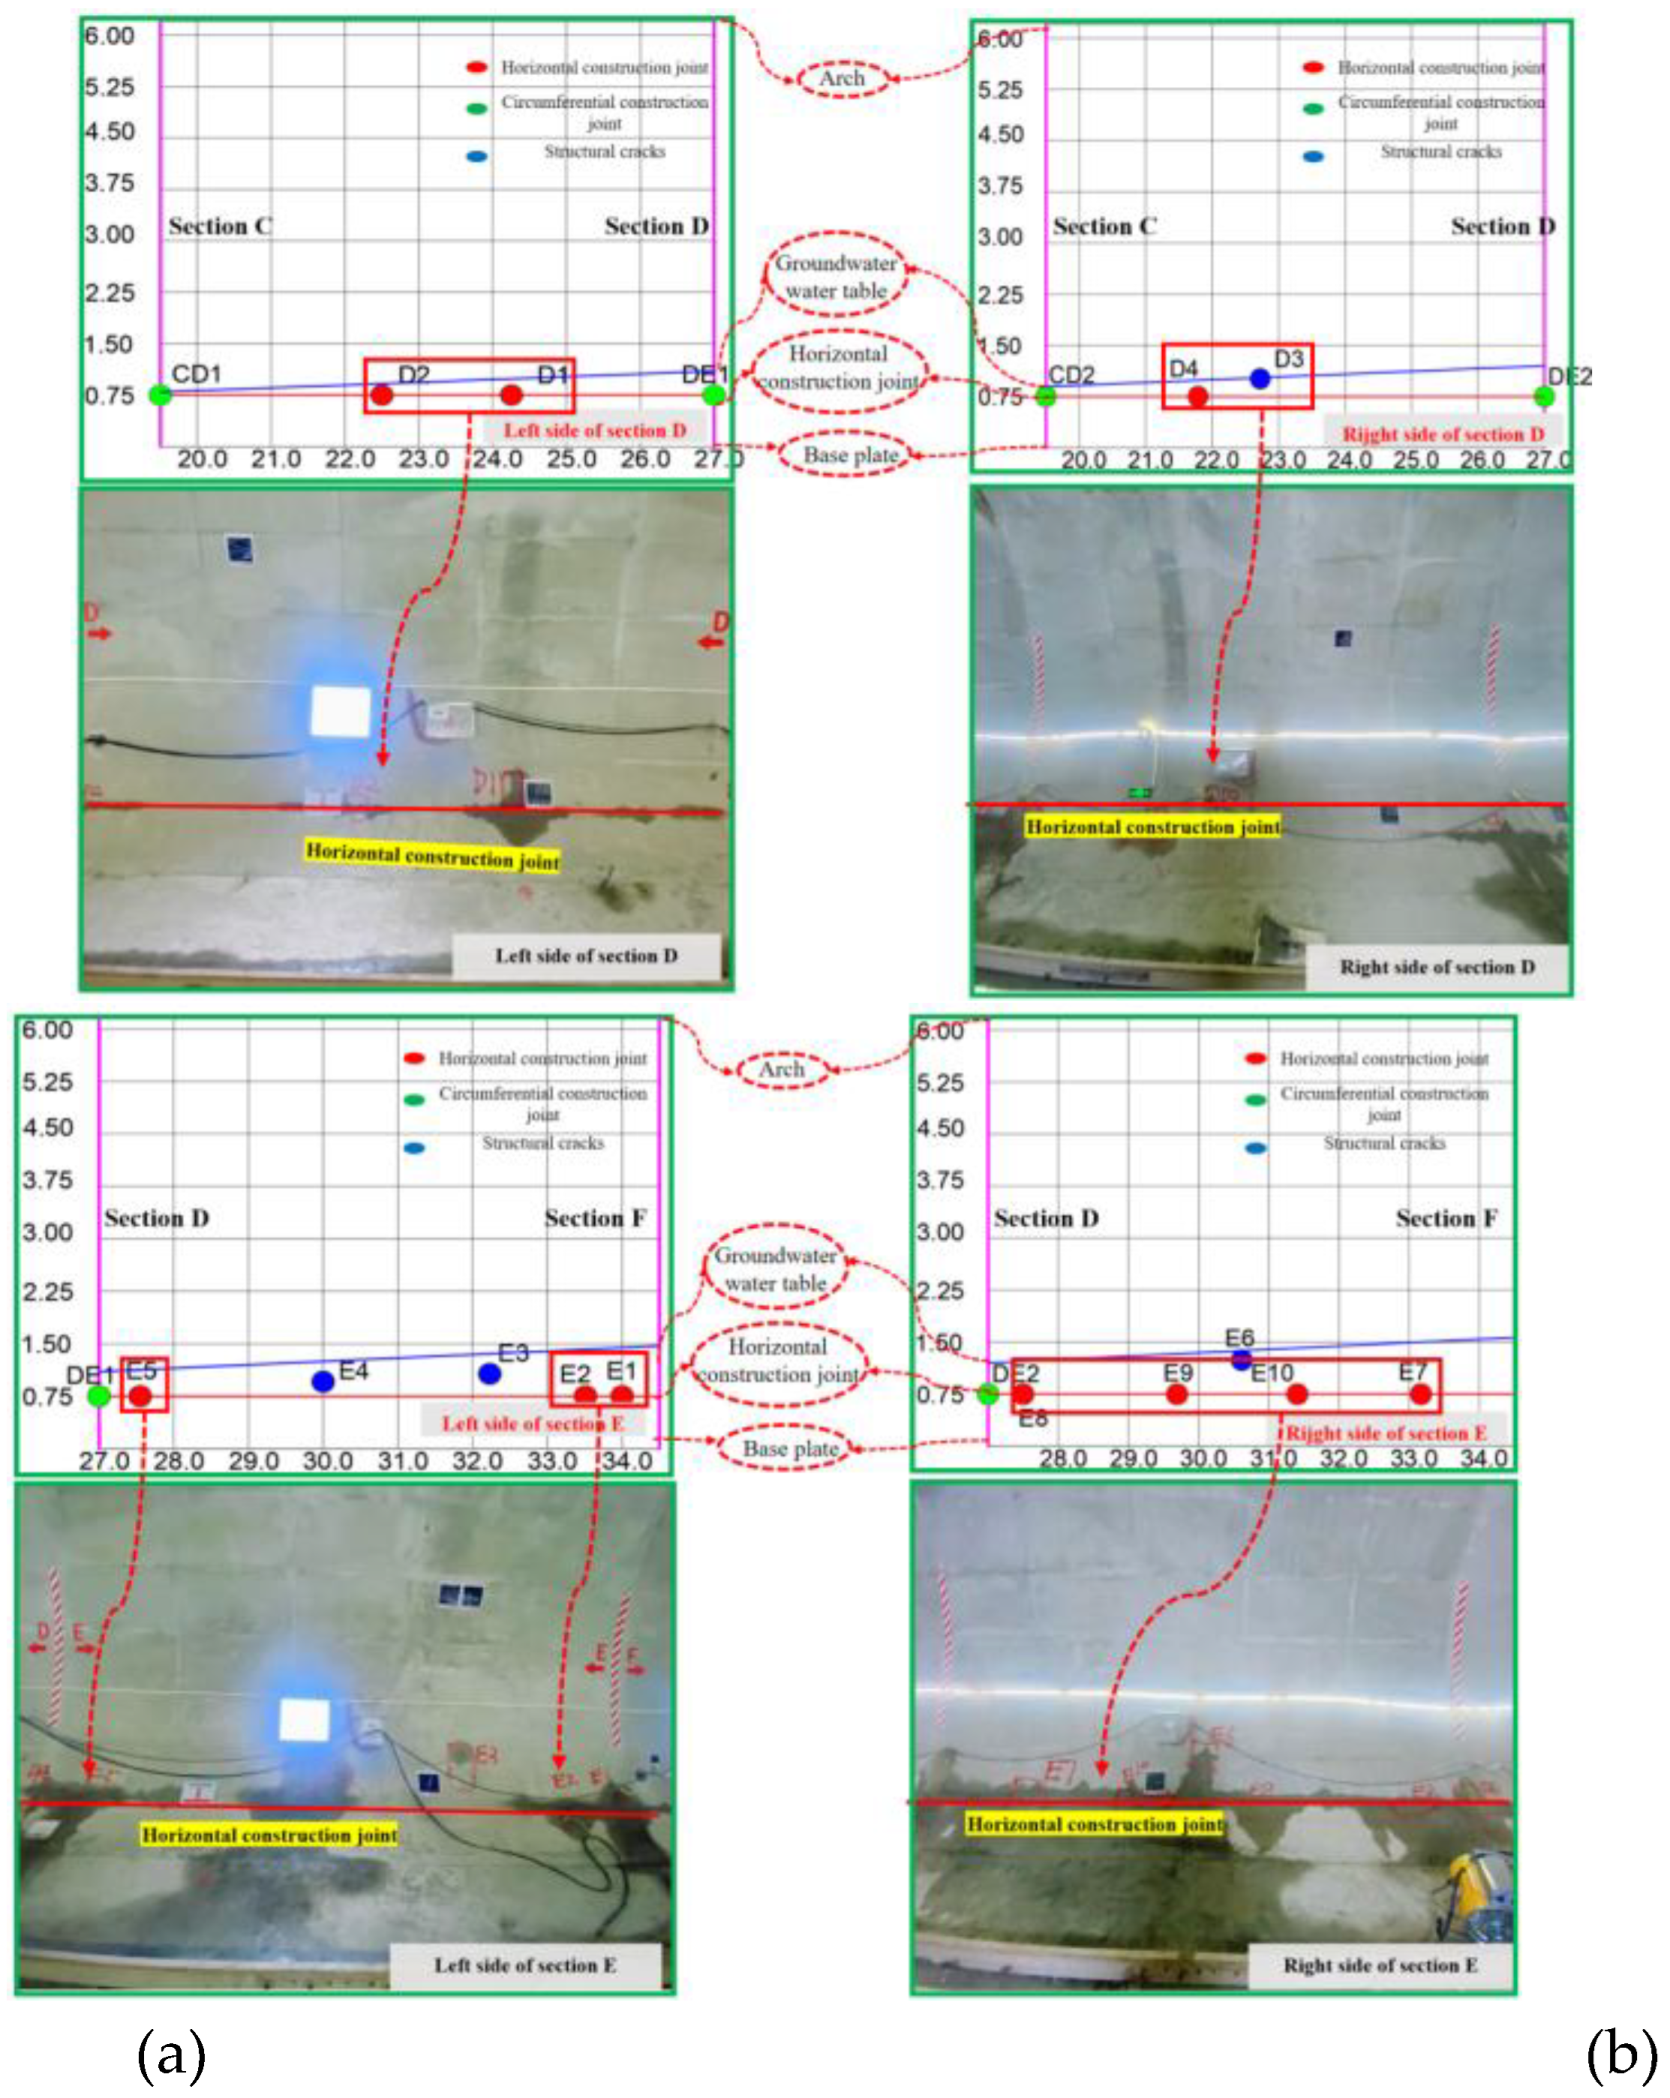
Figure 12.
Selection of materials for A~C section.
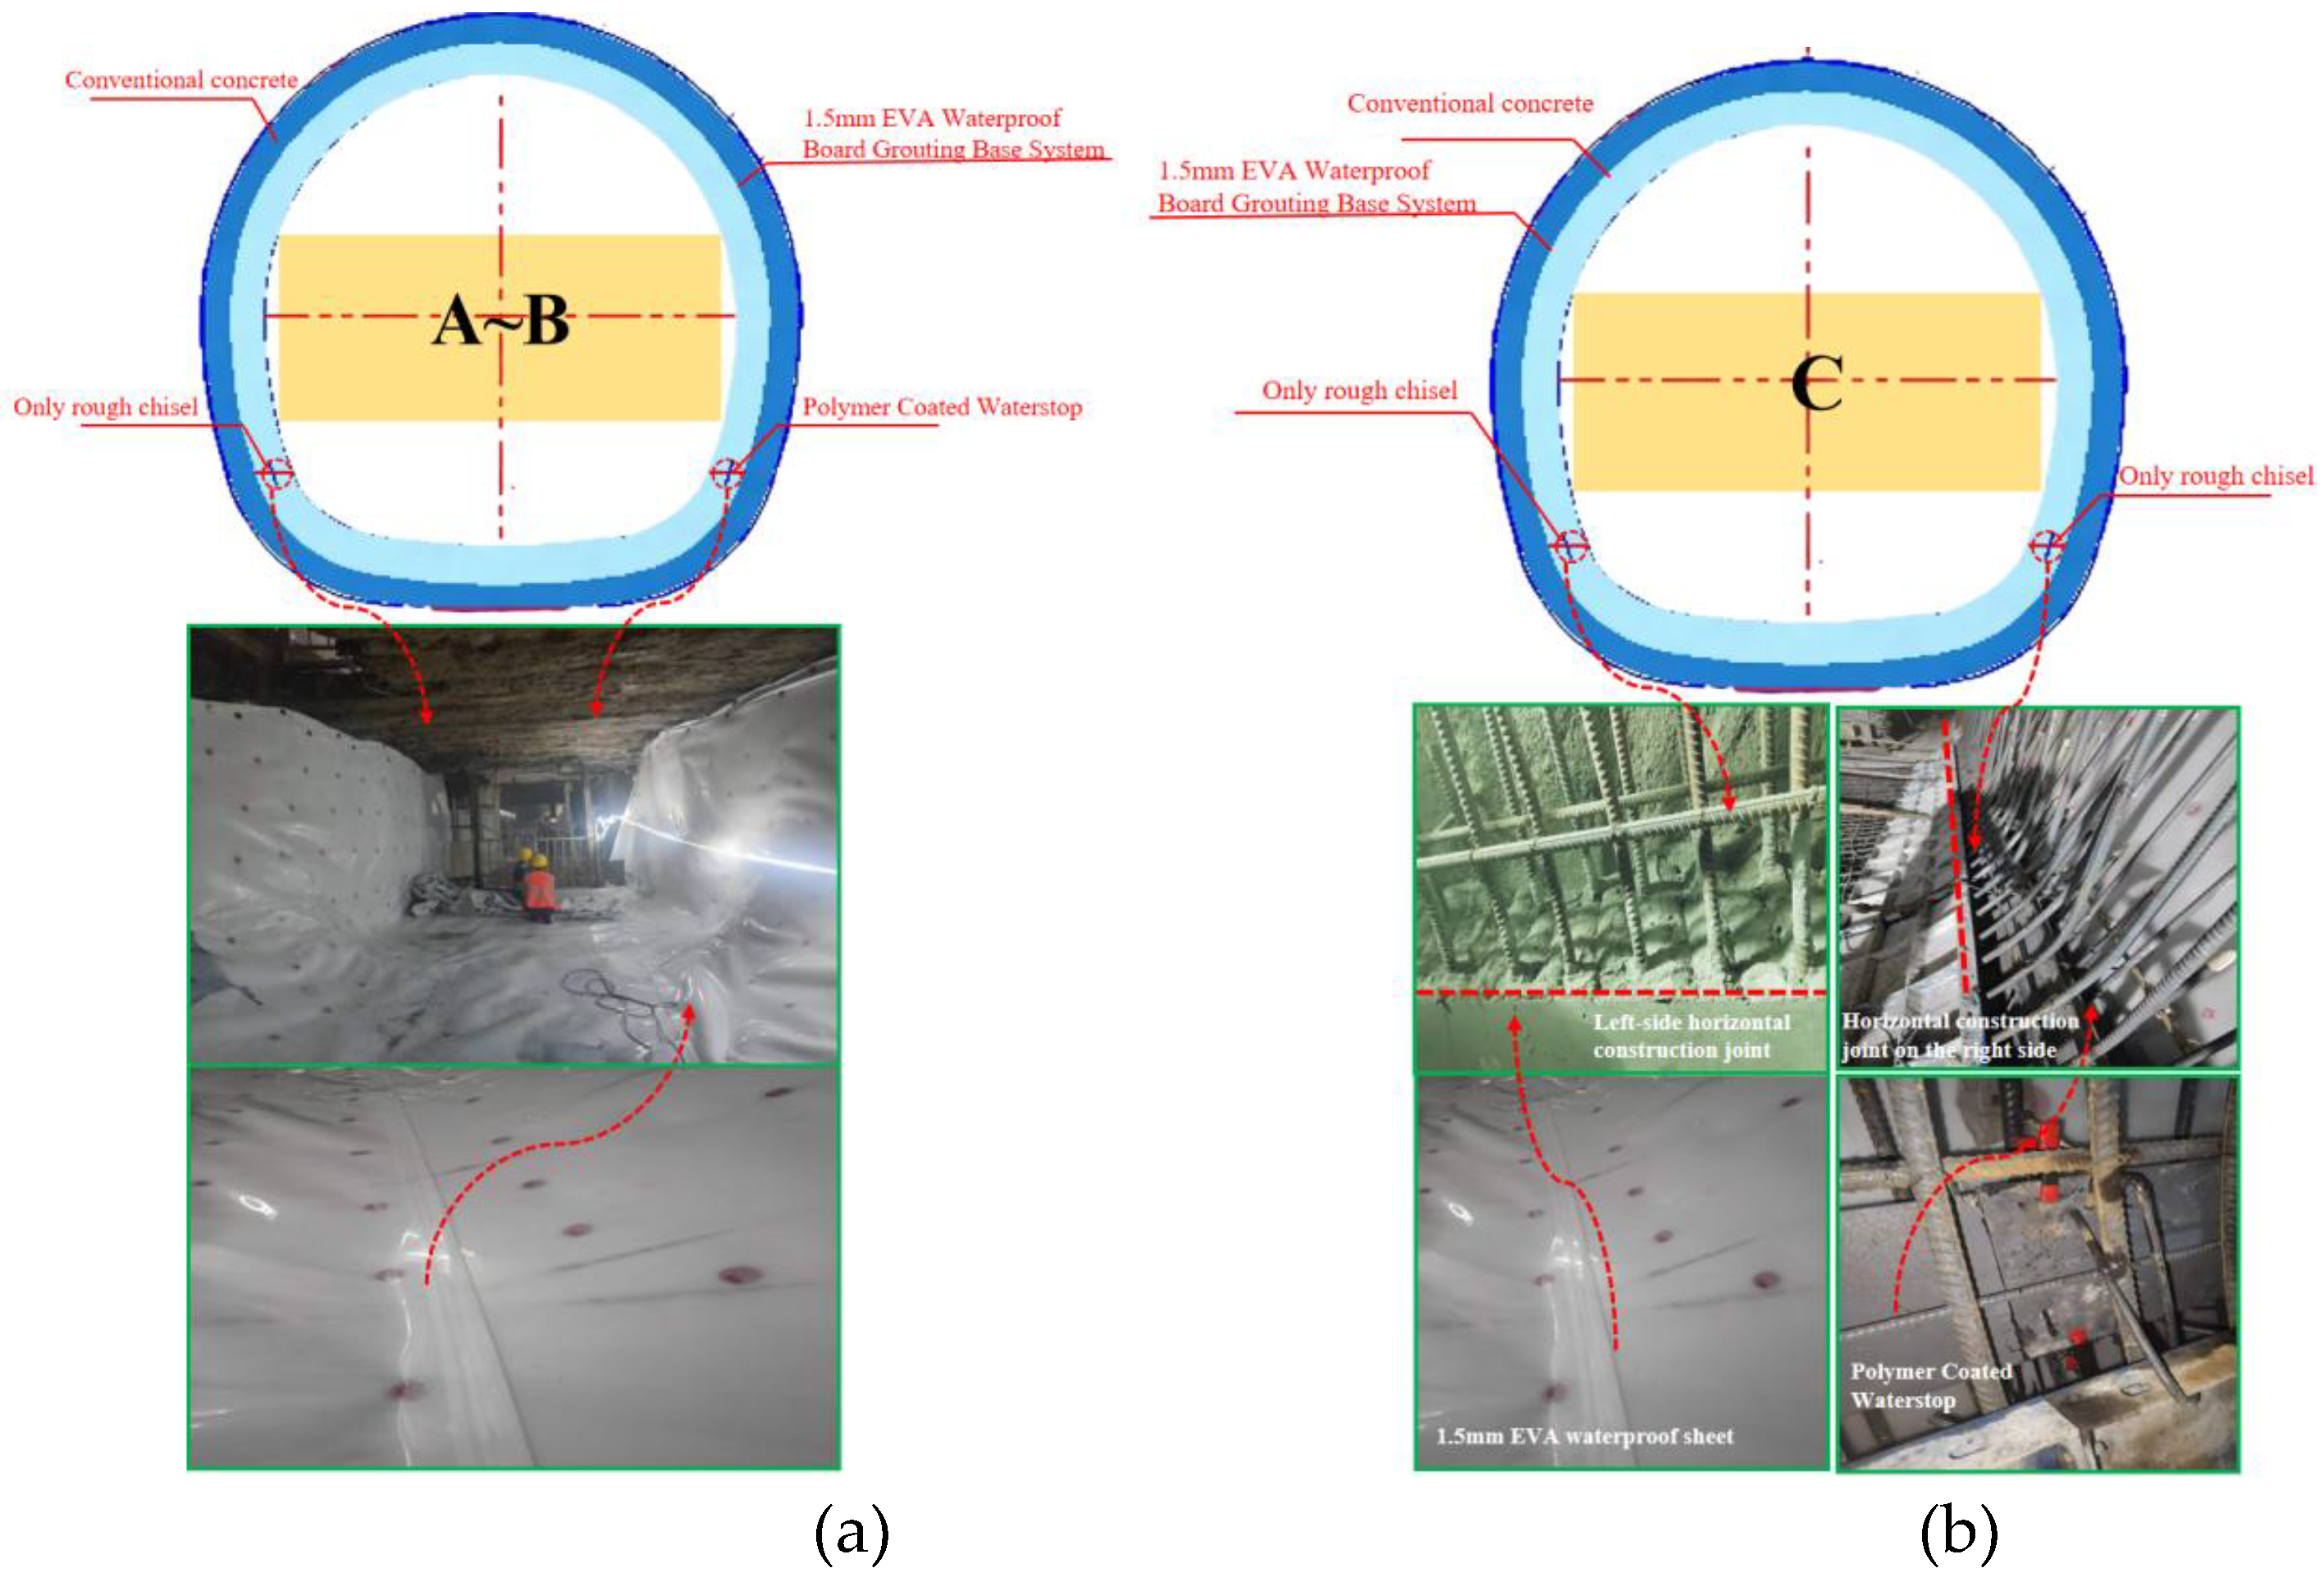
Figure 13.
Selection of materials for A~C section.
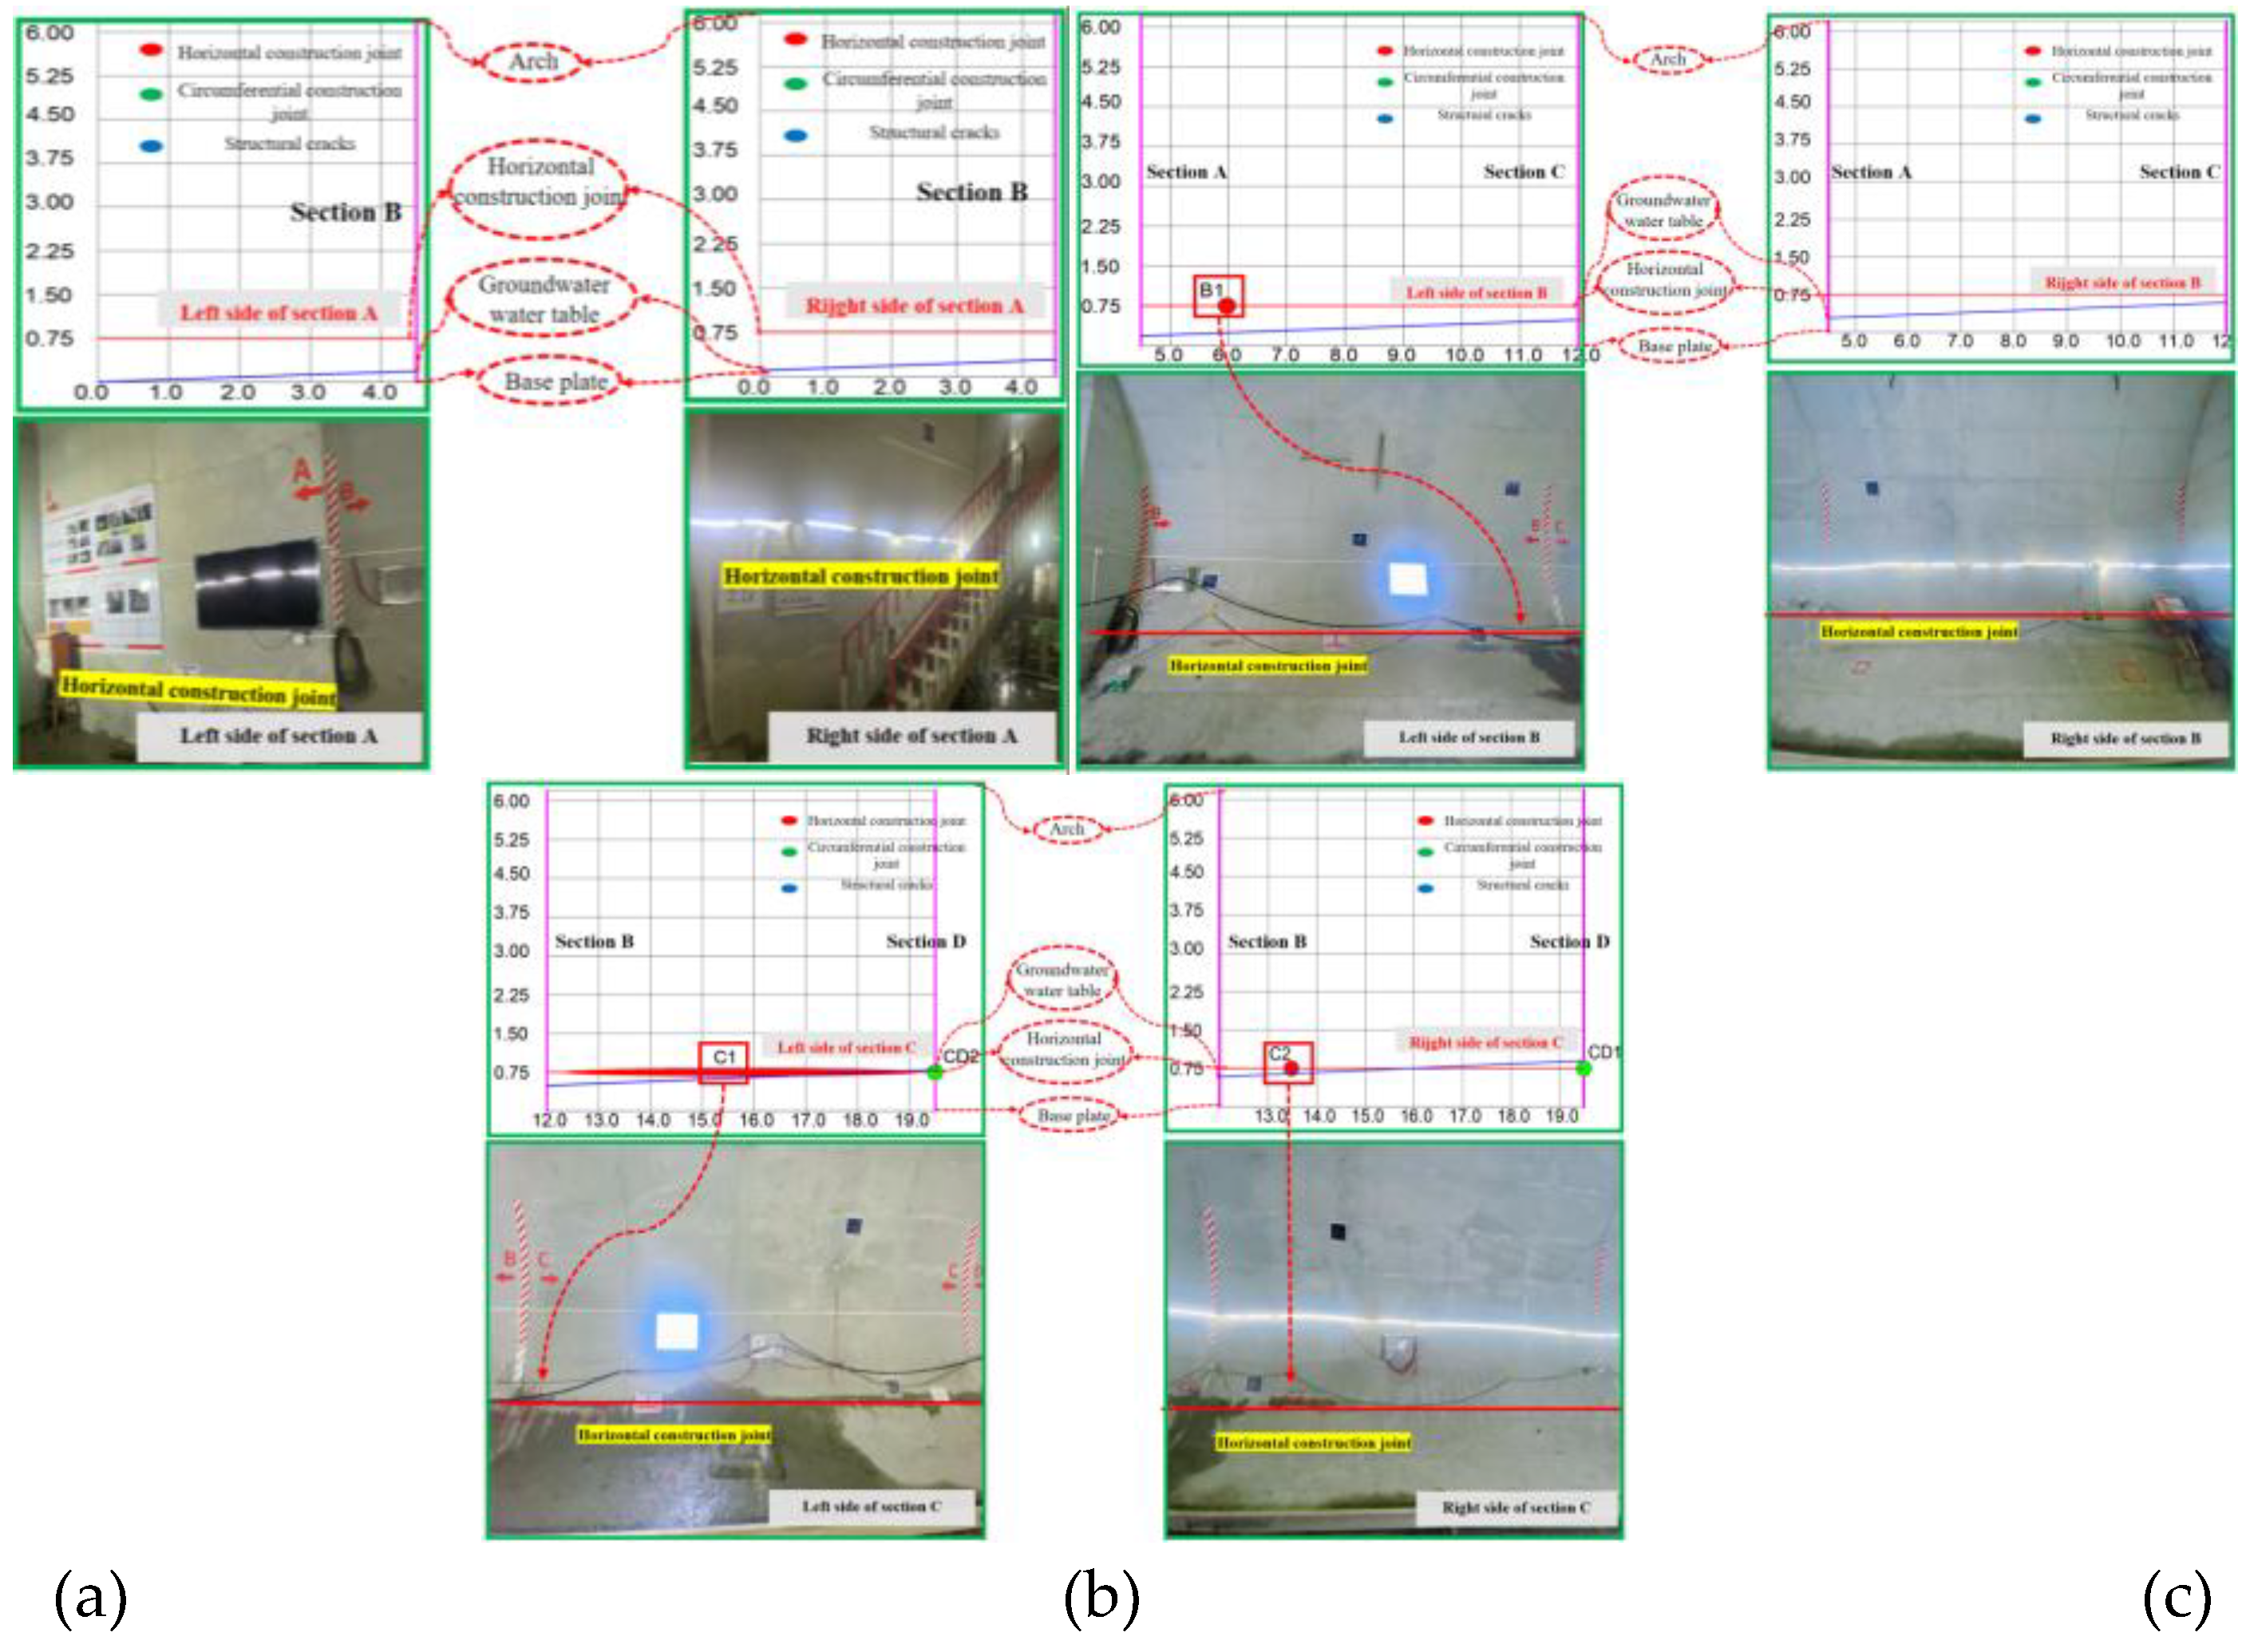
Figure 14.
Finite element model.
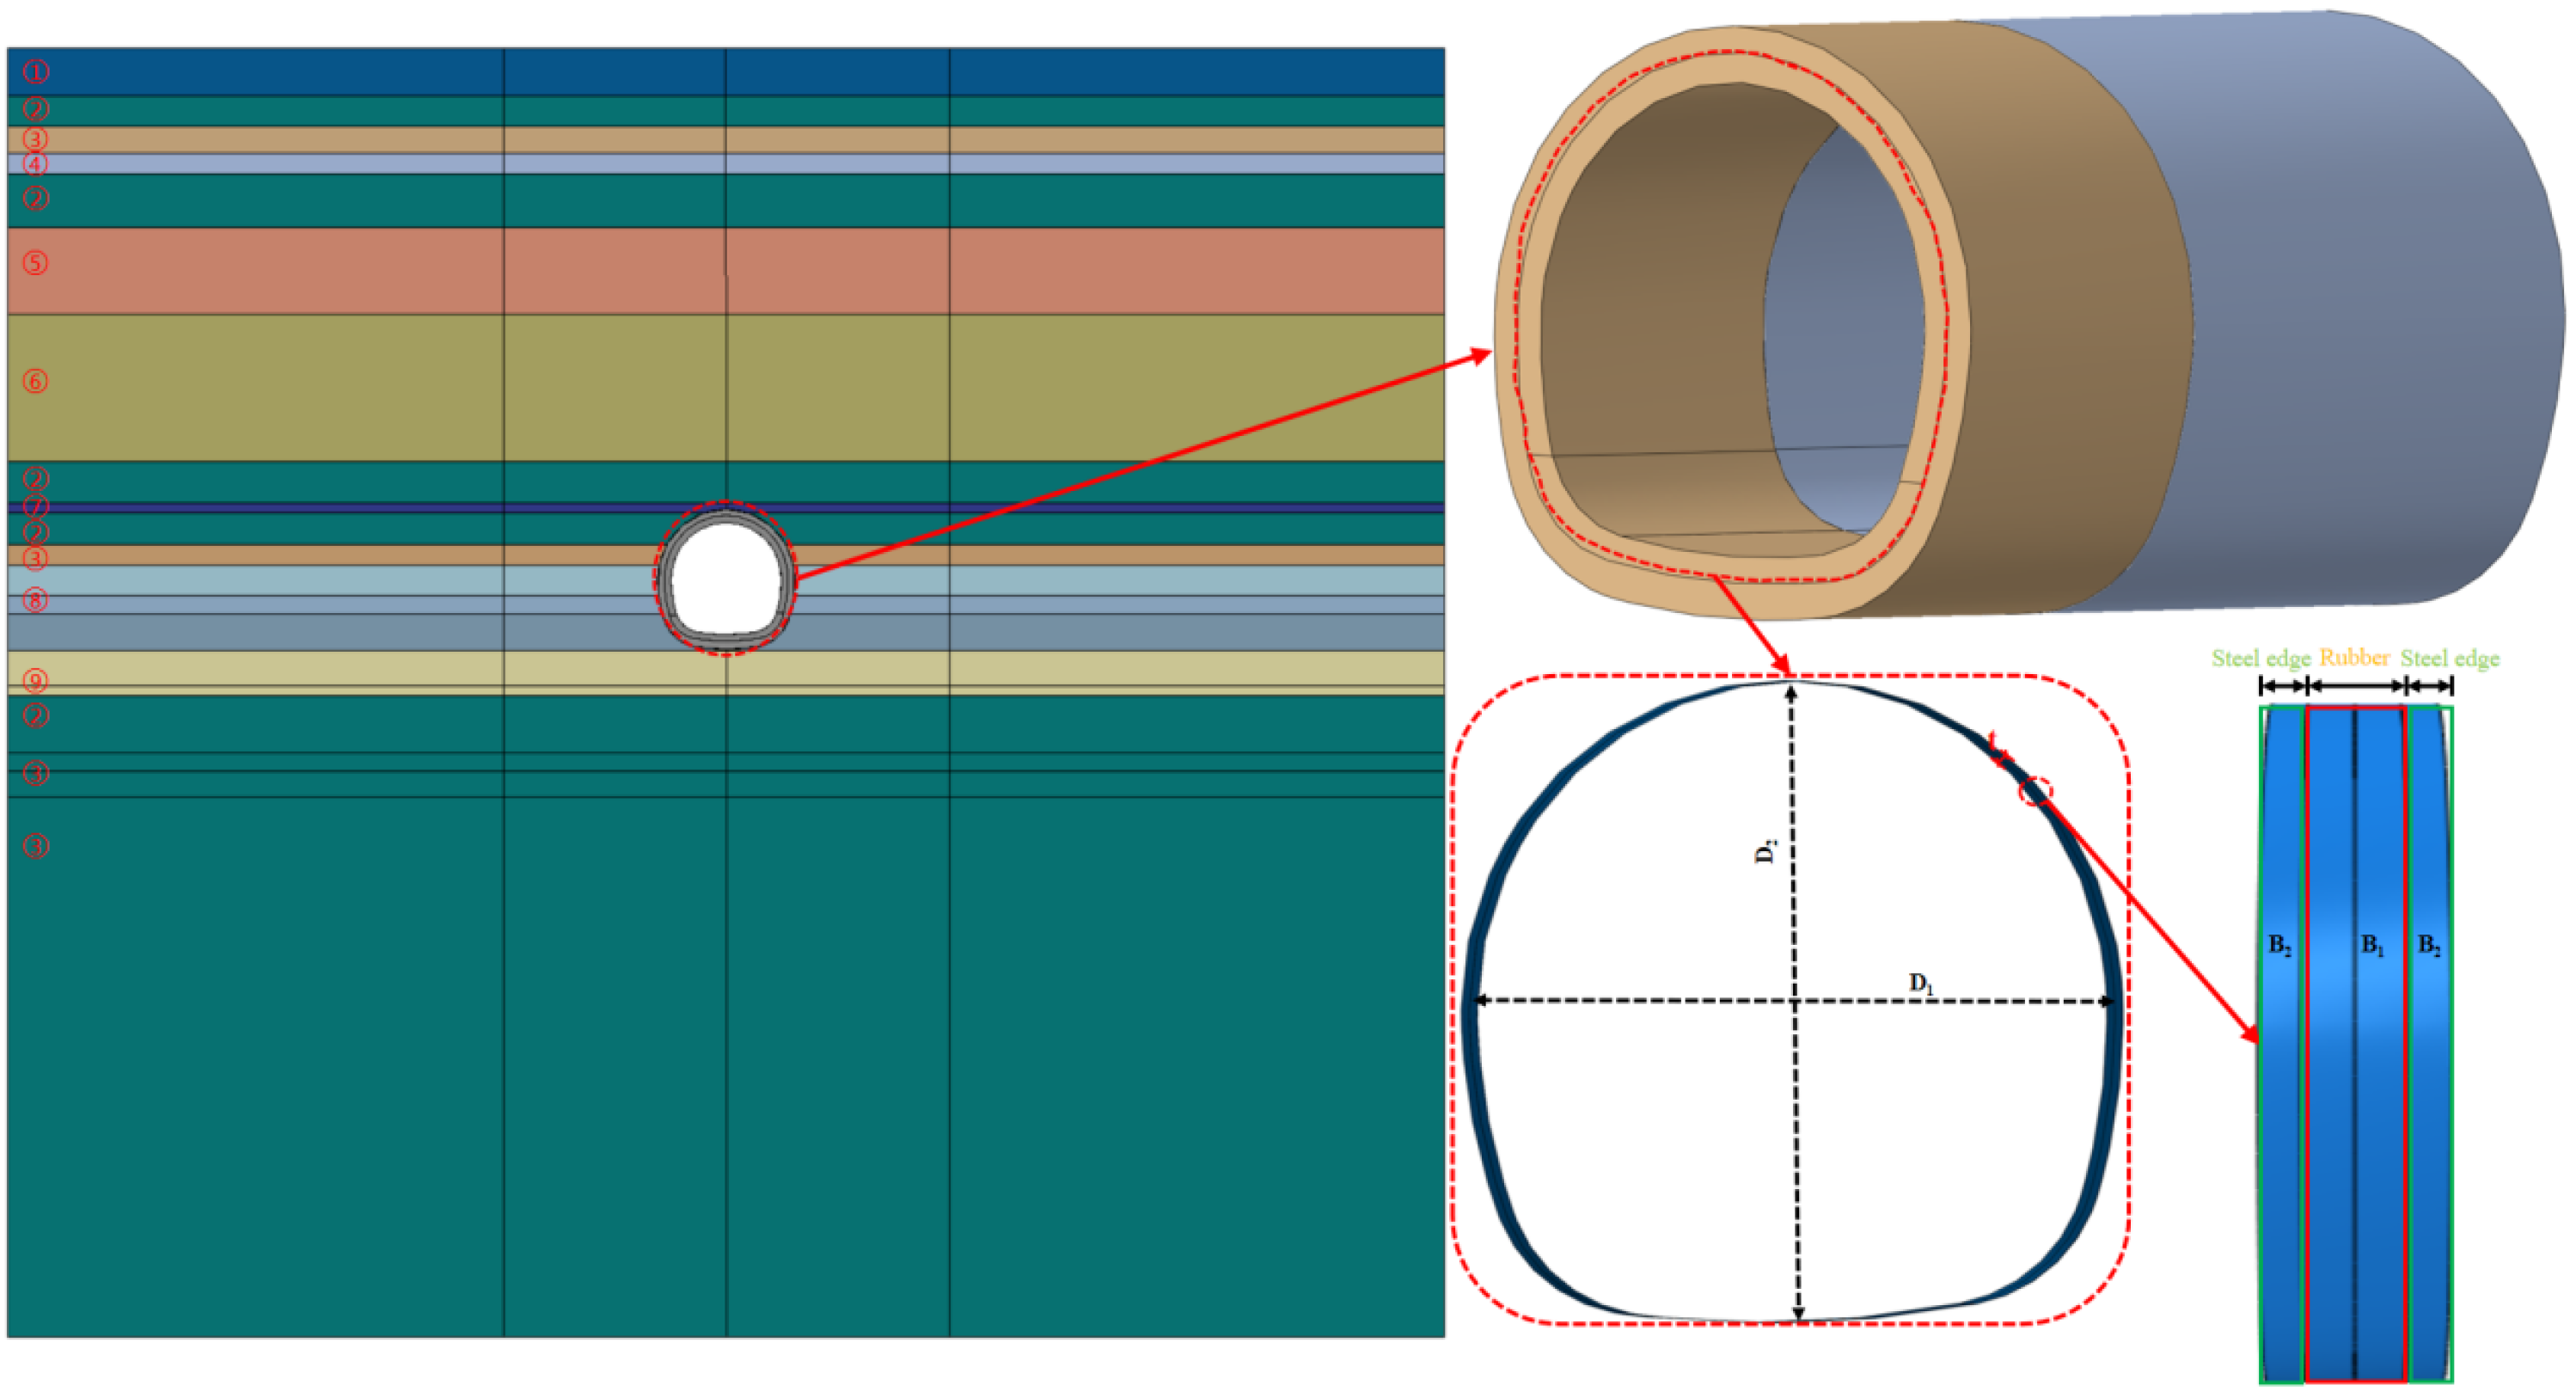
Figure 15.
Comparison of Model Validation Results.
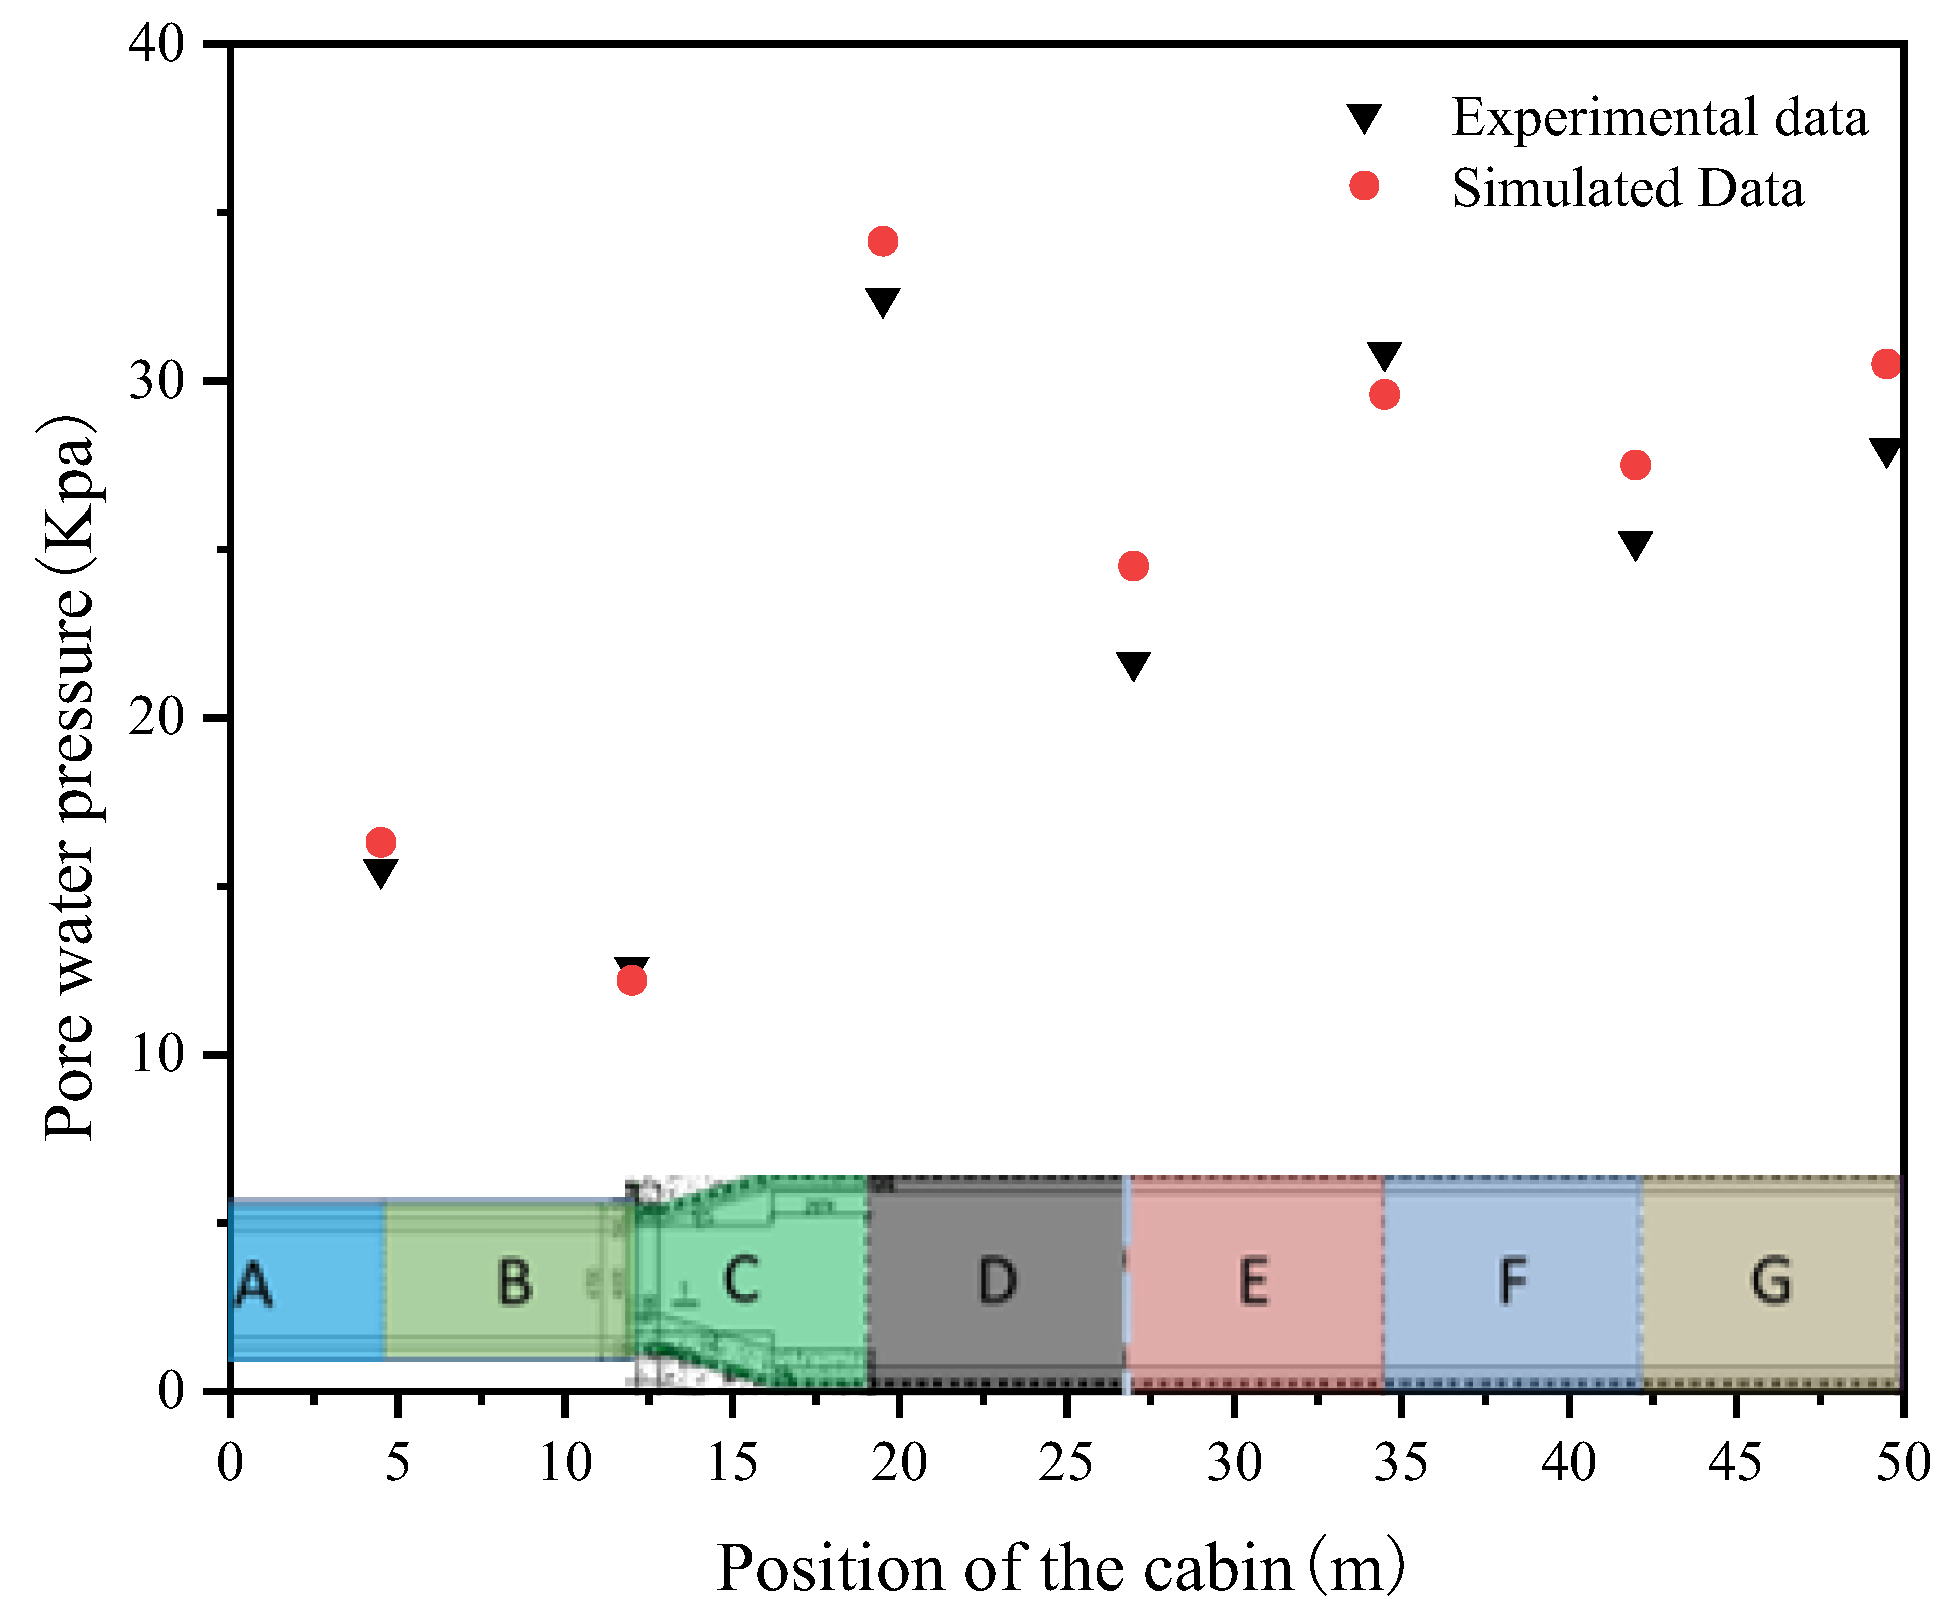
Figure 16.
Distribution of monitoring points with circular cross-sections.
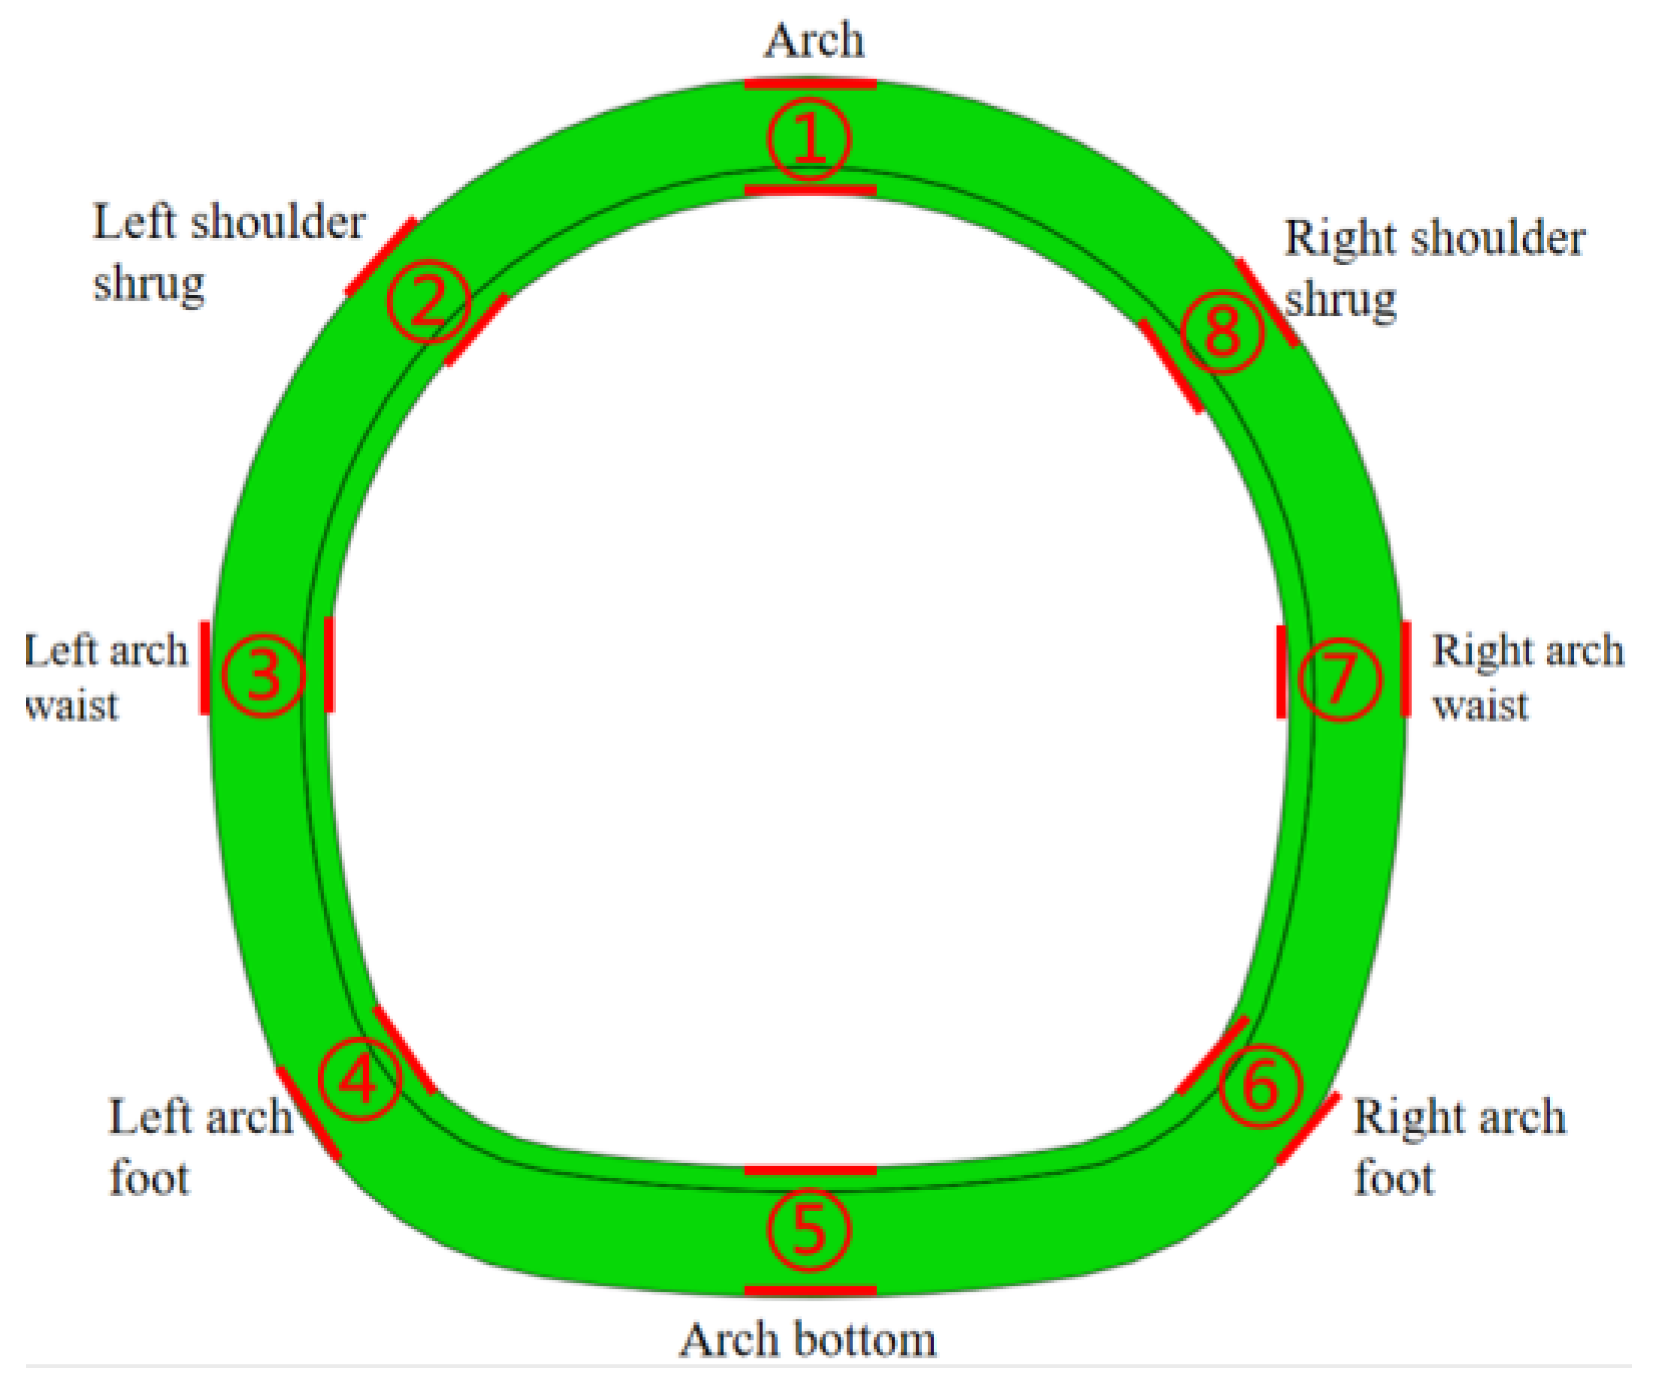
Figure 17.
Distribution of contact stress under different contact displacements.
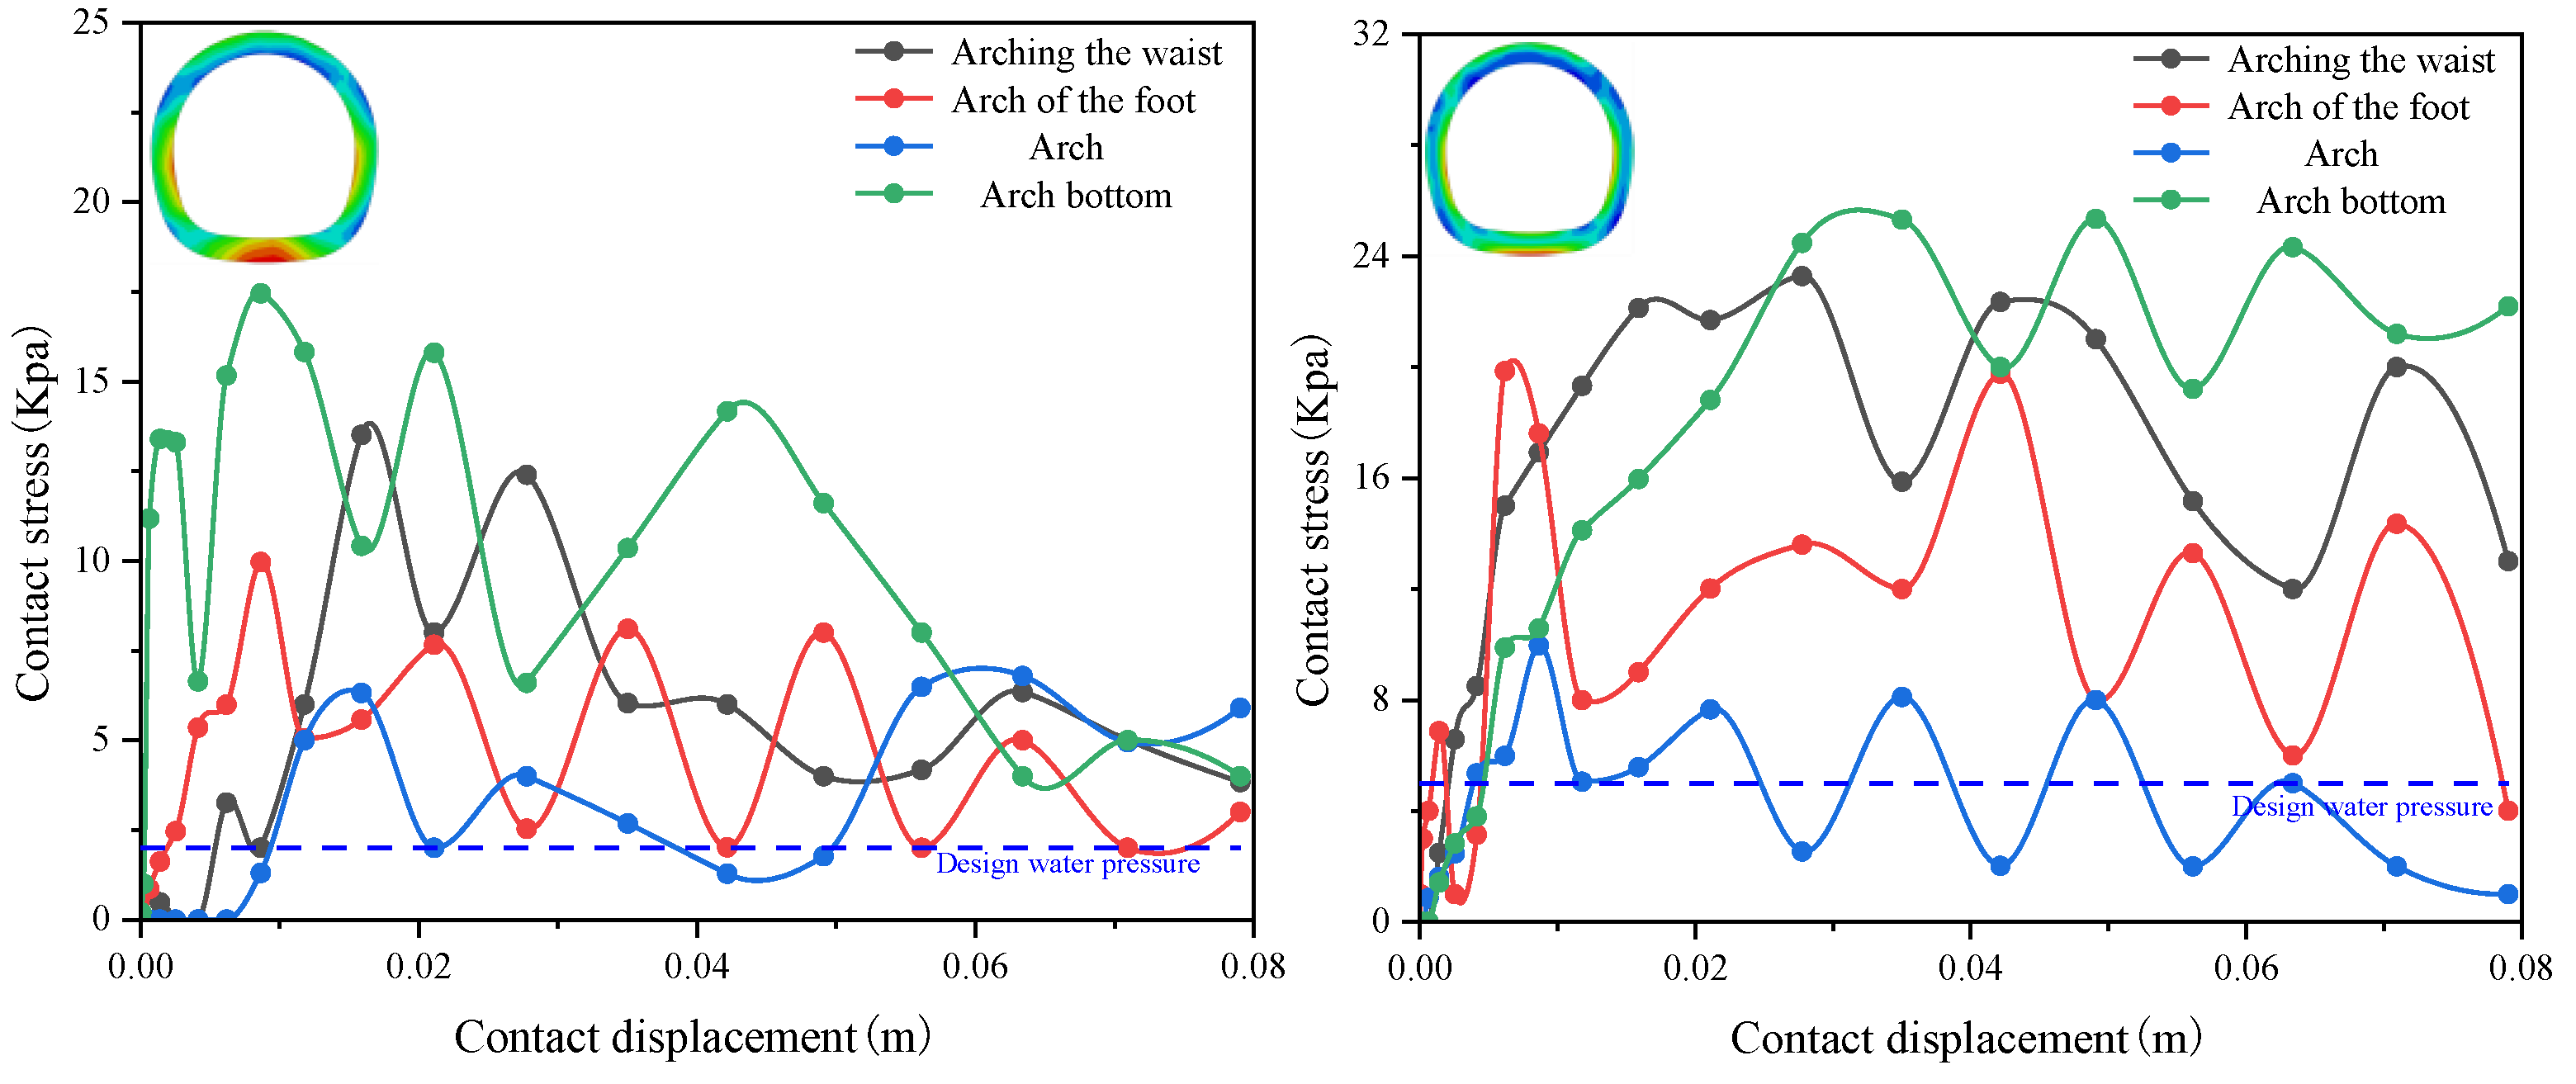
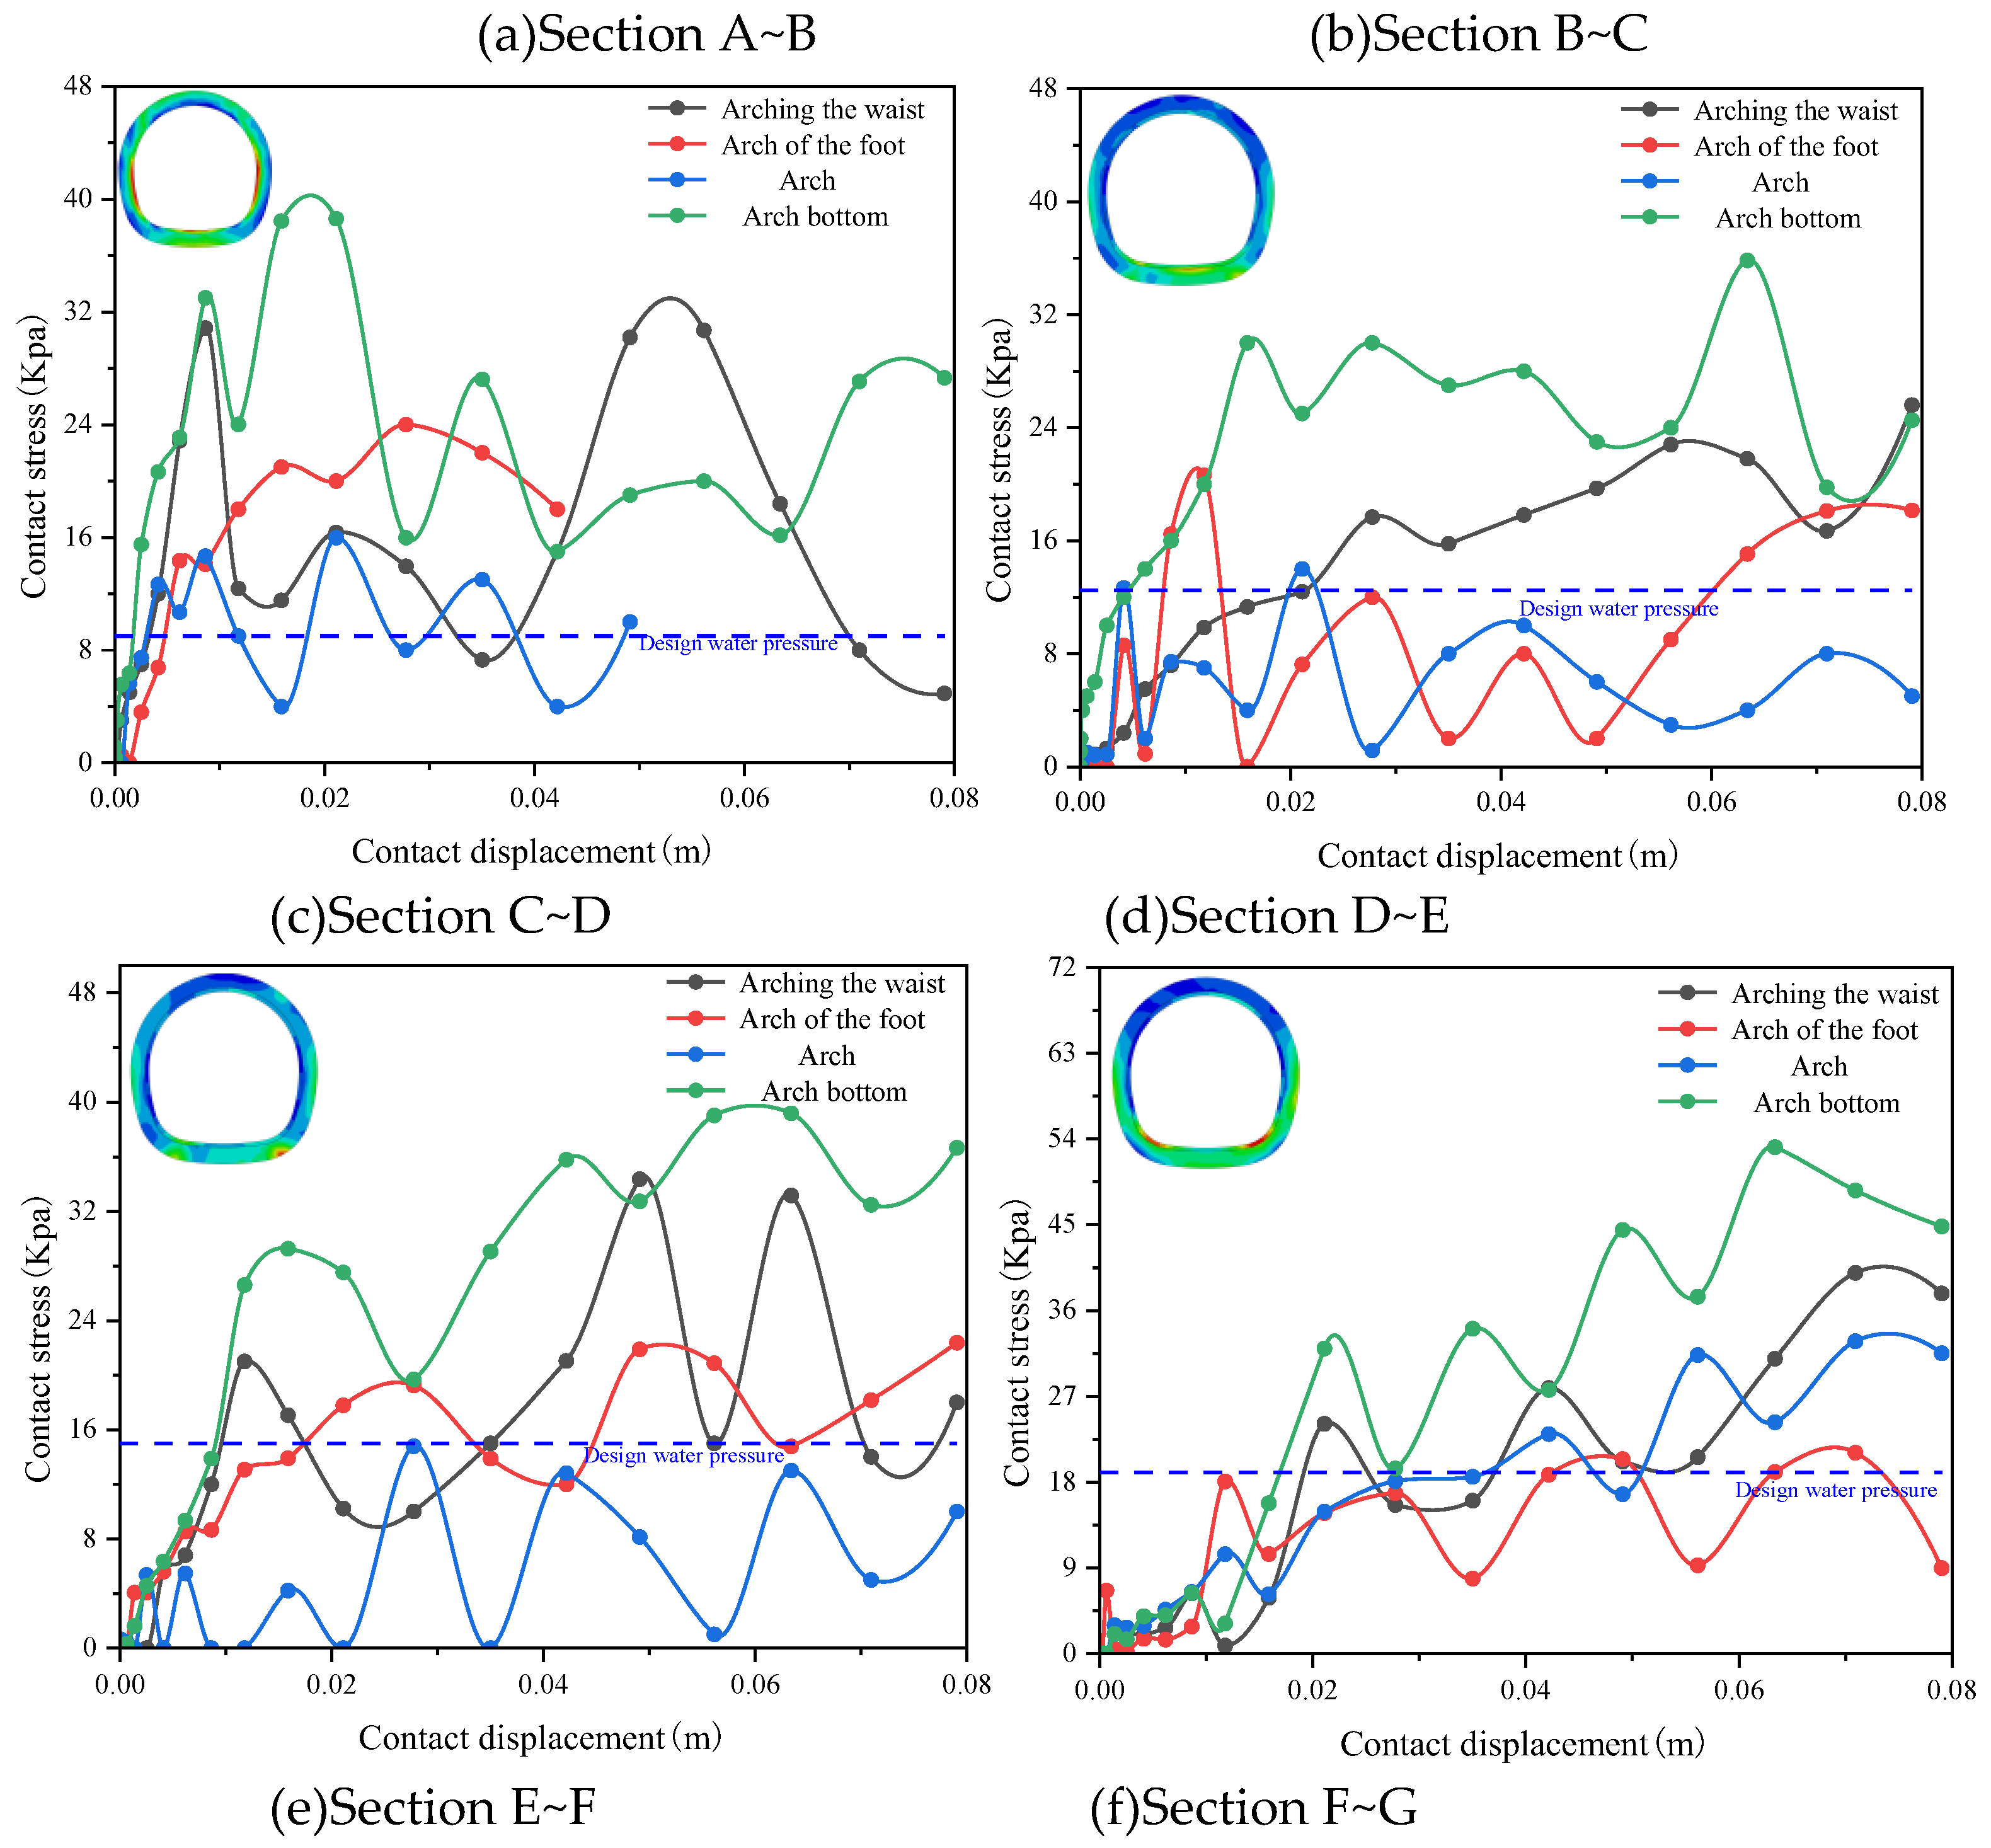

Table 1.
Workload Statistics of Monitoring Point Deployment.
| Monitoring project | Monitoring equipment | Arrangement location | Number of points | Number of points |
| Water pressure | Water pressure gauge | Near expansion joints and circumferential construction joints | 72 | Monitoring of water pressure around the lining structure and construction joint areas |
| Initial support structure arch crown settlement | Electronic level/total station | Near expansion joints and circumferential construction joints | 7 | Initial support structure arch crown settlement |
| Convergence of the initial support structure | Total Station | Near expansion joints and circumferential construction joints | 14 | Convergence of the initial support structure |
| Ground subsidence | Electronic level | Near expansion joints and circumferential construction joints | 35 | Surface settlement above the tunnel |
Table 2.
Soil Layer Information.
| Soil Layer Number | Soil layer name | Severe/γ | E/Kpa | Poisson's ratio/μ |
| ① | Miscellaneous fill soil | 190 | 2000 | 0.3 |
| ② | Clayey silt | 192 | 2200 | 0.4 |
| ③ | Powdery clay | 200 | 850 | 0.43 |
| ④ | Sandy silt | 192 | 3000 | 0.43 |
| ⑤ | Silt | Fine Sand | 202 | 18000 | 0.43 |
| ⑥ | Rounded gravel and cobblestones | 215 | 15000 | 0.43 |
| ⑦ | clay | 192 | 3000 | 0.4 |
| ⑧ | Fine sand | Medium sand | 212 | 6000 | 0.4 |
| ⑨ | Mao Stone | 222 | 4500 | 0.4 |
Disclaimer/Publisher’s Note: The statements, opinions and data contained in all publications are solely those of the individual author(s) and contributor(s) and not of MDPI and/or the editor(s). MDPI and/or the editor(s) disclaim responsibility for any injury to people or property resulting from any ideas, methods, instructions or products referred to in the content. |
© 2025 by the authors. Licensee MDPI, Basel, Switzerland. This article is an open access article distributed under the terms and conditions of the Creative Commons Attribution (CC BY) license (http://creativecommons.org/licenses/by/4.0/).
Copyright: This open access article is published under a Creative Commons CC BY 4.0 license, which permit the free download, distribution, and reuse, provided that the author and preprint are cited in any reuse.


