Submitted:
26 April 2025
Posted:
27 April 2025
You are already at the latest version
Abstract
In deep-buried soil tunnels with poor stability of surrounding rock, there are risks of collapse and large deformation during construction. The scientific selection of construction methods is of vital importance for ensuring the structural safety. Taking a certain tunnel in Baotai District, Yan'an City, Shaanxi Province as the engineering background, this paper conducts a comparative analysis of the response characteristics of the three-step method, the three-step temporary inverted arch method, the double-side wall pilot tunnel method and the CD method in terms of deformation of surrounding rock and support stress through numerical simulation combined with on-site monitoring. The on-site monitoring data effectively validates the reliability of the numerical model. The results show that the double-side wall pilot tunnel method has the most significant deformation control effect in key parts, followed by the CD method and the three-step temporary inverted arch method. The differences in deformation amplitude among the three methods are not significant. Among all the construction schemes, the maximum principal stress is concentrated at the arch bottom. Among them, the three-step temporary inverted arch method generates the lowest stress level and shows a better stress state. Except for the three-step method which has exceeded the limit of anchor bolt stress, the other methods all meet the requirements of design specifications. Considering factors such as overall performance, construction organization efficiency and economy, the three-step temporary inverted arch method has more advantages in overall performance and is suitable for promotion and application in the construction of deep-buried tunnels under similar geological conditions. In addition, the trend of numerical simulation and measured data is basically consistent, further verifying the applicability and guiding value of the model in tunnel design and optimization.
Keywords:
deeply buried soil tunnel
; construction methods
; numerical simulation
; field monitoring
1. Introduction
With the continuous advancement of underground engineering construction, deep-buried soil tunnels have been widely applied in various fields such as transportation, municipal services, and water conservancy. However, such tunnels are often located in areas with high ground stress, have complex geological structures, and the surrounding rock is mostly weak rock layers. During the construction process, problems such as large deformation, failure of surrounding rock, and failure of the support system are prone to occur, posing severe challenges to the project[1,2]. To ensure the stability of the tunnel structure and control the construction cost, it is necessary to scientifically select appropriate construction methods based on the actual geological conditions. Different excavation methods will directly affect the stability of the surrounding rock and the safety of the support system, so it is of great significance to reasonably determine the construction method for the safe and efficient implementation of tunnel projects [3,4,5,6].
In actual engineering, various construction methods such as New Austrian Tunnelling Method (NATM), Full Face Method, Double-side Wall Pilot Tunnel Method, Small Shield Tunneling Method, and Shield Pipe Pre-support Method have been widely adopted. These methods show different advantages in controlling the deformation of surrounding rock, suppressing surface subsidence, and reducing the stress on the support structure. For example, Sun et al. [7] studied the stress evolution of surrounding rock and support structure in ultra-large section tunnels based on different construction techniques; Huang et al. [8] compared the applicability of various construction methods and proposed corresponding optimization suggestions; Han et al. [9]evaluated the effect of various methods on controlling surface subsidence through on-site observation.
In soft or water-rich strata, the response of surrounding rock is more complex, and the selection of construction methods is particularly crucial. Zhao et al. [10] proposed a double-layer pre-support system to enhance the stability of construction in the case of underpassing construction in water-rich sand layers; Chen et al. [11] and Zeng et al. [12]respectively explored the mechanical response characteristics and support performance of soft rock strata under construction disturbance through numerical analysis and on-site monitoring.
For deep-buried tunnels with complex structural conditions, such as shallow burial, ultra-large section, small net distance, or bifurcated structures, scholars have also conducted extensive empirical research and simulation analysis to optimize construction organization and effectively control structural deformation. Wu et al.[13] discussed the optimization of construction sequence for double-arch tunnels under asymmetric loads; Wu et al. [14] analyzed the stress and deformation laws of surrounding rock in bifurcated tunnels during construction; Zhang et al. [15] improved the construction stability of shallow-buried large-section tunnels by changing the construction method; Li et al. [16]optimized the excavation steps of rectangular tunnels by using the pre-digging tunnel method first.
Meanwhile, with the development of construction technology, new means such as numerical simulation, real-time monitoring, and biomimetic design have been widely introduced into tunnel construction research. Song et al. [17] and Zhanping Song et al. [18] emphasized the necessity of dynamic adjustment and monitoring feedback during construction; Tang et al. [19]optimized the construction process of ultra-large section tunnels through three-dimensional modeling, improving the safety and efficiency of the project.
Under specific complex geological conditions, such as high ground stress environments, interlayer of soft and hard rocks, or large longitudinal slopes, the construction difficulty further increases. In response to this, Fang et al. [20] proposed targeted construction techniques and deformation control measures, providing references for similar conditions.
In conclusion, the research on construction methods for deep-buried soil tunnels has achieved relatively rich results. Various methods have shown different adaptability and technical advantages in dealing with complex geological conditions. However, there are still certain research gaps regarding systematic comparison of construction methods, evaluation standards for applicability, and mechanism for optimizing construction method selection. Therefore, this paper will systematically review the engineering characteristics and application scope of common construction methods in deep-buried soil tunnels based on existing literature results, deeply explore their impacts on the stability of surrounding rock, the safety of support structures, and construction efficiency, and thereby provide scientific reference for engineering practice.
2. Research background
The tunnel is located in the loess ridge and ridge-top area of Baotai District, Yan'an City, Shaanxi Province. The terrain slopes from east to west, with well-developed gullies and scattered loess plateaus. Most of the surface in the tunnel site is covered with thick loess, and the ground elevation ranges from 919 to 1139 meters, with a relative height difference of 50 to 150 meters. The tunnel is of a single-dike and double-track form, passing through Nan Gou, Yangzhuang Gou Village, Zhongju, Taoshu'an and Yangjiabian Village from east to west. It mainly passes through the upper Pleistocene wind-blown loess (Q3eol). The starting and ending mileage is DK353+842 to DK357+564.91, with a total length of 3722.91 meters, a maximum burial depth of about 171.33 meters, and a minimum burial depth of about 14.83 meters. The longitudinal slope is a single-sided slope of -11‰, and the exit is connected to the Yanhe Special Bridge. The structure adopts a composite lining, with the maximum net width of 11 meters, the net height of 9.8 meters, the net area of 71.15 square meters, and the maximum excavation section area exceeding 134 square meters. The specific structure is shown in Figure 1.
The structural deformation in the tunnel area is relatively weak, with no obvious folds or faults. The overall structure is a gently inclined single anticline structure, with an inclination angle usually ranging from 1 to 3 degrees, and the maximum being 5 to 7 degrees. Some gullies in the area have water, and the water level varies significantly with the seasons. On the left side of the tunnel entrance at DK353+800 to DK353+900, there is a landslide area, which is 79 meters long and 128 meters wide. There are cave dwellings at the tunnel exit, but they are uninhabited. When the surrounding rock conditions of deep-buried soil tunnels are poor, landslides and large deformations are prone to occur. The design drawings show that the geological complexity of the tunnel and the expected risk analysis table are as shown in Table 1.
Except for the Myeongdong section which adopts the open-cut method, the main construction of the tunnel includes: the three-step method for IV grade rock mass; for V grade rock mass, depending on the geological conditions, the three-step method, the three-step temporary inverted arch method, the double-side wall pilot tunnel method or the CD method (centralized excavation method) is adopted. The schematic diagram of the construction methods for V grade rock mass is shown in Figure 2. Due to the poor surrounding rock conditions during the tunnel excavation process, it is prone to collapse or large deformation. Therefore, before construction, numerical simulation software is used to compare the construction methods for V grade rock mass. The appropriate construction method is selected for construction, and the support parameters are further optimized to provide effective technical guidance for tunnel construction. The applicable conditions, advantages and limitations of the three-step method, the three-step temporary inverted arch method, the double-side wall pilot tunnel method and the CD method are summarized and listed in Table 2.
3. Numerical Simulation for Deformation Control of Surrounding Rock in Tunnels
3.1. Model Construction
Taking the DK357+250 section of a deep soil tunnel buried deep in Baotai District, Yan'an City, Shaanxi Province as the research object, this paper analyzes the influence of four construction methods, namely the three-step method, the three-step temporary inverted arch method, the double-side wall pilot tunnel method and the CD method, on the stability of the surrounding rock. The aim is to determine the construction scheme suitable for V-level surrounding rock. The tunnel section is 91m deep. In the model coordinate system, the y-axis represents the tunnel excavation direction, and the x-axis and z-axis are the horizontal and vertical coordinates. According to the Saint-Venant principle, in order to avoid the influence of boundary effects, the boundaries of each direction of the model are set as 3 to 5 times the tunnel diameter, and the overall size is 100m (width) x 100m (height) x 60m (length). The top of the model is the ground surface, and the tunnel arch top is 50m away from the top of the model. To achieve the total burial depth of 91m, the remaining 41m overburden soil layer is applied to the top of the model in the form of uniformly distributed load to accurately reflect the influence of the self-weight stress of the overburden soil layer on the tunnel structure. The size diagram of the model is shown in Figure 3.
During the above calculation process, the initial lining of the tunnel adopts a thickness of 22 cm C25 sprayed concrete, H180 grid steel frame and ∅8 steel mesh; the anchor rods are all 3.5 m in length and Φ22 hollow grouting anchor rods; the advance small pipe is all 42 mm in diameter and 3.5 m in length.
3.2. Model Calculation Parameters
During the research process, the elastic model was adopted for the supporting structure, while the Mohr-Coulomb model was used to simulate the tunnel excavation process for the rock and soil materials. The 3D solid elements were employed to simulate the surrounding rock, and the 2D plate elements were used for the initial and temporary supports. The 1D embedded truss elements were adopted to simulate the anchor rods, and the 1D embedded beam elements were used for the advance small pipe. The mechanical parameters of the surrounding rock and the supporting materials are shown in Table 3.
The initial support structure of the tunnel is designed based on the equivalent method. According to Formula (1), the elastic modulus of the steel mesh is converted to that of the concrete. The converted data are shown in Table 3.
In the formula: - the elastic modulus of the concrete after conversion; - the elastic modulus of the original concrete; - the cross-sectional area of the steel mesh; - the elastic modulus of the steel mesh; - the cross-sectional area of the concrete.
The elastic modulus of the advance small-diameter pipe is converted to the equivalent value by using Equation (2), and the converted data are presented in Table3.
In the formula: - the converted elastic modulus of the advance small pipe; - the elastic modulus of the slurry inside the pipe; - the moment of inertia of the slurry inside the advance small pipe; - the elastic modulus of the advance small pipe; - the moment of inertia of the advance small pipe.
3.3. Simulation of Excavation Steps
The construction steps of the three-step method, the three-step temporary inverted arch method, the double-side wall pilot tunnel method and the CD method were transformed into the excavation steps in the numerical model, and the same tunnel model was compared and analyzed. To reduce the influence of the difference in excavation dimensions, the excavation advance length of the four methods was uniformly set to 1.5m, following the short advance length principle of the New Austrian Tunneling Method. Figure 4 shows the tunnel excavation model diagrams of the four construction methods.
4. Analysis of Numerical Calculation Results
In order to study the deformation and stress distribution of tunnel surrounding rock under different construction methods, the key parts of the tunnel, such as the arch top, arch waist and arch bottom, were analyzed in detail. These parts are usually the weak links of the tunnel structure and are most susceptible to the influence of construction mechanics and the deformation of surrounding rock. Through the analysis of these parts, it is possible to deeply understand the influence of different construction methods on the deformation and stress changes of the surrounding rock, and provide theoretical support for on-site monitoring.
4.1. Analysis of Surrounding Rock Displacement
Curves depicting the changes in the settlement of the arch top, the uplift of the arch bottom, the horizontal displacements of the left and right arch waists, and the excavation length under the four construction methods were drawn, as shown in Figure 5.
According to Figure 5, for the arch roof settlement, the settlement of the arch roof in the initial excavation stage of the four construction methods all increased rapidly, among which the settlement rate of the three-step method was the highest. With the increase of the excavation length, the settlement growth of each method tended to stabilize, indicating that the supporting structure gradually came into play and effectively suppressed deformation. The maximum settlement of the three-step method was -68.33mm, that of the three-step temporary inverted arch method was -38.92mm, that of the double-side wall pilot tunnel method was -36.25mm, and that of the CD method was -37.12mm. Due to the large excavation area of the three-step method, the support was difficult to effectively suppress the soil deformation, so the result was larger. The other three methods had similar control effects on the tunnel arch roof settlement and were all relatively good. For the arch bottom bulge, the arch bottom bulge value of each method increased rapidly in the initial stage and gradually stabilized after excavation to about 30m, indicating that the inverted arch structure was basically formed and the surrounding rock stress was gradually adjusted. The double-side wall pilot tunnel method performed the best, with the final value being 52.83mm. In terms of the horizontal displacement of the arch waist, the horizontal displacement of the arch waist of the three-step method was the largest, and the deformation was relatively significant; in comparison, the three-step temporary inverted arch method, the double-side wall pilot tunnel method, and the CD method had more advantages in controlling the horizontal displacement of the arch waist, with smaller deformation. Among them, the control effect of the double-side wall pilot tunnel method was the best, followed by the CD method and the three-step temporary inverted arch method.
In conclusion, the double-side wall pilot tunnel method, the CD method, and the three-step temporary inverted arch method had similar effects in suppressing the arch roof settlement and all had good control capabilities. In terms of reducing the arch bottom bulge deformation, the double-side wall pilot tunnel method performed the best. The three-step method had the largest horizontal displacement of the arch waist and the deformation was relatively significant even after stabilizing. In comparison, the three-step temporary inverted arch method, the double-side wall pilot tunnel method, and the CD method had more advantages in controlling the horizontal displacement of the arch waist, with smaller deformation. Among them, the control effect of the double-side wall pilot tunnel method was the best, followed by the CD method and the three-step temporary inverted arch method.
4.2. Rock Mass Stress Analysis
Analyzing the stress state of the surrounding rock after tunnel excavation is of vital importance for assessing the construction methods. This analysis can reveal the stress changes that occur in the surrounding rock during the excavation process, help determine the stability of the rock and the requirements for support, provide scientific basis for the selection and optimization of construction methods, and ensure the safety and quality of the construction. At the same time, understanding the stress state of the surrounding rock is conducive to controlling the deformation of the rock and reducing the impact on the surrounding environment, which is an important foundation for achieving efficient and safe construction. Figure 6 shows the maximum principal stress contour maps of the surrounding rock under four construction methods.
According to the distribution of the maximum principal stress cloud map depicted in Figure 6, changes in the tunnel stress can be observed at specific locations, such as the arch top, arch bottom, arch waist and arch foot. After organizing and analyzing the simulation results, it was found that the maximum principal stress of the four construction methods appeared at the arch bottom position of the tunnel. Specifically, the maximum principal stress of the three-step method was -0.14 MPa, the highest value, indicating that this construction method has a stronger disturbance to the surrounding rock and may lead to higher stress concentration. The maximum principal stress of the three-step temporary inverted arch method was -0.39 MPa, the lowest value, indicating that this construction method has a certain buffering effect in adjusting the surrounding rock stress and the stress acts on the arch bottom, suggesting that this construction method has a more obvious impact on this area. The maximum principal stress of the double-side wall pilot tunnel method was -0.31 MPa, between the three-step method and the three-step temporary inverted arch method, indicating that this construction method has a moderate compressive stress on the surrounding rock and may have a certain deformation control ability. The maximum principal stress of the CD method was -0.18 MPa, larger than the double-side wall pilot tunnel method and the three-step temporary inverted arch method, but smaller than the three-step method, indicating that this construction method has a certain balancing effect in controlling the surrounding rock stress.
4.3. Support Stress Analysis
(1) Stress analysis of initial support
Figure 7 presents the stress cloud diagrams of the initial support after excavation for four construction methods. The compressive stress is indicated by negative values, while the tensile stress is positive. From the figure, it can be seen that the tensile stress of the initial support in the three-step method, the three-step temporary inverted arch method, and the CD method mainly distributes in the arch top area, while the compressive stress is concentrated near the arch foot. The tensile stress of the initial support in the double-side wall pilot tunnel method mainly concentrates around the arch waist, while the compressive stress is mainly distributed in the arch foot area. The formation reason of this distribution characteristic lies in the tunnel excavation process. During the excavation, the roof rock of the arch subsides, while the floor rock of the arch bulges upward, thereby exerting an extrusion effect on the upper support of the tunnel and the inverted arch of the inverted arch.
The distribution and maximum values of the tension and compression stresses of the initial support after excavation by different construction methods are shown in Table 4.
As can be seen from Figure 7 and Table 4, the stress distribution of the three-step temporary inverted arch method and the CD method is more uniform than that of the three-step method and the double-side wall pilot tunnel method, and there is no stress concentration phenomenon. The maximum tensile stress of the three-step method is 22.32 MPa, and the maximum compressive stress is -41.56 MPa; the maximum tensile stress of the three-step temporary inverted arch method is 34.22 MPa, and the maximum compressive stress is -45.11 MPa; the maximum tensile stress of the double-side wall pilot tunnel method is 12.25 MPa, and the maximum compressive stress is -31.66 MPa; the maximum tensile stress of the CD method is 22.79 MPa, and the maximum compressive stress is -30.97 MPa. The initial support adopts a combination of C25 sprayed concrete, H180 grid steel frame and ∅8 steel wire mesh. The stress of each method does not exceed the design strength of the support structure.
(2) Analysis of anchor bolt stress
The stress cloud diagrams of the anchor rods after excavation by the four construction methods are shown in Figure 8. The figure presents the distribution of the anchor rod stress under different construction methods. The compressive stress is negative, while the tensile stress is positive. It can be seen that the ranges of the anchor rods being tensile and compressive are indicated. There are significant differences in the stress distribution of the anchor rods caused by various construction methods, which provides a basis for the subsequent selection of construction methods.
In the three-step method, the three-step temporary inverted arch method, the double-side wall pilot tunnel method and the CD method, the anchor rods are in a tensile state in the area from the arch waist to the arch top, while they are in a compressive state near the arch foot.
The distribution and maximum values of the tensile and compressive stresses of the anchor rods after excavation under different construction methods are shown in Table 5.
As shown in Table 5, in the three-step method, the maximum tensile stress of the anchor rods occurs near the arch waist, reaching 540.19 MPa, while the maximum compressive stress occurs near the arch foot, with a value of -16.70 MPa; in the three-step temporary inverted arch method, the maximum tensile stress is located near the arch waist, reaching 142.98 MPa, while the maximum compressive stress occurs near the arch foot, with a value of -22.48 MPa; in the double-side wall pilot tunnel method, the maximum tensile stress near the arch waist is 104.54 MPa, and the maximum compressive stress near the arch foot is -26.34 MPa; in the CD method, the maximum tensile stress occurs near the arch waist, with a value of 181.09 MPa, while the maximum compressive stress occurs near the arch foot, with a value of -30.49 MPa. Among the four construction methods, except for the three-step method, the tensile stress and compressive stress of the other three methods do not exceed the designed strength of the anchor rods.
4.4. Comparison Conclusion
Compared with the three-step method, the three-step temporary inverted arch method, the double-side wall pilot tunnel method and the CD method have more advantages in controlling the displacement of surrounding rock. Meanwhile, they have better stress-bearing characteristics in terms of the axial force of anchor rods and the bending moment of initial support. Through comprehensive analysis of the performance of the three-step temporary inverted arch method, the double-side wall pilot tunnel method and the CD method in terms of deformation control and stress between surrounding rock and support, the three-step temporary inverted arch method not only can ensure the safety of tunnel construction, but also has the characteristics of simple construction process, convenient management and high construction efficiency. Moreover, it has more advantages in terms of economy. Therefore, under the condition of V-level surrounding rock of a certain tunnel, it is recommended to adopt the three-step temporary inverted arch method to achieve a balance among deformation control, construction convenience and economic benefits.
5. Analysis of Comparison between Monitoring Results and Numerical Simulation Results
5.1. Monitoring Items
This experiment selected the tunnel section DK357+250 as the monitoring object to study the deformation characteristics of the deep-buried soil surrounding rock during the construction process. This section has typical geological features and can well reflect the possible deformation patterns and evolution laws of the surrounding rock during excavation. This study monitored two items: arch top settlement and horizontal convergence. The commonly used monitoring instruments are high-precision total stations. The tunnel monitoring diagram is shown in Figure 9.
5.2. Monitoring and Analysis
In order to study the variation law of the arch top displacement during the tunnel excavation process, during the construction period, the GD-01, GD-02 and GD-03 monitoring points of the arch top settlement at the DK357+250 section were monitored, and the cumulative values of the monitoring data over time were plotted, as shown in Figure 10.
During the construction period, the settlement of the arch roof at the section DK357+250 was monitored for a period of 65 days. The cumulative settlement curve of the arch roof is shown in Figure 10. The monitoring results indicate that within the first 15 days after the tunnel excavation, the settlement of the arch roof was significant and at a relatively fast rate. As the excavation progressed, the excavation face gradually moved away from the monitoring section. After 30 days, the rate of settlement of the arch roof significantly slowed down, and the deformation of the surrounding rock tended to stabilize. The settlement of the GD-01 measuring point at the arch roof of section DK357+250 was the maximum. There were differences in the settlement amounts of the left side GD-02 and the right side GD-03 at the arch roof, mainly due to the unevenness of jointing in the surrounding rock and the unevenness of grouting reinforcement.
During the construction process, the horizontal convergence measurement points GY-01 and GY-02 at the DK357+250 section were monitored, and the cumulative values of the monitoring data over time were plotted (as shown in Figure 11).
According to the horizontal displacement monitoring results shown in Figure 11, the horizontal displacements of the left arch waist and the right arch waist show different trends over time. In the initial stage of construction, the stress release of the surrounding rock led to the gradual increase of the displacements of the arch waists. As the excavation progressed, the displacement rates gradually decreased and the curves became stable. After 30 days of construction, the horizontal displacements of the arch waists were basically stable.
To verify the accuracy of the numerical calculation results, a comparative analysis was conducted by comparing the numerical simulation results with the on-site monitoring data to ensure the stability of the construction process. Rock mass deformation is a key indicator for evaluating the stability of the tunnel. Therefore, in this study, the arch top settlement and horizontal displacement in the numerical simulation were compared with the on-site monitoring data of section DK357+250. The specific comparison results are shown in Table 6.
After conducting a comparative analysis of the on-site monitoring data and the numerical simulation results, it was found that there are certain deviations in specific numerical values between the two. Among them, the deviation of the GD-01 measuring point for the arch roof settlement is 9.64%. In terms of horizontal convergence, the deviations of the GY-01 and GY-02 measuring points for the left and right arch waist are 6.26% and 9.07% respectively. Despite this, the variation trends of the numerical simulation results and the on-site monitoring data are basically consistent, which validates the rationality and reliability of the optimization scheme and indicates that the numerical simulation results can provide effective technical guidance for tunnel construction.
6. Conclusions
This paper takes a deep-buried soil tunnel in Baotai District, Yan'an City, Shaanxi Province as the engineering case. By combining on-site monitoring and numerical simulation, it analyzes the influence of different construction methods on the mechanical properties and deformation change laws of the surrounding rock and the supporting structure of the tunnel. The optimal construction method is determined. The main conclusions are as follows:
(1) In terms of deformation control of surrounding rock, all four methods have certain stability control effects in key areas. The double-side wall pilot tunnel method, the CD method, and the three-step temporary inverted arch method have similar performance in suppressing arch top settlement, and all show good control capabilities. In comparison, the double-side wall pilot tunnel method has more advantages in controlling arch bottom uplift and horizontal displacement, followed by the CD method and the three-step temporary inverted arch method.
(2) From the perspective of stress distribution of surrounding rock and support, all four methods show the maximum principal stress in the arch bottom area. The stress value of the three-step temporary inverted arch method is the lowest, reflecting its better force coordination. Except for the three-step method, the stress values of the other methods do not exceed the design limit, meeting the structural safety requirements.
(3) Considering multiple factors such as control effect, structural force, construction organization efficiency, and economy, the three-step temporary inverted arch method performs relatively superior in all indicators. This method not only has good adaptability but also has advantages such as simple procedures, convenient management, and high construction efficiency, especially suitable for tunnel construction in V-level surrounding rock conditions.
(4) By comparing the numerical simulation results with on-site monitoring data, although there are certain numerical deviations (such as the deviation of the settlement measurement point GD-01 is 9.64%, and the measurement points GY-01 and GY-02 are 6.26% and 9.07% respectively), the overall trend is consistent, indicating that numerical simulation has high reliability and practicability in revealing the response characteristics of surrounding rock. Therefore, this technical means can provide strong support for the optimization design and implementation of deep buried soil tunnel construction schemes.
Author Contribution: Conceptualization, Z.Z. and M.Z.; Data curation, L.Z.and L.W.; Methodology, Z.Z.and Z.M.; Formal analysis, L.W.and Y.H.; Investigation. L.Z.and Y.H.; Writing—original draft, M.Z.and Y.H.; Writing—review & editing, Z.Z.and L.Z.; Supervision, Z.Z.; Project administration, L.Z.and L.W.; Resources, Z.Z; Supervision, Z.Z.and L.W.; Validation, M.Z.and Y.H.; Visualization, M.Z. and Y.H. All authors have read and agreed to the published version of the manuscript.
Funding
This study was funded by the Science and Technology Plan of Housing and Urban-Rural Construction in Anhui Province (2020-YF038), and Science and technology development project (HYB20240110, HYB20250019, HYB20220162).
Data Availability Statement
The data used to support the findings of this study are available from the corresponding author upon request.
Conflicts of Interest
The authors declare that they have no conflicts of interest.
References
- Bian, K. , Liu, J., Liu, Z.; et al. Mechanisms of large deformation in soft rock tunnels: a case study of Huangjiazhai Tunnel. Bull Eng Geol Environ 2019, 78, 431–444. [Google Scholar] [CrossRef]
- F.N. Wang, Z.B. F.N. Wang, Z.B. Guo, X.B. Qiao, J.Y. Fan, W. Li, M. Mi, Z.G. Tao, M.C. He. Large deformation mechanism of thin-layered carbonaceous slate and energy coupling support technology of NPR anchor cable in Minxian Tunnel: A case study. Tunnelling and Underground Space Technology 2021, 117, 104151. [Google Scholar] [CrossRef]
- Belachew, M. , Yamamoto, K., Nichols, E. et al. Ant nest geometry, stability, and excavation–inspiration for tunneling. Acta Geotech. 2024, 19, 1295–1313. [Google Scholar] [CrossRef]
- Morya, P.; Chansutham, T.; Phienwej, N.; Chanrungautai, S.; Inkoom, P.; Jongpradit, P. Design and construction of Map Kabao Tunnel, longest rail tunnel in Thailand. Geomech. Tunn. 2023, 16, 292–303. [Google Scholar] [CrossRef]
- Pei Wang, Chengkai Xu, Zhen-Yu Yin, Shun-xiang Song, Changjie Xu, Sheng Dai. A DEM-based Generic Modeling Framework for Hydrate-Bearing Sediments. Computers and Geotechnics 2024, 171, 106287. [CrossRef]
- Songsong Yang, Dingwen Zhang, Mei Wang, Jiyang Li. Ground and tunnel deformation induced by excavation in pipe-roof pre-construction tunnel: A case study. Tunnelling and Underground Space Technology 2023, 131, 104832. [CrossRef]
- Sun, Y.; Xu, S.; Xu, C.; Huang, W.; He, J.; Rong, Y.; Zheng, F.; Ding, L. Study on the Stress and Deformation of Surrounding Rock and Support Structure of Super Large Section Tunnels Based on Different Excavation Methods. Appl. Sci. 2024, 14, 7025. [Google Scholar] [CrossRef]
- Huang, Y.; Fang, T.; Wang, N. Excavation Method Comparison and Optimization for a Super Large Cross-Section Tunnel. Appl. Sci. 2024, 14, 6544. [Google Scholar] [CrossRef]
- Han, Y.; Wei, C.; Cui, M.; Xie, H.; Ou, Y.; Zhu, H.; Liu, T. Ground Settlement of Deeply Buried Two-Lane Tunnels with Large Cross-Sections Using Different Construction Methods. Appl. Sci. 2022, 12, 11105. [Google Scholar] [CrossRef]
- Chenyang Zhao, Mingfeng Lei, Chenghua Shi, Haorong Cao, Weichao Yang, E. Deng. Function mechanism and analytical method of a double layer pre-support system for tunnel underneath passing a large-scale underground pipe gallery in water-rich sandy strata: A case study. Tunnelling and Underground Space Technology 2021, 115, 104041. [CrossRef]
- Chen, F. , Zeng K., Li X., Xu M., and Dai H. Construction monitoring and numerical simulation of water-rich tuff soft rock tunnel. IOP Conference Series: Earth and Environmental Science 2020, 455, 012163. [Google Scholar] [CrossRef]
- Zeng, K. , Yu J., and Li X. Construction Monitoring and Numerical Simulation Analysis of the Yangwujian Soft Rock Tunnel. IOP Conf. Series: Earth and Environmental Science 2019, 283, 012046. [Google Scholar] [CrossRef]
- Wu, S.; Wu, J.; Liu, D. Research on Construction Sequences and Construction Methods of the Small Clear-Distance, Double-Arch Tunnel under an Asymmetrical Load. Appl. Sci. 2023, 13, 8242. [Google Scholar] [CrossRef]
- Wu, X.; Li, Y.; Gong, M.; Wu, H.; Wu, Y. Deformation and Stress Law of Surrounding Rock for a Bifurcated Tunnel with a Super-Large Section: A Case Study. Appl. Sci. 2023, 13, 12852. [Google Scholar] [CrossRef]
- Zhang Z, Zhao C, Peng L, Zhang X and Lei M. Research on the Stability of Shallow-Buried Large Cross-Section Tunnel by Construction Method Conversion. Front. Earth Sci. 2022, 10, 831169. [Google Scholar] [CrossRef]
- Li, S. , Zhang, Y., Cao, M.; et al. Study on Excavation Sequence of Pilot Tunnels for a Rectangular Tunnel Using Numerical Simulation and Field Monitoring Method. 2022, 55, 3507–3523. [Google Scholar] [CrossRef]
- Song, Z.P. , Su, W.Y., Tian, X.X., Zhang, Y.W. and Zhou, G.N. “Risk analysis of tunnel construction scheme change based on field monitoring and numerical analysis. Advances in Civil Engineering 2021. [Google Scholar] [CrossRef]
- Zhanping Song, Xiaoxu Tian, Qi Liu, Yuwei Zhang, Heng Li, Guannan Zhou. Numerical analysis and application of the construction method for the small interval tunnel in the turn line of metro. Science Progress, A: Issue 3, pp.-Issue published date, 2020; 3. [CrossRef]
- Tang, X. , Wang, Y., and Li, Y. Numerical researches on the optimization of construction methods in tunnels with super large section. IOP Conf. Ser. Earth Environ. Sci. 2019, 304, 032024. [Google Scholar] [CrossRef]
- Fang, Z. , Zhu Z., and Chen X. Research on construction method and deformation control technology of high ground stress interbedded soft rock tunnel. Journal of Intelligent and Fuzzy Systems 2021, 40, 6183. [Google Scholar] [CrossRef]
Figure 1.
Detailed drawing of tunnel structure:(a) Tunnel longitudinal section drawing ;(b) Tunnel lining drawing.
Figure 1.
Detailed drawing of tunnel structure:(a) Tunnel longitudinal section drawing ;(b) Tunnel lining drawing.
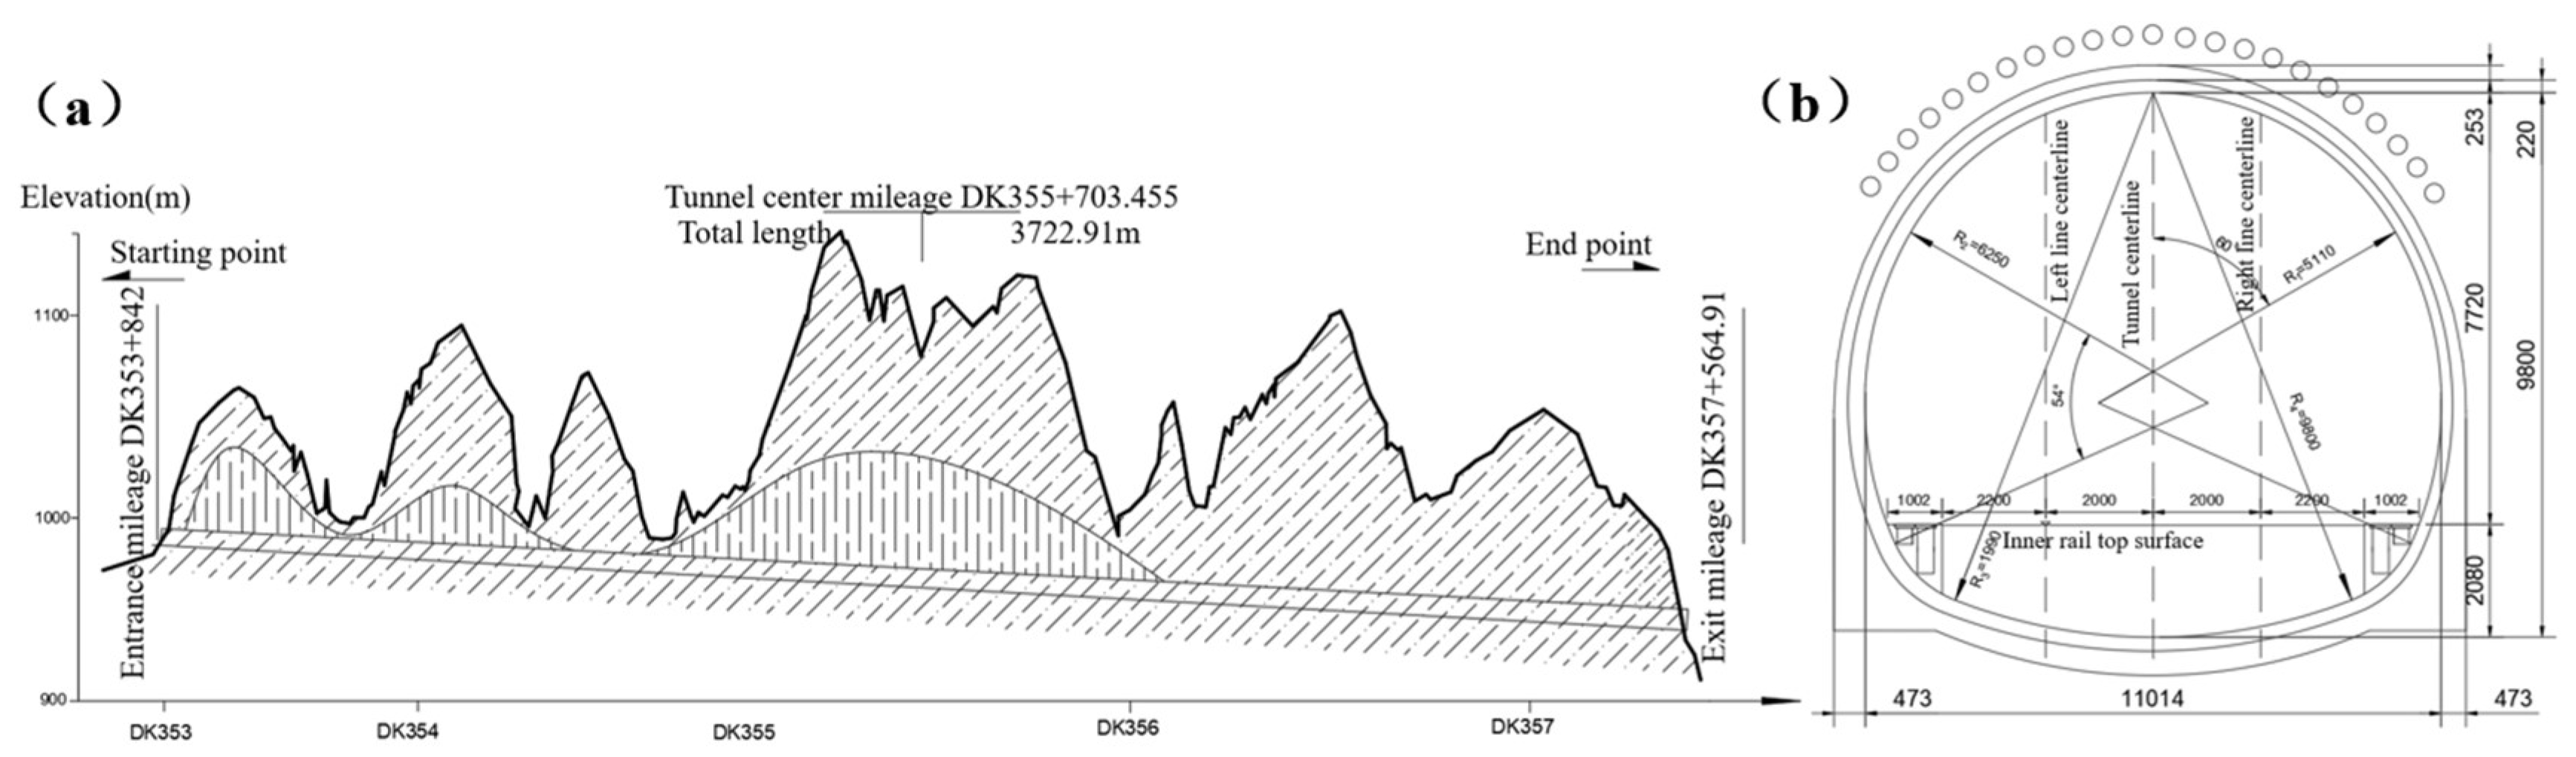
Figure 2.
The section of tunnel with grade V surrounding rock is shown in the construction schematic diagram: (a) The three-step method ;(b) The three-step temporary inverted arch method ;(c) The double-side wall pilot tunnel method ;(d) CD method.
Figure 2.
The section of tunnel with grade V surrounding rock is shown in the construction schematic diagram: (a) The three-step method ;(b) The three-step temporary inverted arch method ;(c) The double-side wall pilot tunnel method ;(d) CD method.
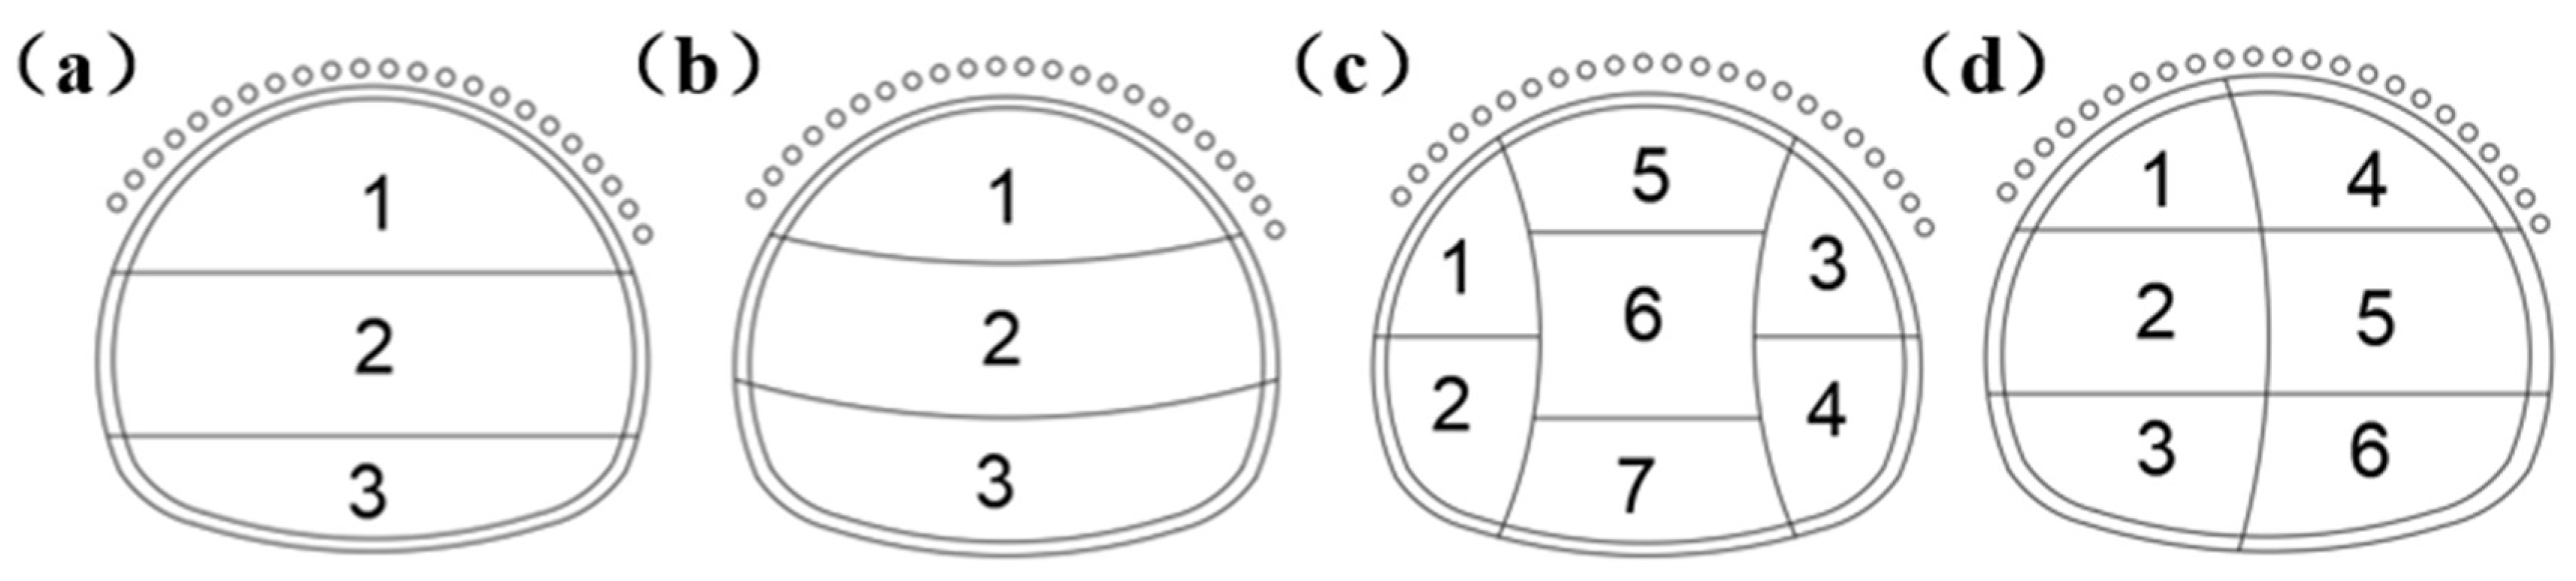
Figure 3.
Model dimension drawing:(a) Overall model size drawing; (b) Tunnel model size.
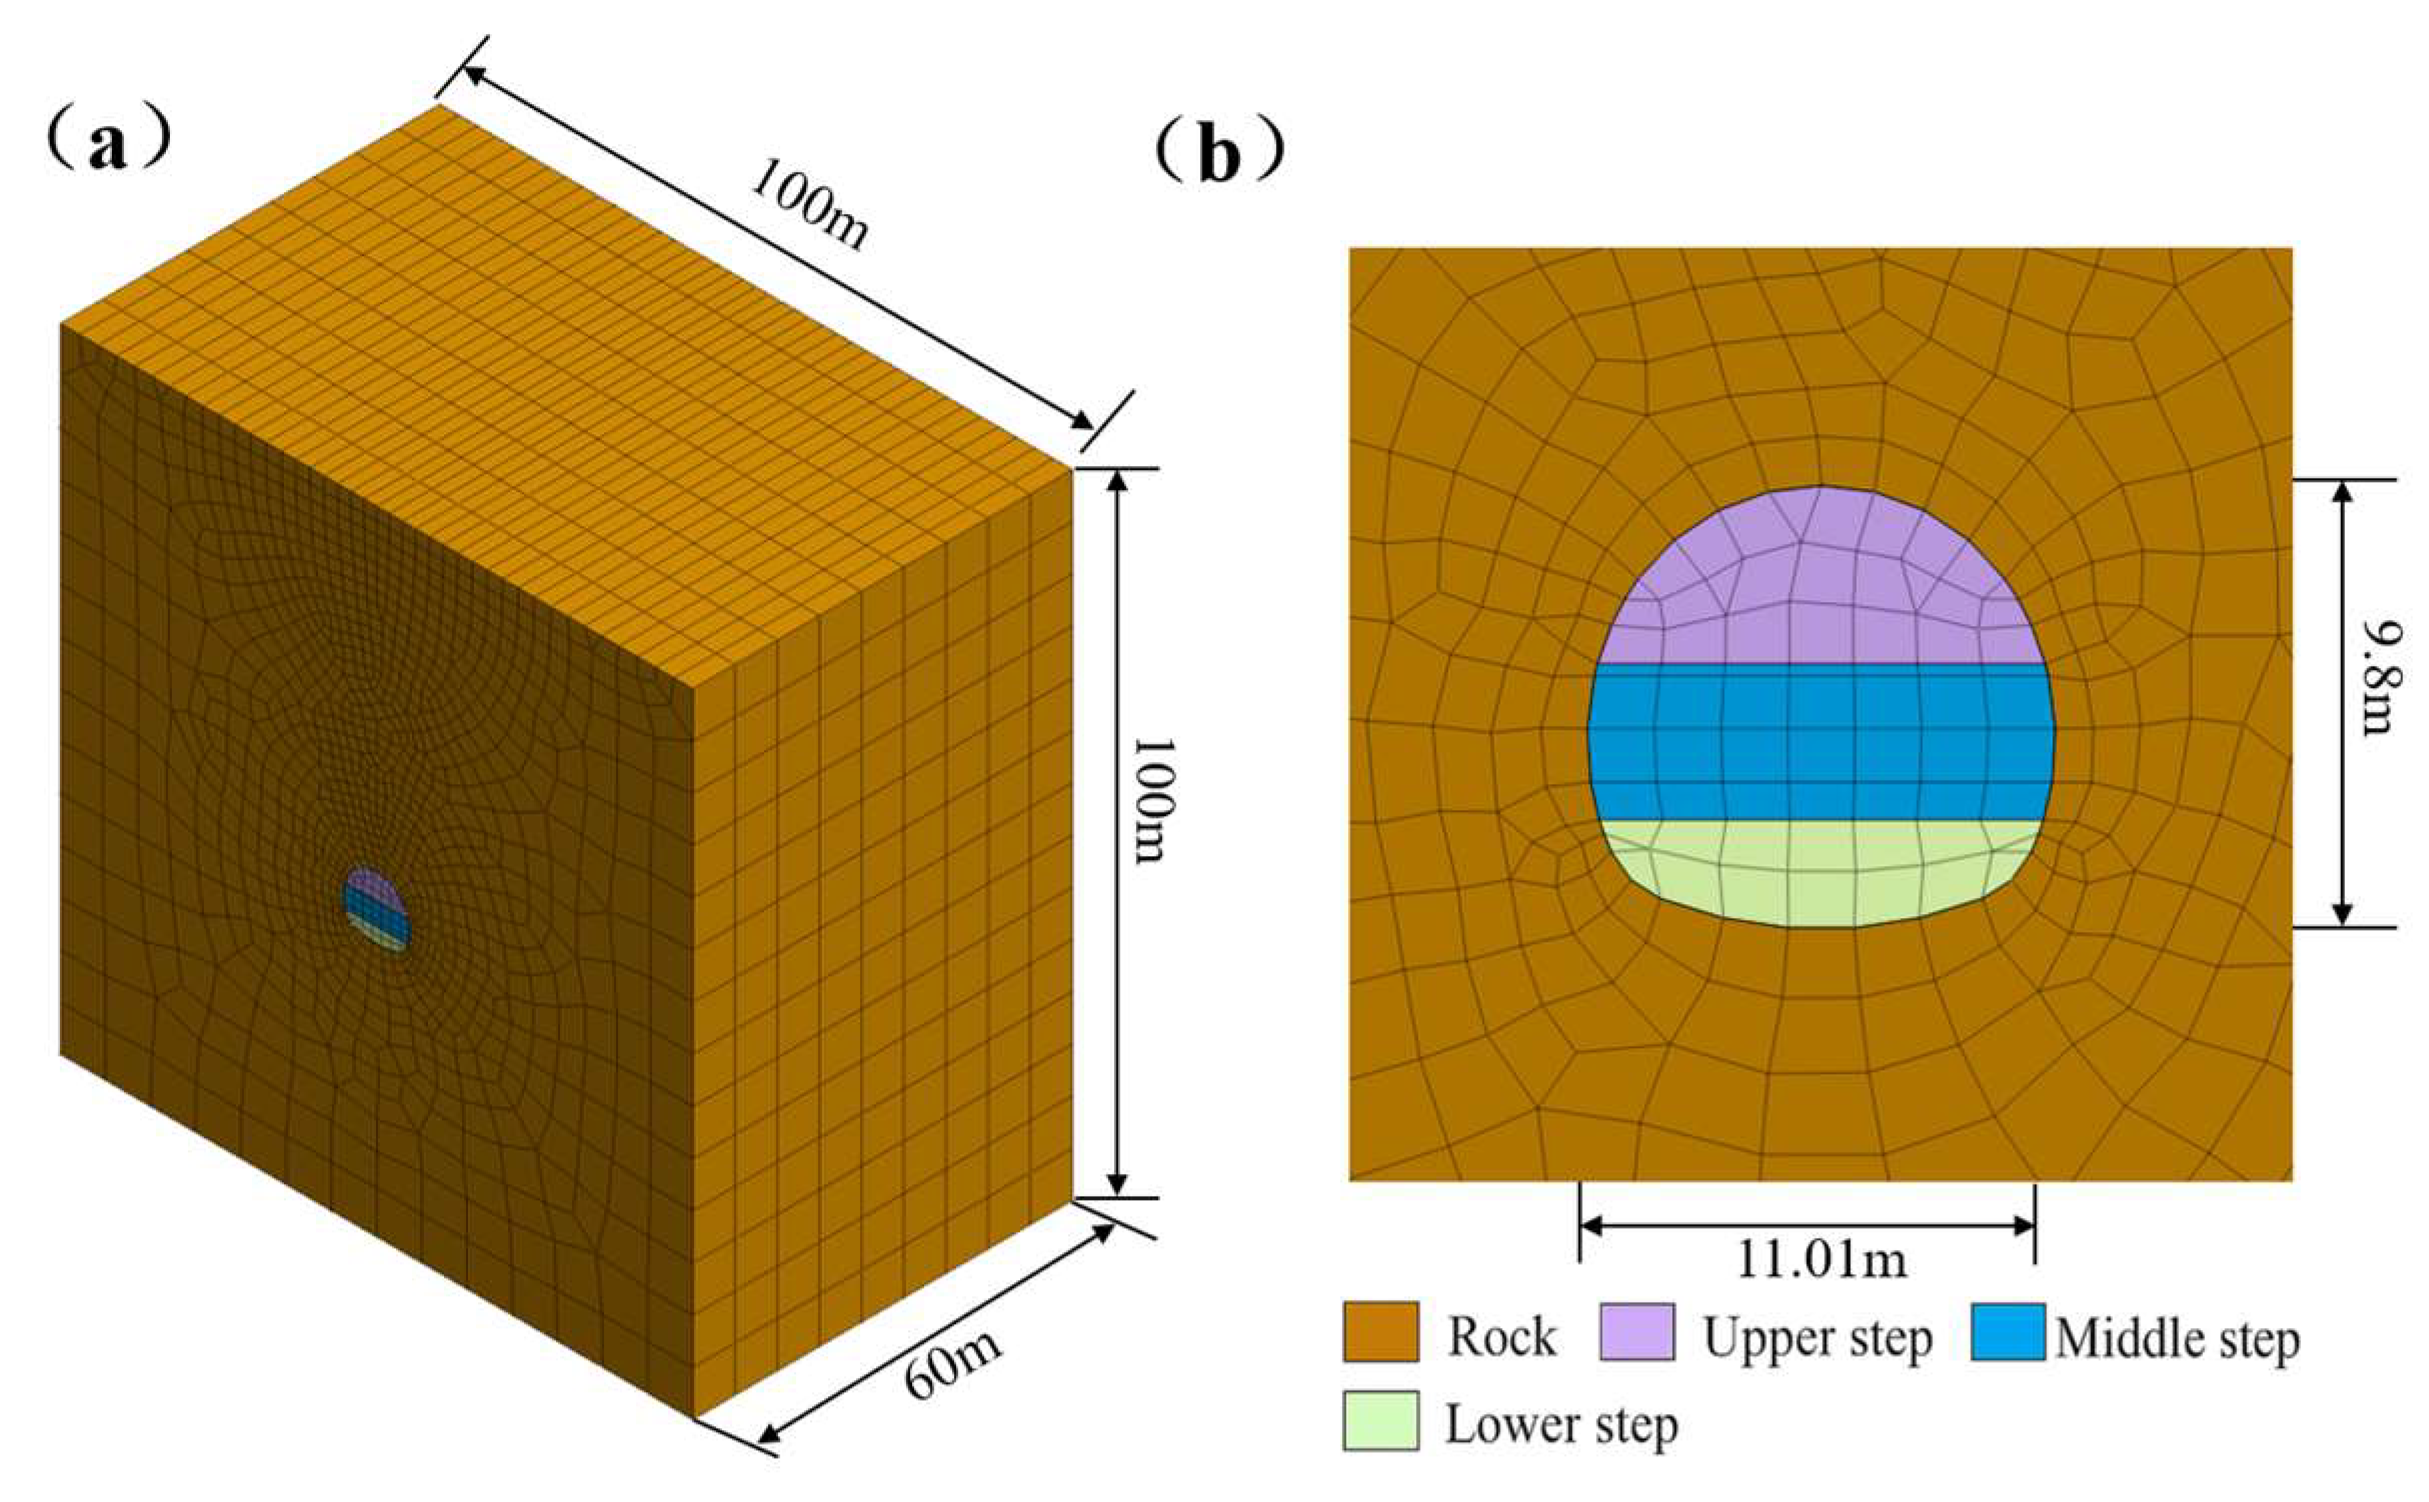
Figure 4.
Model diagrams of tunnel excavation under different construction methods:(a) The three-step method ;(b) The three-step temporary inverted arch method ;(c) The double-side wall pilot tunnel method ;(d) CD method.
Figure 4.
Model diagrams of tunnel excavation under different construction methods:(a) The three-step method ;(b) The three-step temporary inverted arch method ;(c) The double-side wall pilot tunnel method ;(d) CD method.
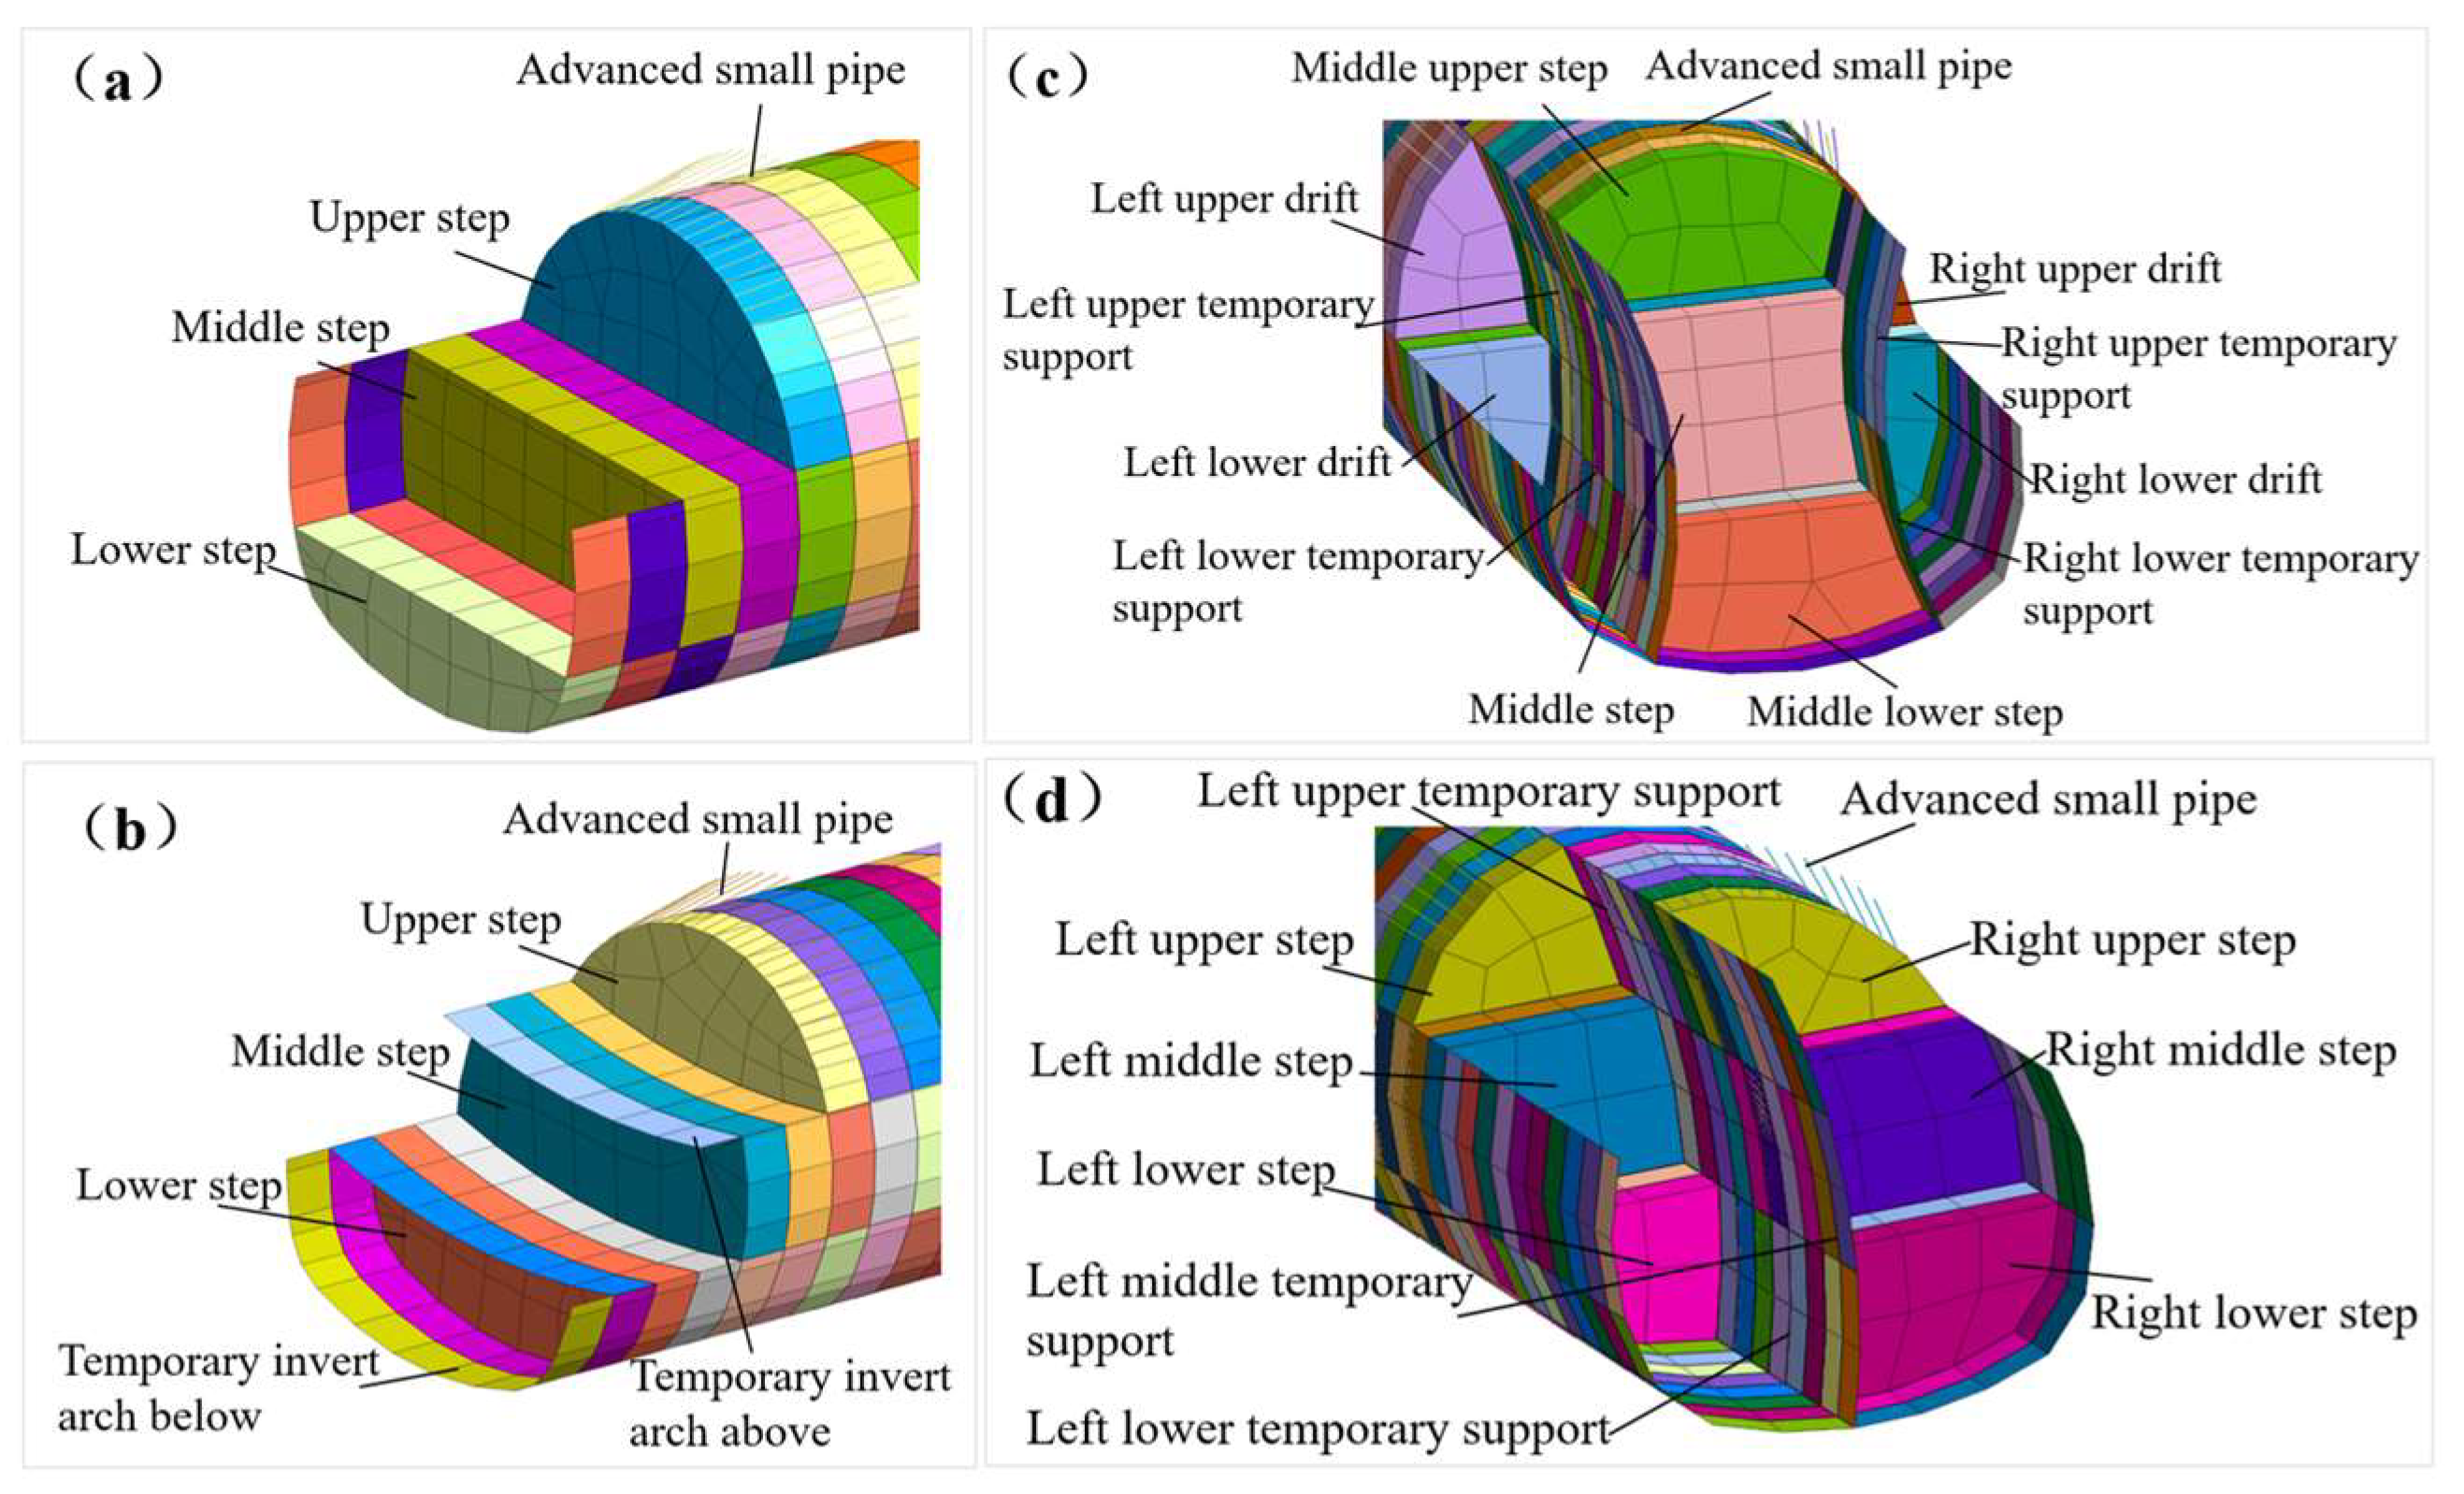
Figure 5.
The deformation curves of each key position of the tunnel surrounding rock with respect to the excavation length:(a) Vault settlement ;(b) Arch-shaped bulge ;(c) Left arching of the waist horizontal displacement ;(d) Right arching waist horizontal displacement.
Figure 5.
The deformation curves of each key position of the tunnel surrounding rock with respect to the excavation length:(a) Vault settlement ;(b) Arch-shaped bulge ;(c) Left arching of the waist horizontal displacement ;(d) Right arching waist horizontal displacement.
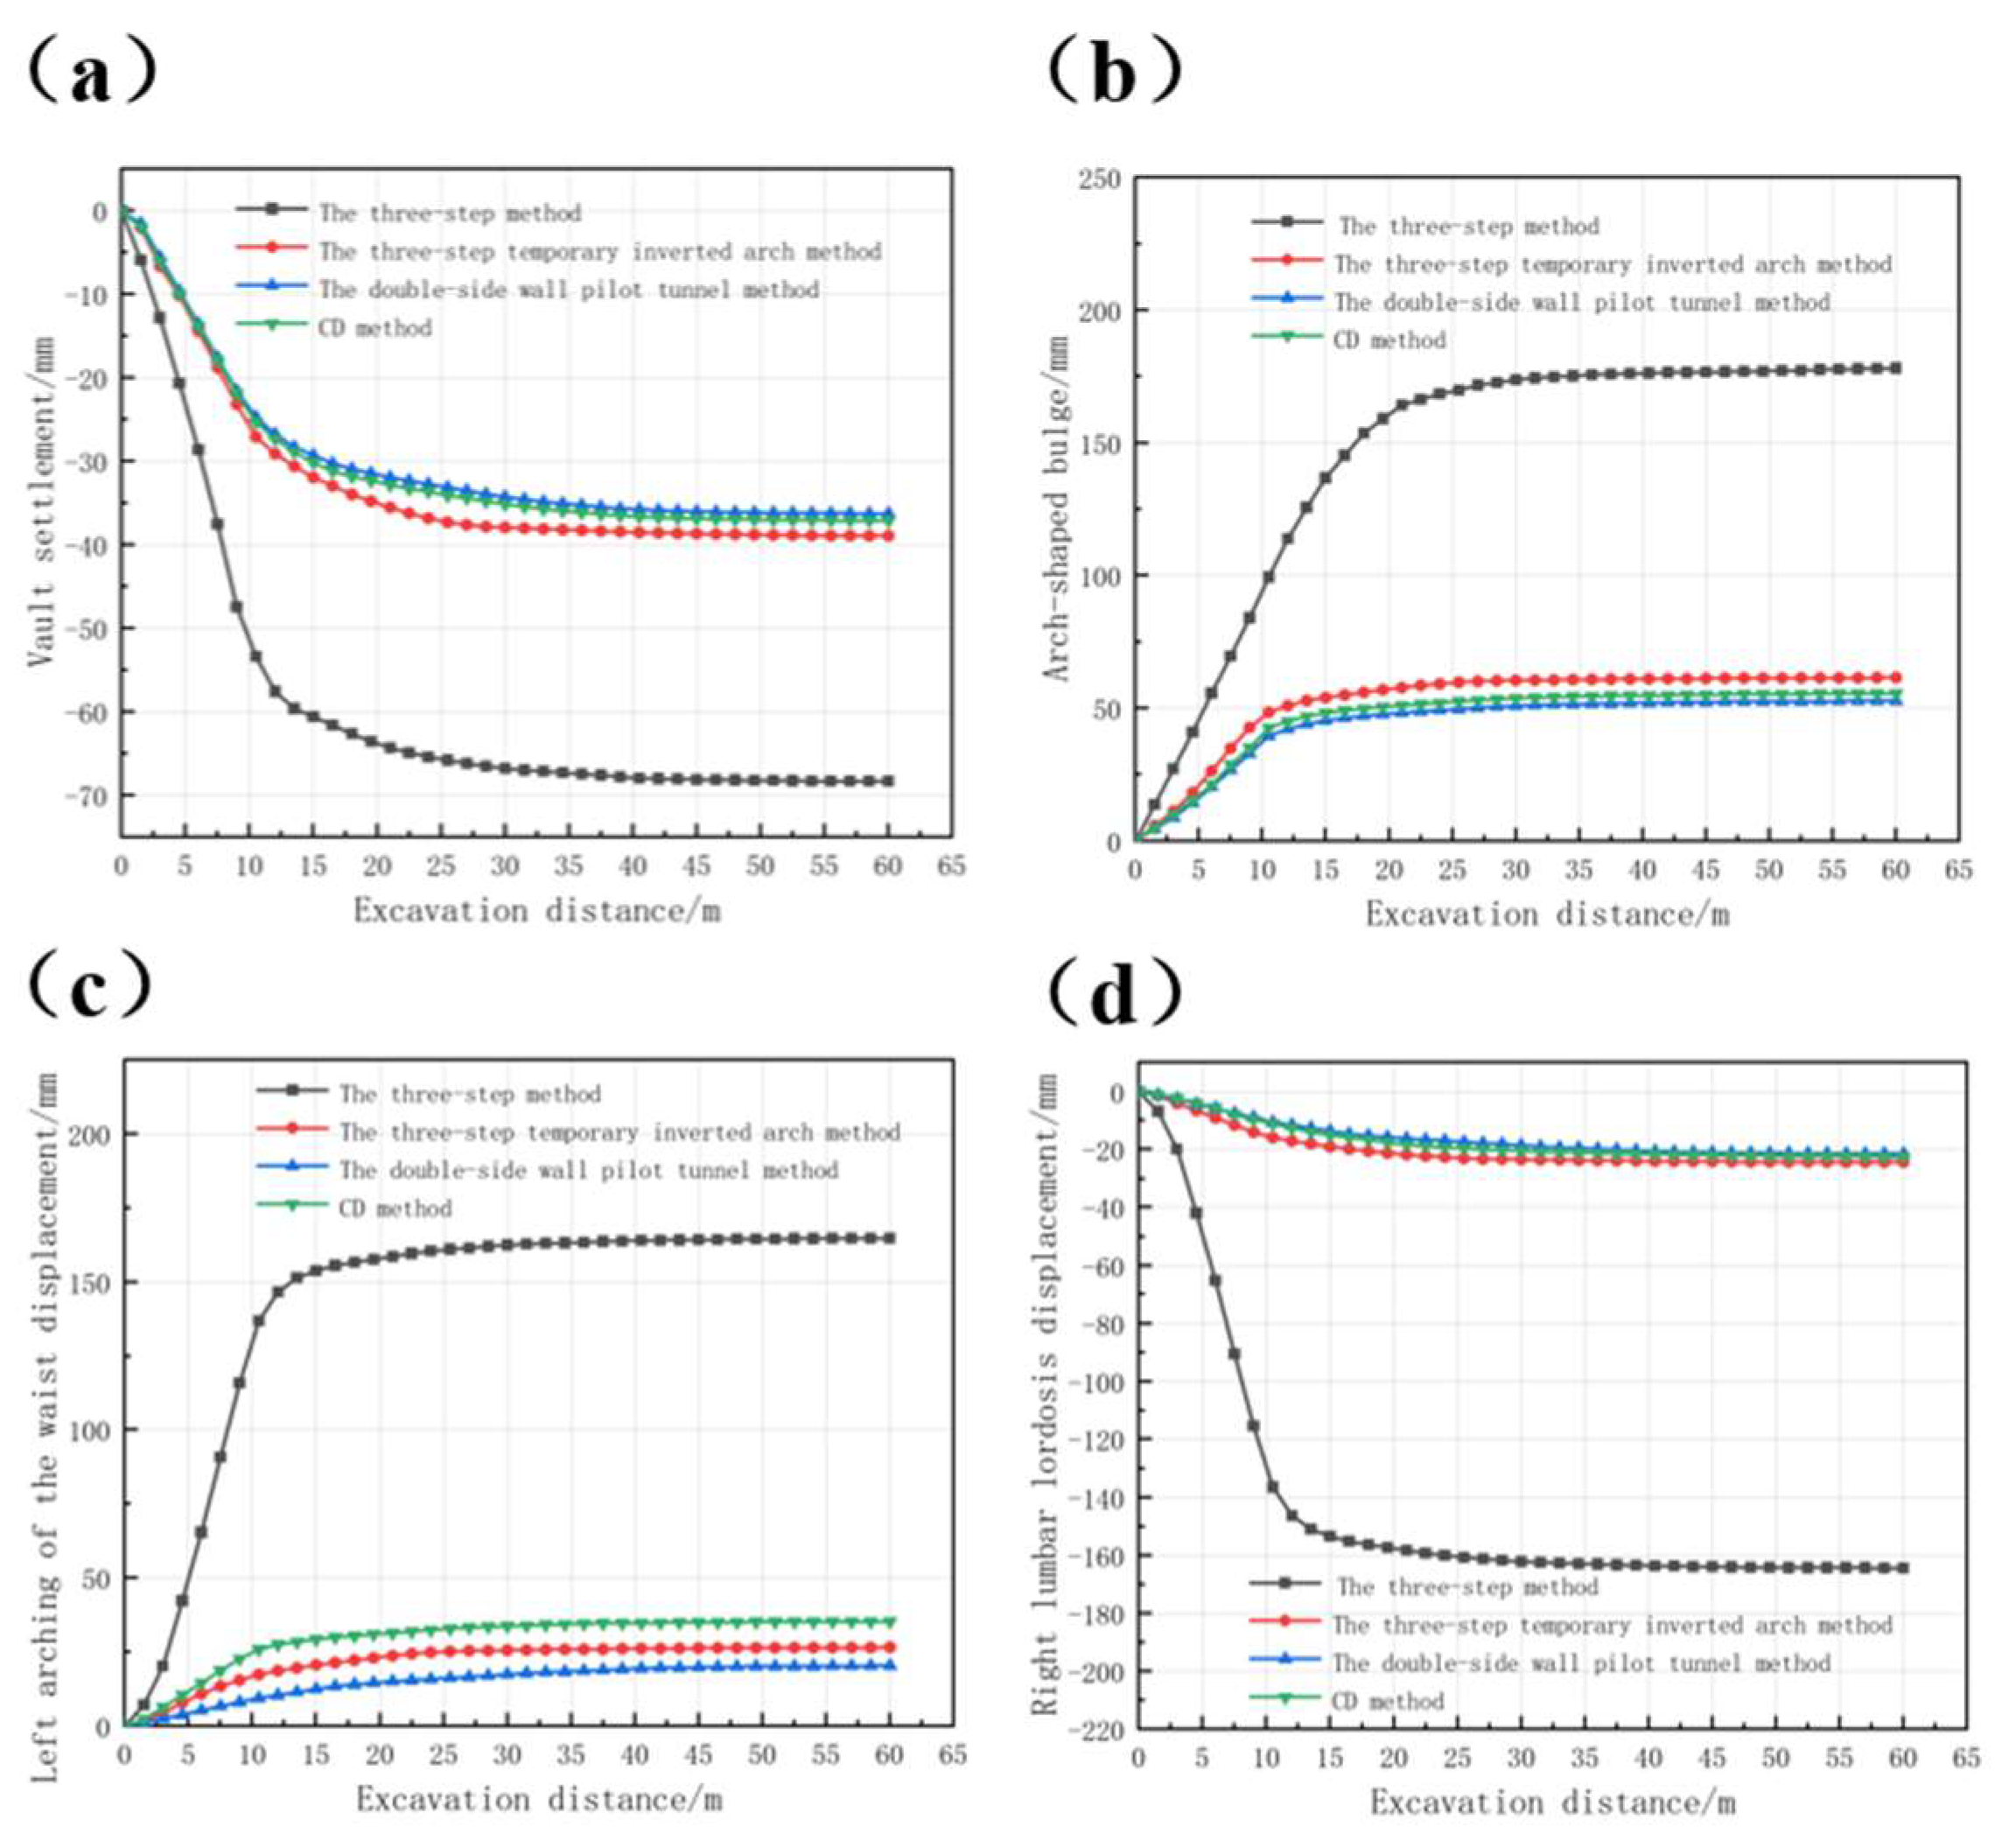
Figure 6.
Maximum principal stress contour maps of surrounding rock under different construction methods: (a) The three-step method ;(b) The three-step temporary inverted arch method;(c) The double-side wall pilot tunnel method ;(d) CD method.
Figure 6.
Maximum principal stress contour maps of surrounding rock under different construction methods: (a) The three-step method ;(b) The three-step temporary inverted arch method;(c) The double-side wall pilot tunnel method ;(d) CD method.
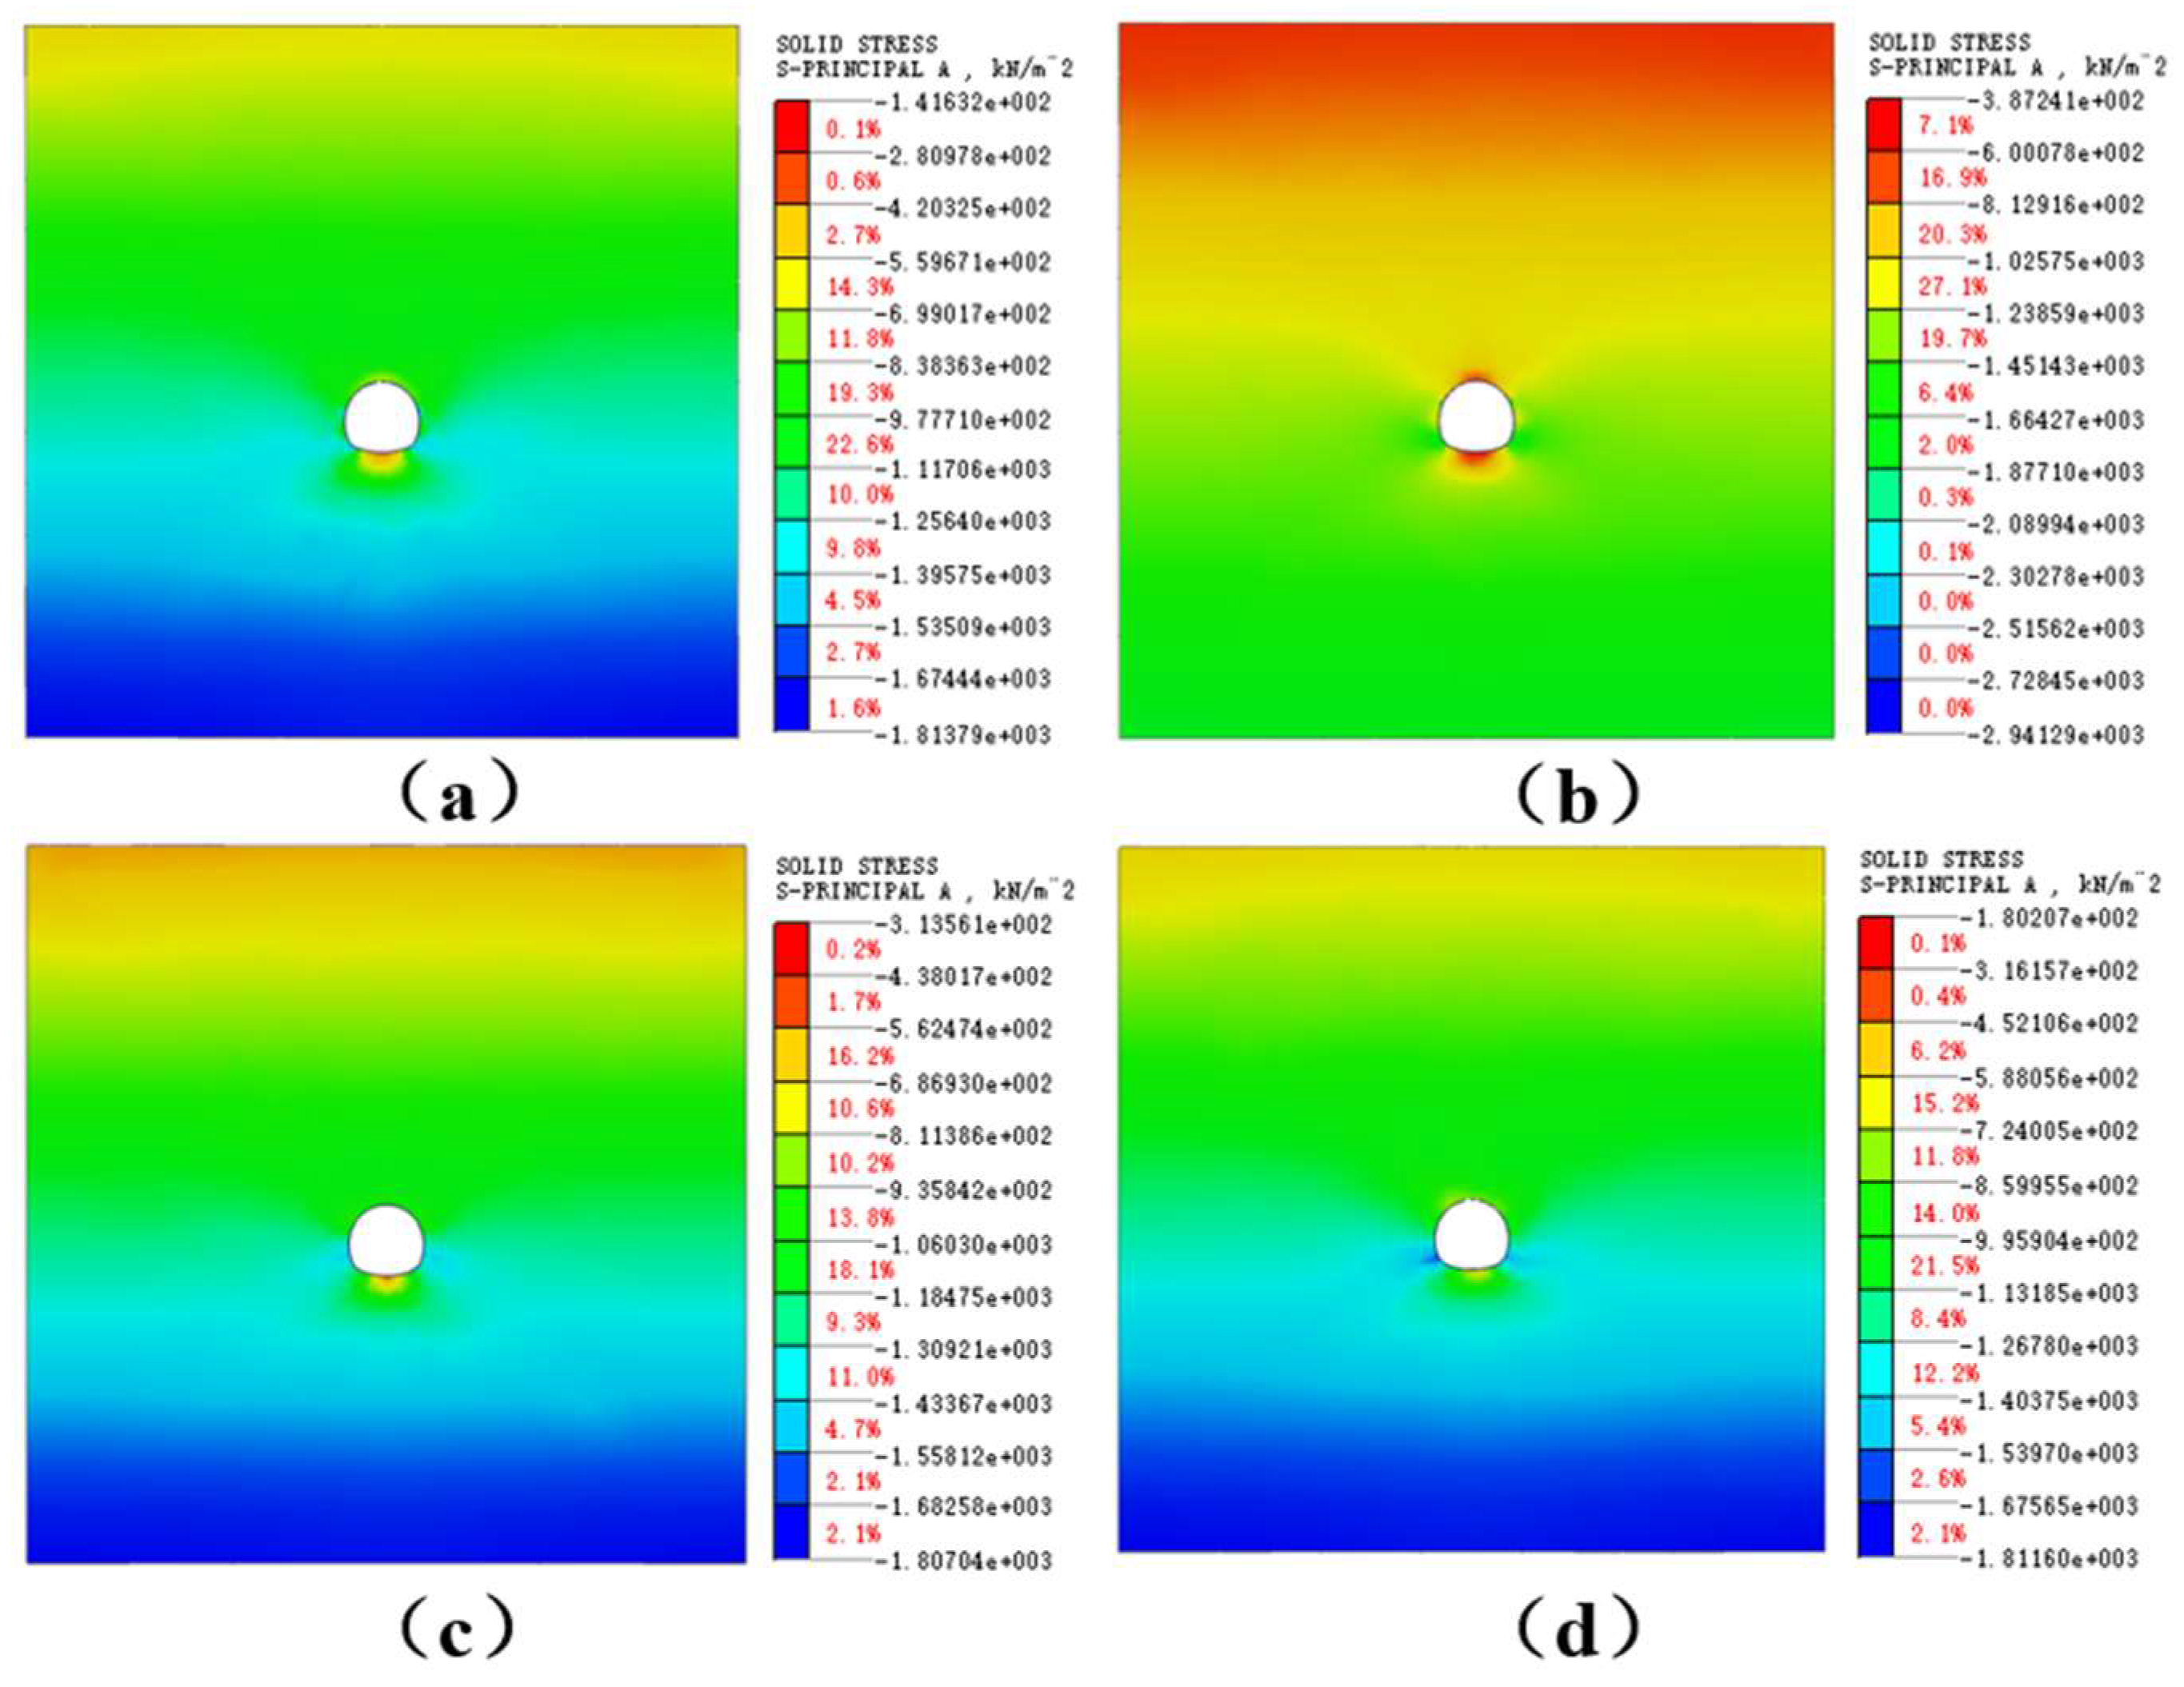
Figure 7.
Stress cloud diagrams of the initial support after excavation by different construction methods: (a) The three-step method ;(b) The three-step temporary inverted arch method ;(c) The double-side wall pilot tunnel method ;(d) CD method.
Figure 7.
Stress cloud diagrams of the initial support after excavation by different construction methods: (a) The three-step method ;(b) The three-step temporary inverted arch method ;(c) The double-side wall pilot tunnel method ;(d) CD method.
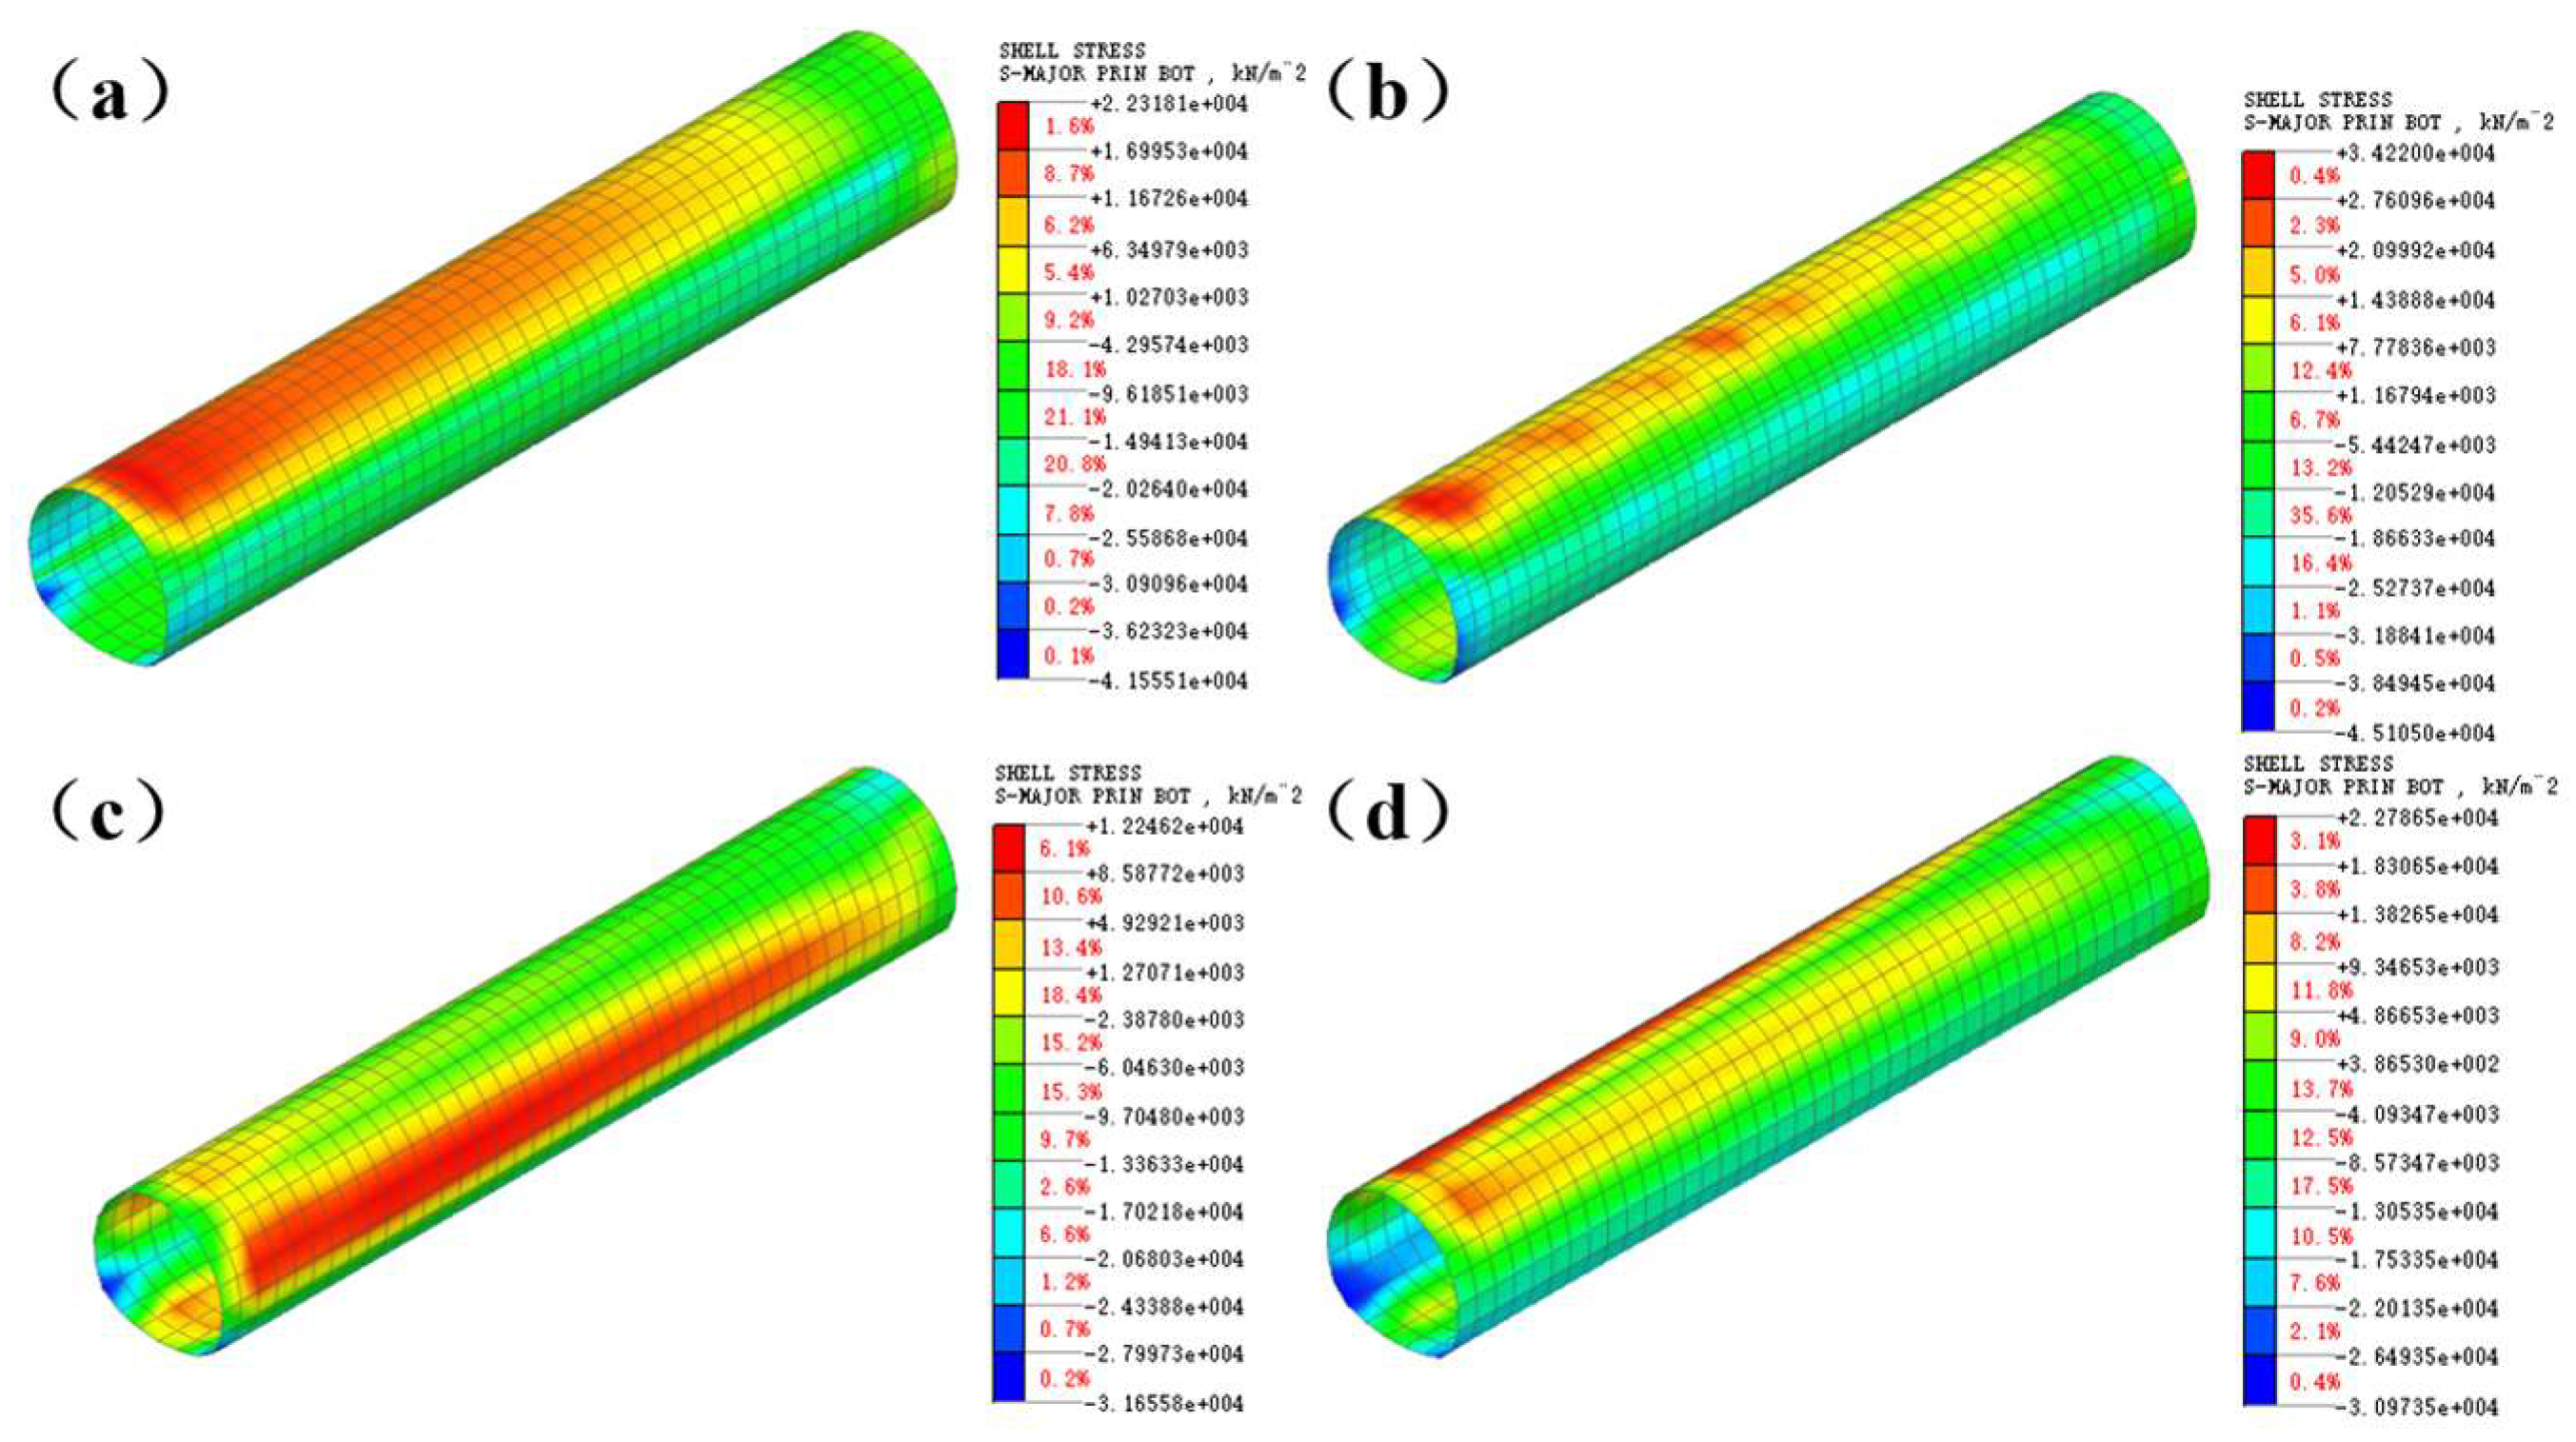
Figure 8.
Stress cloud diagrams of anchor rods after excavation by different construction methods: (a) The three-step method ;(b) The three-step temporary inverted arch method ;(c) The double-side wall pilot tunnel method ;(d) CD method.
Figure 8.
Stress cloud diagrams of anchor rods after excavation by different construction methods: (a) The three-step method ;(b) The three-step temporary inverted arch method ;(c) The double-side wall pilot tunnel method ;(d) CD method.
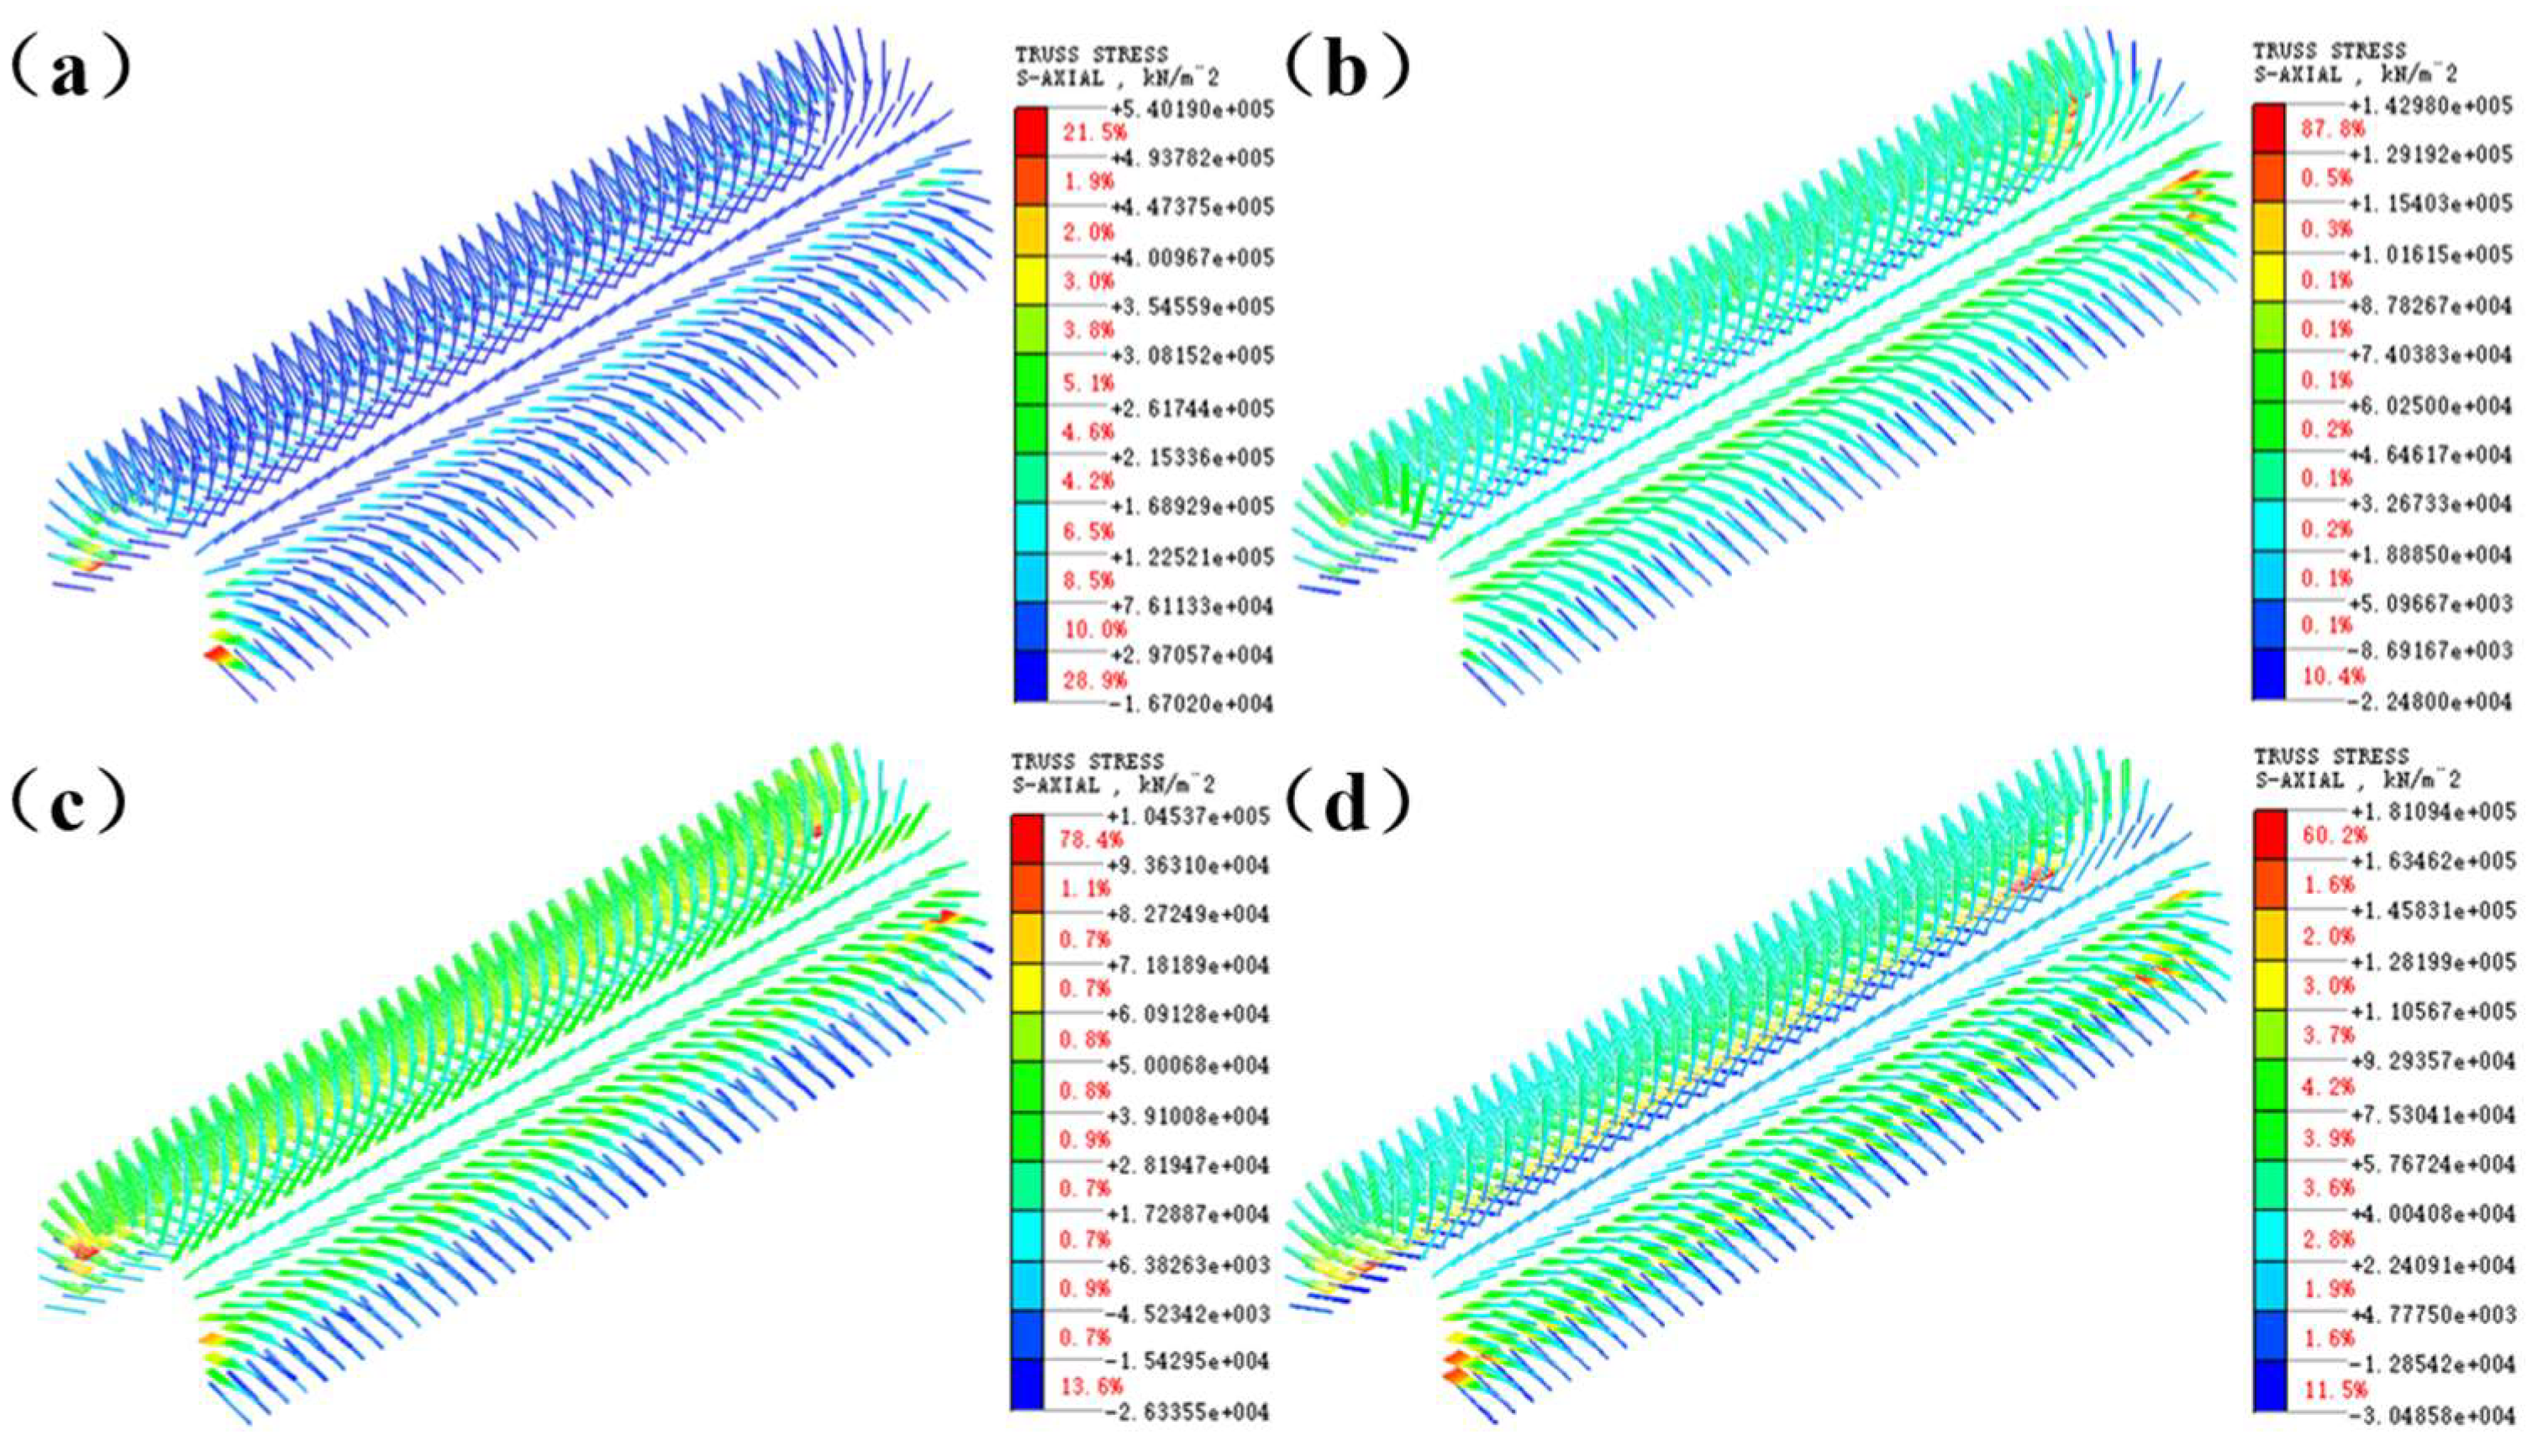
Figure 9.
Tunnel monitoring and measurement:(a) Monitoring point layout diagram; (b) On-site monitoring and measurement diagram.
Figure 9.
Tunnel monitoring and measurement:(a) Monitoring point layout diagram; (b) On-site monitoring and measurement diagram.
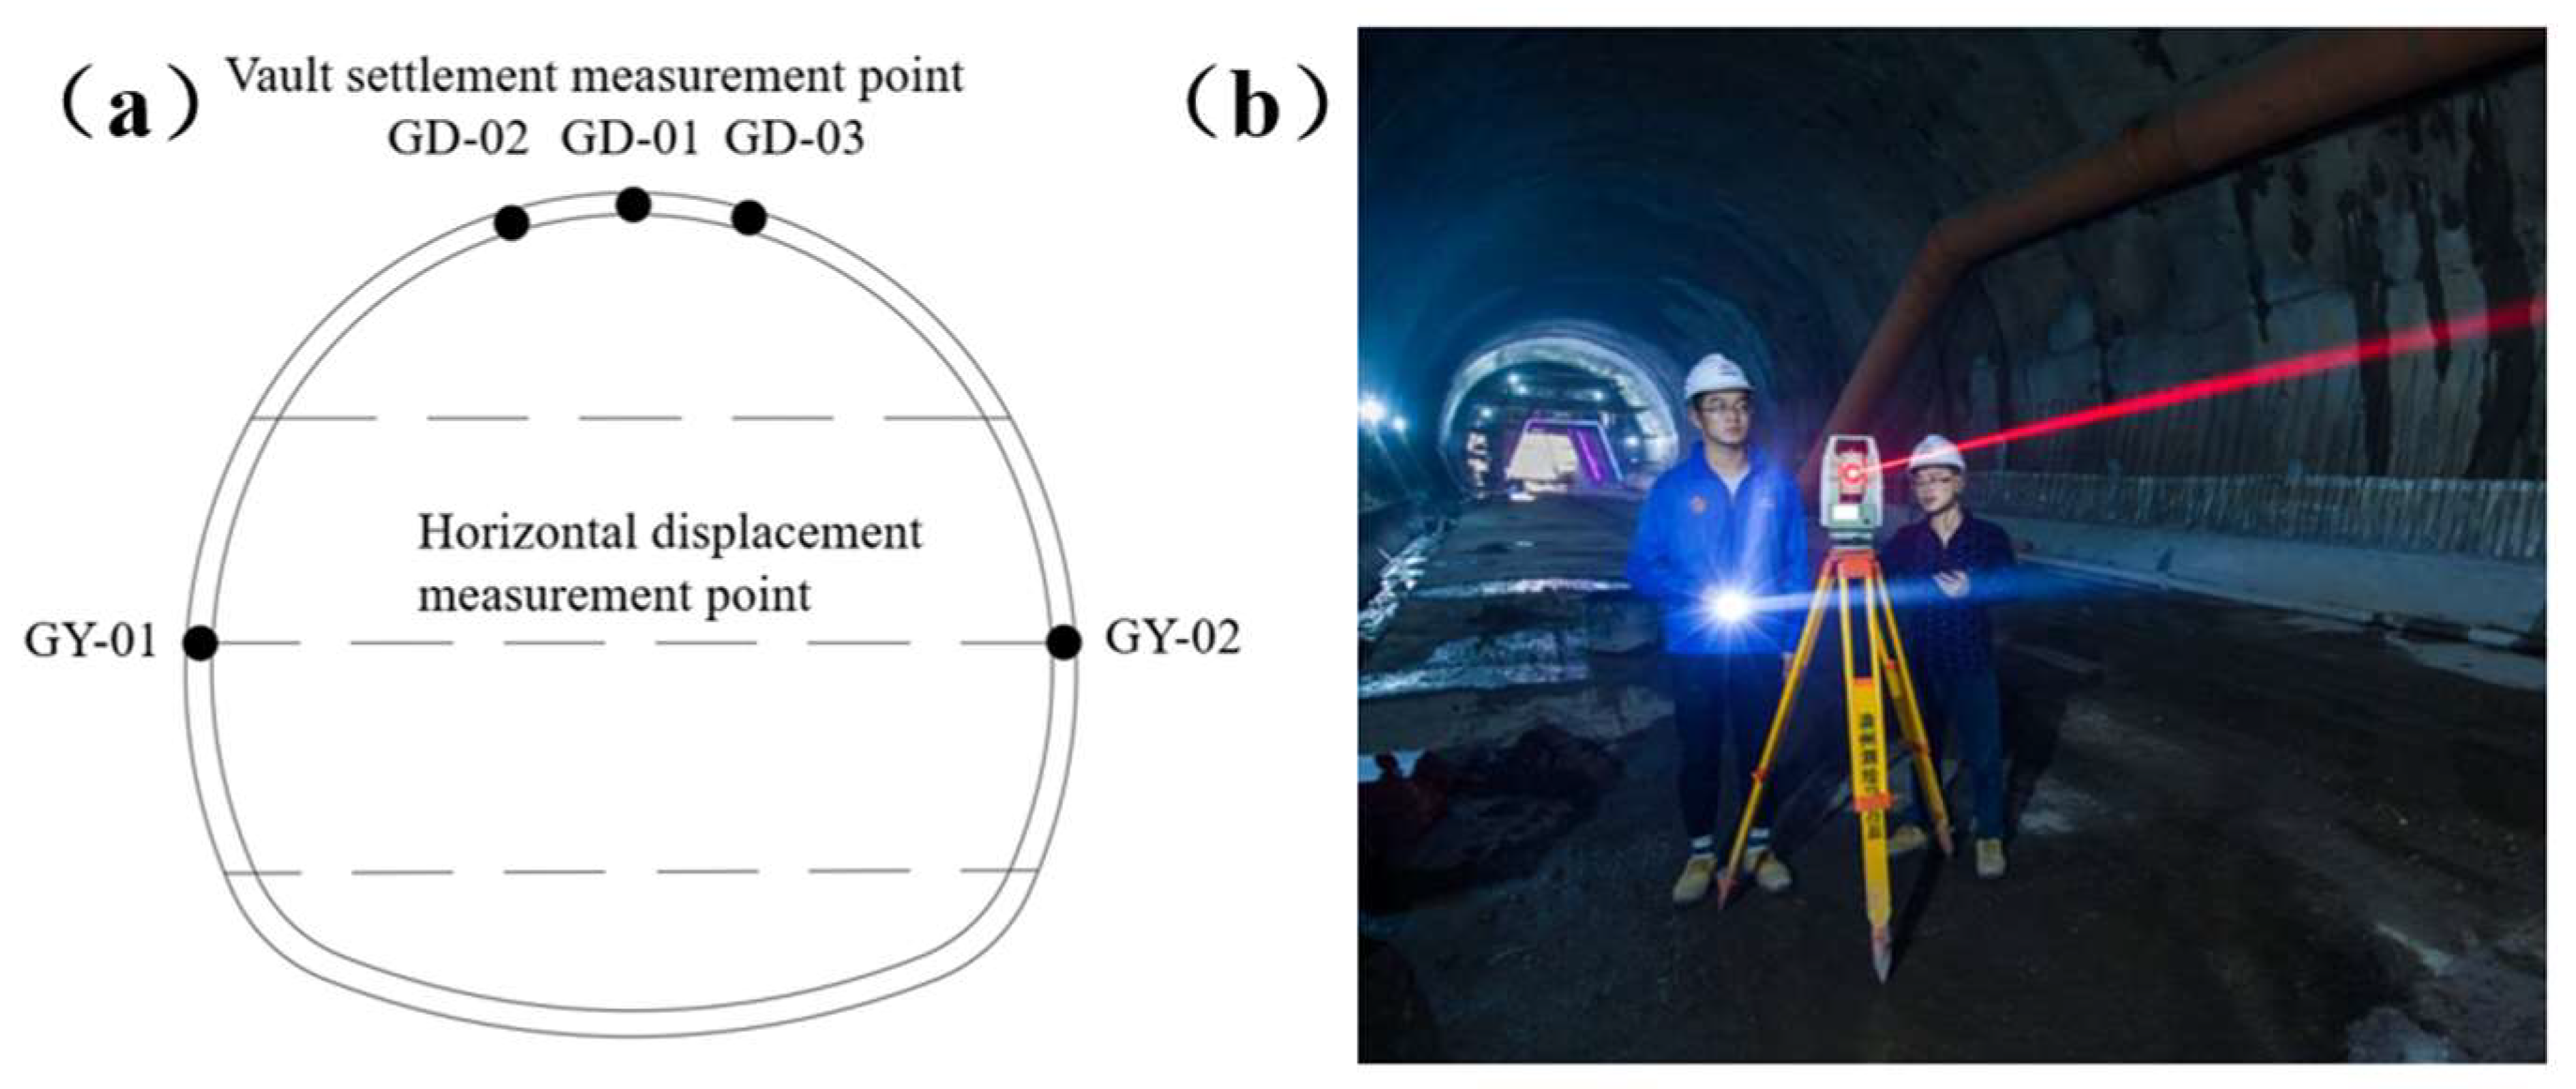
Figure 10.
Cumulative value curve of vault settlement.
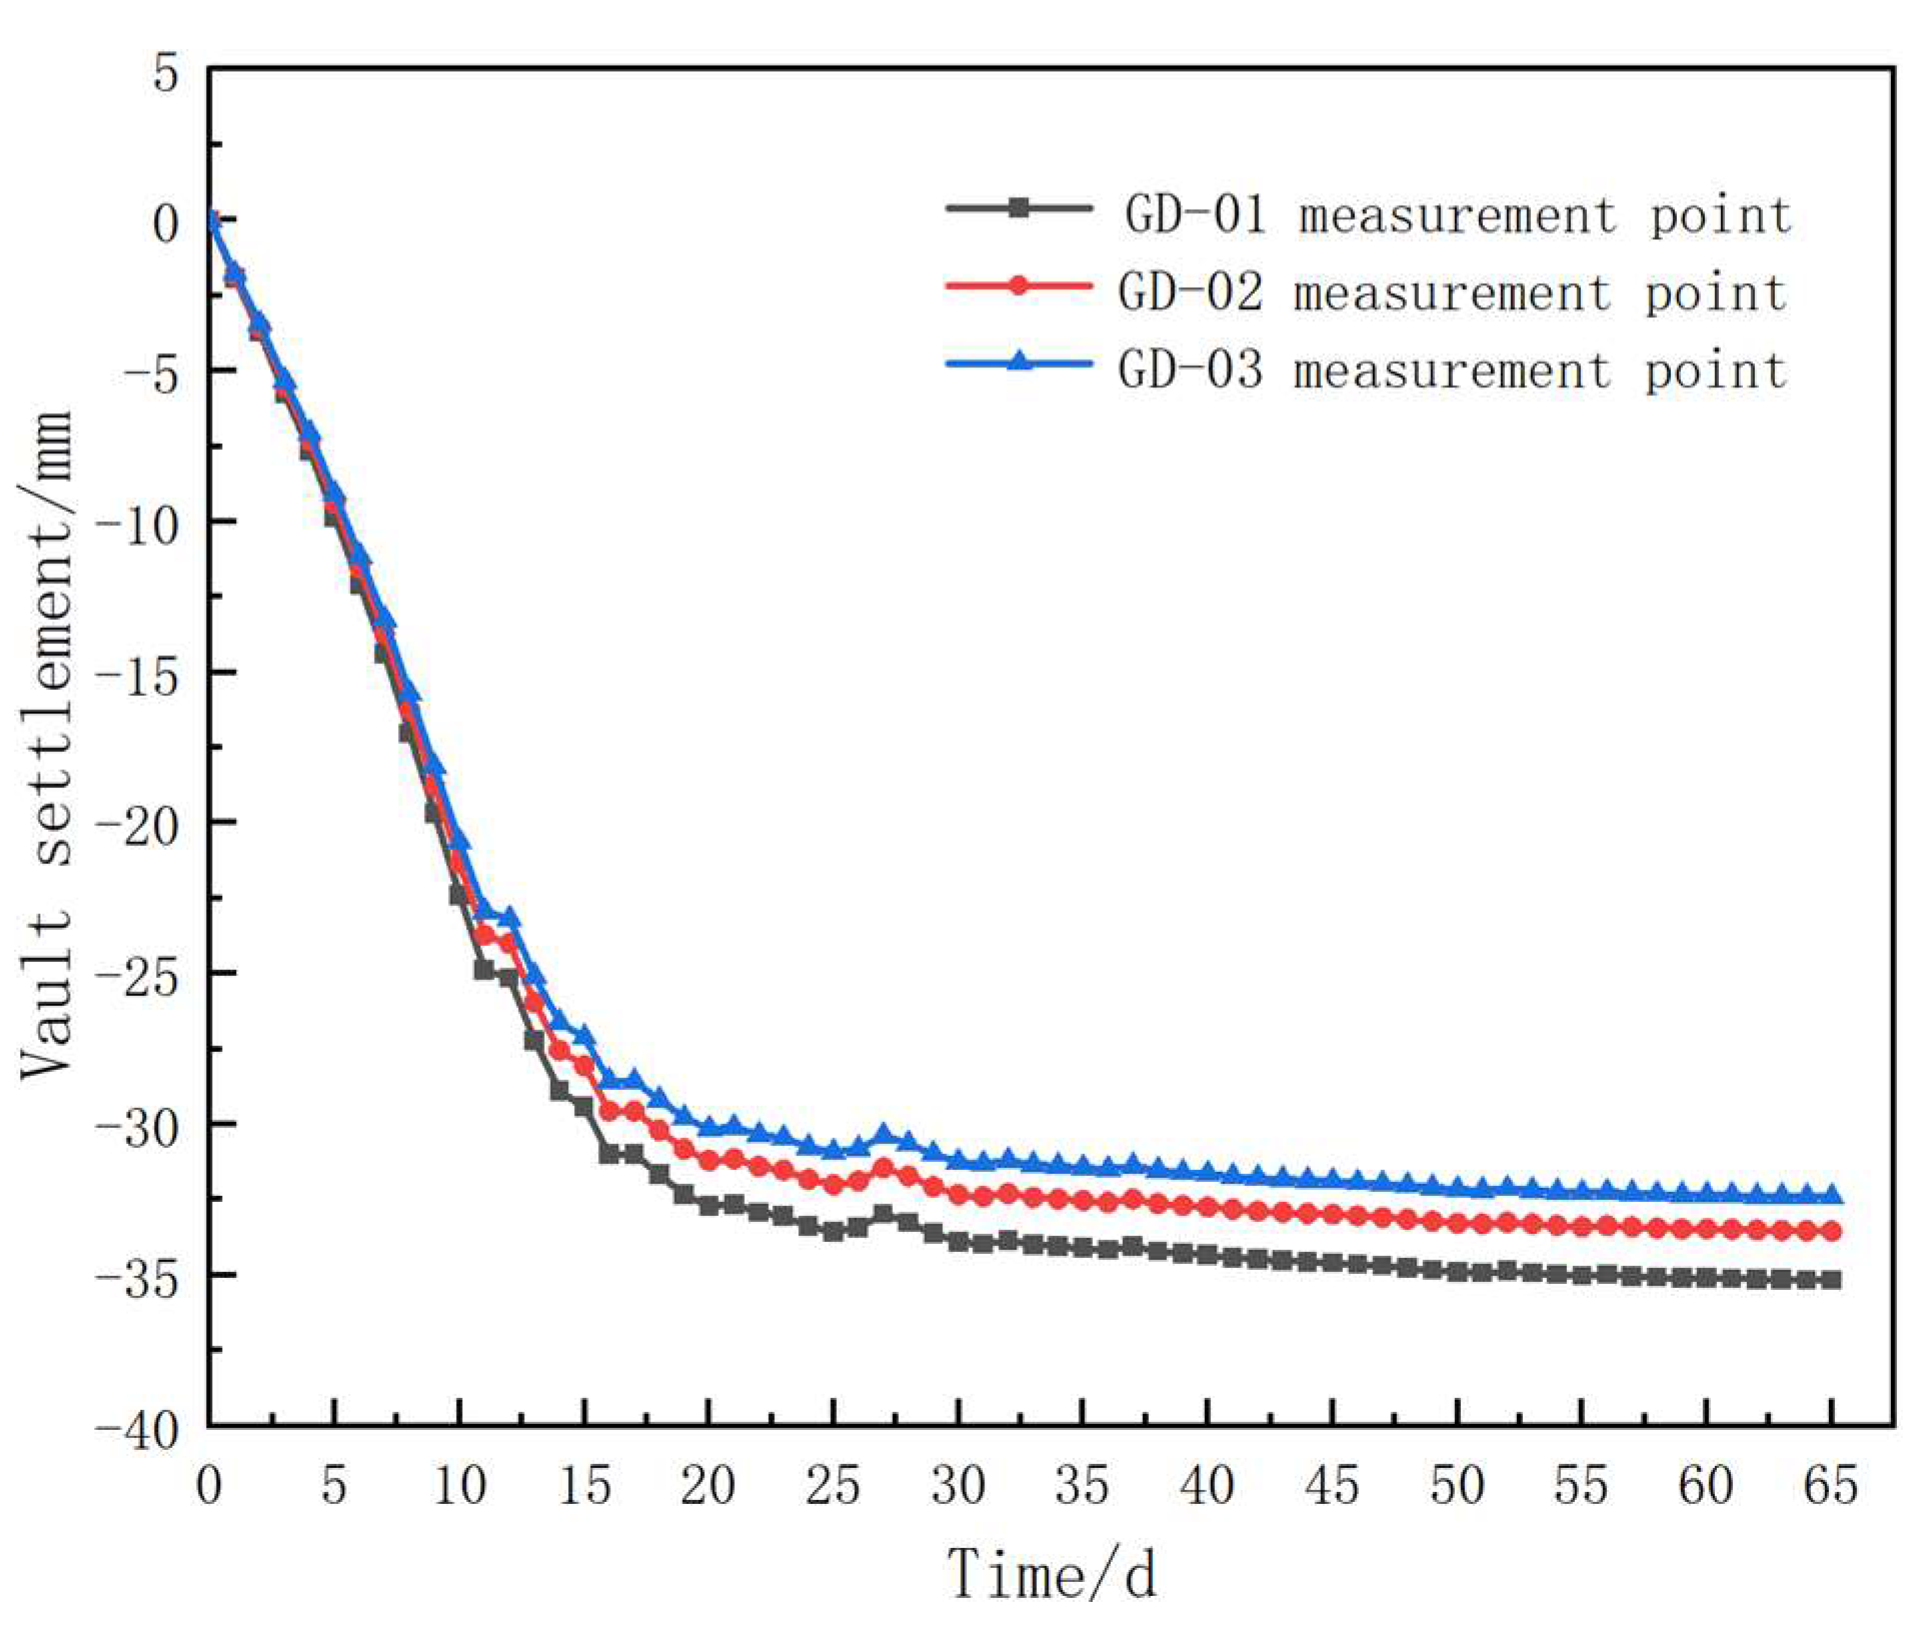
Figure 11.
Cumulative value curve of horizontal displacement:(a) GY-01 measurement point;(b) GY-02 measurement point.
Figure 11.
Cumulative value curve of horizontal displacement:(a) GY-01 measurement point;(b) GY-02 measurement point.
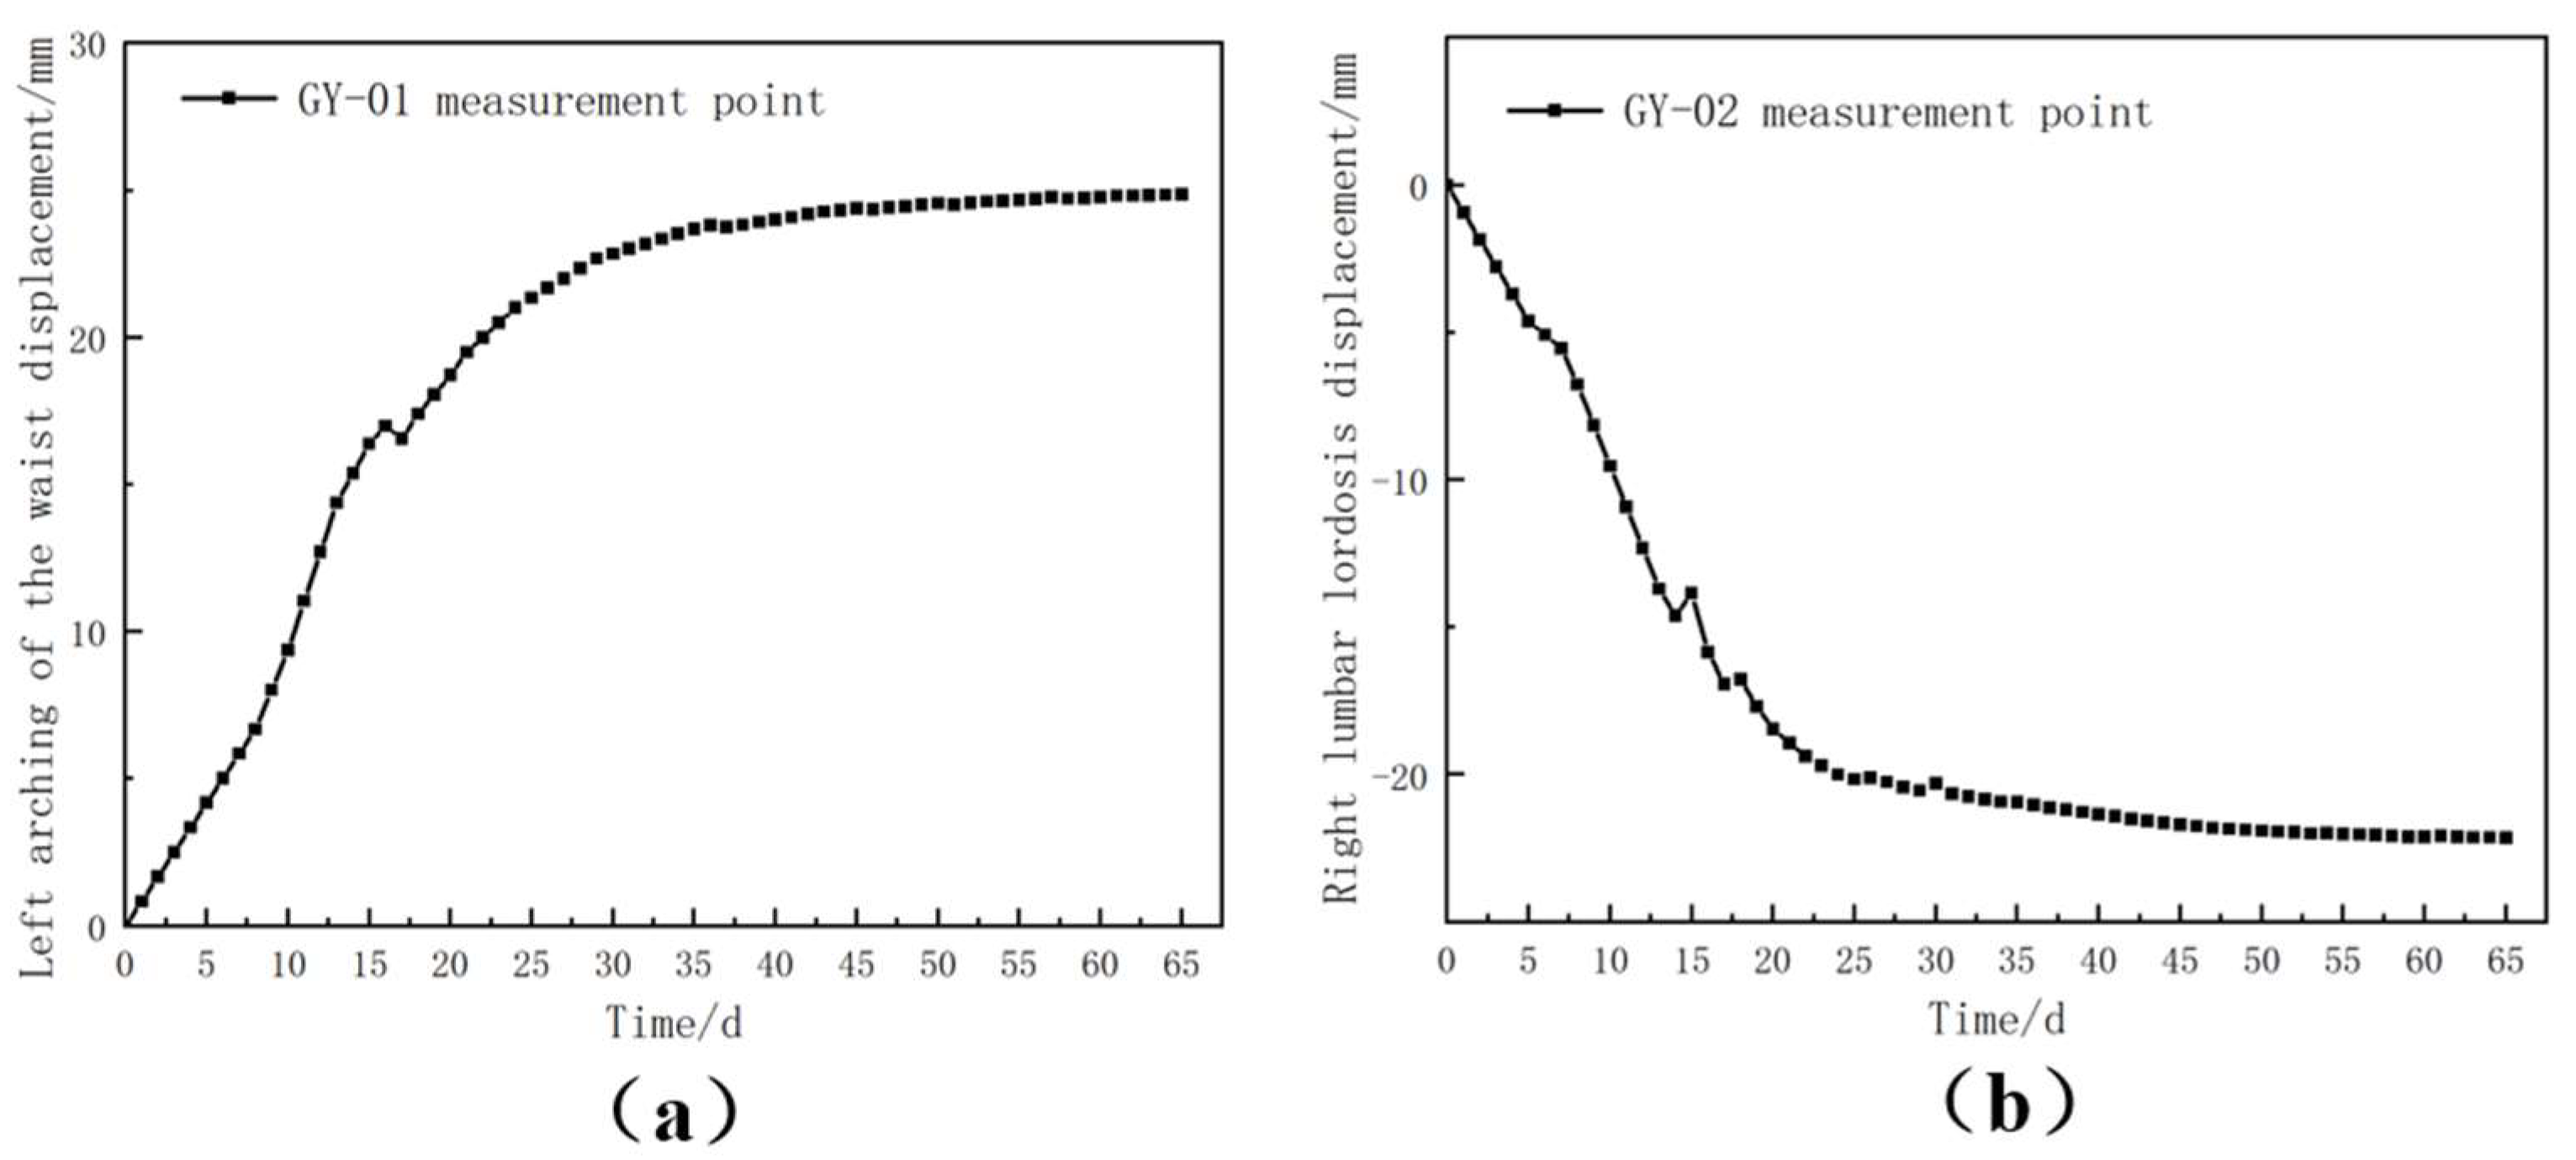

Table 1.
Tunnel Geological Complexity and Anticipated Risk Analysis Table.
| Starting Mileage | Ending Mileage | Length(m) | Surrounding Rock Grade | Geological Complexity Level | Collapse | Large Deformation |
| DK353+842 | DK354+390 | 548 | V | More complex | Highly likely | Possible |
| DK354+390 | DK354+640 | 250 | IV | Moderate complexity | Possible | Possible |
| DK354+640 | DK354+800 | 160 | V | More complex | Highly likely | Possible |
| DK354+800 | DK354+980 | 180 | IV | Moderate complexity | Possible | Possible |
| DK354+980 | DK355+230 | 250 | V | More complex | Possible | Possible |
| DK355+230 | DK357+140 | 1910 | IV | Moderate complexity | Possible | Possible |
| DK357+140 | DK357+500 | 360 | V | Simple | Possible | Possible |
| DK357+500 | DK357+564.91 | 64.91 | V | More complex | Highly likely | Possible |
Table 2.
Comparison and Analysis Table of Tunnel Construction Methods.
| Comparison Item | The Three-Step Method | The Three-Step Temporary Inverted Arch Method | The Double-Side Wall Pilot Tunnel Method | CD Method |
| Applicable rock class | Class III–V | Class IV–V | Class V–VI | Class IV–VI |
| Deformation control | Moderate | Good | Good | Better |
| Construction difficulty | Moderate | High | High | Relatively high |
| Construction procedure | Simple | Complex | Relatively complex | Relatively complex |
| Safety | Moderate | Relatively high | High | High |
| Project cost | Moderate | High | High | Relatively high |
Table 3.
Computational parameters of the numerical simulation model.
| Material classification | Elastic Modulus (GPa) | Poisson's ratio | Unit weight (kN/m3) | Cohesion (kPa) | Internal friction angle (°) |
| Surrounding rock | 0.20 | 0.4 | 19.7 | 45.6 | 25 |
| Initial support | 31.4 | 0.2 | 22.0 | — | — |
| Rock bolt | 210 | 0.3 | 78.5 | — | — |
| Advance small pipe umbrella | 93 | 0.3 | 78.5 | — | — |
| Temporary support | 31.4 | 0.2 | 22.0 | — | — |
Table 4.
The distribution and extreme values of the tension and compression stresses of the initial support after excavation by different construction methods.
Table 4.
The distribution and extreme values of the tension and compression stresses of the initial support after excavation by different construction methods.
| Construction method | Tensile stress (MPa) | Location | Compressive stress (MPa) | Location |
| The three-step method | 22.32 | Vault | -41.56 | Arch springing |
| The three-step temporary inverted arch method | 34.22 | Vault | -45.11 | Arch springing |
| The double-side wall pilot tunnel method | 12.25 | spandrel | -31.66 | Arch springing |
| CD method | 22.79 | Vault | -30.97 | Arch springing |
Table 5.
The maximum and minimum values as well as the distribution of the axial tension and compression stresses of anchor rods after excavation by different construction methods.
Table 5.
The maximum and minimum values as well as the distribution of the axial tension and compression stresses of anchor rods after excavation by different construction methods.
| Construction method | Tensile stress (MPa) | Location | Compressive stress (MPa) | Location |
| The three-step method | 540.19 | spandrel | -16.70 | Arch springing |
| The three-step temporary inverted arch method | 142.98 | spandrel | -22.48 | Arch springing |
| The double-side wall pilot tunnel method | 104.54 | spandrel | -26.34 | Arch springing |
| CD method | 181.09 | spandrel | -30.49 | Arch springing |
Table 6.
Comparison between numerical simulation results and on-site monitoring results.
| Monitoring Items | Numerical Simulation(mm) | Monitoring and Measurement(mm) | Deviation(mm) | Percentage Deviation |
| Vault Settlement(GD-01) | -38.92 | -35.17 | 3.75 | 9.64% |
| Horizontal Displacement(GY-01) | 26.52 | 24.86 | 1.66 | 6.26% |
| Horizontal Displacement(GY-02) | -24.36 | -22.15 | 2.21 | 9.07% |
Disclaimer/Publisher’s Note: The statements, opinions and data contained in all publications are solely those of the individual author(s) and contributor(s) and not of MDPI and/or the editor(s). MDPI and/or the editor(s) disclaim responsibility for any injury to people or property resulting from any ideas, methods, instructions or products referred to in the content. |
© 2025 by the authors. Licensee MDPI, Basel, Switzerland. This article is an open access article distributed under the terms and conditions of the Creative Commons Attribution (CC BY) license (http://creativecommons.org/licenses/by/4.0/).
Copyright: This open access article is published under a Creative Commons CC BY 4.0 license, which permit the free download, distribution, and reuse, provided that the author and preprint are cited in any reuse.


