Submitted:
31 October 2025
Posted:
04 November 2025
You are already at the latest version
Abstract
Global carbon emissions are driving the maritime industry toward cleaner fuels, with LNG already established as a transitional option that reduces SOx, NOx, and particulate emissions relative to conventional marine fuels and in line with decarbonisation strategies. This research aimed to explore the transition of offshore and marine platforms from conventional marine fuel to a cleaner option, with Liquefied Natural Gas (LNG) emerging as the principal transitional fuel. Subsequently, Floating Liquefied Natural Gas (FLNG) platforms are increasingly being deployed to harness offshore gas resources, yet they face critical challenges related to weight, space, and energy efficiency. The study proposes pathways for transitioning FLNG energy systems from LNG to zero-carbon fuels, such as hydrogen derived directly from LNG resources, to optimise fuel supply under the unique operational constraints of FLNG units. The work unifies the independent domains of pure fuel and blending fuel processes for LNG and hydrogen, viewed in the context of thermodynamic processes, to optimise hydrogen–LNG co-firing gas turbine performance and meet the base power line of 50 MW. Furthermore, the research article will contribute to the development of other floating production platforms, such as FPSOs and FSRUs. It will be committed to clean energy policies that mandate the support of green alternatives in substitution for hydrocarbon fuel utilisation.
Keywords:
FLNG
; hydrogen
; methane
; natural gas
; gas turbine
; combustion
; NOx
1. Introduction
In alignment with the IMO’s 2018 strategy, which targets a 40% reduction in CO₂ emissions by 2030 and 70% by 2050 (from 2008 levels), the adoption of LNG is accelerating. However, unresolved issues, such as methane slip and unburned hydrocarbon emissions, limit its long-term sustainability. The study proposes pathways for transitioning FLNG energy systems from LNG to zero-carbon fuels such as hydrogen, derived directly from LNG resources. Emphasis is placed on hydrogen–LNG co-firing gas turbine performance within an environment, linking Aspen HYSYS, MATLAB, and ANSYS Fluent.
Aspen Hysys thermodynamic modelling was used to evaluate pure LNG, blended LNG-hydrogen fuel, and pure hydrogen gas turbine models, highlighting trade-offs between efficiency and thermodynamic optimisation. Results show that co-firing with hydrogen (high specific energy) yields a distinct advantage over LNG for gas turbines used in FLNG power generation. To validate this concept, hydrogen gas turbines are examined in dual-fuel configurations, including the feasibility of applying complex processes in gas turbines for FLNG power systems.
Gas turbine performance for a 50 MW unit was modelled in Aspen Hysys to focus on the process of 0-100% hydrogen blends. Parameters analysed included air-fuel ratio (AFR), Wobbe index, turbine inlet temperature, and other parameters, with a sensitivity analysis to quantify the effects of pressure ratio, equivalence ratio, and hydrogen fraction on efficiency, stability margins, and performance, which was validated with Gasturb software. The methodology bridges gas turbine performance to provide a transferable framework for fuel-flexible turbine optimisation for hydrogen blending, AFR calibration, and NOx reduction, aiming to mitigate the challenges of next-generation offshore turbines.
2. Materials and Methods
This research develops a comprehensive modelling and validation framework for the FLNG platform through the hydrogen-enriched gas turbine power system. Overall, this work not only supports the IMO’s decarbonization goals but also delivers a technology framework that unifies LNG fuel and advanced Gas turbine combustion. The findings contribute to the next generation of sustainable FLNG operations and to a clean energy framework that unites LNG liquefaction, hydrogen generation, and gas turbine co-firing, providing a transferable model for clean power generation across a broad spectrum of floating maritime platforms.
This study uses Aspen HYSYS software as a simulation tool to achieve a comparable process model. For fair analysis, the process must follow the exact defined specifications within the decided specifications, including the constraints and system boundaries for the model. A validation process will be followed up at an industrial level using Gasturb software to verify the research findings, and MATLAB will be used to perform complex calculations and generate a combustion heat map. All cases developed in this study must provide the methods for achieving the objectives.
3. FLNG Power Generation
The working principle of FLNG is the same as that of other offshore floating platforms, such as FPSOs. The key difference lies in its inclusion of both gas processing and liquefaction equipment, along with a storage system, as referred to in the reference. [1,2] In this thesis, a clean-energy unit for power generation is added, and a carbon-emission control unit is also implemented. [3] The power generation system is required to accommodate various facilities, including crew accommodation, gas processing, LNG production, Transfer systems (Risers, turrets, offloading equipment, etc.), a hydraulic power unit for remote valve controls, and a clean energy unit for hydrogen reforming and carbon capture.
The power demand for FLNG is very high due to the large number of compressor trains in the process, which range from 100 to 250 MW. Several electrical motors are the most favourable choice for driving the compressor, unless a gas turbine, such as a gas injection unit, directly drives some compressor units. This research focuses on a single gas turbine unit for FLNG, facilitating the proposal of a 50MW gas turbine. Later in the simulation, the target will be an electricity production capacity of 50MW for a hydrogen-fuel-only gas turbine featuring CO2 emission control. [3,4]
3.1. Hydrogen Marine Fuel
Refer to the previous article in the Gases journal, which compares hydrogen fuel with other hydrocarbon fuels in the marine sector. The specific heat value of liquid hydrogen is 4.894 times larger than that of conventional fuels, and the density of liquid hydrogen is 11.268 times smaller than that of traditional fuels. Hydrogen is an energy carrier, similar to electricity, that requires primary energy sources, such as hydropower or solar power, meaning that hydrogen production relies on primary feedstock. These energy carrier characteristics make hydrogen an ideal fuel source, in combination with hydrocarbon fuels, for generating electricity and for long-term power generation. The combustion of hydrocarbons produces various harmful emissions that contribute to air pollution in the marine environment, thereby exacerbating climate change. [5,6,7,8]
3.2. Using Natural Gas as a Hydrogen Precursor
On offshore floating platforms, natural gas/methane is primarily produced by reforming, which produces hydrogen. This process is also proposed for FLNG, aiming to innovate the small SMR plant to produce hydrogen marine fuel. The high methane content of natural gas is utilised to produce hydrogen through the SMR plant's process flow, where it is mixed with steam and reacts with a nickel-based catalyst inside the reformer reactor. One crucial factor is to preset the hydrogen fuel output, as direct natural gas use in gas turbine power generation requires a controlled input to establish the operating cost of an SMR plant. Carbon emissions will occur during hydrogen production, as referred to in the previous article. [9,10,11]
3.3. Hydrogen Safety Aspect
The potential for hydrogen to create a hazardous situation for humans is attributed to its high energy content and favourable combustion properties, as discussed previously. Hydrogen gas, however, possesses safety-enhancing properties that are not often considered by the public. One of these is the buoyancy of hydrogen gas compared to air, as well as the relatively short time it takes to gain a sufficient altitude, as observed in simulations undertaken at the University of Miami. [12]
The fuel release experiments by Swain provide some insight into the safety-enhancing features of hydrogen and indicate that human safety in its presence is relative. This experiment suggests that hydrogen is a safer fuel than liquid hydrocarbon fuels.
Liquid hydrogen safety research, particularly in the event of significant spills, has been investigated through tests conducted by Arthur D. The conclusions from these spill tests indicated that such a spill does not pose the same danger as a spill of other conventional fuels. Basic chemical considerations support these conclusions based on this test. [12]
Firstly, the evaporation rate of hydrogen compared to gasoline is twenty times quicker under the influence of a flame. Secondly, the released evaporated hydrogen attains altitudes of several hundred meters within mere tens of seconds, whereas evaporated hydrocarbon-air mixtures remain at ground level for several hours. Additionally, a hydrogen flame radiates less than one-tenth the energy per unit area normally emitted by gasoline, and hydrogen emissions are < 0.1 compared to 1.0 for hydrocarbon fuels. However, tank ruptures caused by excessive tank pressure buildup or other factors may spark a fire from metal tearing during the rupture. In the case of non-integral liquid hydrogen tank technology, proposed here for a floating production platform. [13,14]
4. Hydrogen Gas Turbine Technology
Hydrogen fueling of gas turbines has a long research history, dating back to 1943 with a liquid hydrogen experiment at Ohio State University in the US. Current gas turbine technology and research focus on the compressor, combustor, and turbine components, with the combustor design being the most critical for hydrogen fuel applications. The combustion process is a fundamental thermodynamic process of the Brayton cycle, aiming to enhance efficiency through various thermodynamic options. [15,16]
In this thesis, the focus is on the combustor for hydrogen flame stability, with research software utilised in conjunction with Aspen Hysys process flow and Ansys CFD flow analysis to validate the process by comparing flame stability with published hydrogen flame stability analyses. Research methodology to use the current gas turbine to be modified with a combustor design and a fuel mixing system. These modifications are required to study the combustion properties of hydrogen and natural gas, given hydrogen’s higher flame speed and shorter auto-ignition delay time compared to methane, the primary constituent of NG. [17,18,19]
5. Theory and Equations
5.1. Gas Turbine Technology
Gas turbine combustion cycles are based on the simple Brayton Cycle. The efficiency of the gas turbine is the ratio of the net output to the gross heat input, as shown below.
where:
WTurbine = Turbine Work; WCompressor = Compressor Work.
mf = fuel mass flow rate.; LHV = lower heating value of fuel
The heat input to the gas turbine is calculated by multiplying the fuel's heat value by its mass flow rate.
Assumption that fuel combustion within a period of one unit t sec, to calculate the power output of the gas turbine as
5.2. Gas Turbine Pressure Ratio (PR)
The pressure ratio (PR) of the gas turbine is the most critical parameter for the thermodynamic efficiency and specific work output. However, a higher PR will increase the temperature rise across the turbine, generally leading to higher thermal efficiency, mechanical stress, and cooling demands. It is essential to perform a sensitivity analysis of the elevated best PR to ensure the turbine operates within safe thermal limits and achieves the target performance and energy output. [22]
To design the process cycle,
For the compressor, specify the temperatures T1 and T2 of the inlet and outlet, respectively, as well as the compressor's isentropic efficiency. To compute the isentropic outlet temperature T2S.
Use the isentropic relation (air, γc ≈ 1.4)
For the turbine, specify the inlet and outlet temperatures, T3 and T4, and the turbine isentropic efficiency, ƞt, to compute the isentropic outlet temperature, T4S.
Use the isentropic relation (hot gas, γt ≈ 1.3-1.33)
In the simple cycle, the overall cycle PR is set by the compressor PRc, and the turbine expansion ratio PRt is slightly lower due to combustor and diffuser pressure losses.
To get the optimum PR ratio for this case of 50MW, it can be taken from the PR sensitivity analysis graph and can also be calculated analytically to get the maximum specific work as,
With the given turbine inlet temperature (TIT) and γ ≈ 1.4. [20]
5.3. Fuel Flow Calculation
Alternative ways to calculate the fuel flow rate for the required turbine output capacity, firstly, to get the specific energy content of the fuel, such as the lower heating value (LHV) of each fuel and the required thermal efficiency of the gas turbine
The energy content of hydrogen, as its lower heating value (LHV), is approximately 0.34 MJ/kg, whereas LNG, primarily composed of methane (CH4), has an energy content of roughly 0.52 MJ/kg. The mass fuel flow rate for co-firing depends on the ratio of energy contributions from each fuel. [20]
5.4. Fuel Split Ration Calculation for Blending Fuel
It will depend on the percentage, which is determined by the Volume percentage (~Molecular percentage) at the mixer. If required to convert to mass fraction, multiply by the total fuel mass flow rate, using the molecular weights (hydrogen, MWH2, is 2.016 g/mol, and methane, MWCH4, is 16.043 g/mol). There are different ways to split the fuel for a mixed ratio. If the design is based on the molar (volume) ratio, we must consider mass fraction and another factor for energy sharing, which will differ from the volume percentage-based approach. [20]
For mol-share, the mass fraction will be adjusted according to the volume ratio of the fuel blend for fuel species i and j.
where = mole (or Volume) fraction of species i
MWi = molecular weight of species i (kg/kmol)
MWj = molecular weight of species j (kg/kmol)
wi = mass fraction
Component mass flow for blending
For energy share, which is considered the heat energy divided by the portion to be extracted from the respective fuel feed, is calculated as the total fuel with the LHVs of hydrogen (≈ 120 MJ/kg) and methane (≈ 50 MJ/kg), and the cycle efficiency ƞ, as in equation 1.
Total mass flow rate,
5.5. Stoichiometric Air to Fuel Ratios
The optimal air-to-fuel ratio to achieve equal energy contributions will depend on the specific properties and energy content of the fuels, especially for a gas turbine co-firing hydrogen (H2) and liquefied natural gas (LNG), as the primary component is methane (CH4).
As per the equation, for every mole of methane, 2 moles of oxygen (or approximately 9.52 moles of air) are required for complete combustion, to convert this to a mass ratio:
Molecular weight of methane (CH4) =16.04 g/mol and molecular weight of air (approximately 78% nitrogen and 21% oxygen) ≈ 28.97 g/mol (since the average molecular weight of air is close to this value). The mass of air required for stoichiometric combustion per unit mass of methane can be calculated as follows:
Thus, the stoichiometric fuel-to-air mass ratio for LNG (assuming it is primarily methane) is approximately 1:17.2.
The stoichiometric ratio for hydrogen fuel in a gas turbine is the ideal proportion of hydrogen and oxygen required for complete reaction, leaving no excess reactants. For hydrogen (H₂) combustion in air, the stoichiometric combustion reaction is: two molecules of hydrogen gas react with one molecule of oxygen gas to produce two molecules of water vapour and release energy. [16,20,23,24]
To calculate the stoichiometric AFR, use molecular weights: hydrogen (H2) 2 g/mol and oxygen (O2) 32 g/mol. [25]
To calculate the air-to-fuel ratio (AFR) for the mixture, for equal energy contribution as
Given the energy formula of the product of mass and lower heating value (LHV)
where m is the mass flow rate, A is the air flow rate
5.6. Wobbe Index for Co-Fire Gas Turbine
The Wobbe index is a critical parameter for assessing the interchangeability of fuel gases, including their performance in gas turbines. It is defined as the higher heating value (HHV) of the gas divided by the square root of its specific gravity (relative density).
For a gas turbine, especially in co-firing scenarios like Hydrogen and Liquefied Natural Gas (LNG), understanding the Wobbe index helps to ensure proper combustion and efficient operation, which requires higher heating value (HHV) and specific gravity of fuel (SG), as follows the equation to optimise the combustion process of mixed fuel characteristics.
For a co-fired turbine, the effective Wobbe index (WI _ mix)
5.7. Equivalence Ratio (φ) and Excess Air Ratio(λ), and Pressure Ratio (π)
Besides the fuel-air ratio, other ratios are essential in gas turbine thermodynamics and combustion analysis, such as the equivalence Ratio (φ), excess Air Ratio(λ) and pressure Ratio (π) for both single-fuel (non-blending) and multi-fuel blends, such as H2-LNG in this research.
The equivalence ratio and excess air ratio equation is
Since
(λ)= 1.0 stoichiometric; (λ)> 1.0 lean combustion (extra air); (λ) < 1.0 rich combustion
For the actual air flow of lean-premixed
For multi-fuel mixtures
Finally:
In practical turbine operation, the turbine never operates at stoichiometric conditions; otherwise, the flame temperature would be too high, leading to thermal NOx emissions and material failure.
Instead, lean premixed combustion is used at a typical equivalence ratio of φ = 0.3-0.6, corresponding to a FAR of 30-60% of the stoichiometric value.
This keeps TIT (Turbine Inlet Temperature) around 1350-1500 °C to align with material limits. For a hydrogen turbine, the stoichiometric FAR for H2/air by mass is 0.029 (≈ 2.9%), and the typical turbine operating FAR is 0.009-0.018 (≈ 0.9-1.8%) under lean premixed conditions to reduce NOx and protect turbine materials. [20]
5.8. Equation for Stoichiometric Requirement per Mole of Blended Fuel
For a fuel blend of methane (CH₄) and hydrogen (H₂),
where x is the molar fraction of H₂ in the blended fuel stream.
So: stoichiometric O₂ requirement per mole of blended fuel mixture,
This equation will provide the stoichiometric oxygen demand in mol of oxygen per mol of fuel mixture as a function of x,
When x = 0, all methane VO2,st = 2 and when x = 1, all hydrogen VO2,st = 0.5. As the hydrogen fraction increases, the oxygen requirement per mole of fuel drops because hydrogen needs less oxygen than methane. [20,27,28]
And stoichiometric moles of air
Equation for Stoichiometric AFR (mass basis)
Excess air factor with equivalence ratio equation 6-31for 21% of oxygen in dry air, the molar flow rate will be,
5.9. Hydrogen Fuel Combustion Correlation with NOx Emission
NOx formation in hydrogen-fueled gas turbines is a critical concern because hydrogen flames, although carbon-free, exhibit exceptionally high adiabatic flame temperatures and rapid reaction kinetics that strongly promote thermal NO formation through the extended Zeldovich mechanism. In lean-premixed hydrogen–air combustion, the high diffusivity of hydrogen and short chemical time scales result in steep temperature gradients and localised hot zones, where molecular nitrogen reacts with atomic oxygen to form NO, even in globally lean conditions.
The rate of NO production is exponentially sensitive to the flame temperature and residence time in the high-temperature region, making the control of adiabatic flame temperature (Tad) and equivalence ratio (ϕ or λ) central to low-emission turbine operation. Unlike hydrocarbon fuels, hydrogen contains no fuel-bound nitrogen, so the prompt-NO and fuel-NO pathways are negligible. However, the dominance of thermal NOx at high flame speeds presents a challenge for maintaining ultra-lean, stable combustion without incurring flashback or excessive heat loss. Consequently, research on hydrogen turbines emphasises precise mixture control, staged combustion, and advanced cooling or dilution strategies to suppress NOx while sustaining flame stability and turbine efficiency.
There will be a base point for measuring the NOx index, and the surrogate's qualitative Tadd adiabatic temperature, rather than a predictive ppm model to obtain the actual emission proxy. We can use the Zeldovich-type correlation, keyed to the adiabatic flame temperature calculator and heat loss assumptions, as per the equation.
where Eeff ≈ 75-80 kcal/mol
β ≈ 2-3 (>0 leaner to lower NOx)
γ ≈ 0.5-1.0 (weak pressure effect for premixed flame
C: calibrated from 1-2 known NOx data points
5.10. Complexity for Molar Flow and Mass Flow
To meet the baseline power requirement, the stoichiometry per mole will vary, as hydrogen requires 0.5 mol of oxygen and methane requires 2 mol of oxygen. Even though hydrogen moles are higher, the demand for oxygen per hydrogen mole is lower, so total air demand doesn’t scale 1:1, which should be calculated as;
Energy per mole; LHVhydrogen ≈ 242 MJ/kmol , LHVmethane= 800 MJ/kmol, to deliver the same shaft power output required 3.3 times more hydrogen than methane.
Energy per mass: LHV hydrogen ≈ 120 MJ/kgmol, LHV methane = 50 MJ/kgmol. For hydrogen, the energy per mass is stronger than for methane, so the mass flow of hydrogen can be smaller.
6. Simulation Analysis of Hydrogen Gas Turbine
Gas turbines are a primary power source for offshore floating platforms; all gas turbines are investigated and simulated using simple-cycle gas turbine flow diagrams. Compressors generate air to high pressure in the combustion chamber and further expand it through two-stage turbines, producing high- and low-pressure streams. High-pressure turbine (HPT) and low-pressure turbine (LPT) power output to link the FPSO power generator. Gas generators are controlled by the amount of fuel supplied to the compressor.
The chemical process software Aspen HYSYS (version 11) is used in conjunction with ANSYS simulation to predict and validate process-level performance in computational fluid dynamics (CFD). It is used to analyse the combustion flames of methane, hydrogen, and hydrogen-methane blended flames, and to compare them with other published flame stability analyses. This thesis develops the transition towards low-carbon energy systems, which has brought natural methane (CH₄), hydrogen (H₂) and dual fuel for a simple of 50 MW class gas turbine that provides an optimal test rig case for investigating the operational impact of fuel flexibility and validates a dual-method simulation framework, Research methodology to consider for three scenarios: a gas turbine with single fuel LNG and hydrogen, and a gas turbine for the co-firing of LNG and hydrogen. To achieve 50 MW of electrical power, the approximate shaft power is 52.5-53.5 MW, depending on the generator efficiency. [17,29]
The methodology enables a comprehensive evaluation of turbine efficiency, air–fuel ratios, exhaust conditions, flame stability, and emissions under various H₂/CH₄ mixing ratios. This is because hydrogen-rich fuel alters combustion dynamics, potentially leading to flashback and increased NOx formation, whereas methane-rich fuel emits CO2. Aspen HYSYS simulation provides thermodynamic balances for the 50 MW gas turbine, enabling calculation of the turbine inlet temperature (TIT), air-fuel ratios, and exhaust composition. Aspen HYSYS results to use in Matlab for sweep analysis and ANSYS Fluent CFD combustion simulation for fuel composition, AFR, and TIT target to resolve combustion chamber flow, flame structure, and emissions. For the coupling strategy, Aspen outputs serve as boundary conditions in ANSYS, and ANSYS results, including flame stability and NOx emissions, are used to validate the results in Matlab and adjust the Aspen assumptions.
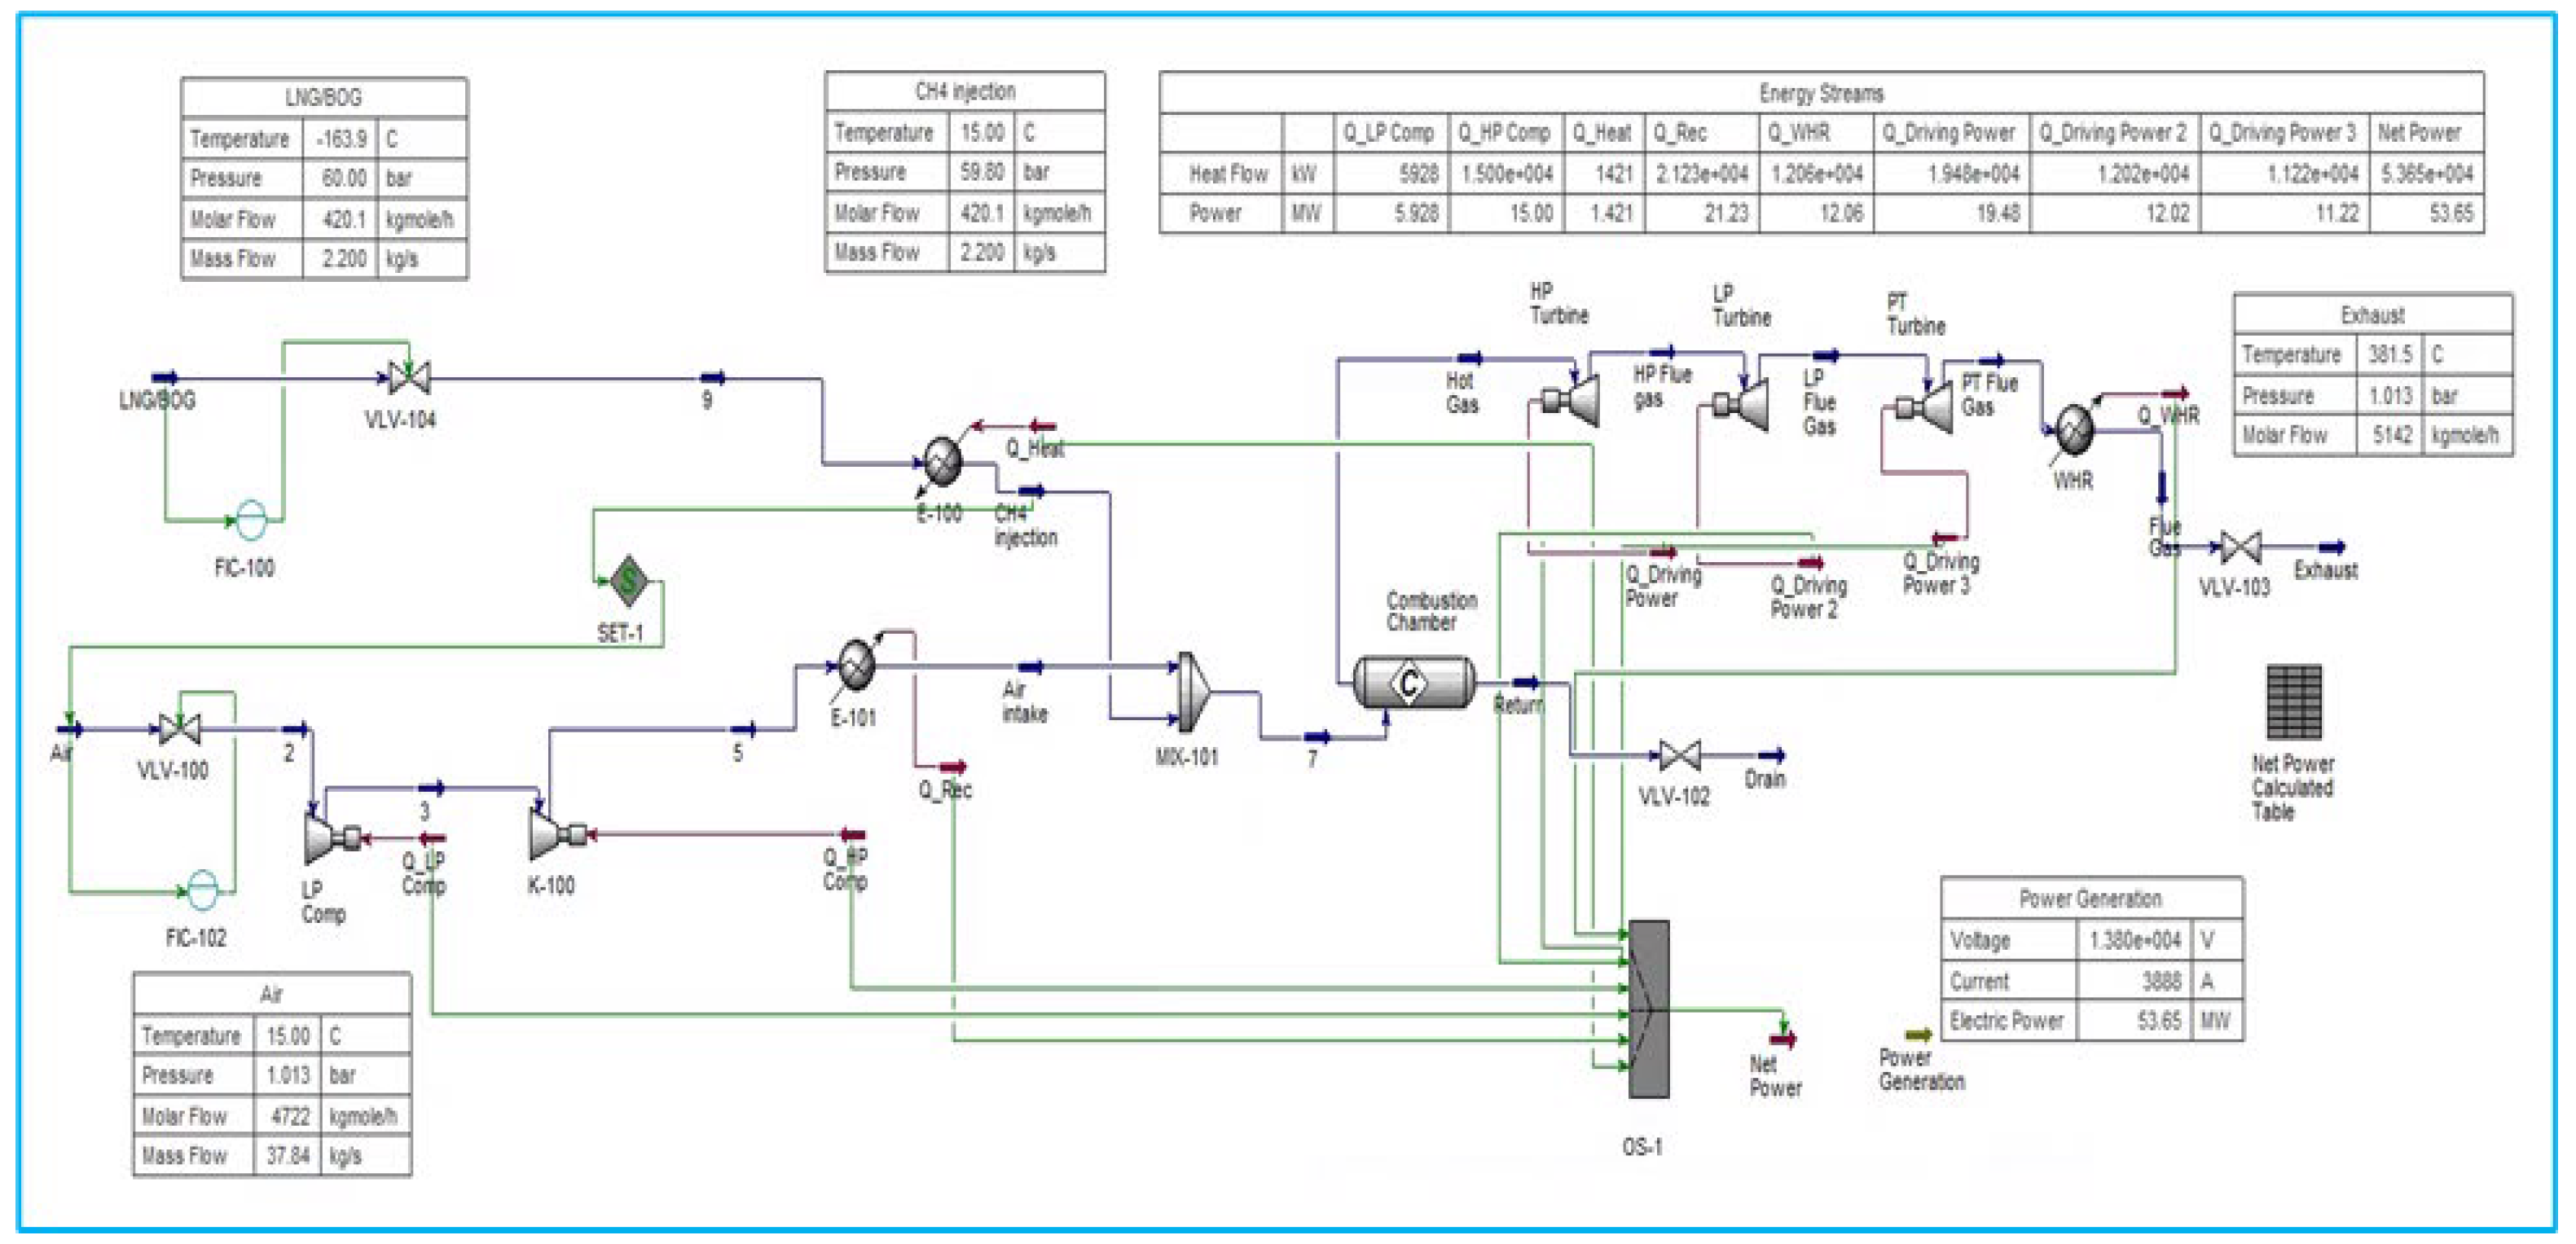
6.1. Model for Pure LNG Fuel Gas Turbine
LNG turbine modelling in Aspen HYSYS involves simulating the performance of a gas turbine using LNG as fuel to support the design, optimisation, and operation of chemical reactions. This is set up using the thermodynamics and physical properties of the components, utilising the Peng-Robinson equation of state.
The model, which includes a compressor, heat exchanger, and combustion chamber, is used in conjunction with a stoichiometric conversion reactor. This setup integrates all equipment, allowing for parameter adjustments to achieve realistic performance characteristics. Simulation results evaluate the turbine's performance, including efficiency, power output, fuel consumption, and emissions.
Figure 1.
Gas Turbine Process Flow Diagram for pure LNG fuel.
6.2. Model for Pure Hydrogen Fuel Gas Turbine
Modelling a hydrogen turbine in Aspen HYSYS requires a detailed understanding of the system components, accurate estimation of thermodynamic properties, and careful integration of the combustion process. The simulation results can be used to optimise turbine performance and assess the feasibility of using hydrogen as a fuel in gas turbines.
Based on GT H2 100% simulation research, a hydrogen-rich fuel should be purified, which directly affects combustion stoichiometry, flame speed, and air–fuel ratio requirements. Unlike LNG, hydrogen’s much lower molecular weight results in significantly lower volumetric energy density, meaning that for the same turbine output, a higher volumetric flow rate of fuel is required despite the relatively modest mass flow rate. This behaviour is confirmed in the material streams data, where the hydrogen mass flow needed to achieve the desired turbine heat input is substantially lower than that of an equivalent LNG feed. Still, the molar and volumetric flows are markedly higher. This highlights the challenge in designing injectors, piping, and combustors, as hydrogen’s diffusivity and velocity profiles must be carefully managed to maintain flame stability and prevent flashback.
Figure 2.
Gas Turbine Process Flow Diagram for pure Hydrogen fuel.
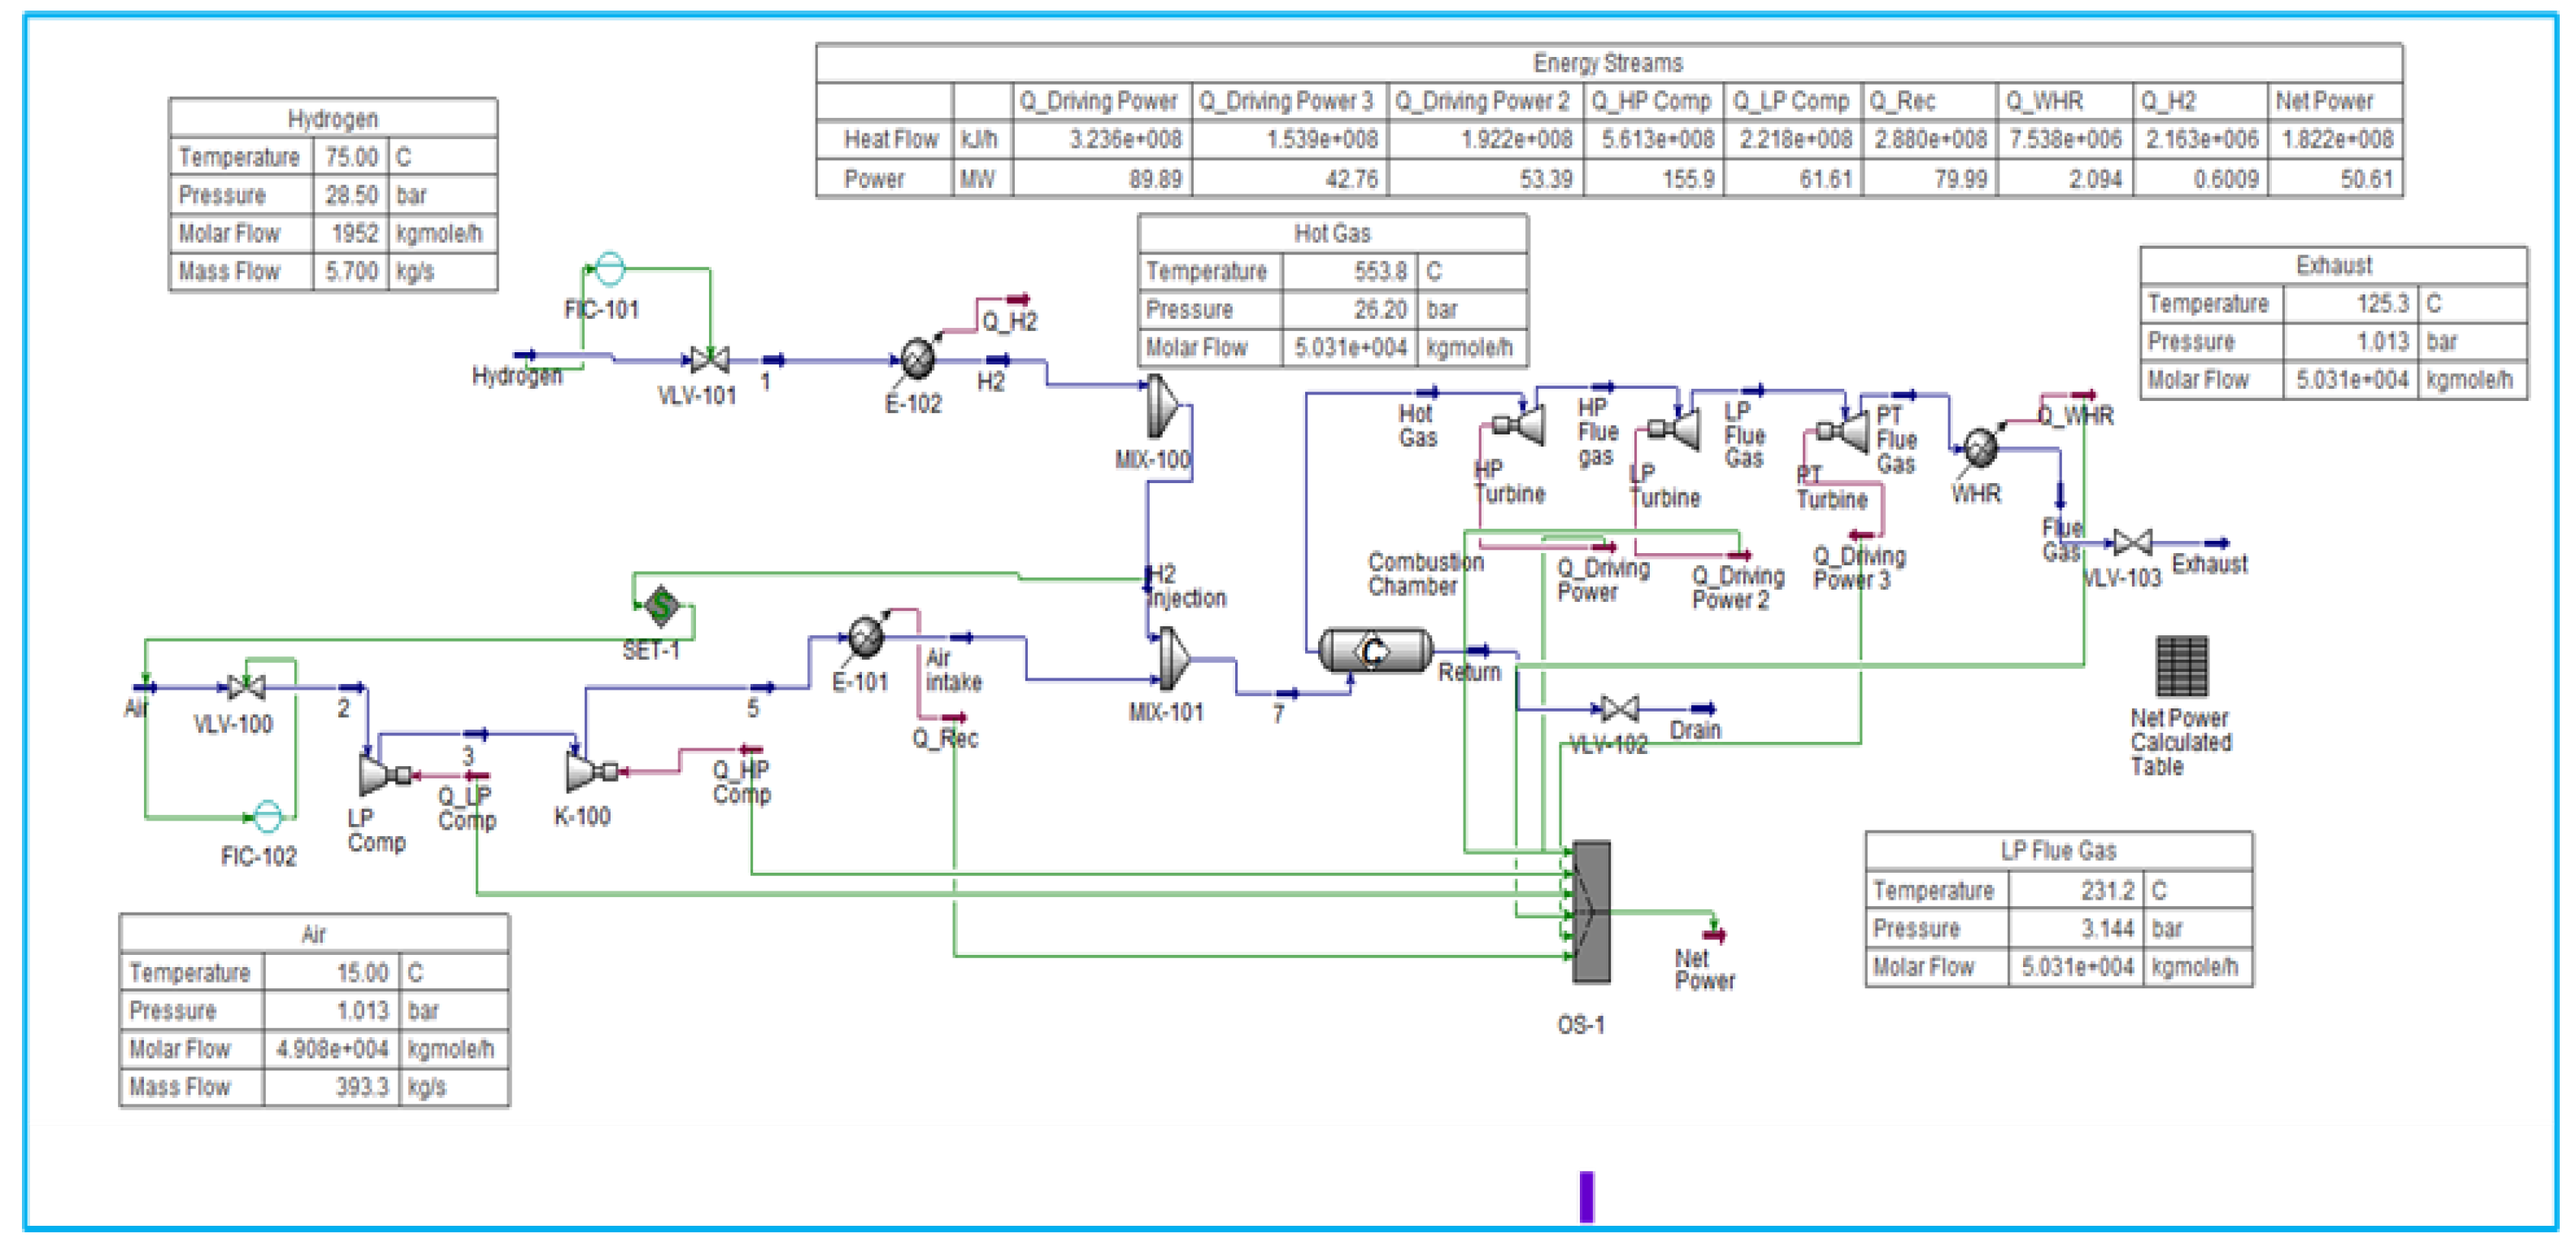
The energy streams further confirm that, while the total heat input is sufficient to sustain 50 MW-class turbine operation, the energy distribution across the cycle differs from that with LNG firing. Hydrogen combustion releases heat more rapidly, thereby increasing the local flame temperature. Still, the turbine efficiency trends indicate that matching air supply, dilution, and pressure ratio is critical to prevent excessive NOₓ formation and turbine material stress. The turbine power output and compressor power balance show that, although net power generation is comparable to LNG scenarios, the margin between compressor work and turbine expansion is narrower due to the different heat-release and mass-flow characteristics of hydrogen.
This suggests that cycle optimisation, particularly in compressor pressure ratio, combustor cooling strategies, and turbine expansion staging, is essential for hydrogen-only operation. These findings are consistent with open-source research by Siemens and GE on hydrogen turbine trials, which validate that, while hydrogen enables carbon-free operation, its unique thermophysical properties necessitate significant adaptations to turbine design and operation.
6.3. Model for Hydrogen-Blended Methane Fuel Gas Turbine
Modelling hydrogen-blended methane fuel in a gas turbine requires careful consideration of both injection dynamics and combustion characteristics to ensure flame stability, efficiency, and emission control. In this model, the co-firing of hydrogen (H₂) and liquefied natural gas (LNG, predominantly methane) is achieved by integrating fuel injection into the gas turbine combustor. The injection model defines premixed fuel streams, accounting for hydrogen's distinct physical properties, including its high diffusivity, low density, and broader flammability range compared with methane.
To capture the mixing and combustion processes, the combustor geometry is discretised to simulate fuel-air mixing, ignition stabilisation under turbine-relevant pressure and temperature conditions, which will be discussed further in Chapter 8 Hydrogen Gas Turbine Analysis.
Figure 3.
Gas Turbine Co-fired Test Rig Flow Diagram for pure H2-LNG fuel.
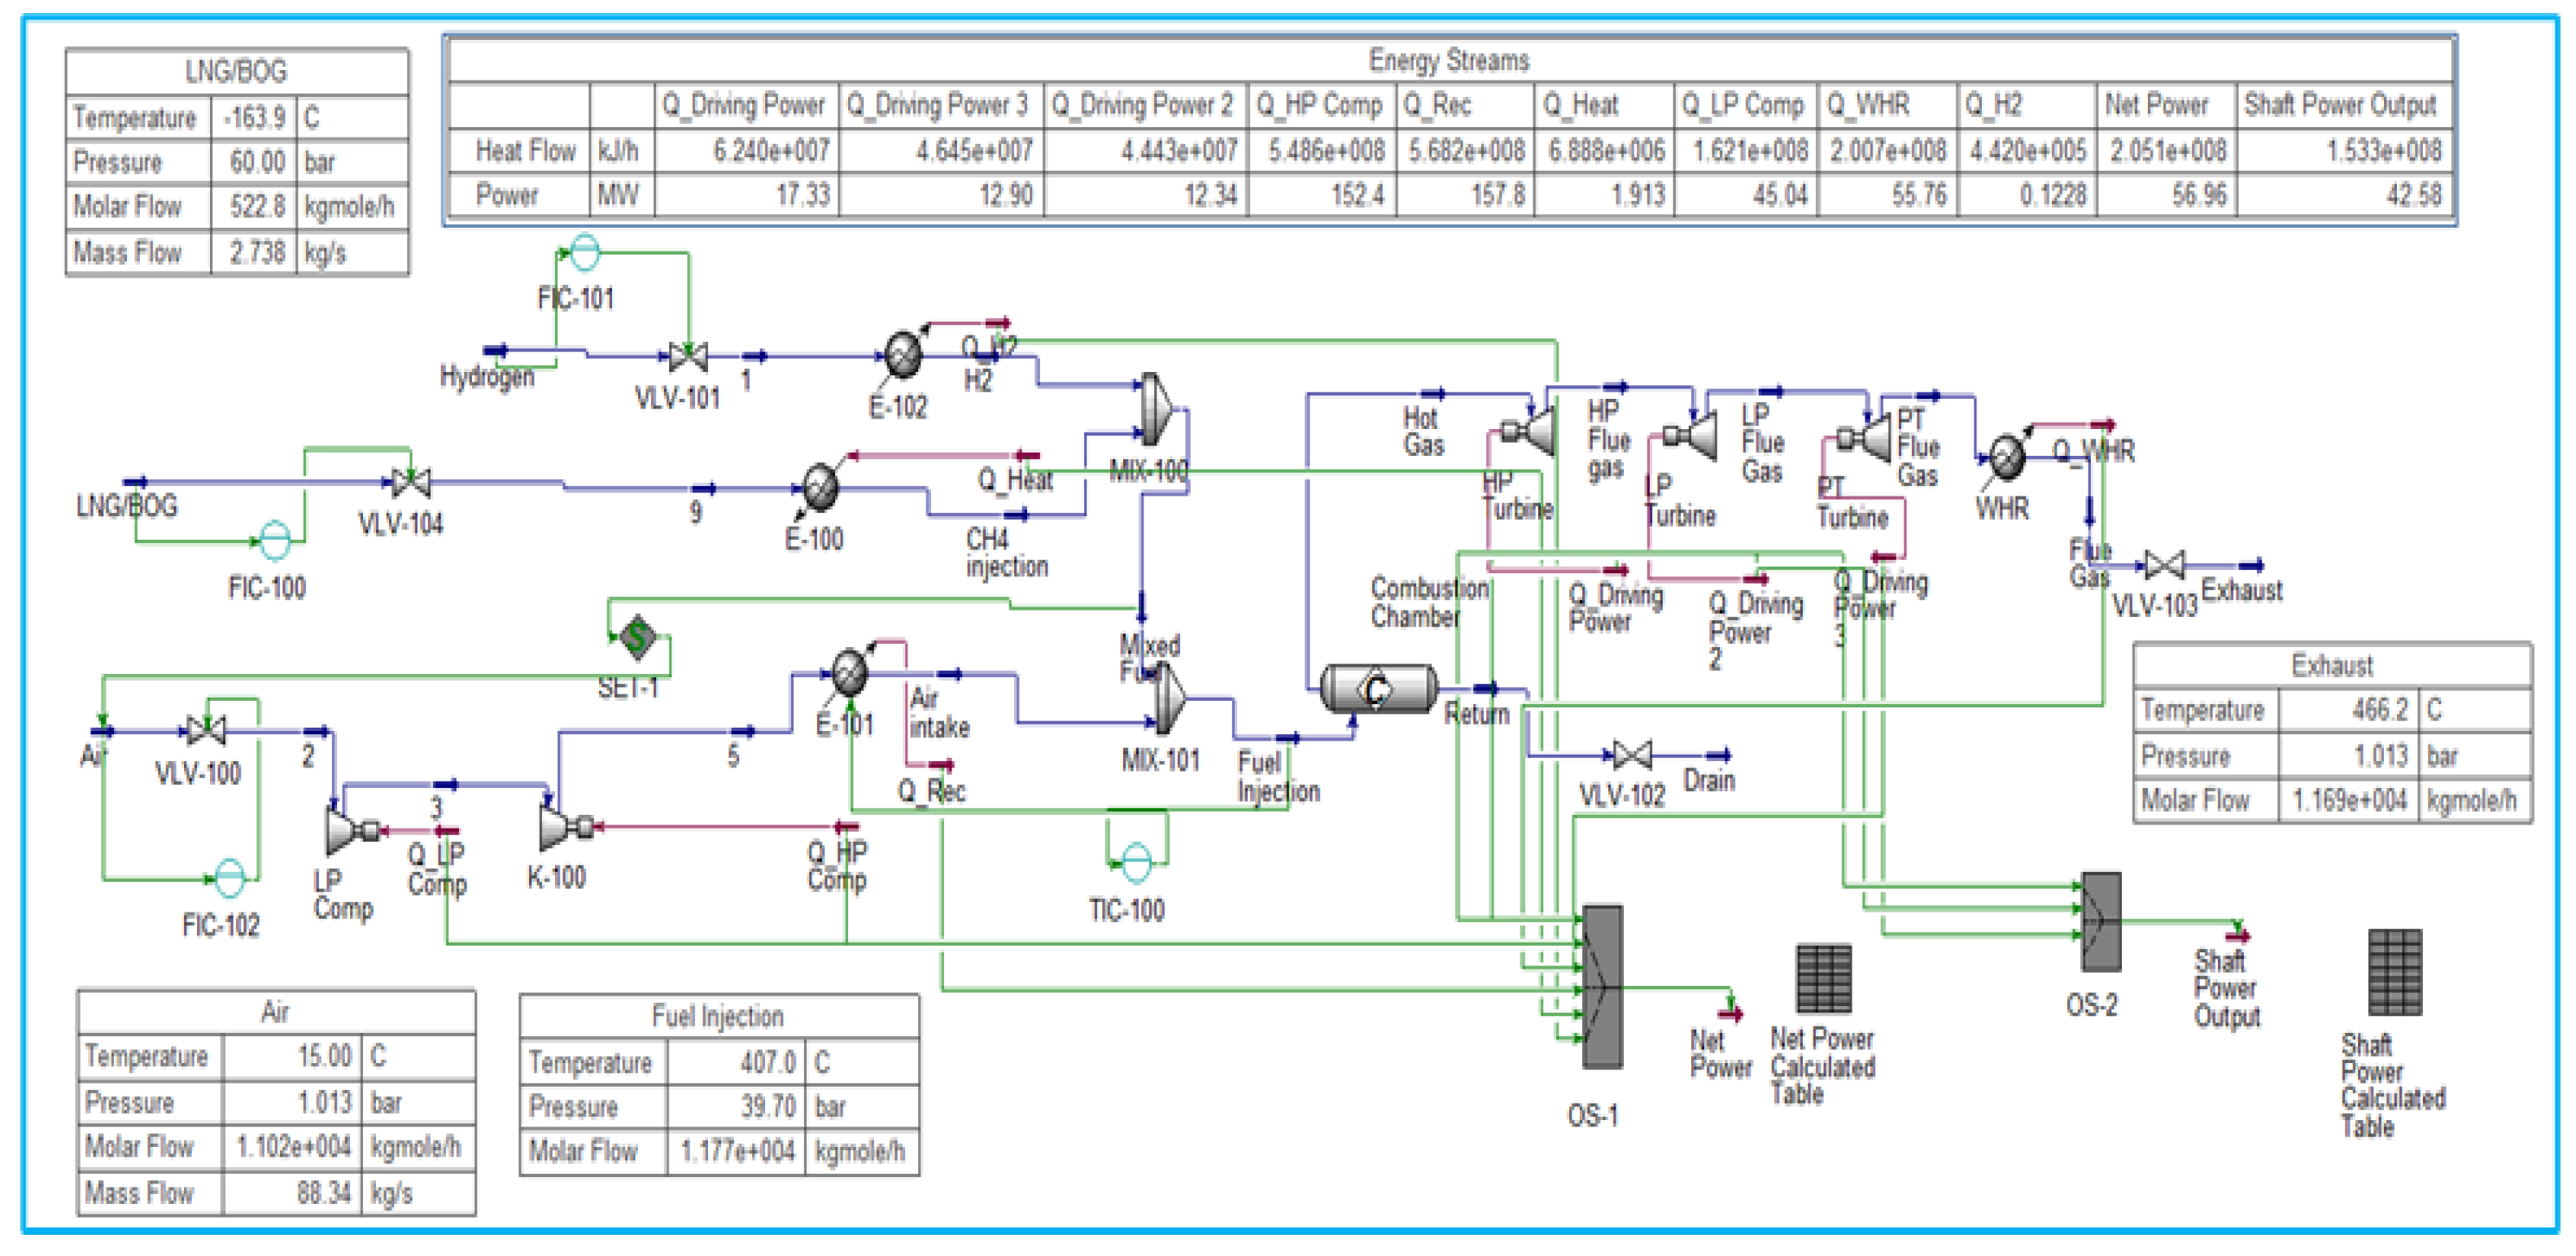
Firstly, research proposed a test rig in Aspen Hysys, a capacity-constrained rig that operates under control of the fuel molar flow within a range of 300-450 kmol/h. This envelope is suitable for injector sizing and fuel-train design based on current methane-fired turbine hardware, in accordance with current research practices for 50 MW power plants.
The second research pathway involves a performance-target comparison, aiming to maintain a fixed 50 MW net output across all blends and to evaluate the resulting requirements for fuel molar flow, air supply, and compressor work. Finally, the third angle of research explores the higher-efficiency cycle pathway. By considering recuperated or combined-cycle configurations, it becomes possible to reduce the fuel molar flow requirement per megawatt, easing the capacity gap for high-hydrogen blends.

Table 1.
Molar and Mass Air to Fuel Ratio.
| Hydrogen Fraction xx | Stoichiometric moles of Oxygen, νO2,st2 | Molar AFR | Fuel Molar Mass (g/mol) | Mass AFR |
| 0.0 (CH₄ only) | 2 | 9.52 | 16.04 | 17.2 |
| 0.3 | 1.55 | 7.38 | 12.69 | 16.76 |
| 0.5 | 1.25 | 5.95 | 10.03 | 16.91 |
| 0.7 | 0.95 | 4.52 | 7.37 | 17.29 |
| 1.0 (H₂ only) | 0.5 | 2.38 | 2.016 | 34.24 |
Application of air fuel ratio AFR for gas turbine combustion of blended fuel to be calculated using equation 6-36, shows that molar AFR decreases when hydrogen fraction increases. In contrast, mass AFR increases because hydrogen has a very low molecular weight; consequently, combustion may need more air per unit mass of hydrogen.
These five research scenarios provide a clear parametric map for setting the equivalence ratio, dilution fraction, and π to maintain TIT, NOₓ, and net efficiency within the target while signalling where hardware or control adjustments are needed as the fuel transitions from LNG-dominant to H₂-dominant. Key performance metrics, including turbine efficiency, temperature distribution, and emission co-firing studies. This model establishes a baseline framework for evaluating the operational feasibility of hydrogen–methane blends in a 50 MW-class gas turbine, providing a foundation for optimisation in terms of air–fuel ratio, injection velocity, and combustion chamber design.
7. Simulation Result Analysis
To normalise comparisons of operating constraints in typical gas turbine simulations operating on LNG and hydrogen (H2), a variable must be fixed to account for differences across fuels. The following are the standard variables to consider fixing:
1. Energy Content (Heating Value): Fixing the energy content (constant thermal input LHV) ensures that each fuel delivers the same amount of energy to the turbine to compare efficiency and emissions based on the same energy input. The heating value can be expressed in terms of MJ/kg or BTU/lb.
2. Power Output: Fixing the power output (constant net power) ensures that the turbine produces the same amount of power regardless of the fuel used, and allows for adjusting the air-fuel ratio by equivalent ratio φ or excess air ratio λ. This approach enables comparison of fuel consumption rates and emissions while maintaining the turbine's performance level.
3. Mass Flow Rate: Fixing the mass flow rate (constraint fuel flow rate) to ensure that the mass of the fuel entering the turbine per unit time is the same. This can be useful for comparing the volumetric and energy densities of different fuels.
4. Molar Flow Rate: Fixing the molar flow rate ensures that the number of moles of fuel entering the turbine per unit time is the same to compare the effects of different molecular structures on combustion characteristics.
5. Volume Flow Rate: Fixing the volume flow rate ensures that the volume of fuel entering the turbine per unit time is the same. This can be useful for comparing the space requirements and handling different fuels.
6. Combustor state: Fixing the combustor state to fix the equivalent ratio φ, the turbine inlet temperature TIT with a fixed pressure ratio PR. Only allow the fuel composition of hydrogen and LNG
Mainly, a practical approach for comparing different fuels in a gas turbine for a fair test to determine the Energy Content (Heating Value) LHV. This is because the primary purpose of the fuel is to provide energy, and fixing the energy content allows for a direct comparison of how efficiently each fuel is converted into mechanical or electrical power.
7.1. Overview of Constraint Fuel Flow Simulation for 50 MW Gas Turbine
Standard research practices typically involve changing either the shaft output power, turbine inlet conditions, equivalence ratio, or heat input and then calculating the outputs accordingly. In simple cycle efficiency calculation numerically for the band (ƞ≈ 0.35-0.41) using equation 6.9, would deliver power output ≈ 38.11 MW at hydrogen fraction 0%, 30.13 MW at 30%, 24.8 MW at 50%, 19.48 MW at 70%, and 11.5 MW only at 100% as referred to table 6-2. However, it could help isolate and test the effects of kinetic and mixing. Another factor to be adjusted to achieve the steady 50 MW is efficiency and LHV.
In this hydrogen gas turbine research, more emphasis is placed on the hardware capacity of the considered fuel train and injector limit rather than on the fairness criterion. This approach is clearly distinct from the constant-power comparison used to determine which hydrogen fraction performs best, intending to achieve 50 MW. As a research comparison of H2 blending, using the method of constraining the fuel molar flow, which is a critical view of the research proposal (fuel molar flow 300–450 kmol/h for “fair comparison”), based on analysis from the current research published data, as per the table,
Table 2.
Power output using conservative simple cycle efficiency ƞ = 0.38 and molar 300<x< 450 kmol/h.
Table 2.
Power output using conservative simple cycle efficiency ƞ = 0.38 and molar 300<x< 450 kmol/h.
| H₂ (%) | LHV_blend (kJ/mol) | P_net @ 300 kmol/h (MW) | P_net @ 450 kmol/h (MW) |
|---|---|---|---|
| 0 | 802.34 | 25.41 | 38.11 |
| 30 | 634.24 | 20.08 | 30.13 |
| 50 | 522.17 | 16.54 | 24.8 |
| 70 | 410.1 | 12.99 | 19.48 |
| 100 | 242 | 7.67 | 11.5 |
Despite the LHV per mole differing by blend. Fixing the fuel molar flow to 300–450 kmol/h is a crucial way to compare blending scenario, may yield inconsistent power results due to varying heat input as it allows for a more consistent comparison of thermal input and achievable power 50 MW across the blending process, after test rig result showing that 0-70% blending scenario achievable for 50 MW with constraint fuel molar flow however 100% pure hydrogen which fuel motor flow widely swings as shown in the table and plotted graph.
Figure 4.
Gas Turbine Test Rig results of molar flow (a) Air & Fuel (b) Compressor & Net Power.
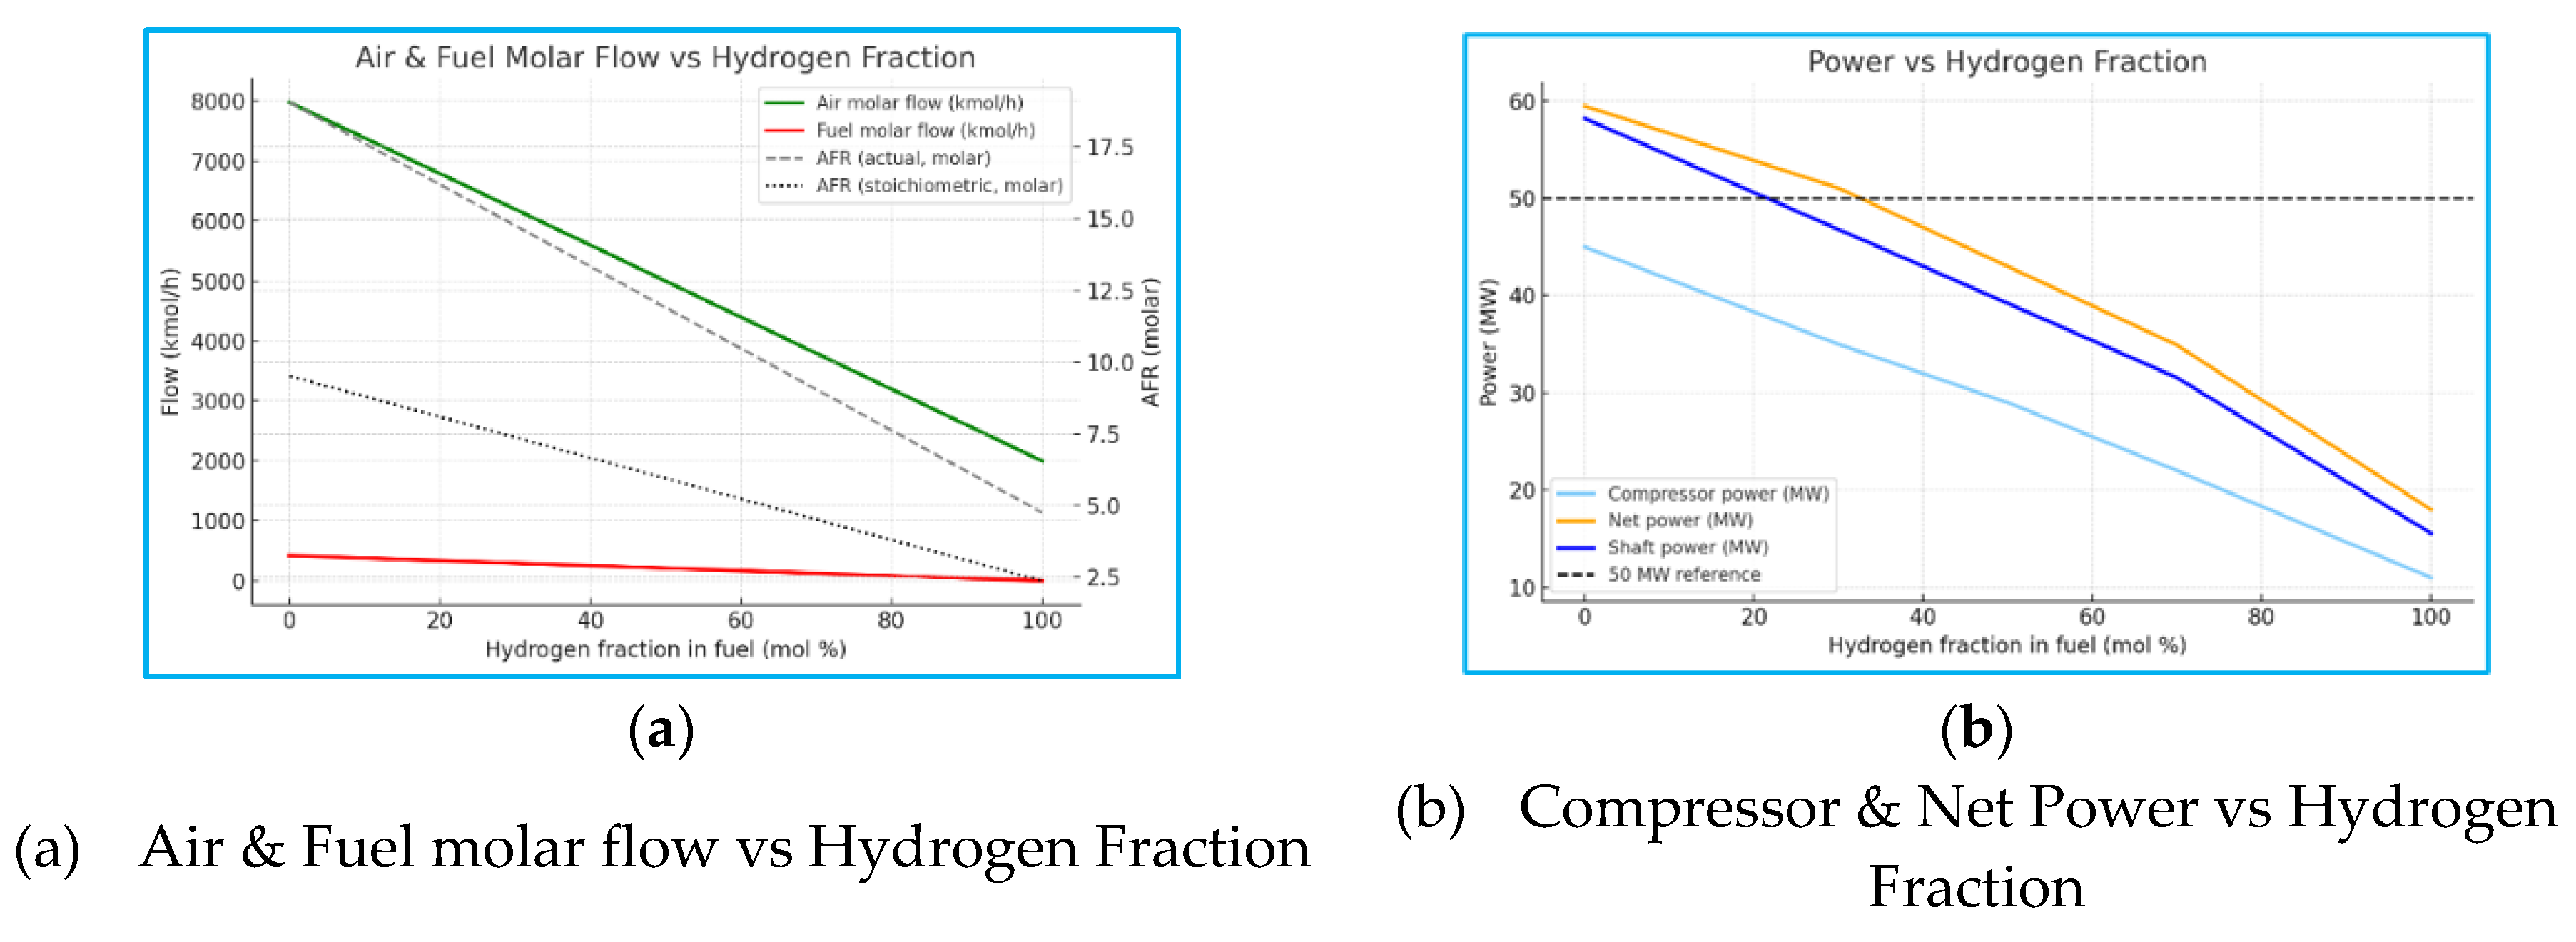
For aiming the net power of 50 MW without fuel molar flow constraint, the calculation result obtained using equation 6.12 is as follows: 591 kmol/h (0% H₂), 747 kmol/h (30%), 907 kmol/h (50%), 1,155 kmol/h (70%), and 1,958 kmol/h (100%). None of the hydrogen fraction results fall within the proposed 300–450 kmol/h window, so the constraint hard-limits output at 50 MW; especially, this may require a higher hydrogen flow, as per the simple cycle calculation. In trial of hydrogen molar flow to down within the range of 300-450 kmol/hr to get 50 MW by 100% pure hydrogen, may need efficiency to achieve (ƞ = 165%) which is impossible and will only achievable only net power 7-11.5 MW, refer to table 6-1 that is perfectly fine for combustor rig but may not meet 50 MW the only way of adjusting the required fuel flow to achieve 50 MW for each hydrogen fraction.
For this test rig, constrain the fuel flow rate at 420 kgmol/h, fixed for 100% fuel-to-ratio, to calculate the hydrogen fraction till it increases to 100% to monitor the changes in flow rate for the power achievable of the shaft power and net power, as shown in Figure 6-2and Table 6-3. Key finding that the air flow rate decreases since the hydrogen flow increases to 100%, and the excess air ratio λ is 2 for this case to complete the combustion. This central constraint affects the system, causing it to become progressively more air-lean relative to the actual mixed-fuel feed as the hydrogen fraction increases. Power results follow the same logic with air sized for the 420 kgmol/h basis. However, the decline in this power trend across the 50 MW reference line at a hydrogen fraction of 30% indicates that the blending ratio is most effective in achieving the 50 MW power target.
Table 3.
Power output using the fuel flow constraint research test rig.
| Sceaniro | Hydrogen fraction (H2 %) |
AFR (Molar) stoich |
AFR (Molar) actual |
Fuel Molar Flow (kgmol/h) |
Air Molar Flow (kgmol/h) |
Comp Power (MW) |
Net Power (MW) | Shaft Power (MW) |
| GT H2 0% LNG 100% | 0 | 9.52 | 19.05 | 420 | 7980 | 45 | 59.5 | 58.21 |
| GT H2 30% LNG 70% | 0.3 | 7.38 | 14.76 | 294 | 6199 | 35 | 51.06 | 46.81 |
| GT H2 50% LNG 50% | 0.5 | 5.95 | 11.9 | 210 | 4998 | 29 | 42.99 | 39.2 |
| GT H2 70% LNG 30% | 0.7 | 4.52 | 9.05 | 126 | 3796 | 22 | 34.91 | 31.57 |
| GT H2 100% LNG 0% | 1 | 2.38 | 4.76 | 0 | 1999 | 11 | 18 | 15.57 |
Firstly, the Strength of the idea view, with a fuel flow rate of 300-450 kmol/h, does cover the operating window for 0-70%. It removes the extreme 100% pure hydrogen case, which is out of both boundaries in fuel molar flow (~1952 kmol/h) and in compressor demand (~217 MW), refer to table 6-2, showing that 100% pure hydrogen needs to be redesigned injectors and compressors, and allowing fuel flow float to keep the constant power 50 MW comparison. This makes sense if the research focuses on the comparative performance of blends under a standard injector/fuel train sizing constraint. It has been demonstrated that 100% pure hydrogen necessitates redesigning injectors and compressors to maintain a constant power of 50 MW, as fuel flow fluctuates.
According to simulation results, a molar flow capacity-constrained test rig can provide valuable data on combustion, stability, and emissions across blends; however, it cannot accurately represent full-load hydrogen operation without substantial hardware expansion. Excluding 100% hydrogen from the fair set means that pure hydrogen requires a step-change in fuel flow and air system sizing. Even hydrogen within the 30-70% limitation range has a lower bound that is very tight compared to rich methane blends. Research option to study the 0% hydrogen as pure LNG case, 30-70% blending of hydrogen and LNG case, and 100% pure hydrogen case of a gas turbine.
7.2. Overview of Locked Combustor State Simulation
Locking the combustor state in gas turbine testing is a critical procedure for validating and certifying combustor performance, especially for new fuels such as blended and pure hydrogen. Key combustor parameters are fixed to study the specific phenomena. In simple terms, to establish the thermodynamic and fluid dynamic conditions at the combustor inlet during the test, and to get a stable and repeatable baseline from which the impact of a single variable can be measured, such as fuel composition. The locked state of the combustor is crucial for hydrogen validation, allowing for a comparison between scenarios. If testing is conducted without a locked state, the combustor inlet temperature (T3) and pressure (P3) will differ, impacting the accuracy of the comparison and the validity of the research data.
In the lock combustor simulation, the analysis is structured to hold the combustor state fixed, defined by inlet pressure to around 40 bar and temperature 407 °C, pressure drop Δp/p, primary-zone equivalence ratio ϕ, and turbine inlet temperature within an acceptable range for all five scenarios, while allowing fuel flow to vary freely across blends of hydrogen and methane. To get 50 MW of net power with efficiency ƞ = 0.38 with excess fuel ratio λ= 2.
Table 4.
Hydrogen and fuel flow rate for non-constraint flow simulation test.
| Hydrogen Fraction (%) |
AFR Stoi (Molar) | AFR Actual (Molar) | Hydrogen Molar Flow (kmole/h) |
LNG Molar Flow (kmole/h) |
Air Molar Flow (kmole/h) |
Shaft Power (MW) |
Heating Value LHV blended (kJ/mole) |
Efficiency (%) |
|---|---|---|---|---|---|---|---|---|
| 0 | 9.52 | 19.05 | 0 | 735 | 13965 | 52 | 802.3 | 31.75 |
| 30 | 7.381 | 14.76 | 265 | 650 | 13505 | 52.34 | 639.97 | 32.17 |
| 50 | 5.952 | 11.9 | 547 | 547 | 13018.6 | 52.13 | 522.05 | 32.86 |
| 70 | 4.524 | 9.04 | 890 | 456 | 12167.84 | 52.73 | 431.68 | 32.67 |
| 100 | 2.38 | 4.76 | 2635 | 0 | 12542.6 | 52.05 | 241.80 | 29.40 |
This framework reflects the physical reality that to maintain a stable combustor exit condition and meet the turbine’s thermal demand, the system must supply as much fuel as the chemistry requires, regardless of the volumetric or molar rate. By removing artificial constraints on the fuel molar flow, the lock combustor simulation highlights the actual differences in hydrogen and methane energy densities and stoichiometry, enabling a fairer comparison of efficiency, air requirements, and compressor work across the hydrogen 0%, 30%, 50%, 70%, and 100% cases as per specific metrics was calculated by equation in MATLAB shown in section 6.2.5.
The results across the five scenarios show that while a methane-rich operation (0% H₂) has a higher fuel mass flow, it delivers energy more efficiently on a molar basis due to methane’s higher LHV. As the hydrogen fraction increases, the necessary molar fuel flow rises significantly, with 100% H₂ demanding nearly three to four times more molar flow than pure methane to sustain the same thermal output. However, this higher molar demand is offset by hydrogen’s very low molecular weight, so the overall fuel mass flow rate remains modest compared to LNG.
The lock combustor state simulations, without constraining fuel flow, provide a direct view of how hydrogen blending influences gas turbine cycle performance. At 0% H₂ (pure LNG), the model indicates an air molar flow of ~13,965 kmol/h, with ~735 kmol/h of fuel, yielding a net power of ~52 MW. As the hydrogen fraction increases, both the air and fuel molar flows progressively reduce, falling to ~13,505/650 kmol/h at 30% H₂, ~13018.6/547 kmol/h at 50% H₂, and ~12167/456 kmol/h at 70% H₂, while keeping shaft power is ~52 MW also hydrogen molar flow is more extreme increase to 2635 kgmole/h, with ~12,542 kmol/h of air and no reported LNG/BOG contribution, achieving a net power of ~52 MW. These results highlight the impact of hydrogen’s lower molar heating value: a higher molar flow is required to maintain stoichiometry at a constant combustor state; however, the overall thermal energy release is still necessary to meet turbine power requirements. Additionally, it is demonstrated that hydrogen at 30% is the optimal point to achieve 50 MW across the blended fuel range of 30% to 70%, as shown in the reference line in Figure 7-5.
Figure 5.
Gas turbine non-constrained flow results for (a) Air & Fuel, (b) Shaft power & heating Values.
Figure 5.
Gas turbine non-constrained flow results for (a) Air & Fuel, (b) Shaft power & heating Values.
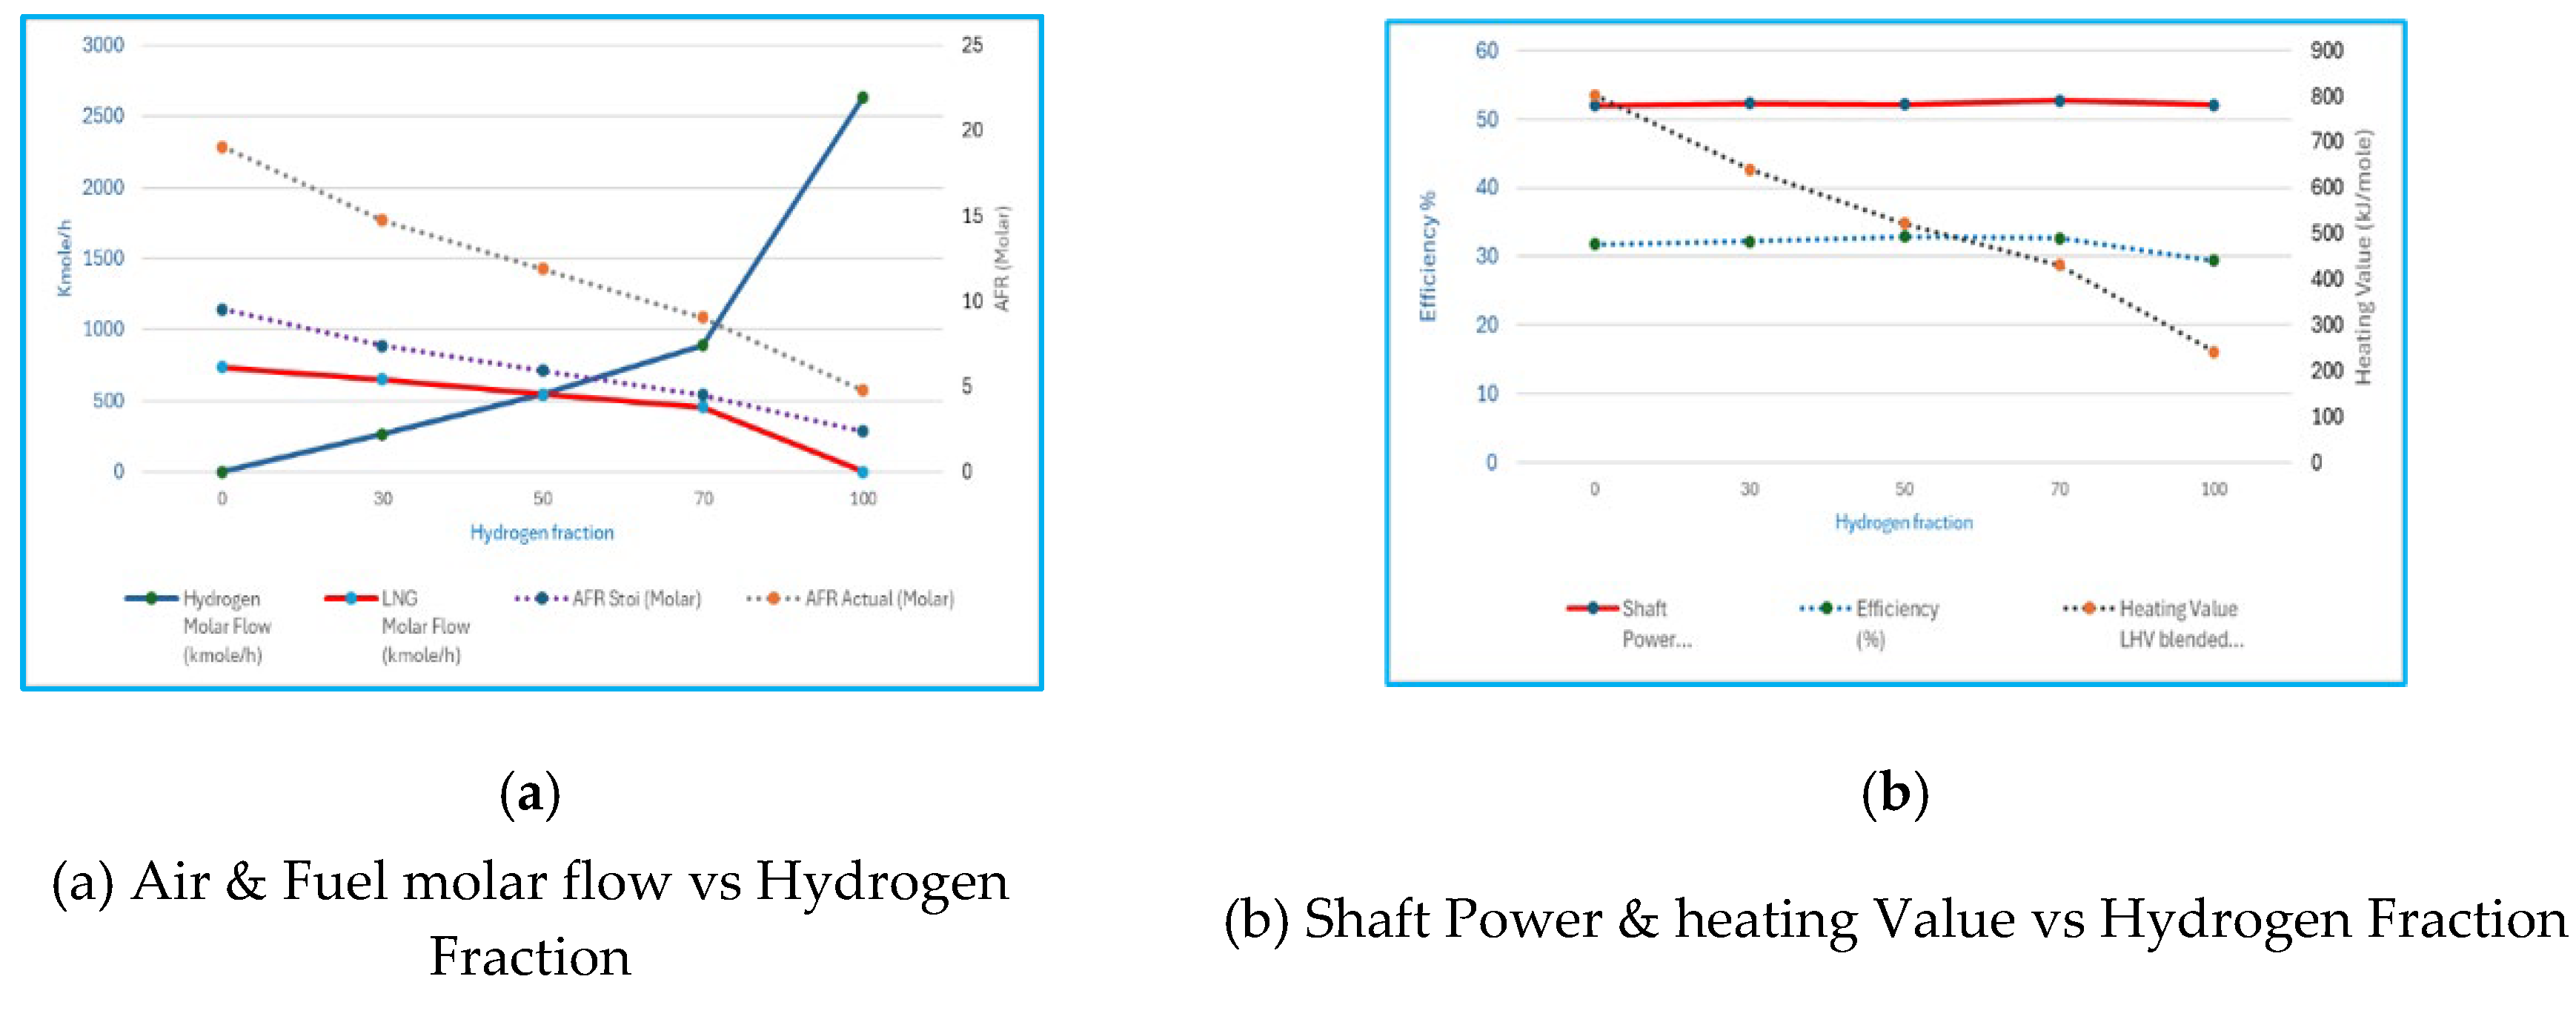
Examining the gas turbine work balance further emphasises the trend. At 0% H₂, the heating value is at its maximum because LNG is used to meet the shaft power demand of approximately 52MW, consistent with the highest net output case. As the hydrogen content increases, the heating value decreases steadily: 639 kJ/mole at 30% H₂, ~522/52.13 MW at 50% H₂, ~431/52.73 MW at 70% H₂, and ~241.8/52.05 MW at 100% H₂. This reduction aligns with the lower overall mass throughput at higher hydrogen fractions, since each mole of hydrogen is much lighter (2 g/mole) on a molar basis. So, per molecule, LNG releases three times more energy than hydrogen when combusted. Hence, blending fuel shifts from rich methane to rich hydrogen, and the average heating value per mole of blended fuel decreases sharply, despite a reduction in the effective cycle efficiency as the H₂ fraction rises.
This highlights a key research trade-off: hydrogen simplifies molar supply requirements, but its low energy per mole limits the achievable power unless the system design is adjusted. To better understand the analysis of re-expressing the hydrogen flow on a mass basis (MJ/kg), the expected trend shows that mass-based LHV rises, even though molar-based LHV falls within the target of ~52MW per table.
Table 5.
Hydrogen heating value on the Molar Basis for non-constraint flow simulation test.
| Hydrogen Fraction (%) | LHV (MJ/kg) | Efficiency | Comment |
|---|---|---|---|
| 0 | ≈ 50 | 31.75 | Methane-based baseline |
| 30 | ≈ 65 – 70 | 32.18 | Hydrogen starts dominating |
| 50 | ≈ 80 – 85 | 32.86 | Rapid increase (H₂ much lighter) |
| 70 | ≈ 95 – 100 | 32.67 | Close to hydrogen energy per mass |
| 100 | 120 | 29.39 | Pure hydrogen limit |
Taken together, these unconstrained fuel flow results suggest that a lock combustor model provides critical insights into the natural behaviour of hydrogen–methane blends before applying hardware constraints. The decreasing air and fuel molar requirements with increasing hydrogen fraction highlight the potential for smaller air systems and lower compressor loads in hydrogen-rich operation; however, the associated loss of net power underscores the need to redesign the cycle.
This research establishes a benchmark: unconstrained hydrogen blends can achieve only ~59% of methane’s net power under the same combustor conditions. Thus, moving from LNG to high-H₂ or pure hydrogen operation requires either increased fuel flow capacity, higher turbine inlet temperatures, or efficiency-enhancing cycle modifications (e.g., recuperation). The lock combustor state simulations, therefore, frame the engineering challenge: balancing the reduced carbon emissions of hydrogen with the need for new design measures to maintain turbine output.
7.3. Overview of Pure Hydrogen Gas Turbine Simulation
According to the above simulation, 100% pure hydrogen requires a separate category, distinct from hydrogen and LNG blending, which involves a 30% hydrogen-to-70 % hydrogen ratio. A pure hydrogen gas turbine simulation was carried out with the condition of non-constrained flow & Lock combustor and adjusted to 50 MW, the base operating point of hydrogen fuel flow H₂ ≈ 2550 kgmol/h and air ≈ 12138 kgmol/h, which corresponds to λ ≈ 2.0 on a stoichiometric molar basis for hydrogen AFR (stoichiometric) ≈2.38 mol air per mol H₂.
A large amount of molar flow of hydrogen is a direct consequence of its lower LHV per mole relative to methane to meet the same heat input; a hydrogen-fired turbine, therefore, requires roughly 3.3× more moles of fuel than a methane-fired one. On a mass basis, however, the hydrogen flow is modest at 2,550 kmol/s, corresponding to approximately 1.428 kg/s, indicating that even a large molar flow can be relatively small in terms of mass flow. At this base point, the thermal input for the locked setting produces 50 MW (consistent with a conservative simple-cycle assumption and the specific compressor/expander balances embedded in this case).
Figure 6.
Varying (a) excess air and (b) hydrogen flow show the effectiveness of power & NOx.
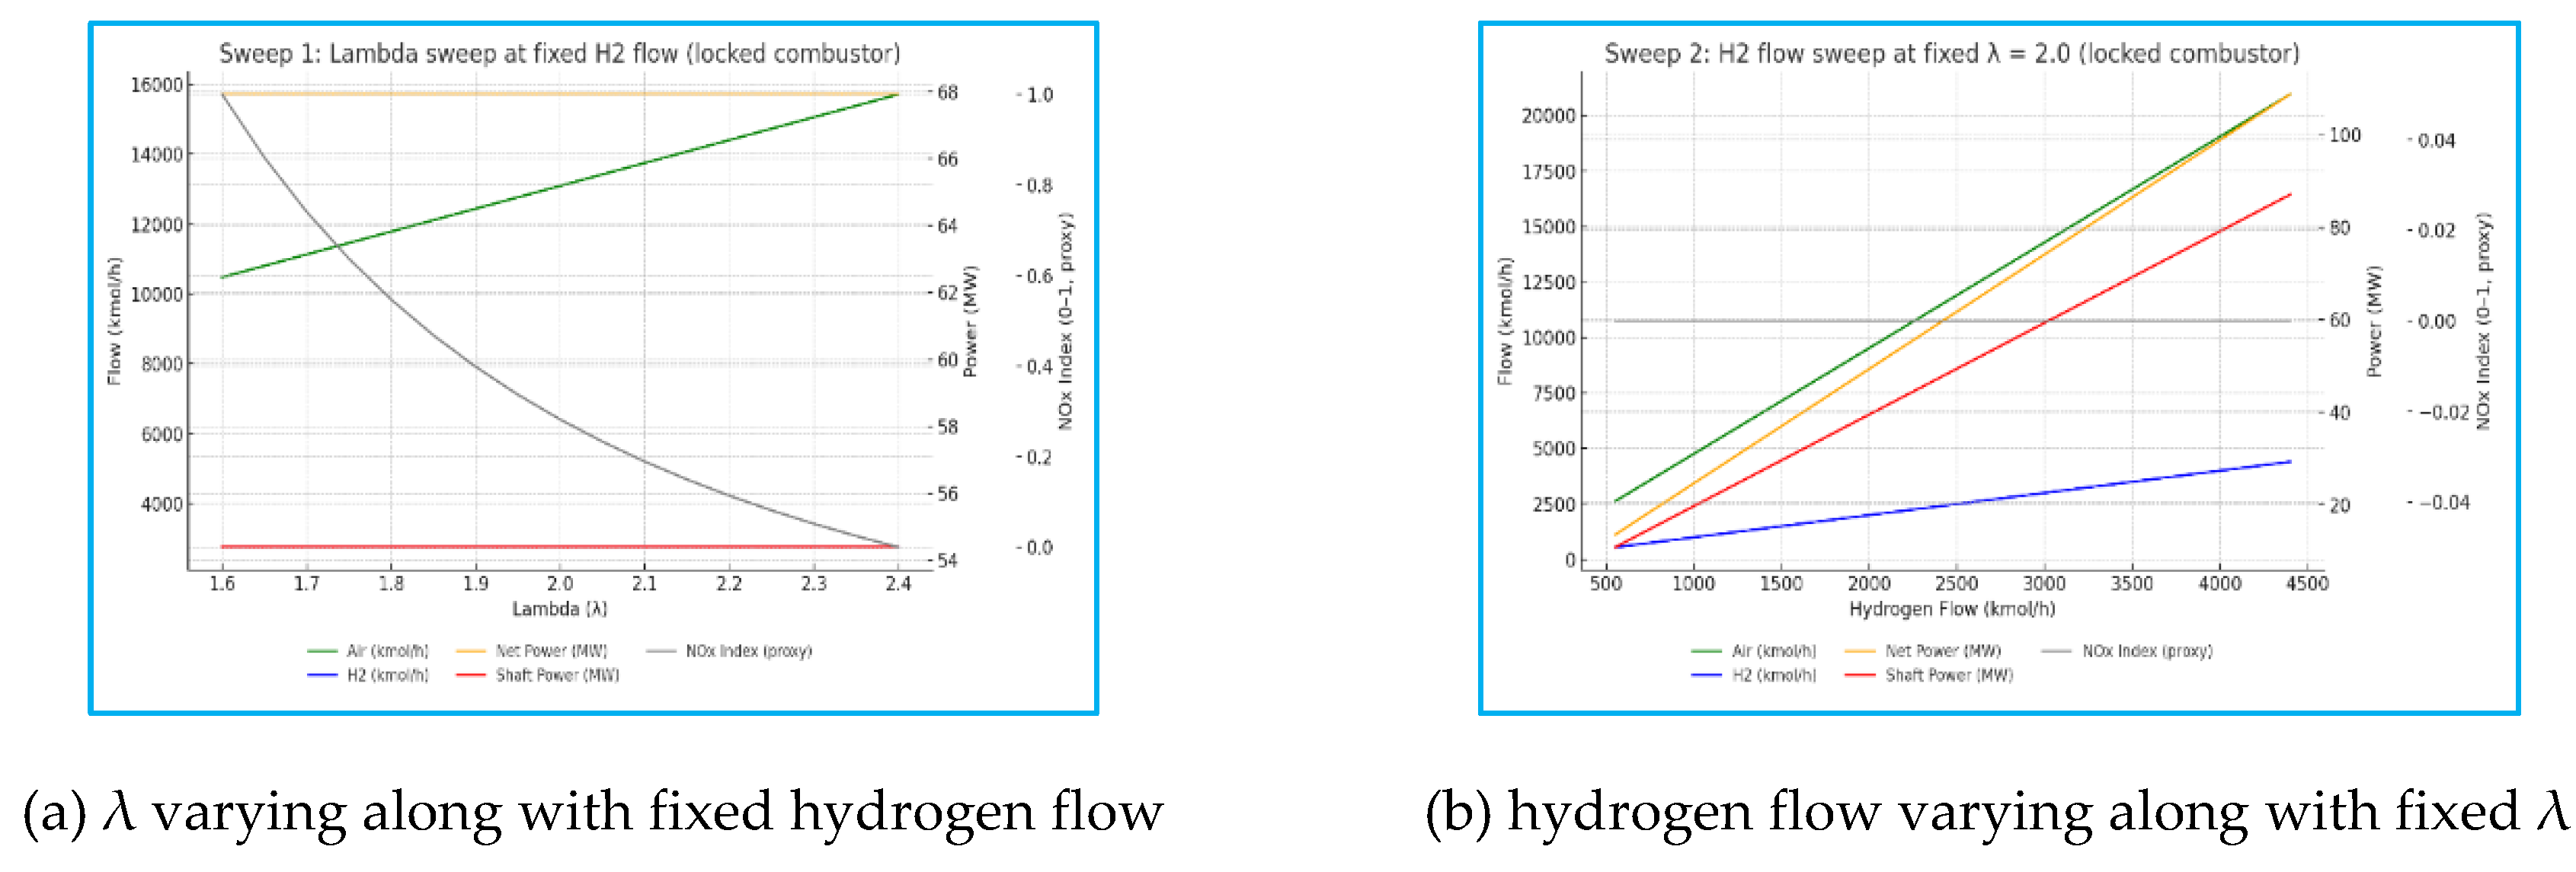
The research findings of a pure hydrogen gas turbine with a lock-combustor and a non-constraint simulation case reveal the distinct thermodynamic behaviour of the gas turbine. For the fixed-hydrogen flow case, increasing the excess-air ratio from lean-rich (λ ≈ 1.6) to very lean (λ ≈ 2.4) results in a proportional rise in air molar flow, increasing compressor work and slightly reducing both net and shaft power, while NOx decreases sharply due to a cooler adiabatic flame temperature under leaner operation. Conversely, when λ is fixed (≈ 2.0) and hydrogen flow varies, the net and shaft powers are almost linearly related to the total heat input, confirming that fuel flow rate governs power at a constant mixture ratio.
The NOx index remains nearly constant since combustion temperature does not change significantly with fixed lambda. These trends confirm that hydrogen’s high reactivity and low molecular weight drive strong sensitivity to lambda (mixture leanness), rather than to flow rate itself. To emphasise the effectiveness of power output, controlling lean-premixed control of lambda is the most effective lever for the pure hydrogen case.
7.4. Sensitivity Analysis of Gas Turbine Constrainted Fuel Flow
The sensitivity analysis conducted in this study assesses the variation in cycle efficiency with respect to two critical operational parameters: fuel flow rate and turbine pressure ratio (PR). The combustion chamber pressure ratio in a gas turbine is primarily determined by the compressor pressure ratio rather than the fuel type. However, different fuels can affect combustion temperature, flame speed, and pressure losses, thereby indirectly affecting the pressure ratio. The typical compressor pressure ratio ranges from 10:1 to 30:1, depending on the turbine design (aero-derivative or heavy-duty). The pressure at the combustion chamber inlet is thus significantly influenced by this compression ratio. While the compressor dictates the overall pressure ratio, the type of fuel impacts the combustion process, pressure losses, and combustion stability. There is LNG and H₂, compared the pressure ratio as follows,
Table 6.
Fuel type, pressure loss in the combustor, and pressure ratio.
| Fuel Type | Compressor Pressure Ratio | Pressure Loss in Combustor | Effective Combustion Chamber Pressure Ratio |
|---|---|---|---|
| LNG | 15:1 to 25:1 | ~3-5% | ~14.5:1 to 23.75:1 |
| H₂ | 15:1 to 25:1 | ~5-8% | ~13.8:1 to 23.0:1 |
In this research, five blending scenarios were considered, representing hydrogen mole fractions of 0%, 30%, 50%, 70%, and 100%. All results were recorded. From the results of five scenarios with H2 at 30% and CH4 at 70%, data were plotted as three-dimensional (3D) graphs of efficiency versus mixed-fuel flow, and PR was also plotted. These graphs were then supported by two-dimensional (2D) cuts along fixed operating conditions. These visualisations provide a comprehensive map of the turbine’s performance envelope across varying compositions, allowing for a direct comparison of fuel blends and the identification of operational bands associated with maximum efficiency.
Figure 7.
Hydrogen 30% Gas Turbine efficiency vs (a) fuel flow and (b) pressure ratio.
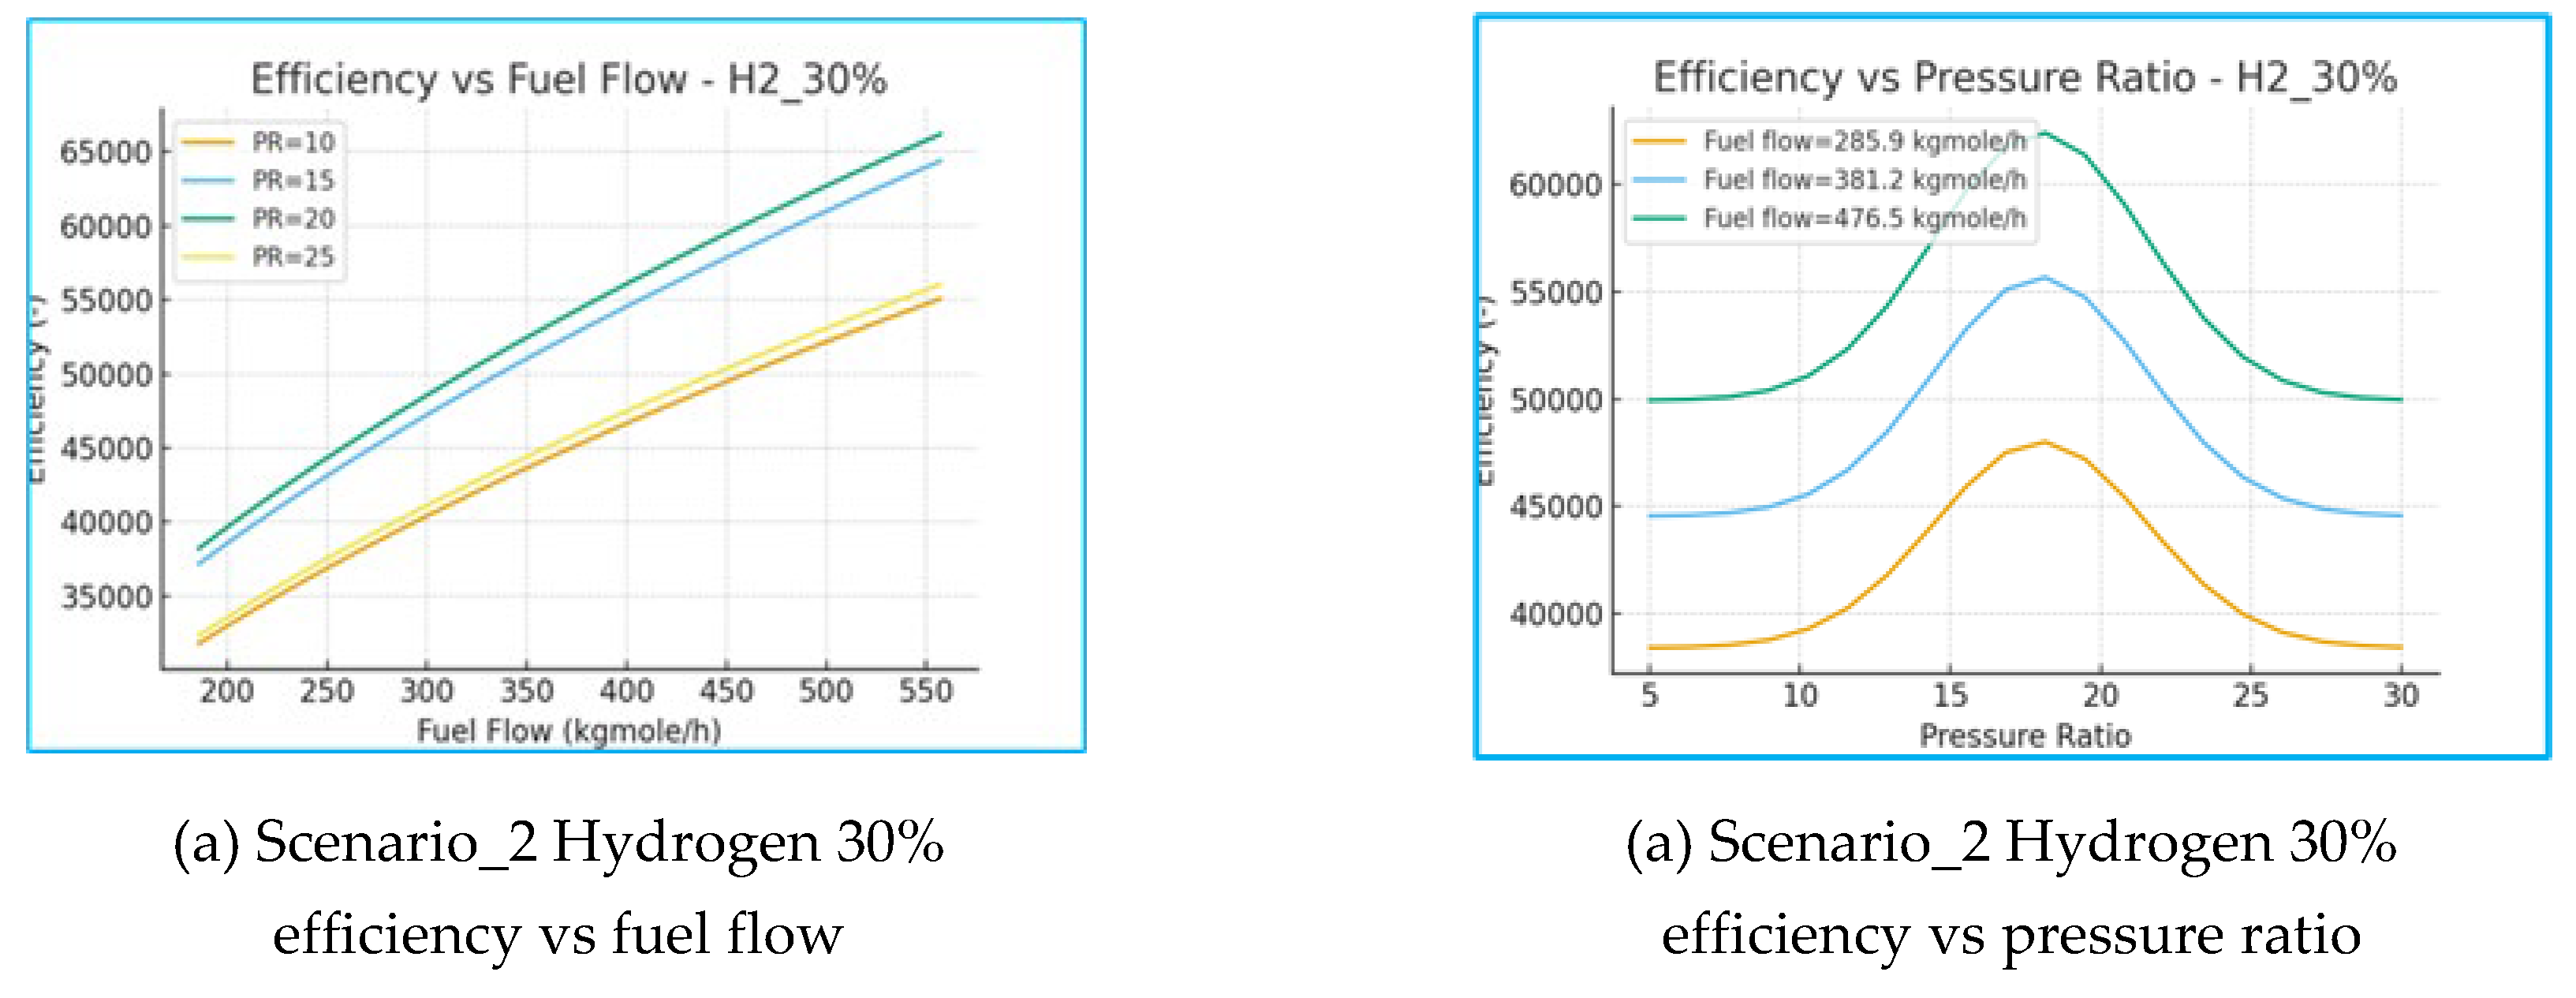
The above 2D sensitivity analyses, in which one parameter was fixed while the other was varied, provide additional clarity. Efficiency versus fuel flow plots demonstrate that hydrogen-enriched fuels diverge significantly from pure LNG behaviour, particularly at elevated PR values. Efficiency versus PR plots reveal that stable, high performance under hydrogen-rich conditions is achievable only within narrow PR bands, underscoring the importance of precise integration between compressor and turbine design.
Figure 8.
Sensitivities 3D surface analysis for Hydrogen 30% and LNG 70%
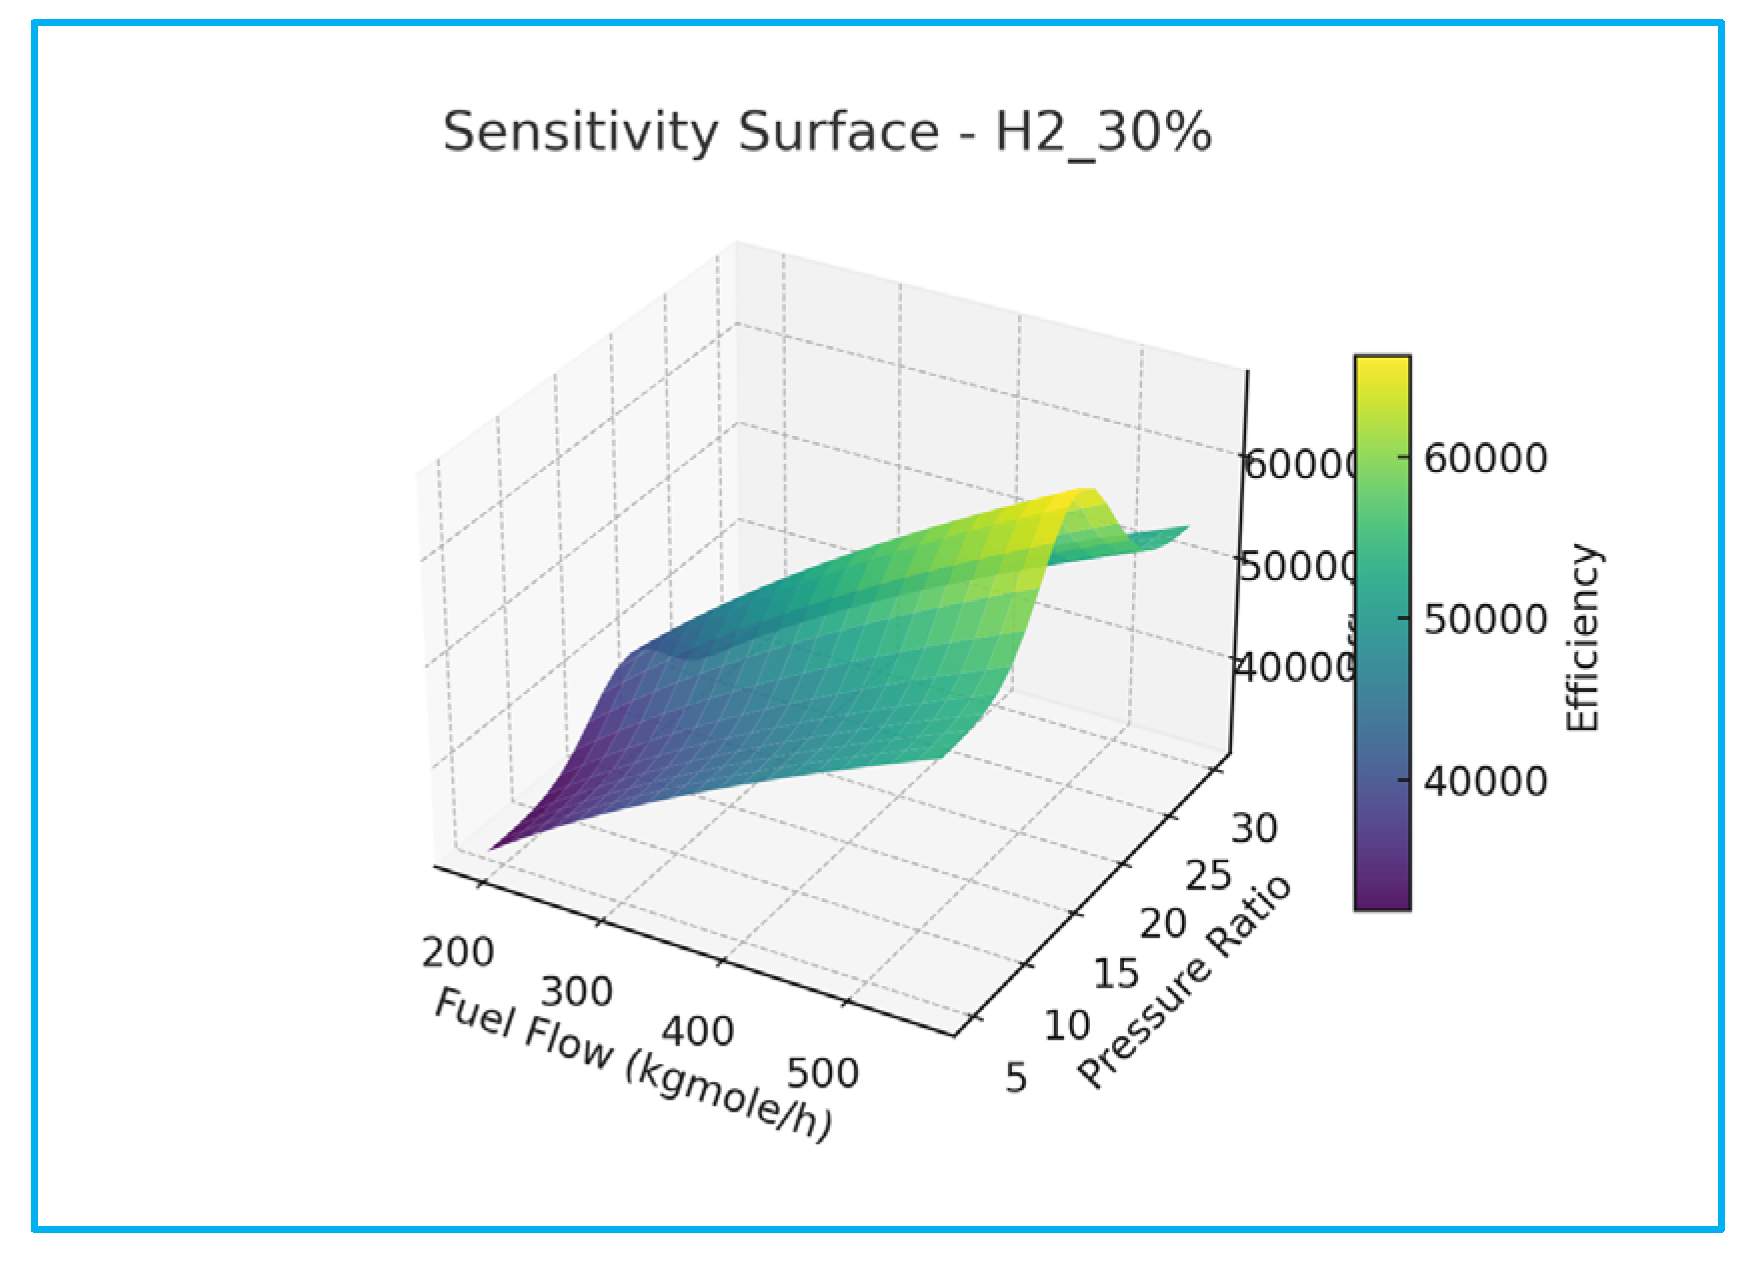
The above 3D plots confirm a common trend across all cases: efficiency increases with pressure ratio up to an optimum (typically in the range of 16–20), beyond which further increases result in a decline. Similarly, higher fuel flow rates contribute to increased net power but yield diminishing efficiency gains due to elevated compressor work and associated thermal penalties. To demonstrate the broad efficiency stability over a wide range of PR to reflect combustion characteristics. In contrast, distinct differences emerge between blending cases, pure LNG (0% H2), and the 100% H2 case, which exhibits sharp sensitivity to PR variations, with efficiency strongly dependent on the tight matching of the compressor and turbine. Among the five scenarios, the intermediate blends (30% H2 and 70% CH4) exhibit hybrid behaviour, with performance trends that interpolate between the volumetric stability of LNG and the high reactivity of hydrogen.
These findings suggest that turbines optimised for LNG cannot be directly transitioned to high-hydrogen operation without significant adaptation of operational control strategies. The sensitivity analysis results collectively address the challenges and opportunities of hydrogen integration in gas turbine systems by reviewing the baseline model simulation.
7.5. Sensitivity Analysis of the Pure Hydrogen (Non-Blending) Simulation
Sensitivity analysis is a critical process in the gas turbine simulation workflow, enabling the determination of how varying input parameters can apportion uncertainty in model output. This process identifies which parameters exert the most significant influence on the system’s performance, thereby prioritising more precise measurements to control operations and achieve better performance. Systematically varying a single parameter in a gas turbine simulation is referred to as a sweep. The most robust approach is to conduct a more robust sensitivity analysis; a multi-parameter sweep is conducted across lambda, fuel flow, and compressor load, as shown in the table.
Table 6.
Varying parameter by sweep Lambda, hydrogen flow, and Comp Load.
| Sweep name | Variable parameter | Fixed parameter | Result |
|---|---|---|---|
| λ-sweep | excess-air ratio (λ) | H₂ molar flow constant | Shows how combustion temperature, NOₓ proxy, and compressor power vary when the mixture becomes leaner or richer. |
| H₂-flow sweep | fuel molar flow rate | Λ is constant (≈2.0) | Reveals how net & shaft power scale with heat input and identifies compressor–turbine balance trends. |
| Compressor-load sweep | compressor pressure ratio/load index | fuel & air fixed | Mimics varying operating lines on the compressor map to assess power sensitivity and surge margin (surge margin refers to Chapter 8). |
For pure hydrogen gas turbine operation running with lean-premixed (λ ≈ 2), the sweep colour mapping graphs indicate that λ is approximately 2 in the central region, which controls the adiabatic flame temperature. This mitigates thermal NO formation while retaining flame stability and avoiding flashback. Additionally, the chosen λ = 2 increases the total molar throughput of reactants, modestly increasing compressor work and slightly reducing net power compared to the same fuel flow at a lower λ.
Refer to Fig. 7-9, the two-dimensional colour map of λ versus hydrogen levels, along with efficiency and power metrics, reveals key changes within the λ ≈ 1.6-2.4 and hydrogen flow 0.7-1.3 range, showing consistent patterns in the colour-coded flow. Firstly, net power increases with hydrogen flow. However, increasing λ reduces the net power due to the compressor penalty, requiring more air intake to be compressed, causing the constant-power contours to tilt upward with λ. Secondly, when λ is 1.6 to 2.0-2.2, and beyond this point, if fuel flows around 0.95-1.1 times the base, extra air does not help, and the compressor work begins to reduce efficiency.
Figure 9.
Pure Hydrogen Gas Turbine Analysis of Lambda vs (a) H2 flow & efficiency, (b) H2 flow & Net power, (c) H2 flow & NOx.
Figure 9.
Pure Hydrogen Gas Turbine Analysis of Lambda vs (a) H2 flow & efficiency, (b) H2 flow & Net power, (c) H2 flow & NOx.
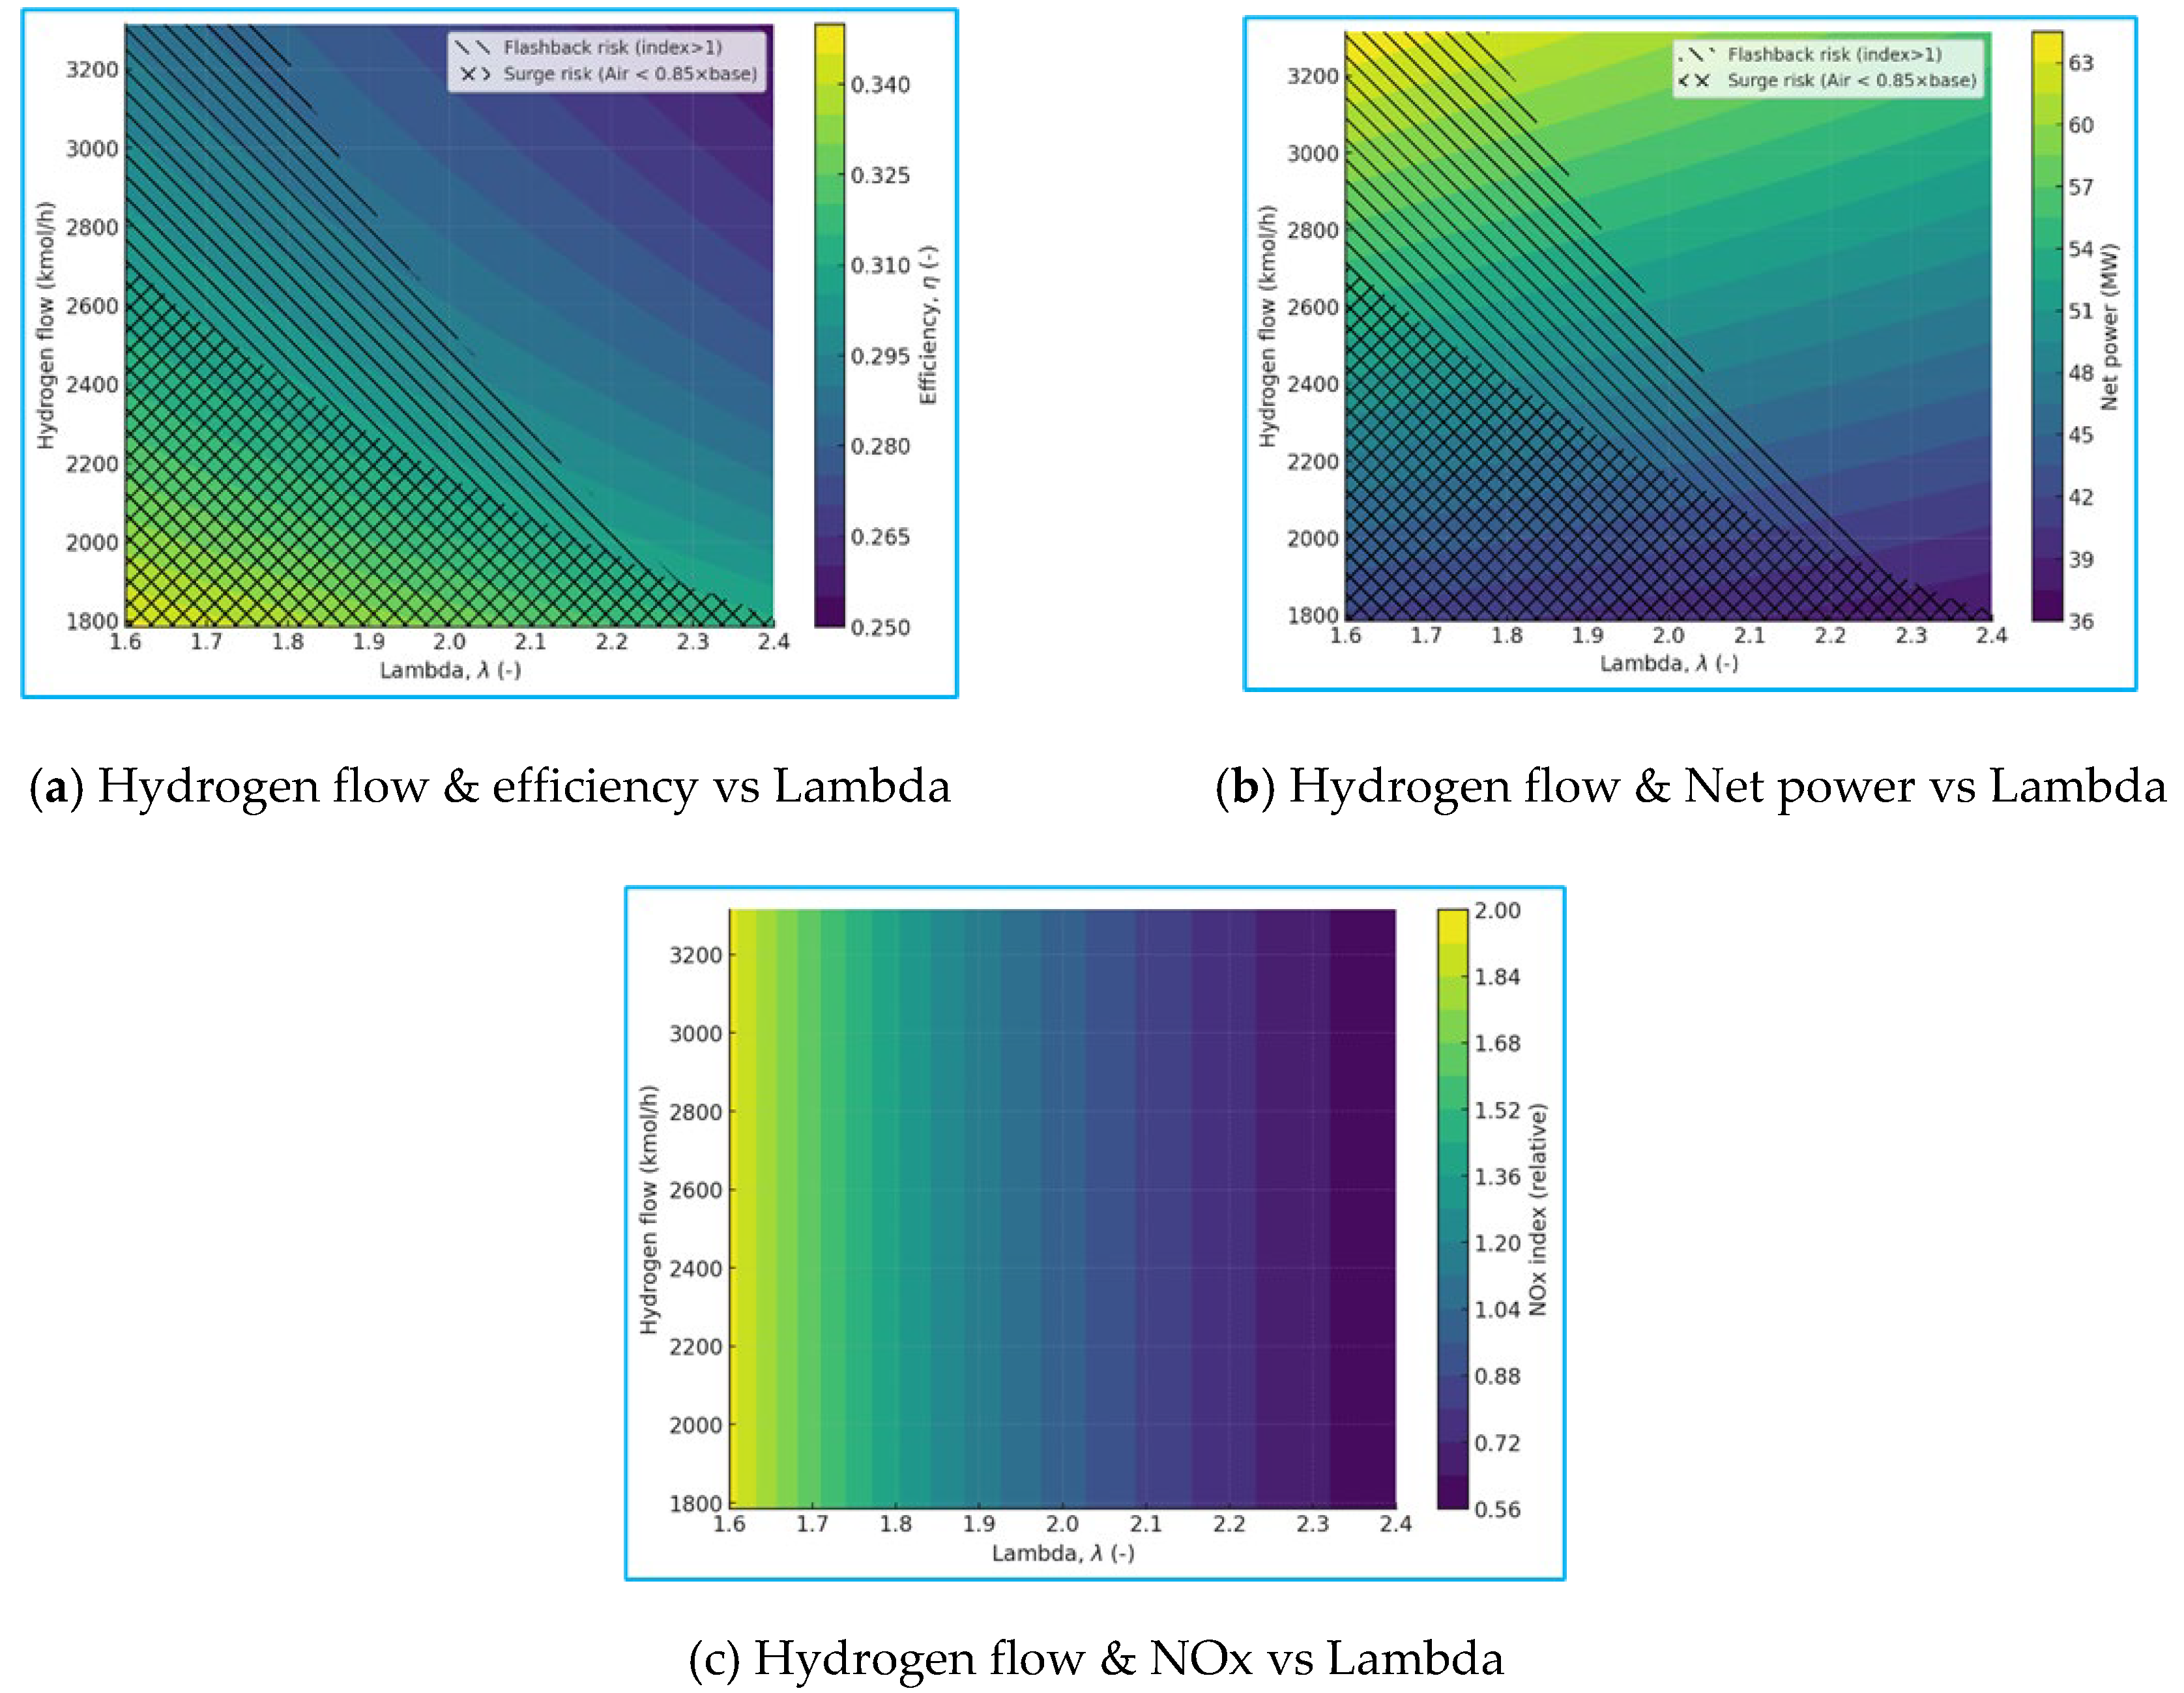
When examining NOx in colour mapping of λ against hydrogen flow, Fig. 6-6 (iii), the NOx index drops steeply with increasing λ. It remains relatively unaffected by minor fuel-flow variations at a fixed λ, which illustrates that a practical window of NOx index is considerably lowered where η stays near its peak while λ≈2.1 with hydrogen flow close to the baseline. This represents the classic trade-off in hydrogen operation: deploying leaner mixtures to cut NOx results in a higher compressor load, which raises the combustor's adiabatic temperature and increases the associated risk.
For the pure hydrogen locked-combustor configuration targeting 50 MW, the maps support the implications of operating-window set-point selection around λ ≈ 2.0–2.2, with hydrogen as the base fuel (minor fuel trims as needed to achieve an exact 50 MW). This selection balances the low NOx propensity with compressor-work penalties and stability margins. If emissions constraints tighten, nudging λ ≈ 2.2 offers a marked reduction in the NOx index with only a minor efficiency trade-off. If power headroom is a priority, modestly raising the base while holding λ near 2.0 increases net power with a contained NOx impact. For future work in Chapter 8, Hydrogen Gas Turbine analysis, including overlaying flashback and surge constraints on the same maps, will enable the creation of a fully operational, safe-efficiency envelope for hydrogen firing.
Figure 10.
Pure Hydrogen Gas Turbine heat map analysis for varying (a) Lambda (b) H2 flow
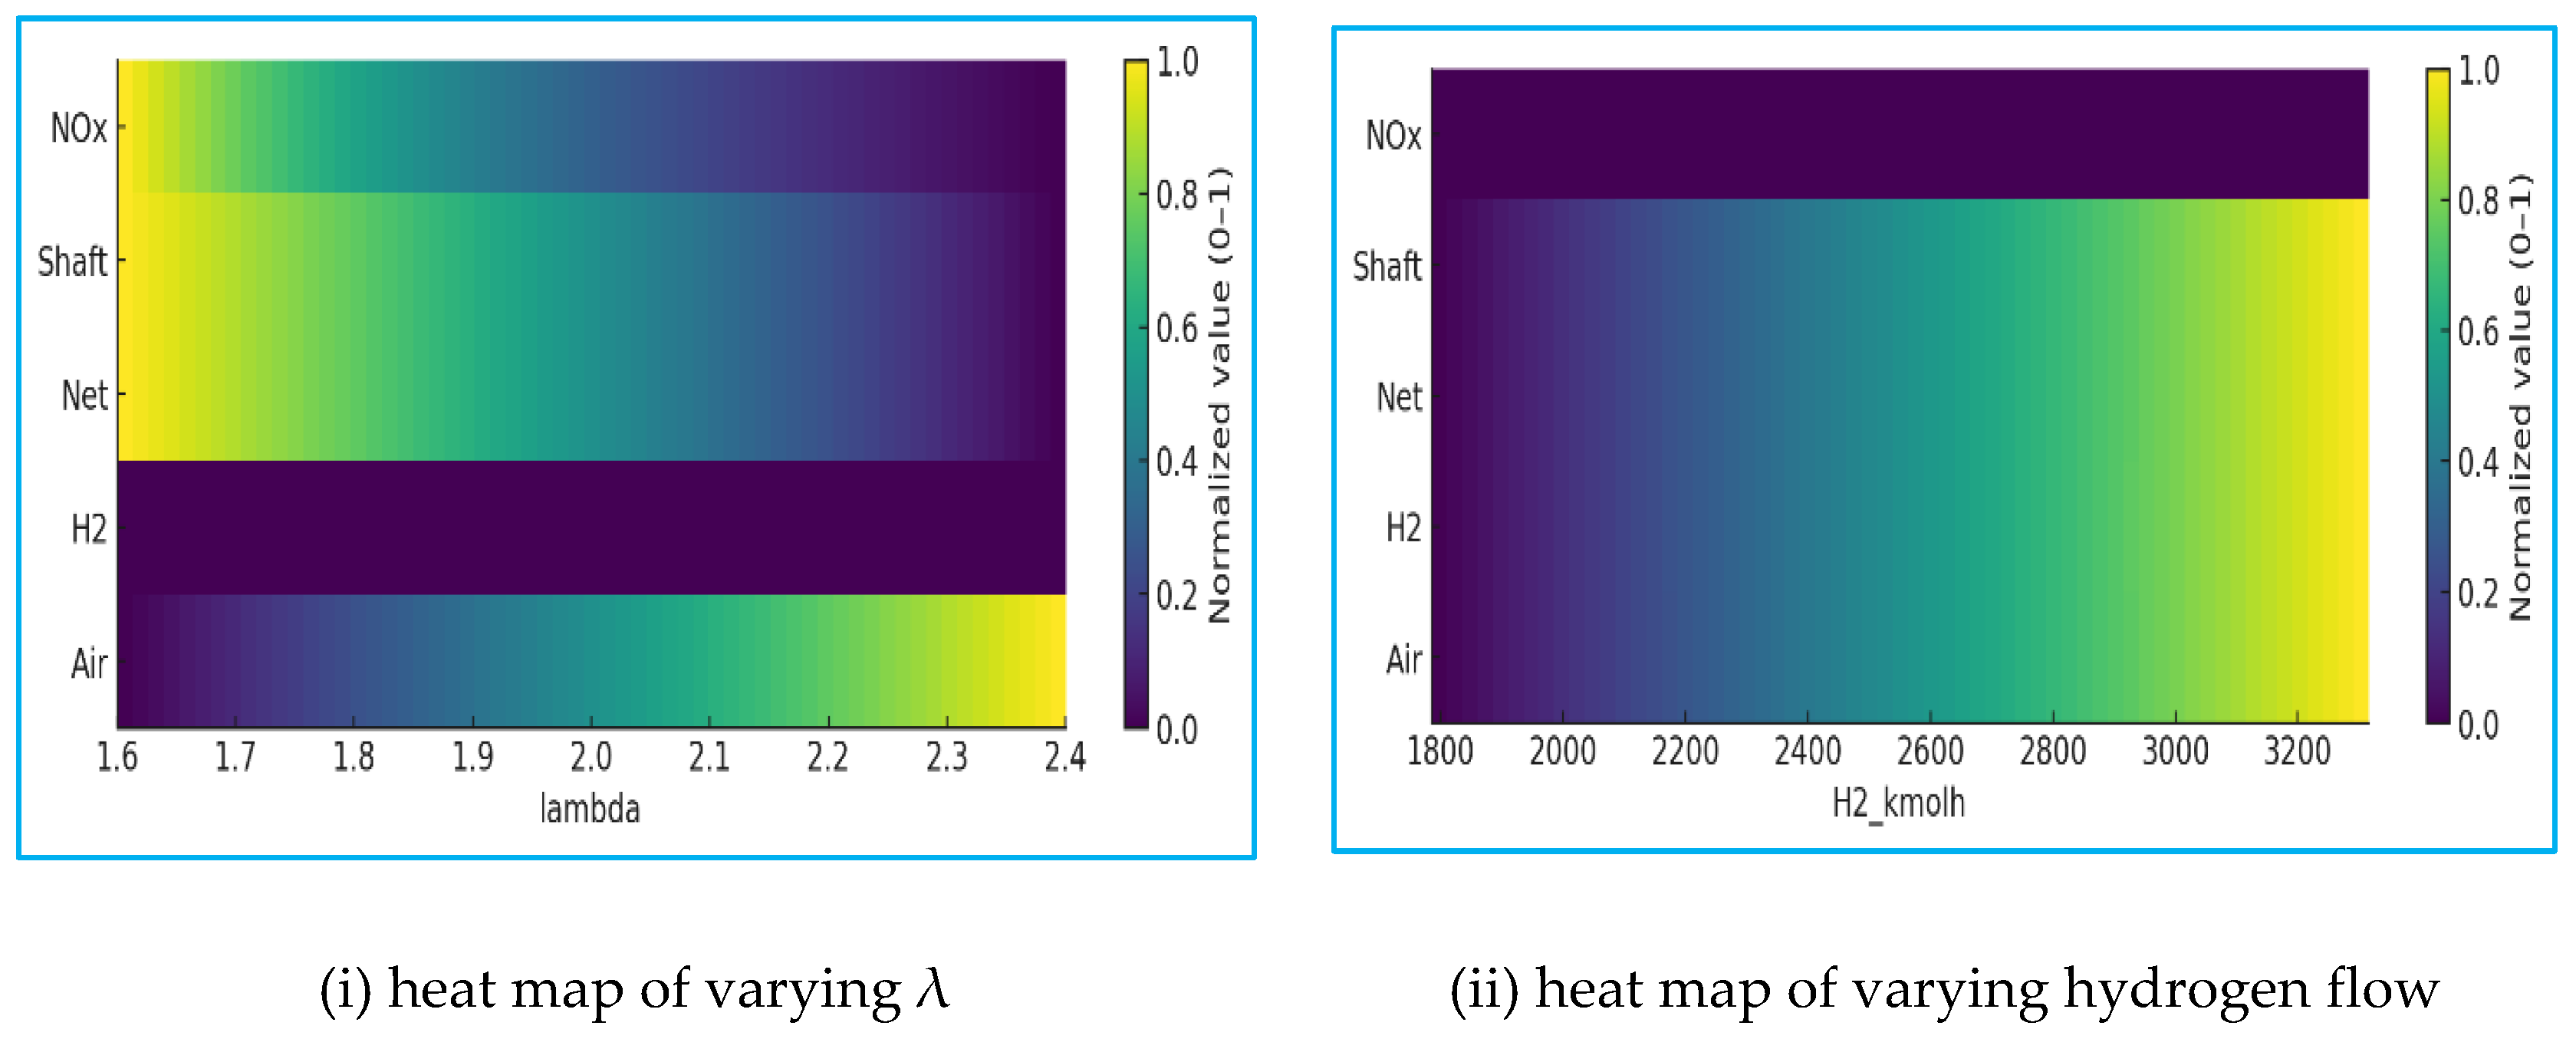
The simulation results were imported into MATLAB to generate a visual normalisation in the form of a heat map, displaying the NOx index, Tadd, efficiency, and net power (MW), with contour colour gradients to visualise how each property changes with the excess ratio λ and hydrogen molar flow rate. The NOx field is normalised to the reference case (λ≈ 2.0, H2 ≈ base 2,330 kgmol/h), where the normalised value of colour is ≈1.0. If the normalised value colour is greater than 1,0 (warmer: orange to red), it represents a higher NOx propensity, associated with a richer mixture (lower λ) and a hotter flame zone. If colour is less than ≈1.0, indicate the lower NOx formation, corresponding to leaner mixtures (higher λ) with lower adiabatic flame temperature.
The adiabatic flame temperature Tadd, map typically uses a yellow-red scale increasing with temperature (hotter zones at lower λ), moving rightward (toward leaner λ) as the excess-air ratio (λ) increases from 1.6 to 2.4 at constant fuel flow cools the map that confirming the thermal dilution decreases from approximately 2450 K to 2100 K, driven by enhanced air dilution and heat capacity loading. This temperature reduction sharply lowers the NOx index, falling by nearly 70–80% across the lean range, as predicted by the exponential temperature sensitivity in the Zeldovich thermal-NO mechanism, as referred to in Equation 39. However, the same dilution increases compressor work, which slightly reduces net and shaft power.
The efficiency map displays light green/yellow zones, indicating optimal ridge near λ ≈ 2.0-2.2, where combustion completeness and completed load are balanced. The net power map is dominated by fuel flow, with darker blues indicating lower hydrogen feed and warmer colours (orange to red) indicating higher hydrogen flow. Consequently, the efficiency map shows a ridge between λ ≈ 2.0 and 2.2, beyond which the efficiency declines despite continued NOx improvement, suggesting that excessively lean mixtures lead to performance penalties without substantial emission gains.
At a fixed λ = 2.0, sweeping the hydrogen molar flow rate between 0.7× and 1.3× the base value (2,550 kgmol/h) reveals a near-linear relationship with the net power output, which increases from ≈ approximately 35 MW to 65 MW. The adiabatic flame temperature varies modestly (±2–3 %) since the air/fuel ratio remains constant, keeping the NOx index nearly flat across this sweep. The efficiency peaks slightly below the nominal design fuel rate (approximately 0.95 times the base), where turbine expansion and compressor load are most balanced. Combining both trends identifies an optimum operation window at λ = 2.0–2.2 and H₂ ≈ 2,400–2,600 kgmol/h, where ηₗₕᵥ exceeds 40 %, the NOx index is minimised by ~70 %, and the net power target of 50 MW is maintained. These findings confirm that lean-premixed operation offers the best compromise between efficiency, power, and low-NOx performance for 100 % hydrogen gas turbine combustion.
In summary, warmer colours (red/orange) indicate a higher flame temperature, higher power, but also higher NOx. Cool colours (blue/green) indicate a leaner operation, lower flame temperature, and reduced NOx, but at the expense of power and efficiency.
8. Conclusions
The comparative evaluation of hydrogen and methane fuel flows reveals different requirements between molar and mass flow rates, with direct implications for turbine operation and air management. On a molar basis, the same 50 MW thermal duty requires approximately three times as many moles of hydrogen as methane because its lower molar heating value (approximately 242 MJ/kgmol) is only one-third that of methane (approximately 800 MJ/kgmol). Conversely, on a mass basis, hydrogen flow is lower due to its exceptionally high specific heating value (≈120 MJ/kg versus ≈50 MJ/kg for methane).
This divergence means that while hydrogen appears to have higher molar throughput, it increases volumetric flow through the combustor, reducing air–fuel mixing. Furthermore, the stoichiometric oxygen requirement per mole is smaller for hydrogen (0.5 mol O₂/mol H₂) than for methane (2.0 mol O₂/mol CH₄), so the total air requirement does not scale linearly with molar flow. Consequently, hydrogen combustion generally operates with higher apparent excess air ratios at the same thermal power, thereby enhancing flame stability and reducing peak flame temperature. However, it also requires tighter control of the equivalence ratio to mitigate flashback and NOx formation.
This non-constrained lock combustor framework is highly relevant for research because it removes arbitrary hardware limitations and exposes the fundamental thermodynamic trade-offs associated with hydrogen blending. It enables the clear identification of operating hydrogen, providing benefits such as faster flame speed, reduced CO₂ emissions, higher volumetric fuel flow demand, and tighter compressor/airflow margins. By simulating the full range from 0% to 100% H₂ under constant combustor states, the model provides a baseline reference for experimental test rigs and OEM designs, showing what the turbine could achieve if unconstrained by injector or manifold capacities. This duality between the “ideal non-constrained case” and the “capacity-constrained rig case” provides a comprehensive methodological model for developing hydrogen-ready gas turbines.
The pure-hydrogen gas turbine simulation under locked-combustor, non-constrained flow conditions serves as the fundamental baseline for evaluating hydrogen’s combustion and performance behaviour in advanced gas turbine systems. In this configuration, the combustor inlet pressure, temperature, and pressure drop ratio (Δp/p) are fixed to reflect realistic aerothermal conditions. At the same time, the air and fuel flows are allowed to vary freely to satisfy the target net power output of 50 MW. This setup isolates the intrinsic thermodynamic behaviour of hydrogen, eliminating external flow limitations, and reveals the direct influence of stoichiometry (λ) and heat release on turbine performance, efficiency, and emission trends.
The results demonstrate that, unlike methane-fired operation, pure hydrogen combustion requires a significantly higher molar fuel flow rate, typically about three times greater, to supply the same thermal input because of hydrogen’s lower molar heating value (≈ 242 MJ kmol⁻¹ compared with 800 MJ kmol⁻¹ for CH₄). However, on a mass basis, the fuel requirement remains comparatively small due to hydrogen’s low molecular weight. At the locked combustor state (λ ≈ 2.0), the system achieves an adiabatic flame temperature around 2300–2400 K, supporting complete combustion and stable ignition with minimal carbon-based emissions. The absence of carbon eliminates CO₂ and CO formation, focusing all emission concerns on thermal NOₓ.
Parametric sweeps of λ and hydrogen molar flow show a clear trade-off between power, efficiency, and NOₓ formation. Leaner mixtures (λ > 2.0) substantially reduce the flame temperature and NOₓ index (by up to 70–80%), though at the cost of reduced thermal efficiency and turbine power due to increased compressor load. Conversely, operating near λ ≈ 1.8–2.0 achieves the optimum balance, where ηₗₕᵥ reaches 40–42% and the net power output remains near 50 MW. These findings confirm that lean-premixed hydrogen combustion under non-constrained flow conditions delivers both high specific power and low emissions, validating hydrogen’s viability as a clean turbine fuel when supported by advanced mixing and thermal management strategies.
In summary, the locked-combustor, non-constrained hydrogen case establishes high reactivity, elevated flame temperatures, and intense sensitivity to air-fuel ratio, which characterise the fundamental behaviour of a zero-carbon gas turbine cycle. The analysis highlights the critical role of λ-control in optimising efficiency and NOₓ performance and provides a validated framework for subsequent constrained-flow and hybrid-fuel (H₂–LNG) simulations.
In practice, Gas turbines never operate at stoichiometric AFR conditions because the flame temperature would be too high, leading to thermal NOx emissions and material failure. Instead, the gas turbine is to be run in lean premixed combustion with a typical equivalence ratio of 0.3-0.6, which means the FAR is 30-60% of the stoichiometric AFR.
Author Contributions
Conceptualization, W.L.C. and A.D.; methodology, W.L.C.; software, W.L.C.; validation, W.L.C., A.D.; formal analysis, W.L.C.; investigation, W.L.C.; resources, W.L.C.; data curation, W.L.C.; writing—original draft preparation, W.L.C.; writing—review and editing, W.L.C.; visualization, W.L.C.; supervision, A.D.; project administration, A.D. All authors have read and agreed to the published version of the manuscript.
Funding
This research received no external funding.
Data Availability Statement
The original contributions presented in this study are included in the article. Further enquiries can be directed to the corresponding authors.
Acknowledgements
The authors would like to thank the guidance of Pavan Kumar Naraharisetti from Newcastle Research and Innovation Institute, NewRIIS, Singapore, and Ben Wetenhall (Lecturer) from Newcastle University, Newcastle upon Tyne NE1 7RU, UK.
Conflicts of Interest
The authors declare no conflict of interest.
Appendix A
Calculation for Blended fuel LHV
Observed that when the hydrogen fraction rises in the simulation dataset, the heating value of blended fuel drops, meaning that different aspects of the weight of hydrogen and methane molecules affect the mass and mole size. Basically, per molecule, methane releases over three times more energy than hydrogen during combustion.
For the molecular basis, comparison
Hydrogen has a much lower energy per mole than methane (LNG Basis)
When blending, the hydrogen fraction shifts from CH4-rich (e.g., LNG, 100%) to H2-rich (e.g., H2, 100%), resulting in a significant decrease in the average heating value per mole of fuel.
Table A1.
Comparison of energy level for Hydrogen and Methane on a Molar Basis.
| Fuel | Lower Heating Value (LHV) |
Units | Ratio | Energy Density |
|---|---|---|---|---|
| Hydrogen (H₂) | 241.8 kJ/mol | 120 MJ/kg ÷ 2.016 g/mol | — | Higher |
| Methane (CH₄) | 802.3 kJ/mol | 50 MJ/kg ÷ 16.04 g/mol | ~3.3× higher per mole | Lower |
For Mass Basis, Comparison of H2 & CH4
It is observed that hydrogen is hotter per kilogram, since each mole of H2 (2 g/mol) is much lighter than CH4 on a molar basis; this means H2 has a higher energy density per mass. This part is confusing to calculate the blending fuel of heating values.
For LHV blended calculations on a molar basis,
This research is using blended fuel on a per-mole basis. In constrained flow, H2 is 241.8 kJ/mol, and CH4 (LNG proxy) is 802.3 kJ/mol. and blended LHV, Thermal input, and efficiency equations will be,
References
- We Lin Chan, Ivan CK Tam, Arun Dev, "Energy Proceedings Case Studies of Single Nitrogen Expander Liquefaction for FLNG," in 14th International Conference on Applied Energy (ICAE 2022), Ruhr University Bochum, Germany & Virtua, 2023.
- We Lin Chan, Ivan CK Tam, Arun Dev, "Case Studies of SMR Liquefaction for FLNG Application," in Energy Proceedings, ICAE, Vol 29: Closing Carbon Cycles - A transformation Process Involving Technology, Economy, and Society: Part IV, Japan, 2022.
- W. L. Chan, "OTC-34732-MS Research Analysis of Reforming Hydrogen Fuel for FLNG Application," in Offshore Technology Conference Asia 2024At:, Kuala Lumpur, Malaysia, February 2024.
- A. CONNOLLY, "Everything you need to know about FLNG.," June 6 2020. [Online]. Available: https://www.scribd.com/document/625738597/Everything-you-need-to-know-about-FLNG.
- H. Council, "Hydrogen Council, Hydrogen decarbonisation pathways; A life-cycle assessment,," January 2021. [Online]. Available: https://hydrogencouncil.com/wp-content/uploads/2021/04/Hydrogen-Council-Report_Decarbonization-Pathways_Part-1-Lifecycle-Assessment.pdf.
- T. report, "The Future of Hydrogen," June 2019 . [Online]. Available: https://www.iea.org/reports/the-future-of-hydrogen.
- H. Pitsch, "Hydrogen: A seemingly simple fuel," in Application in Energy and Combustion Science, Germany, 2020.
- DNV-GL., "Hydrogen as an energy carrier. Retrieved from Oil and Gas:," [Online]. Available: https://www.dnvgl.com/oilgas/download/hydrogen-as-an-energy-carrier.html.
- We Lin Chan, Ivan Ck Tam, Arun Dev, "Theoretical Analysis and Modelling of LNG reforming to Hydrogen Marine Fuel for FLNG Applications," MDPI Gases Journal, no. 2025, 2025.
- Alicia Boyano, Ana Maria Blanco Marigorta, Tatiana Morosuk, George Tsatsaronis, "Steam Methane Reforming System for Hydrogen Production," 10 Feb 2012. [Online]. Available: https://dergipark.org.tr/en/download/article-file/65813.
- L. P. Antonio Vita, "Steam Reforming, Partial Oxidation, and Autothermal Reforming of Ethanol for Hydrogen Production in Conventional Reactors.," Science Direct, Hydrogen Production:, Aug 31 2018. [Online]. Available: https://www.sciencedirect.com/topics/chem.
- D. M. R. Swain, "Fuel Leak Simulation," in Proceedings of the 2001 DOE Hydrogen Program Review, University of Miami, 2001.
- M. Gillespie, "Hyper for hydrogen: our world first for carbon-free fuel. Retrieved from CSIROscope:," Nov 2018. [Online]. Available: https://blog.csiro.au/hyper-for-hydrogen-our-world-first-carbon-free-fuel/.
- College of the Desrt, "Hydrogen Properties," December 2001. [Online]. Available: https://www1.eere.energy.gov/hydrogenandfuelcells/tech_validation/pdfs/fcm01r0.pdf.
- D. J.-w. Kim, "OVERVIEW OF FECM HYDROGEN," Fossil Energy and Carbon Management, US, 2023.
- R. Joel, Basic Engineering Thermodynamics., India: : Pearson Education., (1996).
- A. T. HYSYS®2004.2; Operations Guide, @aspentech, 2004.
- B. FINANCE, "World’s First Gas Turbine-Powered LNG Carrier Gets Approval in Principle," 7 July 2015. [Online]. Available: https://www.offshore-energy.biz/worlds-first-gas-turbine-powered-lng-carrier-gets-approval-in-principle/.
- Professor Kyutae Kim, Dr. Kiyoung Jung, "How Simulation Addresses Hydrogen Fuel Challenges," Ansys part of synopsys, 21 June 2024. [Online]. Available: https://www.ansys.com/blog/how-simulation-addresses-hydrogen-fuel-challenges.
- P. P. Meherwan P.Boyce, Gas Turbine Engineering Handbook, Linacre House, Jordan Hill, Oxford OX2 8DP, UK: GulfProfessional Publishing, 2006.
- Rogers, Engineering Thermodynamics: Work and Heat Transfer, India: Pearson Education, 1967.
- M. Leduc, "The emerging prime mover," March 2001. [Online]. Available: http://www.dieselduck.info/machine/01%20prime%20movers/gas_turbine/gas_turbine.htm.
- N. Glenn Research Center, "Chemical Equalibrium with Applications," [Online]. Available: https://www1.grc.nasa.gov/research-and-engineering/ceaweb/.
- Robert H., Perry; Don W., Green; James, O. Maloney, Perry's Chemical Engineers' Handbook (7th Edition), McGraw-Hill, 1997.
- NIST, "NIST Chemistry WebBook," NIST, 2025. [Online]. Available: https://webbook.nist.gov/chemistry/.
- A. Lefebvre and D. Ballal,, Gas Turbine Combustion, 3rd ed.,, CRC Press, 2010.
- J. B. Heywood, Internal Combustion Engine Fundamentals, 2nd Edition, Mc Graw Hill.
- S. R. Turns, An Introduction to Combustion: Concepts and Applications, UK: McGraw-Hill Education, 2011.
- Kawasaki, "Hydrogen gas turbine offers promise of clean electricity by nature research custom media," 2024. [Online]. Available: https://www.nature.com/articles/d42473-022-00211-0.
Disclaimer/Publisher’s Note: The statements, opinions and data contained in all publications are solely those of the individual author(s) and contributor(s) and not of MDPI and/or the editor(s). MDPI and/or the editor(s) disclaim responsibility for any injury to people or property resulting from any ideas, methods, instructions or products referred to in the content. |
© 2025 by the authors. Licensee MDPI, Basel, Switzerland. This article is an open access article distributed under the terms and conditions of the Creative Commons Attribution (CC BY) license (http://creativecommons.org/licenses/by/4.0/).
Copyright: This open access article is published under a Creative Commons CC BY 4.0 license, which permit the free download, distribution, and reuse, provided that the author and preprint are cited in any reuse.


