Submitted:
12 June 2025
Posted:
17 June 2025
You are already at the latest version
Abstract
Hydrogen technologies are emerging as a pivotal solution in global efforts to decarbonize energy-intensive sectors, aligning with climate goals. This study provides a comprehensive review of hydrogen production technologies—gray, blue, green, turquoise, pink, yellow, and white—examining their technical feasibility, emissions profile, economic viability, and policy implications, particularly in developing regions such as MENA and Africa.
A harmonized classification model was developed, incorporating ISO 14040, IRENA guidelines, UNECE’s UNFC framework, and the EU Taxonomy, systematically assessing hydrogen technologies based on sustainability (E-axis), technical feasibility (F-axis), and project maturity (G-axis). Results indicate that green hydrogen aligns best with net-zero objectives, while blue hydrogen serves as a transitional solution, constrained by carbon capture efficiency. Turquoise and white hydrogen present promising low-emission alternatives, though their market readiness remains limited.
By evaluating hydrogen’s role in climate mitigation and adaptation, this paper highlights strategic policy recommendations, advocating for investment in renewable infrastructure, international collaborations, and tailored regulations to accelerate the adoption of hydrogen solutions. Findings contribute to scientific discourse on hydrogen innovation, providing actionable insights for policymakers, industry leaders, and researchers.
Keywords:
hydrogen production
; climate resilience
; UNFC framework
; evaluation framework
; decarbonization
; net-zero
; MENA & Africa Region
; gray
; blue
; green
; turquoise
; pink
; yellow
; and white hydrogen
1. Introduction
Hydrogen (H2), the most abundant element in the universe, constitutes approximately 75% of normal matter by mass, primarily found in stars and interstellar gas clouds (Carroll & Ostlie, 2017). On Earth, hydrogen is rarely found in its molecular form due to its high reactivity, instead occurring in compounds like water (H2O) and hydrocarbons (Glasstone, 2013). To harness hydrogen as an energy carrier, it must be extracted through processes such as electrolysis or steam methane reforming (SMR), which separate it from these compounds (Sharma & Ghoshal, 2015).
With an energy content of 120 megajoules per kilogram—nearly three times that of gasoline—hydrogen offers significant potential as a high-energy-density fuel (Züttel, 2003). When used in fuel cells or combusted, it produces only water as a byproduct, positioning it as a clean alternative to fossil fuels, which emit greenhouse gases and pollutants (Turner, 2004). Hydrogen’s versatility makes it suitable for applications in energy storage, industrial processes (e.g., ammonia synthesis and oil refining), and transportation, including heavy-duty vehicles and aviation (U.S. Department of Energy, 2020).
Currently, most hydrogen production relies on fossil fuels, with 96% derived from natural gas via SMR, a process that generates significant CO2 emissions (International Energy Agency, 2019). To align with global sustainability goals, alternative production methods, such as electrolysis powered by renewable or nuclear energy, are gaining traction to reduce the carbon footprint of hydrogen supply chains (Staffell et al., 2019). These advancements underscore hydrogen’s potential to transform the global energy landscape.
This study evaluates the spectrum of hydrogen production technologies, classified by color (e.g., gray, blue, green), through a harmonized framework integrating sustainability, technical feasibility, and project maturity (UNECE, 2021). By analyzing their environmental and economic viability, with a focus on deployment in regions like MENA and Africa, this paper provides actionable insights for policymakers and researchers driving the transition to a sustainable energy future.
2. Historical Evolution of Hydrogen Production
The development of hydrogen production technologies began in the early 19th century with the discovery of electrolysis by British scientists William Nicholson and Anthony Carlisle in 1800. This process, which uses electricity to split water into hydrogen and oxygen, marked the first method to isolate molecular hydrogen (H2) but was limited by high energy requirements (Smil, 2017).
Industrial-scale hydrogen production emerged in the 1920s with the introduction of steam methane reforming (SMR), a process that extracts hydrogen from natural gas using high-temperature steam. SMR’s efficiency and the widespread availability of natural gas made it the dominant production method, establishing what is now known as gray hydrogen (Rostrup-Nielsen, 2017). This technology supported early industrial applications, particularly in ammonia synthesis and oil refining.
The oil crises of the 1970s spurred renewed interest in alternative hydrogen production methods to reduce reliance on fossil fuels. Electrolysis powered by renewable energy sources gained attention, laying the foundation for green hydrogen, though its adoption was constrained by cost and limited renewable energy infrastructure at the time (Bockris, 2002).
In the 2000s, advancements in carbon capture and storage (CCS) technologies led to the development of blue hydrogen, which adapts SMR by capturing and storing CO2 emissions. This approach leveraged existing natural gas infrastructure while addressing environmental concerns (Staffell et al., 2019). Concurrently, research into methane pyrolysis introduced turquoise hydrogen, a process that decomposes methane into hydrogen and solid carbon, offering a novel approach to reduce emissions (Abánades, 2020).
More recently, the exploration of nuclear-powered electrolysis gave rise to pink hydrogen, utilizing nuclear energy’s consistent output to drive hydrogen production (International Atomic Energy Agency, 2020). Grid-based electrolysis, termed yellow hydrogen, also emerged, with its viability tied to regional electricity mixes (Ball & Wietschel, 2009). Additionally, the discovery of naturally occurring white hydrogen in geological formations has opened a new frontier, though extraction methods remain in early research stages (He, 2020).
This historical progression reflects the shift from fossil fuel-dependent methods to diverse, lower-carbon alternatives, driven by technological innovation and growing environmental priorities. The evolution sets the stage for a detailed analysis of these production methods (see Section 3).
Figure 1.
Hydrogen production technologies and its environmental impacts – categorized by color (Authors illustration).
Figure 1.
Hydrogen production technologies and its environmental impacts – categorized by color (Authors illustration).
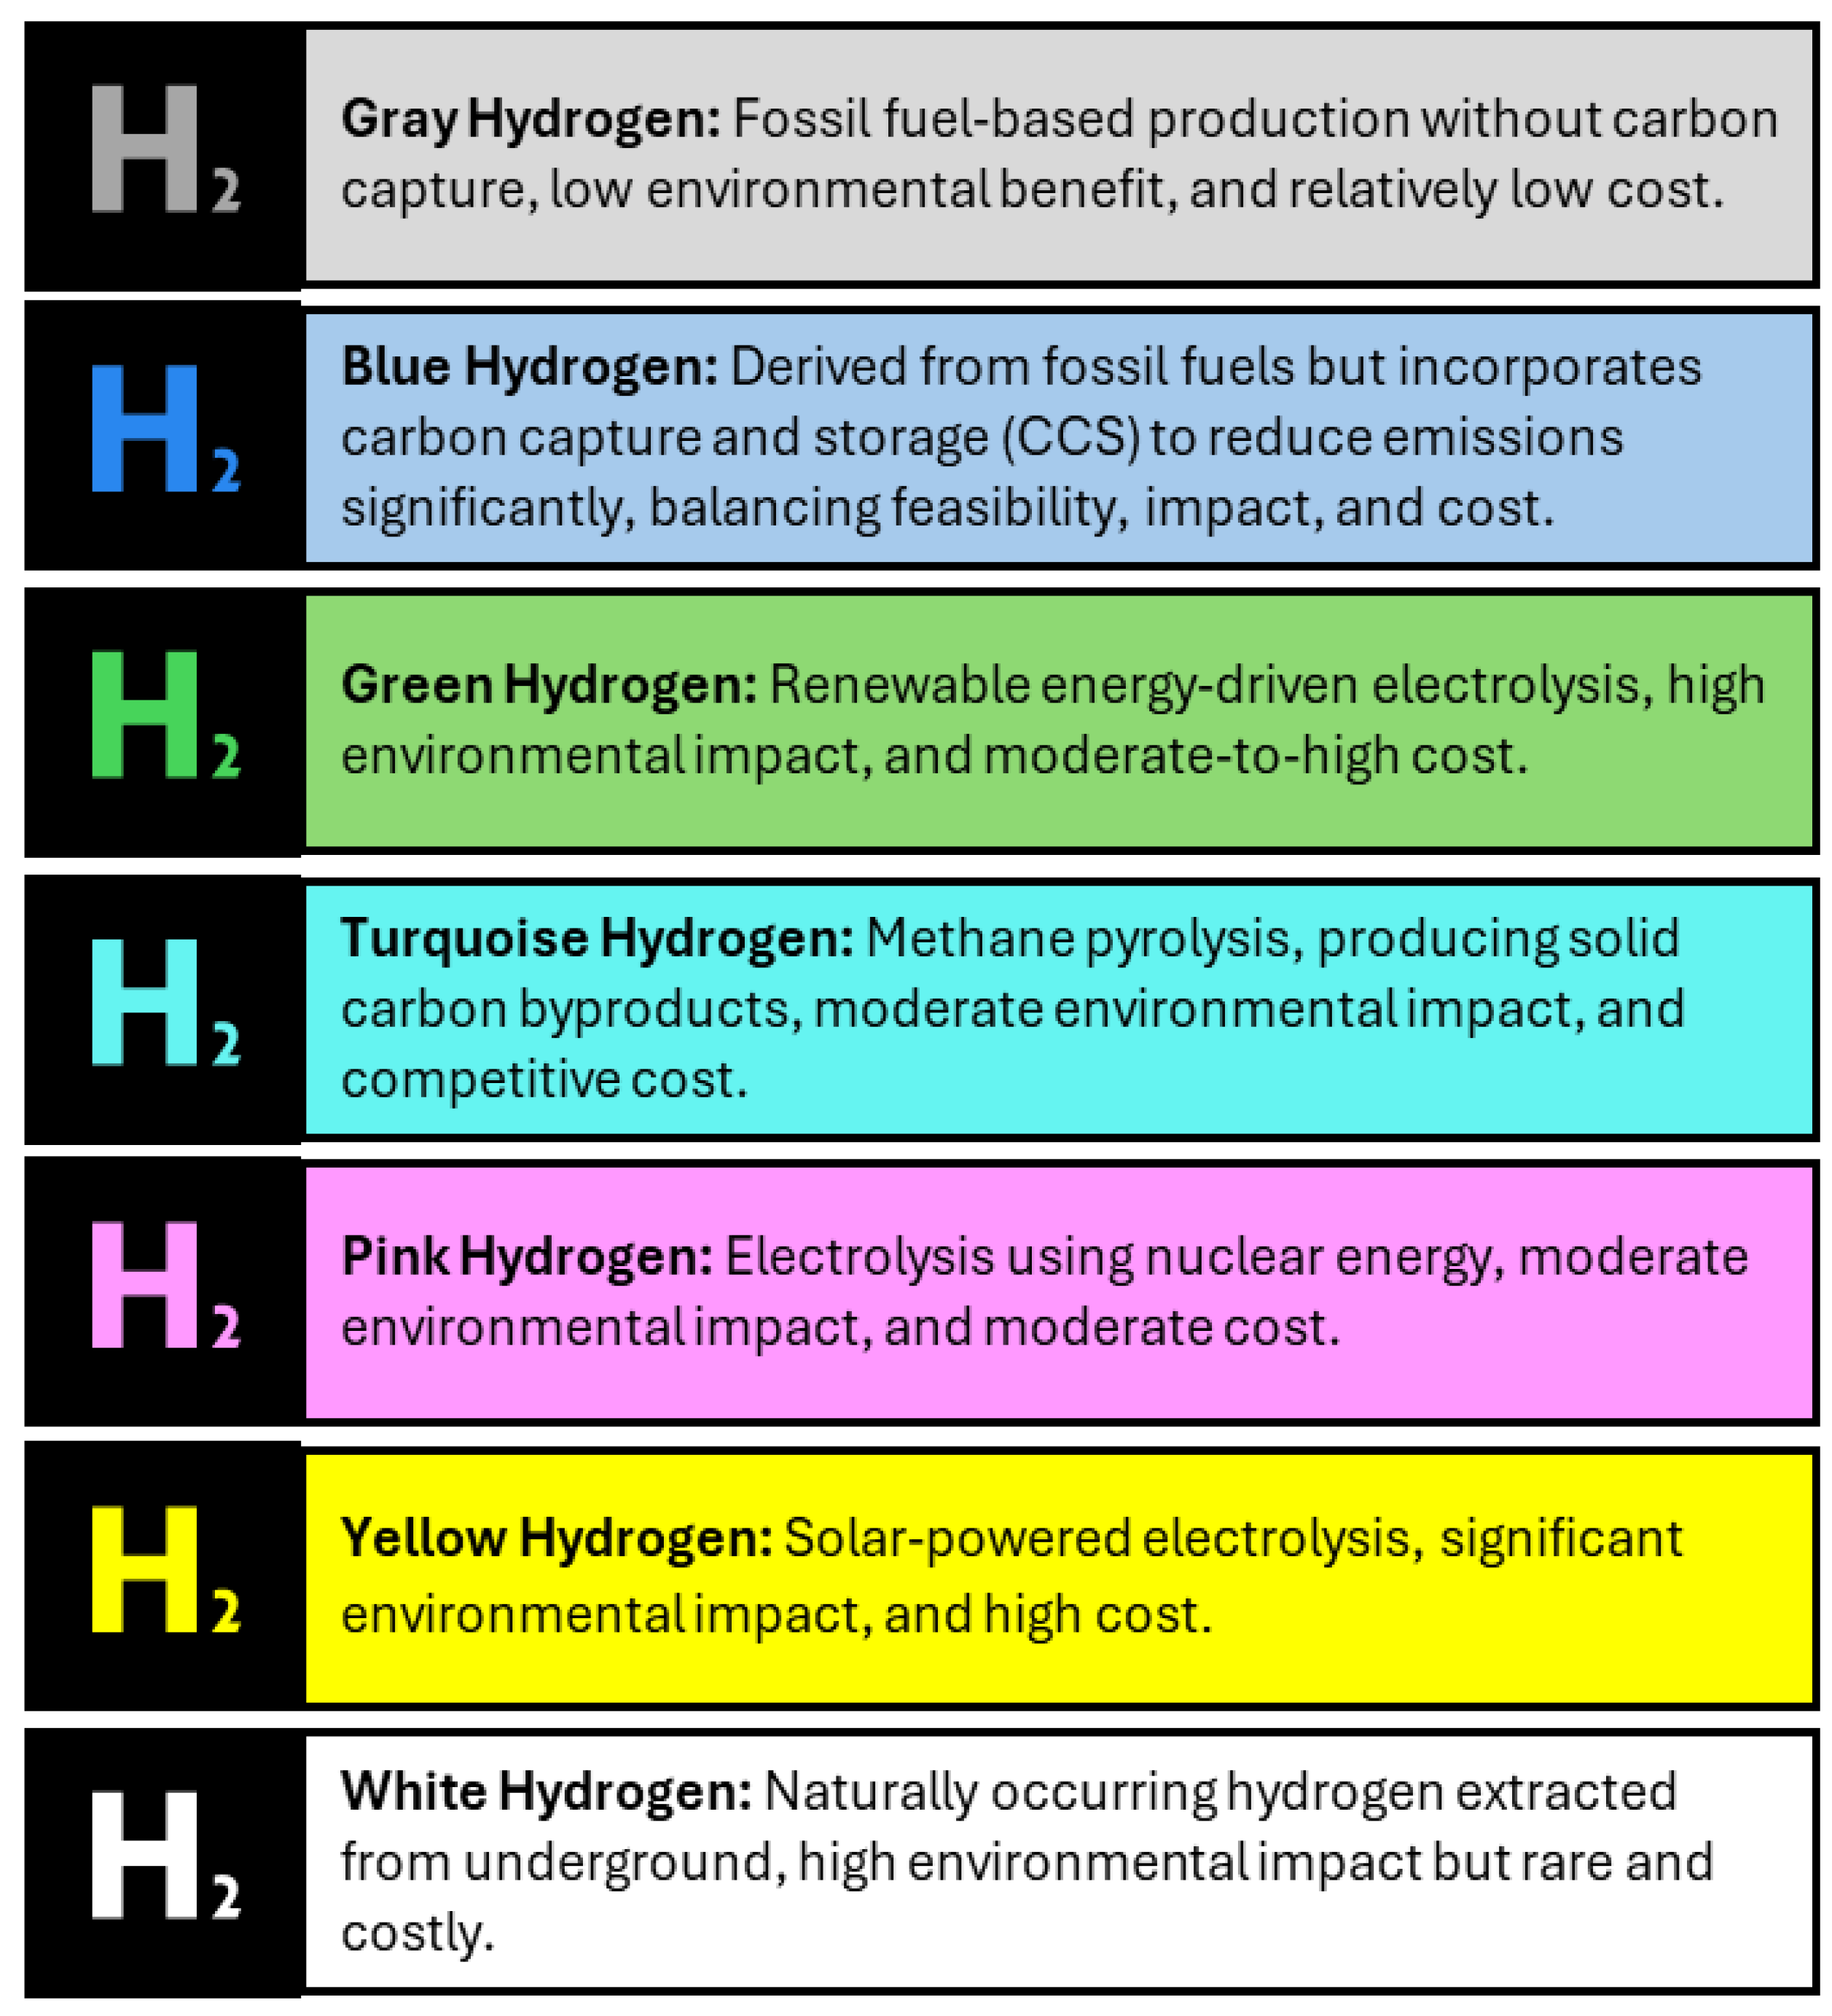
3. Analysis of Hydrogen Technologies by Color
Hydrogen production technologies are classified by color to distinguish their processes, environmental impacts, and applications. This section analyzes gray, blue, green, turquoise, pink, yellow, and white hydrogen based on their production methods, emissions profiles, technological maturity, and potential uses, providing a foundation for subsequent evaluations (see Section 4, Section 5 and Section 6).
Gray Hydrogen
Produced via steam methane reforming (SMR), gray hydrogen extracts hydrogen from natural gas, releasing 10–12 kg CO2e/kg H2 due to uncaptured emissions. As a mature technology (TRL 9), it is cost-effective and widely used in ammonia synthesis and oil refining but faces regulatory constraints due to its high carbon footprint (Rostrup-Nielsen, 2017; International Energy Agency, 2019).
Blue Hydrogen
Blue hydrogen also uses SMR but integrates carbon capture and storage (CCS), reducing emissions to 2–3 kg CO2e/kg H2. With a TRL of 9 for SMR and 7–8 for CCS, it leverages existing infrastructure, making it suitable for industries transitioning to lower-carbon processes. However, CCS costs and methane leakage risks limit its long-term viability (Staffell et al., 2019; Tollefson, 2021).
Green Hydrogen
Green hydrogen is generated through electrolysis powered by renewable energy (e.g., solar, wind), producing zero direct CO2 emissions (<1 kg CO2e/kg H2). At TRL 7–8, it is scaling up for applications in transportation, energy storage, and industrial decarbonization. High electrolyzer costs and renewable energy availability are current constraints, though costs are declining (Bockris, 2002; U.S. Department of Energy, 2020).
Turquoise Hydrogen
Turquoise hydrogen, produced via methane pyrolysis, decomposes methane into hydrogen and solid carbon, yielding 2–4 kg CO2e/kg H2 from lifecycle emissions. At TRL 4–6, it is in the pilot stage, with potential for regions with natural gas and solid carbon markets. Commercial scalability remains a challenge (Abánades, 2020; Hydrogen Council, 2021).
Pink Hydrogen
Pink hydrogen employs nuclear-powered electrolysis, achieving emissions of <1 kg CO2e/kg H2. With a TRL of 7–8, it supports continuous production for heavy industries like steel and chemicals. Its adoption is limited by nuclear infrastructure costs and public perception (Glasstone & Sesonske, 2014; International Atomic Energy Agency, 2020).
Yellow Hydrogen
Yellow hydrogen is produced via grid-based electrolysis, with emissions (1–5 kg CO2e/kg H2) varying by the grid’s energy mix. At TRL 7–8, it is flexible but less sustainable in fossil fuel-heavy grids. Its potential increases in regions with high renewable grid penetration (Ball & Wietschel, 2009).
White Hydrogen
White hydrogen, naturally occurring in geological formations, has minimal emissions (<1 kg CO2e/kg H2) but is at TRL 1–3 due to undeveloped extraction methods. It holds future potential if geological and commercial challenges are addressed (He, 2020).
This analysis highlights the trade-offs between cost, emissions, and technological readiness, guiding the evaluation of hydrogen’s role in sustainable energy systems (see Section 4 for classification framework).

Table 1.
Summary of Hydrogen Production Methods by Color, Emissions, and Applicability.
| Color | Production Method | Emissions (kg CO2e/kg H2) | Applicability |
|---|---|---|---|
| Gray | Steam Methane Reforming (SMR) | 10–12 | Cost-effective for ammonia synthesis, oil refining; high emissions limit use |
| Blue | SMR with CCS | 2–3 | Transitional for industries with gas infrastructure; CCS costs a constraint |
| Green | Electrolysis (renewable energy) | <1 | Ideal for transport, energy storage, industrial decarbonization |
| Turquoise | Methane Pyrolysis | 2–4 | Emerging for regions with gas and carbon markets; pilot stage |
| Pink | Electrolysis (nuclear energy) | <1 | Continuous production for heavy industries; nuclear perception challenges |
| Yellow | Electrolysis (grid electricity) | 1–5 | Flexible; emissions depend on grid mix |
| White | Geological extraction | <1 | Speculative; potential with advanced extraction methods |
4. Harmonized Evaluation Model for Hydrogen Technologies
The United Nations Framework Classification for Resources (UNFC) evaluates resources using Environmental and Socio-Economic Viability (E-axis), Technical Feasibility (F-axis), and Project Maturity/Confidence (G-axis) (UNECE, 2021). To systematically assess hydrogen production technologies, this study develops a harmonized evaluation model adapted from the UNFC, integrating criteria from the International Renewable Energy Agency (IRENA), ISO 14040, and the EU Taxonomy (UNECE, 2021; IRENA, 2023; International Organization for Standardization, 2020; European Commission, 2023). The model evaluates technologies across three axes: Environmental and Socio-Economic Viability (E-axis), Technical Feasibility (F-axis), and Project Maturity/Confidence (G-axis).
E-axis: Environmental and Socio-Economic Viability
The E-axis assesses sustainability and economic viability, incorporating IRENA’s lifecycle emissions metrics, ISO 14040’s lifecycle assessment principles, and EU Taxonomy’s low-carbon threshold (<3 kg CO2e/kg H2) (International Organization for Standardization, 2020; European Commission, 2023). Sub-axes are:
- E1 (Sustainable and Viable): Lifecycle emissions <1 kg CO2e/kg H2, minimal water use, and cost-competitiveness with market incentives.
- E2 (Moderately Sustainable): Emissions of 1–5 kg CO2e/kg H2, moderate water use, and economic viability dependent on subsidies. Risks include upstream emissions (e.g., methane leakage) and regulatory uncertainty.
- E3 (Unsustainable): Emissions >5 kg CO2e/kg H2, high resource use, and economic challenges due to carbon pricing or bans.
F-axis: Technical Feasibility
- The F-axis evaluates technological maturity and scalability, aligned with IRENA’s Technology Readiness Levels (TRL) and ISO/TC 197 standards (IRENA, 2023; International Organization for Standardization, 2020). Sub-axes are:
- F1 (Commercially Deployed): TRL 9, fully commercialized with proven scalability (e.g., steam methane reforming).
- F2 (Scaling Up): TRL 7–8, large-scale demonstration with established standards (e.g., electrolysis).
- F3 (Pilot Stage): TRL 4–6, pilot-scale with emerging standards, facing scalability risks.
- F4 (Conceptual): TRL 1–3, experimental technologies with high technical uncertainties.
G-axis: Project Maturity/Confidence
The G-axis measures project readiness and operational confidence, based on UNECE criteria (UNECE, 2021). Sub-axes are:
- G1 (High Confidence): Established supply chains and regulatory frameworks with low risks.
- G2 (Moderate Confidence): Developing supply chains with moderate risks (e.g., regulatory delays, public opposition).
- G3 (Low Confidence): Immature supply chains and unproven regulations.
- G4 (Speculative): Highly uncertain projects with no established supply chains or regulations.
The following table (Table 2) assigns hydrogen types to the harmonized UNFC-like categories based on these definitions.
The following 3D plot (Figure 2) visualizes the classification, with E, F, and G axes. Each hydrogen type is plotted using the estimations from Table 2 coordinates and color-coded. The plot highlights clusters: Gray at high E, low F/G; Green and Pink at low E, moderate F/G; Blue, Turquoise, Yellow and White at moderate F/G and mid E.
The above harmonized UNFC-like model provides a general framework for evaluating hydrogen technologies, aligned with IRENA, ISO, EU Taxonomy, and UNECE standards. Green, Pink, and Yellow hydrogen excel in sustainability but face scaling and cost risks. Blue and Turquoise offer transitional solutions, constrained by lifecycle emissions and technical maturity. Gray hydrogen is unsustainable, while White is speculative.
5. Hydrogen Technologies and Climate Change
Hydrogen technologies offer significant potential for climate mitigation and adaptation by providing low-carbon alternatives for hard-to-decarbonize sectors such as heavy industry, transportation, and energy storage. This section evaluates the climate impacts of hydrogen types, focusing on their mitigation potential, adaptation roles, and alignment with net-zero goals, building on their technical characteristics (see Section 3) and evaluation framework (see Section 4).
Gray Hydrogen
With emissions of 10–12 kg CO2e/kg H2, gray hydrogen’s high carbon footprint makes it incompatible with net-zero targets, contributing significantly to greenhouse gas (GHG) emissions in its current form (International Energy Agency, 2019). Its role in climate mitigation is negligible, and it offers no adaptation benefits.
Blue Hydrogen
Blue hydrogen, emitting 2–3 kg CO2e/kg H2 with carbon capture and storage (CCS), serves as a transitional solution for industries reliant on natural gas. It supports short-term mitigation in regions with CO2 storage capacity but faces risks from methane leakage and CCS costs, limiting long-term sustainability (Staffell et al., 2019; Tollefson, 2021). Its adaptation role is minimal due to reliance on fossil fuel infrastructure.
Green Hydrogen
Green hydrogen, with emissions <1 kg CO2e/kg H2, is central to climate mitigation, enabling decarbonization of steel, cement, and heavy-duty transport in regions with abundant renewables (U.S. Department of Energy, 2020). It also enhances adaptation by supporting seasonal energy storage and grid stability, particularly in climates with variable renewable output (IRENA, 2021). Its scalability depends on renewable infrastructure expansion.
Turquoise Hydrogen
Turquoise hydrogen (2–4 kg CO2e/kg H2) offers moderate mitigation potential by producing solid carbon instead of CO2, with applications in regions with natural gas and carbon markets (Abánades, 2020). Its low water footprint supports adaptation in water-scarce regions, though its pilot-stage status limits current deployment (Hydrogen Council, 2021).
Pink Hydrogen
Pink hydrogen, with emissions <1 kg CO2e/kg H2, supports mitigation in countries with nuclear capacity, providing a steady low-carbon energy source for industrial processes (International Atomic Energy Agency, 2020). Its adaptation role is moderate, offering energy security but constrained by nuclear infrastructure and public perception.
Yellow Hydrogen
Yellow hydrogen’s emissions (1–5 kg CO2e/kg H2) vary with the grid’s energy mix, offering variable mitigation potential. It supports adaptation through grid flexibility in regions with high renewable penetration (include hydropower plants) but is less effective in fossil fuel-heavy grids (Ball & Wietschel, 2009).
White Hydrogen
White hydrogen, with emissions <1 kg CO2e/kg H2, holds potential for mitigation if extraction methods advance, though its speculative status limits current contributions (He, 2020). Its adaptation role remains unclear due to undeveloped technology.
Circular Economy and Climate Impacts
Hydrogen from biomass or waste streams supports circular economy principles by closing material loops, while green hydrogen utilizing curtailed renewables enhances grid flexibility (IRENA, 2021). Repurposing gas networks for hydrogen distribution and developing export economies (e.g., green ammonia) can mitigate stranded asset risks. By 2040, green hydrogen is projected to dominate new investments, reducing fossil-derived hydrogen to <10% of global supply, driven by falling electrolyzer costs and carbon pricing (IRENA, 2023).
On the other hand, hydrogen strengthens resilience by enabling seasonal energy storage and energy security diversification. In water-scarce regions, turquoise and pink hydrogen offer relatively low water footprints. The potential to store excess renewable power as hydrogen further reinforces energy system stability in the face of climatic variability.
Table 3.
Climate Action of Hydrogen Technologies by Color.
| Hydrogen Type | Mitigation Potential | Adaptation Role | Climate Finance Eligibility | Circular Economy Link | Net-Zero Alignment |
|---|---|---|---|---|---|
| Gray | Very Low | Negligible | Ineligible | None | Misaligned |
| Blue | Moderate (short-term) | Limited | Conditional (high CCS) | Low | Transitional |
| Green | High | High | Eligible, prioritized | Strong | Fully aligned |
| Turquoise | Moderate | High | Emerging | Medium | Potentially aligned |
| Pink | High | Moderate | Eligible (region-specific) | Medium | Aligned (regionally) |
| Yellow | Variable | Moderate | Context-dependent | Low | Uncertain |
| White | Unclear | Unknown | Not yet eligible | Unknown | Uncertain |
Hydrogen’s climate potential hinges on scaling low-emission technologies and infrastructure, with green and pink hydrogen leading net-zero strategies and turquoise offering transitional benefits (see Section 6 for regional applications).
6. Hydrogen Deployment in MENA and Africa: Technical, Economic, and Policy Insights
This section examines the deployment of hydrogen technologies in the Middle East and North Africa (MENA) and sub-Saharan Africa, focusing on Oman, Qatar, Namibia, and Egypt as case studies. It analyzes technical feasibility, economic viability, and policy frameworks, leveraging the technical characteristics (Section 3) and evaluation model (Section 4) to highlight regional strategies for climate resilience.
Oman: Green Hydrogen Leadership
Oman’s abundant solar and wind resources (7,500 full load hours annually) and vast land availability (~50,000 km²) make it a prime candidate for green hydrogen production via renewable-powered electrolysis, with emissions <1 kg CO2e/kg H2 (IEA, 2023). The levelized cost of hydrogen (LCOH) is projected to reach $1.6/kg by 2030, driven by low-cost renewables and integrated desalination to minimize water use. Oman’s national strategy, led by HYDROM, targets 1 Mt/year of green hydrogen by 2030 and 8.5 Mt/year by 2050, positioning the country as a green ammonia exporter to Europe and Asia (IEA, 2023).
Qatar: Blue and Turquoise Hydrogen Transition
Qatar leverages its natural gas reserves and LNG infrastructure to produce blue hydrogen via steam methane reforming (SMR) with carbon capture and storage (CCS), emitting 2–3 kg CO2e/kg H2, and turquoise hydrogen via methane pyrolysis, with emissions of 2–4 kg CO2e/kg H2 (Earthna, 2025). QatarEnergy’s investments in blue ammonia and CCS infrastructure yield an LCOH of $1.7–2.2/kg by 2030. The national roadmap aims to redirect 25% of LNG output to hydrogen by 2035, aligning with EU Carbon Border Adjustment Mechanism (CBAM) standards, though electrolysis infrastructure remains underdeveloped (Earthna, 2025).
Namibia: Emerging Green Hydrogen Hub
Namibia’s high solar potential (~3,000 kWh/m²/year) and coastal access support green hydrogen production via electrolysis, with emissions <1 kg CO2e/kg H2 (UNIDO, 2022). Pilot projects estimate an LCOH of $1.8–2.0/kg by 2030, targeting European exports. Challenges include weak grid integration and high capital costs, but policy support through the Green Hydrogen Council is accelerating development (UNIDO, 2022).
Egypt: Green Hydrogen for Export
Egypt’s solar and wind resources enable green hydrogen production with emissions <1 kg CO2e/kg H2, supported by projects in the Suez Canal Economic Zone (IRENA, 2023). With an estimated LCOH of $1.8–2.5/kg by 2030, Egypt aims to export green ammonia to Europe. The African Union’s Green Hydrogen Strategy bolsters these efforts, though regulatory frameworks and financing gaps pose barriers (African Union, 2023).
Table 4.
Comparative Insights and Policy Implications.
| Country | Main Hydrogen Type | LCOH (2030 est.) | CO2 Intensity (kg CO2e/kg H2) | Export Focus | Policy Support |
|---|---|---|---|---|---|
| Oman | Green | ~$1.6/kg | <1 | Ammonia (EU/Asia) | Strong (HYDROM-led) |
| Qatar | Blue/Turquoise | ~$1.7–2.2/kg | 2–4 | Ammonia, LNG H2 mix | Emerging (QatarEnergy) |
| Namibia | Green | ~$1.8–2.0/kg | <1 | Europe | Growing (pilot-driven) |
| Egypt | Green | ~$1.8–2.5/kg | <1 | Ammonia (Europe) | Moderate (AU strategy) |
These case studies illustrate diverse approaches to hydrogen deployment, with Oman and African nations prioritizing green hydrogen for export and Qatar transitioning via blue and turquoise pathways. Policy alignment, financing, and infrastructure development are critical to scaling these initiatives (see Section 7 for recommendations).
7. Conclusion and Recommendations
Conclusion
Hydrogen technologies are pivotal for transitioning to sustainable energy systems, offering solutions to decarbonize high-emission sectors and enhance climate resilience. This study evaluated gray, blue, green, turquoise, pink, yellow, and white hydrogen through a harmonized framework assessing sustainability, technical feasibility, and project maturity (Section 4). Green hydrogen, with emissions <1 kg CO2e/kg H2, emerges as the most aligned with net-zero goals, supported by its scalability in regions with abundant renewables (Section 5). Blue and turquoise hydrogen serve as transitional options, constrained by lifecycle emissions and technical challenges, while pink and yellow hydrogen offer regional flexibility, and white hydrogen remains speculative (Section 3). Case studies from Oman, Qatar, Namibia, and Egypt highlight diverse deployment strategies, with green hydrogen leading export potential and blue/turquoise leveraging existing infrastructure (Section 6).
This analysis underscores the need for tailored policies and investments to scale low-emission hydrogen technologies, particularly in MENA and Africa, where resource advantages can drive global energy transitions. By integrating technical, economic, and environmental insights, this study contributes actionable guidance for stakeholders advancing a hydrogen-based economy.
Recommendations
- Strengthen Policy Frameworks: Governments should establish targeted regulations to incentivize low-emission hydrogen. For example, adopting Oman’s HYDROM model—a centralized agency for land and licensing—can streamline green hydrogen projects (IEA, 2023). Carbon pricing and subsidies for green and blue hydrogen can accelerate adoption, aligned with EU Taxonomy criteria (European Commission, 2023).
- Invest in Infrastructure: Public-private partnerships should prioritize hydrogen hubs, including production, storage, and distribution networks. Qatar’s integration of CCS with LNG infrastructure offers a model for blue hydrogen, while Namibia’s pilot projects highlight the need for grid upgrades to support green hydrogen (Earthna, 2025; UNIDO, 2022).
- Foster International Collaboration: Cross-border partnerships can mobilize financing and expertise, particularly for African nations like Egypt, where the African Union’s Green Hydrogen Strategy supports export-oriented projects (African Union, 2023). Collaborations with EU markets can enhance knowledge transfer and create export opportunities.
- Support Research and Development (R&D): Investments in R&D are critical to scale emerging technologies like turquoise and white hydrogen. Pilot projects, such as those for methane pyrolysis in Qatar, should focus on cost reduction and scalability (Abánades, 2020). Research into white hydrogen extraction could unlock new low-emission sources (He, 2020).
- Build Workforce and Public Support: Training programs and public outreach are essential to develop skilled labor and address perception challenges, particularly for pink hydrogen in nuclear-reliant regions. Egypt’s technical training initiatives for green hydrogen projects provide a replicable model (IRENA, 2023).
By leveraging regional strengths and implementing these strategies, countries can harness hydrogen’s potential to achieve sustainable energy systems and climate resilience, paving the way for a net-zero future.
References
- Abánades, A. Hydrogen production from methane pyrolysis (turquoise hydrogen): A possible bridge between natural gas and renewable hydrogen. International Journal of Hydrogen Energy 2020, 45, 8310–8320. [Google Scholar]
- African Union. (2023). Green hydrogen strategy for Africa. https://www.au.int/en/documents/green-hydrogen-strategy.
- Ball, M., & Wietschel, M. (2009). The hydrogen economy: Opportunities and challenges. Cambridge University Press.
- Bockris, J.O.M. The hydrogen economy: Its history and prospects. Science and Public Policy 2002, 29, 31–37. [Google Scholar]
- Carroll, B. W., & Ostlie, D. A. (2017). An introduction to modern astrophysics. Cambridge University Press.
- Earthna. (2025). Developing a clean hydrogen industry in Qatar. https://earthna.qa/research/developing-clean-hydrogen-industry-qatar.
- European Commission. (2023). EU taxonomy for sustainable activities. https://ec.europa.eu/info/business-economy-euro/banking-and-finance/sustainable-finance_en.
- Glasstone, S. (2013). Sourcebook on the hydrogen economy. Elsevier.
- Glasstone, S. , & Sesonske, A. Nuclear reactor engineering: Reactor systems engineering. Springer.
- He, Y. Naturally occurring hydrogen: A new frontier in energy. Renewable Energy 2020, 145, 1625–1632. [Google Scholar]
- Howarth, R. W. , & Jacobson, M. Z. (2021). The colors of hydrogen. Belfer Center for Science and International Affairs. https://www.belfercenter.org.
- Hydrogen Council. (2021). Hydrogen insights report 2021. https://www.hydrogencouncil.com.
- International Atomic Energy Agency. (2020). Nuclear power and the clean energy transition. https://www.iaea.org.
- International Energy Agency. (2019). The future of hydrogen. https://www.iea.org.
- International Energy Agency. (2023). Renewable hydrogen from Oman: A producer economy in transition. https://www.iea.org/reports/renewable-hydrogen-from-oman-a-producer-economy-in-transition.
- International Organization for Standardization. (2020). ISO 14040: Environmental management – Life cycle assessment. https://www.iso.org.
- International Renewable Energy Agency. (2021). The role of hydrogen in the energy transition. https://www.irena.org.
- International Renewable Energy Agency. (2023). Green hydrogen supply chain: Morocco as a case study. https://www.irena.org.
- Rostrup-Nielsen, J.R. Industrial uses of hydrogen. Catalysis Today 2017, 103, 9–15. [Google Scholar]
- Sharma, S.; Ghoshal, S.K. Hydrogen the future transportation fuel: From production to applications. Renewable and Sustainable Energy Reviews 2015, 43, 1151–1158. [Google Scholar] [CrossRef]
- Smil, V. (2017). Energy and civilization: A history. MIT Press.
- Staffell, I.; Scamman, D.; Abad, A.V.; Balcombe, P.; Dodds, P.E.; Ekins, P.; Shah, N.; Ward, K.R. The role of hydrogen and fuel cells in the global energy system. Energy & Environmental Science 2019, 12, 463–491. [Google Scholar]
- Tollefson, J. (2021). How green is blue hydrogen? Nature, 597, 15–17.
- Turner, J.A. Sustainable hydrogen production. Science 2004, 305, 972–974. [Google Scholar] [CrossRef] [PubMed]
- United Nations Economic Commission for Europe. (2021). United Nations Framework Classification for Resources (UNFC). https://unece.org.
- UNIDO. (2022). Namibia’s green hydrogen future. https://www.unido.org.
- U.S. Department of Energy. (2020). Hydrogen program plan. https://www.energy.gov.
- World Economic Forum. (2021, ). Grey, blue, green – the many colours of hydrogen explained. https://www.weforum.org.
- Züttel, A. Materials for hydrogen storage. Materials Today 2003, 6, 24–33. [Google Scholar] [CrossRef]
Figure 2.
3D UNFC-like Classification of Hydrogen Technologies (Source: Author's illustration). Where: E-axis: Assign E1–E3 based on emissions, resource use, and economic viability, noting subsidy and carbon pricing risks. F-axis: Assign F1–F4 based on TRL and ISO compliance, considering pipeline retrofitting and embrittlement risks. G-axis: Assign G1–G4 based on supply chain maturity and regulatory confidence, accounting for leakage and safety risks.
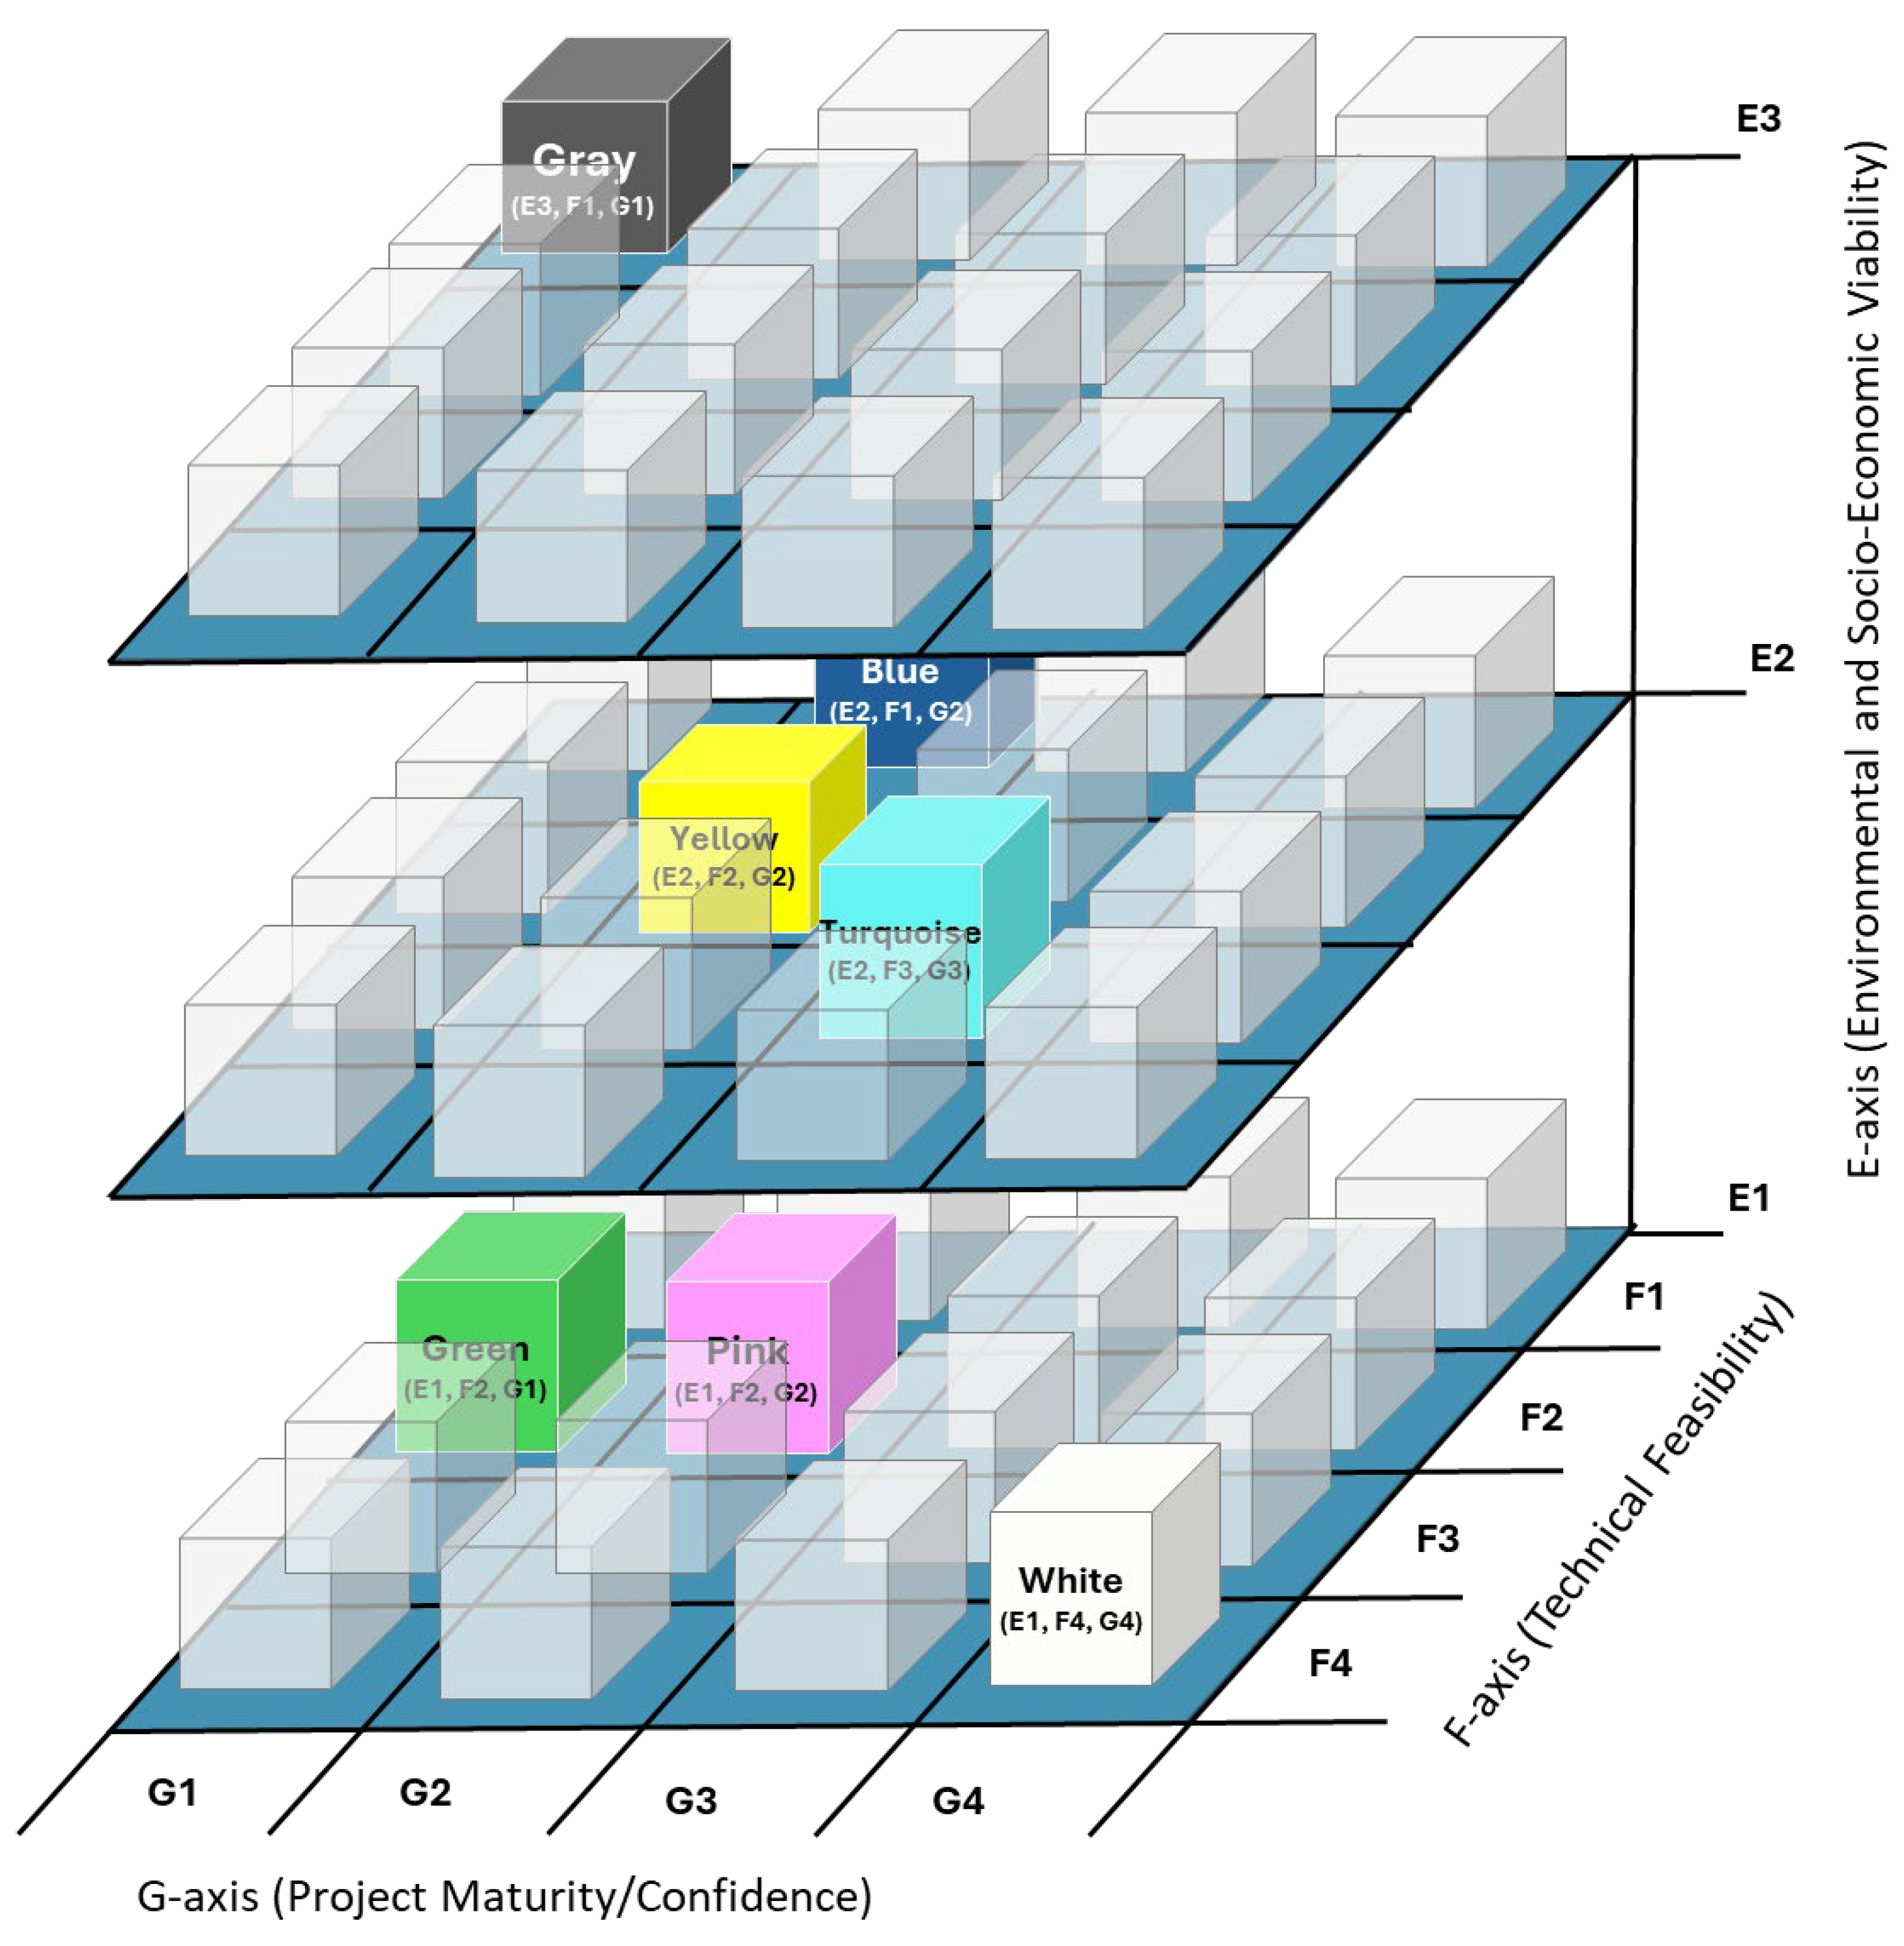
Table 2.
Harmonized UNFC-like Classification for Hydrogen Technologies.
| Hydrogen Type | E-axis | F-axis | G-axis | Description |
|---|---|---|---|---|
| Gray | E3 | F1 | G1 | Steam methane reforming (SMR); 10–12 kg CO2e/kg H2; mature (TRL 9); high confidence but faces carbon pricing risks (Rostrup-Nielsen, 2017; IRENA, 2023). |
| Blue | E2 | F1 | G2 | SMR with CCS; 2–3 kg CO2e/kg H2; mature (TRL 9); moderate confidence due to CCS costs and methane risks (Staffell et al., 2019; Howarth & Jacobson, 2021). |
| Green | E1 | F2 | G1/2 | Renewable electrolysis; <1 kg CO2e/kg H2; scaling (TRL 7–8); high to moderate confidence due to renewable intermittency (IRENA, 2023; U.S. Department of Energy, 2020). |
| Turquoise | E2 | F3 | G2/3 | Methane pyrolysis; 2–4 kg CO2e/kg H2; pilot stage (TRL 4–6); low to moderate confidence due to scalability risks (Abánades, 2020; World Economic Forum, 2021). |
| Pink | E1 | F2 | G2 | Nuclear electrolysis; <1 kg CO2e/kg H2; scaling (TRL 7–8); moderate confidence due to nuclear perception risks (International Atomic Energy Agency, 2020). |
| Yellow | E1/2 | F2 | G2 | Grid electrolysis; 1–5 kg CO2e/kg H2; scaling (TRL 7–8); moderate confidence due to grid mix variability (Ball & Wietschel, 2009). |
| White | E1 | F4 | G4 | Geological extraction; <1 kg CO2e/kg H2; conceptual (TRL 1–3); speculative due to extraction uncertainties (He, 2020). |
Disclaimer/Publisher’s Note: The statements, opinions and data contained in all publications are solely those of the individual author(s) and contributor(s) and not of MDPI and/or the editor(s). MDPI and/or the editor(s) disclaim responsibility for any injury to people or property resulting from any ideas, methods, instructions or products referred to in the content. |
© 2025 by the authors. Licensee MDPI, Basel, Switzerland. This article is an open access article distributed under the terms and conditions of the Creative Commons Attribution (CC BY) license (http://creativecommons.org/licenses/by/4.0/).
Copyright: This open access article is published under a Creative Commons CC BY 4.0 license, which permit the free download, distribution, and reuse, provided that the author and preprint are cited in any reuse.


