
Submitted:
21 December 2024
Posted:
23 December 2024
You are already at the latest version
Abstract
The LNG maritime industry started to anticipate offshore LNG production in tandem with increasing demand for FLNG platforms as offshore gas resources were developed further. The rapid expansion of FLNG deployment demands equipment and procedures that handle challenges associated with weight and space constraints. The chemical composition of LNG will result in slightly less CO2 emissions. While not significant, another crucial aspect is that LNG predominantly comprises methane, acknowledged as a greenhouse gas and is more harmful than CO2.
This requires investigation into clean energy fuel supply for power generation systems, carbon emissions from the process, and thermodynamic analysis and optimization. Focus on supplying fuel for FLNG power generation to reduce the essential management of boil-off fuel gas, which can be researched on the direct reforming method of hydrogen as a marine fuel gas to support the power generation system.
The principal reason for choosing hydrogen over other energy sources is its exceptional energy-to-mass ratio (H/C ratio). The most effective method for hydrogen production is the methane reforming process, which is recognized for generating significant quantities of hydrogen. To optimize the small-scale plant with a carbon capture system (CCS) as an integrated reforming process to produce green hydrogen fuel with zero carbon emissions, this research selection focuses on two alternative processes: steam methane reforming (SMR) and autothermal reforming (ATR).
Furthermore, the research article will contribute to other floating production platforms, such as FPSOs and FSRUs, and will be committed to clean energy policies that mandate the support of green alternatives in substitution of hydrocarbon fuel utilization.
Keywords:
FLNG
; Hydrogen
; Methane
; Natural Gas
; Green House Gas
; Carbon Emission
; SMR
; ATR
1. Introduction
GHG (Green House Gas) emissions from the combustion of hydrocarbon fuels link to climate change and threaten human health. The pollution of the air through global warming eventually reaches irreversible. However, lower emissions will be demanded to mitigate marine industry to clean energy fuel. Most researchers’ vision for the new century is the option to use alternative fuel. Hydrogen is one of the clean energy fuels to replace hydrocarbon fuel which is a promising energy to replace fossil energy and plays a significant role in future energy systems; the main reason that the final product of hydrogen combustion is pure water.
This serious focus on the hydrogen research area is that the production of Hydrogen is directly linked with hydrogen storage and safety factor. Moreover, Hydrogen is the energy carrier, and pure hydrogen gas is not a natural resource like natural gas and oil. Hydrogen can be produced from various sources, such as fossil fuels, biomass, water, etc. Also, efficient hydrogen production is still in the pipeline research area, such as hydrogen fuel cells, steam methane reforming, and membrane technology. The marine industry community still questions all these production methods linked to direct cost, practicalities, and development in a good performance, durability, and manufacturing method.
Classified Hydrogen is based on production methods, such as Grey Hydrogen, Blue Hydrogen, and Green Hydrogen. Grey Hydrogen is created from natural gas, or methane, using steam methane reformation but without capturing the greenhouse gases made in the process. Hydrogen production includes carbon capture and storage, called blue Hydrogen. Grey Hydrogen is essentially the same as blue Hydrogen but without carbon capture and storage. Another type of Hydrogen is Green Hydrogen, produced from a clean method such as water electrolysis cells.
Despite the growing number of renewable energy sources in the research area, hydrocarbon fuels are still the dominant source of energy usage. One of the Offshore Marine producers of hydrocarbon fuel is the LNG production platform of FLNG. The first step of the clean energy trial effort for FLNG is clean energy to use onboard power generation requirements. This clean energy mindset is vital to utilise hydrocarbon fuel most sustainably. This research paper aims to use the reforming method of Hydrogen production onboard FLNG from Natural Gas and BOG and clean hydrogen fuel for FLNG power generation.
Interestingly, methane can be obtained from natural gas and BOG onboard FLNG. Since BOG handling system onboard FLNG is crucial, most of the excess BOG is burned in the GCU (Gas Combustion Unit) without using it as an energy source. The reason for choosing Hydrogen is clean energy fuel, production from Natural Gas and BOG fuel, which consists of methane with four hydrogen atoms and one carbon atom as the higher H/C-ratio contains more energy per mass.
Hydrogen production methodology will be the methane reforming process which is most considerable for the high level of hydrogen production. The reforming method occurs when natural gas, together with either steam and/or oxygen, reacts by being transported over catalyst beds at high temperatures. What natural gas is mixed with either steam, oxygen, or both decide whether the process is a steam methane reforming (SMR) process, a partial oxidation (POX) process, or an autothermal reforming (ATR) process.
The difference between the SMR and ATR processes is how the heat is input to the system boundary. SMR reforming process is an exothermic reaction that requires external combustion heat to supply the system; on the other hand, the ART reforming process is an endothermic reaction that requires internal combustion heat within the system boundary. Research analysis will briefly explain the beneficial techniques for hydrogen production, as well as the complex reforming process analyses to produce Hydrogen from natural gas and BOG.
This study uses Aspen HYSYS software as a simulation tool to achieve a comparable process model. For fair analysis, the process must follow the same defined specification work within decided specifications, including the constraint and system boundaries for the model. All cases developed in this study must provide the methods for achieving the objectives.
2. Materials and Methods
The availability of Hydrogen on board FLNG is to be considered based on the hydrogen production methods and main source of gas supplied such as NG, LNG, BOG, etc. This paper proposes hydrogen production through a steam reforming plant, using the excess BOG as raw material, thus avoiding it being burned in the GCU. At present, LNG vessels and FLNG without reliquefaction plants consume the BOG (boil-off gas) in their engines and the excess is burned in the gas combustion unit without recovering any of its energy content. Excess BOG energy could be captured to produce Hydrogen, a fuel with high energy density and zero emissions, through the installation of a reforming plant.
Thus, to get the greater versatility the installation of a reforming plant will be energetically viable. To test the feasibility of the reforming plant, an actual study of the gas management process on the FLNG with power production unit, along with a thermodynamic simulation of the reforming plant. At present, LNG vessels without reliquefaction plants consume the BOG (boil-off gas) in their engines and the excess is burned in the gas combustion unit without recovering any of its energy content. Excess BOG energy could be captured to produce Hydrogen, a fuel with high energy density and zero emissions, through the installation of a reforming plant.
3. Overview of Hydrogen
Another marine fuel consideration is hydrogen for several maritime alternative fuels in the global marine market. Still, few hydrogen fuel usage vessels are in the marine industry due to two significant problems pending solutions: hydrogen storage and high production cost. Also, hydrogen-related ammonia corrosive action might significantly obstruct the complete application of hydrogen as a marine fuel in the future.
Hydrogen is not an energy source. It is an energy carrier. Hydrogen can be stored and delivered as usable energy. The usage of hydrogen as a marine fuel continues under intense research and development in many countries, particularly Japan and Korea. It is widely agreed that Hydrogen will be the future marine fuel if the researcher can resolve the problems related to the following factors,
- cost-effective hydrogen production,
- safe and compact storage on-board,
- reliability and operational safety for fuel,
3.1. Hydrogen Storage
The biggest obstacle facing the marine industry is onboard hydrogen storage technology since it takes up a lot of volume. Current hydrogen storage technologies including gaseous hydrogen storage, liquefied hydrogen storage, and metal hydride storage, among others.
The characteristics of gaseous hydrogen indicate that one gram occupies approximately 12 liters at atmospheric pressure. In its liquefied state, one gallon of gasoline weighs around 2.75 kg, while one gallon of hydrogen weighs approximately 0.00075 kg at 1 atm pressure and 0°C. Hydrogen can be stored using two methods: as a pressurized gas or in a liquefied state.
Furthermore, the criteria influencing the selection of the optimal storage method depend on the appropriate quantity for the necessary duration, energy density, and expense. The three primary systems can be examined as liquid storage techniques for substantial hydrogen quantities, long-term storage solutions, and compressed storage methods for limited hydrogen amounts over brief durations.
The cryogenic liquefaction technique, which cools the hydrogen to cryogenic temperatures of -253 °C, turning it into a liquid for storage, is currently the best method of storing hydrogen for marine usage due to the high amounts of fuel needed for extended hydrogen storage. Upon liquefaction, hydrogen’s volume diminishes to 1/800th of its gaseous state. Liquefied hydrogen possesses a density of 70.1 kg/m3, which is significantly lower than that of conventional liquid fuels, which have densities ranging from 840 to 1010 kg/m3.
The techniques for hydrogen gas storage include compressing the gas at pressures between 350 bar and 700 bar then transferring it into hydrogen tank systems, with storage capacity dependent on the density at the designated pressure. An increase in storage pressure will lead to higher operational costs. The concept of this paper using hydrogen fuel straight after reforming from BOG was developed in order to mitigate the financial impact on hydrogen storage.
3.2. Heat Value Analysis of Hydrogen
The heat value of hydrogen is the amount of heat released during hydrogen combustion and measured as a fuel’s energy density in energy (joules) per specified amount (e.g., kilograms). Compared to other fuels, hydrogen has the highest energy heat value content MJ/Kg than heat values of other fuels when combusted, as shown in Table 1, and it produces only water with no carbon. This is a high potential to become the classified marine fuel with zero-carbon emissions.
Hydrogen properties compared with other fuels as per Table 1. that liquid hydrogen heating value is about 3.3 times higher than that for diesel fuel. But hydrogen contains less energy per unit volume than all other fuels requiring hydrogen consumption rates to be proportional with others. Same as LNG, BOG, and vaporisation will be high if there is not enough consumption rate onboard. [1] [2]
3.3. Comparison of Hydrogen Properties with Other Fuel
Furthermore, Hydrogen contains less energy per unit volume than all other fuels that require the hydrogen consumption rates to be proportional with others. Also, hydrogen evaporated vapour is the same as LNG carrier BOG, and vaporisation will be high if there is not enough consumption rate onboard. Hydrogen properties compared with other fuels as per Table 2.
4. Hydrogen Production
Hydrogen does not typically exist in nature and must be produced from compounds that contain it such as Methane (Natural Gas) in a process that produces carbon dioxide and other greenhouse gases. Hydrogen Production is still carried more on the R&D stage to generate Methods and technologies of hydrogen economically compared with conventional marine fuels. According to the report of Future Hydrogen, Hydrogen demand is increasing, and it is expected to be five times more by the end of 2030.
Hydrogen production methods are still developing such as Steam reforming (SR), coal gasification, auto-thermal reforming (ATR), dry reforming (DR), and partial oxidation (POX), Hydrogen can also be made from water using electrical energy such as thermolysis and electrolysis are effective routes for producing hydrogen. Among these, steam reforming is the most studied since it produces the highest hydrogen yield compared to other methods, such as ATR, POX, and DR. [3] [4]
Steam reforming of methane to produce hydrogen requires the support of a metal catalyst such as Ni, Rh, Fe, Rh-Fe, CaO, Pt, Pd, and Pt [20-23] other catalysts which have shown that support such as γ-Al2O3, La2O3, ZrO2, MgO, and CeO2 also plays a critical role in the catalytic performance for hydrogen production from methane steam reforming [20, 23, 24]. Among the metals, Ni as an active metal has a considerably cheaper price compared with precious metals (for example, platinum, rhodium, or ruthenium) and high catalytic activity in terms of the cracking of C-C and C-H bonds.
However, this research paper will more focus on the process and the catalysts will be referenced to the catalyst research paper and assumption to make the process. Also, the membrane will assume from the reference.
Hydrogen has a very low energy density (per volume) because of its low density. When producing blue hydrogen (derived from fossil fuels and carbon capture and storage) and green hydrogen (derived from renewable energy sources) are referred to in the DNV-GL hydrogen Journal.
Conclusion: As per the list below, many Hydrogen production methods are underway. Still, the production cost cannot be more economical since hydrogen fuel is not mass production for marine vessels. [5] [6]
- Water Electrolysis Method
- Membrane System
- Reforming Method
- Adsorption Method
4.1. Hydrogen Production Method of Reforming from Hydrocarbon
Reforming the process of hydrogen production is the most interesting process in the marine industry in which high temperature steam (700 Deg C to 1000 Deg C) is used, refer to “endothermic” to produce hydrogen from methane, methanol, ethanol, propane, or gasoline. Also, under research activities of Autothermal Reforming (ATR) combined with Steam Reforming (SR) Partial Oxidation of Methane (POM), and Partial Oxidation (POX) processes. Oxygen from air or water is used to produce hydrogen, which releases heat as the process of “exothermic”. The total reaction to improving hydrogen yields adds to one more process: water gas separation (WGS). Subsequently, in the “water-gas shift reaction,” the carbon monoxide and steam are reacted using a catalyst to produce carbon dioxide and more hydrogen. The exclusive feature of the reforming processes is still considering the possible configuration for different applications.
4.1.1. Steam Reforming Method (SMR)
Steam methane reforming (SMR) method of hydrogen production from fossil fuel is one of the most exciting processes in the marine industry. Methane reaction is reacted with water vapour at temperatures (700-850°C) in the presence of a supported nickel catalyst. In steam-methane reforming, methane reacts with steam under 3–25 bar pressure (1 bar = 14.5 psi) in the presence of a catalyst to produce hydrogen, carbon monoxide, and a relatively small amount of carbon dioxide. Steam reforming is the endothermic reaction. Heat must be supplied to the process for the response to proceed. The primary process of steam reforming is shown in Figure 1.
The reaction product equation of Reform 1 and Reform 2 as per below is syngas (mixture of hydrogen and carbon monoxide by the Partial Oxidation of Methane (POM), which contains approximately 12% of carbon monoxide, which can be converted to more hydrogen by the Water-Gas Shift (WGS)as equation Shift 1. In this step, carbon monoxide reacts with water vapour over a shift catalyst to produce.
In Summary, the method is methane’s autothermal reforming, which combines the SMR process. In thermodynamic terms, endothermic is a process that requires or absorbs thermal energy from its surroundings and is usually in the form of heat with POM.
In thermodynamic terms, exothermic is a process or reaction that releases energy from the system to its surroundings, usually in the form of heat. The total reaction is exothermic; once more, WGS improves the hydrogen yields. [7]
Steam methane reforming reaction, the first step contains a reformer where methane and heavier hydrocarbons react with steam and create carbon monoxide and hydrogen as per Equation (4). This reaction is endothermic, meaning it requires heat to take place.
Reform 1 CH4 + H2O = CO + 3H2 (Equilibrium)
Water-gas shift reaction, the carbon monoxide reacts with steam to generate carbon dioxide and hydrogen in the water-gas shift (5). This reaction is exothermic, meaning it releases heat.
Reform 2 CO + H2O = CO2 + H2 (Equilibrium)
Shift 1 CO2 + H2 = CO + H2O (Equilibrium)
Meth 1 CO + 3H2 = H2O + CH4 (Conversion)
4.1.2. Partial Oxidation (POX)
Partial oxidation can carry out the conversion of fuels to hydrogen. The partial oxidation method relies on the reaction of the fuel, such as methane with air, to produce carbon oxides and hydrogen with other compounds. Partial oxidation is an exothermic process of heat transfer. Typically, the process is much faster than steam reforming and requires a smaller reactor vessel. Subsequently, in a water-gas shift reaction, the carbon monoxide reacts with water to form carbon dioxide and hydrogen.
This technique for producing hydrogen is very similar to the SMR process, except for the first step. The first step consists of the partial combustion of methane with pure oxygen. The products from this reaction are carbon monoxide and hydrogen. This reaction is exothermic and is as follows.
Partial oxidation of methane reaction
CH4 + ½O2 → CO + 2H2 (+ heat)
Water-gas shift reaction, after partial combustion of methane in above equation, the gas enters the water-gas shift step, where carbon monoxide reacts with steam and creates carbon dioxide and hydrogen as equation (9).
CO + H2O → CO2 + H2 (+ small amount of heat)
As seen in chemical reactions of partial oxidation, this process initially produces less hydrogen per unit of the input fuel than is obtained by steam reforming the same fuel.
4.1.3. Autothermal Reforming Process (ATR)
The autothermal reforming process is a combination of the Steam Methane Reforming process (SMR) and the Partial Oxidation Process (POX). The steps are equal to the SMR process after reforming unit. The ATR process is same reaction as the SMR process, hydrocarbon reacts with steam to provide the syngas composed of hydrogen, carbon monoxide and carbon dioxide, after that part of fuel reacts with oxygen as in equation (10). The fundamentals of ATR are summarized in the given reaction equations.
CH4 + ½O2 → CO + 2H2
CH4 + H2O = CO + 3H2
4.2. Comperison of the SMR and ATR
The main difference between the SMR process and an ATR process is how this heat is supplied to the system. The SMR process uses the external source of combustion which occurs outside the reforming unit where the reforming takes place. In an ATR process, heat supply occurs through internal combustion producing the required amount of heat for the steam methane reforming. The benefit of ATR which uses internal combustion is that no separate CO2 streams as shown in Figure 3.
According to the illustrated Figure, the SMR process has the reforming reaction of two discharge points of CO and CO2 which is a large considerable amount. The gas leaving the SMR reformer that carbon monoxide reacts further and additionally, the exhaust from the fuel combustion contains CO2. To get the green hydrogen which necessary to install two CO2 removal units in the SMR process.
In the ATR process, where the heat supply is from internal combustion, the generated CO2 and CO during the reforming follow through the rest of the gas from the process. Therefore, only one point of CO2 discharge through the CO2 removal unit. Even, with clean energy reform, there is an environmental concern about carbon emission which need to be implemented with a carbon capturing system CCS.
Compared to the process heat utilised for reforming, the SMR reformer unit is more compact and simpler in design which is more cost-effective than the ATR reformer process. In addition, the ATR reforming can take place at increased pressure levels compared to the SMR process. [8]
However, the ATR process is a very interesting process for hydrogen production, and it is not a focusing process on this paper. Future research papers will be more discuss more immature technologies available for Hydrogen through an ATR process.
4.3. Comparison of Hydrogen Production Cost
There will vary the cost of hydrogen production depending on the Blue Hydrogen or Green Hydrogen, also depending on the region. However, average costs derived from each hydrogen production method, whether based on renewable or fossil fuel, variables such as energy source, feedstock and capital investment cost, and hydrogen production cost (per kg of hydrogen) have been shown in Table 3.
5. Theory and Equations
5.1. Steam to Carbon (S/C) Ratio
Steam to carbon S/C ratio is usually used to analyse the steam reforming in both SMR and ATR processes to optimise the system. The S/C ratio is based on the ratio between the mole of steam and the carbon at the inlet of the system to evaluate the feeding amount of steam to the reformer. If the S/C ratio is lower, will produce the coke slug formation, the feeding of the steam is important to avoid the thermal cracking of hydrocarbon. If the S/C ratio increases, the temperature of the reform outlet will be lower, indirectly, reformer consumption energy will be lower. [1] [8]
The steam-to-carbon ratio is the ratio of moles of steam to moles of carbon in the reformer feed. It is obtained by dividing the molar flow rates of steam and feed. The reformer feed must contain sufficient steam to avoid the thermal cracking of the hydrocarbons and coke formation. An excess of steam (over the stoichiometric ratio) is usually used. The higher the steam-to-carbon ratio, the lower the residual methane will be for a given reformer outlet temperature. Hence, less fuel energy is required in the furnace. The design steam to carbon is typically 2.5 with a range between 1.0 and 5.0. To prevent the carbon deposit and coke deposit formation, the ratio is to be kept equal or above 2.5, or higher.
5.2. Thermodynamic Properties
Thermodynamic analysis of the hydrogen production process is based on energy and exergy analyses.
5.2.1. Energy Analysis
To assess the operation of the process, heat efficiency calculation is one of the concepts for thermodynamic analysis. Thermal efficiency is the output energy divided by input energy.
where mx is the mass flow and LHVx is the low heat value for a specified input, respectively.
5.2.2. Exergy Analysis
Exergy is a state function in which the maximum quantity is preserved as long as a reversible process is assumed. Exergy measures the maximum amount of available work or works potential that can be extracted from a process in terms of the stream enthalpy and entropy relative to the surroundings when it is at steady-state thermodynamic conditions and neglecting kinetic and potential energy.
The exergy of the process calculation can be done through the equation of state.
where T0 and P0 are in ambient conditions and e is exergy. Here h and s are the enthalpy and entropy of the stream at the actual temperature T and pressure p, while h0 and s0 are the same properties at the environmental conditions T0 and P0.
Total exergy is the sum of Physical exergy and Chemical exergy
Physical exergy =
Chemical Exergy
The total sum of the expression of exergy for the process calculation is the following equation,
where e represents the total molar exergy of a stream, is the molar physical exergy, which is thermomechanical properties, is the molar chemical exergy, and is the molar mixture exergy.
5.2.3. Exergy Destruction
The first and second laws of thermodynamics state that irreversibility in the process system that accompanies energy transfer is the cause of exergy destruction.
Exergy destruction is present in an irreversible process and is absent in a reversible process. The variation in the exergy of a system can either be positive, negative, or zero. When the temperature of the heat transfer process is lower than that of the environment, the transmission of heat and exergy occurs in opposite directions.
Furthermore, work and the associated exergy transfer may occur in the same direction or in opposing directions. The exergy of an isolated system diminishes continually during an irreversible process and remains constant solely during a reversible process.
In an isolated system, there is no exergy transfer between the system and its surroundings; hence, the changes in exergy are equivalent to the exergy destroyed.
The process is irreversible, and the actual work required exceeds that of an ideal scenario. The second law of thermodynamics defines actual work as the sum of work loss and change in exergy.
In thermodynamic terms, exothermic is a process or reaction that releases energy from the system to its surroundings, usually in the form of heat. The total reaction is exothermic; once more, WGS improves the hydrogen yields.
Exergy efficiency can be calculated as the relation between the exergy change of natural gas to be liquefied and the power consumption. [10] [11] [12]
5.2.4. Carbon Capture System (CCS)
To obtain the green blue hydrogen, the CO2 produced during the reforming process need to be captured by the amine medium, SMR process used the MEAmine and ATR process used the DEPG (Dimethyl Ethers of Polyethylene Glycol) to remove CO2 from product stream as shown in flow sheet. Hydrogen product enters the bottom of the absorber, contacts with lean amine solvent from the top counter current direction and rich amine flow out from bottom of the absorber. The technology is currently owned and licensed by Dow, with commercial packages available from a variety of companies, including UOP, Udhe, and Coastal. [13]
5.3. Other Variables
5.3.1. Product Yields
The chemical equilibrium analysis of the methane reforming reaction is analysed to predict the product yields during the reaction. The chemical equilibrium of reactions can be calculated by the CEA Program which calculates the product concentrations from any set of reactants based on the minimization of Gibbs free energy and the equation as below, [14]
where i is the product and j is the feed gas, n is the total moles of species
The product yields of carbon monoxide, carbon dioxide and hydrogen as per the equation
5.3.2. Sensitivity Analysis
Sensitivity analysis is a useful tool for optimizing reforming processes. Sensitivity analysis evaluates how various models respond to alterations in the initial conditions. It provides a thorough rundown on how to maximize hydrogen production while reducing carbon emissions. It is also challenging to estimate the accurate circumstances for every variable. One variable is evaluated whilst all other variables are held constant to facilitate fair testing.
The sensitivity analysis for the molar flow rate equation is,
where S is sensitivity analysis, i is product species, j will be CH, H2O, CO, CO2.O2.
Hydrogen Purity and Methane Conversion.
For the effect of the operating conditions can be analysed with the proportional examination of hydrogen purity and methane conversion efficiency in the steam reformer.
where n is the total moles of species,
6. Simulation Analysis of Hydrogen Production
6.1. Model and Simulation
The chemical process software Aspen HYSYS is used for hydrogen production systems. HYSYS software is specialized in hydrocarbon processing, and it is a comprehensive tool, enabling the design and optimization of steady-state processes. The fluid package Peng-Robinson (PR) is chosen as the equation of state.
The Boil-off Gas Reforming Systems Research Model will be based on similar chemical and mechanical processes of steam reforming methods. But the research consideration will be more from the thermodynamic point of view. However, from the economic point of view that steam reformation is still high cost due to removing carbon dioxide. To overcome this problem, one of the research options will be exergy analyses to get better results of thermodynamic efficiency within the steam methane reforming method. Exergy is measured for the environment to develop to improve the energy conversion system.
The key influencing factors in the reforming process are Steam to Carbon ratio (S/C ratio) and the Oxygen to Carbon ratio. Excessive oxygen intake in the SMR and ATR processes will result in decreased hydrogen generation and increased heating. The research model will focus on the two methods: ATR and SMR reforming process. This study uses control methodology to investigate two important processes and identify the best controllable variables for optimizing hydrogen generation while minimizing carbon emissions. The simulation includes multiple steps of heating and cooling to attain certain feed gas temperature ranges which can be managed by the reforming equipment such as pre-reformer, heater, absorber, stabiliser conjunction with MEAmine and DEPG.
6.2. SMR process integrated with Amine Carbon Capture System
The strategies under consideration involve the conversion of natural gas into hydrogen via the SMR process, followed by CO2 capture following treatment in both HT WGS (High-Temperature Water Gas Shift) and LT WGS (Low-Temperature Water Gas Shift) reactors. The capture of CO2 is an important step in the production of green hydrogen from hydrocarbons. Monoethanolamine (MEA) Amine absorption/stripping techniques have been utilized to remove CO2. Figure 3 shows a carbon dioxide (CO2) capture system located downstream of the conversion of fossil fuels to hydrogen.
MEA CCS techniques consist of two columns. Carbon dioxide (CO2) is absorbed in the first column, known as the absorber, by a solution of low-concentration amine solvent via fast chemical reactions. The end-product solution, known as rich amine, is then transferred to the second column, also known as the stripper, which removes the CO2 component. Stripping requires a significant amount of energy, which is supplied by transferring heat from a recuperative heat exchanger via the cross flow of rich and lean amines as shown in Figure 4. This energy conservation accounts for 15-30% of the total electricity produced by the facility. The power challenge is necessary for properly operating this operation on board the FLNG and maximising energy savings.
The power issue is critical for properly running this process on board the FLNG and maximizing energy savings in a cost-effective manner. As a result, the primary purpose of this thesis is to develop a basic control system capable of efficiently handling on-board operations and running the process as close to optimal as possible. The study focused on the dynamic modeling of the stripper and tested two different configurations to improve energy efficiency on board FLNG with a high electrical requirement.
The authors created a dynamic model particularly for the absorber and investigated the effects of a load change in power generation from 100% to 50%. An integrated system for hydrogen production with carbon capture and storage (CCS) that includes a stripper and recycling process. The paper investigated how adjusting the proportion of CO2 removal and amine concentration (MEA) affects process efficiency and CO2 capture efficiency. Furthermore, the repercussions of lowering the capacity for hydrogen production have been explored.
6.3. ATR process with Carbon Capture System
Compared to SMR, the ATR is a system that diminishes size and complexity. The absence of external heat source will lower fuel costs for the reformer and lead to a reduction in CO2 emissions. Another advantage is that the ATR necessitates less water than an SMR, resulting in enhanced methane conversion.
Oxygen aids in diminishing soot production. Nevertheless, the temperature is limited by material and construction costs. It is also assumed that there is no heat loss in the system, and the compressor’s adiabatic efficiency is 75%. ATR reactors are represented as Gibbs reactors that minimize Gibbs free energy in order to predict reaction feasibility and design chemical process in evaluating energy efficiency and irreversibility refer to appendix A. This model, constructed as a component splitter, is additionally employed for modeling water separation and hydrogen generation refinement to illustrate the possibility for diverse separation processes. The CCS method employed DEPG and utilized separators to facilitate the straightforward extraction of CO2 refer to Figure 5.
6.4. Simulation Result Analysis
6.4.1. Molar Change of Components vs Temperature
The results rely on the thermodynamic analysis to compare the SMR and ATR Amine processes, the molar composition change for hydrogen across the outflow stream points are monitored with graph. Both systems exhibit strong performance; nevertheless, it is important to note that the space limitations for floating FPSOs make ATR more significant than SMR. Additionally, the simplifications and assumptions utilised throughout the simulation will be evaluated across four reforming processes under the optimum circumstances for each process. The influence of temperature on reforming results in process improvements attributable to variations in the mole fraction of the components. Consequently, with the S/C ratio of 2.5, temperature variation at the process stream point and the mole variation of the mixing components are illustrated in the graph shown in Figure 6.
6.4.2. Exergy Analysis
Exergy analysis is an advanced approach to thermodynamic evaluation. The first and second laws of thermodynamics indicate that exergy destruction results from irreversibility in the exergy transfer process. Kotas (1985). Exergy destruction is present in irreversible processes and absent in reversible processes. The variation in the exergy of a system may be positive, negative, or neutral. When the process temperature is inferior to that of the environment, heat and exergy transfer occur in reverse. [15] [16]
Furthermore, work and the associated exergy transfer may occur in the same direction or in opposing directions. The exergy of an isolated system diminishes throughout an irreversible process. It remains constant just for a reversible procedure. In an isolated system, there is no exergy exchange between the system and its environment. Consequently, the alterations in exergy are equivalent to the exergy that has been destroyed. [10]
Exergy analysis is the most effective criterion for system optimization. Determining the exergy balance of the process within system boundaries is challenging. The loss of exergy is primarily associated with the reformer unit. The simulation reveals several vulnerability factors regarding the steam reformer. These elements lead to the dissipation of exergy. Evaluate the exergy efficiency of each reformer to determine the performance of the process. The tables above display the findings.

Table 1.
Simulated Exergy efficiency and exergy destruction for ATR Process.
| Equipment Name | Unit Type | ex-in (kW) | ex-out (kW) | ∆e (kW) | Energy Consumption (kW) | ηexergy | Exergy Destruction (kW) |
|---|---|---|---|---|---|---|---|
| ATR Reformer | Gibbs Reactor | 4855.12 | 13943.01 | 9087.89 | 25910.30 | 187.18% | 16822.40 |
| HT WGS Reactor | Equilibrium Reactor | 6816.54 | 11963.63 | 5147.09 | 7294.00 | 75.51% | 2146.91 |
| LT WGS Reactor | Equilibrium Reactor | 5467.32 | 4811.86 | -655.46 | -2664.00 | -11.99% | -2008.54 |
| Overall | 17138.98 | 30718.50 | 13579.52 | 30540.30 | 79.23% | 16960.78 |
Table 2.
Simulated Exergy efficiency and exergy destruction for SMR Process.
| Equipment Name | Unit Type | ex-in (kW) | ex-out (kW) | ∆e (kW) | Energy Consumption (kW) | ηexergy | Exergy Destruction (kW) |
|---|---|---|---|---|---|---|---|
| Reformer | Equilibrium Reactor | 4399.58 | 8255.53 | 3855.95 | 59862381.57 | 87.64% | 59858525.62 |
| HT WGS Reactor | Equilibrium Reactor | 5801.17 | 6544.43 | 743.25 | 3059681.95 | 12.81% | 3058938.70 |
| LT WGS Reactor | Equilibrium Reactor | 3786.11 | 3286.44 | -499.67 | -7129567.61 | -13.20% | -7129067.93 |
| Overall | 13986.87 | 18086.40 | 4099.53 | 55792495.91 | 29.31% | 55788396.38 |
To evaluate the exergy destruction in the process, consider the specific S/C ratio relative to exergy. The S/C ratio is 2.5, as the variation in the S/C ratio influences the process’s overall efficiency. Furthermore, the determination of exergy efficiency is primarily contingent upon the reformer temperature. ATR is an endothermic reaction that requires external heat input. Conversely, SMR is exothermic, with heat generated within the system boundaries.
The negative exergy in the LT WGS reactor results from the combination of high entropy generation due to heat transfer at low temperatures, irreversibilities associated with the exothermic reaction, energy dissipation close to ambient temperature, reducing the quality of energy. This doesn’t imply the reactor is inefficient in producing hydrogen but highlights losses in the quality of energy during the process. To reduce this issue, systems can recover heat efficiently or optimize operating conditions to minimize entropy generation.
6.4.3. Carbon Capture Analysis
This should be integrated into the comprehensive assessment of the carbon capture system analysis. The primary process design displays the H2 and CO2 molar flow rate variables directly on a carbon capture dashboard, which illustrates the mole percentages composition of sour gas and fuel gas, lean and rich amine loading, inlet and outlet CO2 loading, CO2 capture percentage, net GHG emissions, and carbon fees, as presented in Table 1 below. The primary outcome of both simulations is the CO2 collection and carbon tax, which influence the overall system performance across all operations. To achieve an effective design, it is necessary to assess the temperature that affects the mole fraction and exergy of the reformer, as well as the separation processes in the absorber and stripper. The flow is minimized to satisfy the hydrogen fuel requirements solely for the power generation turbine. This methodology will provide a more compact and efficient design for FLNG, addressing economic concerns and unit sizing to accommodate the spatial limitations of FLNG. The assessment of the numerous evaluations of hydrogen generation from all simulation models is necessary to ascertain the performance attributes of FLNG applications, including energy and exergy efficiency, spatial limitations, and carbon emissions. The conclusion is derived from the model of the process inside the same context, encompassing all conditions and assumptions. Finding an optimization might become more feasible if the inquiry is expanded to include additional factors.
Table 3.
Simulated carbon capture comparison dashboard for SMR and ATR Process.
| Sr | Description | CCS_SMR(MEA) | CCS_ATR (DEPG) |
|---|---|---|---|
| 1 | Sour Gas CO2 composition (mole %) | 15.83 | 11.21 |
| 2 | Fuel Gas CO2 composition (mole%) | 1.270e-003 | 3.161 |
| 3 | Lean CO2 Loading | 2.722e-002 | 3.234e-002 |
| 4 | Rich CO2 Loading | 0.2573 | 5.479e-002 |
| 5 | Inlet CO2 (Kg/hr) | 7997.1472 | 8441.4143 |
| 6 | Outlet CO2 (Kg/hr) | 7996.7551 | 7216.6676 |
| 7 | CO2 Capture (%) | 100 | 85.49 |
| 8 | Heat Utility Emissions (Kg/hr) | 1208 | |
| 9 | Power Utility Emissions (Kg/hr) | 2.934e+004 | 424.5 |
| 10 | Inlet Emissions (Kg/hr) | 7.216e+004 | 7.216e+004 |
| 11 | Outlet Emissions (Kg/hr) | 1.308e+004 | 8777 |
| 12 | Net GHG Emission (Kg/hr) | 1.004e+006 | 7.233e+005 |
| 13 | Carbon Fee ($) | 5.119e+007 | 8.680e+008 |
*According to US SCC regulatory uses an SCC of around $51 per ton.
Regarding CO2 capture, SMR with MEA Amine are the best alternatives. SMR Amine is the most efficient process for producing hydrogen based on hydrogen yields, followed by ATR with DEPG amine. As per the simulation result, and the comparison graph Figure 6, SMR is slightly efficient, however ATR is one feasible solution for FLNG applications in terms of further research to reduce the equipment. The ATR process is the combination of SMR, which requires to control of both oxygen and steam. The oxygen-to-fuel ratio drives carbon emission, hence, oxygen to fuel ratio used in the simulation will affect to reduce the carbon emission. The reformer temperature is substantially greater in the ATR reactor than in the SMR reformer because of the absence of steam and soot or coke formation which can be controlled by the scrubber after the reformer outlet.
6.4.4. Analysis of Product Yields, Sensitivity, Methane Conversion, Hydrogen Purity
The calculated product yields of the reforming processes are principally indicated by the S/C ratio and Molar Change analysis, which may be graphically represented to explain the optimization of the reforming process, as shown in Figure 6. Formulas 11 to 15 can be used to determine the reaction’s product yields, sensitivity, methane conversion, and hydrogen purity, as indicated in Table 4.
Table 4.
Sensitivity Analysis and Other Variable Analysis for Process Model.
| Process Model | Methane Conversion | Hydrogen Purity | Hydrogen yield | CO2 Yield | CO Yield |
|---|---|---|---|---|---|
| ATR | 32.13% | 70.68% | 48.56% | 1.25% | 11.21% |
| SMR Amine | 51.43% | 67.87% | 67.87% | 15.83% | 1.25% |
7. Discussion
This study’s main goal is to examine the green energy potential of hydrogen fuel as a reforming process substitute for traditional fuels, with an emphasis on the energy requirements of floating platforms. A comprehensive investigation of the variations in molar change, efficiency, and carbon capture ratio will determine the superior system. The ATR system provides more carbon fee savings and a reduction in equipment size; however, the most beneficial alternative remains SMR MEA Amine, as determined by the molar change analysis conducted for hydrogen production at each phase. It is recommended to broaden the system boundaries to enable a more thorough assessment. This article evaluates applications and analysis of energy and exergy in the SMR and the ATR process.
The results obtained suggest the potential for enhancing exergy characteristics in SMR and ATR reactors; thus, it is extremely important to include exergy efficiency in the alterations of the system’s thermodynamic parameters. The overall exergy efficiency of ATR process is better than SMR which means The ATR process benefits from the autothermal balance of exothermic and endothermic reactions, leading to efficient hydrogen production. Also, understanding exergy destruction aids in comparing different process designs of ATR and SMR, and based on exergy for selecting with the least irreversibility, ensuring high performance and sustainability.
8. Conclusions
In order to increase the volumetric flow rate within the reforming reactor, future system optimization studies may reconfigure the reformer with an enhanced stream subsequent to the reactor. However, the reformer’s dimensions must be assessed in light of the FLNG’s financial and spatial limitations. The cost of hydrogen production will be influenced by many energy-related factors. This suggests that, upon evaluation, the SMR and ATR techniques for hydrogen production are more efficient for FLNG.
Funding
This research received no external funding.
Acknowledgments
The authors would like to thank the guidance of Supervisor Dr Arun Dev, Dr Ivan CK Tam and Dr Pavan Kumar Naraharisetti (Assistance Professor) from Newcastle Research and Innovation Institute, NewRIIS, Singapore.
Conflicts of Interest
Declare that no conflict of interest.
Appendix A
Gibbs Free Energy (G)
The Gibbs free energy is a thermodynamic potential that measures the maximum amount of useful work obtainable from a system at constant temperature (T) and pressure (P). Gibbs free energy combines enthalpy (energy content) and entropy (disorder) to give a single value that shows whether a process can occur naturally under constant T and P.
It’s a central concept in thermodynamics and chemistry for understanding and controlling reactions and processes. It determines whether a chemical or physical process is spontaneous under these conditions.
In chemical reactions, as work potential, G indicates the maximum reversible work (excluding work done by pressure-volume changes) a system can perform. As coupled reactions: Processes with positive ΔG can be driven by coupling them with reactions that have a larger negative ΔG,
The change in Gibbs free energy (ΔG) predicts whether a process will occur spontaneously:
ΔG<0: The process is spontaneous.
ΔG>0: The process is non-spontaneous.
ΔG=0: The system is at equilibrium.
ΔG represents the driving force. Reactions with ΔG<0 release free energy and are energetically favorable.
The Gibbs free energy is defined as:
where:
G: Gibbs free energy (Joules, J)
H: Enthalpy (total heat content of the system, J)
T: Absolute temperature (Kelvin, K)
S: Entropy (a measure of system disorder, J/K)
References
- M. Gillespie, "Hyper for hydrogen: our world first for carbon-free fuel. Retrieved from CSIROscope:," Nov 2018. [Online]. Available: https://blog.csiro.au/hyper-for-hydrogen-our-world-first-carbon-free-fuel/.
- W. N. Association, "Heat Values of Various Fuels," Aug 2018. [Online]. Available: https://www.world-nuclear.org/information-library/facts-and-figures/heat-values-of-various-fuels.aspx.
- L. P. Antonio Vita, "Steam Reforming, Partial Oxidation, and Autothermal Reforming of Ethanol for Hydrogen Production in Conventional Reactors.," Science Direct, Hydrogen Production:, Aug 31 2018. [Online]. Available: https://www.sciencedirect.com/topics/chem.
- M. D. T. K. Eyalarasan, "Design of Process Plant for Producing Hydrogen from Steam Reforming of Natural Gas," International Journal of Engineering Research & Technology (IJERT),, vol. 2, no. 12, pp. 2278-0181, 2013.
- DNV-GL., "Hydrogen as an energy carrier. Retrieved from Oil and Gas:," [Online]. Available: https://www.dnvgl.com/oilgas/download/hydrogen-as-an-energy-carrier.html.
- V. H. H. A. Silberova B, "Production of hydrogen by short contact time partial oxidation and oxidative steam reforming of propane.," Journal of Catalysis, pp. 99(1-2): 69-76., 2005.
- A.-M. B.-M. T. M. G. T. Alicia Boyano, "Steam Methane Reforming System for Hydrogen Production," 10 Feb 2012. [Online]. Available: https://dergipark.org.tr/en/download/article-file/65813.
- R. Gupta, Hydrogen Fuel: Production, Transport, and Storage, Boca Raton: CRC Press, 2008.
- R. S. C. B. A. O. Hanane Dagdougui, "Hydrogen Production Cost," 2018. [Online]. Available: https://www.sciencedirect.com/topics/engineering/hydrogen-production-cost.
- T. J. Kotas, The Exergy Method of Thermal Plant Analysis pg.7-19, Department of Mechanical Engineering,Queen Mary College, University of London: (E-Book),, 1985.
- T. I. S. X. Agnew B, "Optimization of heat and mass exchange. Processes," p. 314., 2020, 8(3),.
- Y. Demirel, "Exergy USING THE SECOND LAW: THERMODYNAMIC ANALYSIS," 2007. [Online]. Available: https://www.sciencedirect.com/topics/chemical-engineering/exergy.
- S. P. W. M. J. Mokhatab, Handbook of Natural Gas Transmission and, Elsevier Inc, 2006.
- N. Glenn Research Center, "Chemical Equalibrium with Applications," [Online]. Available: https://www1.grc.nasa.gov/research-and-engineering/ceaweb/.
- Rogers, Engineering Thermodynamics: Work and Heat Transfer, India: Pearson Education, 1967.
- Joel, Basic Engineering Thermodynamics., India: : Pearson Education., (1996).
Figure 1.
Hydrogen Production by Steam Reforming.
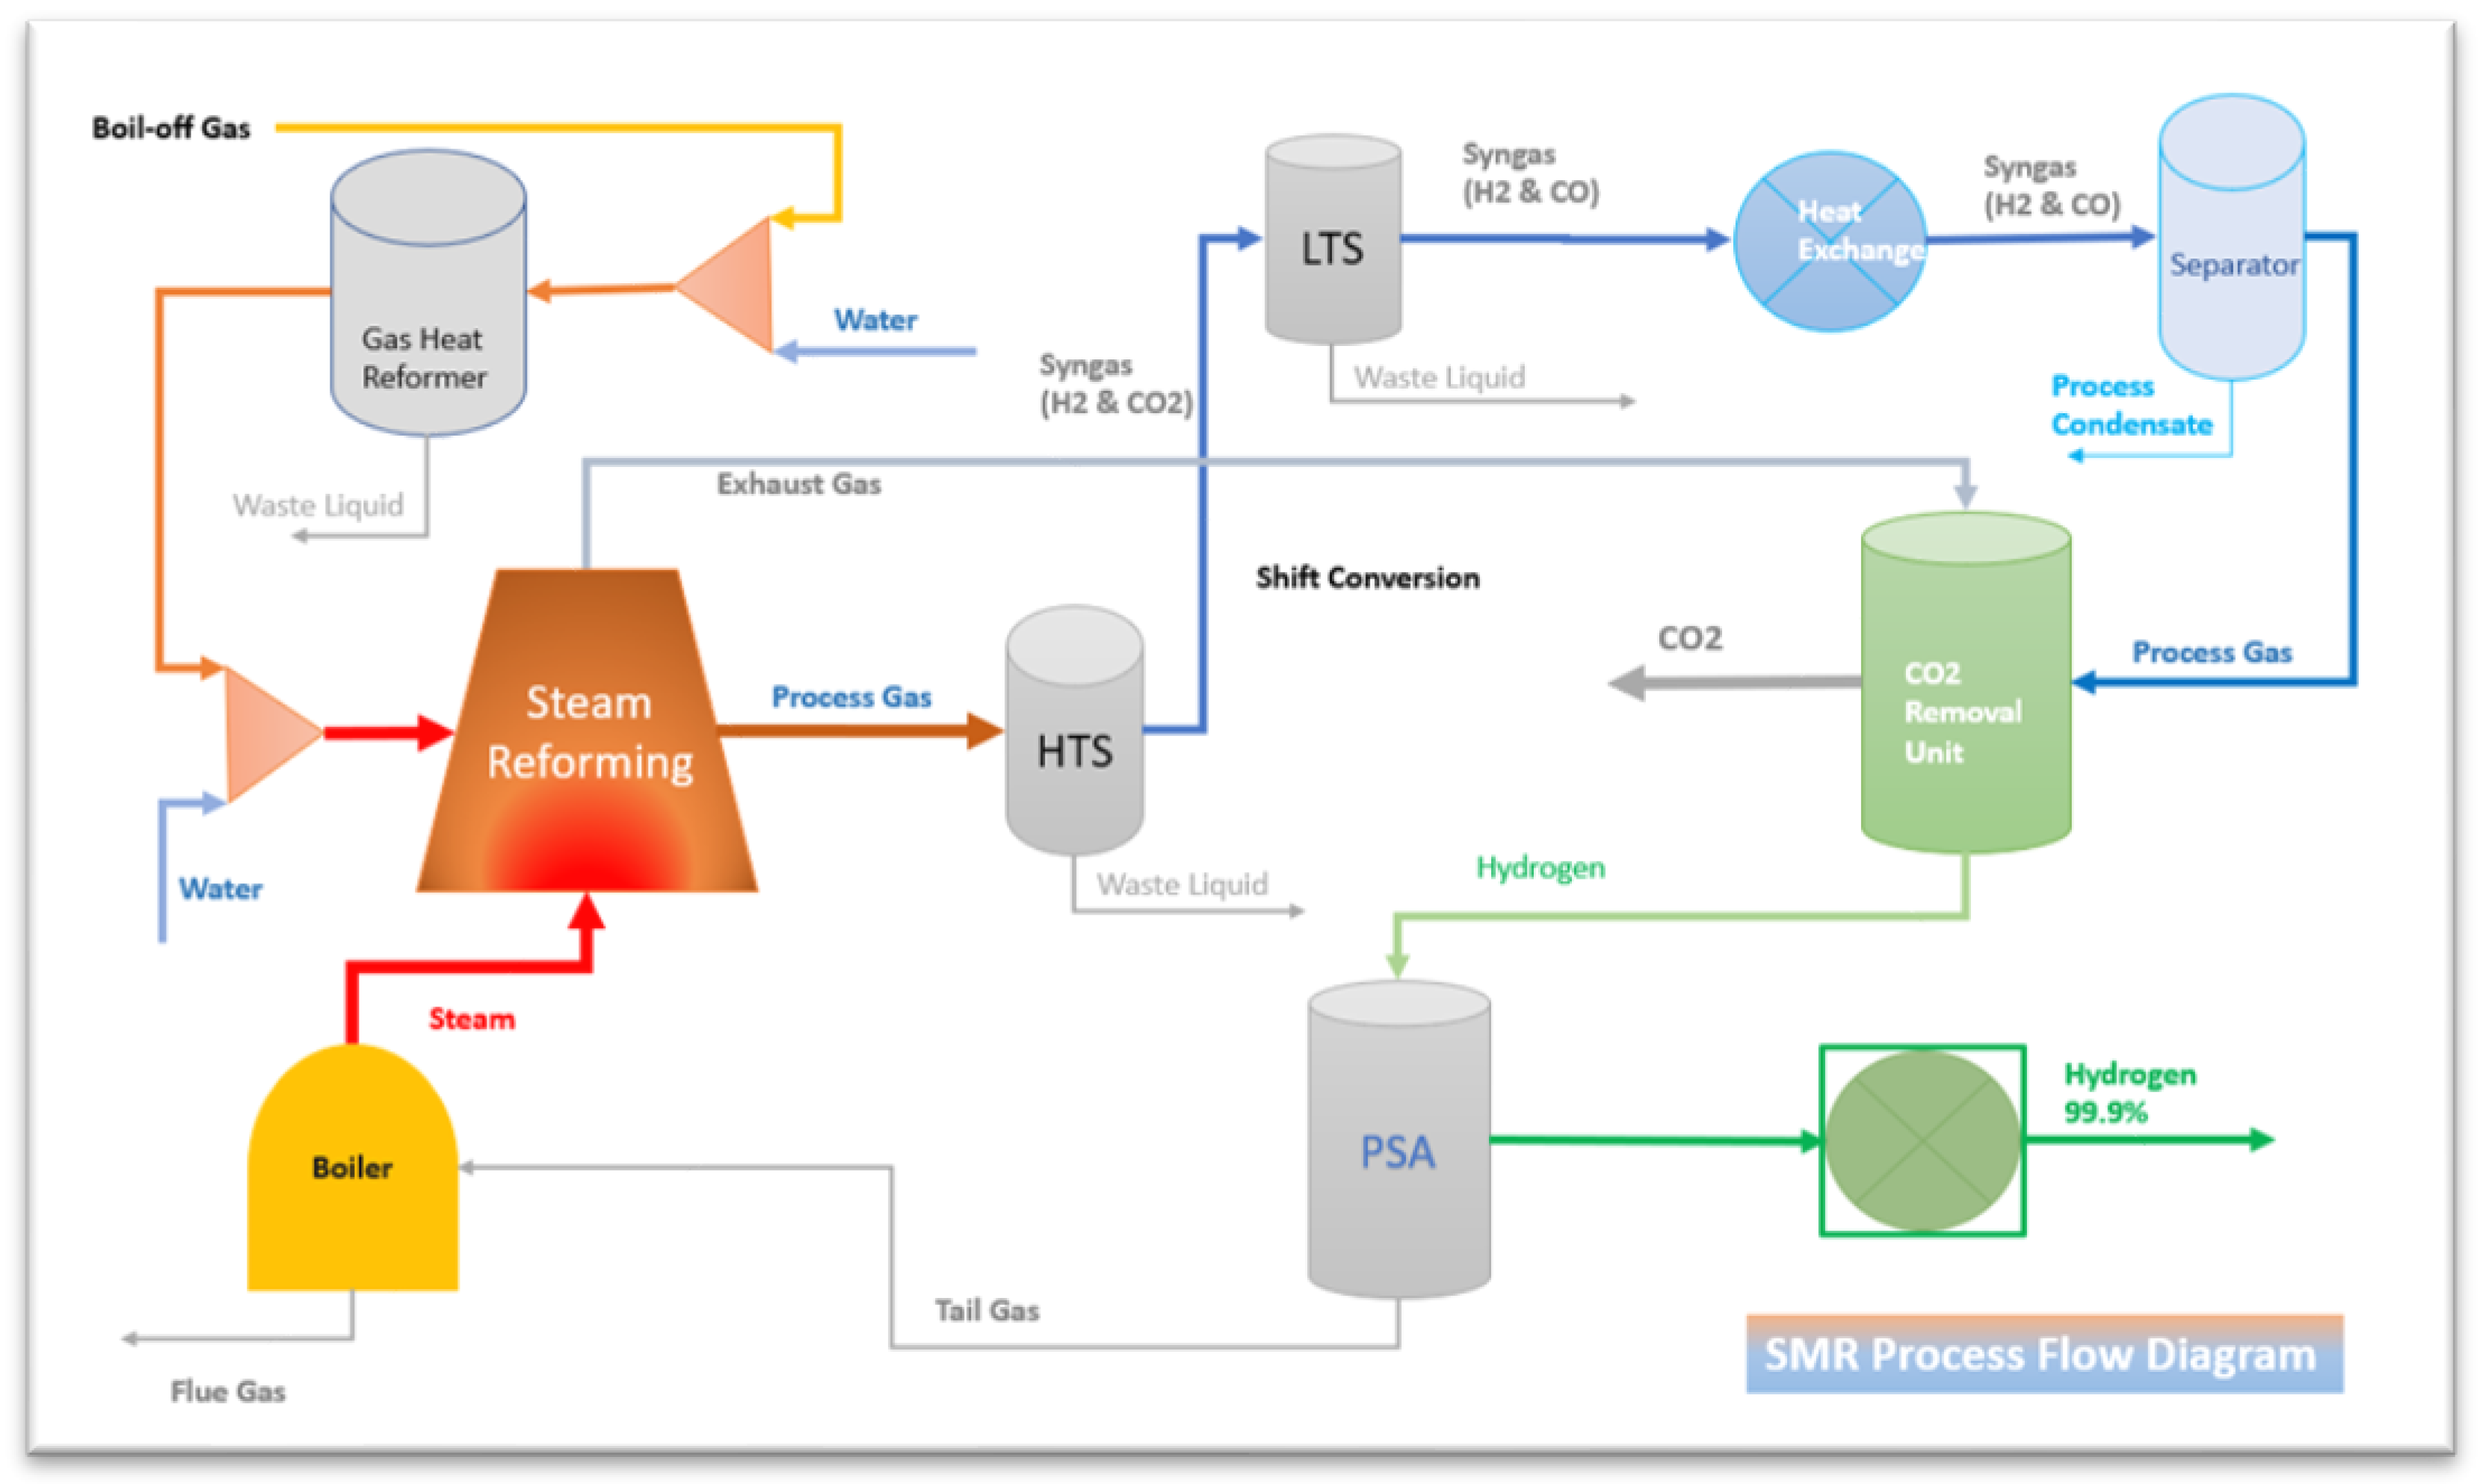
Figure 2.
Hydrogen Production by Autothermal Reforming.
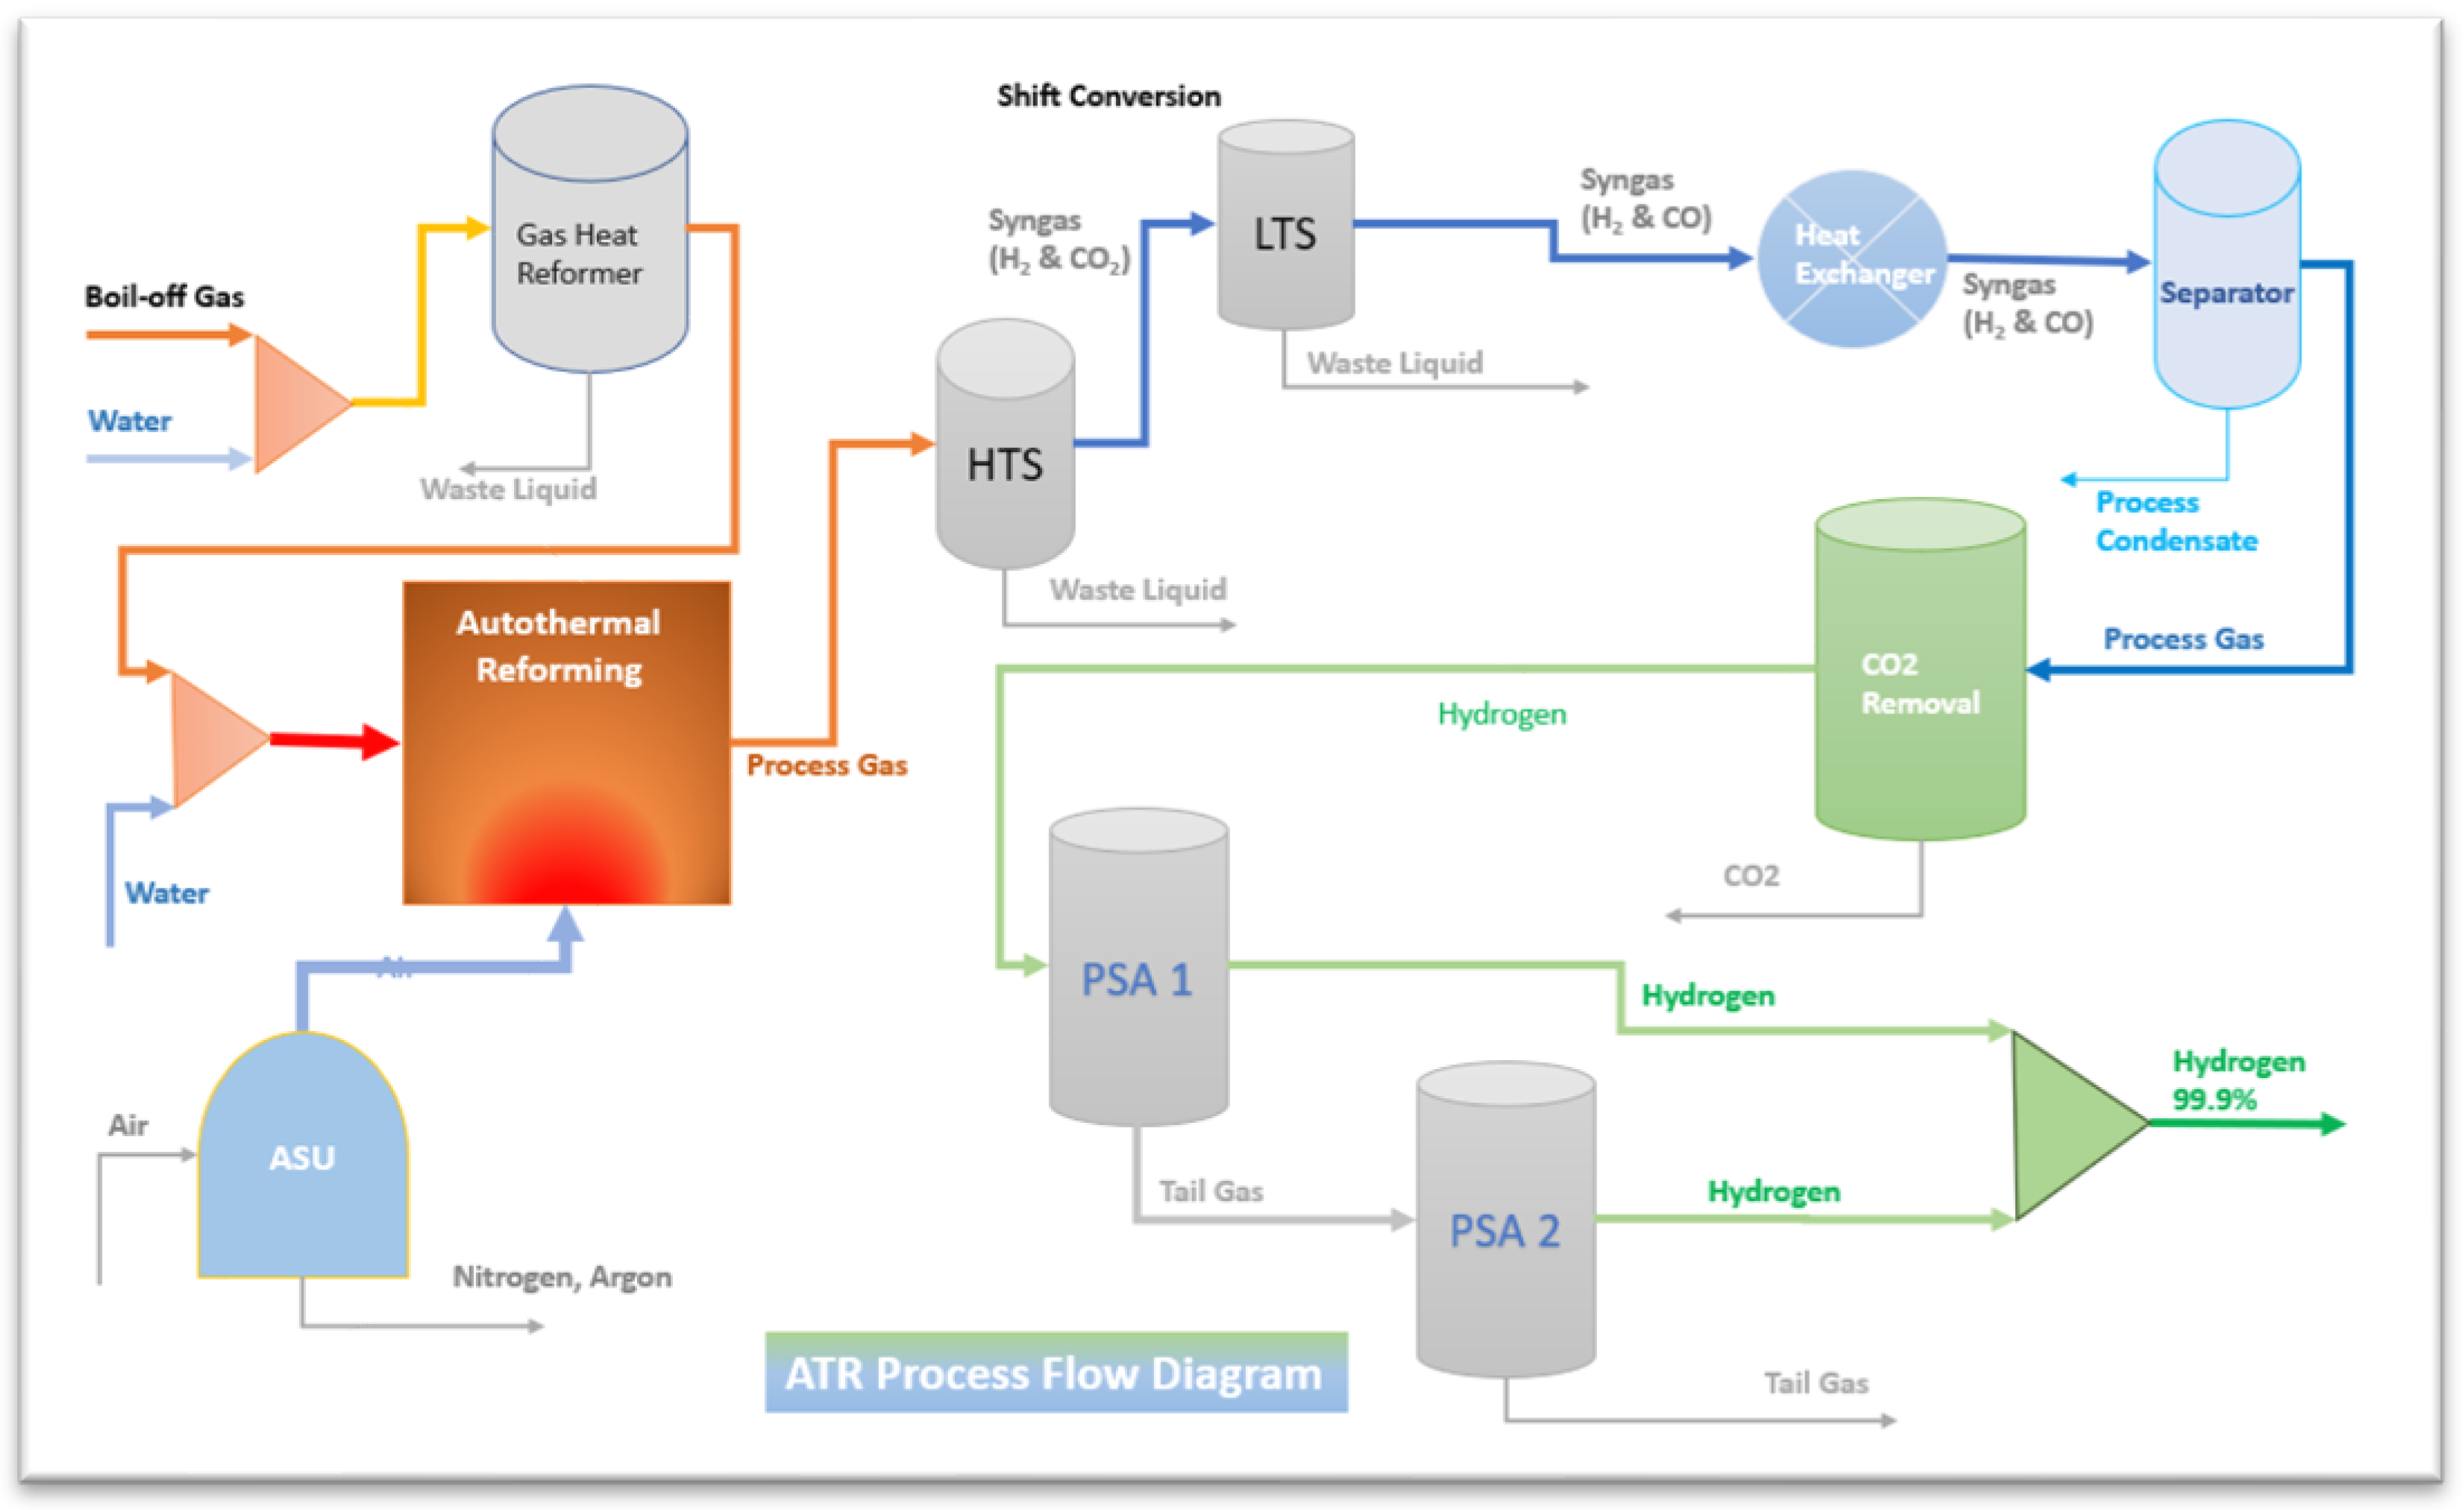
Figure 3.
Comparison of Heat Supply System in SMR and ART process.
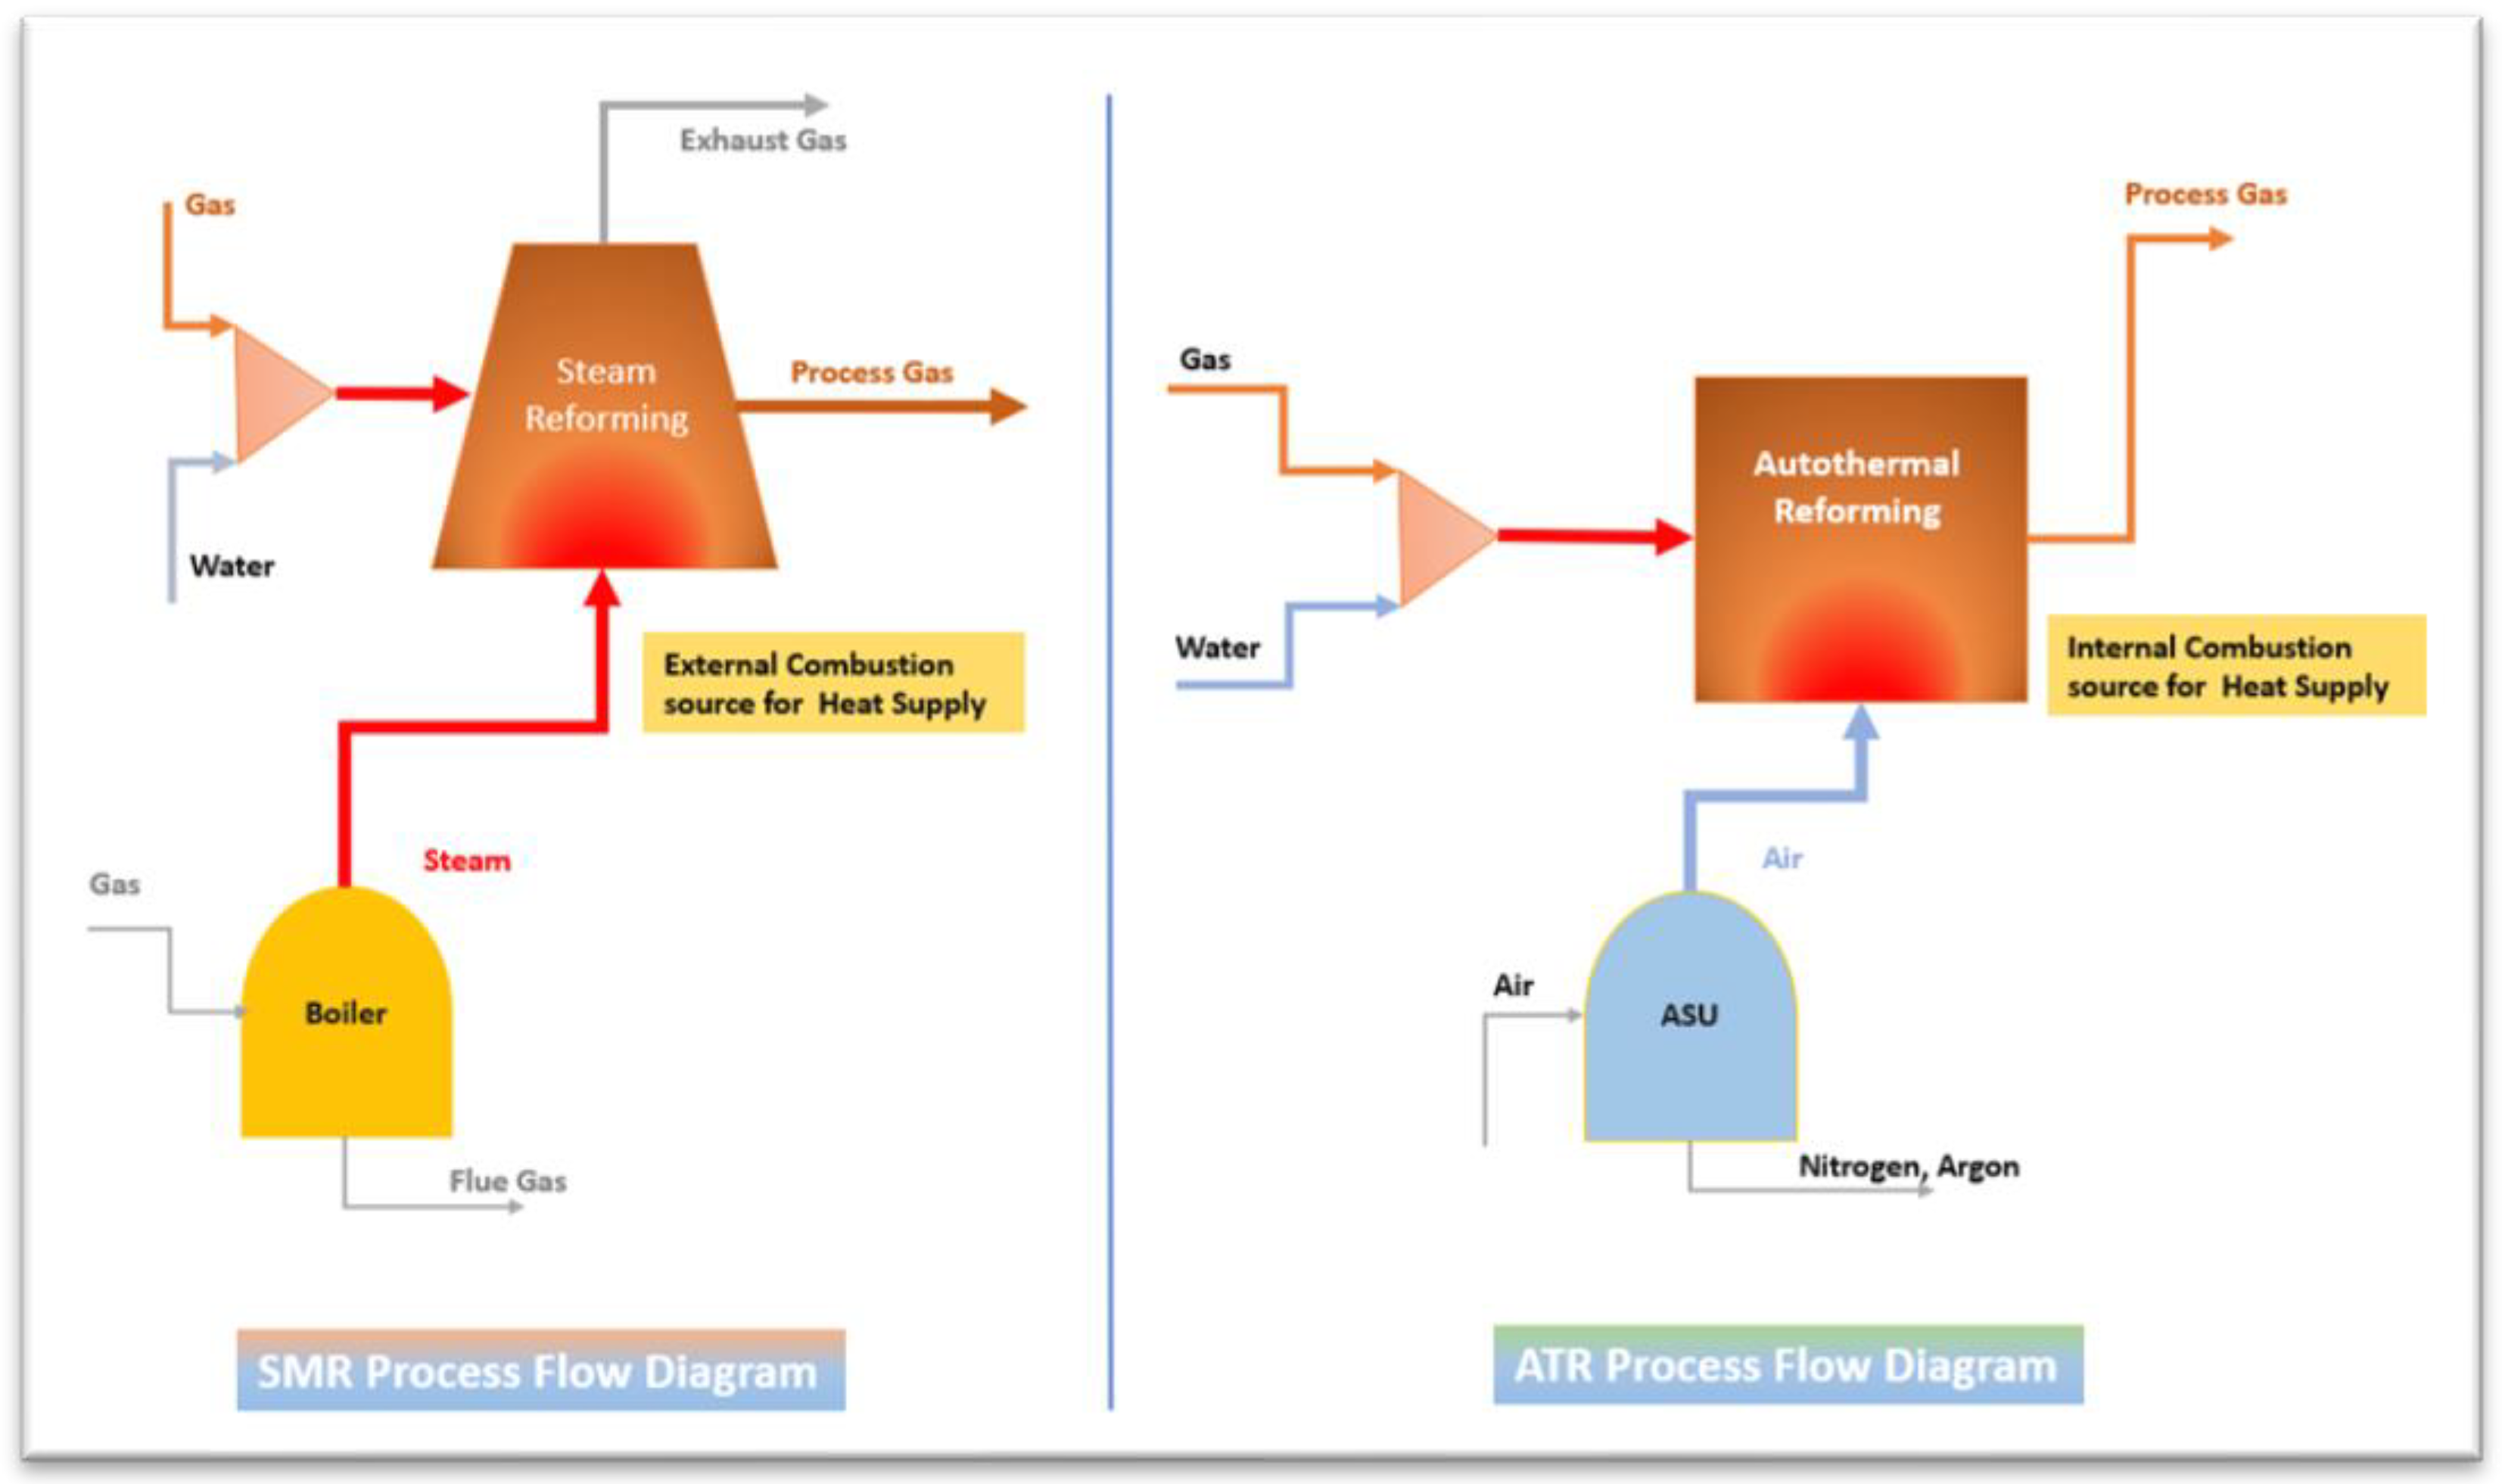
Figure 4.
SMR process with Carbon Capture System.
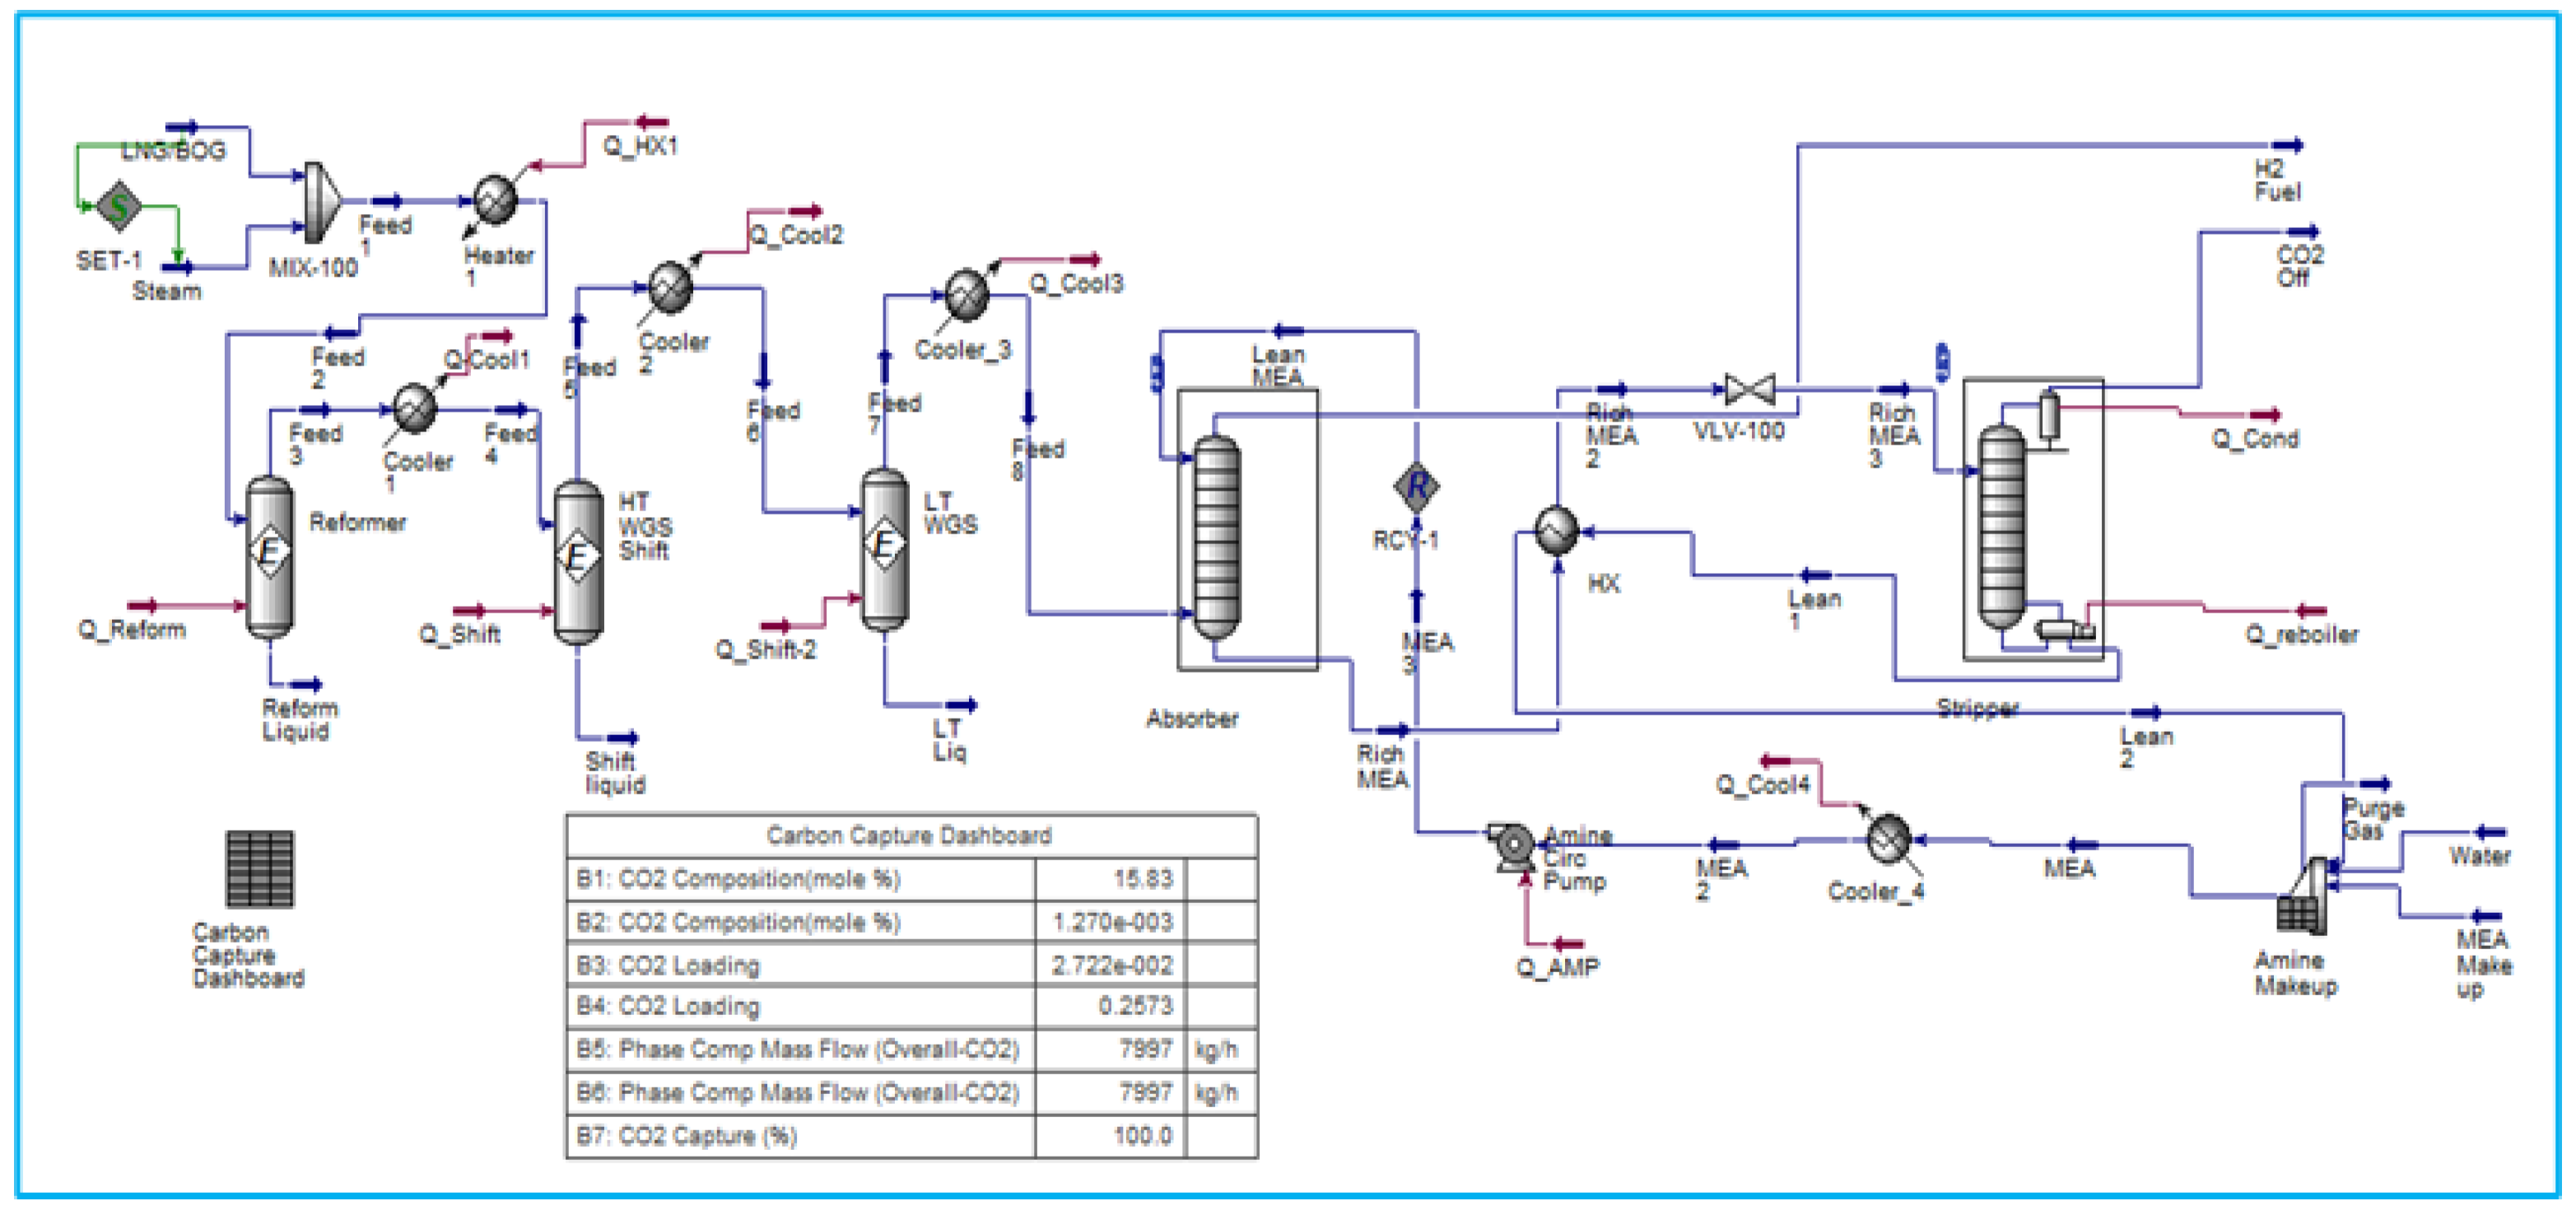
Figure 5.
ATR process with Carbon Capture System.
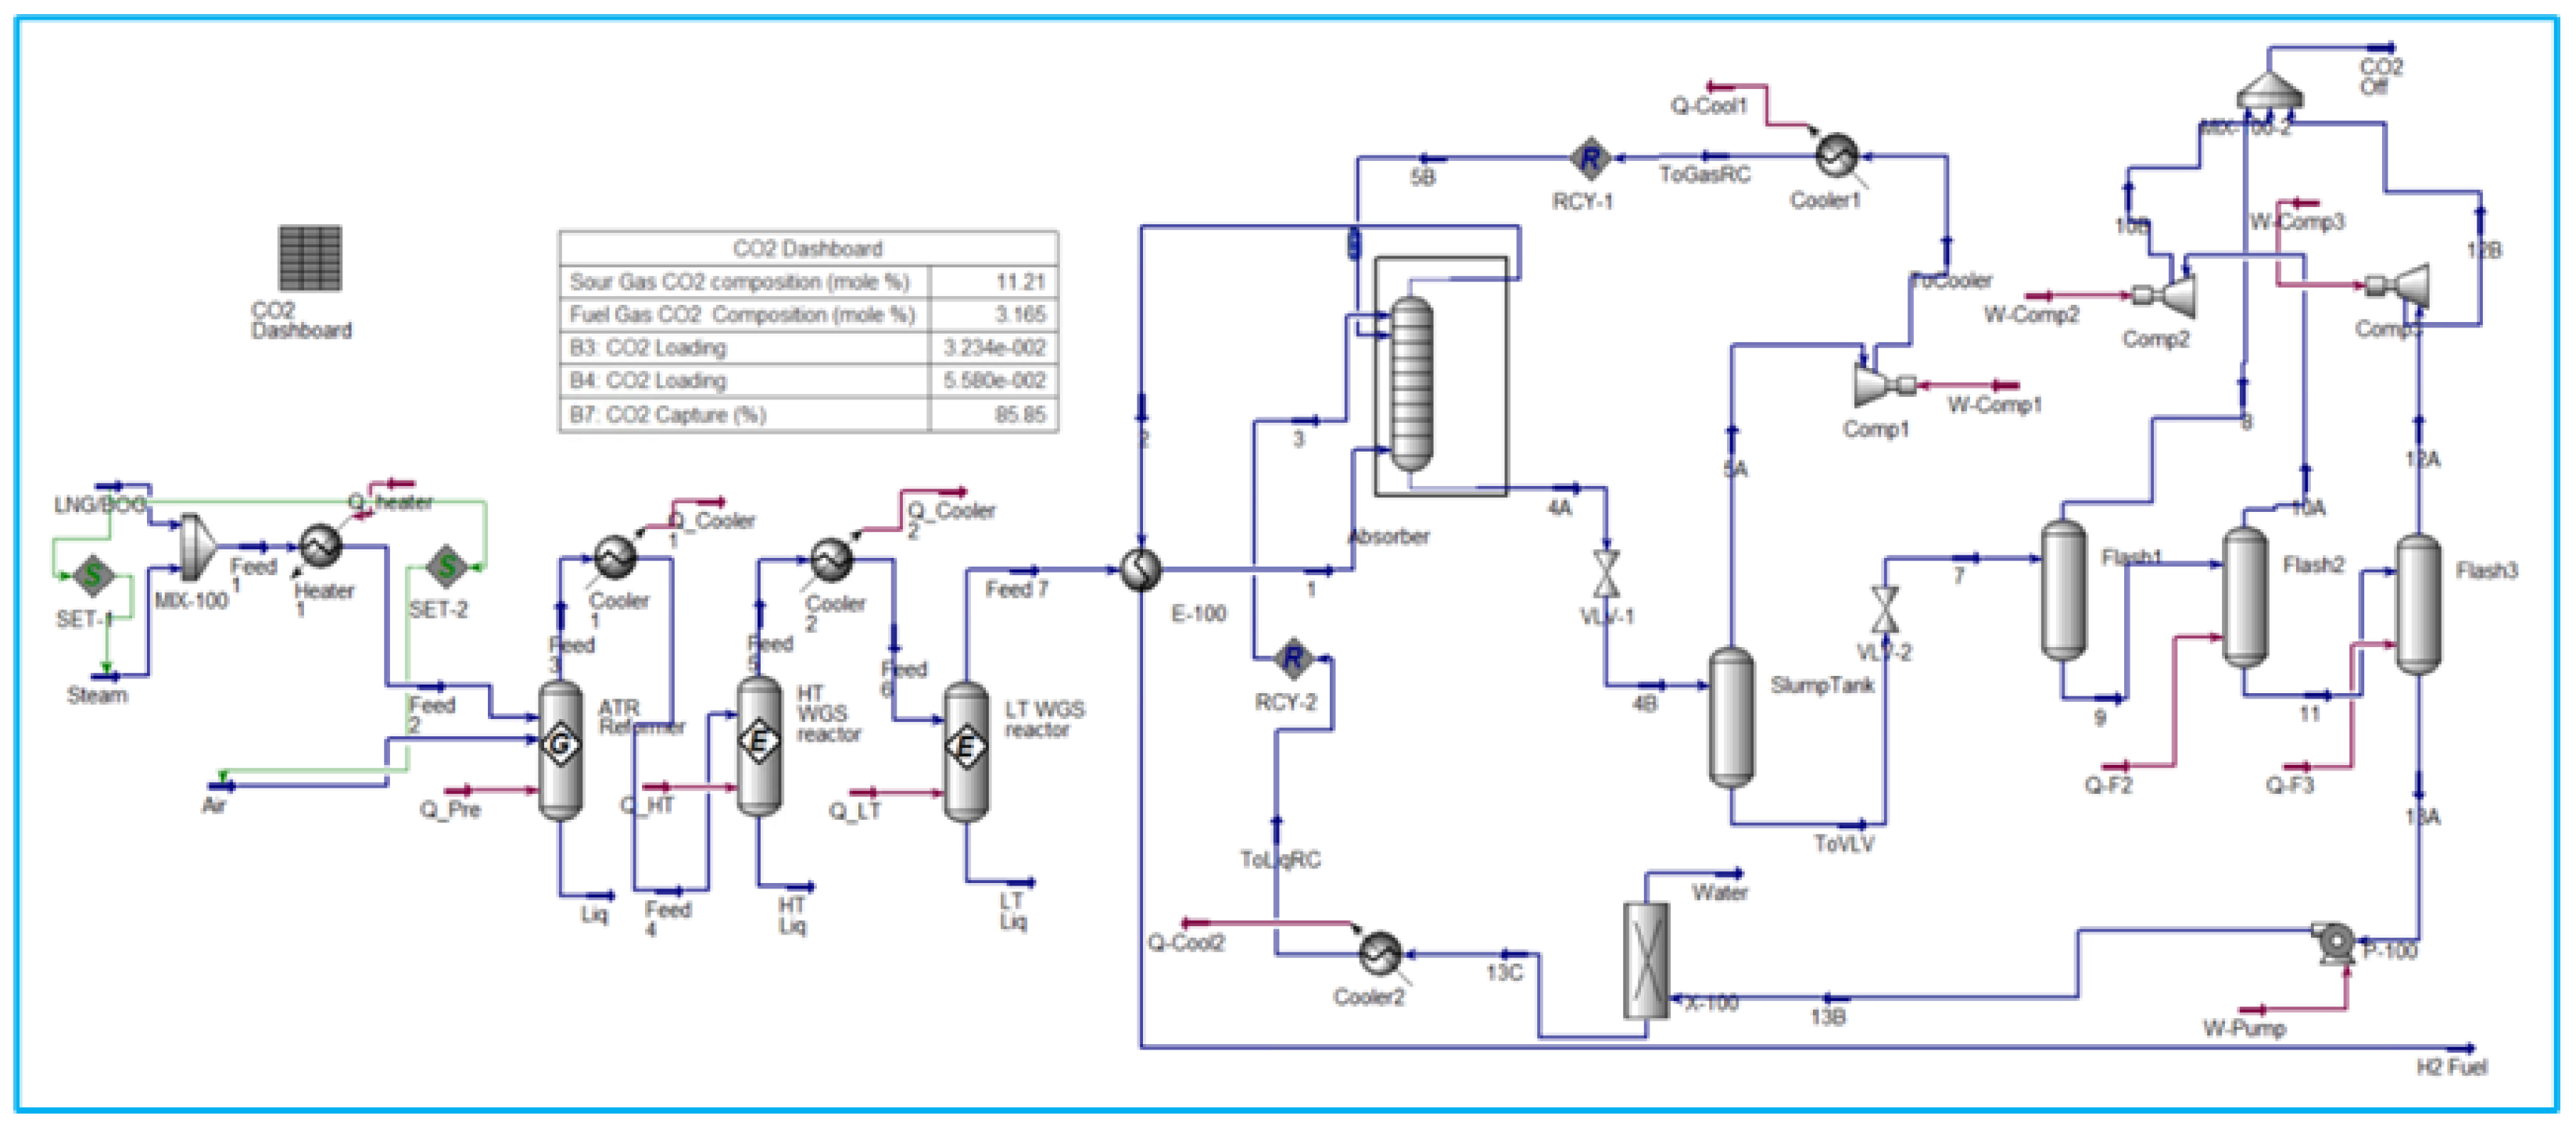
Figure 6.
Molar change of S/C=2.5 vs temperature for SMR_CCS and ATR_CCS process.
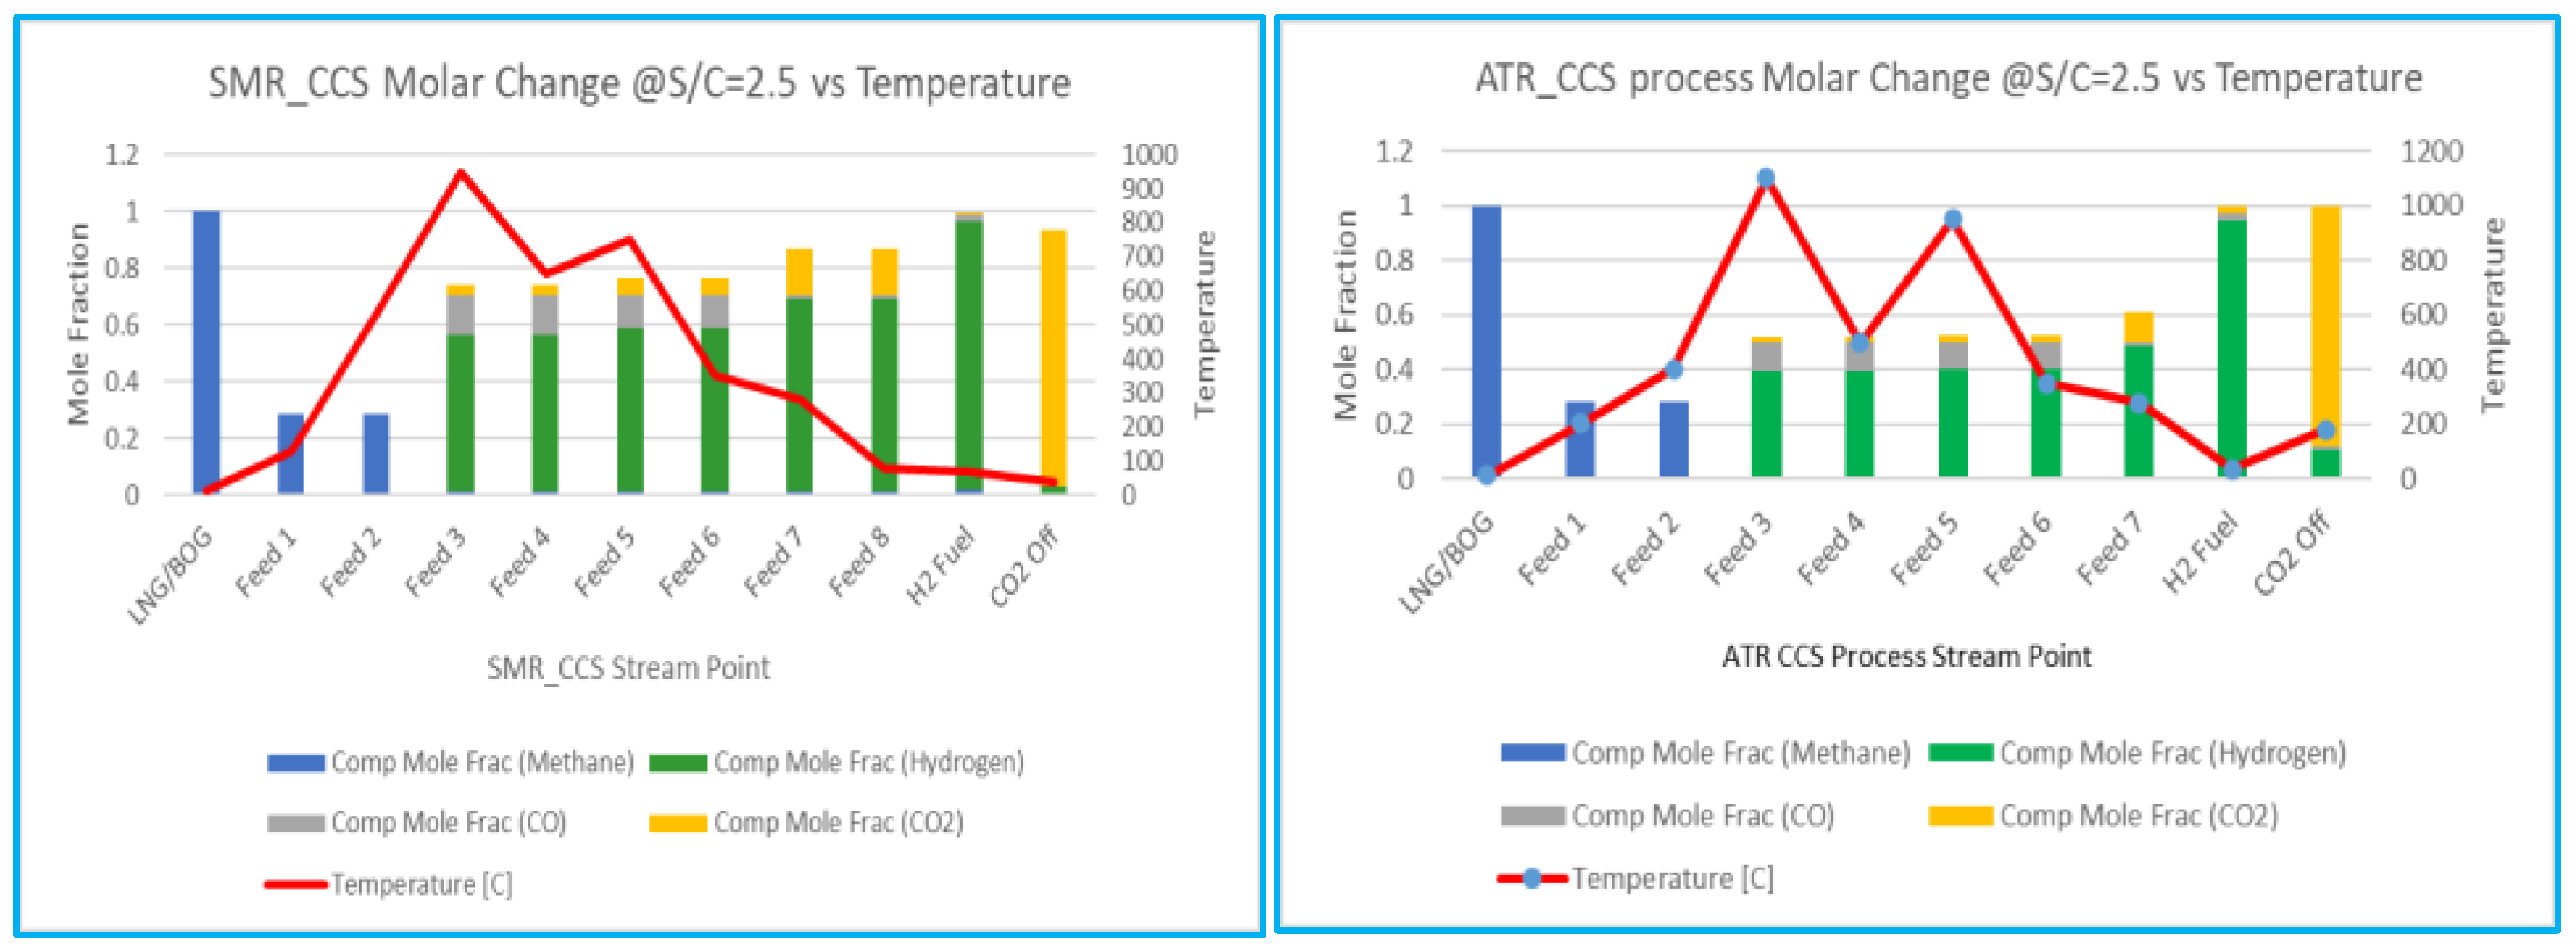
Table 1.
Comparison of the heat value of different fuels (Source: [2]).
Table 1.
Comparison of the heat value of different fuels (Source: [2]).
| Fuel Type | Heat value |
|---|---|
| entry 1 | data |
| entry 2 | data |
| Hydrogen (H2) | 120-142 MJ/kg |
| Ammonia (NH3) | 22.5 MJ/Kg |
| Methane (CH4) | 50-55 MJ/kg |
| Methanol (CH3OH) | 22.7 MJ/kg |
| Dimethyl ether - DME (CH3OCH3) | 29 MJ/kg |
| Petrol/gasoline | 44-46 MJ/kg |
| Diesel fuel | 42-46 MJ/kg |
| Crude oil | 42-47 MJ/kg |
| Liquefied petroleum gas (LPG) | 46-51 MJ/kg |
| Natural gas | 42-55 MJ/kg |
| Hard black coal (IEA definition) | >23.9 MJ/kg |
| Hard black coal (Australia & Canada) | c. 25 MJ/kg |
| Sub-bituminous coal (IEA definition) | 17.4-23.9 MJ/kg |
| Sub-bituminous coal (Australia & Canada) | c. 18 MJ/kg |
| Lignite/brown coal (IEA definition) | <17.4 MJ/kg |
| Lignite/brown coal (Australia, electricity) | c. 10 MJ/kg |
| Firewood (dry) | 16 MJ/kg |
| Natural uranium in LWR (normal reactor) | 500 GJ/kg |
| Natural uranium, in LWR with U & Pu, recycle | 650 GJ/kg |
| Natural uranium, in FNR | 28,000 GJ/kg |
| Uranium enriched to 3.5% in LWR | 3900 kg |
Table 2.
Comparison of Hydrogen Properties with other fuels (Source: [2]).
Table 2.
Comparison of Hydrogen Properties with other fuels (Source: [2]).
| Property | Units | Hydrogen | Methane | Propane | Methanol | Ethanol | Gasoline |
|---|---|---|---|---|---|---|---|
| Chemical Formula | H2 | CH4 | C3H8 | CH3OH | C2H5OH | CxHy (x = 4 - 12) | |
| Molecular Weight [a, b] | 2.02 | 16.04 | 44.1 | 32.04 | 46.07 | 100 - 105 | |
| Density, NTP [3, a, c] | kg/m³ | 0.0838 | 0.668 | 1.87 | 791 | 789 | 751 |
| lb/ft³ | 0.00523 | 0.0417 | 0.116 | 49.4 | 49.3 | 46.9 | |
| Viscosity, NTP [3, a, b] | g/cm-sec | 8.81 E-5 | 1.10 E-4 | 8.012 E-5 | 9.18 E-3 | 0.0119 | 0.0037 - 0.0044 |
| lb/ft-sec | 5.92 E-6 | 7.41 E-6 | 5.384 E-6 | 6.17 E-4 | 7.99 E-4 | 2.486 E-4 - 2.957 E-4 | |
| Normal Boiling Point [a, b] | °C | -253 | -162 | -42.1 | 64.5 | 78.5 | 27 - 225 |
| °F | -423 | -259 | -43.8 | 148 | 173.3 | 80 - 437 | |
| Vapour specific gravity, NTP [3, a, d] | air = 1 | 0.0696 | 0.555 | 1.55 | N/A | N/A | 3.66 |
| Flash Point [b, d] | °C | <-253 | -188 | -104 | 11 | 13 | -43 |
| °F | <-423 | -306 | -155 | 52 | 55 | -45 | |
| Flammability Range in Air [c, b, d] | vol% | 4.0 - 75.0 | 5.0 - 15.0 | 2.1 - 10.1 | 6.7 - 36.0 | 4.3 -19.0 | 1.4 - 7.6 |
| Auto ignition temperature [b, d] | °C | 585 | 540 | 490 | 385 | 423 | 230 - 480 |
| °F | 1085 | 1003 | 914 | 723 | 793 | 450 - 900 | |
| Maximum flame velocity in the air [2, c] | m/s | 2.83 | 0.45 | 0.46 | N/A | N/A | N/A |
| ft/s | 9.28 | 1.48 | 1.52 |
Table 3.
Comparison of Hydrogen Production Cost (Source: [9]).
Table 3.
Comparison of Hydrogen Production Cost (Source: [9]).
| Process | Energy source | Feedstock | Capital cost (M$) | Hydrogen cost ($/kg) |
|---|---|---|---|---|
| SMR with CCS | Standard fossil fuels | Natural gas | 226.4 | 2.27 |
| SMR without CCS | Standard fossil fuels | Natural gas | 180.7 | 2.08 |
| CC with CCS | Standard fossil fuels | Coal | 545.6 | 1.63 |
| CG without CCS | Standard fossil fuels | Coal | 435.9 | 1.34 |
| ATR of methane with CCS | Standard fossil fuels | Natural gas | 183.8 | 1.48 |
| Methane pyrolysis | Internally generated steam | Natural gas | – | 1.59–1.70 |
| Biomass pyrolysis | Internally generated steam | Woody biomass | 53.4–3.1 | 1.25–2.20 |
| Biomass gasification | Internally generated steam | Woody biomass | 149.3–6.4 | 1.77–2.05 |
| Direct bio-photolysis | Solar | Water + algae | 50 $/m2 | 2.13 |
| Indirect bio-photolysis | Solar | Water + algae | 135 $/m2 | 1.42 |
| Dark fermentation | – | Organic biomass | – | 2.57 |
| Photo-fermentation | Solar | Organic biomass | – | 2.83 |
| Solar PV electrolysis | Solar | Water | 12–54.5 | 5.78–23.27 |
| Solar thermal electrolysis | Solar | Water | 421–22.1 | 5.10–10.49 |
| Wind electrolysis | Wind | Water | 504.8–499.6 | 5.89–6.03 |
| Nuclear electrolysis | Nuclear | Water | – | 4.15–7.00 |
| Nuclear thermolysis | Nuclear | Water | 39.6–2107.6 | 2.17–2.63 |
| Solar thermolysis | Solar | Water | 5.7–16 | 7.98–8.40 |
| Photo-electrolysis | Solar | Water | – | 10.36 |
Disclaimer/Publisher’s Note: The statements, opinions and data contained in all publications are solely those of the individual author(s) and contributor(s) and not of MDPI and/or the editor(s). MDPI and/or the editor(s) disclaim responsibility for any injury to people or property resulting from any ideas, methods, instructions or products referred to in the content. |
© 2024 by the authors. Licensee MDPI, Basel, Switzerland. This article is an open access article distributed under the terms and conditions of the Creative Commons Attribution (CC BY) license (http://creativecommons.org/licenses/by/4.0/).
Copyright: This open access article is published under a Creative Commons CC BY 4.0 license, which permit the free download, distribution, and reuse, provided that the author and preprint are cited in any reuse.


