
Submitted:
27 October 2025
Posted:
03 November 2025
You are already at the latest version
Preprints on COVID-19 and SARS-CoV-2
Abstract
Recent studies have reported a reduction or elimination of taste and smell perception in individuals who have had acute respiratory syndrome caused by COVID-19. However, there are few reports in the literature to verify if the aforementioned syndrome causes a difference in the dominant sensation perceived during the consumption and acceptance of food. Therefore, this study aims to develop an innovative product, a low-calorie coconut ice cream with total substitution of sucrose by different sweeteners, and sensory analyze them. Six different samples of coconut ice cream were obtained with different sweeteners: 1- 100% sucrose; 2- 100% sucralose; 3- 100% stevia rebaudioside A 60; 4- 100% stevia re-baudioside A 95; 5- 100% stevia rebaudioside D; and 6- 100% acesulfame k mesh, all with the same sweetness equivalent to the product's ideal sweetness (15%). The six formula-tions were sensorially analyzed by 140 regular ice cream consumers, using the Flash Pro-file method, affective tests (acceptance) and CATA (check-all-that-apply) test. During the tests, consumers were asked whether or not they had ever experienced acute respiratory syndrome caused by Covid 19. It is important to carry out studies that can provide infor-mation on the sensory characteristics perceived in coconut ice cream with different sweeteners, as well as their acceptance and whether these responses differ between con-sumers who have or have not had acute respiratory syndrome caused by Covid 19. Alter-ing the perception of tastes, aromas, and, consequently, flavors during food consumption can have significant consequences for the quality of life of individuals, and this knowledge can guide concrete attitudes in the preparation and production of food.
Keywords:
sensory analysis
; coconut ice cream
; stevia
; COVID-19 effects
1. Introduction
COVID-19 is a contagious respiratory disease, caused by the coronavirus SARS-CoV-2, that appeared at the end of 2019, causing an enormous global crisis. Symptoms go from mild to severe, including fever, shortness of breath, cough, fatigue, and, in particular, loss of taste or smell. The World Health Organization (WHO) declared COVID-19 a pandemic in March 2020, which led to social distancing, lockdowns, and mandatory wearing of masks to avoid the spread of the virus.
Since the loss of taste is an important point related to food science and engineering, this paper makes an effort to study this problem, associated to the coconut, which is a common tropical food.
The literature has some research on this topic. Parker et al. [1] investigated the impact of parosmia, an olfactory dysfunction, on food perception in individuals recovering from COVID-19. It shows that most patients regain their sense of smell within weeks, but about 10% experience long-lasting distortions known as parosmia, which can lead to significant changes in eating behavior and quality of life. The study involved a cross-sectional analysis of 727 respondents who completed a questionnaire about their experience with smell distortions and related changes in food perception. The results show a strong correlation between the strength of odor distortion and feelings of disgust, with 84% of distorted items rated as unpleasant. This research also shows that olfactory dysfunction can lead to dietary changes, potentially impacting mental health and nutrition.
Chaaban et al. [2] explored the effects of COVID-19 on appetite, sensory perception, and eating behavior based on self-reports from individuals in Denmark who experienced changes due to the virus. Conducted through an online survey with 102 participants, the research focused on how COVID-19 affects food desire, hunger, and satiety sensations, as well as taste and smell perceptions, food intake, and coping strategies. The results show that, during the acute phase of COVID-19, a significant majority reported decreased appetite and sensory alterations, such as loss of taste (ageusia) and smell (anosmia), which persisted into the post-acute phase for many individuals. Altered sensory perceptions were linked to reduced enjoyment of food and changes in dietary habits, with participants reporting a preference for certain textures and increased use of spices to enhance flavors. This study illustrates a complex relationship between COVID-19 and eating behaviors, highlighting the need for strategies to address altered appetite and sensory perception, which includes focusing on the more functional senses, like touch, to improve food enjoyment.
Cabal-Prieto et al. [3] examined the impact of COVID-19 on sensory and cognitive perception among patients diagnosed with mild and severe cases, compared to healthy individuals. The research involved three groups of 50 participants each, including healthy consumers and those who had recovered from mild or severe COVID-19, who evaluated their perception of instant coffee using different concentrations to assess sensory attributes, emotions, and memories associated with the stimuli. The results showed that healthy consumers generally perceived higher intensities in most sensory attributes compared to those who had recovered from COVID-19. However, individuals diagnosed with mild and severe COVID-19 demonstrated a greater ability to discriminate between sensory attributes related to smell, taste, and flavor. Participants recovering from COVID-19 also reported experiencing a higher frequency of negative emotions and memories, such as feelings of boredom, disgust, and guilt, compared to the healthy group. The results also showed the complex sensory alterations induced by COVID-19 and their subsequent effects on emotional and cognitive experiences.
Neuman et al. [4] investigated food-related experiences and behavioral responses of individuals affected by chemosensory dysfunctions (alterations in taste and smell) following COVID-19. The review aimed to map existing literature regarding how these dysfunctions impact food intake, eating behavior, and overall quality of life. The results synthesize findings from various research methods, including qualitative and quantitative studies, with a total of nine publications included. The results are categorized into two main themes: "Psychological and Social Aspects" and "Nutritional Aspects." It highlights that individuals with chemosensory dysfunctions experience a variety of food-related issues, such as decreased enjoyment of eating, altered appetite, and significant impacts on social interactions. Many reported feelings of isolation and dissatisfaction with their eating experiences. Participants often employed coping strategies, such as focusing on familiar foods, utilizing olfactory training, and seeking support through online communities. The results indicate that, while many people show improvement over time, the effects of chemosensory dysfunctions on eating behavior and quality of life can be profound and long-lasting.
Cattaneo et al. [5] investigated the impact of COVID-19 on olfactory (smell) and gustatory (taste) functions, comparing hospitalized patients with laboratory-confirmed SARS-CoV-2 infections to a control group of healthy individuals. The study aimed to psychophysically evaluate these sensory functions and assess their relationship with clinical parameters and disease severity. The study involved 61 COVID-19 patients and 54 healthy controls. Results showed a significant impairment in both smell and taste functions among COVID-19 patients, with 45% reporting issues with these senses. Psychophysical testing confirmed these self-reported complaints, revealing reduced performance in identifying and perceiving the intensity of smells and tastes. Notably, patients exhibited greater difficulties with sweet and bitter tastes, with around 60% unable to recognize these flavors. The results highlighted the sensory negative impact on the quality of life of the patients, suggesting that such impairments may be a valuable diagnostic marker for COVID-19.
On the other side, the increase in the consumption of modified foods, including low-calorie foods, which is growing everywhere due to consumer awareness about healthy eating habits, leads to the tendency to consume products with sugar replaced by sweeteners [6]. According to a study published by Brazil Food Trends 2020, 21% of Brazilians associate food consumption with healthiness, well-being, sustainability, and ethics [7]. The five highlighted macro-trends are Control and Adjustment [8], where one of the trends in the Control and Adjustment category is the reduction and/or replacement of sugar.
A challenge for replacing this ingredient is to maintain the sensory characteristics of the product and ensure consumer acceptance. Thus, the study of applying sweeteners as a substitute for sucrose becomes of utmost importance [8].
Dairy products, including ice creams, occupy a large part of the global market for modified foods [9] and have been widely studied, creating a category of specific products for consumers who need or wish to consume low-calorie foods, with reduced or total sucrose replacement [10]. Ice creams are highly consumed and appreciated worldwide, in particular in tropical regions like Brazil, and they are produced in different flavors.
Coconut is a typical Brazilian fruit with antioxidant properties, used in numerous savory and sweet recipes, and serves as a food source in many parts of Brazil. Coconut helps in reducing cholesterol and has an effect on lowering blood pressure, due to its antioxidant phenolic compounds [11]. Brazil ranks among the top five coconut producers globally, generating interest in developing and producing innovative coconut-based products, especially those aligned with healthier habits. Due to its low carbohydrate content and low glycemic index, coconut is widely used in "low carb" diets, increasing the number of coconut consumers [12].
For these reasons, the present research proposes the formulation of coconut ice cream with total or partial sucrose replacement by stevia sweetener with different concentrations of rebaudioside A. Considering the relevance of the acceptance of ice creams and coconut products by consumers, the sensory study of low-calorie coconut ice cream samples becomes fundamental.
The sensory method Flash Profile proposed by Dairou and Sieffermann [13] can be applied to compare the intensity of descriptors and therefore the product profile rapidly. Consumers (untrained) select their own terms to describe and evaluate a set of products simultaneously and then rate each product for each sensory descriptor they perceive individually. Consumers are asked to focus on descriptive terms [13,14]. The method does not require a training session, since participants need to rate products on a scale for each term that the consumer detected in the sample.
Each participant develops a list of descriptor terms to evaluate the products. The individual sensory maps are treated with multivariate statistical analysis, such as principal component analysis, principal coordinates, and/or hierarchical clustering, to be visually represented graphically in two-dimensional space [13,15].
The effective acceptance method is also extremely important for checking how much consumers like or dislike a new product. The development of the project enabled the generation of important and unprecedented results for scientific research in related fields. Thus, considering the high acceptance of consumers regarding coconut and ice cream, the present project presented three important stages:
1. Development of coconut ice creams with total sucrose replacement by stevia sweetener with different levels of rebaudioside A, by stevia rebaudioside D, by sucralose, and by acesulfame K mesh.
2. Determine the sensory profile using the Flash Profile method, acceptance, and apply the CATA test concerning the six produced coconut ice cream samples.
3. Compare the responses given by consumers who presented the acute respiratory syndrome caused by COVID 19 and those who did not, regarding the six elaborated coconut ice cream samples.
2. Materials and Methods
COVID-19 is a contagious respiratory disease, caused by the coronavirus SARS-CoV-2, that appeared at the end of 2019, causing an enormous global crisis. Symptoms go from mild to severe, including fever, shortness of breath, cough, fatigue, and, in particular, loss of taste or smell. The World Health Organization (WHO) declared COVID-19 a pandemic in March 2020, which led to social distancing, lockdowns, and mandatory wearing of masks to avoid the spread of the virus.
Since the loss of taste is an important point related to food science and engineering, this paper makes an effort to study this problem, associated to the coconut, which is a common tropical food.
The literature has some research on this topic. Parker et al. [1] investigated the impact of parosmia, an olfactory dysfunction, on food perception in individuals recovering from COVID-19. It shows that most patients regain their sense of smell within weeks, but about 10% experience long-lasting distortions known as parosmia, which can lead to significant changes in eating behavior and quality of life. The study involved a cross-sectional analysis of 727 respondents who completed a questionnaire about their experience with smell distortions and related changes in food perception. The results show a strong correlation between the strength of odor distortion and feelings of disgust, with 84% of distorted items rated as unpleasant. This research also shows that olfactory dysfunction can lead to dietary changes, potentially impacting mental health and nutrition.
Chaaban et al. [2] explored the effects of COVID-19 on appetite, sensory perception, and eating behavior based on self-reports from individuals in Denmark who experienced changes due to the virus. Conducted through an online survey with 102 participants, the research focused on how COVID-19 affects food desire, hunger, and satiety sensations, as well as taste and smell perceptions, food intake, and coping strategies. The results show that, during the acute phase of COVID-19, a significant majority reported decreased appetite and sensory alterations, such as loss of taste (ageusia) and smell (anosmia), which persisted into the post-acute phase for many individuals. Altered sensory perceptions were linked to reduced enjoyment of food and changes in dietary habits, with participants reporting a preference for certain textures and increased use of spices to enhance flavors. This study illustrates a complex relationship between COVID-19 and eating behaviors, highlighting the need for strategies to address altered appetite and sensory perception, which includes focusing on the more functional senses, like touch, to improve food enjoyment.
Cabal-Prieto et al. [3] examined the impact of COVID-19 on sensory and cognitive perception among patients diagnosed with mild and severe cases, compared to healthy individuals. The research involved three groups of 50 participants each, including healthy consumers and those who had recovered from mild or severe COVID-19, who evaluated their perception of instant coffee using different concentrations to assess sensory attributes, emotions, and memories associated with the stimuli. The results showed that healthy consumers generally perceived higher intensities in most sensory attributes compared to those who had recovered from COVID-19. However, individuals diagnosed with mild and severe COVID-19 demonstrated a greater ability to discriminate between sensory attributes related to smell, taste, and flavor. Participants recovering from COVID-19 also reported experiencing a higher frequency of negative emotions and memories, such as feelings of boredom, disgust, and guilt, compared to the healthy group. The results also showed the complex sensory alterations induced by COVID-19 and their subsequent effects on emotional and cognitive experiences.
Neuman et al. [4] investigated food-related experiences and behavioral responses of individuals affected by chemosensory dysfunctions (alterations in taste and smell) following COVID-19. The review aimed to map existing literature regarding how these dysfunctions impact food intake, eating behavior, and overall quality of life. The results synthesize findings from various research methods, including qualitative and quantitative studies, with a total of nine publications included. The results are categorized into two main themes: "Psychological and Social Aspects" and "Nutritional Aspects." It highlights that individuals with chemosensory dysfunctions experience a variety of food-related issues, such as decreased enjoyment of eating, altered appetite, and significant impacts on social interactions. Many reported feelings of isolation and dissatisfaction with their eating experiences. Participants often employed coping strategies, such as focusing on familiar foods, utilizing olfactory training, and seeking support through online communities. The results indicate that, while many people show improvement over time, the effects of chemosensory dysfunctions on eating behavior and quality of life can be profound and long-lasting.
Cattaneo et al. [5] investigated the impact of COVID-19 on olfactory (smell) and gustatory (taste) functions, comparing hospitalized patients with laboratory-confirmed SARS-CoV-2 infections to a control group of healthy individuals. The study aimed to psychophysically evaluate these sensory functions and assess their relationship with clinical parameters and disease severity. The study involved 61 COVID-19 patients and 54 healthy controls. Results showed a significant impairment in both smell and taste functions among COVID-19 patients, with 45% reporting issues with these senses. Psychophysical testing confirmed these self-reported complaints, revealing reduced performance in identifying and perceiving the intensity of smells and tastes. Notably, patients exhibited greater difficulties with sweet and bitter tastes, with around 60% unable to recognize these flavors. The results highlighted the sensory negative impact on the quality of life of the patients, suggesting that such impairments may be a valuable diagnostic marker for COVID-19.
On the other side, the increase in the consumption of modified foods, including low-calorie foods, which is growing everywhere due to consumer awareness about healthy eating habits, leads to the tendency to consume products with sugar replaced by sweeteners [6]. According to a study published by Brazil Food Trends 2020, 21% of Brazilians associate food consumption with healthiness, well-being, sustainability, and ethics [7]. The five highlighted macro-trends are Control and Adjustment [8], where one of the trends in the Control and Adjustment category is the reduction and/or replacement of sugar.
A challenge for replacing this ingredient is to maintain the sensory characteristics of the product and ensure consumer acceptance. Thus, the study of applying sweeteners as a substitute for sucrose becomes of utmost importance [8].
Dairy products, including ice creams, occupy a large part of the global market for modified foods [9] and have been widely studied, creating a category of specific products for consumers who need or wish to consume low-calorie foods, with reduced or total sucrose replacement [10]. Ice creams are highly consumed and appreciated worldwide, in particular in tropical regions like Brazil, and they are produced in different flavors.
Coconut is a typical Brazilian fruit with antioxidant properties, used in numerous savory and sweet recipes, and serves as a food source in many parts of Brazil. Coconut helps in reducing cholesterol and has an effect on lowering blood pressure, due to its antioxidant phenolic compounds [11]. Brazil ranks among the top five coconut producers globally, generating interest in developing and producing innovative coconut-based products, especially those aligned with healthier habits. Due to its low carbohydrate content and low glycemic index, coconut is widely used in "low carb" diets, increasing the number of coconut consumers [12].
For these reasons, the present research proposes the formulation of coconut ice cream with total or partial sucrose replacement by stevia sweetener with different concentrations of rebaudioside A. Considering the relevance of the acceptance of ice creams and coconut products by consumers, the sensory study of low-calorie coconut ice cream samples becomes fundamental.
The sensory method Flash Profile proposed by Dairou and Sieffermann [13] can be applied to compare the intensity of descriptors and therefore the product profile rapidly. Consumers (untrained) select their own terms to describe and evaluate a set of products simultaneously and then rate each product for each sensory descriptor they perceive individually. Consumers are asked to focus on descriptive terms [13,14]. The method does not require a training session, since participants need to rate products on a scale for each term that the consumer detected in the sample.
Each participant develops a list of descriptor terms to evaluate the products. The individual sensory maps are treated with multivariate statistical analysis, such as principal component analysis, principal coordinates, and/or hierarchical clustering, to be visually represented graphically in two-dimensional space [13,15].
The effective acceptance method is also extremely important for checking how much consumers like or dislike a new product. The development of the project enabled the generation of important and unprecedented results for scientific research in related fields. Thus, considering the high acceptance of consumers regarding coconut and ice cream, the present project presented three important stages:
1. Development of coconut ice creams with total sucrose replacement by stevia sweetener with different levels of rebaudioside A, by stevia rebaudioside D, by sucralose, and by acesulfame K mesh.
2. Determine the sensory profile using the Flash Profile method, acceptance, and apply the CATA test concerning the six produced coconut ice cream samples.
3. Compare the responses given by consumers who presented the acute respiratory syndrome caused by COVID 19 and those who did not, regarding the six elaborated coconut ice cream samples.
3. Results
Six formulations of coconut ice cream were developed, being: 1) 100% sucrose; 2) Sucralose; 3) Stevia Rebaudioside A 60%; 4) Stevia Rebaudioside A 95%; 5) Stevia Rebaudioside D; and 6) Acesulfame K Mesh, all with the same sweetness equivalent to the product at ideal sweetness (15%), pasteurized and prepared in a bench ice cream maker in the Sensory Science and Consumer Studies Laboratory, according to the developed basic formulation [16]. Sensory tests were conducted in individual laboratory booths at 22 ± 2º C, with positive pressure to eliminate volatiles outside the laboratory through doors opening outward. Table 1 shows the formulation of each sample. Sweetener agents in each formulation of coconut ice cream are: Sucrose (ICCSucrose), Sucralose (ICCSucralose), Stevia Rebaudioside A 60 (ICCR60), Stevia Rebaudioside A 95 (ICCR95), Stevia Rebaudioside D (ICCSD), Acesulfame K Mesh (ICCAKM). The study was approved by the Ethics Committee of the State University of Campinas under the request number 60511622.0.0000.5404. Participants were selected from advertisements posted on flyers and social media. Informed consent was obtained from all volunteers. The average participant age was 21 yo, with a balanced distribution of male and female volunteers.
As can be seen in Table 1, all formulations had the same base, differing only in the type of sweetener used in each one. For the preparation of the samples, important steps were taken to ensure that the final product has the expected safety and quality. Initially, the ingredients were weighed and homogenized in a blender. Once the mixture was homogenized, it was pasteurized while stirring, reaching 83ºC for 2 minutes, to ensure the safety of the coconut ice cream. Then, the ice cream was cooled in an ice bath until it reached between 5 and 10 ºC and allowed to mature for at least 4 hours at a temperature below 5 ºC, without reaching the freezing temperature. After maturation, the mixture was churned in bench ice cream makers, where the product achieved all the expected characteristics of texture, aeration, and creaminess. The formulations were taken to the freezer as soon as the churning was completed, done in a controlled and rapid manner to avoid the formation of ice crystals, which, when present, alter the sensory characteristics of the product.
With 140 people recruited to participate, the analyses of determining the descriptive sensory profile by Flash Profile, acceptance, and CATA of the six produced coconut ice cream samples were made. 20 participants completed only the Flash Profile test, forming a group of research participants, and 120 completed the acceptance tests, which also included a CATA questionnaire.
3.1. FLASH PROFILE
The sensory analysis of the product profiles occurred through the application of Flash Profile [13]. Each of the consumers created a list of sensory descriptor terms that they perceive in each of the coconut ice cream samples.
The sensory evaluation occurred during the tasting of the ice cream samples, which took place in computerized individual booths. The test was designed in balanced complete blocks, where all samples were tested by all consumers in a balanced order, following Williams’ Latin square design, for each taster [17].
The taster received the six samples, presented monadically, in individual packages with a quantity of 15 g at a temperature of 6 °C. They were then instructed to place the sample in their mouth and mark on a scale the intensity of each descriptor perceived in each of the samples.
3.2. ACCEPTANCE TEST
Acceptance tests were applied using a linear hedonic scale of 9 cm [17], to evaluation of the coconut ice cream samples [18] regarding appearance, aroma, flavor, texture, and overall impression. The test used an unstructured linear scale anchored at the extremes on the left and right with the terms “extremely disliked” and “extremely liked,” respectively.
The samples were presented to the tasters in a sequential monadic manner, and the experimental design used balanced complete blocks, with data collection through the Fizz Sensory Software program from BIOSYSTEMES, France.
The results of the acceptance test were analyzed by ANOVA, using two factors (consumer and sample), Tukey's mean test (p < 0.05), and internal preference mapping [10].
3.3. CATA TEST (Check-All-That-Apply)
The check-all-that-apply (CATA) questionnaire consists of a list of sensory descriptors, generated by a group of ice cream studies at LCSEC. Consumers were invited to select all the terms they considered necessary to describe the sensory characteristics of the samples. For this purpose, a balanced list of descriptor terms was used, organized according to methodological recommendations [19].
The analysis of the results occurred through the frequency of mention for each term in the CATA formulary, determined by counting the number of consumers who used that term to describe each sample and correspondence analysis. To evaluate whether the applied questions were able to determine differences in the consumers' perception regarding the samples, Cochran's Q test was performed for each of the terms, considering the factors of sample variation and consumption [20].
4. Discussion
From the results obtained in the sensory acceptance test, several figures were generated. Figure 1, shows the characteristics of the ice cream and the number of consumers who considered each one ideal regarding creaminess, surface uniformity, intensity of coconut flavor, sweetness, dairy flavor, and intensity of overall flavor (dark blue color means much less than ideal, light blue represents less than ideal, green represents ideal, orange represents more than ideal, and red represents much more than ideal). Therefore, it can be observed that, in five of the six characteristics, the predominant color is green, indicating that most consumers stated that the characteristics were close to ideal. However, creaminess was presented less than ideally, as the majority indicated a factor that should be improved in the coconut ice cream if it is to be marketed.
In Figure 2, it is possible to analyze the acceptance of the prepared ice cream samples concerning appearance, color, aroma, overall impression, and coconut flavor. From this, it can be concluded that the samples with sucrose, sucralose, and stevia rebaudioside D had greater acceptance by consumers, presenting higher overall impressions than the other samples. It also shows that the most important factor that gives a higher overall good impression is the coconut flavor, because the bars representing those two factors are the ones with higher correlation. The second most important factor is appearance, for the same reason. This result suggests that, to achieve greater acceptance, ice cream formulations should prioritize the sweeteners that were found to be most palatable to consumers.
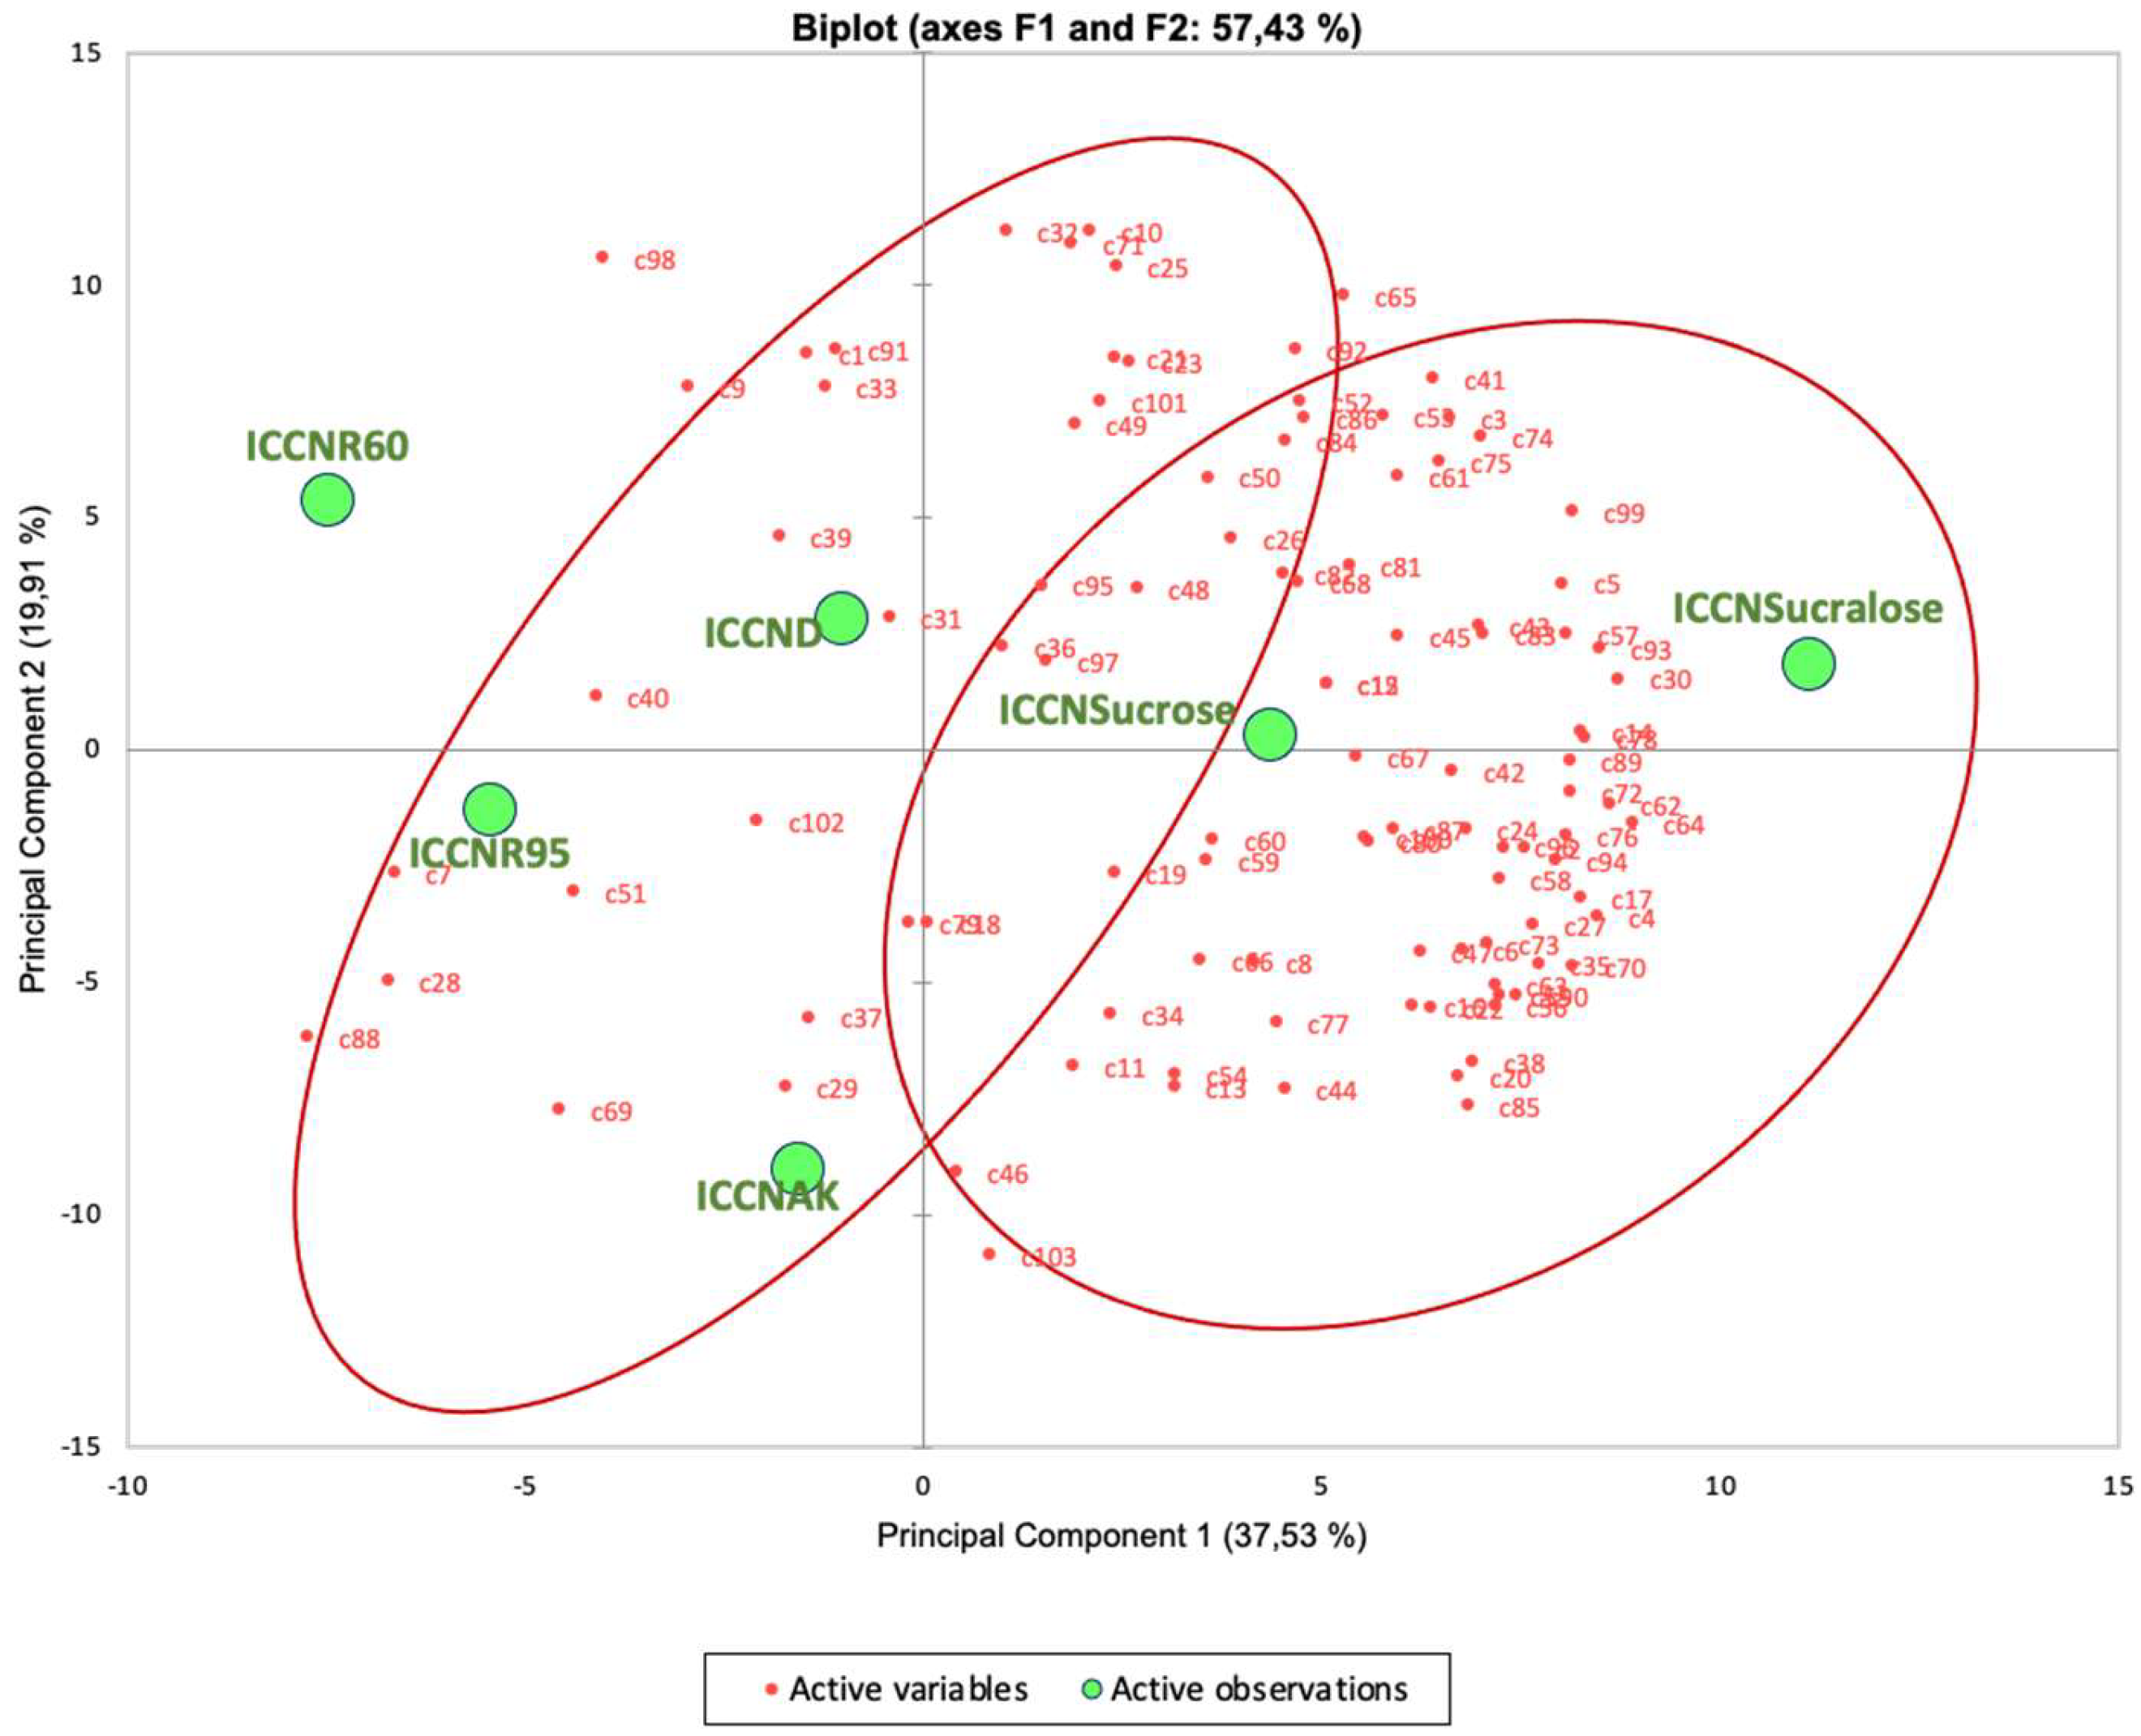
To observe the consumer preference map generated from multivariate statistical analysis of principal components (Figure 2). Consumers marked their opinion about appearance, flavor, texture, and overall acceptability in a nine-point hedonic scale, which goes from 1 (dislike extremely) to 9 (like extremely). The red points indicate the consumers, and the green circles indicate the samples. It is noticeable that consumers showed a greater preference for the coconut ice cream samples sweetened with sucrose and sucralose, as the largest number of points is closest to the area of these two samples, indicating the overall preference of each consumer regarding each sample. This information is crucial for the development of future products in the ice cream market, as it reinforces the idea that the choice of sweetener can influence overall acceptance of the product.
Figure 3.
Internal Preference Map generated by Multivariate Statistical Analysis of Principal Components.
Figure 3.
Internal Preference Map generated by Multivariate Statistical Analysis of Principal Components.
In Figure 4, it is possible to observe that two groups of acceptance of the formulated samples were formed. From the dendrogram of groupings by Hierarchical Cluster Analysis, it is possible to verify the consumers' preference for the samples with sucrose and sucralose.
For the first stage of the CATA test (Check-All-That-Apply), consumers evaluated characteristics such as: "coconut," "sour," "characteristic flavor," "healthy," "indulgent," "natural," "artificial," "tasty," "creamy," and "none of these," marking all options that applied to each sample tasted. This information is valuable for understanding how different sweeteners affect sensory perception and can help guide future product formulations.
Figure 5 provides insight into the results of the CATA test, where consumers associated specific characteristics with each sample. It is possible to observe that the samples made with Sucralose and Stevia Rebaudioside D were associated with "characteristic flavor" and "coconut." The sample made with sugar was associated with "tasty" and "healthy." The samples of Stevia Rebaudioside A 95 and Stevia Rebaudioside A 60 were associated with "artificial" and "indulgent," while the Acesulfame K Mesh sample was associated with "natural." These insights are fundamental for understanding which sensory attributes consumers value and can guide the development of new products.
In Figure 6, the relationship between the global impression (overall liking) of the samples and their sensory characteristics is presented. It is possible to associate the overall impression of the samples with the presented characteristics, with the highlighted ones being "natural," "healthy," "coconut," and "tasty." These characteristics are considered desirable for a coconut ice cream, demonstrating a generally positive sensory profile of the product. However, it can be observed that "creamy" is distanced from the overall impression, and for an ice cream, it should be creamy, therefore, this would be a parameter to be evaluated in the case of a reformulation of the product if it were to be produced.
Figure 7 identifies the characteristics that have the most significant impact on the acceptance of the samples. It can be seen that the characteristics of the greatest impact were "coconut" and "characteristic flavor," aligning with expectations for a coconut ice cream, demonstrating that the formulation is consistent with the product proposal. This result confirms that the formulation should emphasize these attributes to ensure consumer satisfaction and the product's relevance in the market.
Figure 8 analyzes the variables associated with the samples to understand their impact on overall acceptance. It demonstrates the impact of each characteristic associated with the samples, reinforcing previous analyses, where "characteristic flavor" and "coconut" are of greatest impact, and "creamy," "indulgent," "artificial," "sour," and "none of these" are of lesser impact. This data is crucial for guiding reformulation and product development efforts, prioritizing attributes that are more valued by consumers.
For the second stage of the CATA test (Check-All-That-Apply), consumers evaluated characteristics such as: "joy," "I want more," "indulgence," "natural," "delicious," "satiety," "fun," "childlike," "a break for me," "pleasure," "different," "it's perfect," "enjoying the moment," "artificial," "sharing with friends," "I wanted to change to make it better," "tasty," "quality," "strange," and "novelty," marking all options that applied to each sample tasted.
Figure 9 shows which words were most attributed to each sample. The samples of Stevia Rebaudioside A 60 and Stevia Rebaudioside A 95 were more associated with "artificial" and "different;" the Acesulfame K Mesh formulation was more associated with "natural," "I wanted to change to make it better," and "satiety;" the Stevia Rebaudioside D formulation was more associated with "enjoying the moment" and "natural;" the Sucrose formulation was associated with "enjoying the moment," "fun," "a break for me," and "tasty," while the Sucralose formulation was associated with "I want more," "joy," and "delicious."
It is interesting to note that the formulation of Stevia Rebaudioside D was associated with desirable characteristics for the product, being a sweetener still little used, which brings positive results regarding its implementation in the market.
Figure 10 highlights the characteristics that have the greatest impact on the global impression of the ice creams. It is possible to observe the overall characteristics of greater impact, which are "joy," "natural," and "different." The characteristic "different" contributes negatively to the product, while "joy" and "natural" contribute positively to the product. These results may indicate that to improve acceptance, it is important to align the product characteristics with consumer expectations.
Figure 11 presents the variables analyzed for their impact on acceptance, reinforcing previous analyses. It is possible to see all the characteristics and their impacts, reinforcing previous analyses. Characteristics that provide pleasure and naturalness are valued, while negative attributes such as "strange" should be avoided. This information is essential for developing products that meet consumer preferences. From the results obtained in the Flash Profile test, the following figures were generated.
Figure 12 represents the principal components of the Flash Profile. The samples sweetened with Sucralose and with Sucrose are mainly characterized by "apparent creaminess," "sweet," "residual sweet," and "white color." The sample sweetened with Stevia Rebaudioside D is characterized by "milk flavor," "melting," "coconut flavor," and "creaminess," while the samples sweetened with Stevia Rebaudioside A 60 and Stevia Rebaudioside A 95 are characterized by "residual bitterness" and "bitter taste." The samples sweetened with sucralose and sugar are characterized positively. The identification of characteristics such as "apparent creaminess," "sweetness," "residual sweetness," and "white color" is crucial, as this information can guide the development of new formulations that meet consumer sensory expectations.
Figure 13 evidencing samples forming two groups with common characteristics concerning the Flash Profile. Within each, based on hierarchical cluster analysis, the samples sweetened with Sucralose, Sucrose, and Stevia Rebaudioside D have similar sensory characteristics, while the samples sweetened with Acesulfame K Mesh, Stevia Rebaudioside A 60, and Stevia Rebaudioside A 95 have common sensory characteristics among themselves. This information is useful for understanding how different sweeteners can create distinct perceptions among consumers and can help define marketing and product development strategies.
Figure 14 and Figure 15 associate the Flash Profile results with the overall impression of the sample by multivariate statistic analysis. In the Figure 14, the apparent creaminess, milk flavor, and mouth creaminess are sensory characteristics provided in the Flash Profile that positively contribute to the overall acceptance of consumers. Figure 15 presents the external preference map, which relates the acceptance of the samples to their sensory characteristics. It shows a complex analysis that demonstrates the location of the overall impression, which is primarily close to the samples sweetened with sucralose and sucrose, providing direction on consumer preferences when compared to samples sweetened with other sweeteners. In Figure 15, it is also possible to observe that the characteristics that contributed the most to the overall impression to be close to these two samples were "creaminess," "sweet," "milk flavor," "residual sweet," "coconut flavor," and "melting."
In Figure 16, it is possible to verify the consumers who presented or did not present Acute Respiratory Syndrome caused by COVID 19 and the overall acceptance of each sample. The sample sweetened with sucrose revealed a significantly higher acceptance average (p < 0.05), while for the samples sweetened with the other studied sweeteners, there was no significant difference in acceptance between those who presented or did not present the syndrome (p > 0.05). This can be seen by the relative differences in the evaluation of the hedonic scale showed in Figure 16. For the sucrose sample, there is a difference of about 12% in the hedonic scale, while in the others samples, the difference was about 5.5%. This demonstrates that only the formulation sweetened with sucrose showed a significant difference between people who had or did not have COVID 19. However, it is not possible to justify this difference with the obtained results, necessitating further studies to reach a conclusion on the reason.
5. Conclusions
Sensory tests and analyses are fundamental to studying consumers' perceptions through the application of scientific methods with uni and multivariate statistical applications, as they demonstrate which characteristics need improvement in a product and/or which products consumers prefer most, being an exact and fundamental science in research, development, and innovation of foods.
The results indicate that the formulation of coconut ice cream with different sweeteners received varied acceptance levels from consumers. The samples sweetened with sucrose and sucralose were favored, demonstrating higher overall impressions compared to those sweetened with stevia and acesulfame K. This suggests that, while low-calorie options can be appealing, maintaining the sensory characteristics associated with traditional ice cream is critical for consumer acceptance.
The Flash Profile highlighted the influenced consumer preference, including creaminess, coconut flavor, and overall taste. However, creaminess was identified as an area needing improvement, highlighting the importance of texture in ice cream products.
The consumers who had experienced COVID-19 reported different acceptance levels for certain formulations, specifically favoring the sucrose-sweetened sample. This point needs further research to understand the long-term sensory alterations experienced by individuals post-COVID-19 and how these changes impact food preferences. Overall, the results show the significance of sensory traits in the acceptance of modified food products, especially for populations affected by chemosensory dysfunctions.
Future studies should explore the effects of other sweeteners and further investigate the sensory experiences of consumers recovering from COVID-19 to enhance product development strategies in the food industry. It would also be interesting to deepen the studies on the difference in sensory perception in the sample made with sucrose between individuals who presented COVID and those who did not, seeking to find a reason for the difference, since the other formulations did not present significant differences (p>0.05).
Author Contributions
Author Contributions: Conceptualization, H.M.A.B.; formal analysis, S.L.A.P., H.M.A.B.; investigation, S.L.A.P., H.M.A.B.; methodology, S.L.A.P., H.M.A.B.; resources, H.M.A.B.; original draft preparation, S.L.A.P.; writing review and editing, S.L.A.P., H.M.A.B.; supervision, H.M.A.B.
Funding
This study was financed in part by the Coordination for the Improvement of Higher Education Personnel in Brazil (CAPES)—Finance Code 001 and the Brazilian National Council for Scientific and Technological Development (CNPq).
Institutional Review Board Statement
The study was conducted according to the guidelines of the Declaration of Helsinki, and approved by the Research Ethics Committee of the State University of Campinas (UNICAMP), Brazil (CAAE: 60511622.0.0000.5404) on November 23, 2022.
Informed Consent Statement
Informed consent was obtained from all participants involved in the study.
Data Availability Statement
Data is contained within the article.
Conflicts of Interest
The authors declare no conflicts of interest
References
- Parker, J.K.; Methven, L.; Pellegrino, R.; Smith, B.C.; Gane, S.; Kelly, C.E. (2022). Emerging pattern of post-COVID-19 parosmia and its effect on food perception. Foods, 11(7), 967.
- Chaaban, N.; Høier, A.T.Z.B.; Andersen, B.V. (2021). A detailed characterisation of appetite, sensory perceptional, and eating-behavioural effects of COVID-19: self-reports from the acute and post-acute phase of disease. Foods, 10(4), 892.
- Cabal-Prieto, A.; Sánchez-Arellano, L.; Herrera-Corredor, J.A.; Rodríguez-Miranda, J.; Prinyawiwatkul, W.; Ramón-Canul, L.G.; Toledano-Toledano, F.; Rodríguez-Buenfil, I.M.; Ramírez-Sucre, M.O.; Hernández-Salinas, G.; de Ramírez-Rivera, E.J. (2023). Effects of COVID-19 on sensory and cognitive perception of mild and severe diagnosed and recovered patients versus healthy consumers. Journal of Sensory Studies, 38(1), e12798.
- Neuman, N.; Sandvik, P.; Lindholm, N. B., Bömer-Schulte, K., & Lövestam, E.; (2023). Food-related experiences and behavioral responses among people affected by chemosensory dysfunctions following COVID-19: A scoping review. Research in nursing & health, 46(4), 385-399.
- Cattaneo, C.; Pagliarini, E.; Mambrini, S.P.; Tortorici, E.; Mené, R.; Torlasco, C. Changes in smell and taste perception related to COVID-19 infection: a case–control study. Sci Rep 2022; 12: 8192.
- Dutra, M.B.L.; Bolini, H.M.A. (2013) Sensory and physicochemical evaluation of acerola nectar sweetened with sucrose and different sweeteners. Food Sci Technol 33(4):612–618.
- Brasil food Trends 2020. São Paulo: Fiesp/ITAL, 2010. 173 p.
- Queiroz, G.C.; Rego, R.A.; Jardim, D.C.P. Brasil bakery & Confectionery Trends 2020. Campinas: ITAL, 2014. 321 p.
- Özer, B.H.; Kirmaci, H.A. (2010). Functional milks and dairy beverages. International Journal of Dairy Technology, 63(1), 1-15.
- Medeiros, A.; Tavares, E.; Bolini, H.M.A. Descriptive Sensory profile and consumer study impact of different nutritive and non-nutritive sweeteners on the descriptive, temporal profile, and consumer acceptance in a peach juice matrix. Foods 2022, 11, 244. [Google Scholar] [CrossRef] [PubMed]
- Gonçalves, D.P.; De Souza, R.S. Coco: análise do seu aproveitamento e utilização na gastronomia. Revista de Gastronomia, v. 1, n. 1, 2019.
- Da Silva, T.T.; Mulder, A.P.; Santana, I. Coqueiro (Cocos nucifera L.) e produtos alimentícios derivados: Uma revisão sobre aspectos de produção, tecnológicos e nutricionais. Revista Tecnologia de Alimentos: Tópicos Físicos, Químicos e Biológicos, v. 2, p. 80-101, 2021.
- Dairou, V; Sieffermann, JM.; 2002. A comparison of 14 jams characterized by conventional profile and a quick original method, the flash profile. Journal of Food Science, 67,826-834.
- Delarue, J.; Sieffermann, J.M. (2004). Sensory mapping using Flash profile. Comparison with a conventional descriptive method for the evaluation of the flavour of fruit dairy products. Food quality and preference, 15(4), 383-392.
- Tarea, S; Cuvelier, G; Sieffermann, JM.; 2007. Sensory evaluation of the texture of 49 commercial apple and pear purees. Journal of Food Quality, 30,1121-1131.
- Peres, J.; Esmerino, E.; Lins e Silva, A.C.M; Racowski, I.; Bolini, H.M.A. Sensory profile, drivers of liking, and influence of information on the acceptance of low-calorie synbiotic and probiotic chocolate ice cream. Journal of Food Science, v. 83, p. 1375-1385, 2018.
- Wang, B.S.; Wang, X.J.; Gong, L.K. (2009). The construction of a Williams design and randomization in cross-over clinical trials using SAS. Journal of statistical software, 29, 1-10.
- Lawless, H.; Heymann, H. Sensory evaluation Techniques. Academic Press. 2013. 419p.
- Ares, G., Tarrega, A. Izquerdo, L., Jaeguer, S.; Investigation of the number of consumers necessary to obtain stable sample and descriptor configurations from check-all-that-apply (CATA) questions. Food Quality and Preference. 31 (2014) 135–141.
- Souza Lima, R.; Medeiros, A.; Bolini, H.M.A. International Journal of Food Science and Technology. 2021,56, 3055–3065.
Figure 1.
Ideal analysis for the set of six samples. 1 = much less than ideal, 2 = less than ideal, 3 = ideal, 4 = more than ideal, 5 = much more than ideal.
Figure 1.
Ideal analysis for the set of six samples. 1 = much less than ideal, 2 = less than ideal, 3 = ideal, 4 = more than ideal, 5 = much more than ideal.
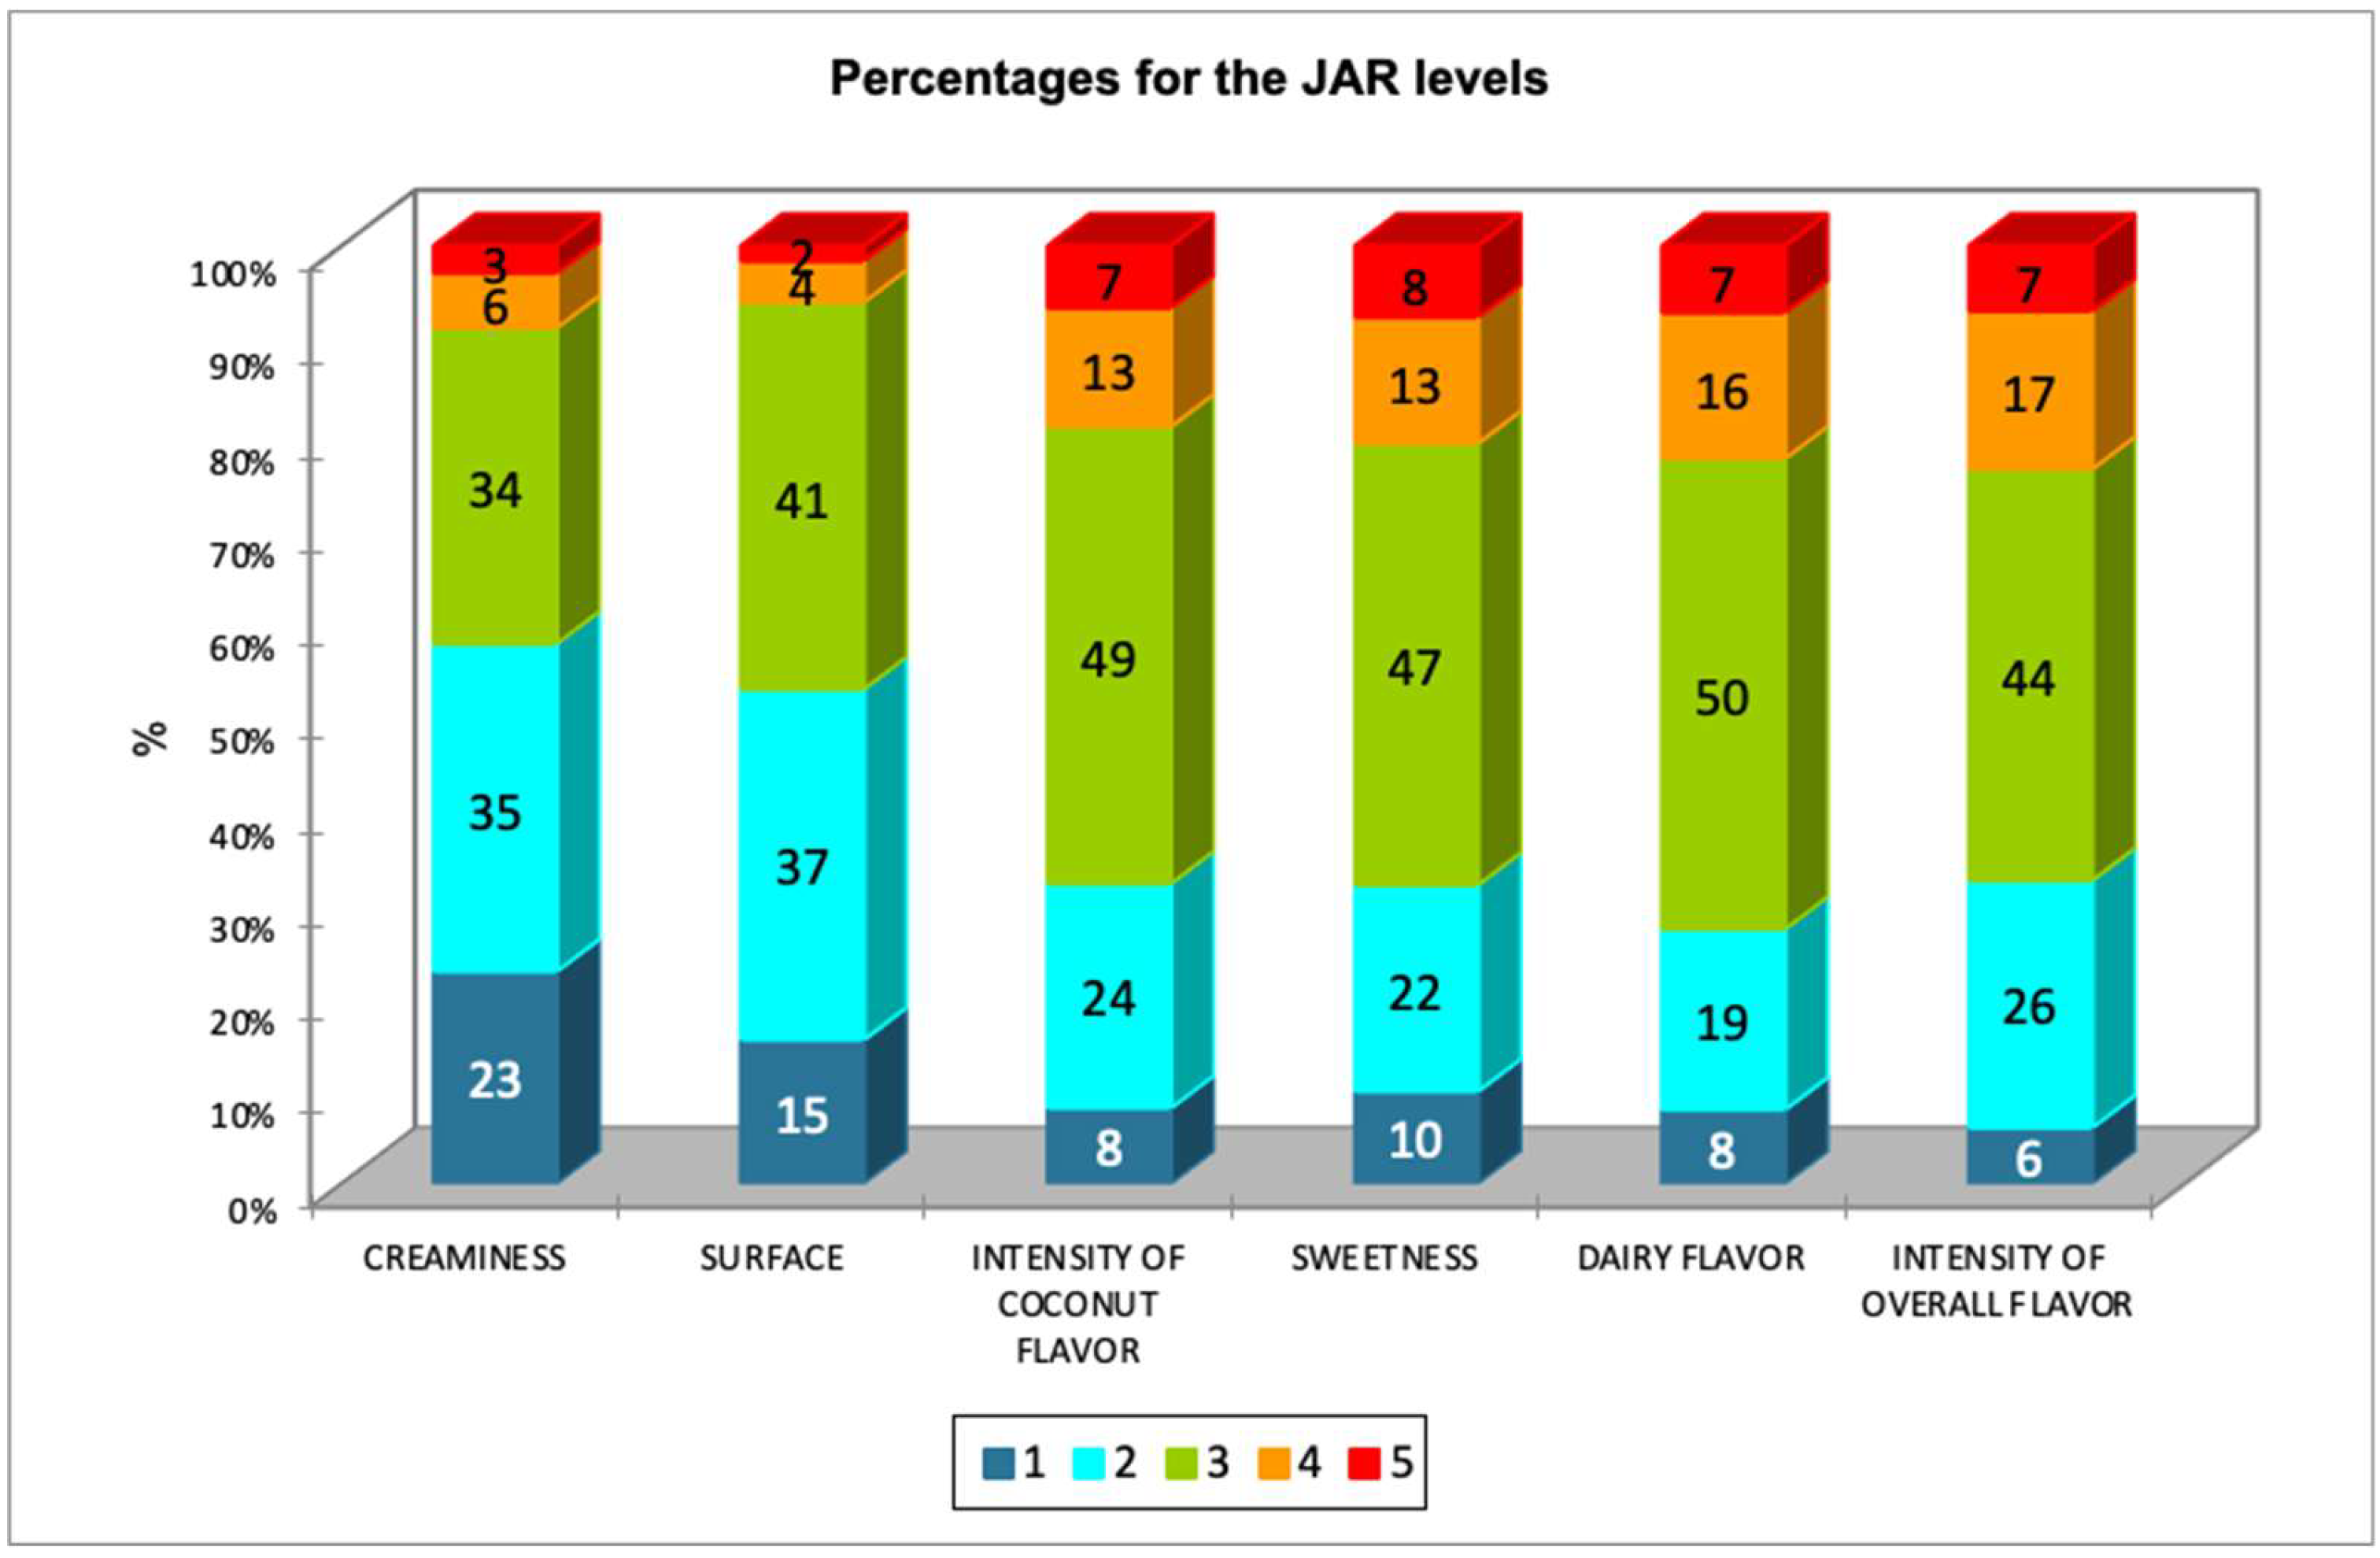
Figure 2.
Consumer acceptance.
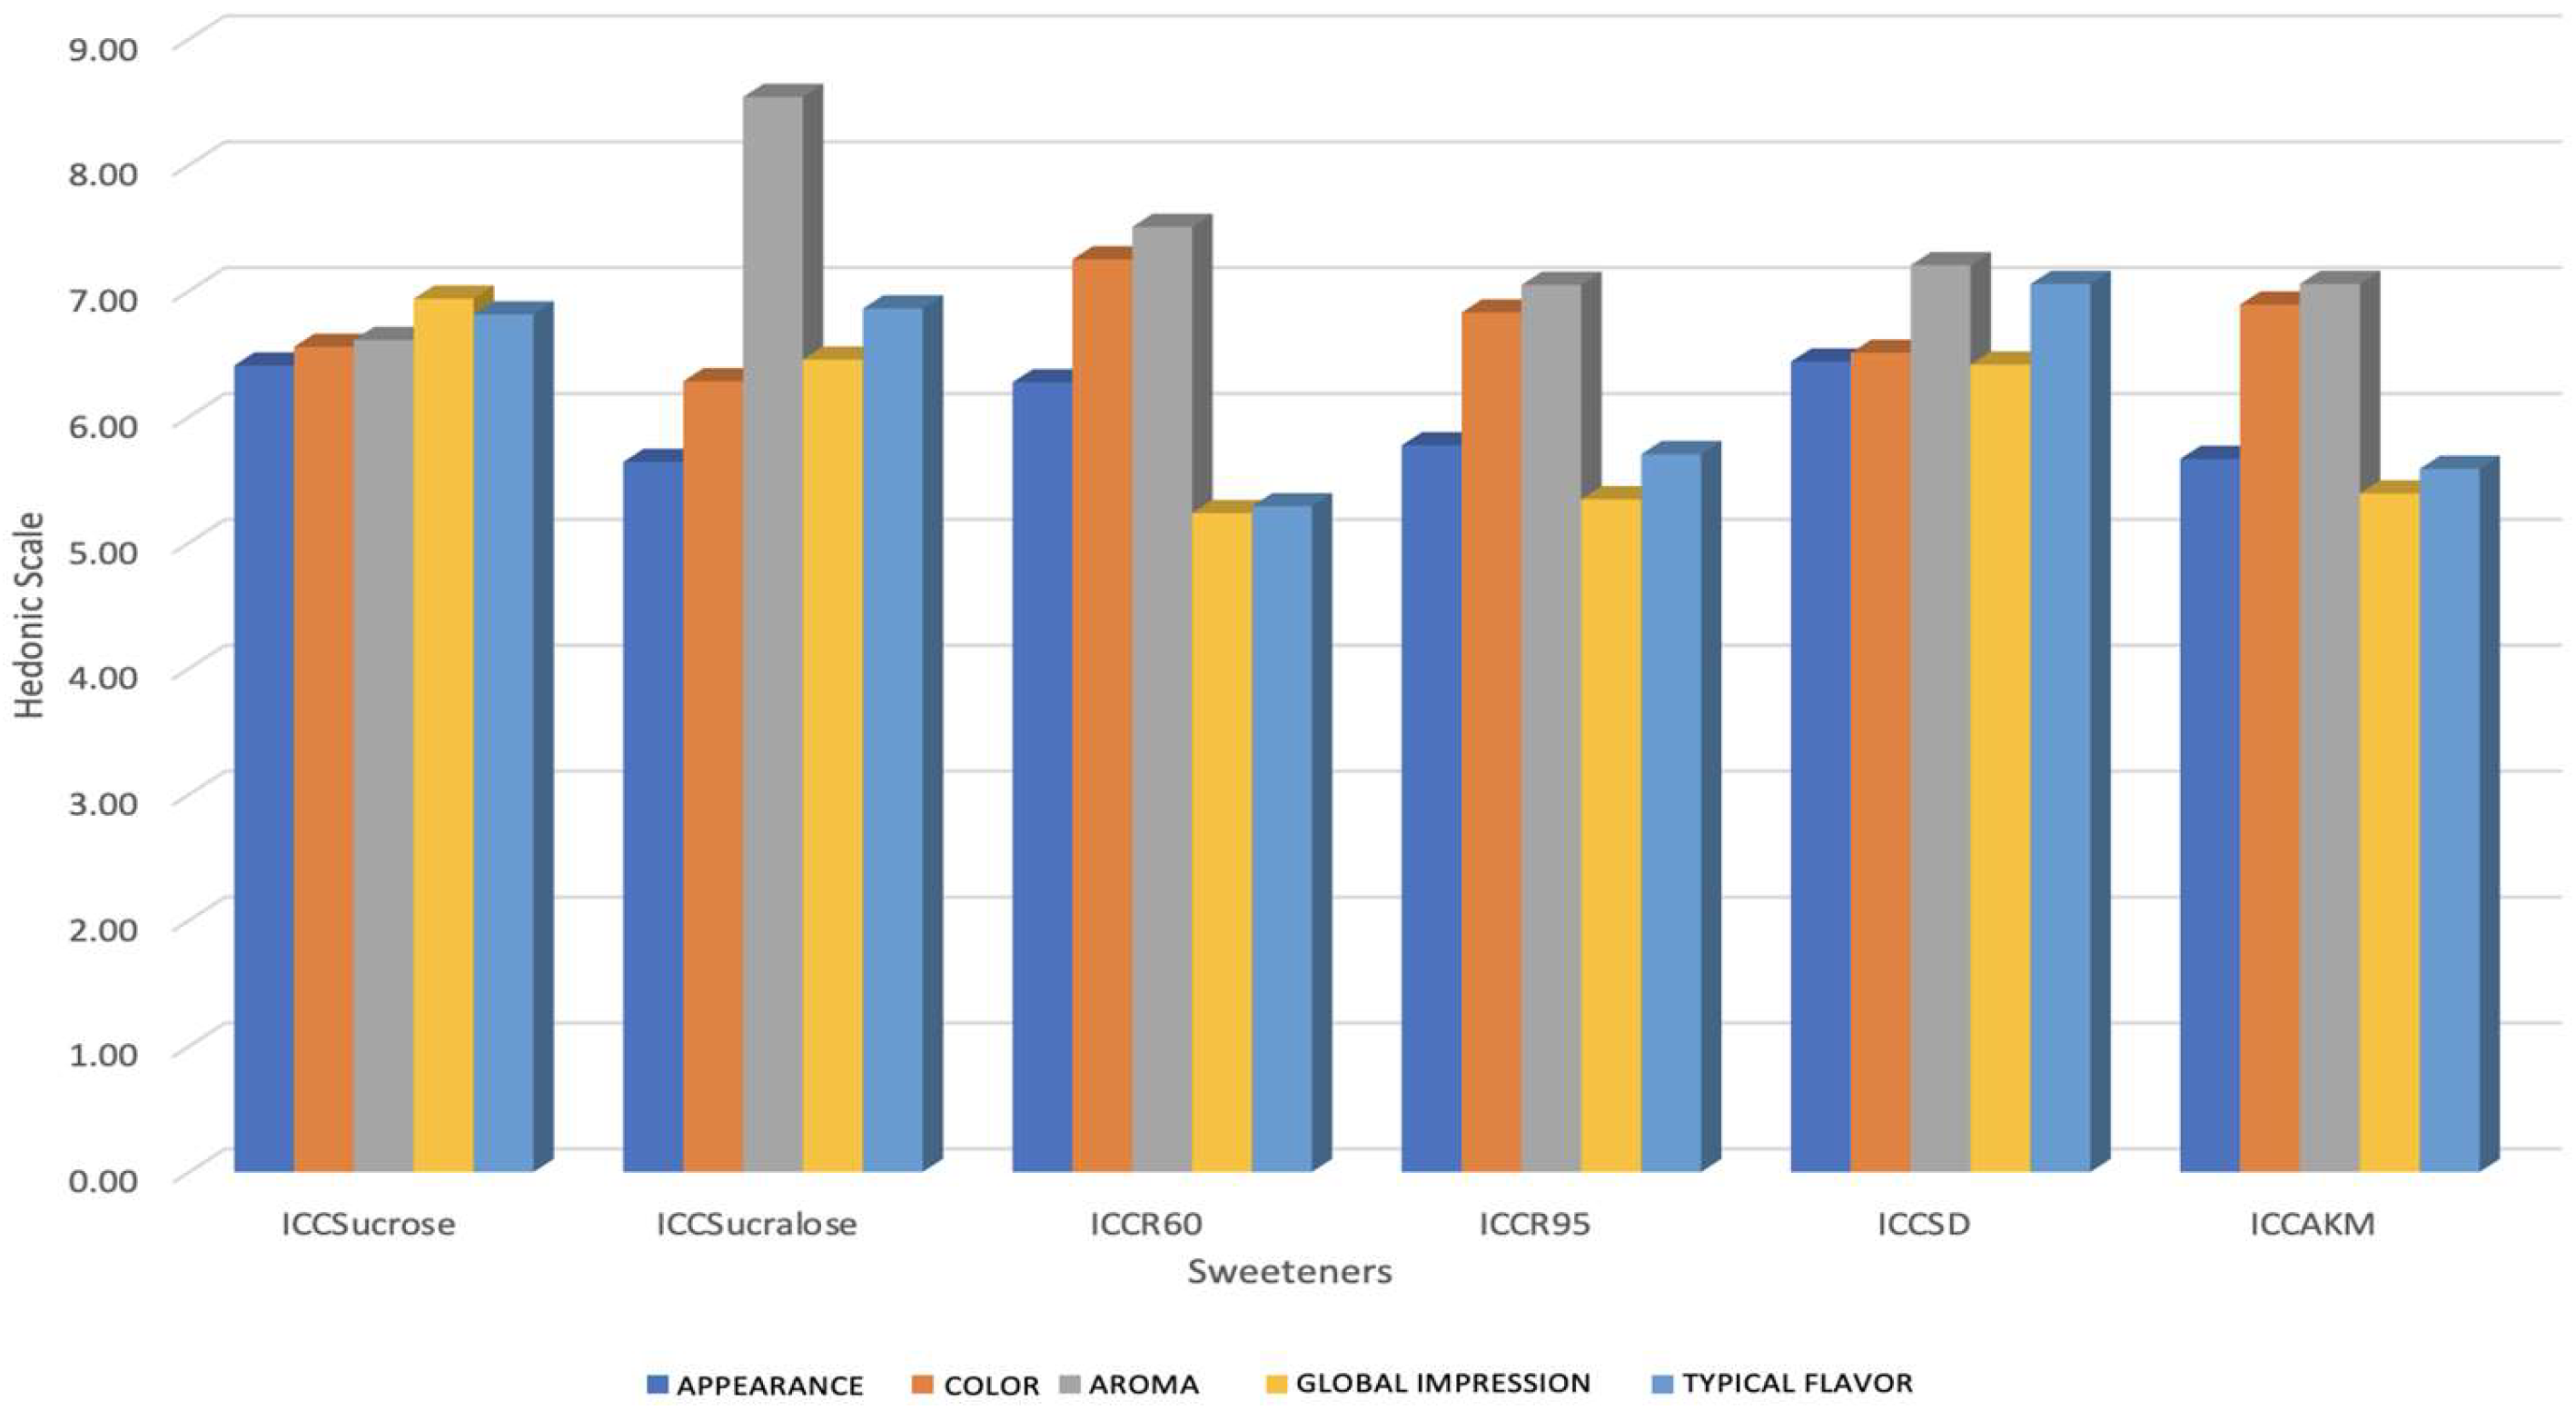
Figure 4.
Dendrogram of consumer preference groupings by Hierarchical Cluster Analysis.
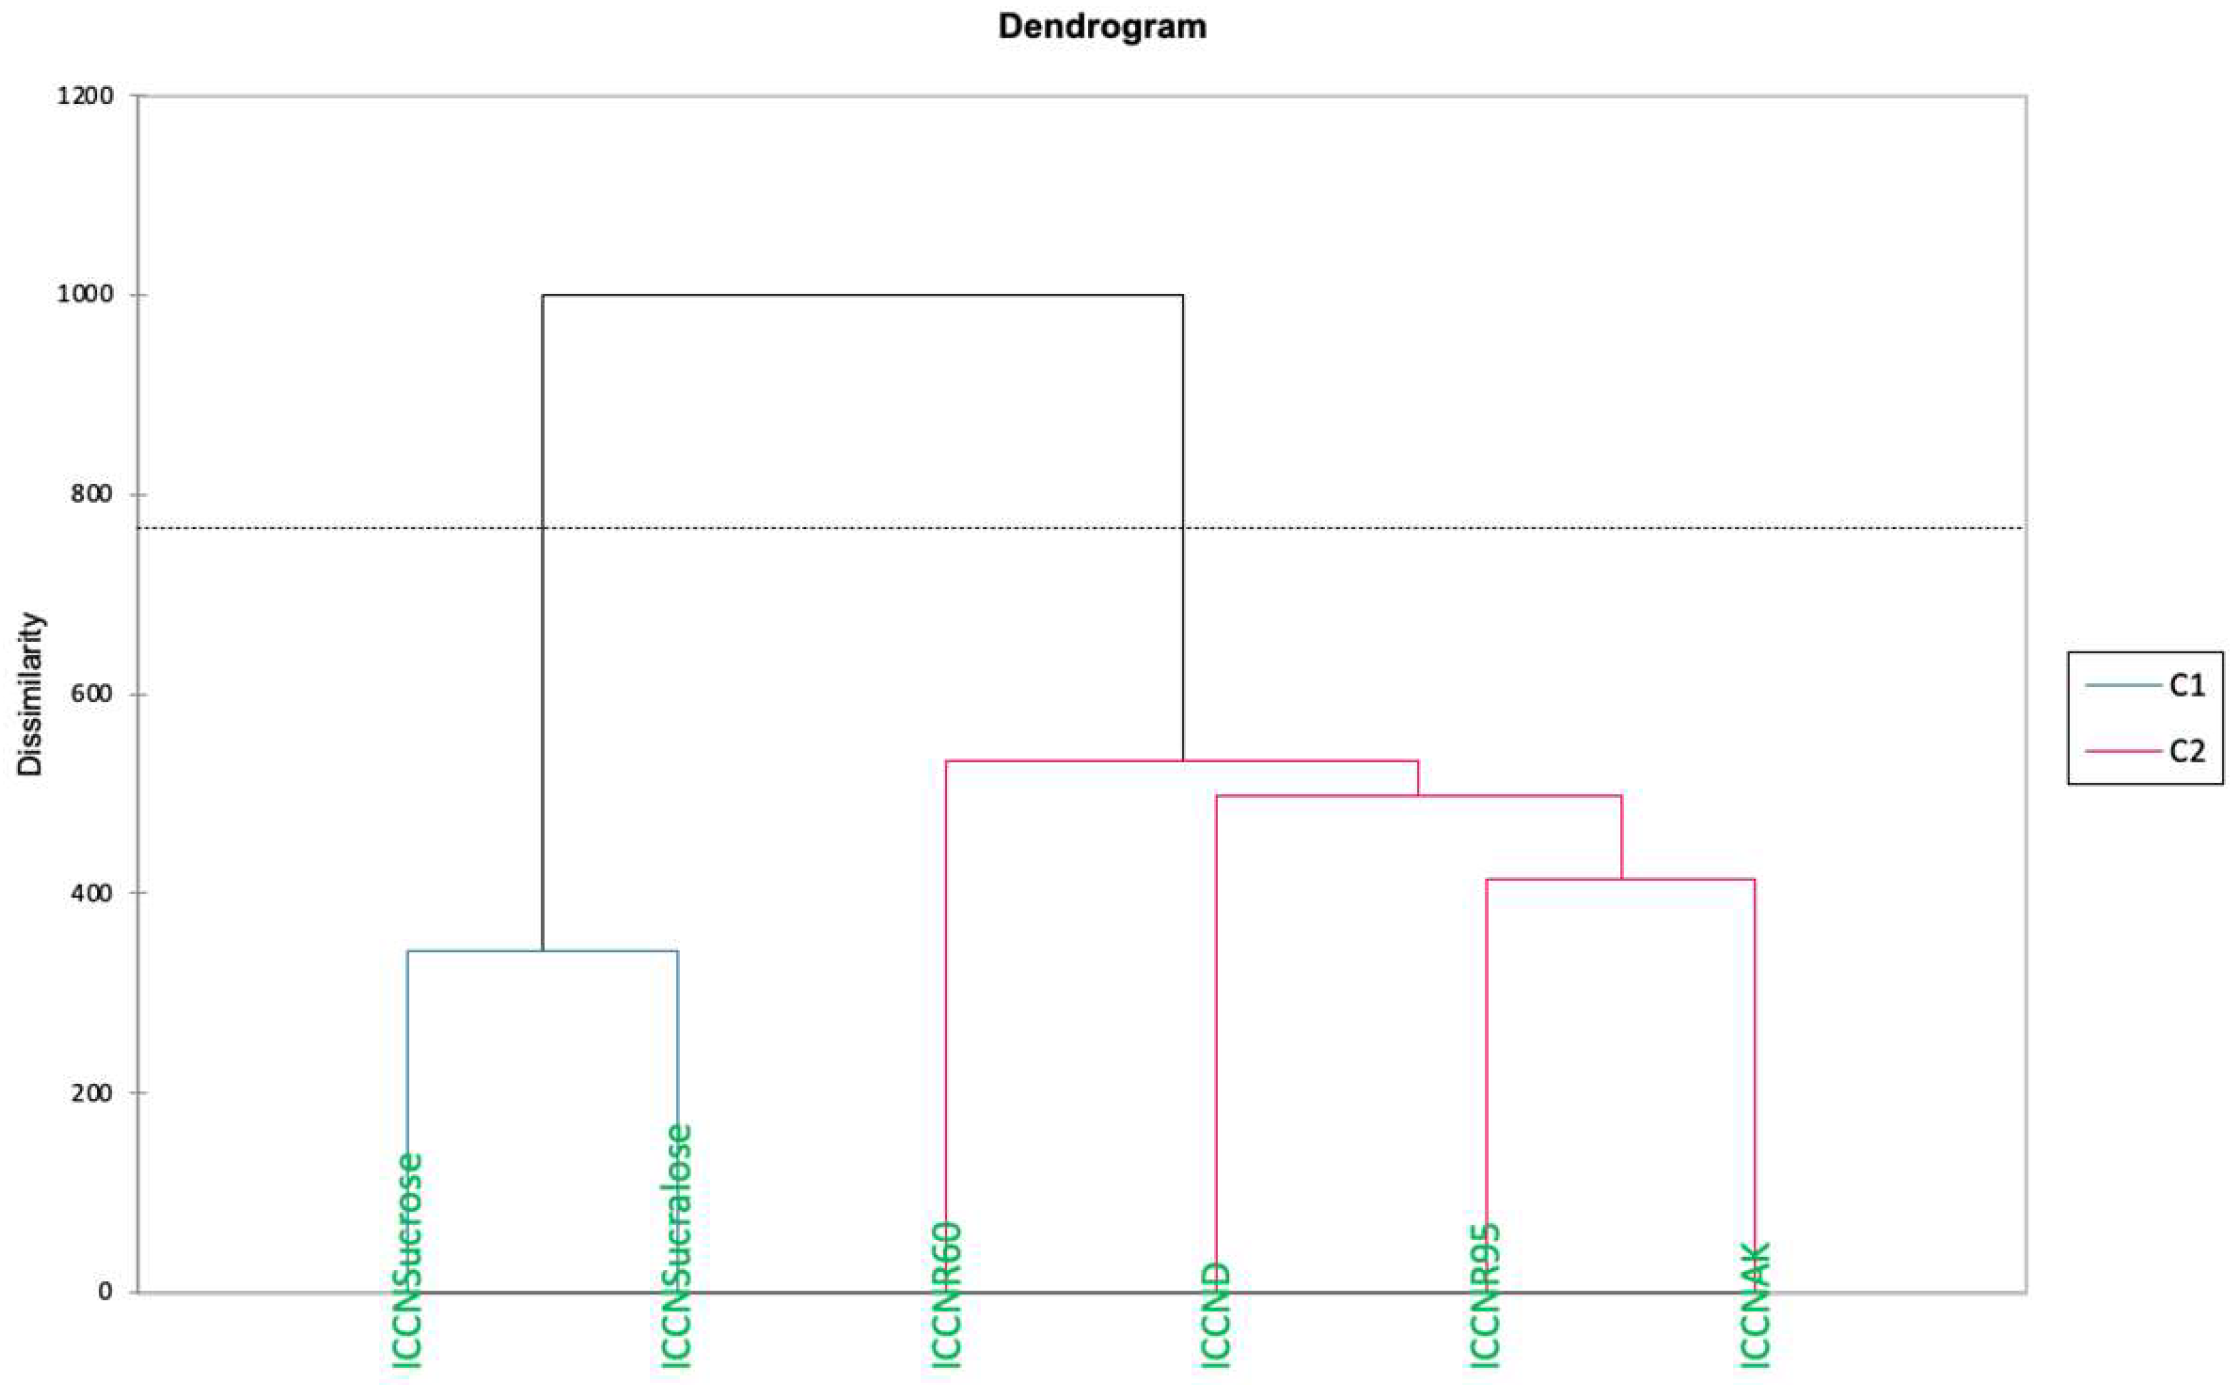
Figure 5.
Results of CATA test.
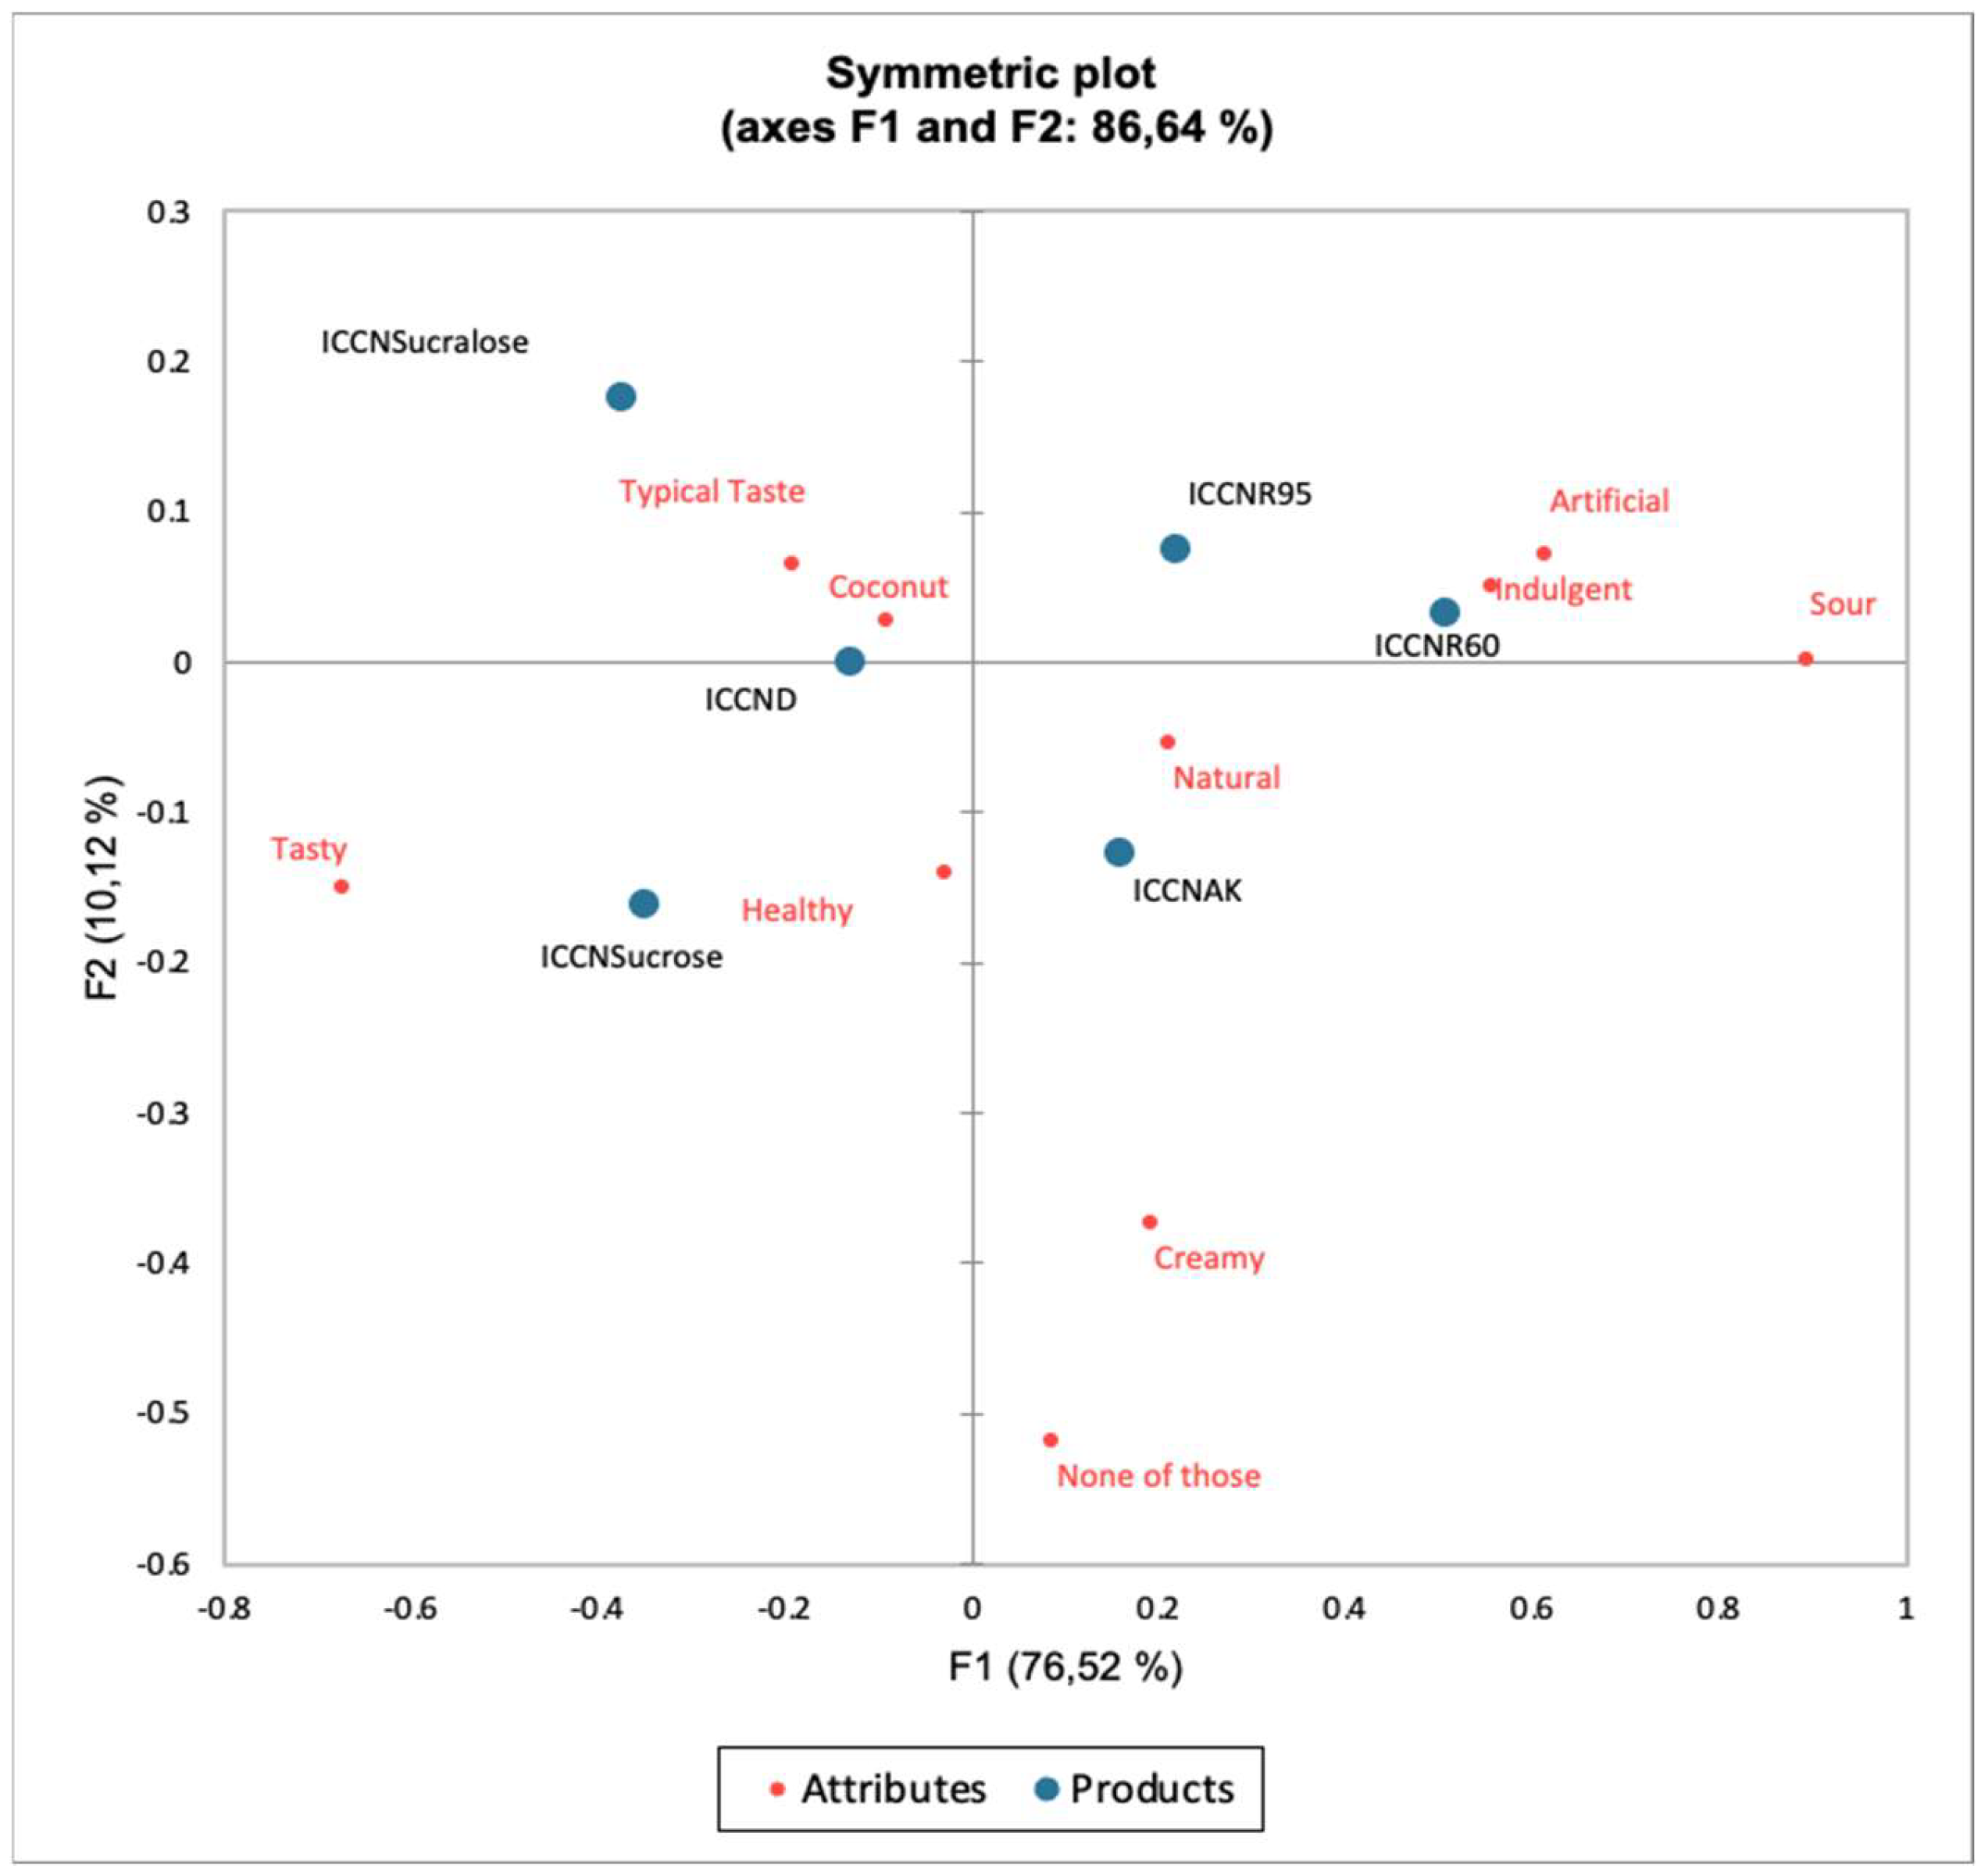
Figure 6.
Location of the overall impression close to the characteristics of greatest impact on acceptance for consumers.
Figure 6.
Location of the overall impression close to the characteristics of greatest impact on acceptance for consumers.
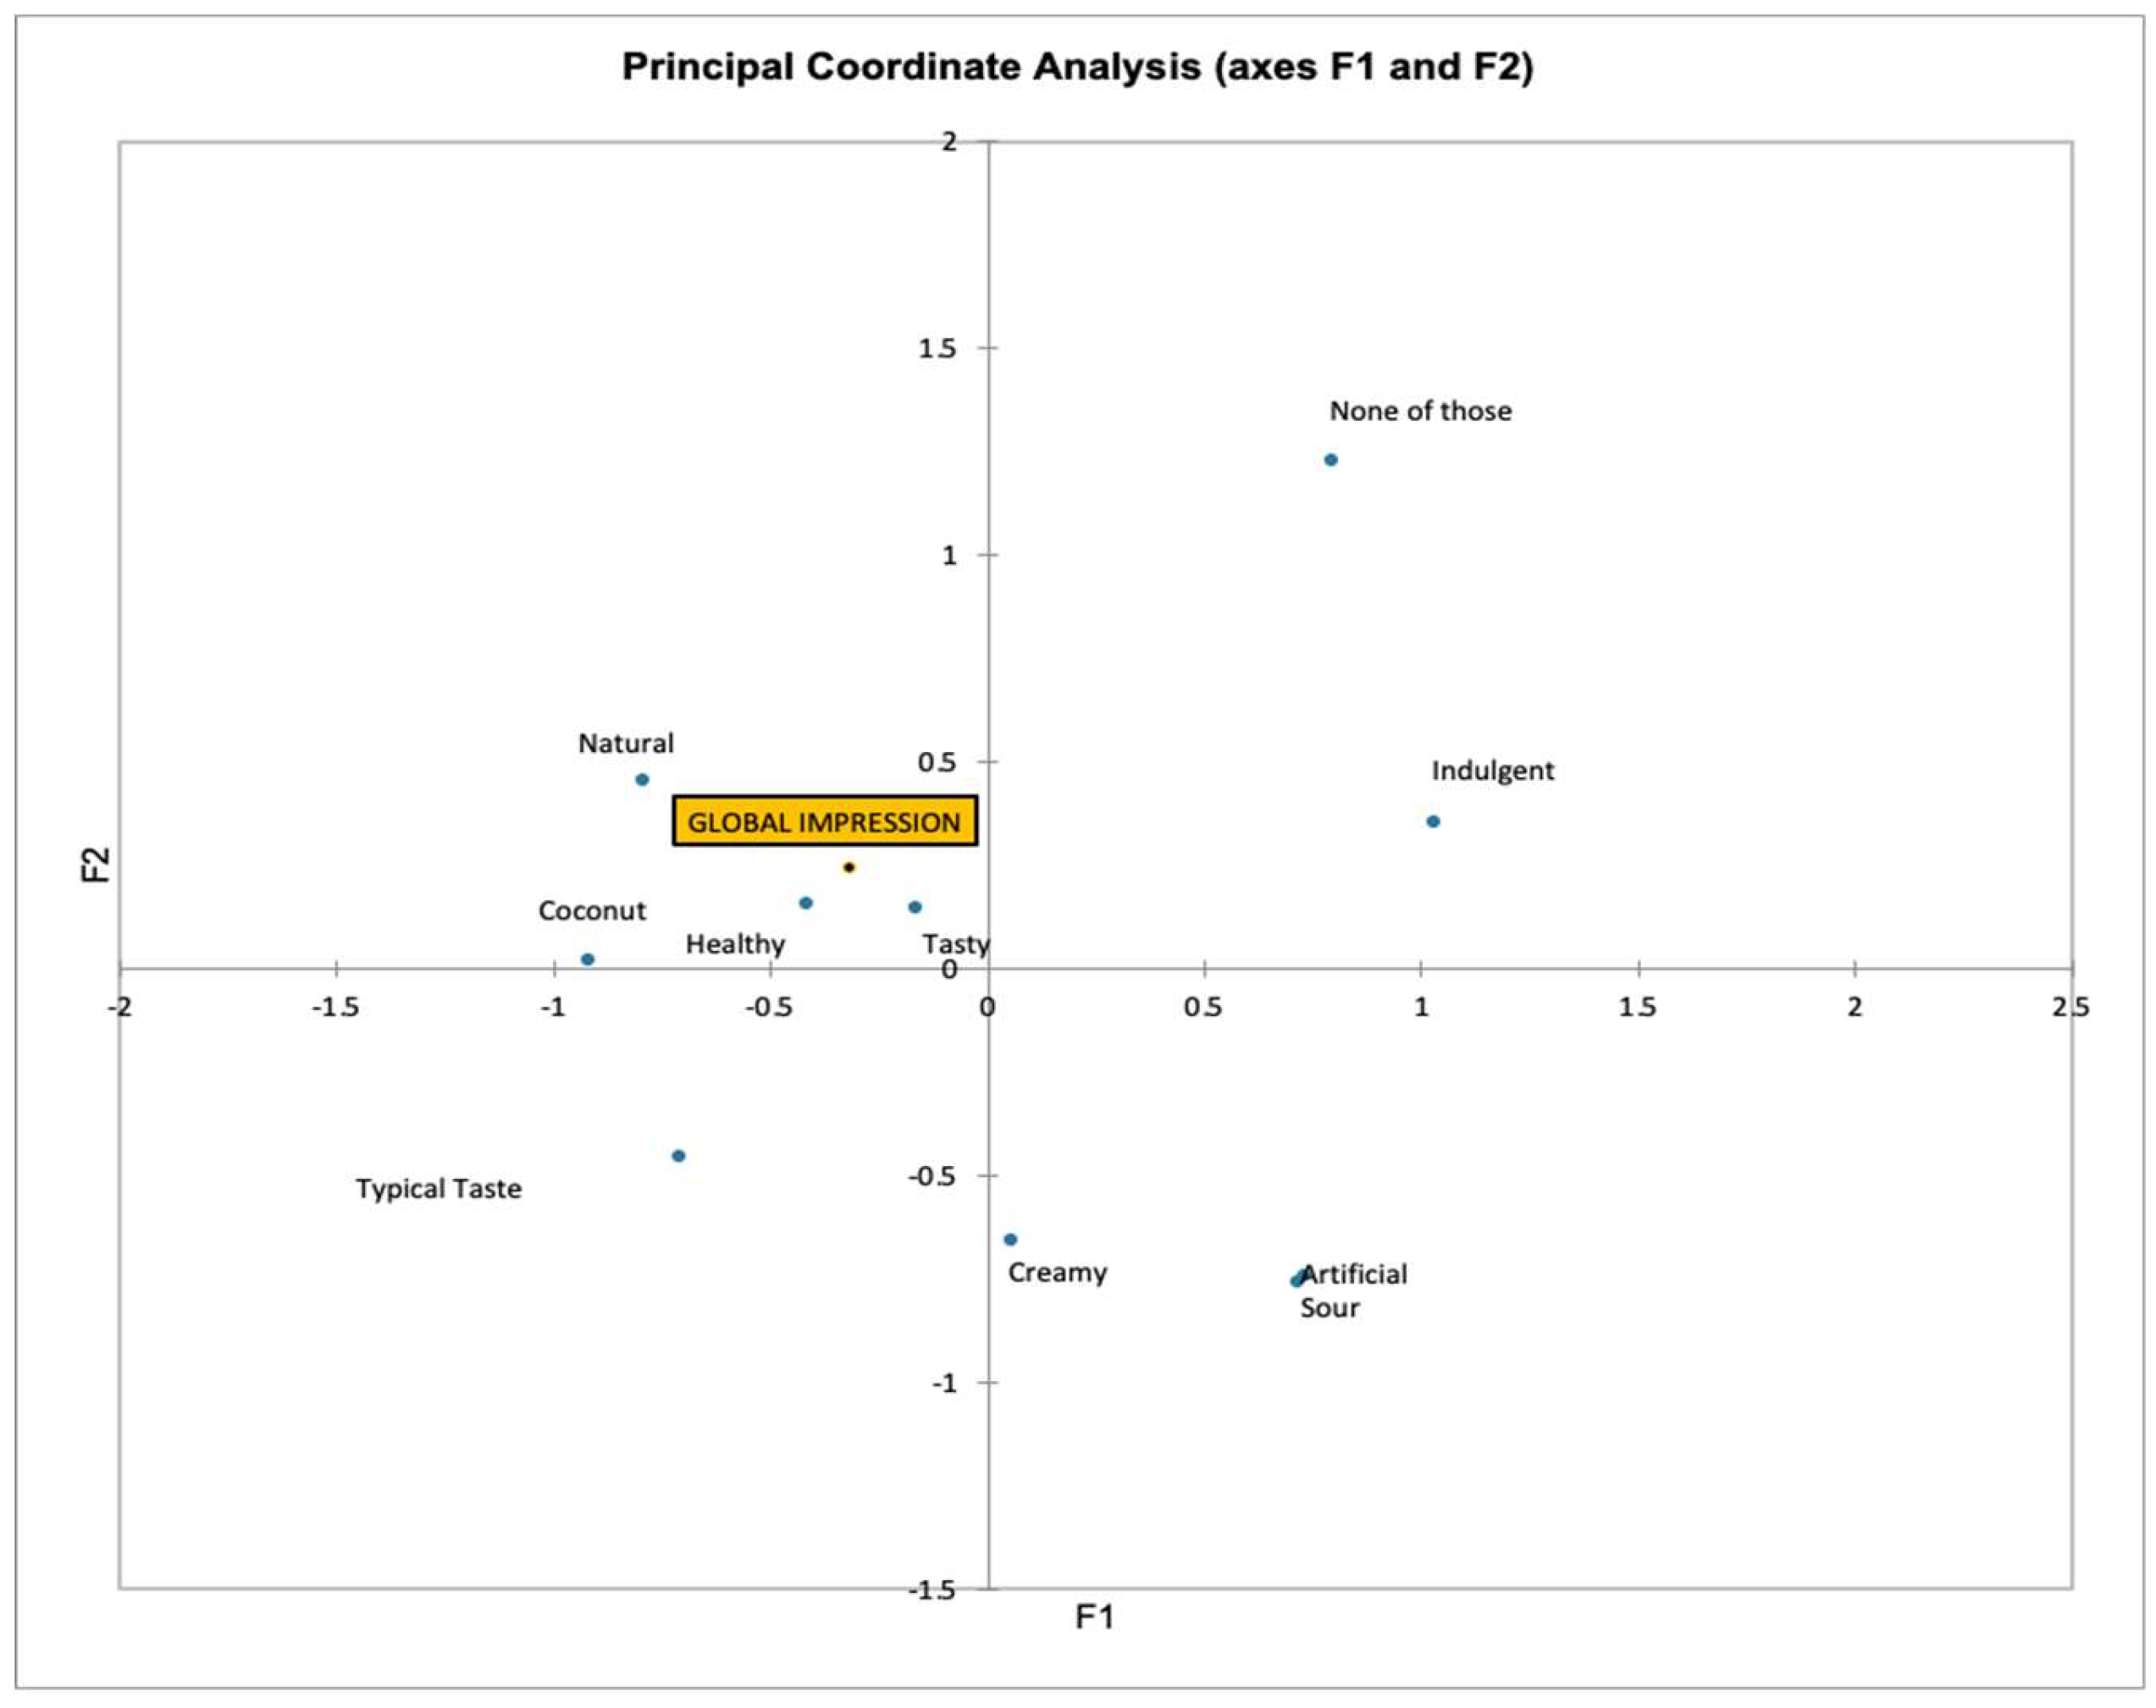
Figure 7.
Variables of greater impact on the average overall impression of the samples.
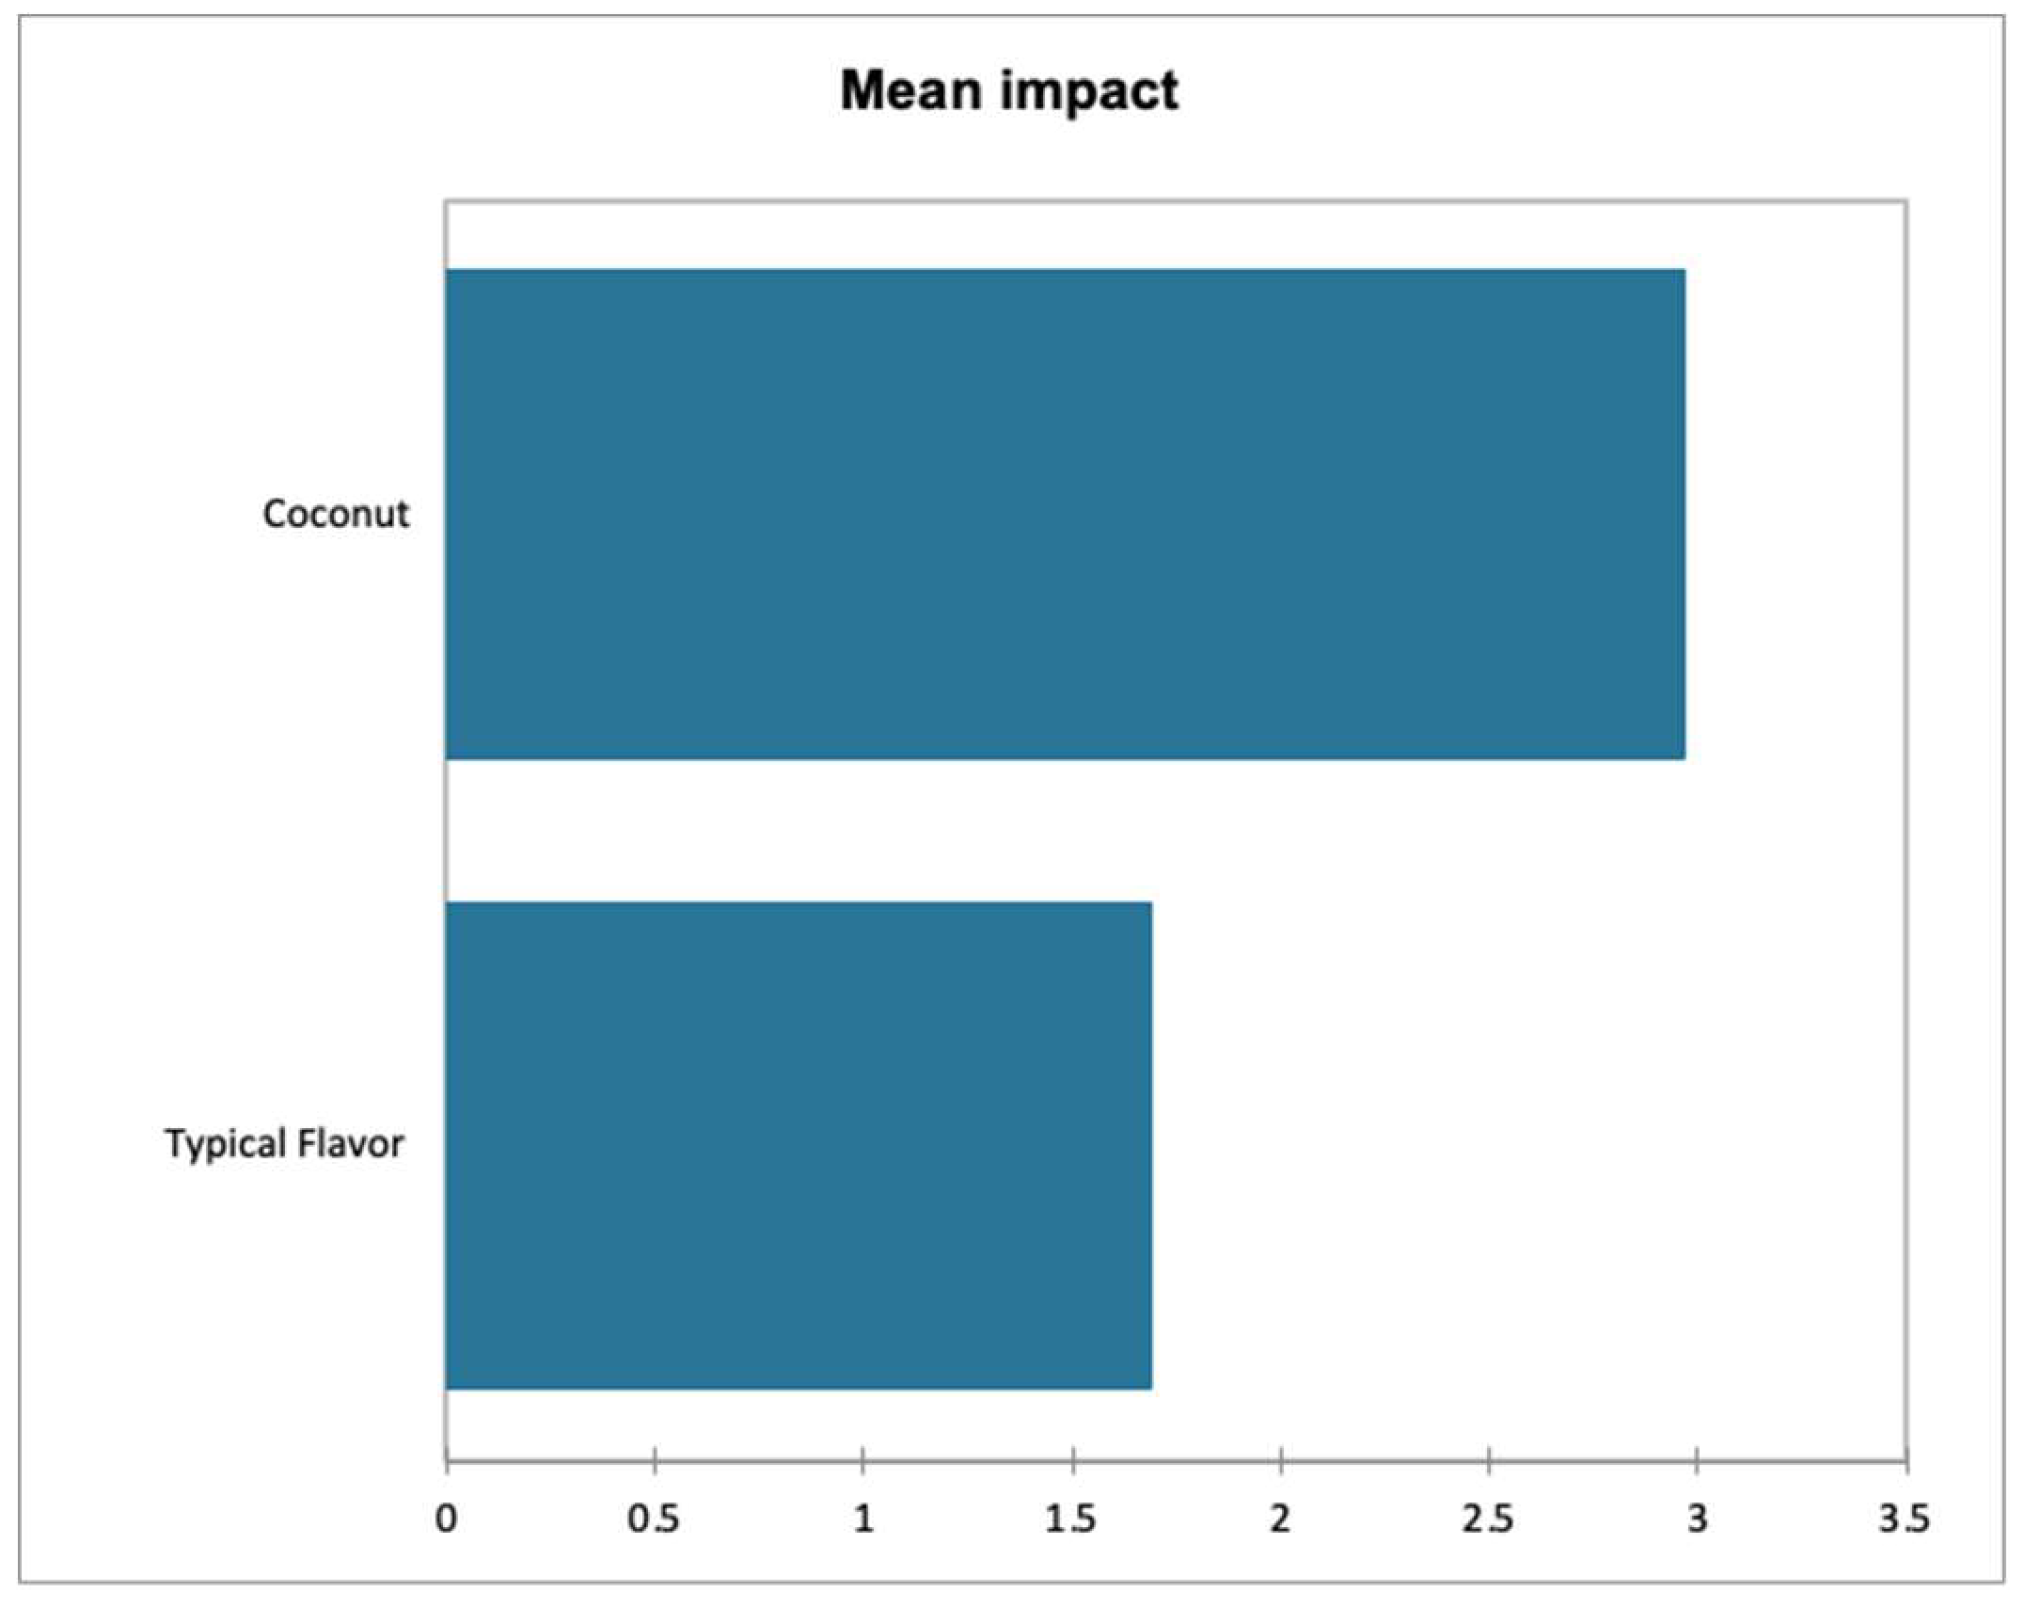
Figure 8.
Variables and impact on the acceptance of the samples.
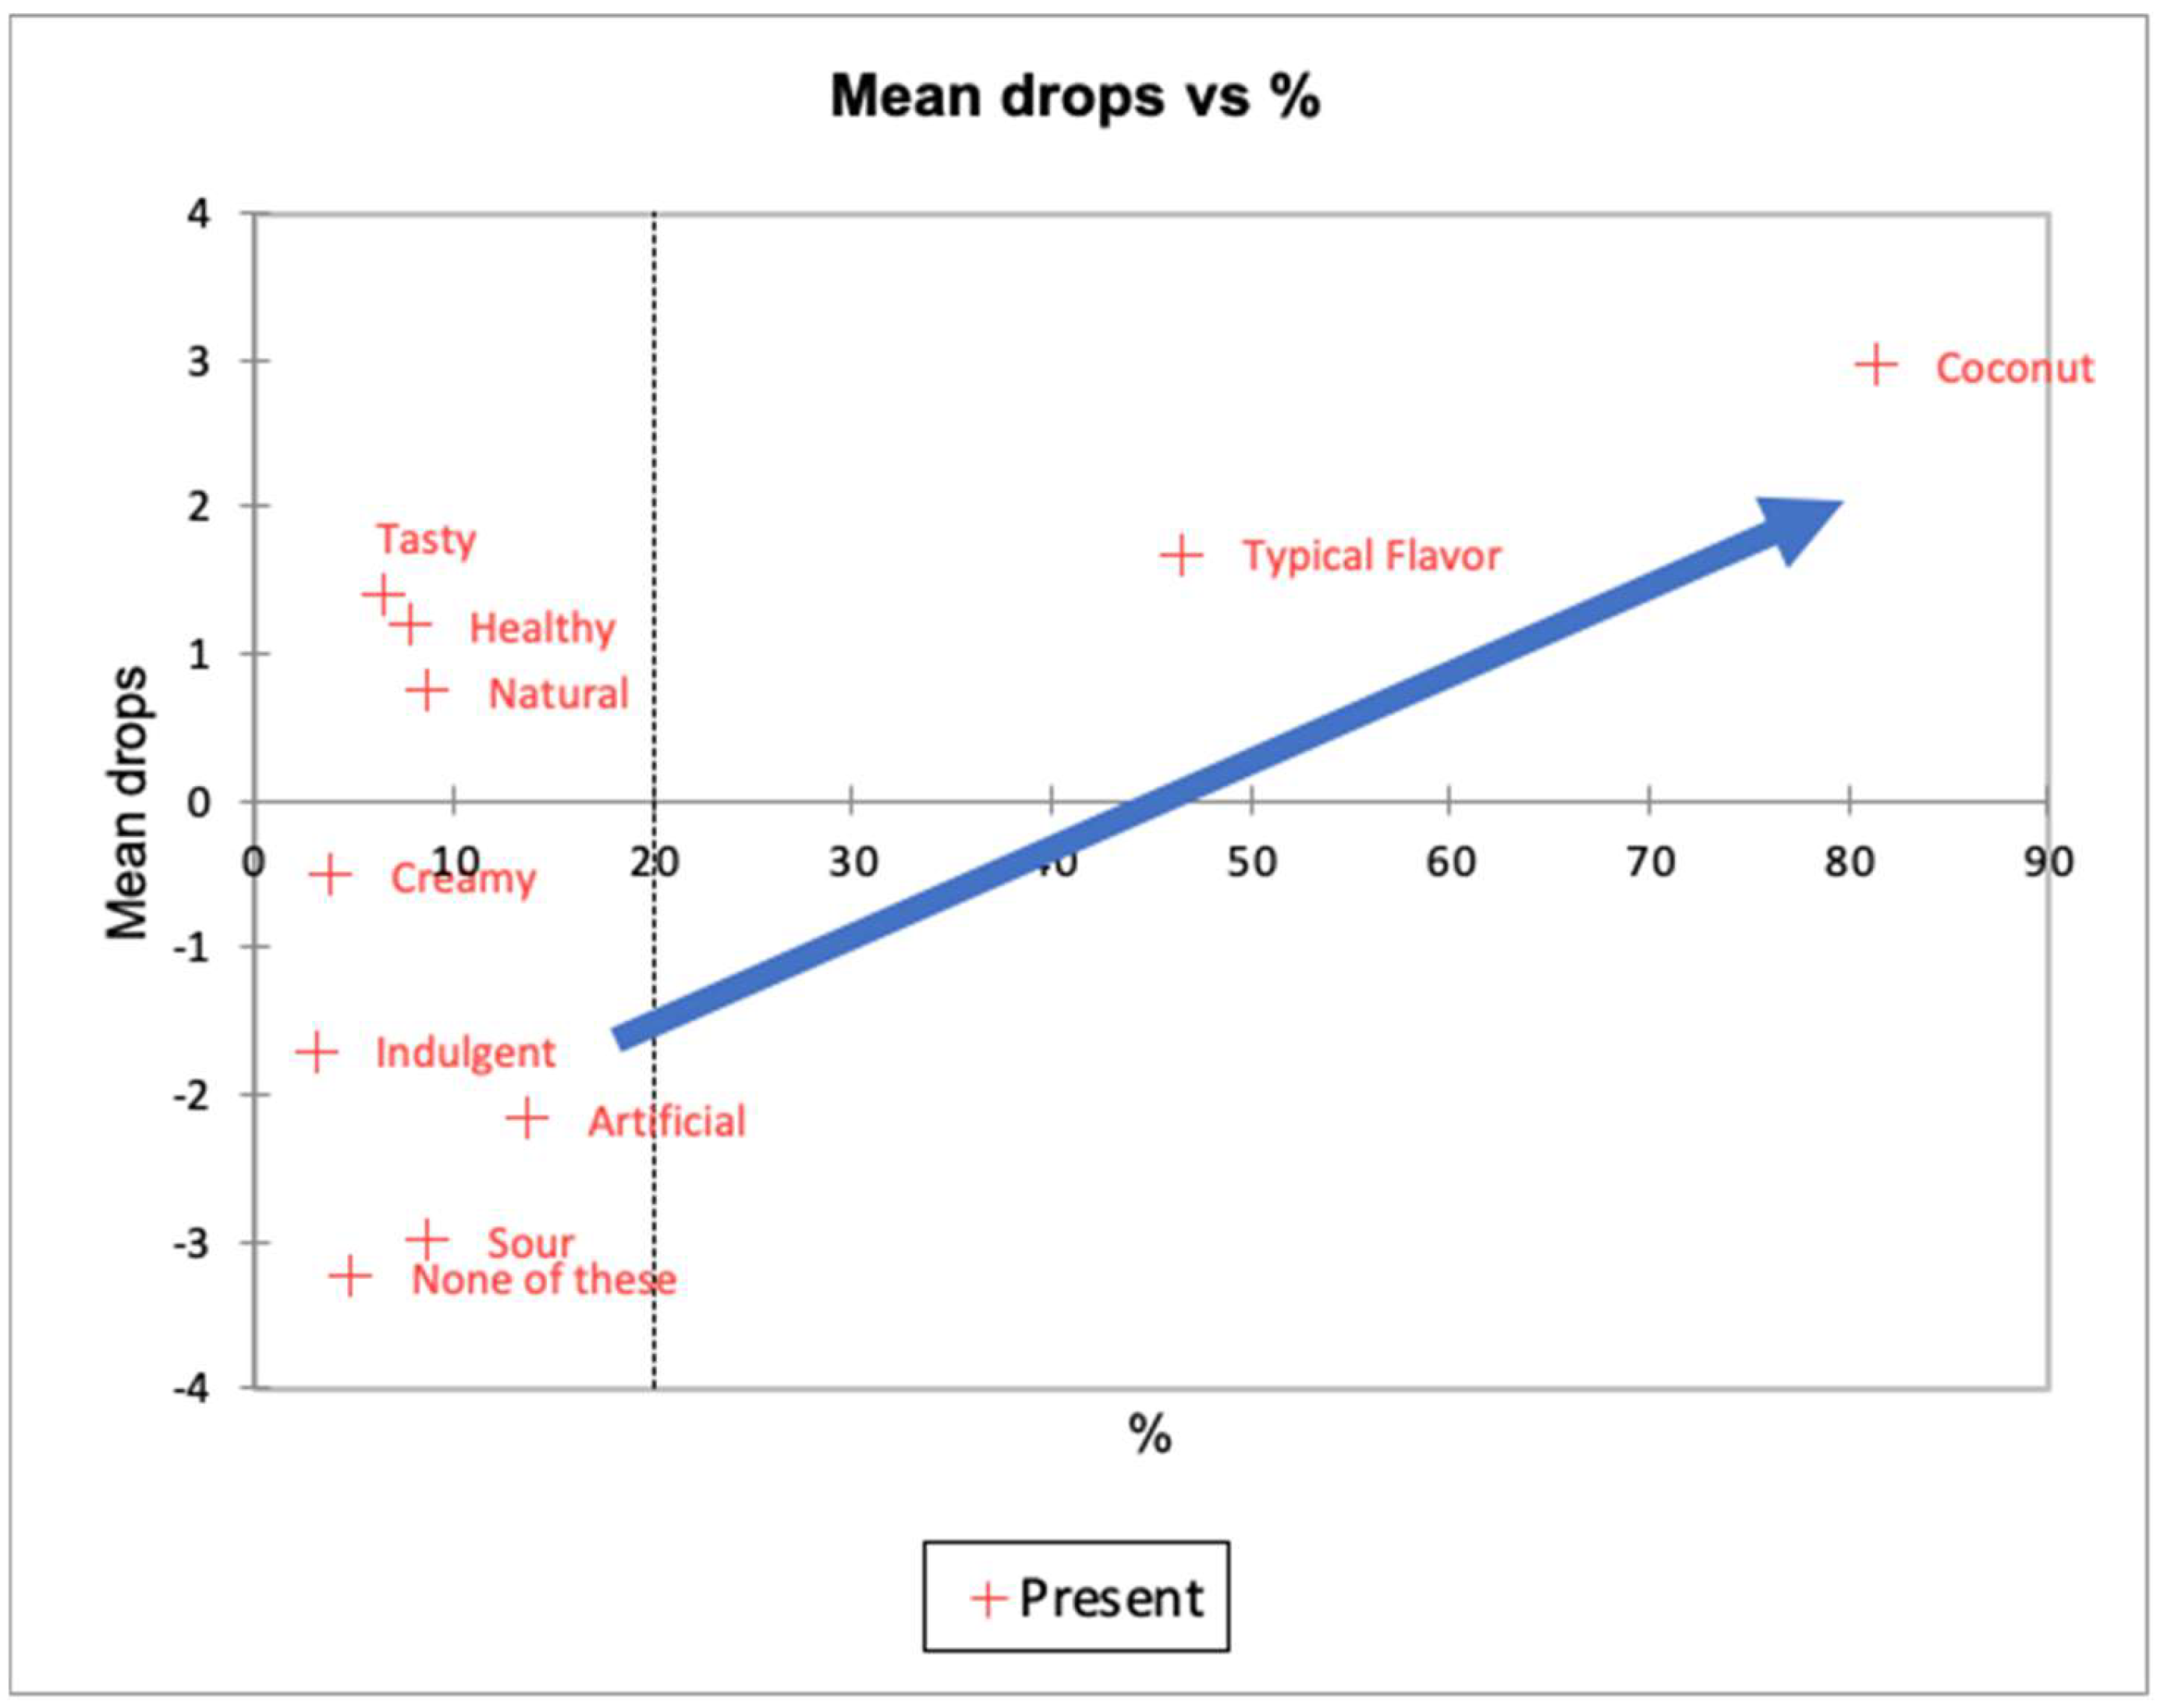
Figure 9.
Results of the CATA test.
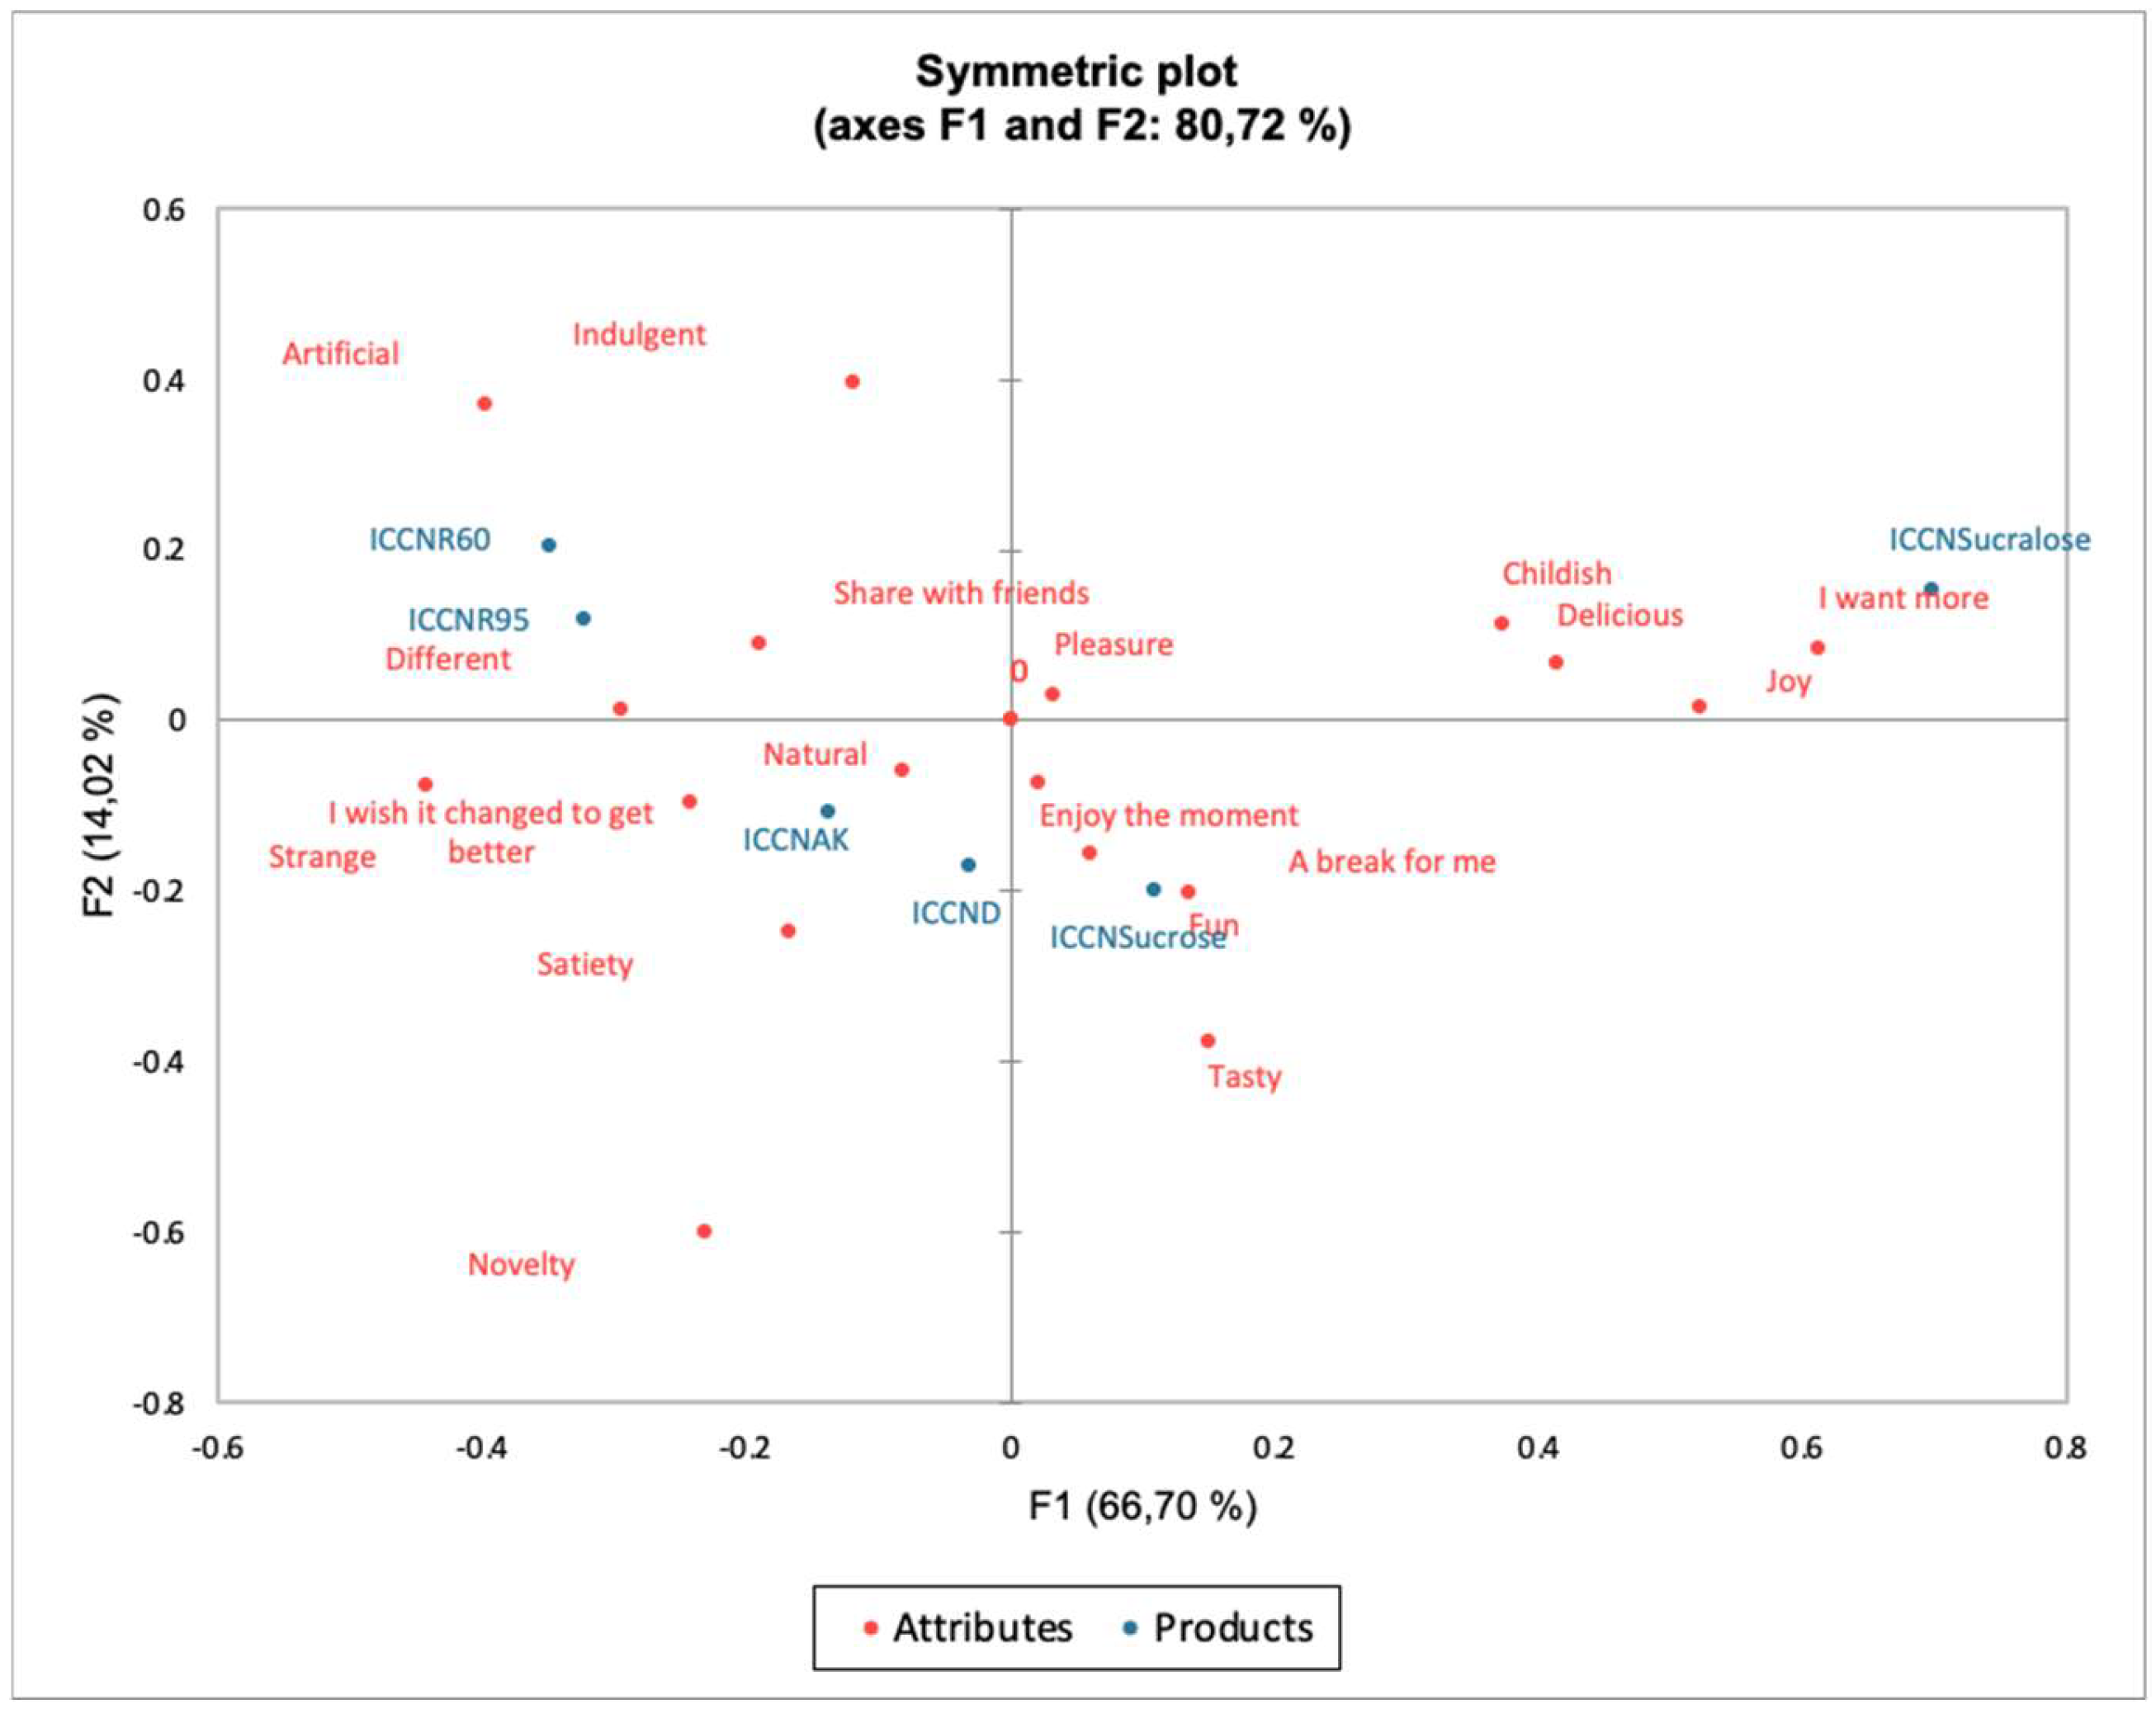
Figure 10.
Variables of greater impact on the average overall impression of the samples.
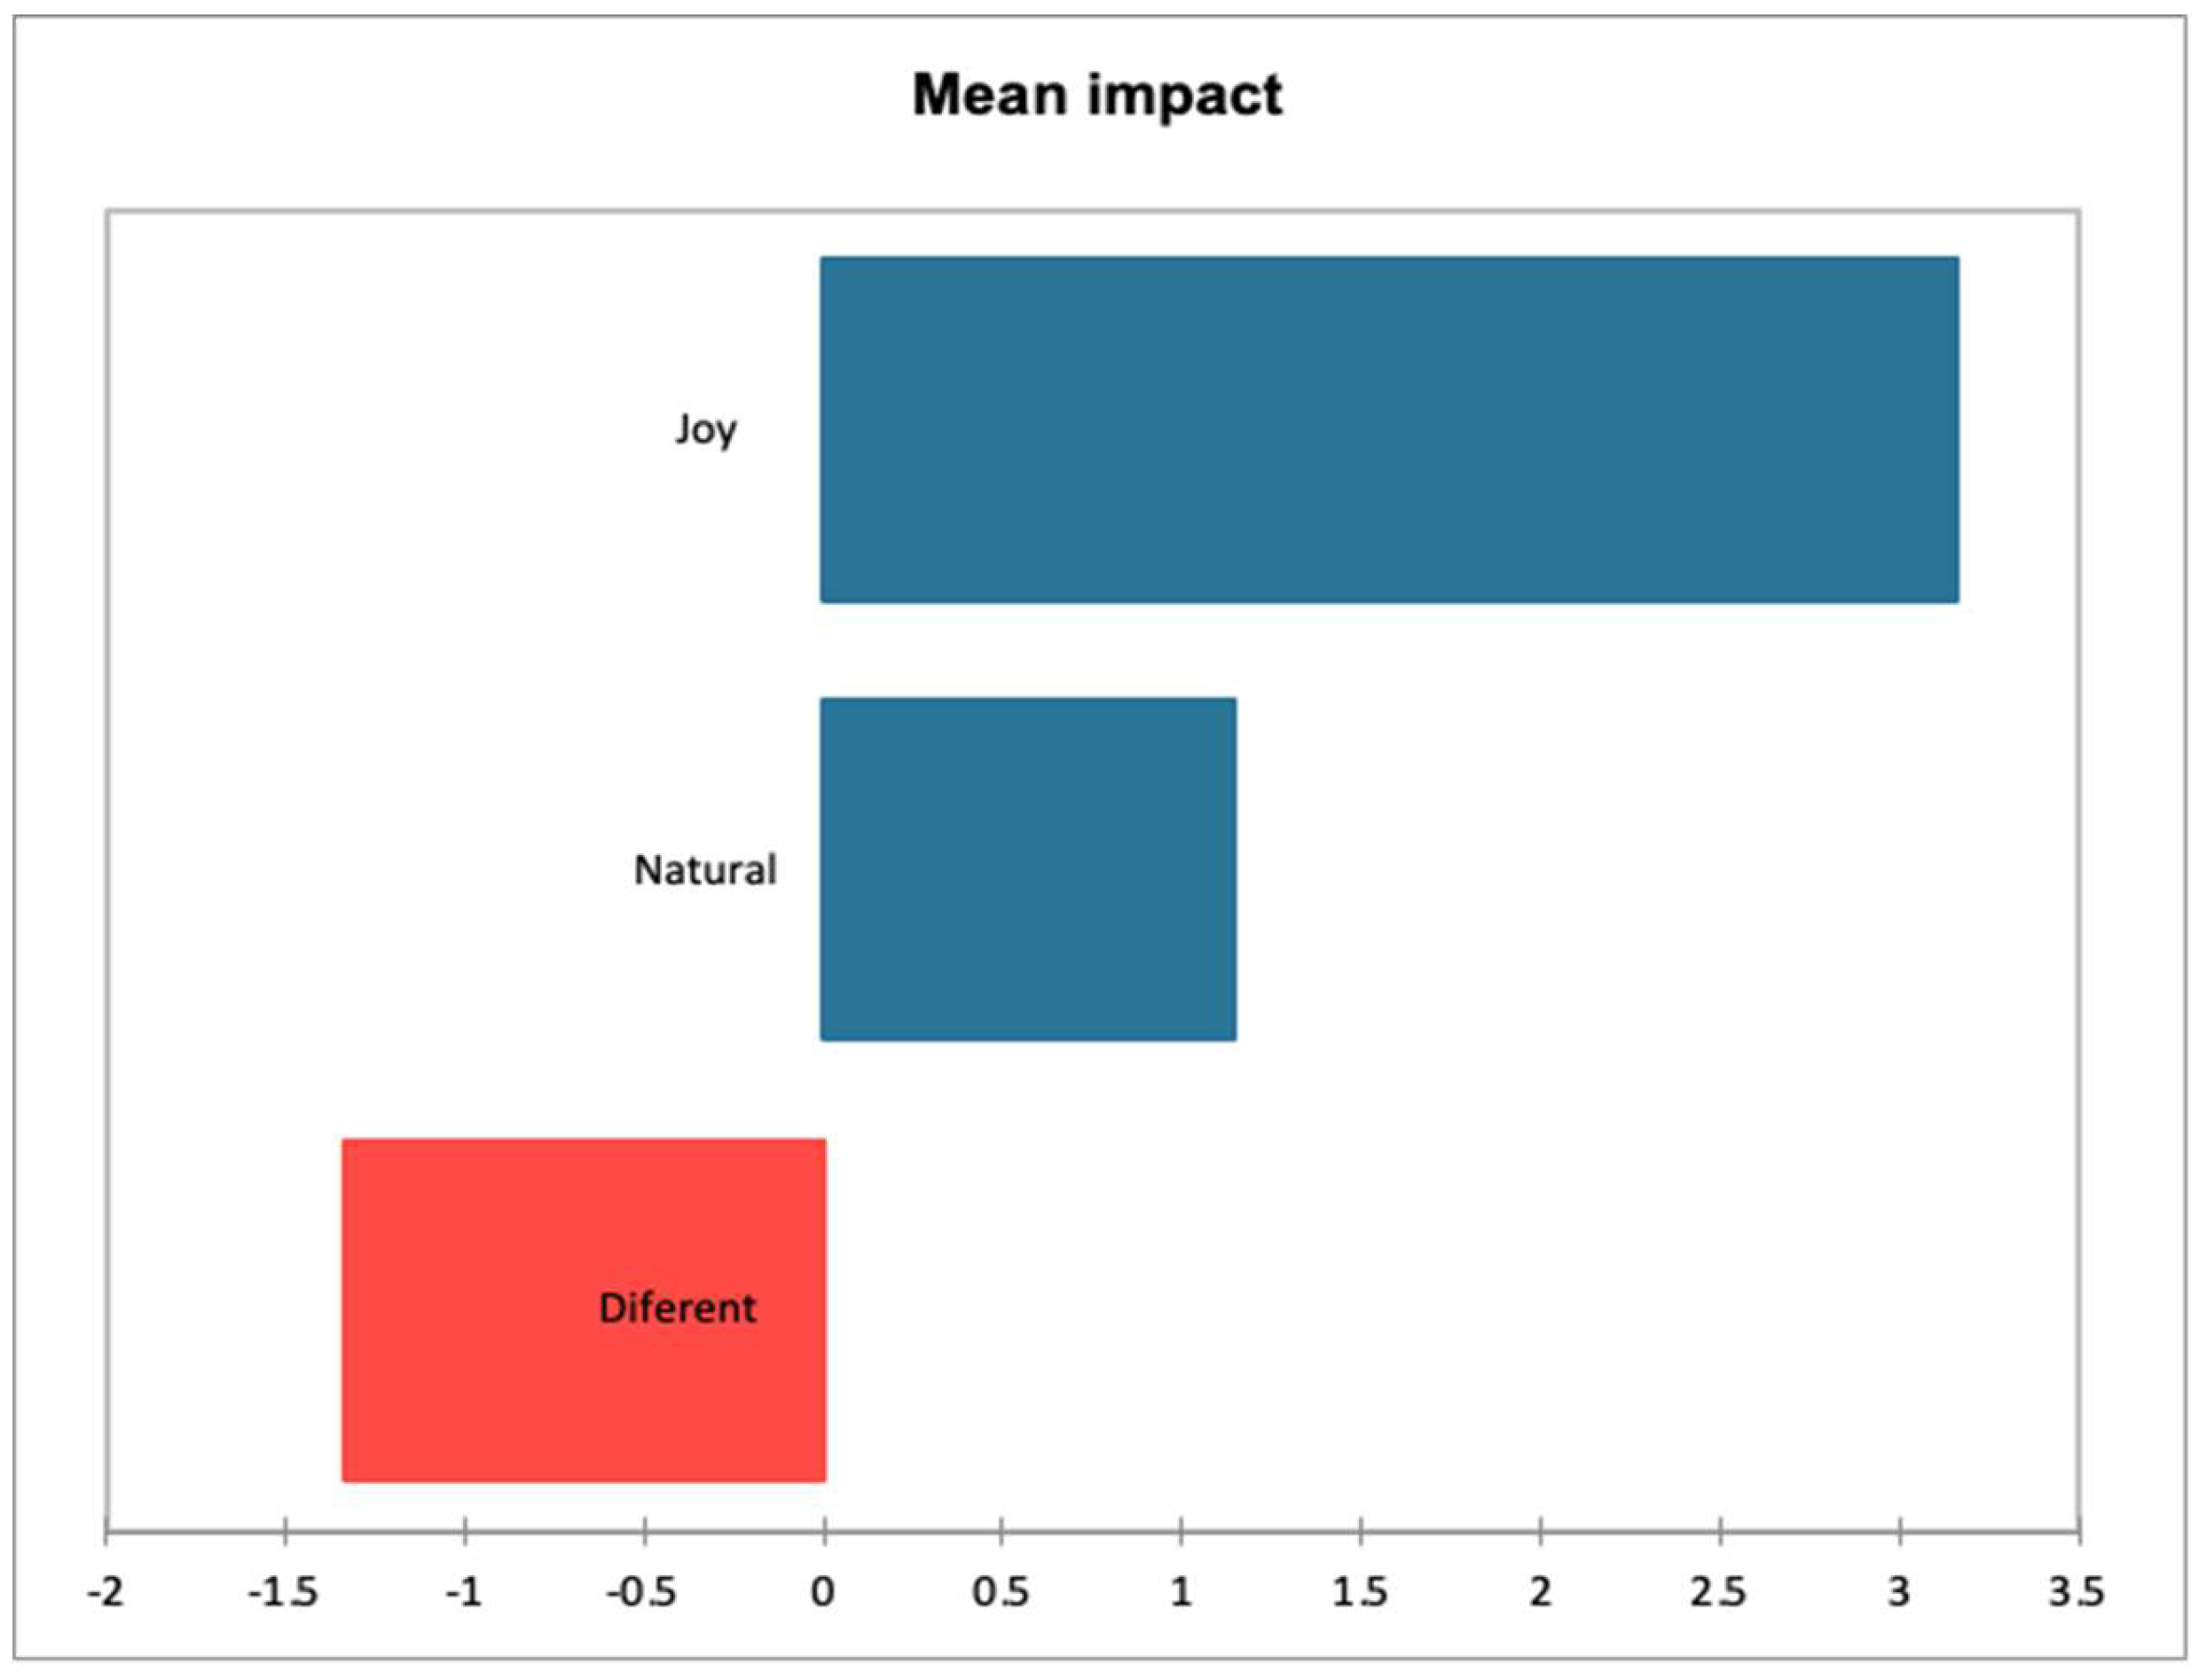
Figure 11.
Variables and the impact on the acceptance of the samples.
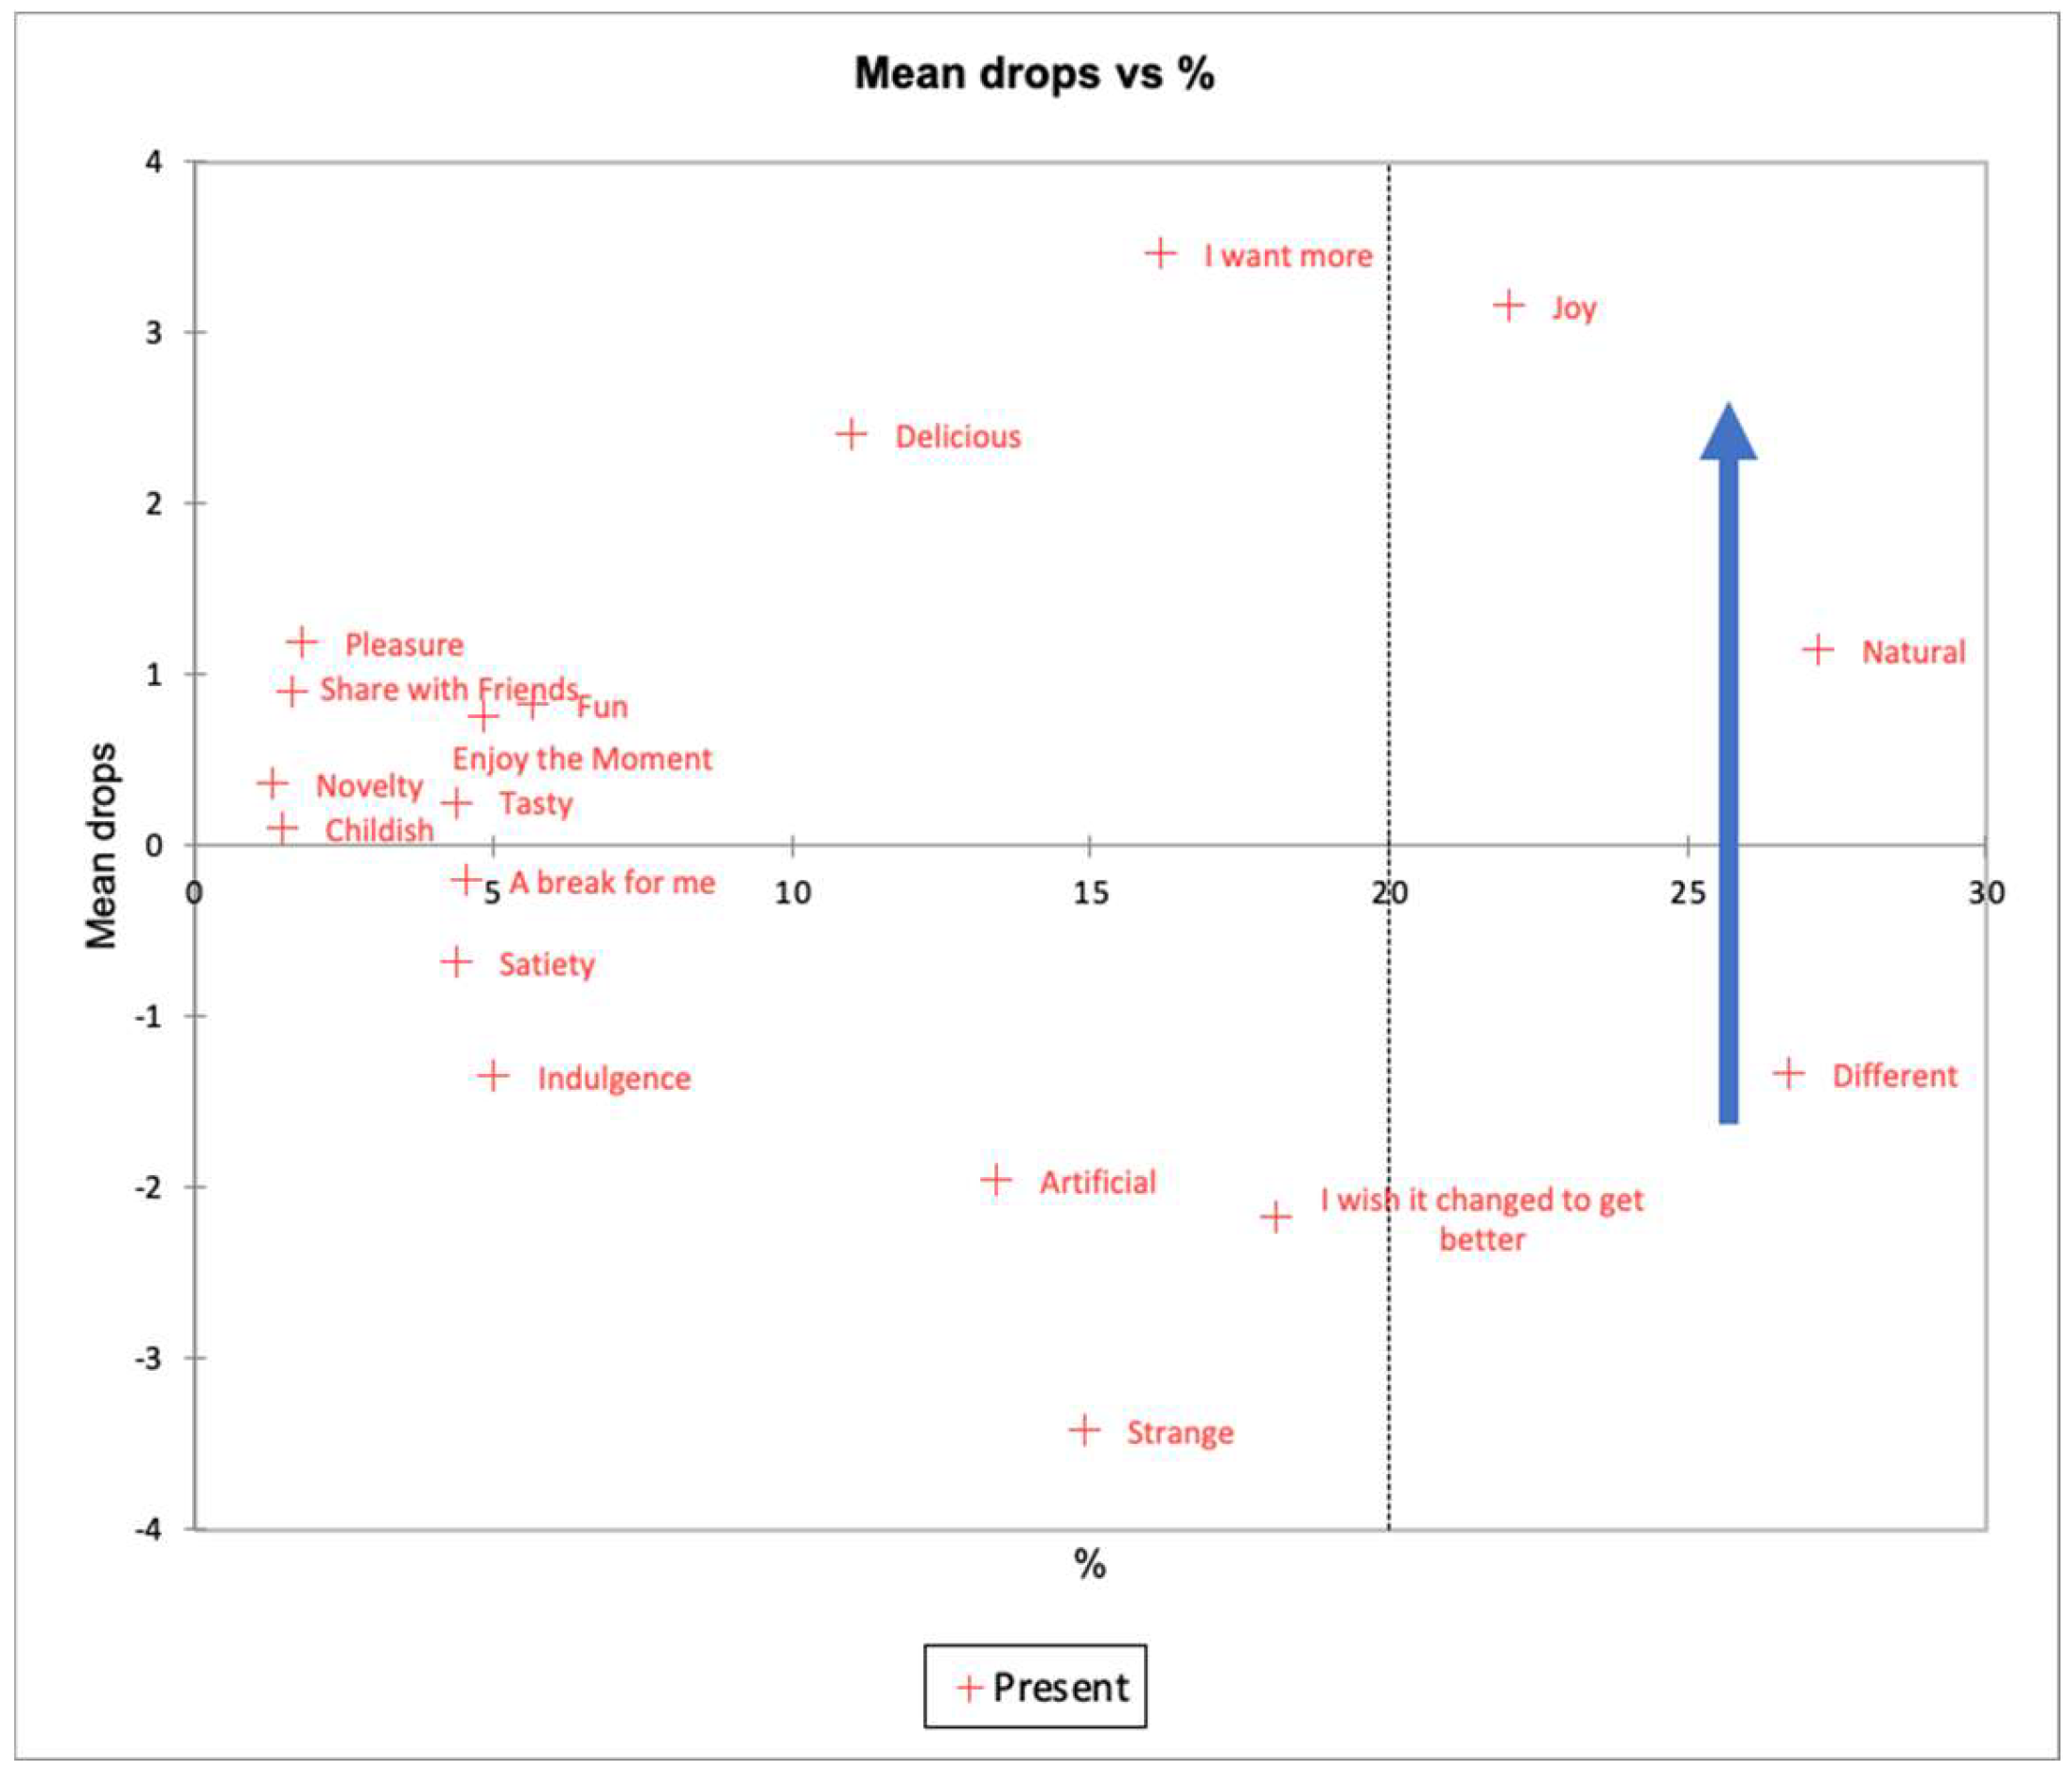
Figure 12.
Two-dimensional figure of the principal component analysis of the Flash Profile of the coconut ice cream samples sweetened with different sweetening agents.
Figure 12.
Two-dimensional figure of the principal component analysis of the Flash Profile of the coconut ice cream samples sweetened with different sweetening agents.
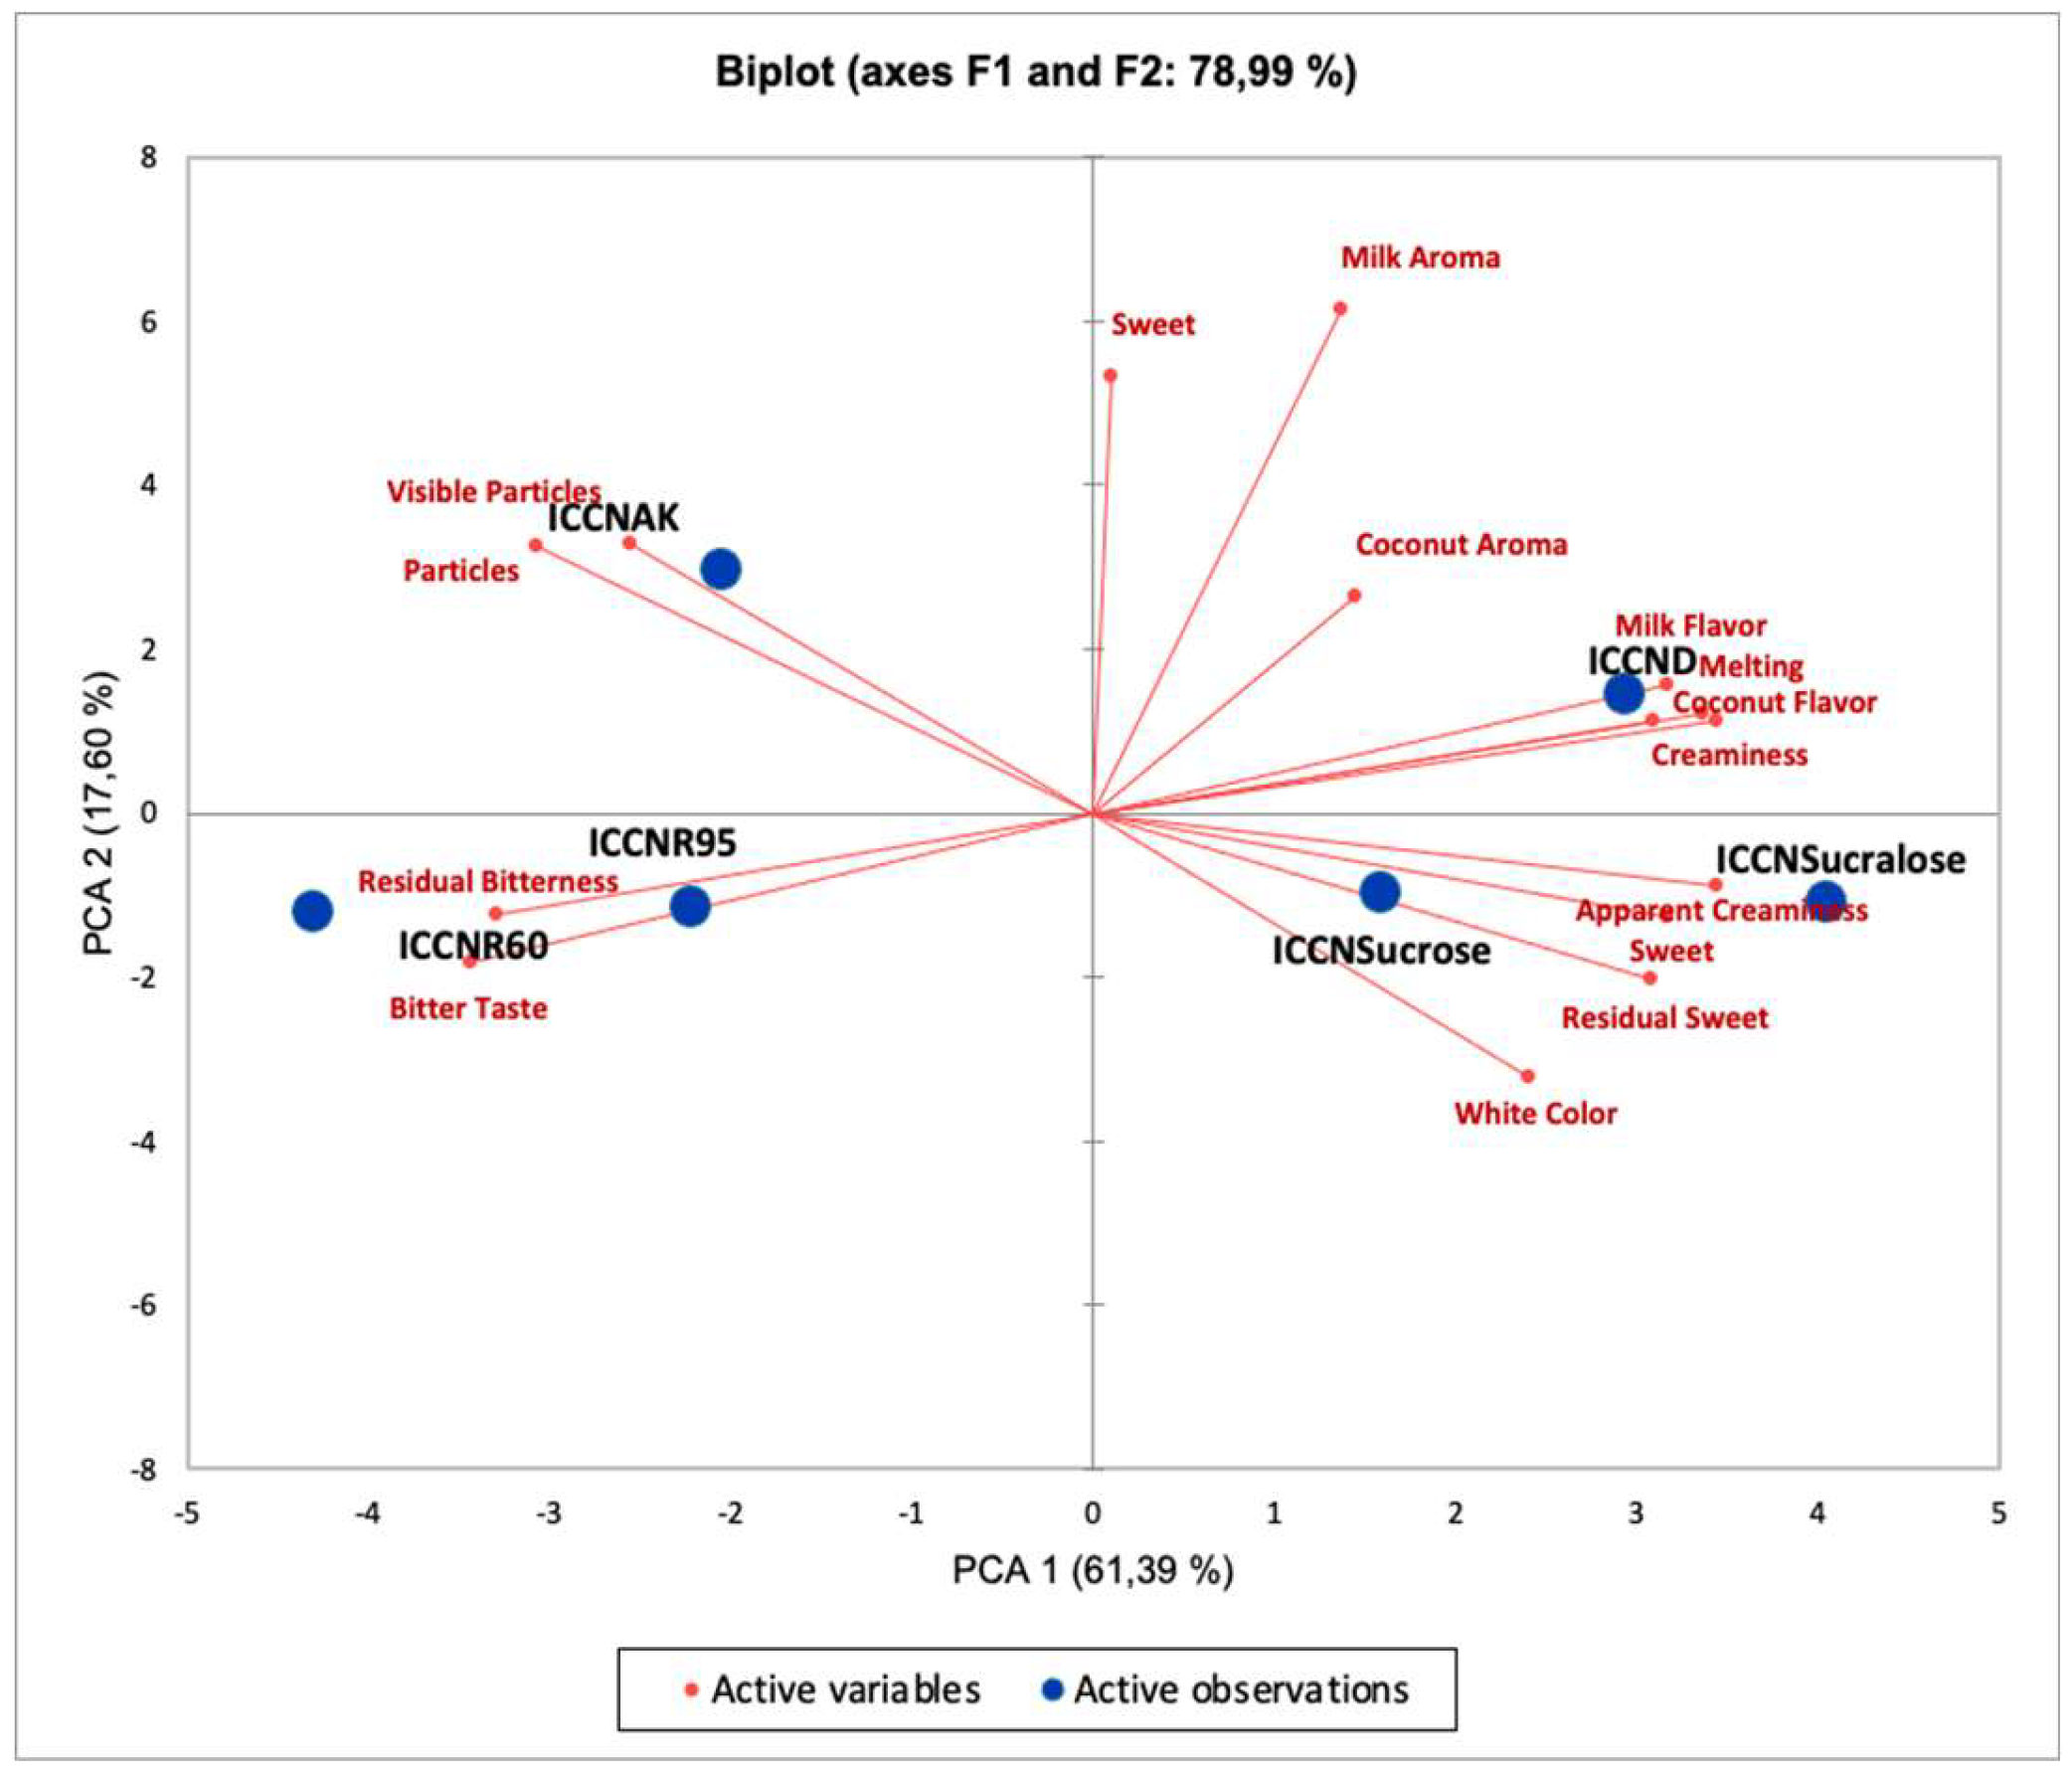
Figure 13.
Hierarchical cluster analysis of the ice cream samples with different sweetening agents.
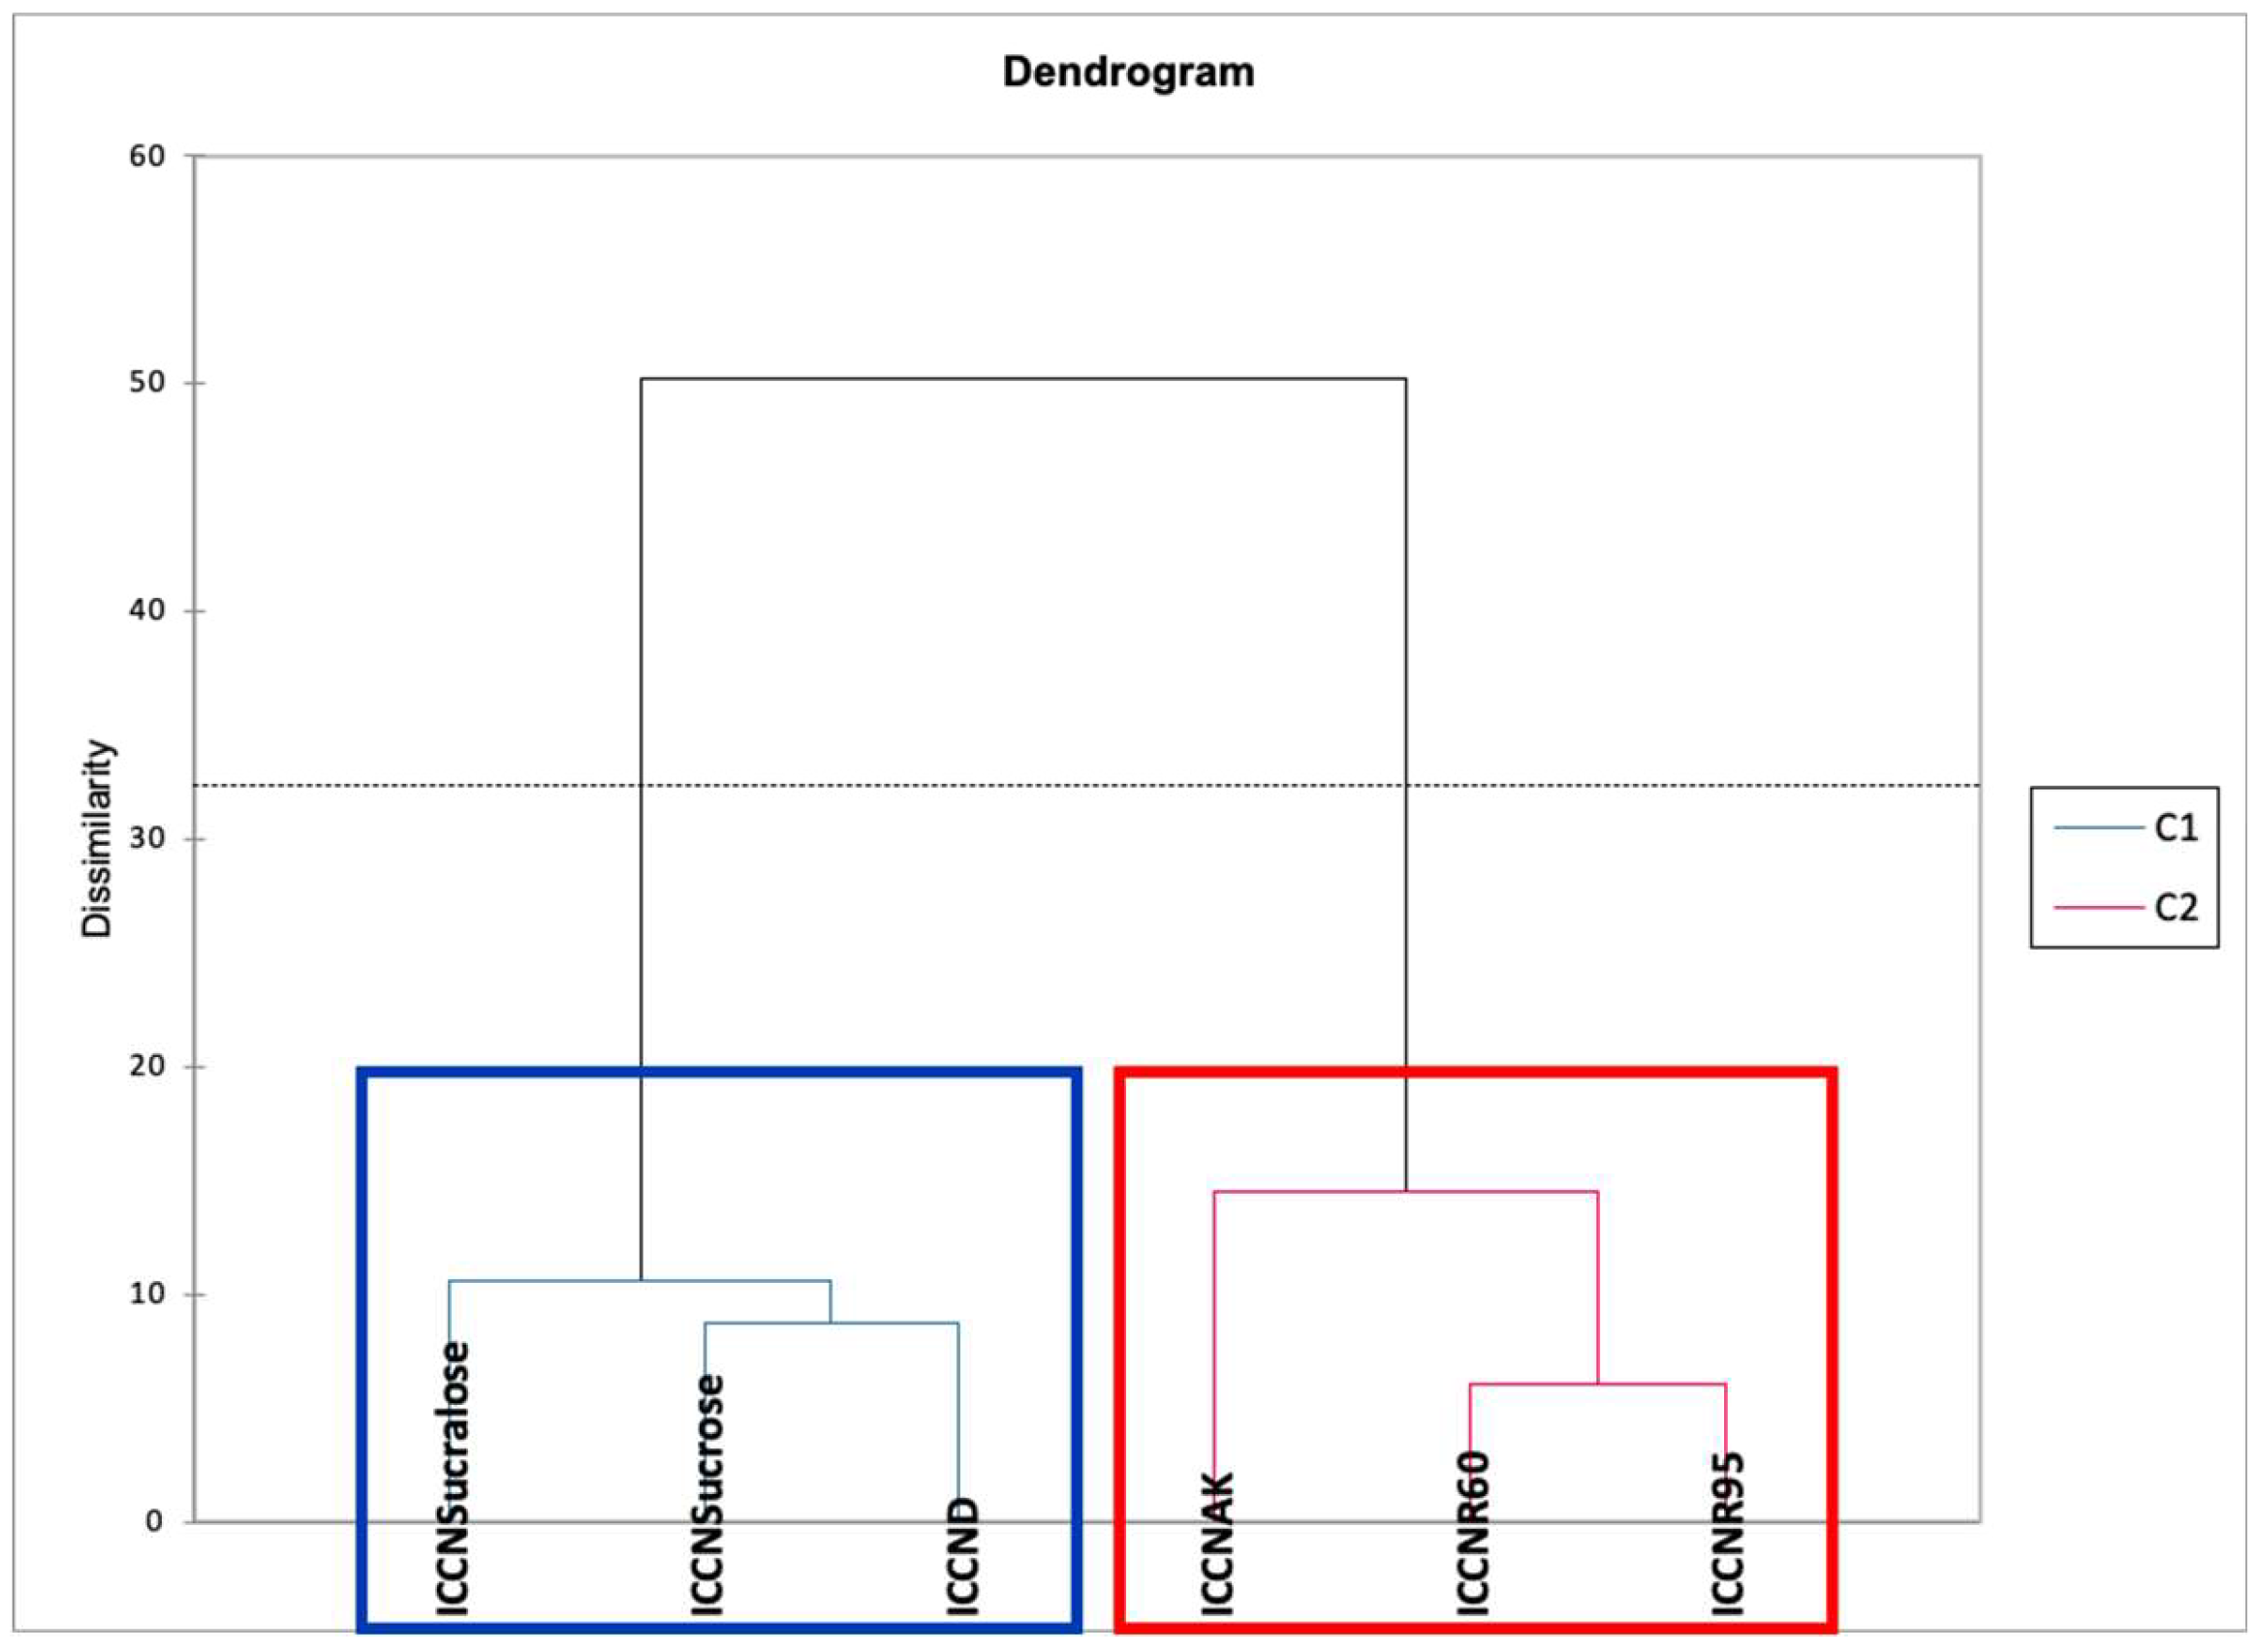
Figure 14.
Preference drivers for the formulated ice cream samples were obtained through multiple regression statistical analysis by partial least squares. Apparent creaminess, milk flavor, and creaminess (texture) contribute positively to the overall consumer acceptance (p < 0.05).
Figure 14.
Preference drivers for the formulated ice cream samples were obtained through multiple regression statistical analysis by partial least squares. Apparent creaminess, milk flavor, and creaminess (texture) contribute positively to the overall consumer acceptance (p < 0.05).
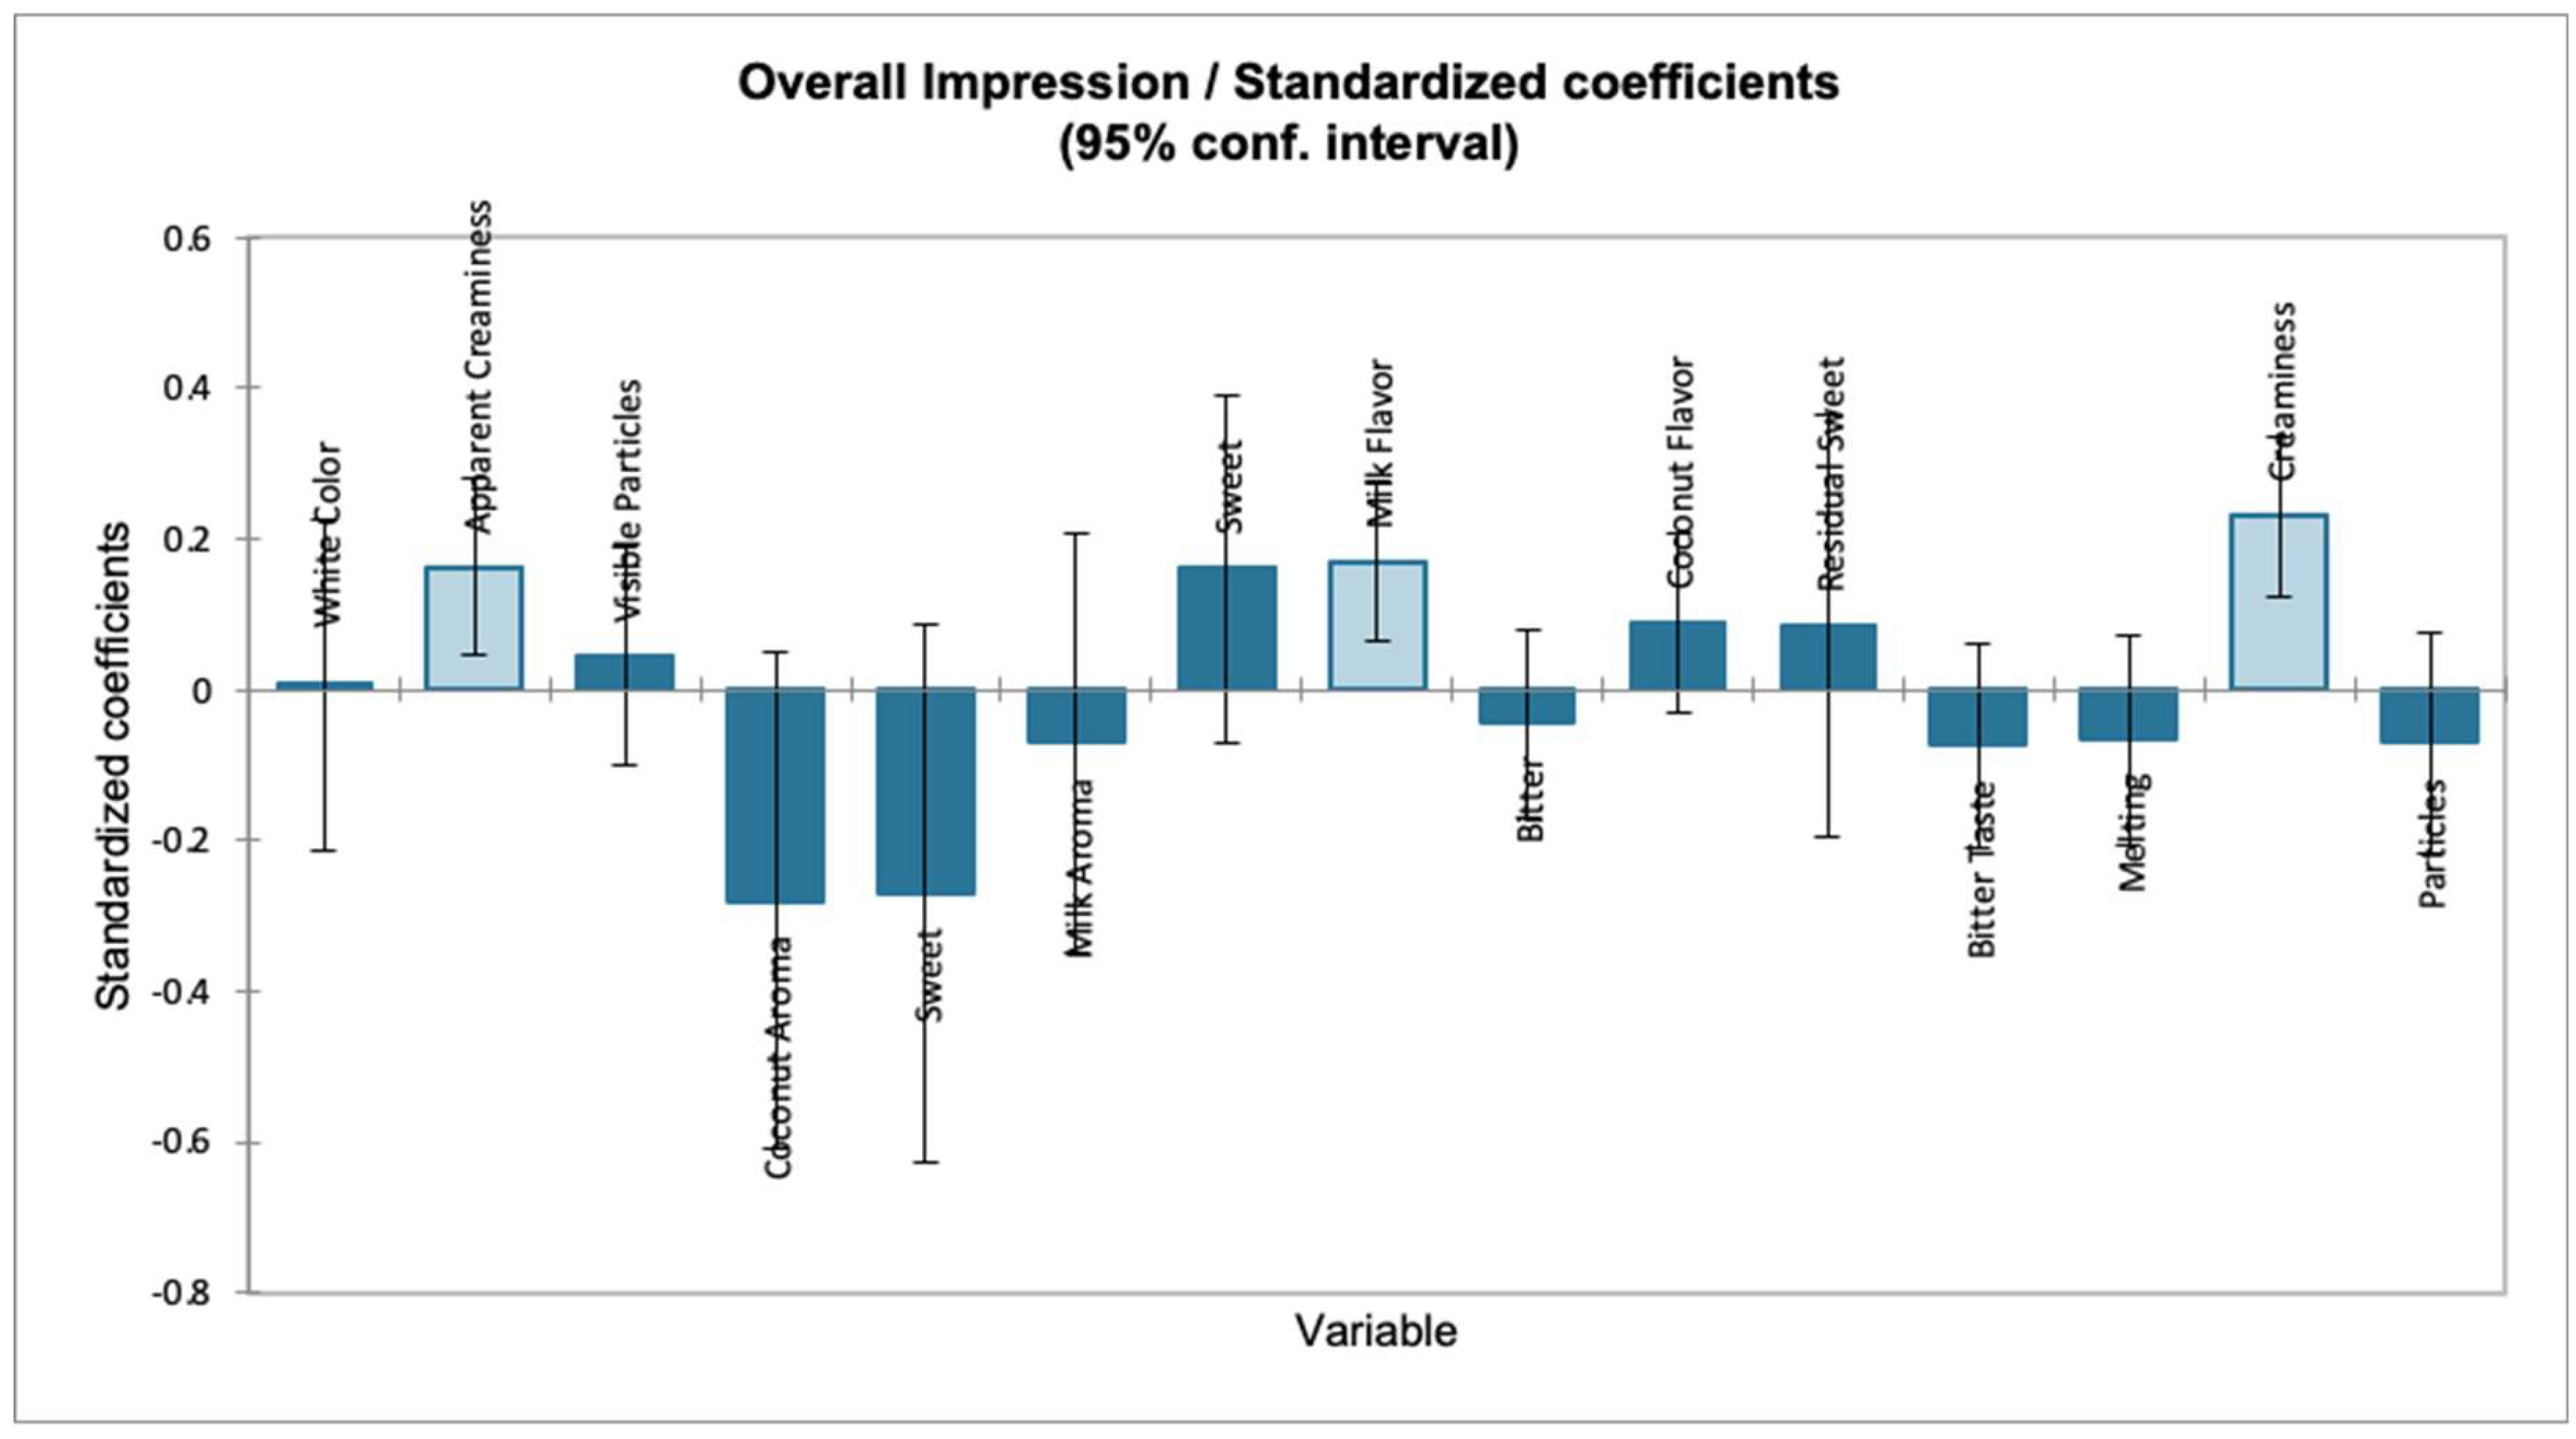
Figure 15.
External preference map of the coconut ice creams obtained through multiple regression statistical analysis by partial least squares. Samples located closer to "Overall Impression" have the highest acceptance. The descriptor terms of the flash profile located closest to the overall impression are more important in the product for increasing acceptance.
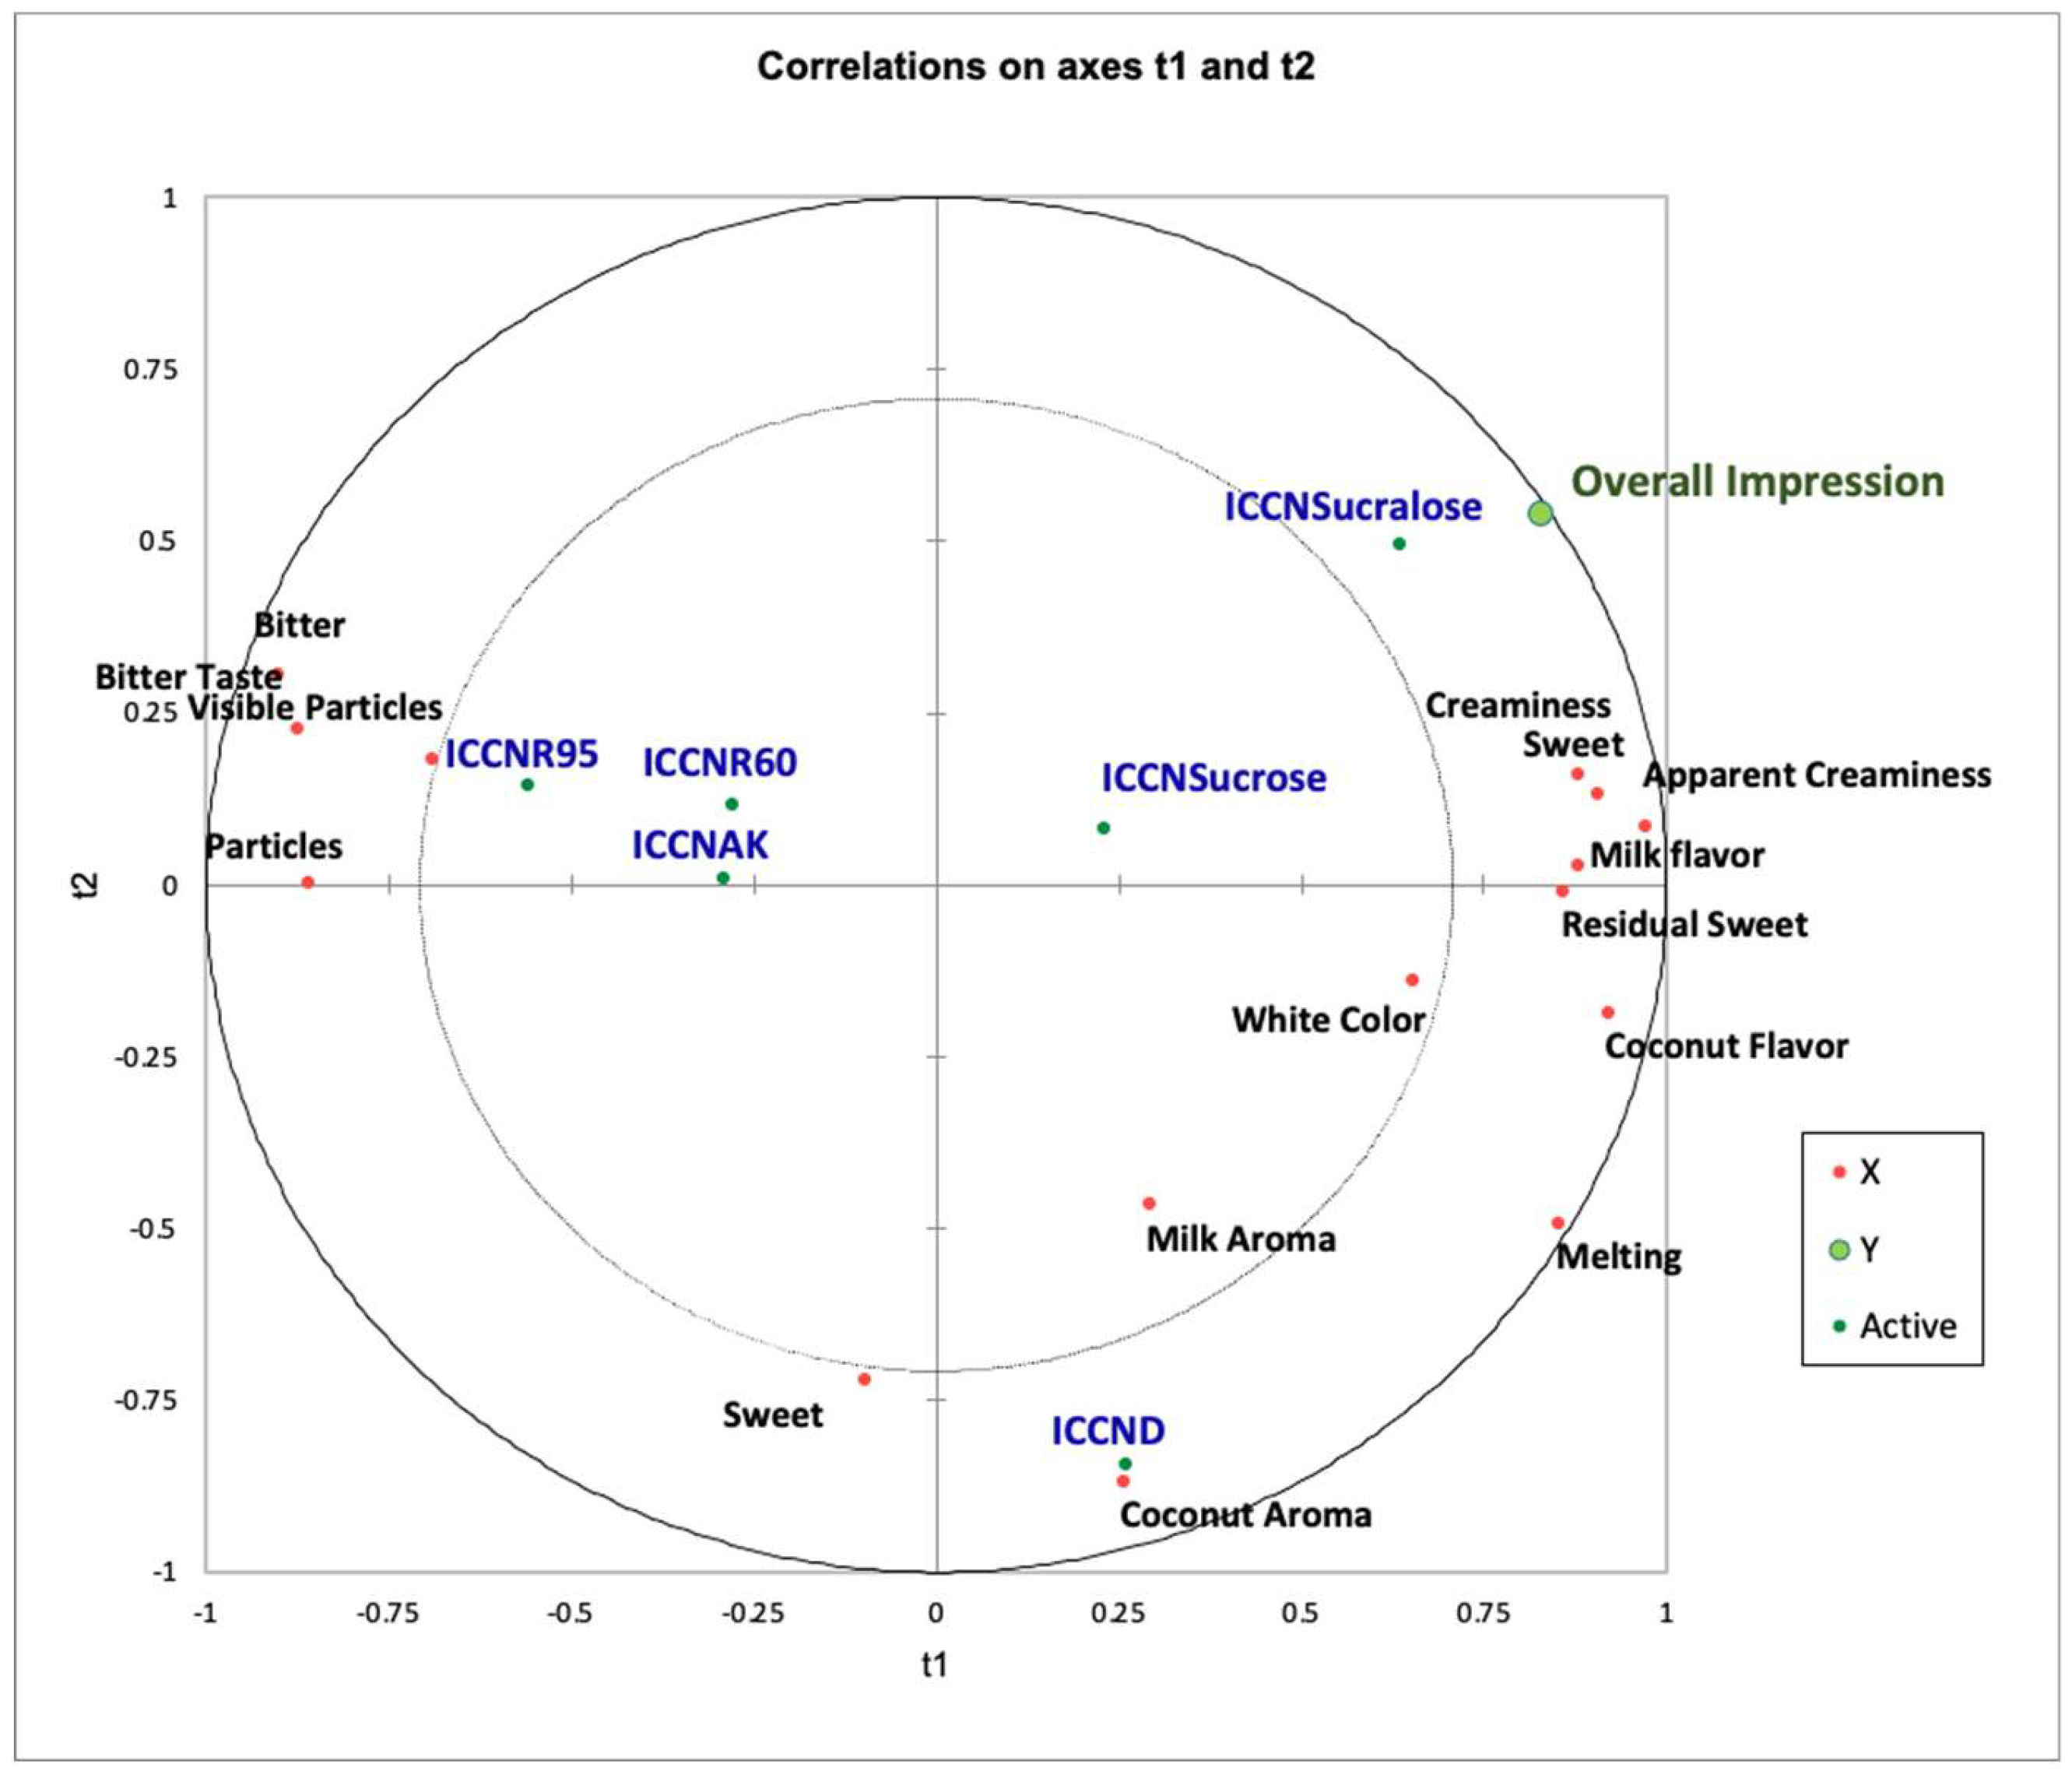
Figure 16.
Consumers who presented or did not present the acute respiratory syndrome caused by COVID 19.
Figure 16.
Consumers who presented or did not present the acute respiratory syndrome caused by COVID 19.
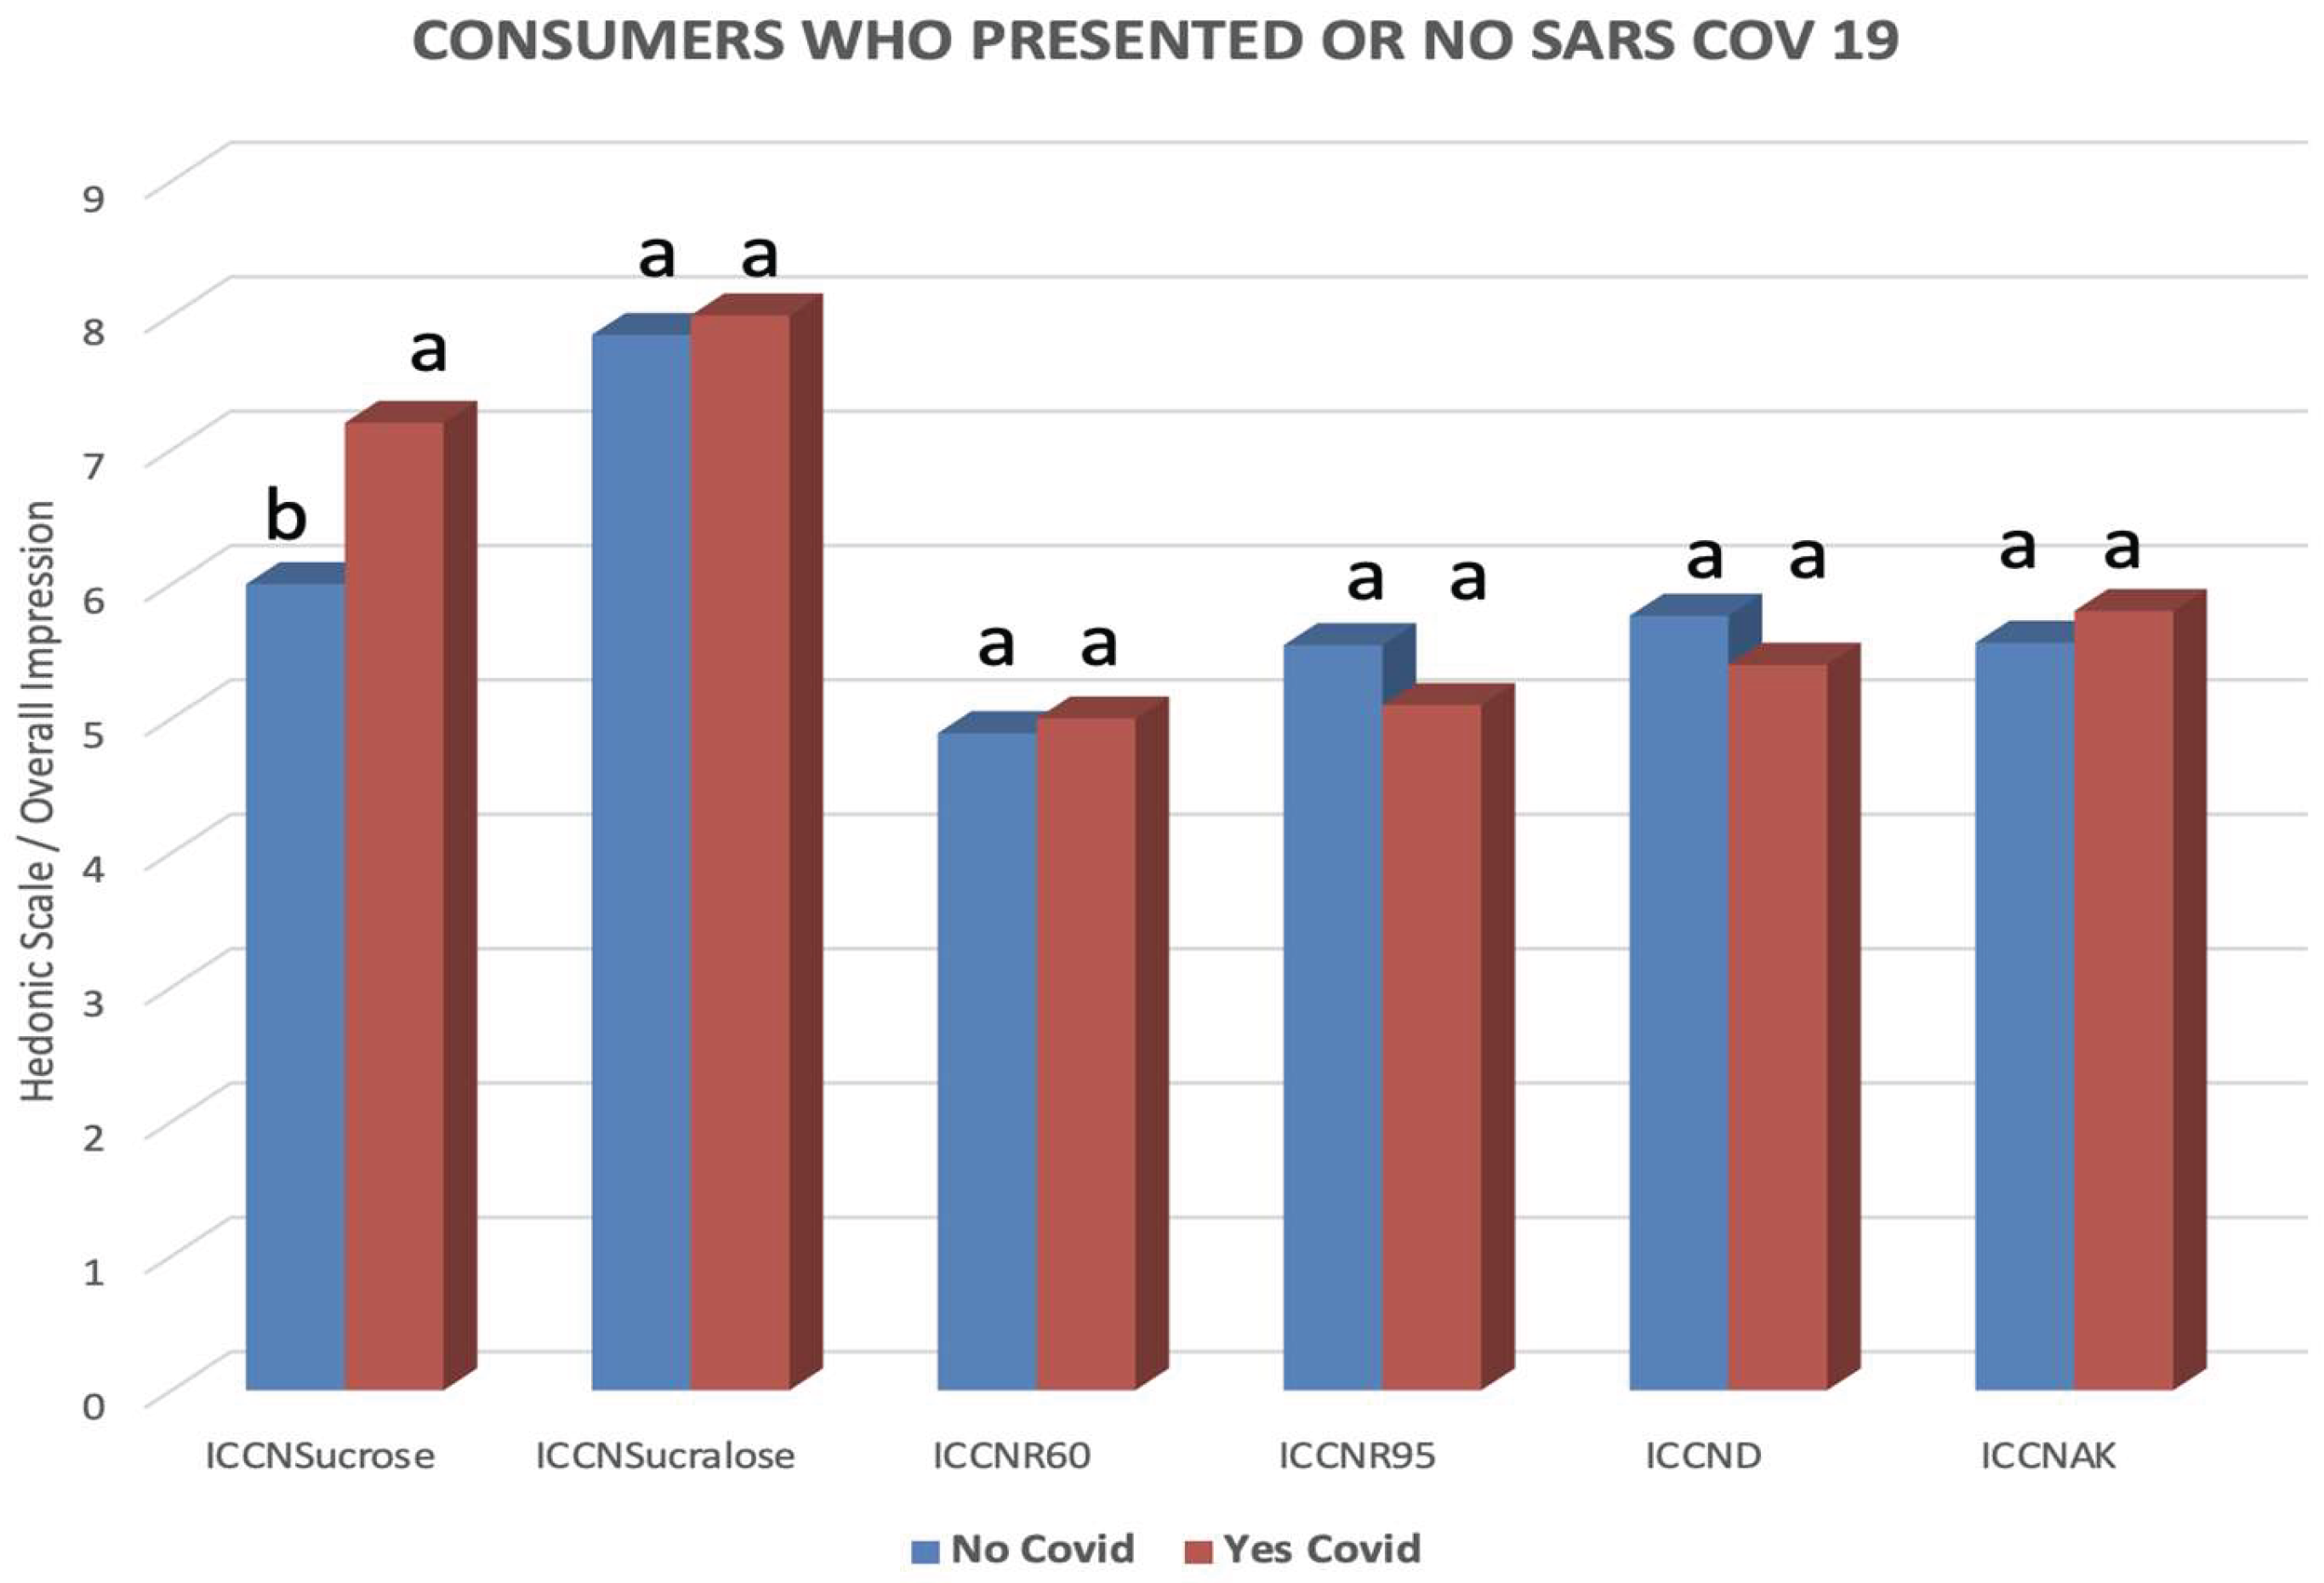

Table 1.
Composition used in the formulation of the coconut ice creams.
| Ingredients (%) | ICCSucrose | ICCSucralose | ICCR60 | ICCR95 | ICCSD | ICCAKM |
| Milk powder | 14,5 | 15,5 | 15,5 | 15,5 | 15,5 | 15,5 |
| Cream | 5 | 6 | 6 | 6 | 6 | 6 |
| Shredded coconut | 7 | 7 | 7 | 7 | 7 | 7 |
| Emulsifier | 0,4 | 0,4 | 0,4 | 0,4 | 0,4 | 0,4 |
| Inulin | - | 5 | 5 | 5 | 5 | 5 |
| Water | 61,1 | 63,025 | 63,025 | 63,025 | 63,045 | 63,045 |
| Glucose | 3 | 3 | 3 | 3 | 3 | 3 |
| Sweetener | 9 | 0,041 | 0,075 | 0,075 | 0,055 | 0,055 |
Disclaimer/Publisher’s Note: The statements, opinions and data contained in all publications are solely those of the individual author(s) and contributor(s) and not of MDPI and/or the editor(s). MDPI and/or the editor(s) disclaim responsibility for any injury to people or property resulting from any ideas, methods, instructions or products referred to in the content. |
© 2025 by the authors. Licensee MDPI, Basel, Switzerland. This article is an open access article distributed under the terms and conditions of the Creative Commons Attribution (CC BY) license (http://creativecommons.org/licenses/by/4.0/).
Copyright: This open access article is published under a Creative Commons CC BY 4.0 license, which permit the free download, distribution, and reuse, provided that the author and preprint are cited in any reuse.


