Preprint
Article

This version is not peer-reviewed.

Screening of Romanian Maize Local Landraces to Identify Morpho-Productive Traits and Resistance to Fusarium verticillioides for Mitigating Fumonisin Contamination

Submitted:

02 November 2025

Posted:

03 November 2025

You are already at the latest version

Abstract

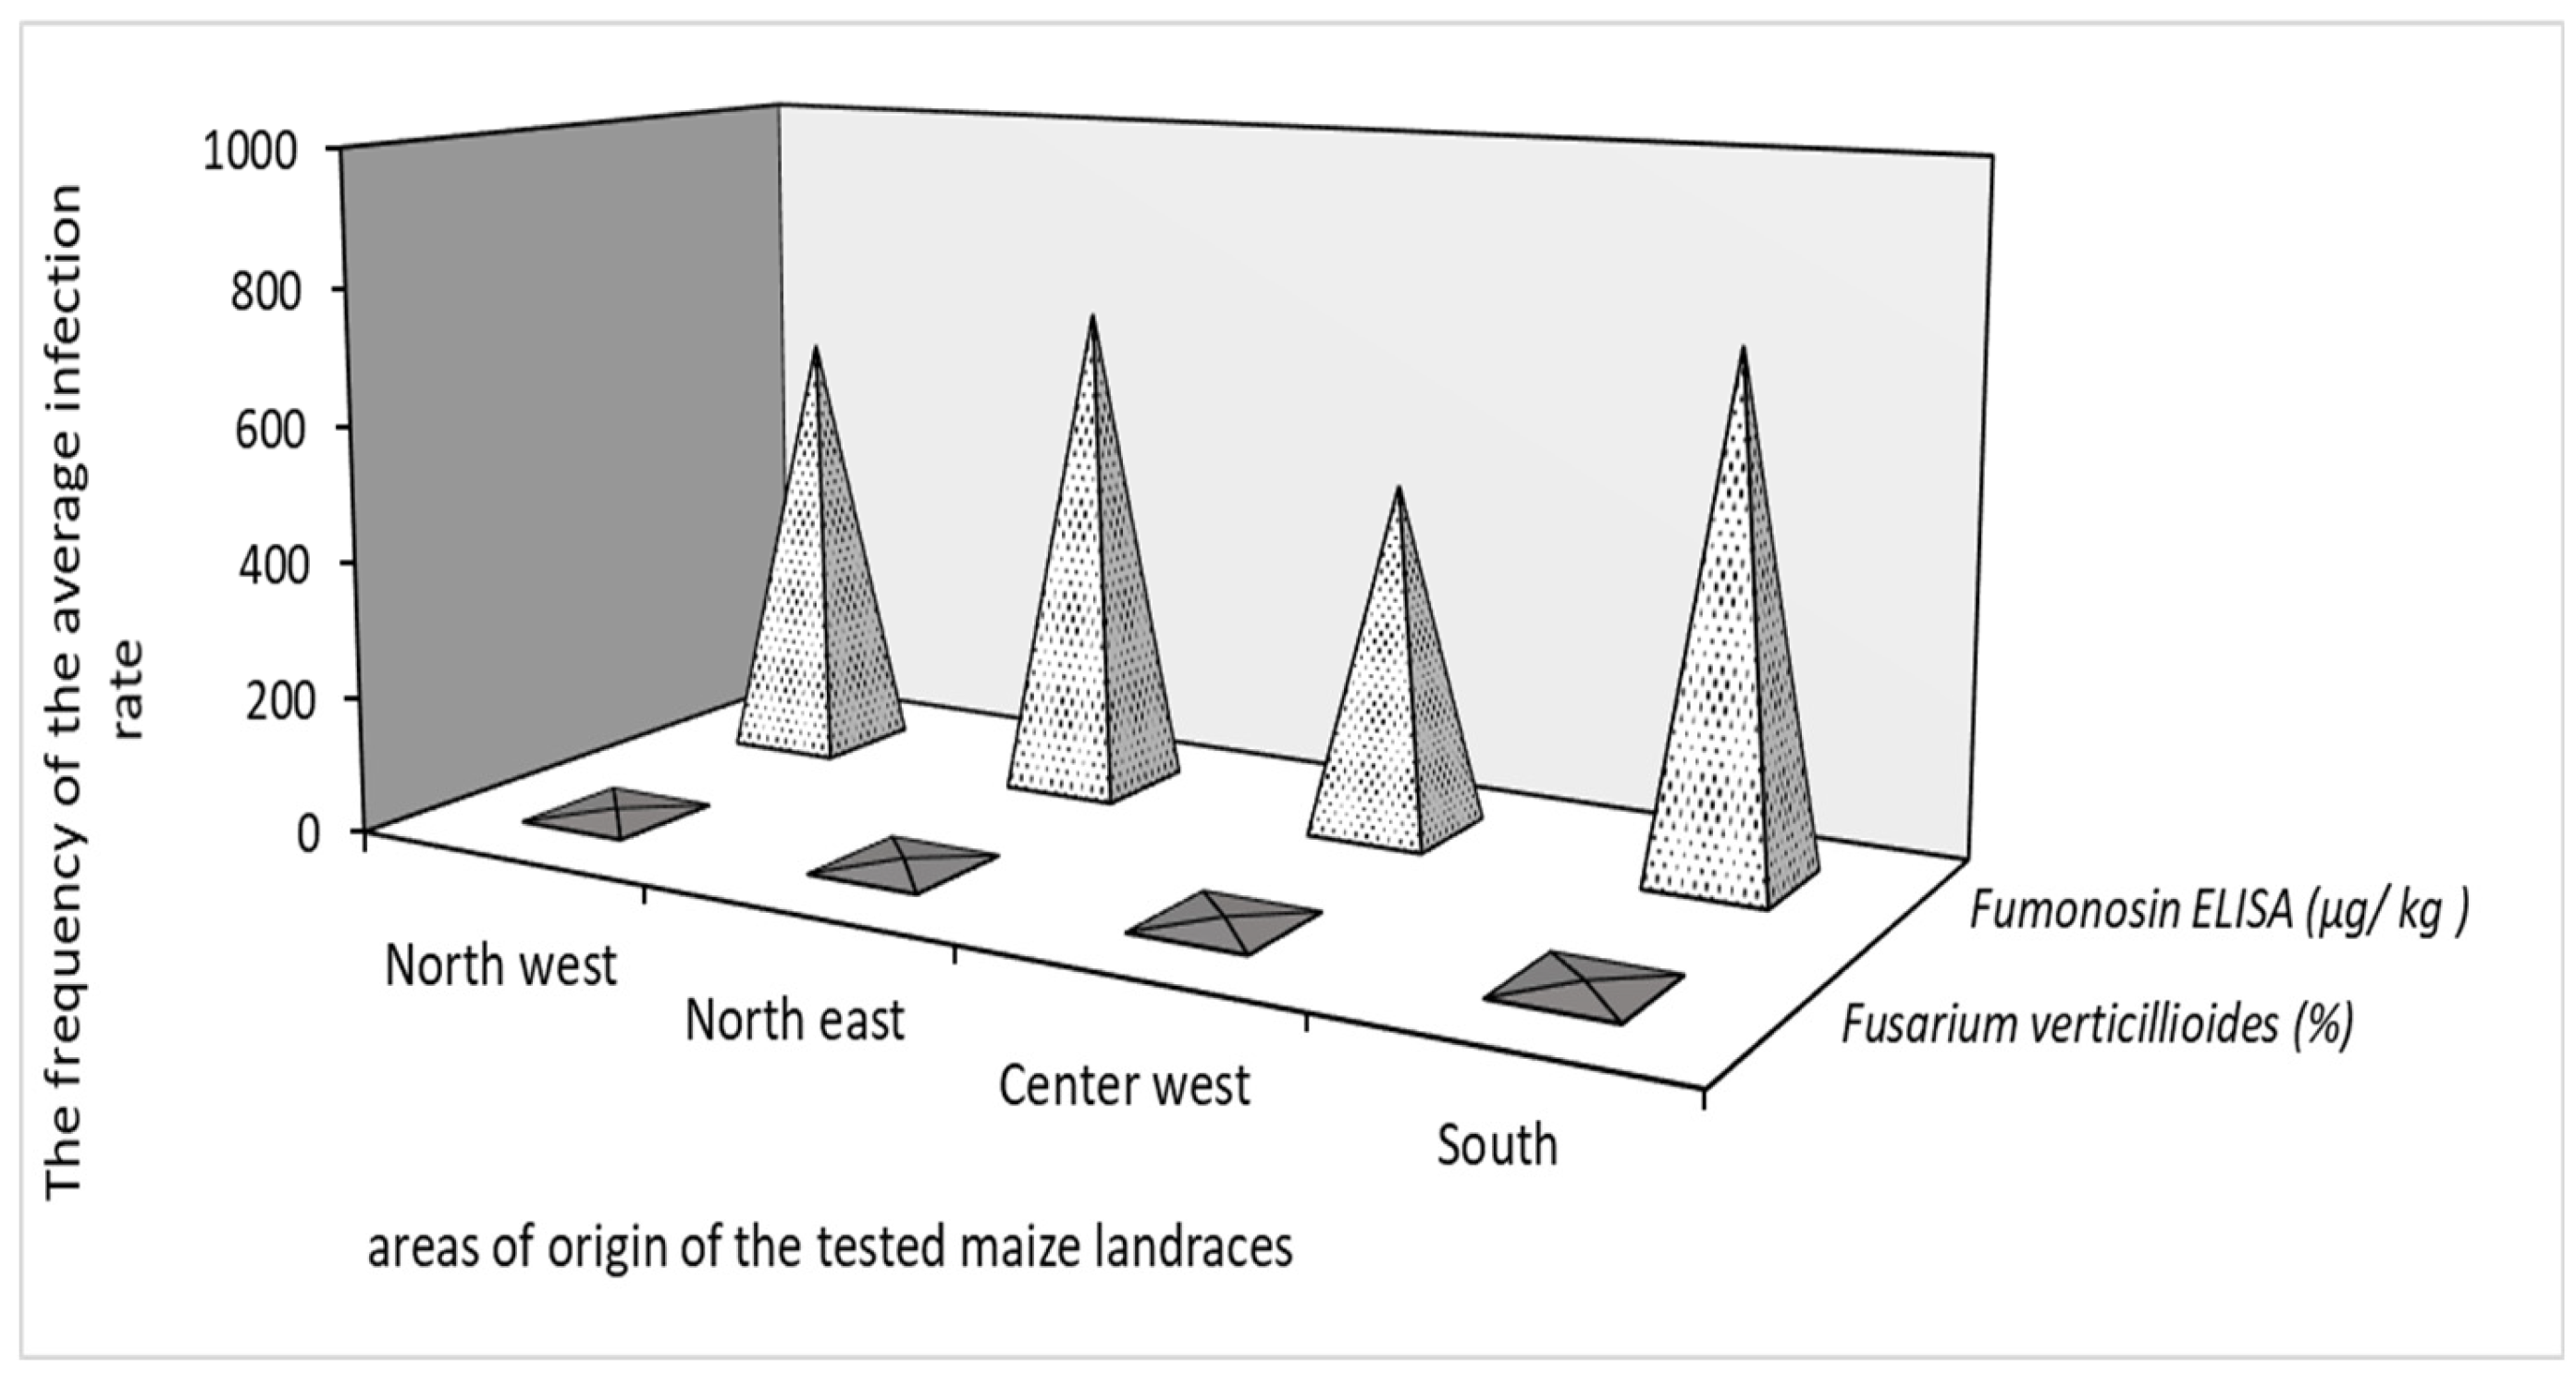
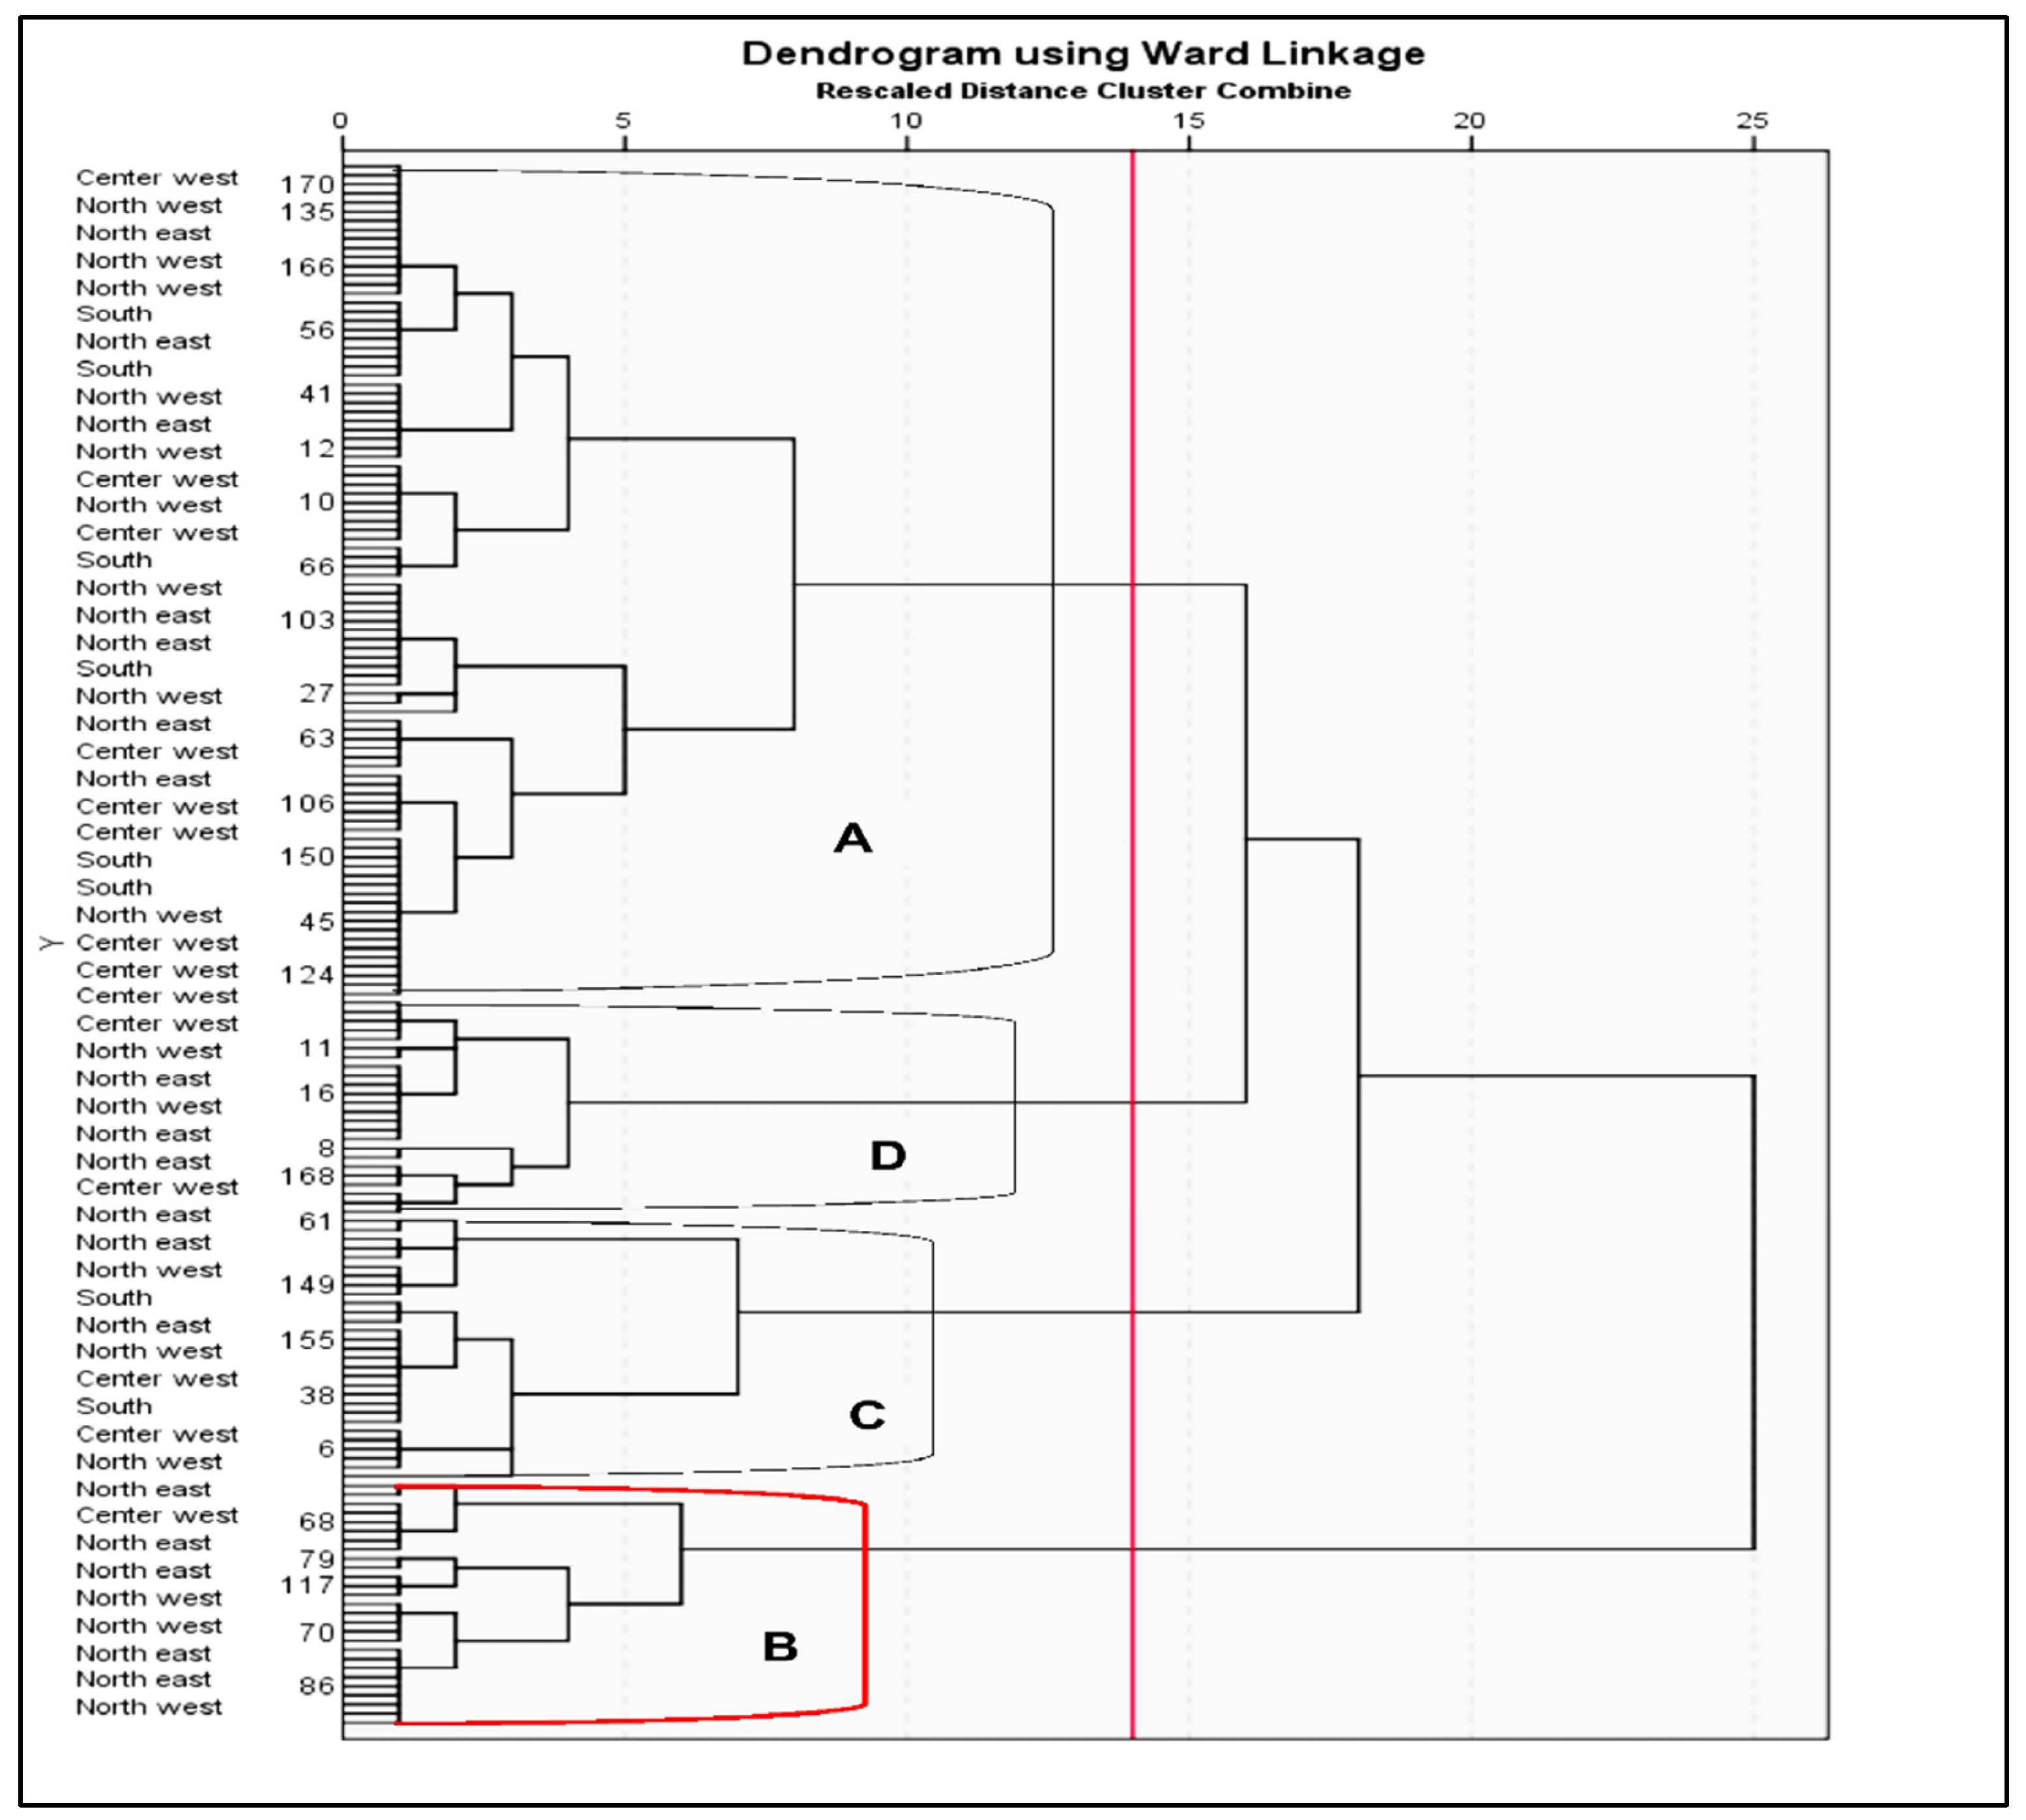
Fusarium verticillioides f. sp. moniliforme is a key mycotoxigenic pathogen of maize, causing fumonisin contamination that endangers food security and is favored by drought and climate change. This study evaluated 172 Romanian maize landraces from the Suceava Gene Bank to identify sources of resistance and adaptive traits for breeding. Accessions representing four regions (North-West, North-East, Center-West, and South) were tested under field conditions at ARDS Suceava in 2021. Phenological, morphological, and yield traits were recorded, Fusarium resistance was scored on 1,046 ears using the CIMMYT 1–6 scale, and fumonisin levels were quantified by ELISA. Data were analyzed using descriptive statistics, principal component analysis, and hierarchical clustering. Substantial phenotypic variation was observed among regions. Southern landraces displayed superior plant height, ear length, kernel weight, and yield (3.54 t/ha), while North-Eastern accessions matured earlier but were more heterogeneous. Fusarium incidence ranged from 6.95% to 8.89%, and fumonisin levels from 151 to 2,178 μg/kg. Cluster B (27 accessions) emerged as genetically distinct, combining agronomic performance with moderate Fusarium tolerance. These landraces constitute valuable germplasm for breeding programs aimed at enhancing maize resilience to Fusarium infection and reducing fumonisin contamination under changing environmental conditions.

Keywords: 
;  ;  ;  ;  

1. Introduction

F. verticillioides is a pathogenic filamentous fungus with a major impact on agriculture, due to its toxigenic capacity and resistance to extreme environmental conditions (including high temperatures). It infect grains produces spores in the microclimate of small cereals and maize, directly affecting productivity traits. Maize infection can occur through several pathways, the most frequently reported being the penetration of airborne conidia through silks [1,2,3]. Subsequently, the fungus colonizes kernels, although only a small proportion of them develop visible symptoms [4]. Another possible infection route is systemic, via seeds, when conidia or mycelia are present either inside or on the seed surface [5]. In this case, the fungus develops within the young plant, progressing from the roots to the stalk and finally to the cob and kernels [6].
According to Czembor et al. [7], the micromycete exhibits a symbiotic relationship with maize while also acting as a soil pathogen. Infested kernels show high fumonisin concentrations in the embryo and pericarp [8,9]. The development of the pathogen and the accumulation of fumonisins are stimulated by abiotic and biotic factors such as drought stress, excessive rainfall, phytophagous insects [10,11], high temperatures (30–35 °C), and endosperm composition [12,13,14].
Climate change and extreme weather events have influenced the life cycle of mycotoxigenic fungi, altering their ability to colonize crops and produce toxins [15]. Consequently, the geographical distribution of Fusarium species has expanded, now including temperate regions [16]. Parts of Europe that were previously less affected are currently reporting higher incidences of maize fumonisin contamination [17].
F. verticillioides synthesizes several toxins with toxic potential for humans and domesticated animals, of which fumonisins are the most important [18,19]. Their occurrence in both symptomatic and asymptomatic maize kernels makes the management of fumonisin contamination a major priority in food safety research [20]. Consequently, regulations have been established concerning the maximum allowable fumonisin levels in food and animal feed [21].
Considering the risks to food safety and security, the economic impact of crops failing to meet international trade standards, and the financial losses for farmers and exporters, the adoption of sustainable measures for fumonisin contamination management is imperative [22,23].
In this context, the primary objective of our study is to assess the morpho-productive traits and resistance to F. verticillioides in local maize populations originating from various regions of Romania, with the ultimate goal of identifying genotypes that combine high productivity indices, enhanced resistance to Fusarium infection, and reduced levels of fumonisin mycotoxin contamination.

2. Results and Discussions

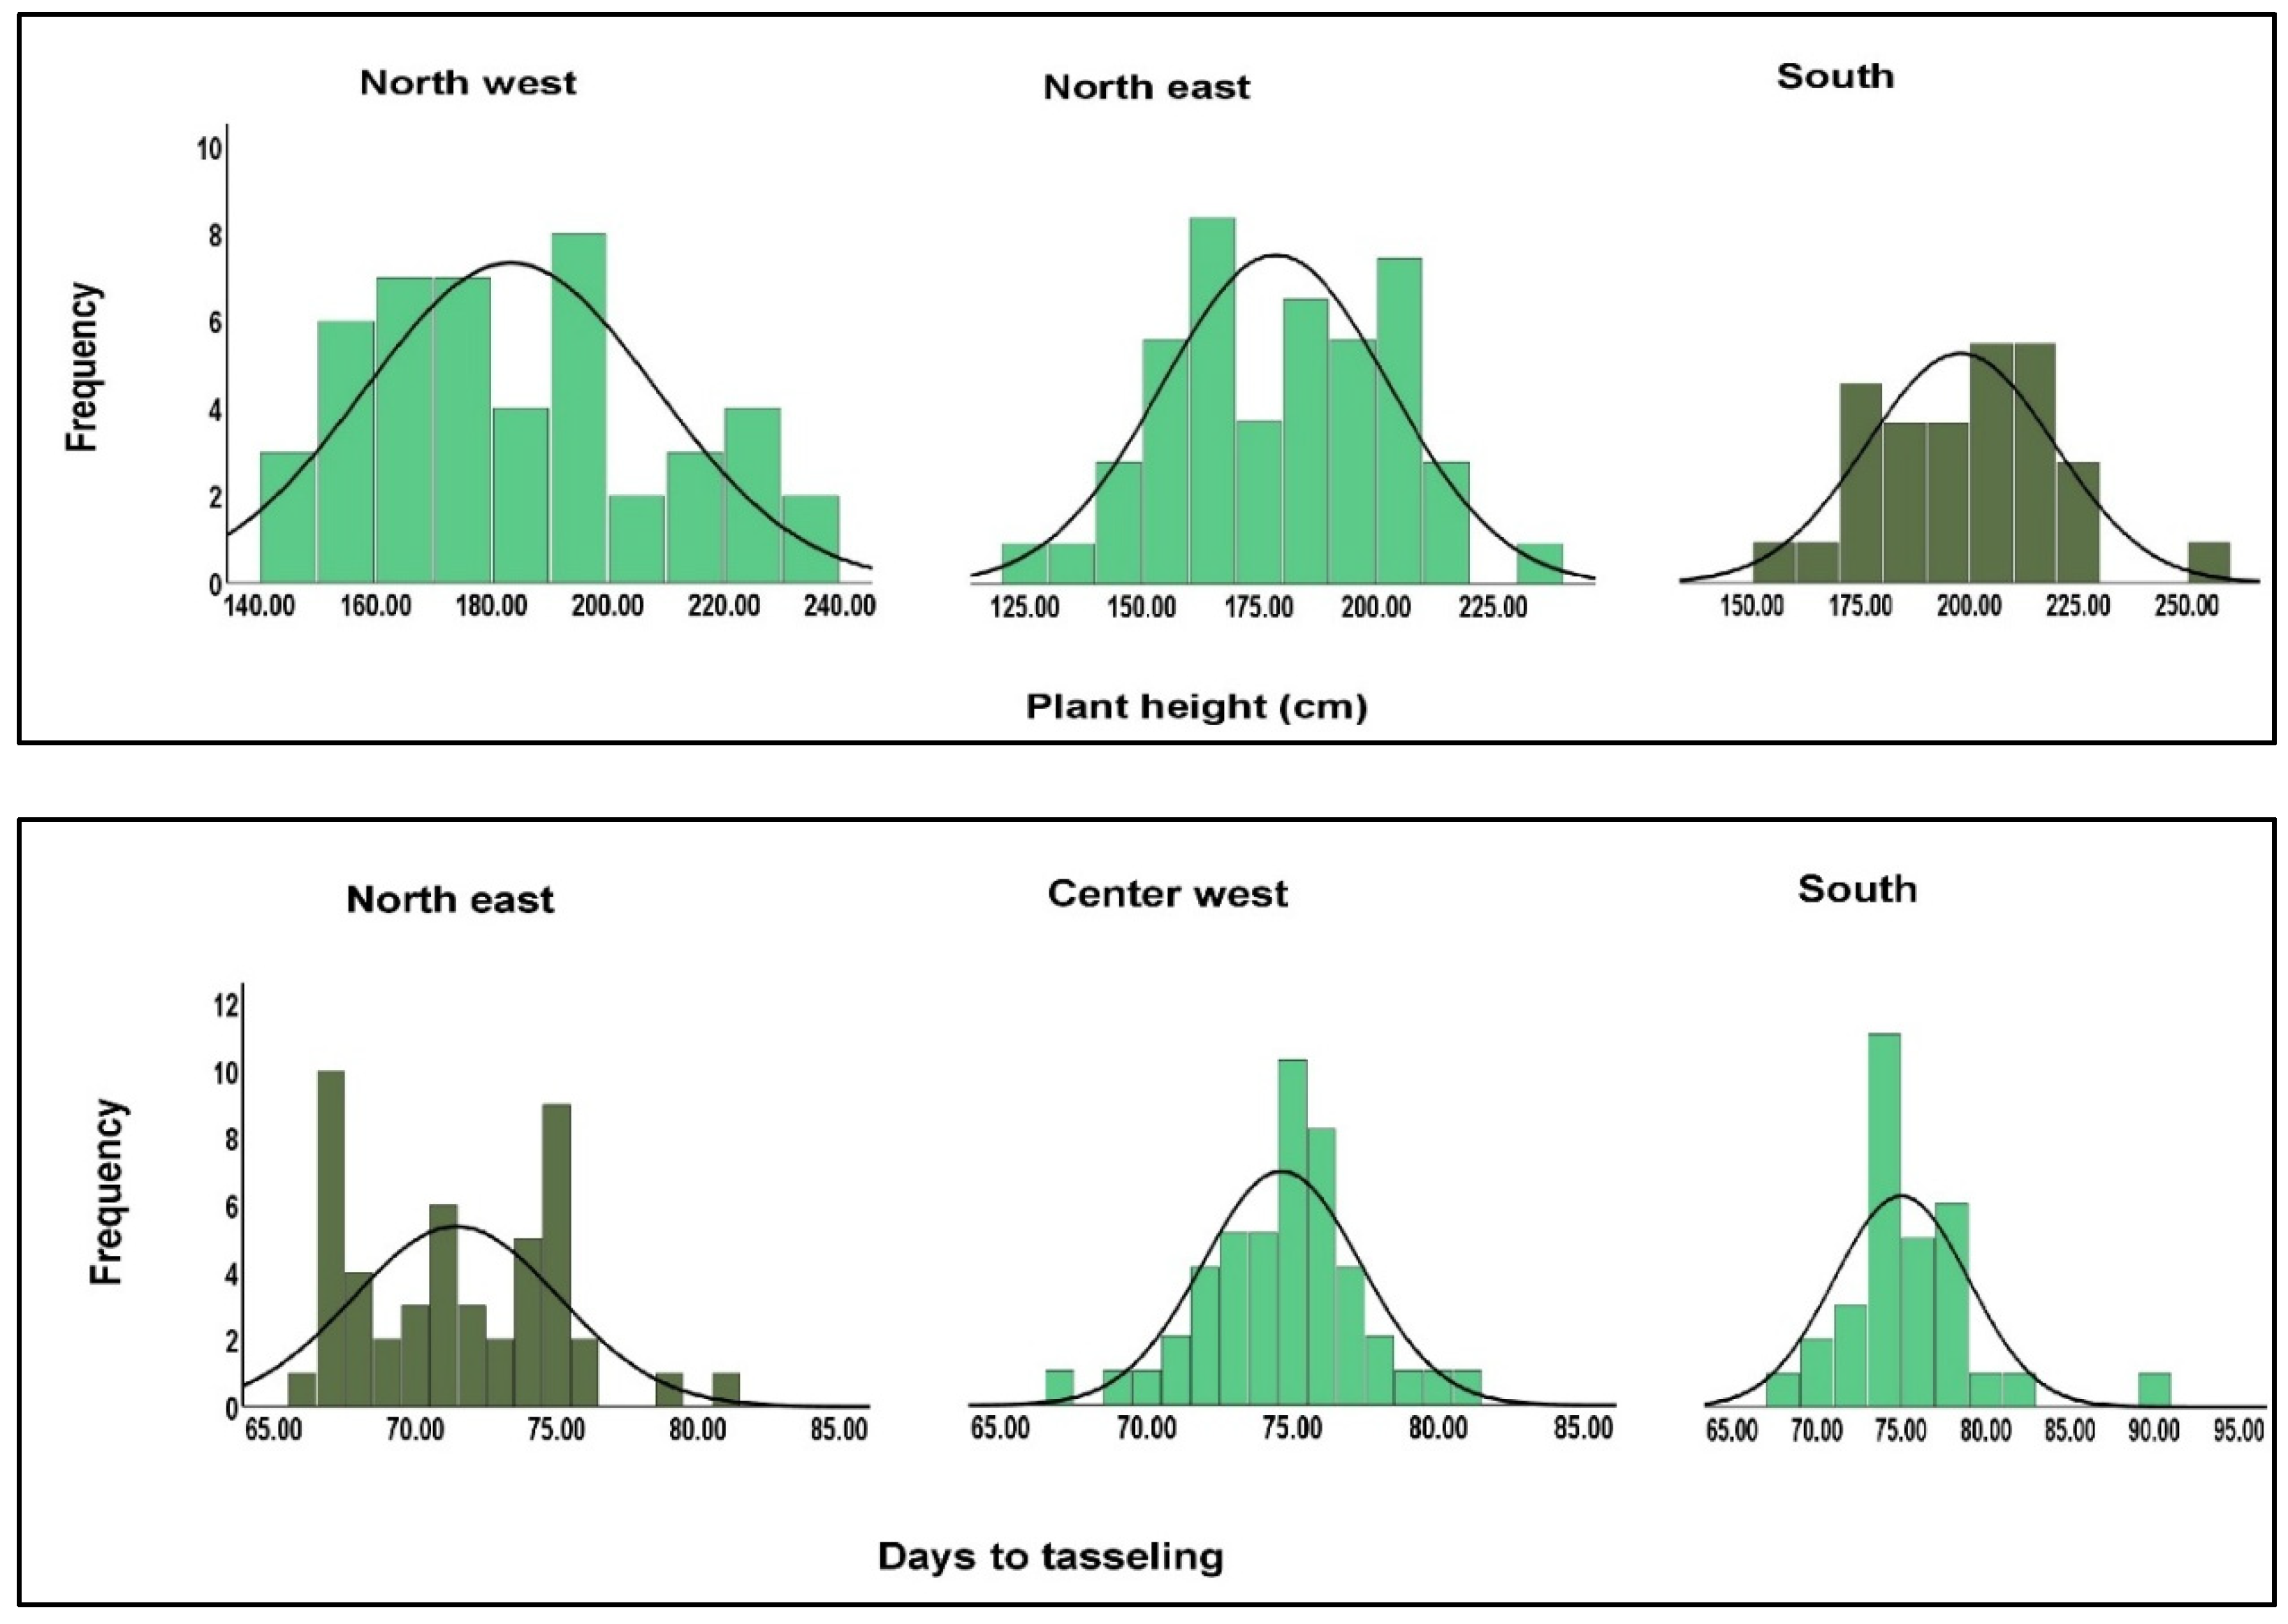
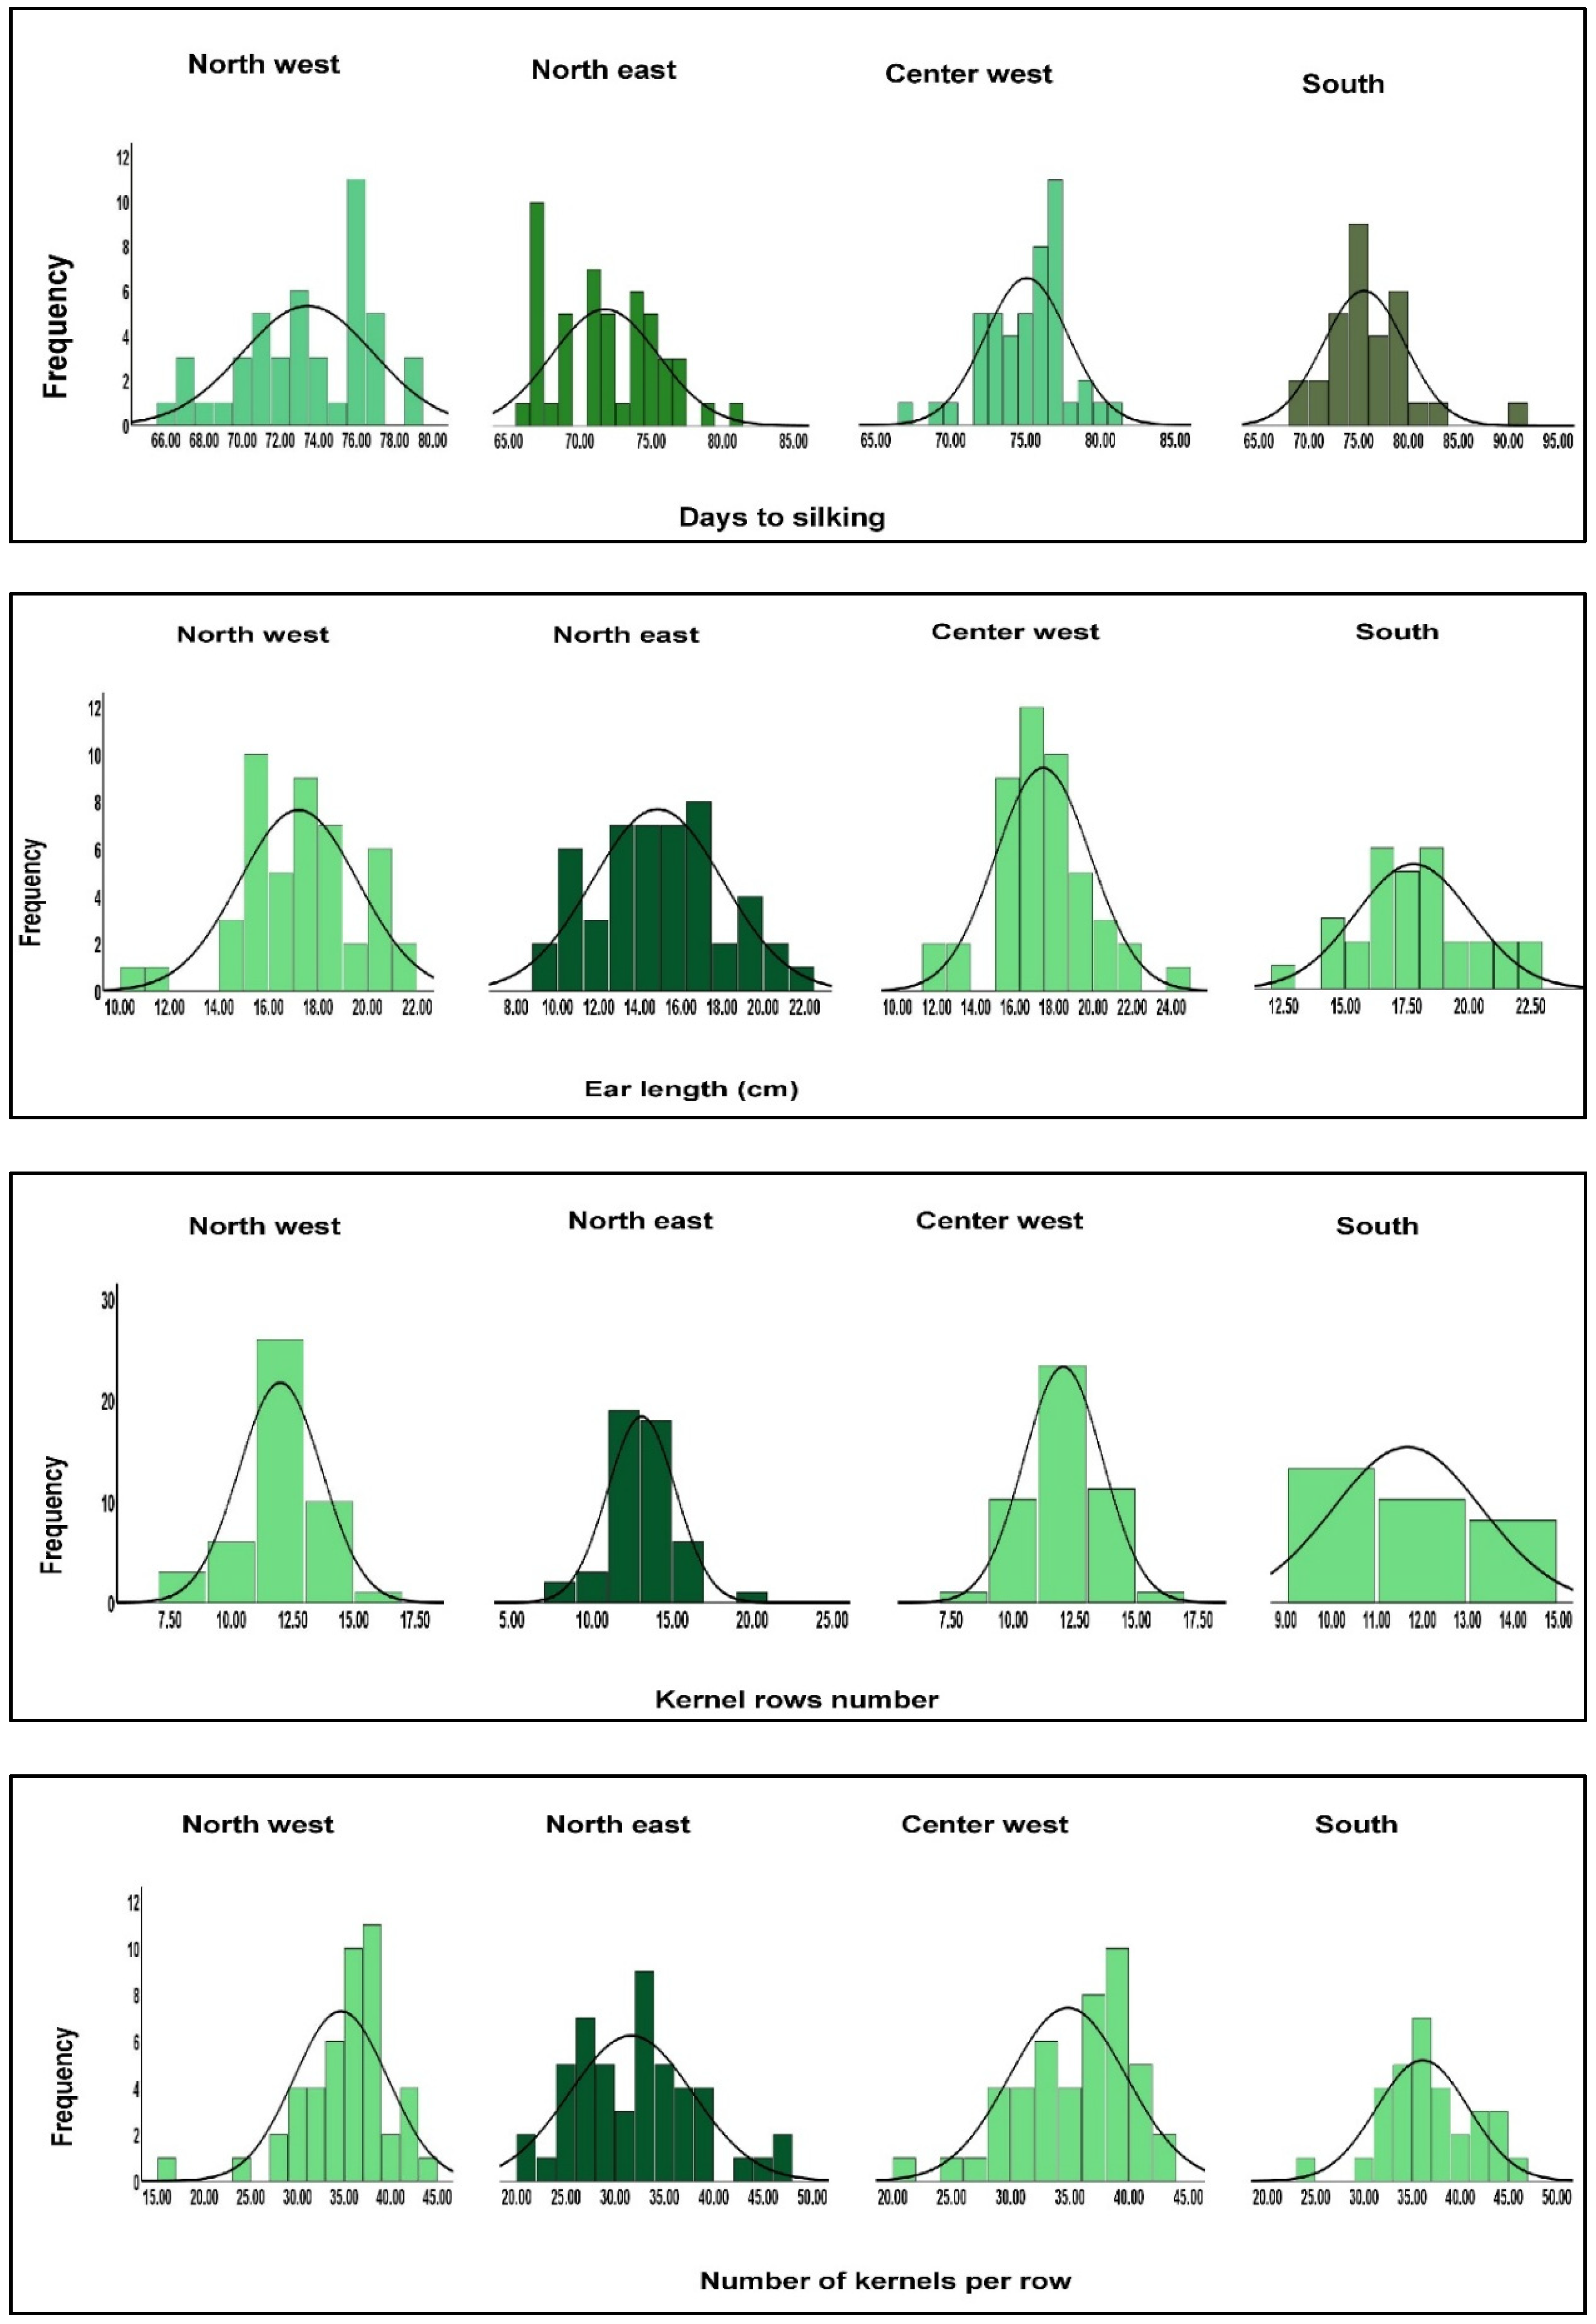
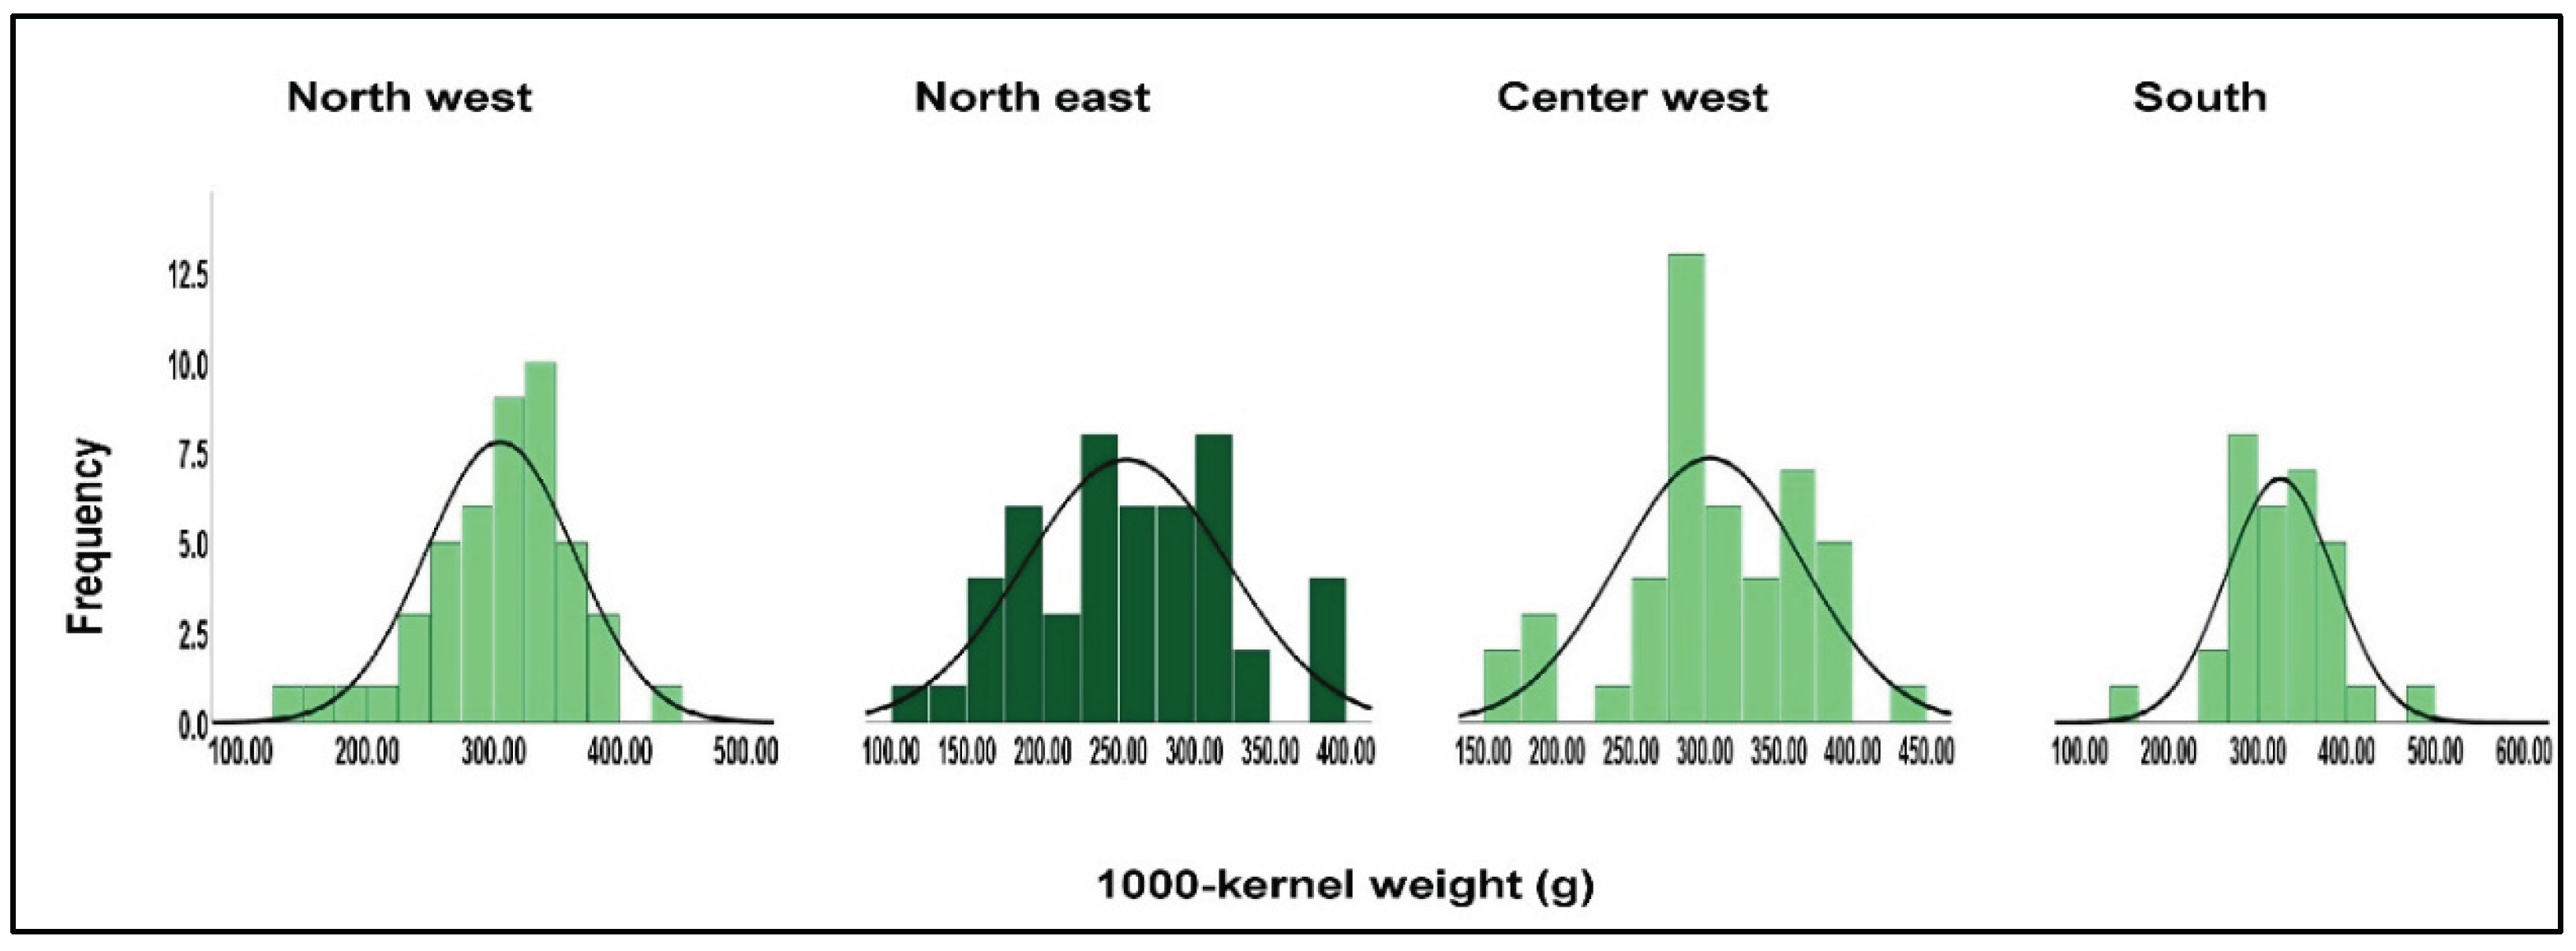
2.1. Phenotypic Diversity of the Maize Landraces Studied

A total of 172 local maize populations were evaluated to identify new germplasm sources for breeding programs aimed at improving resistance to F. verticillioidis and reducing fumonisin contamination. Accessions were grouped according to geographical origin (46 from North-West, 49 from North-East, 46 from Central-West, and 31 from South), and a comprehensive assessment of morphological traits, disease resistance, and toxin content was conducted.
The analysis of phenotypic traits revealed significant variation among maize landraces from different regions (Table 1).
  • Plant height: Southern populations were tallest (mean197.93 cm) and showed the lowest variation (CV = 10.86%), whereas North-East populations were shortest (mean 178.57 cm) with higher variability (CV = 13.53%).
  • Phenology: Days to tasseling and silking were longest in the South and Center-West (mean ~75 days) and shortest in the North-East (~71–72 days). Coefficients of variation were generally low (<6%), indicating consistent development within regions.
  • Ear and kernel traits: Ear length was similar across regions (14.86–17.76 cm), while the number of kernels per row was highest in the South (36.09) and most variable in the North-East (CV = 19.79%). Kernel type in southern populations showed the highest variability (CV = 26.48%).
  • Productivity traits: 1000-kernel weight and grain yield were highest in southern populations (325.38 g and 3.54 t/ha, respectively), with lower variability (CV < 22%), while North-East populations had the lowest mean values and highest variation, suggesting potential for selection in breeding programs.
Southern populations exhibited taller plants and higher productivity, aligning with findings by Eller et al. (2008) [29], who noted that southern maize genotypes often demonstrate enhanced growth characteristics. In contrast, northeastern populations were shorter with earlier flowering times, a pattern that may reflect regional adaptation strategies.
According ANOVA test, most traits, including plant height, ear length, number of kernel rows, and number of kernels per row, differed significantly among regions (p < 0.05), whereas kernel type and grain yield showed no significant differentiation (Table 1). Southern populations were generally taller and later flowering, while northeastern populations were shorter and earlier. Ear traits also varied, with longer ears and higher kernel numbers in southern and central-west populations. Coefficients of variation indicated substantial intraregional diversity.
Histograms of morphological traits (Figure 1) confirmed continuous, near-normal distributions, consistent with polygenic inheritance and reflecting adaptation to local environments.
Overall, the Figure 1 highlights that southern populations combine taller plants, higher productivity, and extended vegetative growth, whereas populations from the North-East exhibit shorter plants, lower yields, and slightly reduced kernel characteristics but higher variability. These patterns reinforce the potential of southern landraces as superior germplasm sources for breeding programs targeting both productivity and stress adaptation.

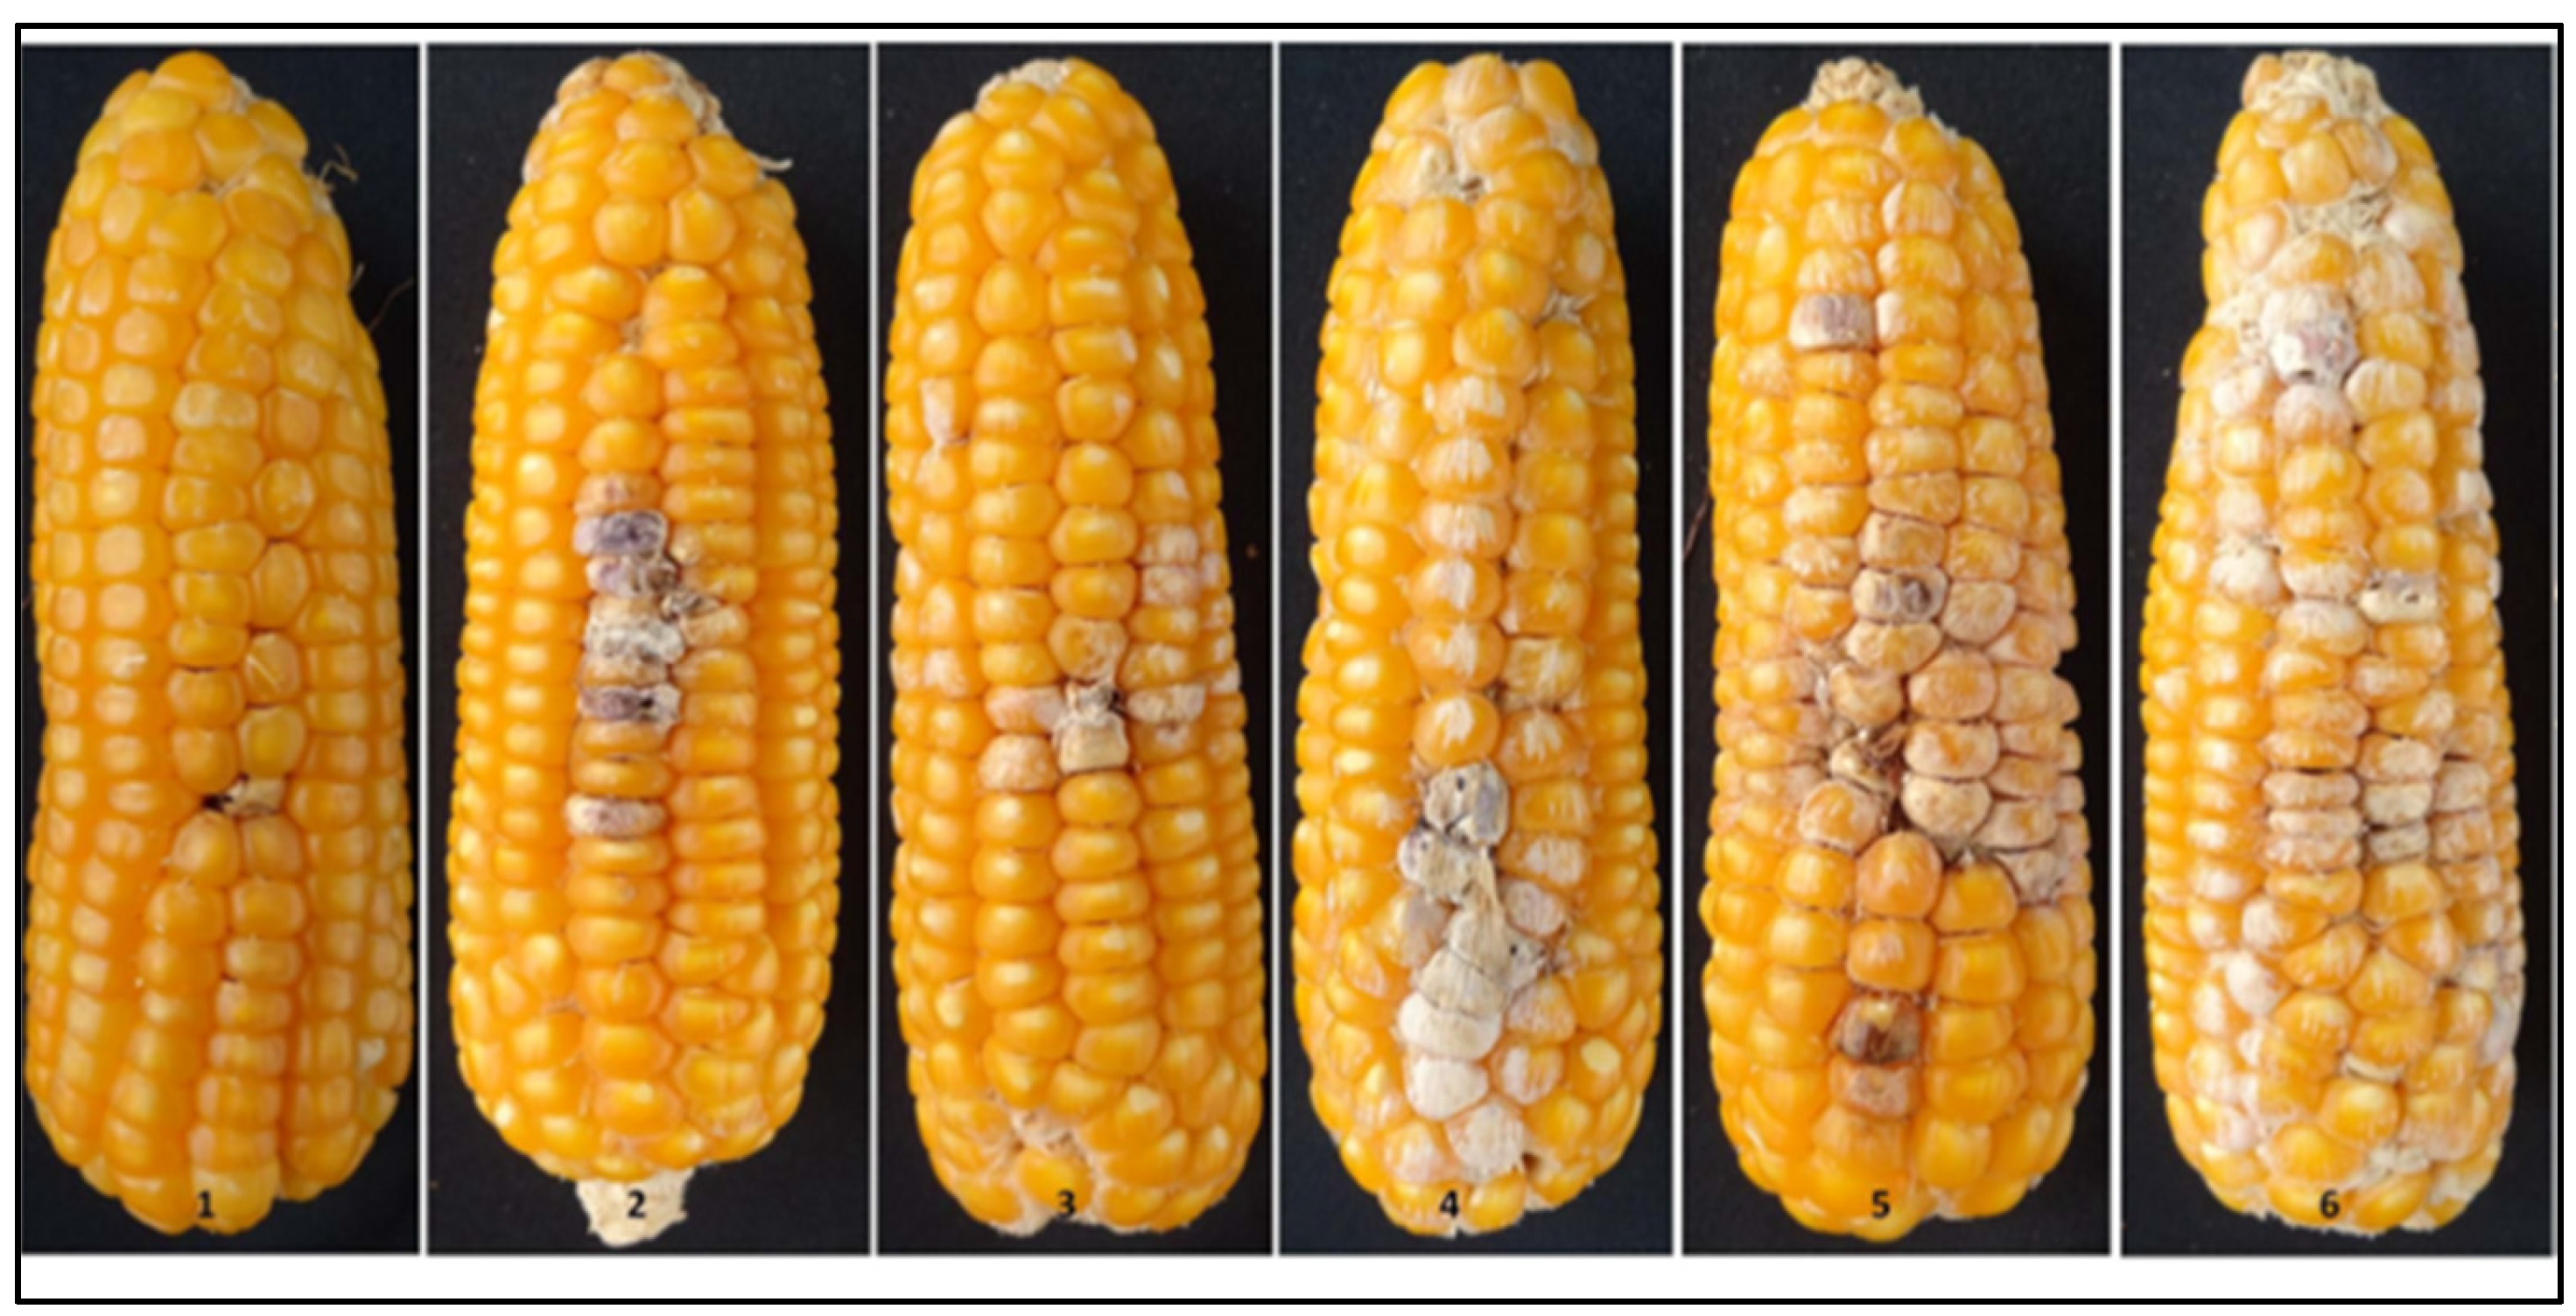
2.2. Assessment of Disease Severity and Fumonisin Content in maize grains infected by F. verticillioides f.sp.moniliforme

Regarding the level of resistance to F. verticillioides f.sp.moniliforme of the studied maize populations, determined by phenotypic evaluation of infested ears under natural conditions in the experimental field of ARDS Suceava, it highlights a considerable amplitude of variation in both the percentage of kernels damaged by F.verticillioides and the associated fumonisin content across maize populations from different geographical regions (Table 2). The proportion of damaged kernels ranged consistently from 8% to 40%, indicating a uniform baseline susceptibility among landraces but also significant variability in their response to natural infection. The mean fumonisin concentrations exhibited regional differences, with the South (mean 749.70 μg/kg) and North East (mean 724.44 μg/kg) regions recording the highest average levels, while the Center West (mean 508.00 μg/kg) displayed comparatively lower contamination. Notably, the maximum fumonisin concentration reached 2,178 μg/kg in all regions, emphasizing the potential for high toxin accumulation irrespective of geographical origin under favorable conditions for fungal proliferation (Table 2; Figure 2). Research by Santiago et al. (2023) [30] emphasizes the importance of identifying genotypes with inherent resistance to this pathogen. While our study did not directly assess Fusarium resistance, the observed morphological traits, such as plant height and ear length, may indirectly correlate with resistance levels. For instance, taller plants with robust ear structures might exhibit better resistance due to enhanced canopy architecture and reduced ear exposure to fungal spores. Fumonisin B1, produced by Fusarium species, poses significant health risks, including hepatotoxicity and nephrotoxicity in animals and humans (World Health Organization, 2007)[31]. Our study’s agronomic data suggest that southern landraces, with their higher productivity, might also be more susceptible to fumonisin contamination due to increased biomass. This aligns with findings by Gesteiro et al. (2021) [32], who reported that higher yielding maize genotypes often accumulate more fumonisins. However, as noted by Morales et al. (2019), [33] breeding for Fusarium resistance and reduced fumonisin contamination requires a balanced approach, integrating both phenotypic selection and molecular techniques.
Additionally, employing genomic tools, as suggested by Cao et al. (2022), [34] could facilitate the identification of quantitative trait loci associated with resistance to Fusarium and fumonisin accumulation.

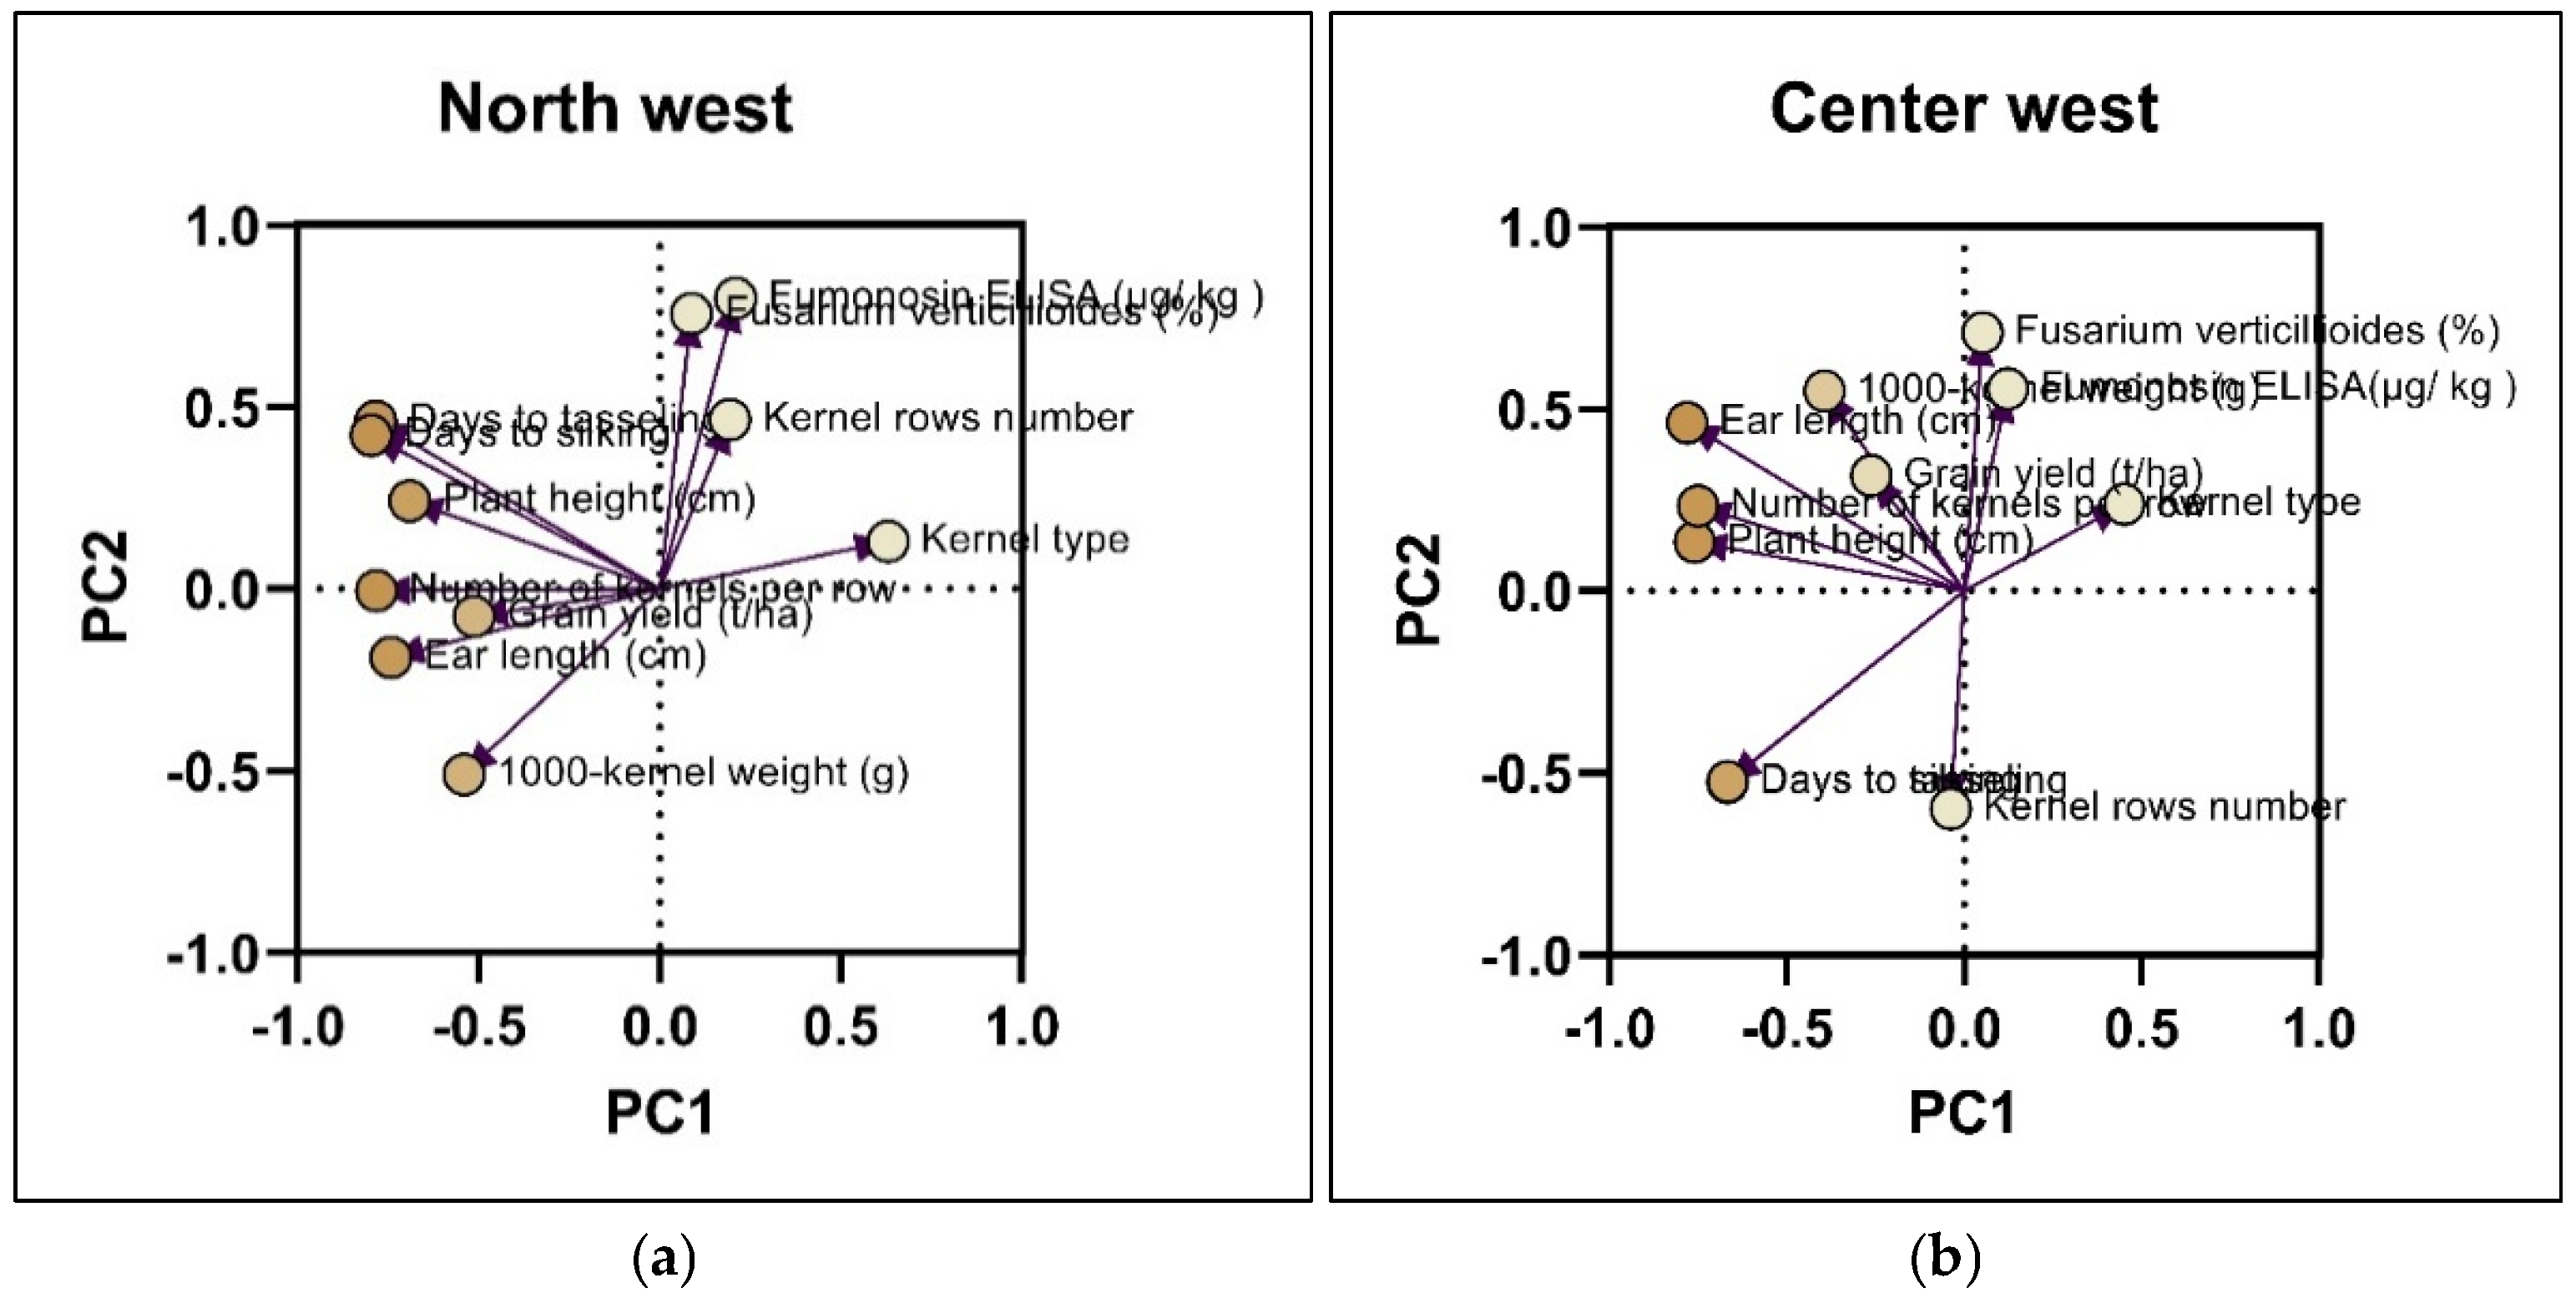
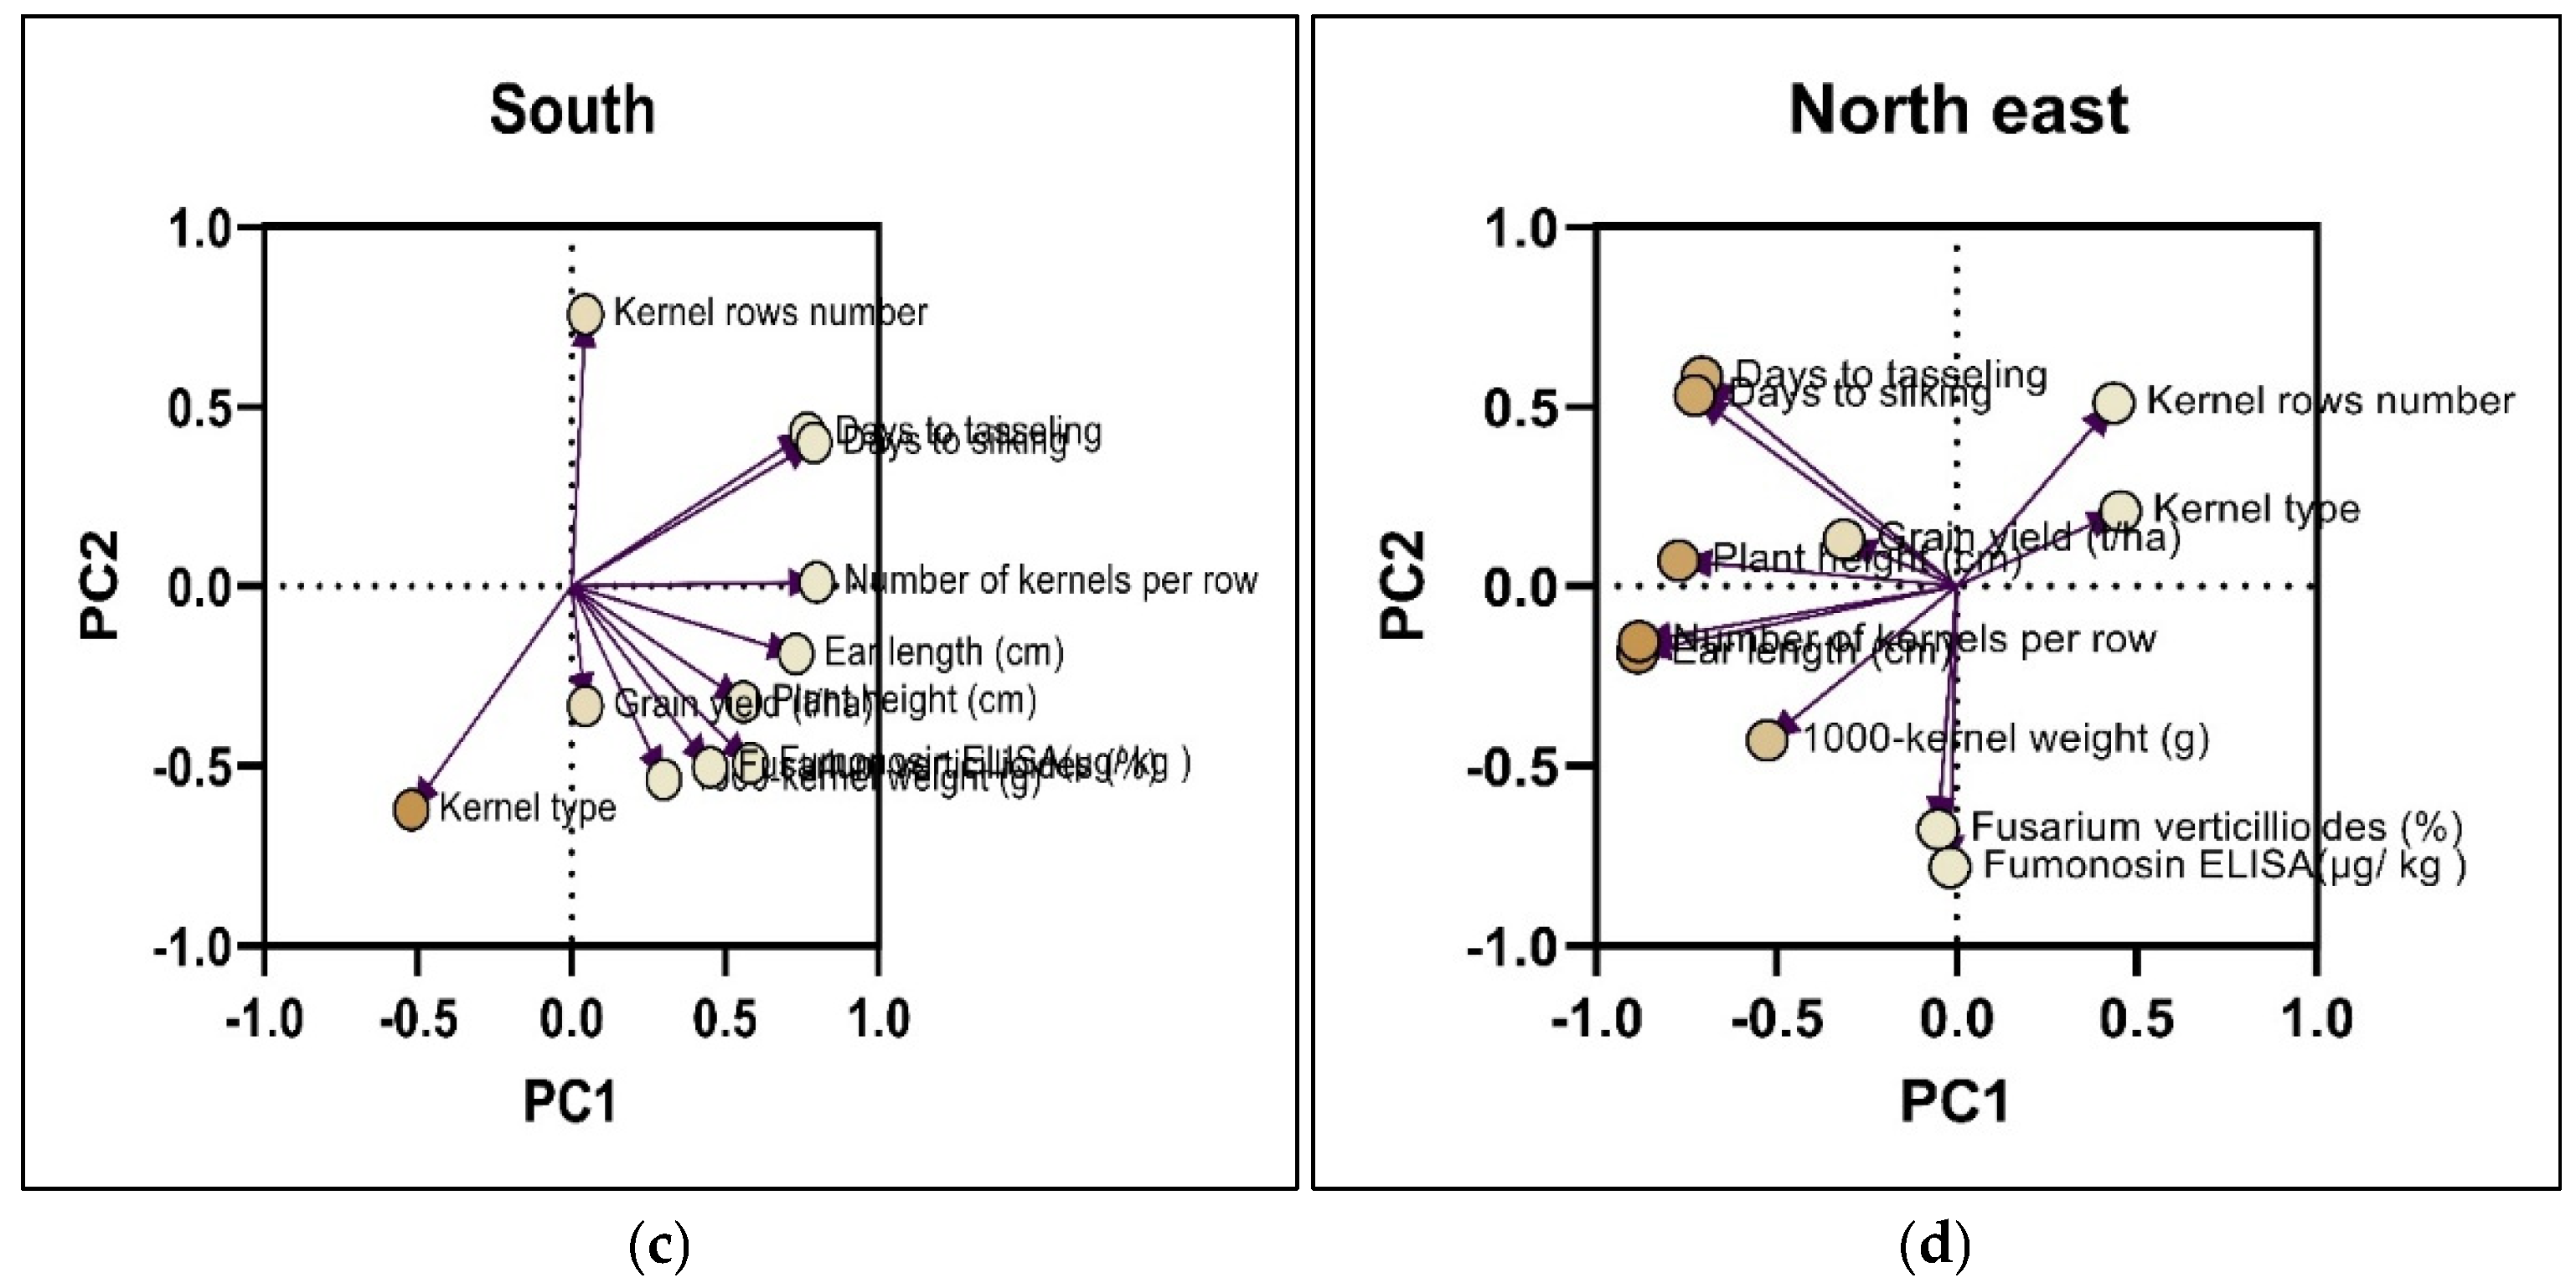
2.3. Principal Component Analysis (PCA) on the Incidence of Damaged Kernels by F. verticillioides f.sp.moniliforme and Fumonisin Content

Principal Component Analysis (PCA) provides insights into the incidence of Fusarium and fumonisin mycotoxin content in the phenotyping of the tested maize germplasm of different origins. All three principal components (PC1, PC2, PC3) had eigenvalues greater than 1, representing a major share of the variation. The highest contribution to variation was explained by PC1 (35.98%) in the North-East and PC2 (22.38%) in the Central-West, while the lowest was PC3 (15.12%) in the South (Table 3). Also the Table 5 presents the cumulative variation, eigenvalues, and variable loadings of the principal components (PCs) derived from the correlation matrix of the evaluated maize populations originating from four geographical regions. The results indicate that the first two principal components (PC1 and PC2) explained a substantial proportion of the total variation in each region, ranging from 48.43% in the Center West to 55.88% in the North East, while in the South, three components (PC1, PC2, and PC3) were required to account for 69.02% of the total variance.
Comparable multivariate patterns have been reported in other maize diversity studies, where phenological and ear-related traits explained most of the phenotypic variation among landraces [35,36,37].
The data from Table 3 and the eigenvectors of these variables highlight, in populations from the North-West, the highest negative values in PC1 for phenological traits [days to flowering (−0.785) and silking (−0.798)], plant height (−0.691), and productivity elements [ear length (−0.743), number of kernels per row (−0.783)]. All these descriptors play a discriminatory role in tolerance to fusariosis and fumonisin. In PC2, higher positive values were recorded for fumonisin mycotoxin (0.798) and F. verticillioides infection (0.755). These descriptors play a discriminant role in tolerance to F. verticillioides infection and fumonisin accumulation. Similar associations between late flowering, increased plant height, and partial resistance have been described by Santiago et al. (2015) [38] and Cao et al. (2022) [34], suggesting that longer vegetative phases may enhance the activation of defense-related pathways. In contrast, PC2 displayed higher positive loadings for fumonisin content (0.798) and F. verticillioides infection (0.755), reinforcing the independence between morphological development and pathogen response.
In the North-East, PC1 was dominated by negative loadings for number of kernels per row (−0.881), ear length (−0.885), and plant height (−0.771), whereas PC2 (20.50%) grouped fumonisin contamination and kernel damage (−0.782 and −0.677, respectively). These results align with observations by Munkvold (2017) [39] and Lanubile et al. (2021), [40] who emphasized that kernel architecture and compact ears may increase fungal colonization and fumonisin accumulation due to reduced aeration and delayed drying.
The PCA for Central-West germplasm revealed a more balanced distribution of variables defining PC1 and PC2. Traits such as plant height (−0.784), ear length (−0.746), number of kernels per row (−0.750), days to flowering (−0.652), and silking (−0.648) had negative values in PC1, suggesting a link between robust vegetative growth and Fusarium tolerance. Positive loadings for kernel type (0.533), thousand-kernel weight (0.570), and ear length (0.569) may reflect susceptibility components associated with looser kernel structure or thicker pericarps. Cao et al. (2022) [34] similarly reported that regions associated with cell wall reinforcement, flavonoid metabolism, and stress signaling contribute to reduced infection and fumonisin accumulation, supporting the functional significance of these traits in resistance breeding.
Compared to other regions, southern populations displayed a distinct multivariate structure, requiring three components (PC1–PC3) to describe trait variation. High positive loadings for days to flowering (0.766), days to silking (0.738), ear length (0.730), and number of kernels per row (0.797) in PC1 indicate strong covariation among yield-related and developmental traits. In PC3, negative loadings for F. verticillioides infection (−0.552) and yield (−0.642) suggested that resistance was not strictly linked to productivity. Similar findings were noted by Balconi et al. (2024) [36] and Santiago et al. (2015) [38], who observed weak or negative correlations between ear rot resistance and grain yield, highlighting the need to balance defense and productivity in breeding programs.
Overall, the PCA results emphasize that phenological traits (days to tasseling and silking) and yield-related descriptors (ear length, kernels per row, and kernel weight) were the main drivers of genetic variability across all regions, whereas fumonisin content and kernel damage represented distinct, largely independent axes of variation. This pattern agrees with reports that resistance to Fusarium ear rot and fumonisin contamination is polygenic and only partly correlated with morphological traits [34,40] . Therefore, breeding strategies aiming to combine high yield potential with enhanced resistance to F. verticillioides and reduced fumonisin accumulation will require the simultaneous selection of partially independent trait complexes through marker-assisted and genomic selection approaches [39,41].
The biplot graph (Figure 3a) shows the projection of the studied traits on the first two principal components (PC1 and PC2), which together explain 55.67% of the total variation (PC1: 35.78%, PC2: 19.89%). PC1 (horizontal axis) is primarily associated with phenological and yield-related traits, including plant height, days to tasseling and silking, ear length, number of kernels per row, and 1000-kernel weight. These traits cluster closely together, indicating a strong positive correlation among them and their contribution to the differentiation of the maize populations along this component. PC2 (vertical axis) is mainly defined by resistance-related variables, specifically fumonisin content and the percentage of kernels damaged by F. verticillioides, which are positioned in the upper quadrant. This highlights that toxin accumulation and kernel damage represent a separate source of variability, partially independent from yield and phenological traits. Kernel type and the number of kernel rows show intermediate loadings, suggesting moderate contributions to both PCs.
Thus, the graphical distribution for the North west maize accessions indicates that yield performance and phenological traits are strongly interrelated, while resistance-related traits (fumonisin levels and kernel damage) form a distinct variability axis. This separation suggests that improving resistance to F. verticillioides and reducing fumonisin accumulation in these populations may require targeted selection strategies, as these traits are not strongly correlated with yield potential.
The Figure 3b represents the distribution of traits across the first two principal components (PC1 and PC2), which together explain 56.48% of the total variability (PC1: 35.98%, PC2: 20.50%), for maize accessions coming from North east of country. PC1 (horizontal axis) is strongly associated with phenological and yield-related traits, such as plant height, days to tasseling and silking, ear length, number of kernels per row, and 1000-kernel weight. These traits cluster together on the negative side of PC1, indicating that they are positively correlated and contribute jointly to the variability in these populations. PC2 (vertical axis) captures variation related to kernel row number, kernel type, and flowering traits, suggesting that these descriptors provide additional differentiation between genotypes in this region. Conversely, fumonisin content and kernel damage by F. verticillioides are positioned on the lower side of the vertical axis (negative PC2 values), forming a distinct group from yield and phenological traits. This placement indicates that resistance-related traits are relatively independent from productivity traits in these populations. Just like the maize populations coming from North West the plot suggests that in the North-East maize populations, phenological and yield components are closely linked, while resistance-related traits form a separate axis of variability. This separation implies that simultaneous improvement for both yield potential and resistance to F. verticillioides infection may require multi-trait selection strategies to exploit the genetic diversity present in these landraces.
The biplot graph (Figure 4c) illustrates the distribution of the studied traits along the first two principal components, which together explain 50.92% of the total variation (PC1: 28.54%, PC2: 22.38%), for maize accessions collected from Center west of country. PC1 (horizontal axis) shows a moderate distribution of traits but does not display strong clustering, indicating that no single trait dominates this axis. This suggests a more balanced variability in this population compared to other regions. PC2 (vertical axis) explains a larger share of variation and is primarily associated with ear length, kernel number per row, grain yield, and 1000-kernel weight, as well as fumonisin content and the percentage of kernels damaged by F. verticillioides, all positioned in the upper half of the graph. This clustering indicates a positive relationship between yield components and susceptibility to Fusarium infection, meaning that genotypes with higher yield potential may also present a higher risk of contamination. Phenological traits (days to tasseling and silking) and kernel row number are located in the lower quadrant, suggesting that they contribute less to the primary axes of variation in this region. Overall, the PCA for the Center-West populations suggests that yield-related traits and resistance/susceptibility indicators are more closely aligned than in other regions, which could pose a challenge in breeding programs aimed at simultaneously improving yield potential and reducing fumonisin accumulation. This indicates a need for careful selection strategies to break the apparent association between productivity and susceptibility to F. verticillioides.
Figure 4d shows the distribution of traits along the first two principal components, which together explain 53.90% of the total variation (PC1: 32.68%, PC2: 21.22%). PC1 is primarily associated with phenological and yield-related traits, such as days to tasseling and silking, plant height, ear length, number of kernels per row, 1000-kernel weight, and grain yield. These traits cluster together on the positive side of PC1, suggesting a strong positive correlation among them and indicating that genotypes with taller plants and longer ears tend to produce higher yields. PC2 is dominated by kernel row number, positioned in the positive quadrant, showing that this trait contributes independently to the genetic variation within these populations. Kernel type appears isolated in the negative quadrant of PC1, indicating its weak association with the main yield and phenological traits in these populations. Additionally, fumonisin content and kernel damage appear closely aligned with yield-related traits along PC1, suggesting that in the southern populations, high-yielding genotypes might also be more susceptible to F. verticillioides infection and fumonisin accumulation. So that, the PCA results highlight that in the southern maize populations, yield potential and phenological traits are tightly linked, while kernel row number provides a separate source of variability. Breeding programs targeting this region should consider strategies that break the correlation between yield performance and susceptibility to infection to develop genotypes that combine high productivity with improved resistance.

2.4. Cluster Analysis

The hierarchical cluster analysis of local maize germplasm (172 populations) from different regions was performed by grouping them into four clusters with different numbers of members (92 in Cluster A, 27 in Cluster B, 29 in Cluster C, and 27 in Cluster D), using (8.06%). At the opposite end was Cluster D, characterized by a high risk of F. verticillioides infection (24.28%) and high fumonisin content (1879.70 μg/kg), with lower mean performance values, similar to Cluster A, for some morpho-productive traits: plant height (185.70 cm), phenotypic data, the incidence of F. verticillioides, and fumonisin content (Table 4).The overall mean values of the descriptors in the analyzed clusters highlighted Cluster C as having the best agronomic performance of local maize populations in terms of plant architecture and phenology, productivity traits, moderate resistance to Fusarium and fumonisin content, representing very good adaptability to the agro-climatic conditions of the Suceava Plateau, regardless of area of origin. Members of Cluster C stood out with the following overall mean values: plant height (200.93 cm), number of days to tasseling (76.28) and days to silking (77.06), ear length (18.89 cm), Number of kernel rows (12.65), number of kernels per row (40.30), kernel type (3.5), thousand-kernel weight (345.55 g), yield (3.47 t/ha), fumonisin content (587.37 μg/kg), and F. verticillioides infection rate number of days to flowering (71.80) and silking (72.08), ear length (16.36 cm), kernel rows number (11.83), number of kernels per row (33.94), kernel type (6.0), 1000- kernel weight (287.08 g), and grain yield (3.32 t/ha). Members of Clusters A and B showed intermediate mean values compared to the other two clusters with respect to agronomic traits and lower levels of Fusarium of members (92 in A; 27 in B), higher mean values for traits such as plant height (187.11 cm in A; 165.75 cm in B), number of kernels per row (34.26 in A; 26.80 in B), 1000-kernel weight (308.27 g in A; 212.85 g in B), and a lower mean fumonisin content (266.34 μg/kg in A; 602.52 μg/kg in B). Members of Cluster A displayed similar agronomic characteristics, even though they originated from different geographical regions. Cluster B included a smaller number of members, originating only from three geographical regions, and showed the greatest distance from Cluster A, with a distinct genetic and agronomic profile determined by possible local adaptations of the regions of origin.
*Number of accessions/cluster (N), Plant height - cm (PH), Days to tasseling (DT), Days to silking (DS), Ear length- cm (EL), Kernel row number (NRG), Number of kernels per row (NKR), Kernel type (KT), 1000-kernel weight -g (KW), grain yield -t/ha (GY), Fumonosin content - μg/ kg (FC), kernels damaged by F. verticillioides - % (KDF).
The analysis of distances among Clusters A, B, C, and D, and the construction of the similarity matrix between the tested genotypes, based on 11 variables characterized for each area of origin, used the squared Euclidean distance as a measure and the Ward Linkage method as the clustering algorithm (IBM SPSS Statistics, version 26). In the Ward dendrogram (Figure 5), the grouping possibilities of the 172 local maize populations of different origins can be observed, using the similarities among the biometric traits. This provided valuable information for selecting initial material in maize breeding programs aimed at tolerance to Fusarium and control of fumonisin content.
Accordingly, Cluster B with 27 members (6 accessions from the North-West, 16 accessions from the North-East, 5 accessions from the Central-West), being the most genetically isolated group due to its large distance from the other three clusters, suggests a potentially valuable genetic pool for breeding programs through its morpho-physiological variability and resistance to Fusarium (Figure 6).

4. Materials and Methods

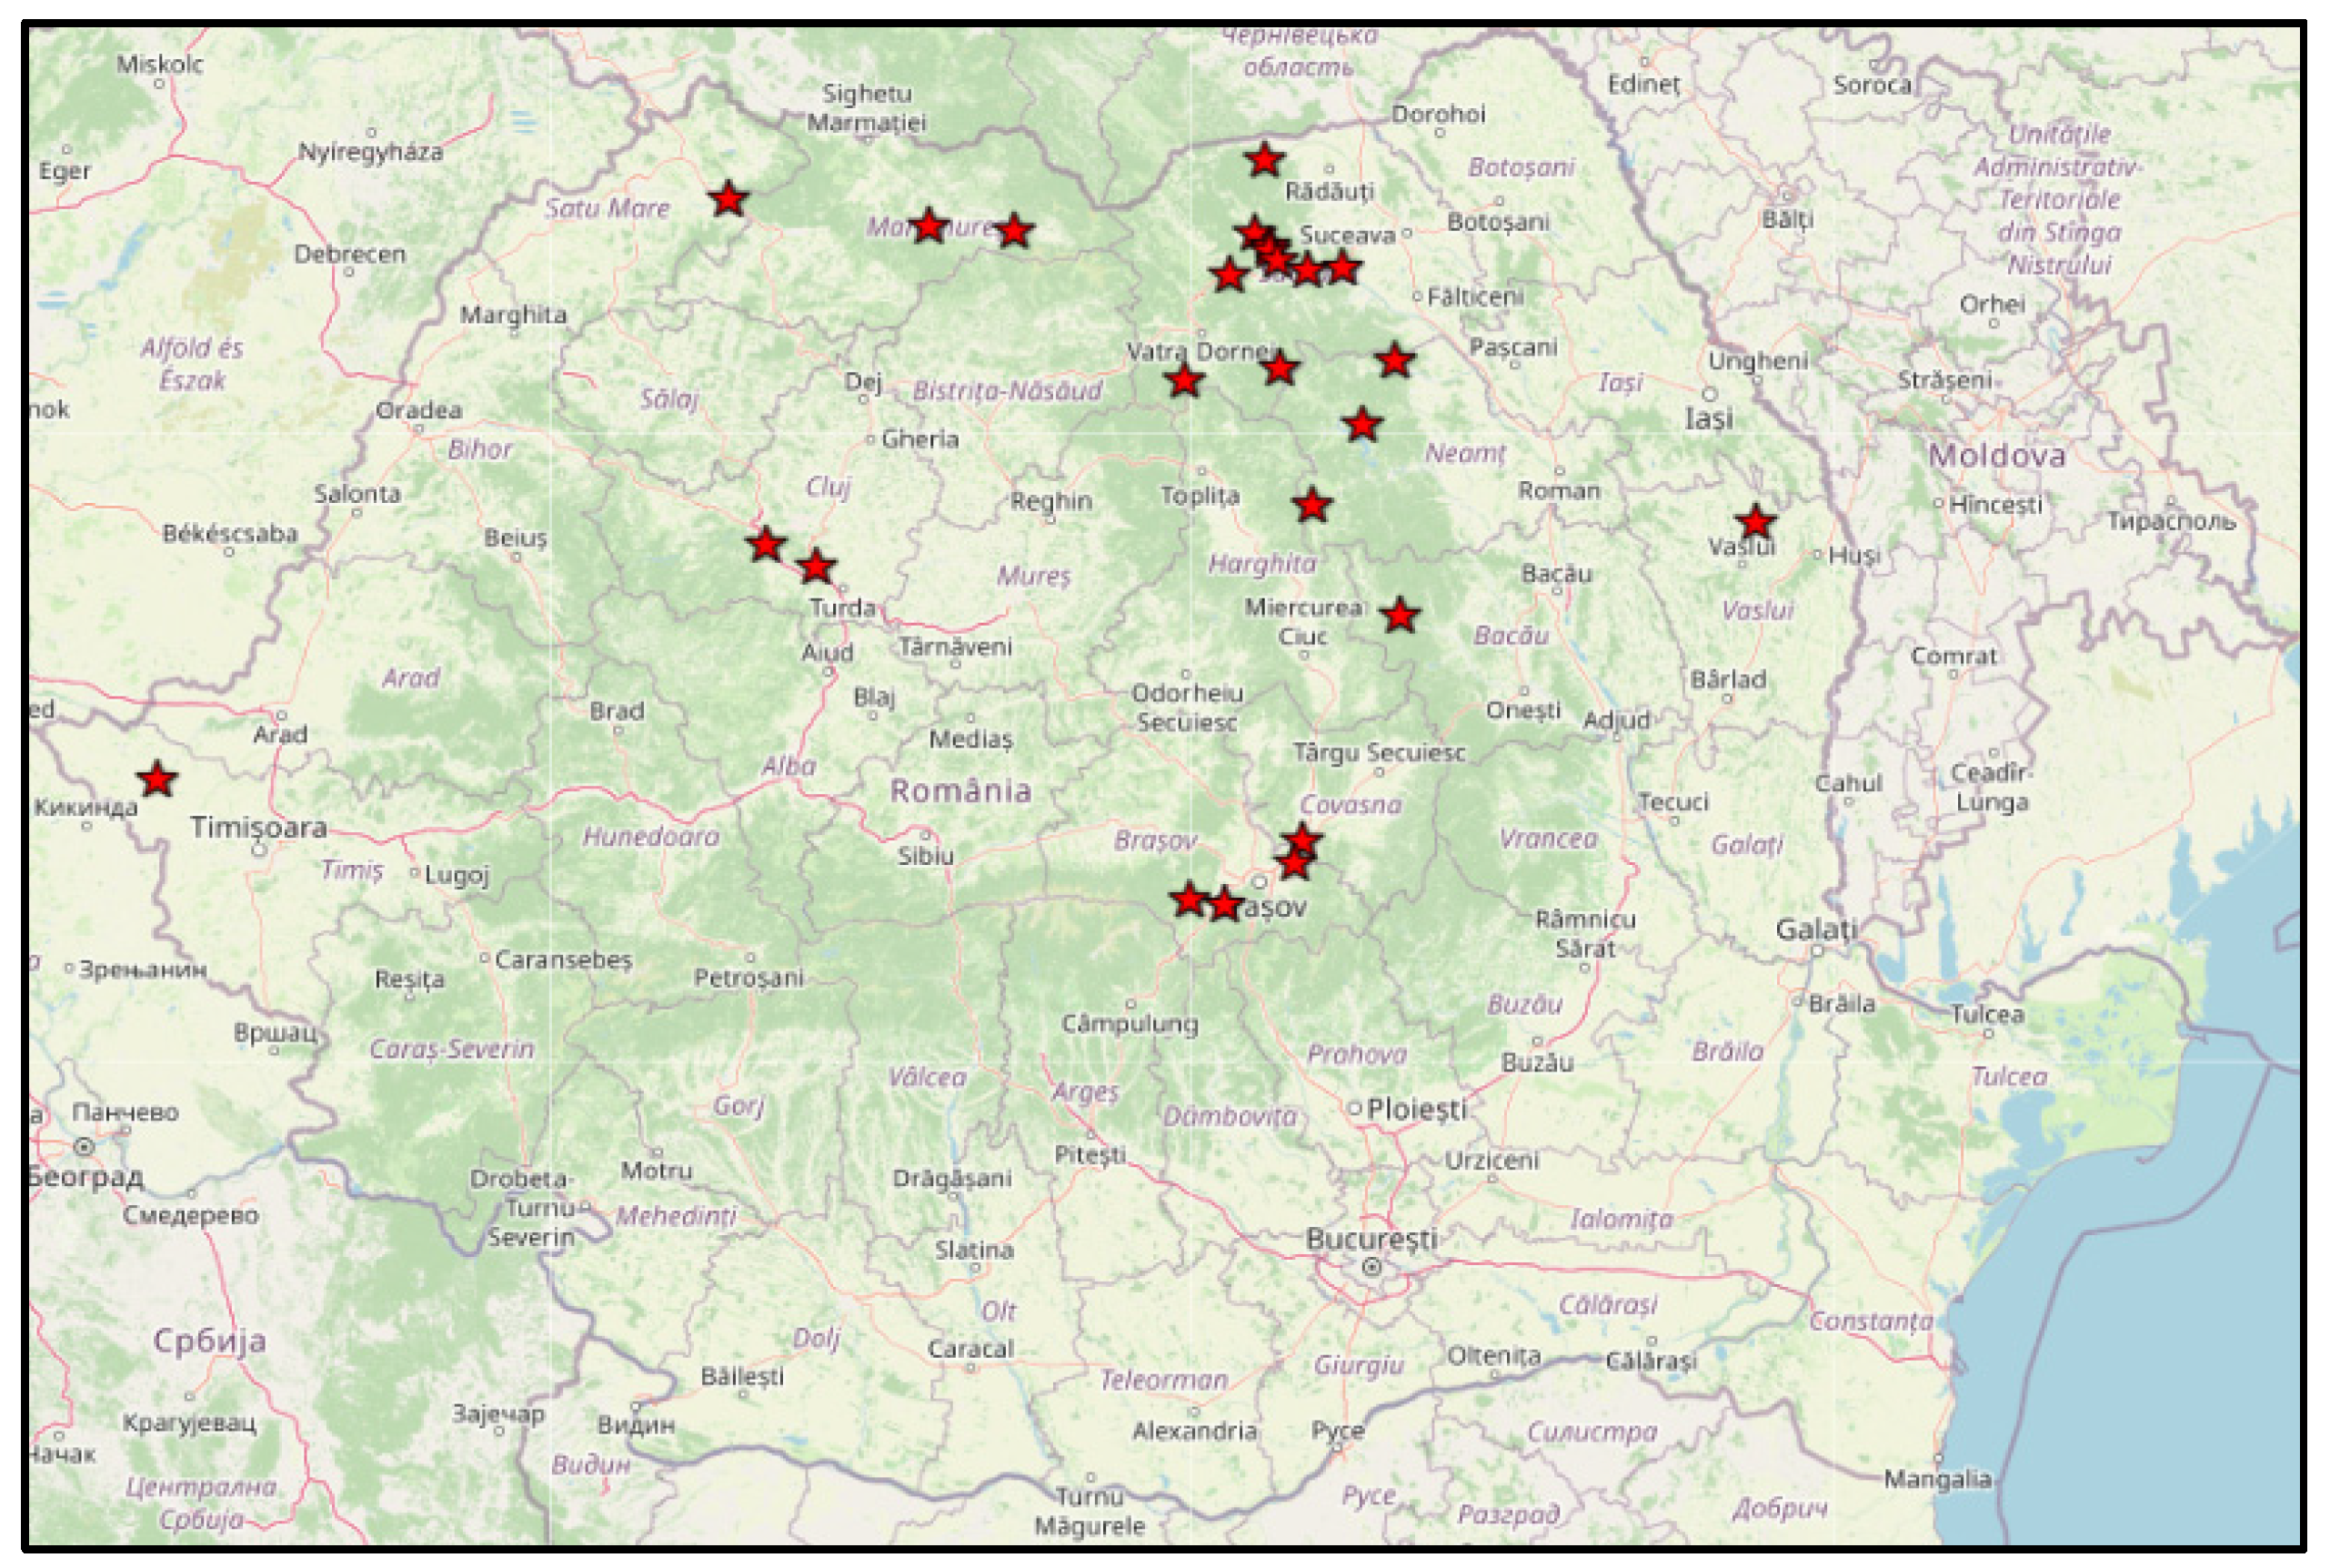
4.1. Plant Material and Climatic Conditions

This investigation, focused on evaluating the morpho-productive traits and resistance to F. verticillioides in local maize populations originating from diverse regions of Romania, was carried out in the maize breeding fields of the Agricultural Research and Development Station (ARDS) Suceava and in the phytosanitary control laboratory of Suceava Gene Bank.
The biological material consisted of 172 local maize populations from the Gene Bank collection, originating from different geographical regions (46 accessions/North-West, 49 accessions/North-East, 46 accessions/Central-West, and 31 accessions/South) (Table 5).
Table 5. The origin of the analyzed Romanian local maize landraces.
North-west North-east Center-west South
46 acc. 49 acc. 46 acc 31 acc
Origin
(county)
Number of studied landraces Origin
(county)
Number of studied landraces Origin
(county)
Number of studied landraces Origin
(county)
Number of studied landraces
Bistrița Năsăud 6 Bacău 13 Alba 9 Vrancea 3
Cluj 19 Botoșani 3 Brașov 6 Gorj 2
Maramureș 10 Iași 3 Mureș 6 Călărași 1
Satu Mare 2 Neamț 10 Covasna 1 Vâlcea 3
Bihor 8 Suceava 17 Harghita 3 Dâmbovița 1
Salaj 1 Vaslui 3 Sibiu 3 Mehedinți 1
Hunedoara 12 Dolj 3
Arad 1 Galați 2
Caraș Severin 2 Argeș 15
Timiș 3
The accessions were sown in 2021 in the experimental field of ARDS Suceava under the specific climatic conditions (Table 6). Each accession was planted in two rows, with an inter-row spacing of 70 cm and a row length of 5 m.
The climatic data (Table 6) recorded during the vegetation season of year 2021, indicate significant deviations from the multiannual averages. Average monthly temperatures were consistently higher than the multiannual averages, with the largest deviations observed in July (22.5 °C vs. 18.4 °C) and June (19.0 °C vs. 16.9 °C). Rainfall levels were markedly lower than the multiannual totals across most months, particularly in July (11.0 mm compared to 88.6 mm) and October (1.6 mm compared to 29.5 mm). The total rainfall during the vegetation season was 151.3 mm, representing less than 40% of the multiannual total (394.7 mm). These conditions indicate a hotter and considerably drier season, which likely influenced plant growth, productivity, and stress response to the biotic factors [24].

4.2. Phenotypic Evaluations

The resistance of maize germplasm to F. verticillioides infection was evaluated after harvest in the phytopathology laboratory of the gene bank, on 1,046 ears from 172 maize accessions. The macroscopic method was applied using a typical scheme (Figure 7) and a standard scoring scale from 1 to 6 [score 1 = 0%, score 2 = 1–10%, score 3 = 11–25%, score 4 = 26–45%, score 5 = 51–75%, score 6 = 76–100%] according to CIMMYT [25].
Biometric measurements were carried out on plants, ears, and kernels, with data collected for phenological traits (days to flowering, days to silking), plant architecture traits [plant height (cm), ear length (cm), kernel rows number, number of kernels per row, kernel type], and productivity traits [1000-kernel weight (g), yield (t/ha)], [26].

4.3. Laboratory and Statistical Analysis

4.3.1. Estimation of Fumonisin Concentration

The estimation and quantification of mycotoxins produced by Fusarium in the cereal industry is based on immunoassay methods [27].The fumonisin concentration in the studied maize germplasm was determined in an accredited laboratory using the immunochemical ELISA method (Enzyme-Linked Immunosorbent Assay), following the protocol provided by the ELISOFUMO Kit (PS-LR-05, Ed. VI, Rev. 00, Annex VI, 19/04/2019).Mycotoxin levels in the maize germplasm were determined using an ELISA immunoassay, with measured concentrations ranging from the limit of detection (LOD, 36 µg/kg) to the limit of quantification (LOQ, 52 µg/kg). For each analysis, approximately 100 g of maize kernels were used, in accordance with European Regulation (EU) No. 915/2023, [28].

4.3.2. Statistical Analysis of Collecting Data

The collected data were analyzed using statistical approaches appropriate for identifying productive and Fusarium-resistant maize genetic sources. The variability of the tested germplasm was assessed through descriptive statistics, including range, mean, standard deviation, coefficient of variation and ANOVA test, while hierarchical clustering (Ward’s method and Euclidean distance) was applied to determine trait similarity, using IBM SPSS Statistics, version 26. Additionally, Principal Component Analysis (PCA) was performed on the studied local populations for 11 evaluated descriptors, employing GraphPad Prism 9.3.0.

5. Conclusions

The concept described in this study highlights the role of the phenotypic diversity available in local maize populations from different geographical areas of the country regarding the impact of the micromycete F. verticillioides f. sp. moniliforme and the management of the fumonisin mycotoxin. The evaluation of phenotypic diversity (morpho-physiological and agronomic traits) through descriptive statistical parameters (range of variation, mean, standard deviation, coefficients of variation) revealed that local populations originating from the South had the best mean values for most of the analyzed traits (plant height, ear length, thousand-kernel weight, yield, kernel type). At the opposite end were the populations from the North-East, characterized by earliness and genetic diversity in productivity elements, followed by those from the North-West and Central-West, which displayed relatively stable and constant variability for the analyzed traits. Also the results of one way ANOVA indicate significant differences between regions for all analyzed traits, except grain yield/ha.
Regarding quantitative resistance to F. verticillioides f. sp. moniliforme, determined through phenotypic evaluation of naturally infested ears in the experimental field, a relatively variable degree of infection was observed, with constant contamination and a high potential risk in some local populations from different regions. Vulnerability to Fusarium and fumonisin mycotoxin was manifested through susceptibility in local populations originating from the South and North-East, while resistance was observed in those from the North-West and Central-West, which showed lower contamination rates.
Principal Component Analysis highlighted a strong contribution to variation from PC1 (35.98%) in the North-East, PC2 (22.38%) in the Central-West, and a weaker but significant contribution from PC3 (15.12%) in the South, revealing distinct relationships between productivity traits, resistance to F. verticillioides f. sp. moniliforme, and fumonisin content. The PCA biplot graphs showed a clear opposition between vectors describing yield and those indicating resistance to Fusarium. Thus, it was found that populations originating from the North-East with high thousand-kernel weight, and those from the Central-West with long ears, high 1000-kernel weight, and a specific kernel type, are more susceptible in terms of disease resistance and fumonisin content levels. In populations from the South, the same trend of opposition between contamination and productivity vectors was maintained, but with weaker implications of Fusarium attack and mycotoxin content compared to those from the North-West, where the relationship between vectors was more evident: ears with high 1000-kernel weight, ear length, kernel rows number and a certain kernel type were more susceptible to contamination with Fusarium and fumonisin accumulation.
PCA analysis confirmed a tendency for separation between productive traits and those associated with contamination, indicating a potential trade-off between yield and resistance. This has major importance for the balanced selection of tested local populations as genetic sources in maize breeding strategies.
The most valuable and distinct local populations, indicating genetic uniqueness as determined from the structure of the Ward Linkage dendrogram, were found especially in Cluster B, which is relatively small with 27 members (6 accessions from the North-West, 16 accessions from the North-East, 5 accessions from the Central-West). This cluster shows internal homogeneity and clear differentiation from Clusters A and C, making it a potential source of stable and rare traits for resistance to Fusarium and a low fumonisin content.

Author Contributions

Conceptualization D.D.P; data curation, D.D.P., D.M., and C.E.; methodology, D.D.P. și D.M.; writing—original draft preparation, D.D.P.; writing—review andediting, D.D.P., D.M., C.E.; visualization, D.D.P.; supervision D.M. and C.E.; project administration C.E.; funding acquisition, C.E. All authors have read and agreed to the published version of the manuscript

Funding

This study was supported by funding from the ARDS Suceava through the ADER 2.1.2 Project, which is part of the Sectoral Research and Development Plan in Agriculture and Rural Development of the Ministry of Agriculture and Rural Development (MADR)

Acknowledgments

This research was conducted within the framework of the ADER 2.1.2 Project, which is included in the Sectoral Research and Development Plan in Agriculture and Rural Development of the Ministry of Agriculture and Rural Development (MADR), under the legal coordination of ARDS Suceava.

Conflicts of Interest

The authors declare no conflicts of interest.

References

  1. Headrick, J. , and J. Pataky. Maternal influence on the resistance of sweet corn lines to kernel infection by Fusarium moniliforme. Phytopathology 1991, 81, 268–274. [Google Scholar] [CrossRef]
  2. Munkvold, G. P., and W. M. Carlton. Influence of inoculation method on systemic Fusarium moniliforme infection of maize plants grown from infected seeds. Plant Dis. 1997, 81:211–216.2.
  3. Munkvold, G. P., R. L. Helmich, and W. B. Showers. Reduced Fusarium ear rot and symptomless infection in kernels of maize genetically engi neered for European corn borer resistance. Phytopathology, 1077. [Google Scholar]
  4. Munkvold, G. P. C. McGee, and W. M. Carlton.Importance of different pathways for maize kernel infection by Fusarium verticillioides. Phytopathology 1997, 97, 209–217. [Google Scholar] [CrossRef] [PubMed]
  5. Kedera, C. J., J. F. Leslie, and L. E. Claflin. Systemic infection of corn by Fusarium moniliforme. Phytopathology 1992, 82:1138.
  6. Munkvold, G. P., R. L. Helmich, and W. B. Showers. Reduced Fusarium ear rot and symptomless infection in kernels of maize genetically engi neered for European corn borer resistance. Phytopathology 1997, 87:1071–1077.
  7. Czembor E., Stępień Ł, and Waśkiewicz A. Effect of environmental factors on Fusarium species and associated mycotoxins in maize grain grown in Poland. PloS One 10 (7) 2015, e0133644.
  8. Kimanya M., E. , De Meulenaer B., Tiisekwa B., Ndomondo-Sigonda M., Devlieghere F., Van Camp J. et al. Co-occurrence of fumonisins with aflatoxins in home-stored maize for human consumption in rural villages of Tanzania. Food Addit. Contam. Part A Chem. Anal. Control Expo. Risk Assess. 2008, 25 (11), 1353–1364.
  9. Burger, H. , Shephard G. , Louw W., Rheeder J., and Gelderblom W. The mycotoxin distribution in maize milling fractions under experimental conditions. Int. J. Food Microbiol. 2013, 165(1), 57–64. [Google Scholar] [PubMed]
  10. Betz F. S., Hammond B. G., and Fuchs R. L. Safety and advantages of Bacillus thuringiensis-protected plants to control insect pests. Regul. Toxicol. Pharmacol.2000, 32 (2).
  11. Li, T. , Gong L., Wang Y., Chen F., Gupta V. K., Jian Q. et al. Proteomics analysis of Fusarium proliferatum under various initial pH during fumonisin production. J. proteomics 2017, 164, 59–72. [Google Scholar] [CrossRef] [PubMed]
  12. Chulze, S. Strategies to reduce mycotoxin levels in maize during storage: a review. Food Additives Contamin 2010, 27(5), 651–657. [Google Scholar] [CrossRef] [PubMed]
  13. Picot, A. , Barreau C., Caron D., Lannou C., and Richard-Forget F. The dent stage of maize kernels is the most conducive for fumonisin biosynthesis under field conditions. Appl. Environ. Microbiol. 2011, 77(23), 8382–8390. [Google Scholar] [CrossRef] [PubMed]
  14. Alberts J., F. , Van Zyl, W. H., and Gelderblom, W. C. Biologically based methods for control of fumonisin-producing Fusarium species and reduction of the fumonisins. Front. Microbiol. 2016, 7, 548–556. [Google Scholar]
  15. Zingales, V.; Taroncher, M.; Martino, P.A.; Ruiz, M.-J.; Caloni, F. Climate change and effects on molds and mycotoxins. Toxins 2022, 14, 445. [Google Scholar] [CrossRef] [PubMed]
  16. Chen, X.; Abdallah, M.F.; Landschoot, S.; Audenaert, K.; De Saeger, S.; Chen, X.; Rajkovic, A. Aspergillus flavus and Fusarium verticillioides and Their Main Mycotoxins: Global Distribution and Scenarios of Interactions in Maize. Toxins 2023, 15, 577.
  17. Wu, F.; Bhatnagar, D.; Bui-Klimke, T.; Carbone, I.; Hellmich, R.; Munkvold, G.; Paul, P.; Payne, G.; Takle, E. Climate change impacts on mycotoxin risks in US maize. World Mycotoxin J. 2011, 4, 79–93. [Google Scholar] [CrossRef]
  18. Desjardins, A. E. D. Plattner, T. C. Nelsen, and J. F. Leslie. Genetic analysis of fumonisin production and virulence of Gibberella fujikuroi mating population A (Fusarium moniliforme) on maize (Zea mays) seedlings. Appl. Environ. Microbiol. 1995, 61, 79–86. [Google Scholar] [CrossRef] [PubMed]
  19. Nelson, P. E., A. E. Desjardins, and R. D. Plattner. Fumonisins, mycotoxins produced by Fusarium species: biology, chemistry and signifi cance. Annu. Rev. Phytopathology 1993, 31:233–252.
  20. Brown, R. Cleveland, C. Woloshuk, G. A. Payne, and D. Bhatnagar. Growth inhibition of a Fusarium verticillioides GUS strain in corn kernels of aflatoxin-resistant genotypes. Appl. Biotechnol. Microbiol. 2001, 57, 708–711. [Google Scholar] [CrossRef] [PubMed]
  21. Food and Drug Administration. Guidance for industry: fumonisin levels in human foods and animal feeds—draft guidance. Food and Drug Administration, 2000 Washington, D.C.
  22. Adiaha, M. S. Economic value of maize (Zea mays l.) in Nigeria and its impacts on the global food production. Int. J. Sci. World 2018, 9 (257), 280–284.
  23. Ncube E., Flett B. C., Waalwijk C., and Viljoen A. Fusarium spp. and levels of fumonisins in maize produced by subsistence farmers in south Africa. South Afr. J. Science 2011, 107 (1-2), 1–7.
  24. Medina, Á.; Rodríguez, A.; Magan, N. Climate change and mycotoxigenic fungi: Impacts on mycotoxin production. Curr. Opin. Food Sci. 2015, 5, 99–104. [Google Scholar]
  25. Suresh M., CIMMYT, 2019. Phenotyping for disease resistance to increase genetic gains 11-15 November 2019, Lilongwe, Malawi.
  26. IBPGR. Descriptors for Maize 1991, International Maize and Wheat Improvement Center, Mexico City/International Board for Plant Genetic Resources, Rome ISBN 92-9043-189-1.
  27. Marijana Sokolovic. HPLC and ELISA Methods for Detection and Quantification of Fumonisins in Naturally Contaminated Maize, 2022, Croatian Veterinary Institute Poultry Centre.
  28. Commission Regulation (EU) 2023/915 of 25 April 2023 on maximum levels for certain contaminants in food and repealing Regulation (EC) No 1881/2006, Anexis I, 16.1.
  29. Eller, M. S., Holland J.B. Gary A. Payne. Breeding for improved resistance to fumonisin contamination in maize. Crop Science, 2008. 48(5), 1-10.
  30. Di Pasquale, G.M.; Stagnati,L.; Lezzi, A.; Lanubile, A.;Marocco, A.;Rossi, G.; Busconi,M. Morphologicaland Genetic Characterization of MaizeLandraces Adapted to Marginal Hills in North-West Italy. Plants 2024, 13,1030.
  31. World Health Organization. Safety evaluation of certain mycotoxins in food. WHO Food Additives Series, 2007. 57, 1-147.
  32. Gesteiro N., Cao A., Santiago R., Malvar R.A. Butron A. Genomics of maize resistance to kernel contamination with fumonisins. BMC Plant Biology, 2021 21(1), 1-15.
  33. Morales L., Zila C.T., Moreta Mejía D.E., Montoya Arbelaez M., Balint Kurti P.J., Holland J.B., Nelson R.J., Diverse Components of Resistance to Fusarium verticillioides Infection and Fumonisin Contamination in Four Maize Recombinant Inbred Families.2019. Plant Pathology, 68(6), 1097-1107.
  34. Cao A, de la Fuente M, Gesteiro N, Santiago R, Malvar RA and Butrón A (2022) Genomics and Pathways Involved in Maize Resistance to Fusarium Ear Rot and Kernel Contamination With Fumonisins. Front. Plant Sci. 2022 13:866478.
  35. Kedera, C. J., J. F. Leslie, and L. E. Claflin. Systemic infection of corn by Fusarium moniliforme. Phytopathology 1992, 82: 1138 [Abstr.].
  36. Balconi, C.; Galaretto, A.; Malvar, R.A.; Nicolas, S.D.; Redaelli, R.; Andjelkovic, V.; Revilla, P.; Bauland, C.; Gouesnard, B.; Butron, A.; et al. Genetic and Phenotypic Evaluation of European Maize Landraces as a Tool for Conservation and Valorization of Agrobiodiversity. Biology 2024, 13, 454. [Google Scholar] [CrossRef] [PubMed]
  37. Doko, M.B.; Rapior, S.; Visconti, A.; Schjoth, J.E. Incidence and levels of fumonisin contamination in maize genotypes grown in Europe and Africa. J. Agric. Food Chem. 1995, 43, 429–434. [Google Scholar] [CrossRef]
  38. Santiago, R., Cao, A., Malvar, R.A., & Butrón, A. Genetic basis of maize resistance to Fusarium ear rot and fumonisin contamination. Frontiers in Plant Science, 2015. 6, 543.
  39. Munkvold, G.P. Fusarium species and their associated mycotoxins. Mycotoxins in Maize: Agronomic Management, Genetics, and Breeding Strategies. 2017.
  40. Lanubile A, Maschietto V, Borrelli VM, Stagnati L, Logrieco AF and Marocco A Molecular Basis of Resistance to Fusarium Ear Rot in Maize. Front. Plant Sci. 2017 8:1774.
  41. Chen, X.; Abdallah, M.F.; Landschoot, S.; Audenaert, K.; De Saeger, S.; Chen, X.; Rajkovic, A. Aspergillus flavus and Fusarium verticillioides and Their Main Mycotoxins: Global Distribution and Scenarios of Interactions in Maize. Toxins 2023, 15, 577. [Google Scholar] [CrossRef] [PubMed]
Figure 1. Histograms of phenotypical traits in 172 local maize populations, significantly differentiated by geographical origin.
Preprints 183361 g001aPreprints 183361 g001bPreprints 183361 g001c
Figure 2. The means of fumonisin content and percentages of infected kernels by Fusarium verticillioides (%) in maize populations originating from different geographical regions.
Preprints 183361 g002
Figure 3. Distribution of the analyzed traits in PC1 and PC2 of the studied local maize populations coming from the North-West (a) and North-East (b) of the country.
Preprints 183361 g003
Figure 4. Distribution of the analyzed traits in PC1 and PC2 of the studied local maize populations coming from the Center-West (c) and South (d) of the country.
Preprints 183361 g004
Figure 5. Ward dendrogram of cluster analysis based on Euclidean distance, phenotypic data, incidence of F. verticillioides (%), and fumonisin content in 172 tested local maize populations.
Preprints 183361 g005
Figure 6. The origin sites of the local maize populations in cluster B, showing morpho-physiological variability and resistance to F. verticillioides.
Preprints 183361 g006
Figure 7. Typical scheme for scoring F. verticillioides infection (CIMMYT, Suresh L.M., 2019).
Preprints 183361 g007
Table 1. Statistical parameters and ANOVA test of phenotypical traits in maize populations from diverse geographical origins.
Geographical region North west North east Center west South
Number of local landraces tested 46 49 46 31
Descriptors Plant height (cm)
Average 183.30 178.57 187.32 197.93
Range 143.00- 236.00 127.00- 232.00 140.00- 232.00 150.00- 251.00
Standard deviation 25.02 24.17 22.52 21.50
Coefficient of variation (%) 13.64 13.53 12.02 10.86
F - Anova/ p (0.05) F (3 , 171) = 4.53; p- 0.004
Tukey HSD Test- p (0.05) -14.63* -19.36* - 14.63*/ 19.36*
Descriptors Days to tasseling
Average 73.00 71.44 74.63 75.00
Range 66.00-79.00 66.00- 81.00 67.00- 81.00 68.00- 89.00
Standard deviation 3.20 3.64 2.71 3.97
Coefficient of variation (%) 4.38 5.09 3.63 5.29
F - Anova/ p (0.05) F (3 , 171) = 10.08; p- 0.000
Tukey HSD Test - p (0.05) - -3.18*/ -3.55* 3.18* 3.55*
Descriptors Days to silking
Average 73.43 71.77 75.08 75.54
Range 66.00-79.00 66.00- 81.00 67.00- 81.00 69.00- 90.00
Standard deviation 3.44 3.74 2.77 4.10
Coefficient of variation (%) 4.68 5.21 3.68 5.42
F - Anova/ p (0.05) F (3 , 171) = 10.267; p- 0.000
Tukey HSD Test- p (0.05) -2.11* -3.31*/-3.77* 3.31* 2.11*/ 3.77*
Descriptors Ear length (cm)
Average 17.21 14.86 17.44 17.76
Range 10.00- 21.40 14.86- 9.10 11.80- 24.60 12.60- 22.70
Standard deviation 2.39 3.17 2.43 2.32
Coefficient of variation (%) 13.88 21.33 13.93 13.06
F - Anova/ p (0.05) F (3 , 171) = 11.35 ; p- 0.000
Tukey HSD Test- p (0.05) 2.34* -2.34*/-2.57*/-2.89* 2.57* 2.89*
Descriptors Kernel rows number
Average 12.00 13.10 12.04 11.67
Range 8.00- 16.00 8.00- 20.00 8.00-16.00 10.00- 14.00
Standard deviation 1.68 2.12 1.60 1.64
Coefficient of variation (%) 14.00 16.18 13.28 14.05
F - Anova/ p (0.05) F ( 3, 171)=5.22; p-0.002
Tukey HSD Test- p (0.05) -1.10* 1.10*/1.05*/1.42* -1.05* -1.42*
Descriptors Number of kernels per row
Average 34.65 31.63 34.82 36.09
Range 16.00-43.00 21.00- 47.00 21.00-43.00 24.00-45.00
Standard deviation 5.03 6.26 4.93 4.76
Coefficient of variation (%) 14.51 19.79 14.15 13.18
F - Anova/ p (0.05) F ( 3, 171)=5.37; p-0.001
Tukey HSD Test- p (0.05) 3.01* -3.01*/-3.19*/ -4.46* 3.19* 4.46*
Descriptors Kernel type
Average 5.63 5.65 5.45 5.06
Range 3.00-6.00 2.00- 6.00 2.00- 6.00 2.00- 6.00
Standard deviation 0.79 0.99 1.06 1.34
Coefficient of variation (%) 14.03 17.52 19.44 26.48
F - Anova/ p (0.05) F ( 3, 171) = 2.43 ; p-0.067
Tukey HSD Test -p (0.05) - - - -
Descriptors 1000-kernel weight(g)
Average 305.43 255.00 303.32 325.38
Range 140.00-434.00 114.00-391.00 152.00-432.00 152.00-467.00
Standard deviation 58.85 66.86 62.45 61.12
Coefficient of variation (%) 19.26 26.21 20.58 18.78
F - Anova/ p (0.05) F ( 3, 171) = 2.43; p-0.067
Tukey HSD Test -p (0.05) 50.43* -50.43*/-48.32*/-70.38* 48.32* 70.38*
Descriptors Grain yield (t/ha)
Average 3.16 2.85 3.41 3.54
Range 1.30-5.20 0.70-5.00 0.80-4.80 1.40-4.80
Standard deviation 0.83 0.92 0.93 0.76
Coefficient of variation (%) 26.26 32.28 27.27 21.46
F - Anova/ p (0.05) F ( 3, 171) = 0.48; p-0.069
Tukey HSD Test- p (0.05) - - - -
Table 2. Mean and range of the proportion of damaged kernels by F. verticillioides f.sp.moniliforme and fumonosin contents in maize populations originating from different geographical regions, grown under natural infection conditions (Suceava, 2021).
Area of origin Number of local landraces tested Percent of damaged kernels by
F. verticillioides (%)
Fumonisin content
(μg/ kg )
Min Average Max Min Average Max
North west 46 8.00 7.00 40.00 151.0 639.39 2178.00
North east 49 8.00 8.89 40.00 151.0 724.44 2178.00
Center west 46 8.00 6.95 40.00 151.0 508.00 2178.00
South 31 8.00 7.74 40.00 151.0 749.70 2178.00
Table 3. Cumulative variation, vectors and eigenvalues of the principal components (PCs) for the correlation matrix based on the average of the values obtained in the case of studied maize populations coming from different geographical regions.
Descriptors North west North east Center west South
PC1 PC2 PC1 PC2 PC1 PC2 PC1 PC2 PC3
Plant height -0.691 0.241 -0.771 0.071 -0.784 0.232 0.559 -0.322 0.293
Days to tasseling -0.785 0.460 -0.707 0.582 -0.652 -0.491 0.766 0.426 -0.207
Days to silking -0.798 0.421 -0.727 0.530 -0.648 -0.495 0.788 0.399 -0.162
Ear length -0.743 -0.189 -0.885 -0.185 -0.746 0.569 0.730 -0.189 0.342
Kernel rows number 0.193 0.464 0.436 0.509 -0.081 -0.629 0.045 0.755 -0.335
Number of kernels per row -0.783 -0.006 -0.881 -0.154 -0.750 0.245 0.797 0.011 0.247
Kernel type 0.630 0.130 0.454 0.208 0.533 0.292 -0.521 -0.622 -0.173
1000-kernel weight (g) -0.541 -0.511 -0.526 -0.429 -0.389 0.570 0.299 0.559 0.501
Grain yield (t/ha) -0.513 -0.076 -0.313 0.129 -0.232 0.151 0.045 -0.333 -0.642
Fumonisin content (μg/ kg ) 0.209 0.798 -0.019 -0.782 0.220 0.495 0.582 -0.493 -0.469
Damaged kernels by
F. verticillioides (%)
0.087 0.755 -0.052 -0.677 0.134 0.681 0.450 -0.504 -0.552
Eigenvalue 3.936 2.187 3.958 2.255 3.14 2.462 3.595 2.335 1.663
Cumulative proportion of variance (%) 35.78 19.89 35.98 20.50 28.54 22.38 32.68 21.22 15.12
Table 4. Cluster means for morpho-physiological traits, incidence of F. verticillioides (%), and fumonisin content in 172 maize populations coming from different geographical origins.
Specifications*
Clusters
Area of origin N PH DT DS EL KRN NKR KT KW GY FC KDF
A North west 27 184.62 72.73 73.19 17.50 11.62 34.69 5.88 318.19 3.27 256.5 3.69
North east 20 185.53 72.59 73.21 16.23 12.32 33.21 5.74 282.42 3.31 293.05 3.79
Center west 29 186.14 74.31 74.79 17.64 11.52 34.93 5.79 310.52 3.6 329.69 4.69
South 16 192.16 72.39 73.38 17.17 11.25 34.19 5.75 321.94 3.4 186.13 2.00
Total 92 187.11 73.01 73.64 17.14 11.68 34.26 5.79 308.27 3.40 266.34 3.54
B North west 6 163.50 71.50 71.67 13.62 13.00 26.83 6.00 220.50 2.30 837.50 7.33
North east 16 163.75 69.88 70.00 11.80 14.75 25.56 6.00 198.06 2.25 504.25 5.25
Center west 5 170.00 75.80 76.40 13.70 13.60 28.00 6.00 220.00 1.82 465.80 3.60
Total 27 165.75 72.39 72.69 13.04 13.78 26.80 6.00 212.85 2.12 602.52 5.39
C North west 6 203.67 76.17 77.00 18.50 12.33 39.00 3.83 373.33 3.70 647.17 5.67
North east 4 192.25 74.25 75.25 19.32 12.5 43.75 3.00 300.5. 2.98 1218.5 11.00
Center west 7 200.86 76.43 77.00 18.53 13.43 38.86 3.29 323.14 3.77 360.71 4.57
South 12 206.92 78.25 79.00 19.22 12.33 39.58 3.92 340.17 3.43 123.08 11.00
Total 29 200.93 76.28 77.06 18.89 12.65 40.30 3.51 345.55 3.47 587.37 8.06
D North west 7 176.86 72.57 72.71 17.54 12.29 36.43 6.00 271.14 2.94 2028.8 21.14
North east 9 181.22 69.56 70.11 15.29 12.00 33.00 6.00 279.33 2.84 1830.0 25.33
Center west 5 192.03 72.08 72.16 17.48 11.71 34.00 6.00 313.19 3.21 1830.0 25.33
South 3 192.67 73.00 73.33 15.13 11.33 32.33 6.00 284.67 4.27 1830.0 25.33
Total 24 185.70 71.80 72.08 16.36 11.83 33.94 6.00 287.08 3.32 1879.70 24.28
Table 6. Climatic conditions (temperature and rainfall) during the vegetation period of maize crop (Experimental field of ARDS Suceava - 2021).
Month Temperature/°C Rainfall /mm
Min. Max. Average Monthly
multiannual average
Total Monthly
multiannual total
May 1.1 25.3 14.1 13.7 44.3 80.2
June 9.6 32.3 19.0 16.9 35.2 93.6
July 13.3 34.1 22.5 18.4 11.0 88.6
August 9.1 33.4 19.9 18.3 35.0 62.8
September 3.1 27.0 14.2 14.2 24.2 40
October -2.5 22.8 8.2 8.4 1.6 29.5
Average temperatures/vegetation season 5.61 29.15 16.31 14.98 - -
Total rainfall/vegetation season - - - 151.3 394.7
Disclaimer/Publisher’s Note: The statements, opinions and data contained in all publications are solely those of the individual author(s) and contributor(s) and not of MDPI and/or the editor(s). MDPI and/or the editor(s) disclaim responsibility for any injury to people or property resulting from any ideas, methods, instructions or products referred to in the content.
Copyright: This open access article is published under a Creative Commons CC BY 4.0 license, which permit the free download, distribution, and reuse, provided that the author and preprint are cited in any reuse.
Prerpints.org logo

Preprints.org is a free preprint server supported by MDPI in Basel, Switzerland.

Subscribe

Disclaimer

Terms of Use

Privacy Policy

Privacy Settings

© 2025 MDPI (Basel, Switzerland) unless otherwise stated