
Submitted:
27 October 2025
Posted:
28 October 2025
You are already at the latest version
Abstract
Polarized neutron reflectometry (PNR) analyzes surface and interfacial structures of materials. For the SHARAKU reflectometer at the Materials and Life Science Experimental Facility in the Japan Proton Accelerator Research Complex, precise measurements under weak magnetic fields, which are critical for modern spintronics, have long been challenging. To address this issue, we developed a precise weak-field sample environment equipped with a newly designed coil system. The magnetic field at the sample position can be applied within the surface/interface plane, either in the scattering plane (horizontal configuration) or perpendicular to it (vertical configuration). The horizontal configuration achieved high polarization efficiency across a stable field range, whereas the vertical configuration enabled the experiments to cross zero into negative fields. We demonstrated the instrument’s capability by resolving the remanent magnetic structure of a Fe film. Its applicability to soft-matter was proven through analysis of a cellulose thin film with roughness using magnetic contrast variation PNR. In this case, precise weak-field control is essential to tune the magnetic contrast from the reference layer beneath the soft film. These results establish the system as a versatile platform for future PNR and polarized off-specular scattering experiments across a wide range of materials.
Keywords:
polarized neutron reflectivity
; weak-field sample environments
; magnetic contrast variation
; polarized neuron reflectometry
1. Introduction
Polarized neutron reflectometry (PNR) and polarized off-specular scattering (POSS) are powerful techniques for the high-precision, nondestructive characterization of surface and interface structures in thin films and multilayer materials. Because neutrons are sensitive to magnetic structures through their spin, PNR can nondestructively probe buried magnetic interfaces in systems with high spatial resolution. By contrast, POSS enables the direct observation of domain spacing and correlation lengths on the micrometer scale, providing structural information complementary to that obtained by PNR. This capability is particularly important in fields such as high-density magnetic storage and spintronics, where a precise understanding of interfacial magnetism is essential for optimizing device performance. At the Materials and Life Science Experimental Facility (MLF) in the Japan Proton Accelerator Research Complex (J-PARC), the polarized neutron reflectometer SHARAKU (BL17) plays a central role in the study of magnetic thin films. Since its commissioning, BL17 has operated primarily under magnetic fields ranging from 50 Oe to 65 kOe, enabling the detailed characterization of a wide variety of magnetic materials. These measurements have yielded numerous significant findings and have contributed substantially to advances in magnetism and materials science [1,2,3,4].
Although strong-field environments have enabled such progress, an increasing number of studies require precise measurements in the weak-field regime. In recent years, the demand for the analysis of magnetic structures under weak magnetic fields has significantly increased, driven by advances in magnetic and spintronic devices. Precise characterization in the field range of ~10–50 Oe is particularly important for understanding the remanent state and interlayer coupling phenomena relevant to device operation. For example, high-speed magnetic memories operating in the GHz range rely on precise magnetic control near ±30 Oe, and their performance is strongly influenced by the interfacial quality of pseudo-antiferromagnetic multilayers [5,6]. Similarly, magnetic multilayer mirrors used as neutron optical elements have been investigated using PNR and POSS at ~17 Oe to study interlayer exchange coupling [7,8,9,10]. Other materials, including the skyrmionic compound Mn4N [11], films exhibiting an anomalous Nernst effect [12], and Fe/MgO multilayers [13], exhibit magnetic properties that emerge only in low-field regimes. Ferromagnetic/ferroelectric heterostructures have also been investigated under combined electric and weak magnetic fields, highlighting the importance of precise magnetic-field control [14].
Despite these advances and growing demand, conventional measurement environments often lack the magnetic field resolution, uniformity, and flexibility required to investigate low-field magnetic phenomena. This limitation has impeded the development of next-generation magnetic devices and fundamental understanding of magnetism under weak-field conditions. To overcome the limitations of conventional magnetic field environments, a dedicated sample environment capable of precisely controlling weak magnetic fields must be developed, thereby meeting the growing demands of materials research in this area.
However, only a few widely accessible sample environments can provide stable and precisely controllable magnetic fields in the aforementioned weak-field range. For example, the SuperADAM reflectometer at the Institute Laue-Langevin in France supports sample magnetic fields of ~10 Oe [15]. Similarly, the Platypus instrument at the Australian Nuclear Science and Technology Organization provides an AC magnetic field of ~6 Oe for combined ferromagnetic resonance and PNR experiments. However, these setups are not intended for general-purpose applications such as temperature-dependent or static magnetic field measurements [16].
In this study, we developed a precise weak-field sampling environment (WFSE) integrated into the SHARAKU reflectometer. Here, “precision” refers to its experimentally verified capabilities: (i) temporal stability of ~0.2 Oe, (ii) a linear coil current–field relationship, and (iii) spatial uniformity within ~1.1% at the sample position. Unless otherwise noted, we use the abbreviation WFSE. The WFSE supports horizontal and vertical configurations, ensuring a smooth magnetic connection to the guide field, while maintaining a high polarization efficiency for the PNR. The system enables precise and stable control of sample magnetic fields from 0.4 to 125.9 Oe, a range that is challenging to achieve with conventional general-purpose instruments. Furthermore, the system maintained a high neutron polarization efficiency throughout the field range, thereby ensuring its suitability for advanced PNR experiments. This design allows flexible switching between horizontal and vertical configurations, thereby extending the accessible experimental parameter space.
In this study, the terms “horizontal configuration” and “vertical configuration” are mainly used; they correspond to the longitudinal (‖ beam) and transverse (⊥ beam) geometries commonly employed in magnetic scattering. Although this study primarily reports the results obtained using a horizontal field configuration, a vertical configuration is also available for polarized experiments that require continuous measurements across zero-to-negative field conditions. The following sections present the design and performance of the system, demonstrating how its capabilities open up two distinct and powerful research avenues: (i) the elucidation of complex magnetic thin films in the weak-field regime and (ii) the high-precision structural analysis of traditionally nonmagnetic materials, such as soft matter, by utilizing magnetic contrast variation.
To demonstrate the latter research avenue, that is, the structural analysis of soft matter, we investigated the applicability of the developed WFSE to systems in which conventional neutron reflectometry often encounters difficulties owing to low scattering contrast or significant surface roughness. To address these limitations, we employed magnetic contrast variation polarized neutron reflectometry (MCV-PNR) [17]. To demonstrate its ability to determine the nanostructures of cellulose films with high precision, we performed MCV-PNR measurements on a cellulose-based thin-film Fe/Si substrate. Although the structure and applications of cellulose have been extensively studied, it is still of great interest. The application of MCV-PNRs to such systems is useful for accurately analyzing the surface, interface, and thin-layer structures of cellulose thin films. In this sample, the surface roughness was too high for conventional reflectivity methods to resolve the structural features. To overcome this limitation, we introduced a magnetic reference layer beneath the cellulose film, which enhanced contrast and enabled the extraction of nanostructural information. The combination of MCV-PNRs and a weak magnetic field environment represents a promising approach for probing the internal structure of soft matter systems that are difficult to analyze using conventional reflectometry techniques.
These results highlight the potential of the developed WFSE for characterizing magnetic materials under operationally relevant conditions and for precisely determining the nanostructures of soft matter systems. This approach is expected to contribute to advances in a wide range of fields spanning spintronics to sustainable materials science. In the following sections, we present the design and performance of a weak-field sample environment and demonstrate experiments on magnetic thin films and cellulose-based soft materials.
2. Instrument and Methods
2.1. Design and Performance of the Precision WFSE
This section describes the key components of the BL17 polarized neutron reflectometer [18], newly developed WFSE, and methods used to evaluate its polarization performance. To enable PNR experiments under low magnetic fields, we developed a dedicated WFSE compatible with the BL17 reflectometer at J-PARC [19]. BL17 is a time-of-flight (TOF) reflectometer designed for pulsed neutron beams with a wavelength range of 0.24–0.88 nm [18,20]. Its wide wavelength coverage and high polarization performance make it particularly suitable for detailed structural studies of thin films using polarized-neutron techniques. The detailed specifications of the beamline have been reported elsewhere. This study focused on the development and integration of the WFSE into the BL17 system.
The standard magnet installed at BL17 (hereafter referred to as the 10 kOe magnet) provides two practically accessible field ranges for PNR experiments—approximately −10 kOe to −50 Oe and +50 Oe to +10 kOe—because iron-core remanence makes uniform, stable fields within ±50 Oe difficult to attain. A photograph and further details are provided in the Supplementary Material (Figure S1). These strong-field capabilities are invaluable for ferromagnets, whereas weak-field conditions addressed by the WFSE are critical for antiferromagnets and techniques such as MCV-PNR.
To meet the experimental requirements for low-field PNR, the WFSE was designed to (i) generate fields up to ±120 Oe without remanent effects, (ii) ensure a smooth magnetic connection to the guide field, (iii) maintain temporal stability, and (iv) provide high spatial uniformity over a 10 mm × 10 mm sample area. A Helmholtz coil (HC) configuration was adopted to avoid remanent magnetization: two identical circular coils on a common axis, separated by the coil radius, and driven with equal currents. This arrangement yields a uniform field in the central region and a linear response to the applied currents. For magnetic continuity with the beamline, existing guide coils were tuned to operate in a weak-field regime. No magnetic shielding was employed to preserve magnetic continuity with the guide field and maintain experimental access. Heat dissipation was handled by heat sinks and forced-air cooling. The mechanical interfaces between the WFSE and BL17 sample stages were precisely matched to ensure compatibility. The sample was aligned with the geometric center of the coil assembly, enabling accurate positioning within a uniform magnetic field region.
The HC configuration provided highly uniform fields near the center of the coil. The uniformity was estimated to be ~1.1% over a volume of 60 mm × 60 mm × 60 mm, exceeding the area required for typical PNR samples. Along the beam axis (z-direction), the field decreased smoothly and crossed zero ~156 mm from the coil center, defining the effective field boundary. The operational range was set to −120 to +120 Oe. To preserve neutron polarization throughout the sample region, the field gradients between the WFSE and surrounding guide coils were minimized by matching their settings to the WFSE conditions.
The WFSE supports both room temperature and cryogenic environments. At room temperature, a non-magnetic sample stick maintains magnetic continuity and suppresses spurious signals, and up to three samples can be mounted using an automated exchanger. For cryogenics, a closed-cycle 4 K cryostat accommodating up to two samples can be installed, enabling sample exchange under cryogenic conditions and enhancing throughput.
A schematic overview of the BL17 beamline is presented in Figure 1, illustrating the layout of the key components used for PNR. The optical system included a supermirror polarizer, two spin flippers, a sample stage, a supermirror analyzer, and a 2D detector arranged along the beam path. The newly developed WFSE was integrated at the sample position, enabling weak-field measurements without compromising neutron polarization. This configuration supported four spin-dependent reflectivity channels through selective spin manipulation before and after the sample.
Figure 2 illustrates two representative WFSE configurations. In the horizontal configuration (Figure 2a), the field is applied along the beam axis (z); owing to magnetic connection constraints to the guide field, PNR measurements are limited to positive fields, although negative fields can be applied prior to measurement to set the magnetic history. The usable sample area was 30 mm × 30 mm owing to the holder geometry. In the vertical configuration (Figure 2b), continuous measurements across negative and positive fields are possible; however, at low fields (|H| ≤ 10 Oe), contamination from the guide and geomagnetic fields alters the direction of the magnetic field axis. A more detailed comparison between the horizontal and vertical configurations, as well as additional technical information on the WFSE design and performance, is provided in the Supplementary Materials.
To perform the PNR experiments, a well-defined neutron spin state must be prepared and analyzed. Polarized neutrons are generated by passing unpolarized neutrons through a supermirror polarizer that selects spin states aligned antiparallel to the guide magnetic field. After interaction with the sample, the spin state of the reflected neutrons was analyzed using a supermirror analyzer. Spin-state manipulation was achieved by placing two spin flippers upstream and downstream of the sample. By activating these flippers in various combinations, all four spin-dependent reflectivity channels (R++, R––, R+–, and R–+) can be accessed. The performances of the polarizer and analyzer were characterized by their polarization efficiencies P1 and A2, respectively. These are defined as follows:
where I+ and I− are the intensities of neutrons with spin up and spin down, respectively, at the position of the polarizer or analyzer. These efficiency values are essential for correcting the measured reflectivity and extracting accurate spin-dependent signals.
The spin-manipulation system at BL17 includes two types of spin flippers: a two-coil flipper located upstream of the sample and a Mezei-type flipper positioned downstream. These devices are part of the standard optical configuration of the beamline and have been described in detail elsewhere [18,21,22]. Owing to the finite flipping efficiencies, the actual neutron spin states differ slightly from the ideal configurations. To characterize the overall spin-selective performance of the system, the combined polarization efficiency, Ptotal, is defined as the product of the polarizer, spin-flipper, and analyzer efficiencies:
where P1 and A2 are the polarization efficiencies of the polarizer and analyzer, respectively; and F1, F2 represent the flipping efficiencies of the upstream and downstream spin flippers, respectively.
In the practical measurements, spin-dependent reflectivity signals were obtained by operating the upstream and downstream spin flippers in four on/off combinations. The resulting neutron intensities are denoted as I(ij), where i and j indicate the flipper states (0 = off and 1 = on) upstream and downstream of the sample, respectively. Each I(ij) configuration primarily corresponds to a dominant spin-state combination. Table 1 summarizes the relationship between the flipper settings and corresponding measured spin-dependent reflectivity channels.
Owing to the finite polarization and flipping efficiencies of the optical components, the measured intensities I(ij) are not pure representations of a single spin state, but contain contributions from other channels. To extract accurate spin-dependent reflectivities, the measured signals must be corrected by accounting for the polarization efficiencies of the polarizer and analyzer (P1, A2) as well as the flipping efficiencies of the upstream and downstream flippers (F1, F2). This correction is essential for quantitative analyses, particularly when calculating spin asymmetries or fitting structural models to reflectivity data. The relationship between the measured intensities and the true spin-dependent reflectivities can be expressed using a correction matrix that accounts for the finite polarization and flipping efficiencies of the optical components. This matrix describes how each measured intensity I(ij) is a linear combination of the ideal reflectance R++, R––, R+–, and R−+ weighted by the performance of the polarizer, analyzer, and spin flippers. In the subsequent data analysis, corrections for the polarization and flipping efficiencies of the polarizer, analyzer, and spin flippers were applied to obtain the true spin-dependent reflectivities. These corrections are essential for accurately extracting magnetic signals, particularly under weak magnetic fields.
To evaluate the practical performance of the newly developed WFSE, we conducted a series of measurements focusing on the magnetic field calibration and polarization efficiency. The magnetic field was measured at the sample position using a Gaussmeter (Model 5180, F.W. Bell, USA), with the probe rigidly mounted on a fixed stand and positioned at the center of the HC. Figure 3 shows the calibration of the on-sample field versus the HC current. The temporal fluctuation during acquisition was ~0.2 Oe (20 µT); the corresponding error bars (±1 s.d.) are smaller than the symbol size.
To quantify the polarization performance, we performed four-channel direct-beam and reflection measurements using a magnetite (Fe3O4) single crystal magnetized to saturation. The overall polarization efficiency of the beamline, including the spin flippers, polarizer, and analyzer, was assessed in the horizontal configuration of the WFSE. For reference, these results were compared with the polarization efficiencies obtained using a conventional 10 kOe magnet. The individual polarization efficiencies of the upstream and downstream spin flippers (F1, F2), polarizer (P1), and analyzer (A2) were extracted by solving a set of equations based on the measured intensities, following the matrix-correction formalism summarized in the Supplementary Materials (Eqs. S3–S7). To examine the magnetic field dependence of the polarization efficiency, measurements were carried out across a range of sample magnetic fields from +0.4 to +125.9 Oe using the horizontal configuration of the WFSE. Polarization efficiency measurements were performed using a 10 mm × 10 mm magnetite (Fe3O4) single crystal with a (100) surface orientation, grown using the floating zone method (SurfaceNet GmbH). The proton beam power at the mercury target at the MLF at J-PARC was 650 kW. The neutron incidence angle was set to 0.7°, and the angular divergence was defined as 5.0% using the slit settings. For each magnetic field condition, the total measurement time for the four-channel direct was 1.5 h. The four-channel reflection spectra for the polarization efficiency determination were acquired at an incident angle of 0.7° with a measurement time of 4 h, avoiding the total reflection region.
2.2. PNR Measurement for Magnetic Thin Film
To investigate the magnetic structure in the remanent state of the sample, PNR measurements were performed using SiO2 (100 nm)/Fe (20 nm)/MgO. The field-dependent magnetization of the Fe layer was measured using SQUID magnetometry (MPMS II, Quantum Design, Japan). An external field was applied parallel to the film plane. The resulting M–H curve was used to identify the remanent state in the PNR experiments.
To determine the depth-resolved magnetic structure in the remanent state, we performed four-channel PNR using WFSE in the horizontal configuration. The sample was first magnetized at −120 Oe and then measured at +10 Oe, where the M–H curve indicated proximity to remanence. Magnetic structure analysis was performed using four-channel and two-channel PNR. Data acquisition and processing were performed using a system developed at the MLF [23]. The neutron angular divergence was set to 5.0%, as defined by the slit settings. Data was reduced using Utsusemi [24] with a TOF binning width of 1.0 ms, corresponding to a wavelength bandwidth of 0.02 nm. To optimize the counting statistics, the measurement times were allocated in proportion to the signal intensity: I(00):I(01):I(10):I(11) = 6:1:1:6, because I(01) and I(10) exhibited higher intensities than I(00) and I(11). The reflectivity data were structurally fitted using the GenX software package [25]. To map the field dependence of the average moment with higher throughput, we acquired two-channel PNR (non-analyzed, R+ and R−) from 10.0 to 66.0 Oe. The spin-asymmetry SA = (R+ − R−)/(R+ + R−) was used as an indicator sensitive to magnetization.
The performance characteristics of the WFSE presented in this section establish a reliable foundation for subsequent experiments, including magnetic thin-film measurements and MCV-PNRs, as described in the following sections.
2.3. MCV-PNR Method
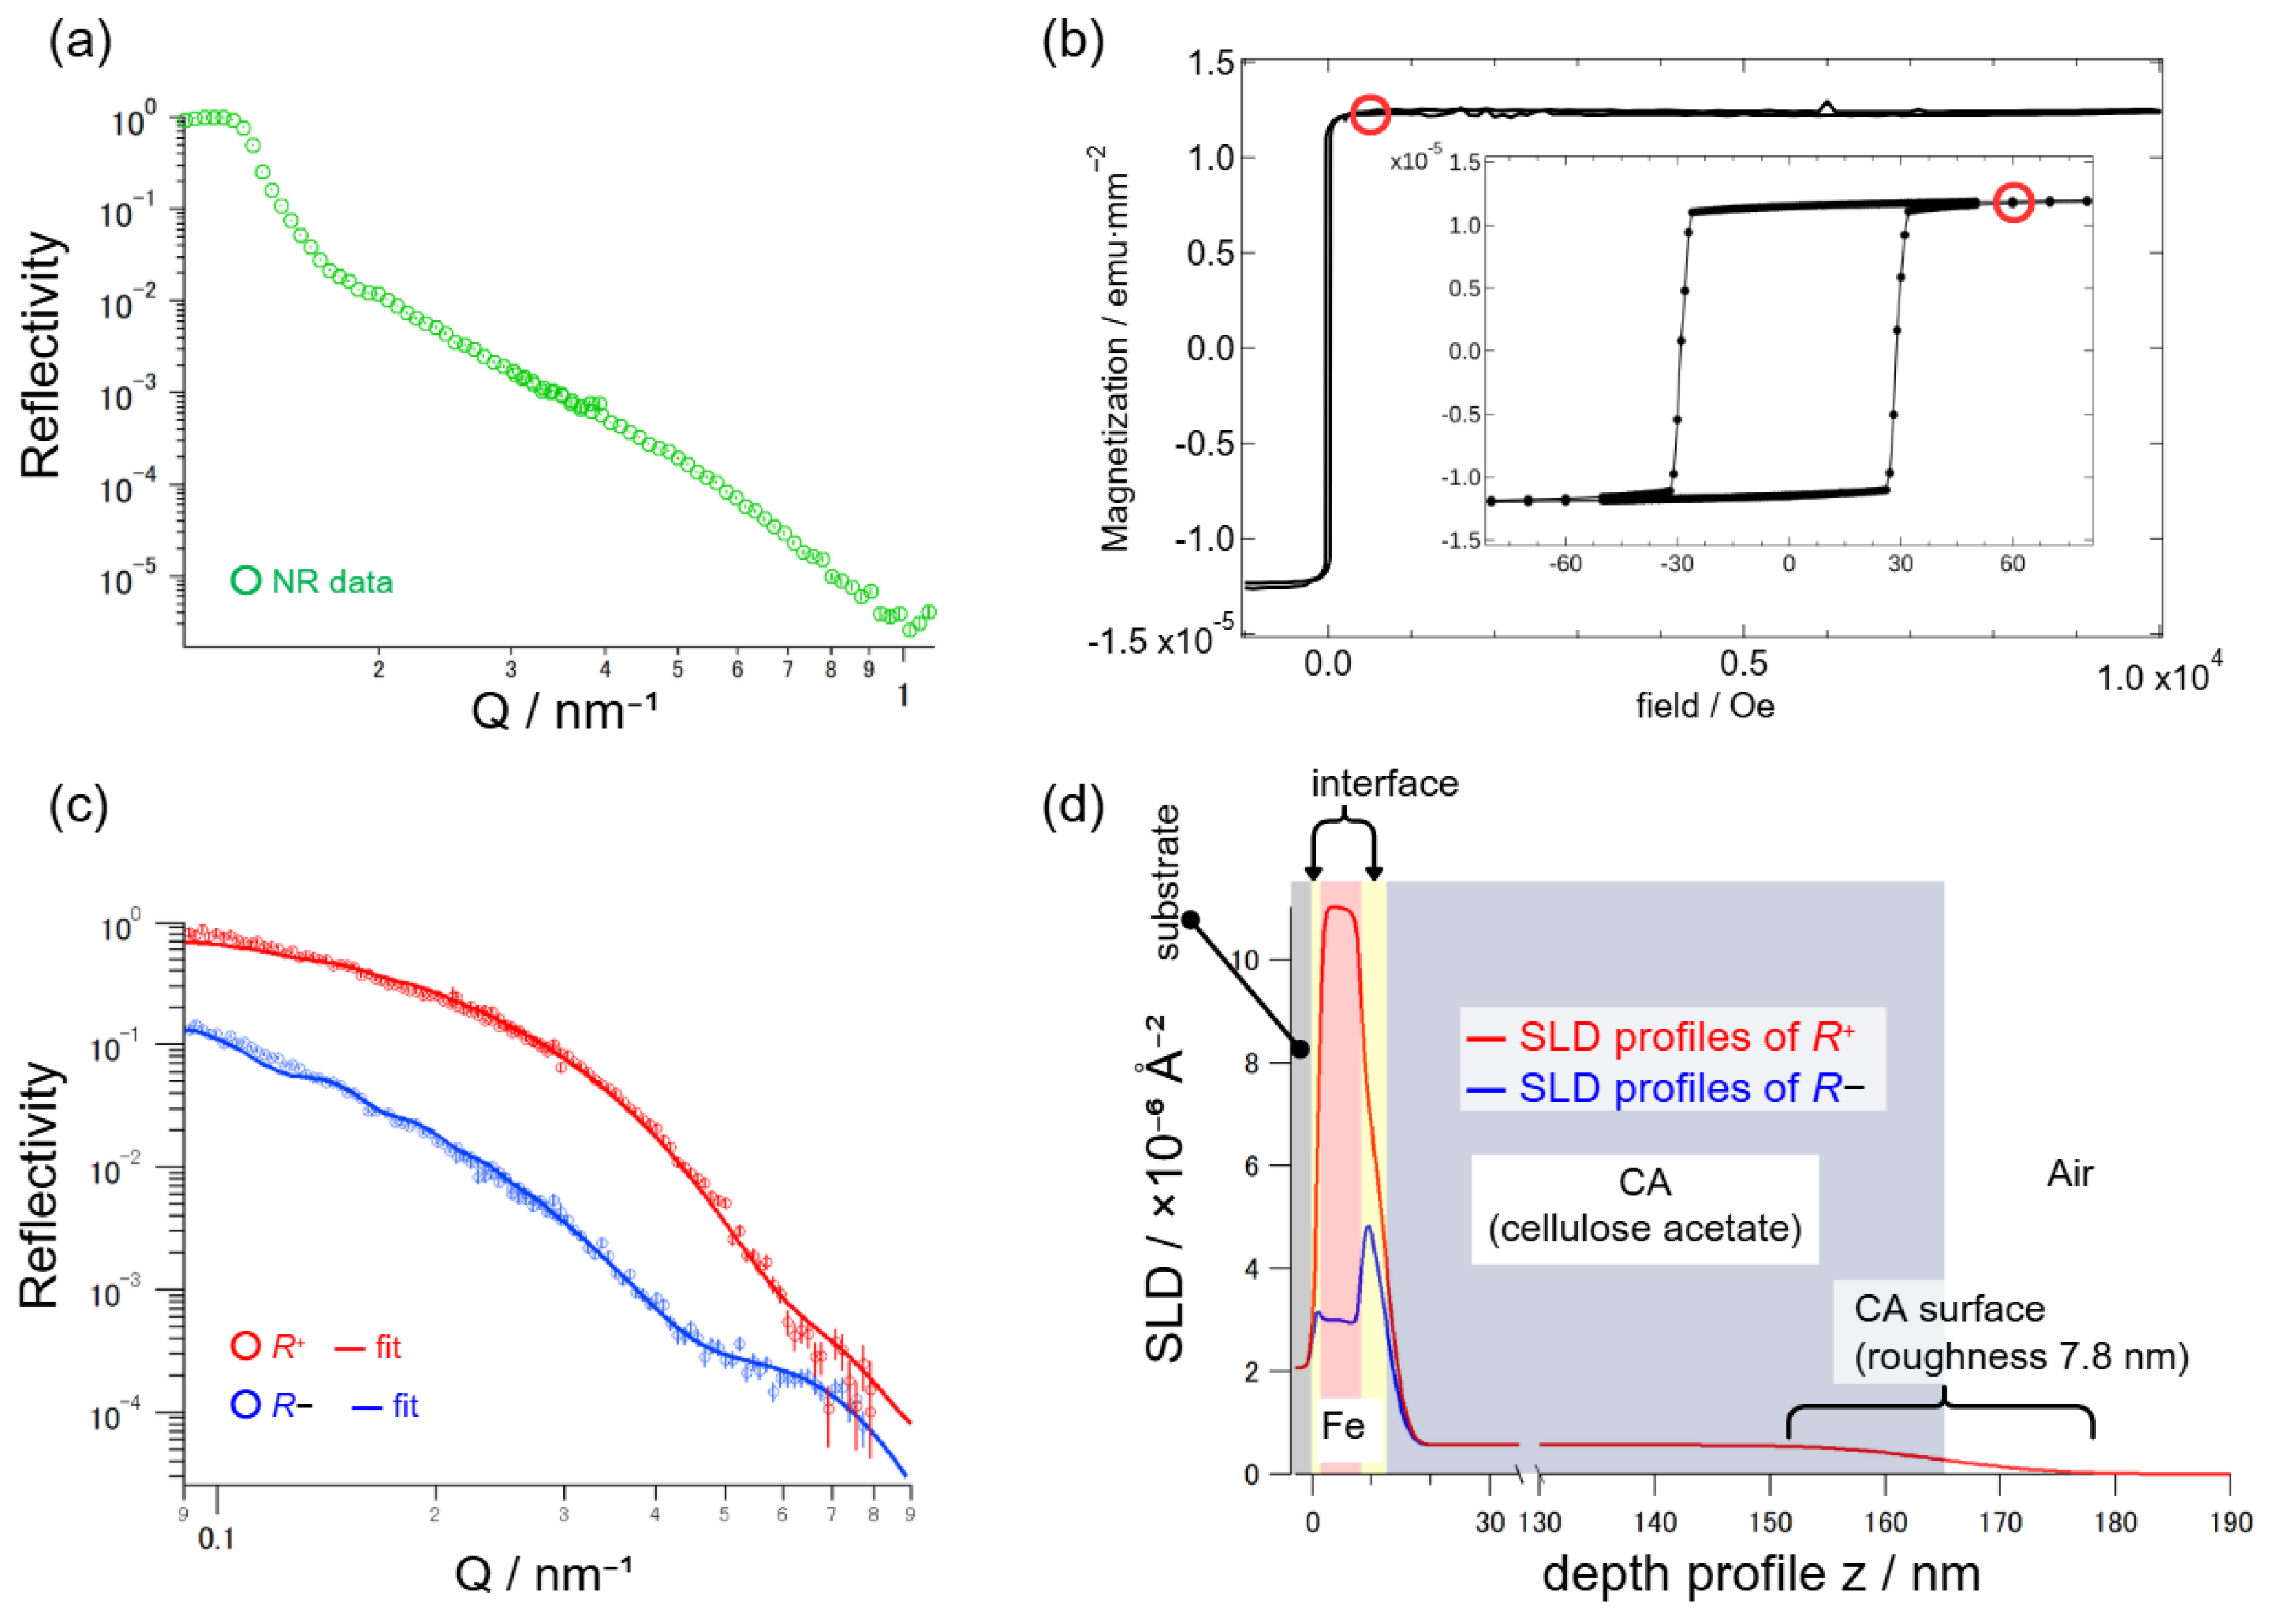
This section introduces the MCV-PNR technique [17], with a focus on its application in the structural analysis of cellulose-based soft matter samples. As an application example, we conducted MCV-PNR measurements on a cellulose thin-film/Fe/Si sample to demonstrate the capability of determining the nanostructure of cellulose films with high precision [26]. MCV-PNR is a valuable technique for accurately analyzing the surface, interface, and thin-layer structures of cellulose thin films. As a preliminary step, we measured the neutron reflectivity (NR) of a cellulose acetate (CA) thin film, ~150 nm thick, prepared on a quartz substrate (ESI-01), as shown in Figure 8(a). However, the NR data did not exhibit any interference fringes from the CA thin film, probably owing to its significant surface roughness. Because MCV-PNRs are particularly well suited for analyzing thin films with substantial surface roughness, we applied this method to investigate the CA thin-film structure.
Iron has a large magnetic scattering length, making it an excellent material for MCV-PNRs. Therefore, in this study, we prepared CA/Fe/Si samples in which an iron layer was incorporated as a magnetic contrast medium. The Fe/Si substrate was fabricated using a sputtering system at the AIST Nano-Processing Facility. The CA layer was prepared by spin coating a 2 wt% cellulose acetate/acetone solution at 2000 rpm using a spin coater (MS-A150, Mikasa, Tokyo, Japan). The sample was then heated at 90 °C in a vacuum oven for 12 h and subsequently stored in a box under low-humidity and dust-free conditions at room temperature. Prior to the neutron experiments, the magnetization curve of the Fe layer was measured using SQUID magnetometry and was found to saturate at ~30.0 Oe. Consequently, all MCV-PNR measurements were performed under a static field of 60.0 Oe to guarantee full saturation of the magnetic reference layer using the horizontal configuration of the WFSE. For samples with thicker films, observing Kiessig fringes in the low-Qz region was preferable during the reflectivity measurements. In the CA/Fe/Si sample, the back-incidence geometry, in which neutrons are introduced through the substrate, allows access to lower momentum-transfer regions (Qz), which is advantageous for resolving Kiessig fringes in thicker films. Therefore, MCV-PNR measurements were conducted in back-incidence mode to obtain high-quality data suitable for analyzing the CA/Fe/Si sample. A beam footprint of 10 mm × 10 mm was maintained on the sample surface, and TOF neutron data were collected using a two-dimensional scintillation detector with spatial resolution capabilities. All measurements were performed at ambient temperature under a magnetic field of 60.0 Oe, and magnetization of the iron thin film was confirmed to be fully saturated. The MCV-PNR profiles were fitted using Motofit software [27,28] with a least-squares approach to minimize fitting deviations. The film thickness (t, Å), scattering length density (SLD, ρ), and Gaussian interfacial roughness (σ, Å) were evaluated using Motofit.
3. Results and Discussion
3.1. Magnetic-Field Characteristics and Polarization Efficiencies
This section presents the key results and their implications using the WFSE: (i) calibration and stability of the on-sample field, (ii) direct-beam polarization spectra, (iii) wavelength dependence of component efficiencies, and (iv) field dependence of the total efficiency.
At the sample position, the magnetic field was measured using a gaussmeter, whose probe was rigidly mounted on a fixed stand and positioned at the center of the HC. Figure 3 shows the on-sample field versus HC current in the horizontal WFSE configuration. The response is linear:
where the +1.4 Oe offset arises from the guide and geomagnetic fields (each +0.7 Oe). For example, I = 20 A yields H = 125.9 Oe, whereas I = 0 A yields H = 1.4 Oe. The temporal fluctuation during acquisition was ∼0.2 Oe (±1 s.d.), which defines the practical floor of field control and corresponds to ∼±0.03 A in the HC current. The specified current noise of the HC power supply (±30 A, ±70 V, 0.01% current noise; Model TM-PSBC3070-234-S, Kudo-Denki) is sufficiently low that the observed ∼0.2 Oe fluctuation reflects combined contributions from electronics, D/A conversion, and ambient magnetic noise inside and outside the beamline. These results demonstrate that the WFSE delivers stable, precisely tunable weak fields over the full operating range.
H (Oe) = 6.226 × I (A) + 1.4
Figure 4 shows the four-channel direct spectra acquired in the horizontal configuration at +1.4 Oe (0 A in the HC). The usable wavelength band (0.24–0.88 nm) was determined by the source-chopper setting. All spin-resolved spectra varied smoothly with the wavelength, confirming a stable source and polarization optics. The residual signals in I0(00) and I0(11) were small yet finite, attributable to optical imperfections and the background.
Figure 5 summarizes the wavelength dependence of the polarization efficiencies extracted from the four-channel data. The polarization efficiencies of F1, F2, and P1 remained nearly constant throughout the wavelength range of 0.24–0.88 nm. Conversely, A2 and Ptotal gradually decreased toward longer wavelengths. Quantitatively, A2 dropped from ∼99% (0.25 nm) to 87% (0.87 nm); Ptotal declines from ∼95% to ∼88% toward longer wavelengths. We attribute this to a geometric mismatch between the sheet-beam and the fixed analyzer orientation optimized for 2θ-axis detection in POSS mode. Practical mitigation without hardware changes involves weight acquisition toward shorter wavelengths via chopper phase optimization. Despite this reduction, the overall polarization performance remains sufficiently high across the full wavelength range, ensuring the reliability of the weak-field PNR measurements.
Figure 6 illustrates how Ptotal varies with the magnetic field for selected wavelengths in the horizontal WFSE configuration. The total polarization efficiency, Ptotal, is essentially independent of the field at all tested wavelengths from 0.4 to 125.9 Oe. The lower measurement bound of 0.4 Oe reflects the ∼0.2 Oe calibration fluctuation; below this level, we did not attempt a quantitative efficiency evaluation. The field-independent behavior indicated that the weak fields of the WFSE and the smooth magnetic connection to the guide coils did not degrade the polarization performance across the operating range.
3.2. PNR on Fe Thin Film Under Remanent State
Figure 7(a) shows the magnetization curve of the SiO2 (100 nm)/Fe (20 nm)/MgO sample. To investigate the magnetic structure under the remanent state, four-channel PNR spectra were obtained at +10 Oe after presetting the magnetic history at −120 Oe, as shown in Figure 7(b). Figure 7(c) shows the nuclear and magnetic scattering length–density profiles, nSLD and mSLD, extracted from the fits. The mSLD profile indicates that the Fe layer exhibits a magnetic moment of 1.34 μB ± 0.06 per atom, with a tilt angle of 86° ± 4° relative to the external field direction. The negative sign of mSLD indicates that the average magnetization vector is oriented opposite to the direction of the applied field, as defined relative to the neutron spin quantization axis. It is important to note that the magnetic moment derived from the PNR is a spatial average over the entire sample area illuminated by the neutron beam, which is typically on the order of square centimeters. Therefore, the observed value of 1.34 μB should not be interpreted as the moment within a single domain, but as the net magnetization resulting from the vector sum of all domains. In the remanent state, it is physically plausible that the film fragments into multiple in-plane domains whose individual magnetizations are oriented along various easy axes. Partial cancellation among these domain vectors leads to a net magnetization with a magnitude smaller than the saturation value of ~2.2 μB. Figure 7(d)–(g) show the two-channel PNR measurements in various fields, illustrating the evolution of the magnetic moment.
The WFSE developed in this study significantly expanded the measurement capabilities of the BL17 reflectometer. In particular, it enables PNR in a previously inaccessible field range of 0.4–125.9 Oe, which could not be achieved using the conventional 10 kOe magnet owing to its intrinsic remanence. This advancement allows for a detailed investigation of magnetic phenomena, such as the remanent state and domain formation, under near-zero field conditions. In addition, the results demonstrate that WFSE enables a detailed, nondestructive analysis of magnetic thin films in remanent states, a regime that is highly relevant to practical device operation. In particular, such measurements are essential for understanding the magnetic domain behavior and interlayer coupling in complex multilayer structures, such as the pseudo-antiferromagnetic stacks used in spintronic devices. By enabling the precise evaluation of the magnetization direction and moment magnitude under low-field conditions, this environment provides critical insights into magnetic switching mechanisms, domain stability, and performance tuning in next-generation magnetic memory applications. The broader significance of these findings and future research directions are summarized in the conclusion.
3.3. MCV-PNR Results
To evaluate the applicability of WFSE to soft-matter systems, we employed the MCV-PNR method to analyze the CA/Fe/Si samples. Owing to its substantial surface roughness, this sample was not suitable for structural analysis using conventional neutron reflectometry, as indicated by the lack of interference fringes in the NR data (Figure 8(a)).
To overcome this limitation, we introduced a magnetic reference layer beneath the CA film to generate a spin-dependent contrast. The magnetization curve of the sample is shown in Figure 8(b). A magnetic field of 60 Oe was applied to saturate the magnetization of the Fe reference layer. Under these conditions, the contrast in the R− channel (nSLD–mSLD) is enhanced, clearly revealing the Kiessig fringes. Figure 8(c) shows the MCV-PNR reflectivity profiles of the CA/Fe/Si sample measured under a magnetic field of 60 Oe. A significant contrast between the R+ and R− reflectivity curves was observed, resulting from the magnetic scattering contribution of the Fe layer. Here, R+ and R− represent the reflectivities for neutrons incident on the sample with their spins parallel and antiparallel to the applied magnetic field, respectively. In the reflectivity model, R+ corresponds to (nSLD + mSLD) and R− to (nSLD − mSLD), where nSLD is the nuclear scattering length density and mSLD is the magnetic one. Kiessig fringes were apparent in the R− profile but not in the R+ profile, indicating that the contrast in scattering length density (nSLD − mSLD) between the CA and Fe layers is more favorable under the R− condition. These results confirm that the MCV-PNR method can enhance the structural visibility of soft films with high surface roughness, which is otherwise difficult to resolve using conventional NR techniques. The reflectivity data were fitted using a model consistent with the known layer structure, yielding reliable nSLD and mSLD profiles, as shown in Figure 8(d). The mSLD profile revealed a saturated magnetic moment of 2.2 μB per atom in the Fe layer, while the CA layer exhibited negligible magnetization, as expected. No change was observed in the nSLD between the R+ and R− datasets, confirming that the observed contrast originated from magnetic rather than nuclear scattering. The surface roughness at the air/CA and CA/Fe interfaces were estimated to be 7.8 nm and 2.6 nm, respectively. These values confirm that the CA layer possessed substantial surface roughness, which hindered structural analysis using conventional neutron reflectometry techniques.
Jielong Su et al. reported a surface roughness of 2.8 nm for CA thin films prepared by spin coating with a 2.5 wt% polymer solution [26]. The higher roughness observed in our study was presumed to result from differences in the deposition conditions. Despite this discrepancy, the structural parameters obtained from the MCV-PNR were in close agreement with the design values, underscoring the robustness of the method.
The successful detection of Kiessig fringes in the R− channel despite such conditions demonstrates the practical advantage of MCV-PNR for soft systems that are otherwise challenging to characterize. These findings establish MCV-PNRs as a practical tool for the nondestructive structural analysis of soft matter systems under weak magnetic field conditions. Because the magnetization of the Fe reference layer is typically saturated at ~30 Oe, precise control of the applied field below this threshold is essential for maintaining a reliable SLD contrast. The ability to regulate weak magnetic fields with high stability highlights the utility of the developed system for a broad range of soft-matter investigations.
Figure 8.
MCV-PNR analysis of a cellulose acetate (CA) film. (a) Conventional neutron reflectivity (NR) profile, showing no Kiessig fringes owing to the significant surface roughness of the CA thin film. (b) SQUID M–H curve for CA/Fe sample. (c) MCV-PNR reflectivity profiles of the CA/Fe sample measured under a magnetic field of 60 Oe. A difference between the R⁺ and R⁻ profiles is clear, resulting from the magnetic contrast introduced by the Fe layer. Kiessig fringes arising from the CA layer are visible in the R⁻ profile but absent in the R⁺ profile, demonstrating the effectiveness of MCV-PNR in resolving structural features in soft matter films with substantial surface roughness. (d) SLD profiles from R+ (= nSLD + mSLD) and R− (= nSLD − mSLD).
4. Conclusions
In conclusion, we developed a WFSE for a BL17 polarized neutron reflectometer at MLF J-PARC. The system enables the precise control of magnetic fields from sub-Oersted to over 100 Oe and maintains a high polarization efficiency. Demonstration experiments confirmed its utility in analyzing magnetic thin films in the remanent state and resolving the structural features of soft matter films using MCV-PNR. This system provides a practical platform for low-field NR of a wide range of materials. Future plans will involve improving the experimental throughput by introducing a GM-type 4 K cryostat and a multisample exchange mechanism. We also plan to adapt the system to support polarized off-specular scattering (POSS) measurements, enabling the observation of more detailed magnetic domain structures, thereby expanding the range of applications of the system.
This system is expected to accelerate the research and development of spin electronics, magnetic recording, and energy-conversion materials. Its ability to control weak magnetic fields with high precision opens new avenues for studying magnetic materials in realistic remanent states. In soft-matter research, this instrument enables nondestructive profiling of rough organic films, offering a powerful route for the structural analysis of complex organic and biological layers.
Supplementary Materials
The following supporting information can be downloaded at the website of this paper posted on Preprints.org, Equation(S1) to (S7); Figure S1: Photograph of the 10 kOe magnet used at BL17. The red arrows indicate the direction of the magnetic field. The brown-painted structure corresponds to the H-shaped iron yoke, within which the iron-core pole pieces and automated sample changer are housed. Figure S2: Schematics and installation of the WFSE in the horizontal (longitudinal, ‖ beam) and the vertical (transverse, ⊥ beam) configuration: (a) Calculated magnetic field distribution when 16.6 A is applied to the Helmholtz coil pair (HC), generating 100 Oe at the sample position. (b) Design drawing of the WFSE centered on the HC, showing the outer dimensions and neutron beam direction. (c) Photograph of the WFSE installed at the SHARAKU (BL17) beamline of J-PARC MLF. For comparison, the horizontal configuration aligns the field parallel to the neutron beam axis, while in the vertical configuration the field is applied perpendicular to it. (d) Calculated values of as a function of distance from the WFSE center. The legend indicates the offset values (in mm) of the neutron beam relative to the sample center in the beam (Y) and field (Z) directions. These offsets correspond to an effective beam footprint of approximately 10 mm (Y-axis) × 40 mm (Z-axis), which is typical for PNR experiments. (e) Magnetic field at the sample position as a function of the HC current. The linear fit yields H(Oe) = 5.953 × I(A) + 1.44. The lower panel shows the tilt angle of the field direction relative to the vertical axis, which arises from the influence of the guide and geomagnetic fields.
Author Contributions
Basic design of the instrument, H. K. and T. H.; application of the MCV-PNR method, K. A. S.; sample preparation, A. N. H., A. I. O., and H. T.; construction of a safe system and software framework, Y. O. and S. K.; validation, K. A. S., H. K., K. K., and J. S.; technical advice and guidance, K. K. and J. S.; formal analysis, experimental work, and data curation, T. H. and K. A. S. All the authors have read and agreed to the published version of the manuscript.
Funding
This research was supported in part by JSPS KAKENHI (Grant No. 21K05015).
Data Availability Statement
The data supporting the findings of this study are available from the corresponding author upon request.
Acknowledgments
The authors would like to thank Dr. Masayasu Takeda (JAEA) for providing valuable advice and supplying the analysis software used in this study. We are also grateful to Keiichi Ohuchi (CROSS) for extensive technical support and attention to safety considerations. Neutron experiments at the SHARAKU (BL17) beamline of the Materials and Life Science Experimental Facility at J-PARC were conducted under proposal numbers 2020C0005, 2021C0006, 2022C0001, and 2024C0009. The CA/Fe/Si sample was prepared at the User Experiment Preparation Laboratory III provided by CROSS. Magnetic properties were measured using SQUID at the CROSS user laboratory II in Japan. We thank Dr. Motoyuki Ishikado for support. We would like to thank Editage (www.editage.jp) for English language editing.
Conflicts of Interest
The authors declare no conflicts of interest. The funders had no role in the study design; collection, analyses, or interpretation of data; writing of the manuscript; or decision to publish the results.
References
- Akiyama, R.; Ishikawa, R.; Akutsu-Suyama, K.; Nakanishi, R.; Tomohiro, Y.; Watanabe, K.; Iida, K.; Mitome, M.; Hasegawa, S.; Kuroda, S. Direct Probe of the Ferromagnetic Proximity Effect at the Interface of SnTe/Fe Heterostructure by Polarized Neutron Reflectometry. J. Phys. Chem. Lett. 13, 8228–8235 (2022). [CrossRef]
- Suturin, S.M.; Dvortsova, P.A.; Snigirev, L.A.; Ukleev, V.A.; Hanashima, T.; Rosado, M.; Ballesteros, B. Structural Peculiarities of ε-Fe2O3/GaN Epitaxial Layers Unveiled by High-Resolution Transmission Electron Microscopy and Neutron Reflectometry. Materials Today Communications 33, 104412 (2022). [CrossRef]
- Kumada, T.; Miura, D.; Akutsu-Suyama, K.; Ohishi, K.; Morikawa, T.; Kawamura, Y.; Suzuki, J.; Oku, T.; Torikai, N.; Niizeki, T. Structure Analysis of a Buried Interface between Organic and Porous Inorganic Layers Using Spin-Contrast-Variation Neutron Reflectivity. Journal of Applied Crystallography 55, 1147–1153 (2022). [CrossRef]
- Ohtsuka, Y.; Kanazawa, N.; Hirayama, M.; Matsui, A.; Nomoto, T.; Arita, R.; Nakajima, T.; Hanashima, T.; Ukleev, V.; Aoki, H.; et al. Emergence of Spin-Orbit Coupled Ferromagnetic Surface State Derived from Zak Phase in a Nonmagnetic Insulator FeSi. Science Advances 7, eabj0498 (2021). [CrossRef]
- Nagashima, G.; Kurokawa, Y.; Zhong, Y.; Horiike, S.; Schönke, D.; Krautscheid, P.; Reeve, R.; Kläui, M.; Inagaki, Y.; Kawae, T.; et al. Quasi-Antiferromagnetic Multilayer Stacks with 90 Degree Coupling Mediated by Thin Fe Oxide Spacers. Journal of Applied Physics 126, 093901 (2019). [CrossRef]
- Zhong, Y.; Kurokawa, Y.; Nagashima, G.; Horiike, S.; Hanashima, T.; Schönke, D.; Krautscheid, P.; Reeve, R.M.; Kläui, M.; Yuasa, H. Determination of Fine Magnetic Structure of Magnetic Multilayer with Quasi Antiferromagnetic Layer by Using Polarized Neutron Reflectivity Analysis. AIP Advances 10, 015323 (2020). [CrossRef]
- Maruyama, R.; Yamazaki, D.; Aoki, H.; Akutsu-Suyama, K.; Hanashima, T.; Miyata, N.; Soyama, K.; Bigault, T.; Saerbeck, T.; Courtois, P. Improved Performance of Wide Bandwidth Neutron-Spin Polarizer Due to Ferromagnetic Interlayer Exchange Coupling. Journal of Applied Physics 130, 083904 (2021). [CrossRef]
- Zubayer, A. Enhanced Polarizing Neutron Optics with 11B4C Incorporation : SLD Tunability, Interface Refinement, and Elimination of Magnetic Coercivity. Licentiate thesis, comprehensive summary, Linköping University Electronic Press: Linköping, (2023).
- Grünberg, P.; Schreiber, R.; Pang, Y.; Brodsky, M.B.; Sowers, H. Layered Magnetic Structures: Evidence for Antiferromagnetic Coupling of Fe Layers across Cr Interlayers. Phys. Rev. Lett. 57, 2442–2445 (1986). [CrossRef]
- Spezzani, C.; Torelli, P.; Sacchi, M.; Delaunay, R.; Hague, C.F.; Salmassi, F.; Gullikson, E.M. Hysteresis Curves of Ferromagnetic and Antiferromagnetic Order in Metallic Multilayers by Resonant X-Ray Scattering. Phys. Rev. B 66, 052408 (2002). [CrossRef]
- Ma, C.T.; Zhou, W.; Kirby, B.J.; Poon, S.J. Interfacial Mixing Effect in a Promising Skyrmionic Material: Ferrimagnetic Mn4N. AIP Advances 12, 085023 (2022). [CrossRef]
- Sheng, P.; Fujita, T.; Mizuguchi, M. Anomalous Nernst Effect in Cox(MgO)1-x Granular Thin Films. Applied Physics Letters 116, 209901 (2020). [CrossRef]
- Moubah, R.; Magnus, F.; Warnatz, T.; Palsson, G.K.; Kapaklis, V.; Ukleev, V.; Devishvili, A.; Palisaitis, J.; Persson, P.O.Å.; Hjörvarsson, B. Discrete Layer-by-Layer Magnetic Switching in Fe / MgO ( 001 ) Superlattices. Phys. Rev. Applied 5, 044011 (2016). [CrossRef]
- Al-Rashid, M.M.; Bhattacharya, D.; Grutter, A.; Kirby, B.; Atulasimha, J. Polarized Neutron Reflectometry Study of Depth Dependent Magnetization Variation in Co Thin Film Due to Strain Transfer from PMN-PT Substrate. Journal of Applied Physics 124, 113903 (2018). [CrossRef]
- Ukleev, V.; Ajejas, F.; Devishvili, A.; Vorobiev, A.; Steinke, N.-J.; Cubitt, R.; Luo, C.; Abrudan, R.-M.; Radu, F.; Cros, V.; et al. Observation by SANS and PNR of Pure Néel-Type Domain Wall Profiles and Skyrmion Suppression below Room Temperature in Magnetic [Pt/CoFeB/Ru]10 Multilayers. Science and Technology of Advanced Materials 25, 2315015 (2024). [CrossRef]
- Kostylev, M.; Causer, G.L.; Lambert, C.-H.; Schefer, T.; Weiss, C.; Callori, S.J.; Salahuddin, S.; Wang, X.L.; Klose, F. In Situ Ferromagnetic Resonance Capability on a Polarized Neutron Reflectometry Beamline. J Appl Crystallogr 51, 9–16 (2018). [CrossRef]
- Zubayer, A.; Eriksson, F.; Ghafoor, N.; Stahn, J.; Birch, J.; Glavic, A. Optimization of Magnetic Contrast Layer for Neutron Reflectometry. (2025). [CrossRef]
- Takeda, M.; Yamazaki, D.; Soyama, K.; Maruyama, R.; Hayashida, H.; Asaoka, H.; Yamazaki, T.; Kubota, M.; Aizawa, K.; Arai, M.; et al. Current Status of a New Polarized Neutron Reflectometer at the Intense Pulsed Neutron Source of the Materials and Life Science Experimental Facility (MLF) of J-PARC. Chinese J. Phys. 50, 161 (2012).
- Kai, T.; Harada, M.; Teshigawara, M.; Watanabe, N.; Kiyanagi, Y.; Ikeda, Y. Neutronic Performance of Rectangular and Cylindrical Coupled Hydrogen Moderators in Wide-Angle Beam Extraction of Low-Energy Neutrons. Nuclear Instruments and Methods in Physics Research Section A: Accelerators, Spectrometers, Detectors and Associated Equipment 550, 329–342 (2005). [CrossRef]
- Nakajima, K.; Kawakita, Y.; Itoh, S.; Abe, J.; Aizawa, K.; Aoki, H.; Endo, H.; Fujita, M.; Funakoshi, K.; Gong, W.; et al. Materials and Life Science Experimental Facility (MLF) at the Japan Proton Accelerator Research Complex II: Neutron Scattering Instruments. QuBS 1, 9 (2017). [CrossRef]
- Liaud, P.; Steinberg, R.I.; Vignon, B. A Two-Coil Spin Flipper for Beams of Polarized Slow Neutrons. Nuclear Instruments and Methods 125, 7–8 (1975). [CrossRef]
- Hayter, J.B. Matrix Analysis of Neutron Spin-Echo. Z Physik B 1978, 31, 117–125. [CrossRef]
- Nakatani, T.; Inamura, Y.; Moriyama, K.; Ito, T. IROHA2: Standard Instrument Control Software Framework in MLF, J-PARC. NOBUGS 2016 Proceedings 76 (2016). [CrossRef]
- Inamura, Y.; Nakatani, T.; Suzuki, J.; Otomo, T. Development Status of Software “Utsusemi” for Chopper Spectrometers at MLF, J-PARC. J. Phys. Soc. Jpn. 82, SA031 (2013). [CrossRef]
- Glavic, A.; Björck, M. GenX 3 : The Latest Generation of an Established Tool. J Appl Crystallogr 55, 1063–1071 (2022). [CrossRef]
- Su, J.; Garvey, C.J.; Holt, S.; Tabor, R.F.; Winther-Jensen, B.; Batchelor, W.; Garnier, G. Adsorption of Cationic Polyacrylamide at the Cellulose–Liquid Interface: A Neutron Reflectometry Study. Journal of Colloid and Interface Science 448, 88–99 (2015). [CrossRef]
- Nelson, A. Co-Refinement of Multiple-Contrast Neutron/X-Ray Reflectivity Data Using MOTOFIT. J Appl Crystallogr 39, 273–276 (2006). [CrossRef]
- Nelson, A. Motofit – Integrating Neutron Reflectometry Acquisition, Reduction and Analysis into One, Easy to Use, Package. J. Phys.: Conf. Ser. 251, 012094 (2010). [CrossRef]
Figure 1.
Schematic top view of the SHARAKU (BL17) beamline, showing the layout of the key polarization components along the neutron beam path, including the newly developed WFSE, polarizer, two spin flippers, sample stage, analyzer, 2θ arm, and detector.
Figure 1.
Schematic top view of the SHARAKU (BL17) beamline, showing the layout of the key polarization components along the neutron beam path, including the newly developed WFSE, polarizer, two spin flippers, sample stage, analyzer, 2θ arm, and detector.
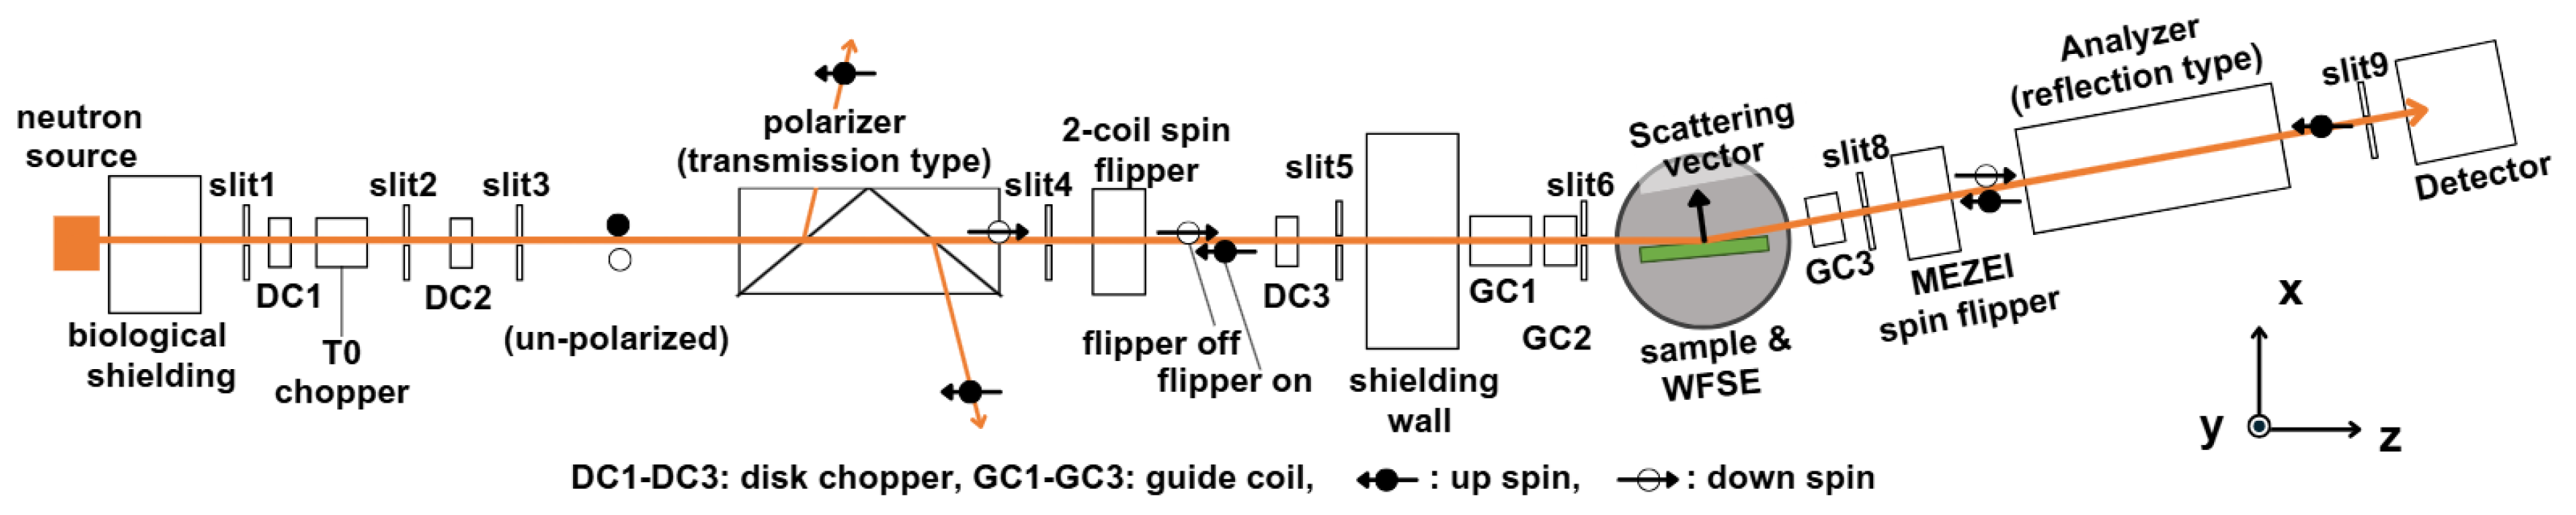
Figure 2.
Schematics of WFSE: (a) horizontal (longitudinal, ‖ beam) configuration, where the field is applied parallel to the neutron beam axis; (b) vertical (transverse, ⊥ beam) configuration, where the field is applied perpendicular to the neutron beam axis. The sample is located at the center of the coil assembly in both configurations.
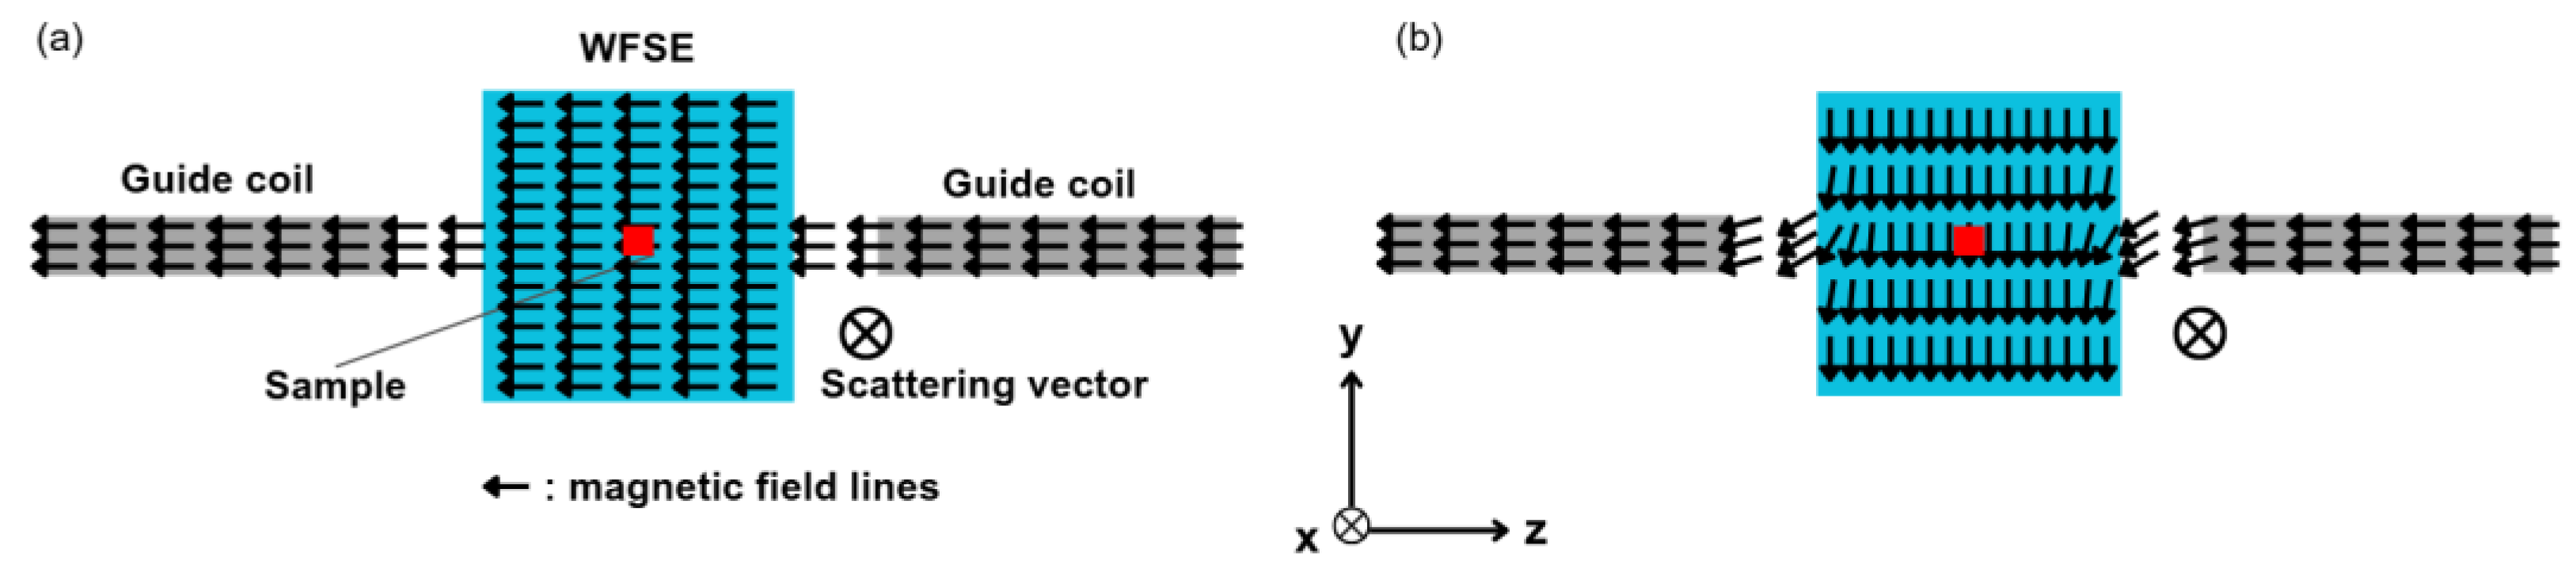
Figure 3.
On-sample magnetic field (H) versus HC current (I) in the horizontal WFSE configuration. The solid line shows a linear fit of H (Oe) = 6.226 × I (A) + 1.4; the error bars (±1 s.d., ~0.2 Oe = 20 µT) are smaller than the symbol size. The relationship is linear, with an offset of +1.4 Oe resulting from the combined contributions of the guide field and the geomagnetic field.
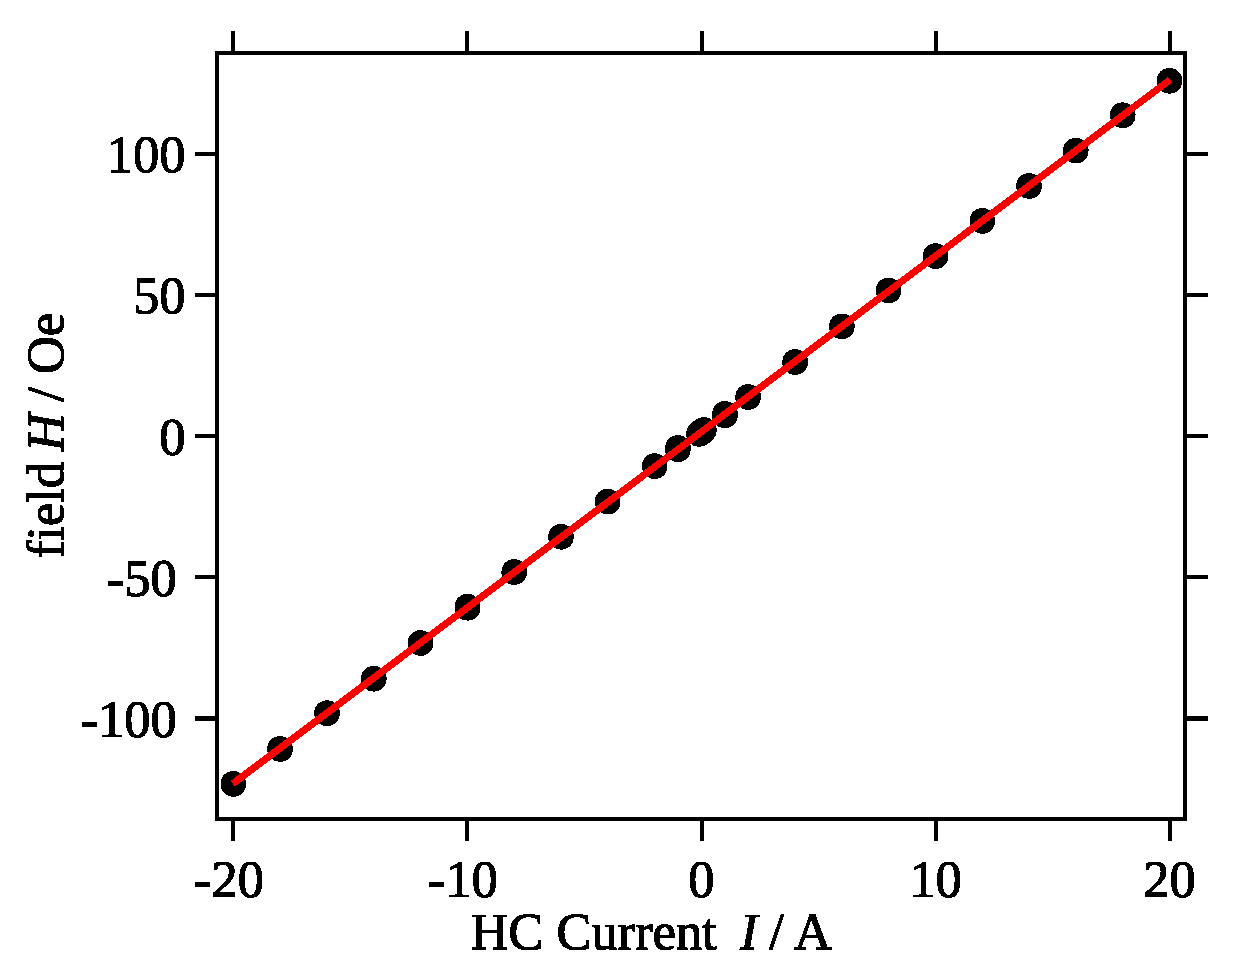
Figure 4.
Four-channel direct spectra measured under a 1.4 Oe (0 A in the HC) magnetic field in the horizontal configuration; usable wavelength band range: 0.24–0.88 nm.
Figure 4.
Four-channel direct spectra measured under a 1.4 Oe (0 A in the HC) magnetic field in the horizontal configuration; usable wavelength band range: 0.24–0.88 nm.
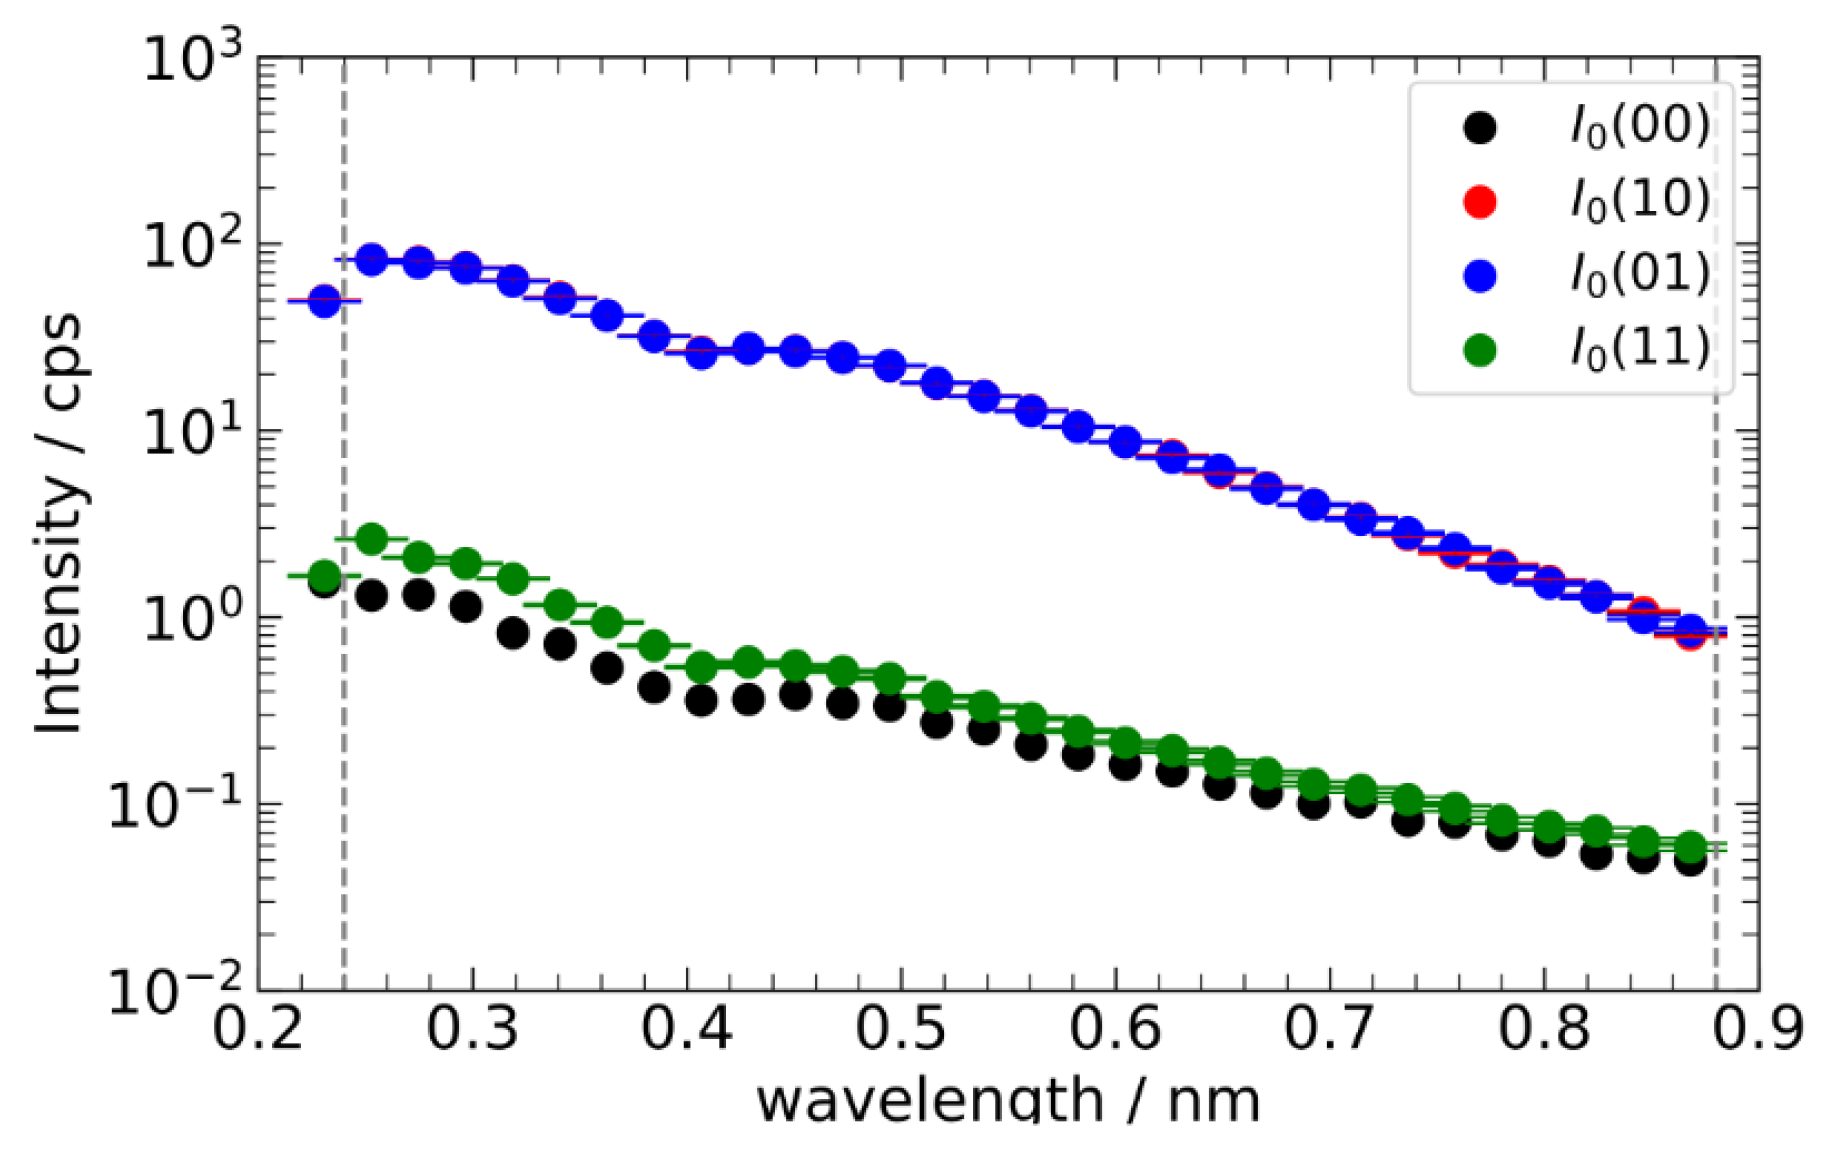
Figure 5.
Wavelength dependence of the polarization efficiencies derived from four-channel direct and four-channel reflection measurements at a magnetic field of +1.4 Oe. The efficiencies of the upstream spin flipper (F1), downstream spin flipper (F2), and polarizer () remain nearly constant over the wavelength range, while those of the analyzer (A₂) and total system (Ptotal) decrease toward longer wavelengths.
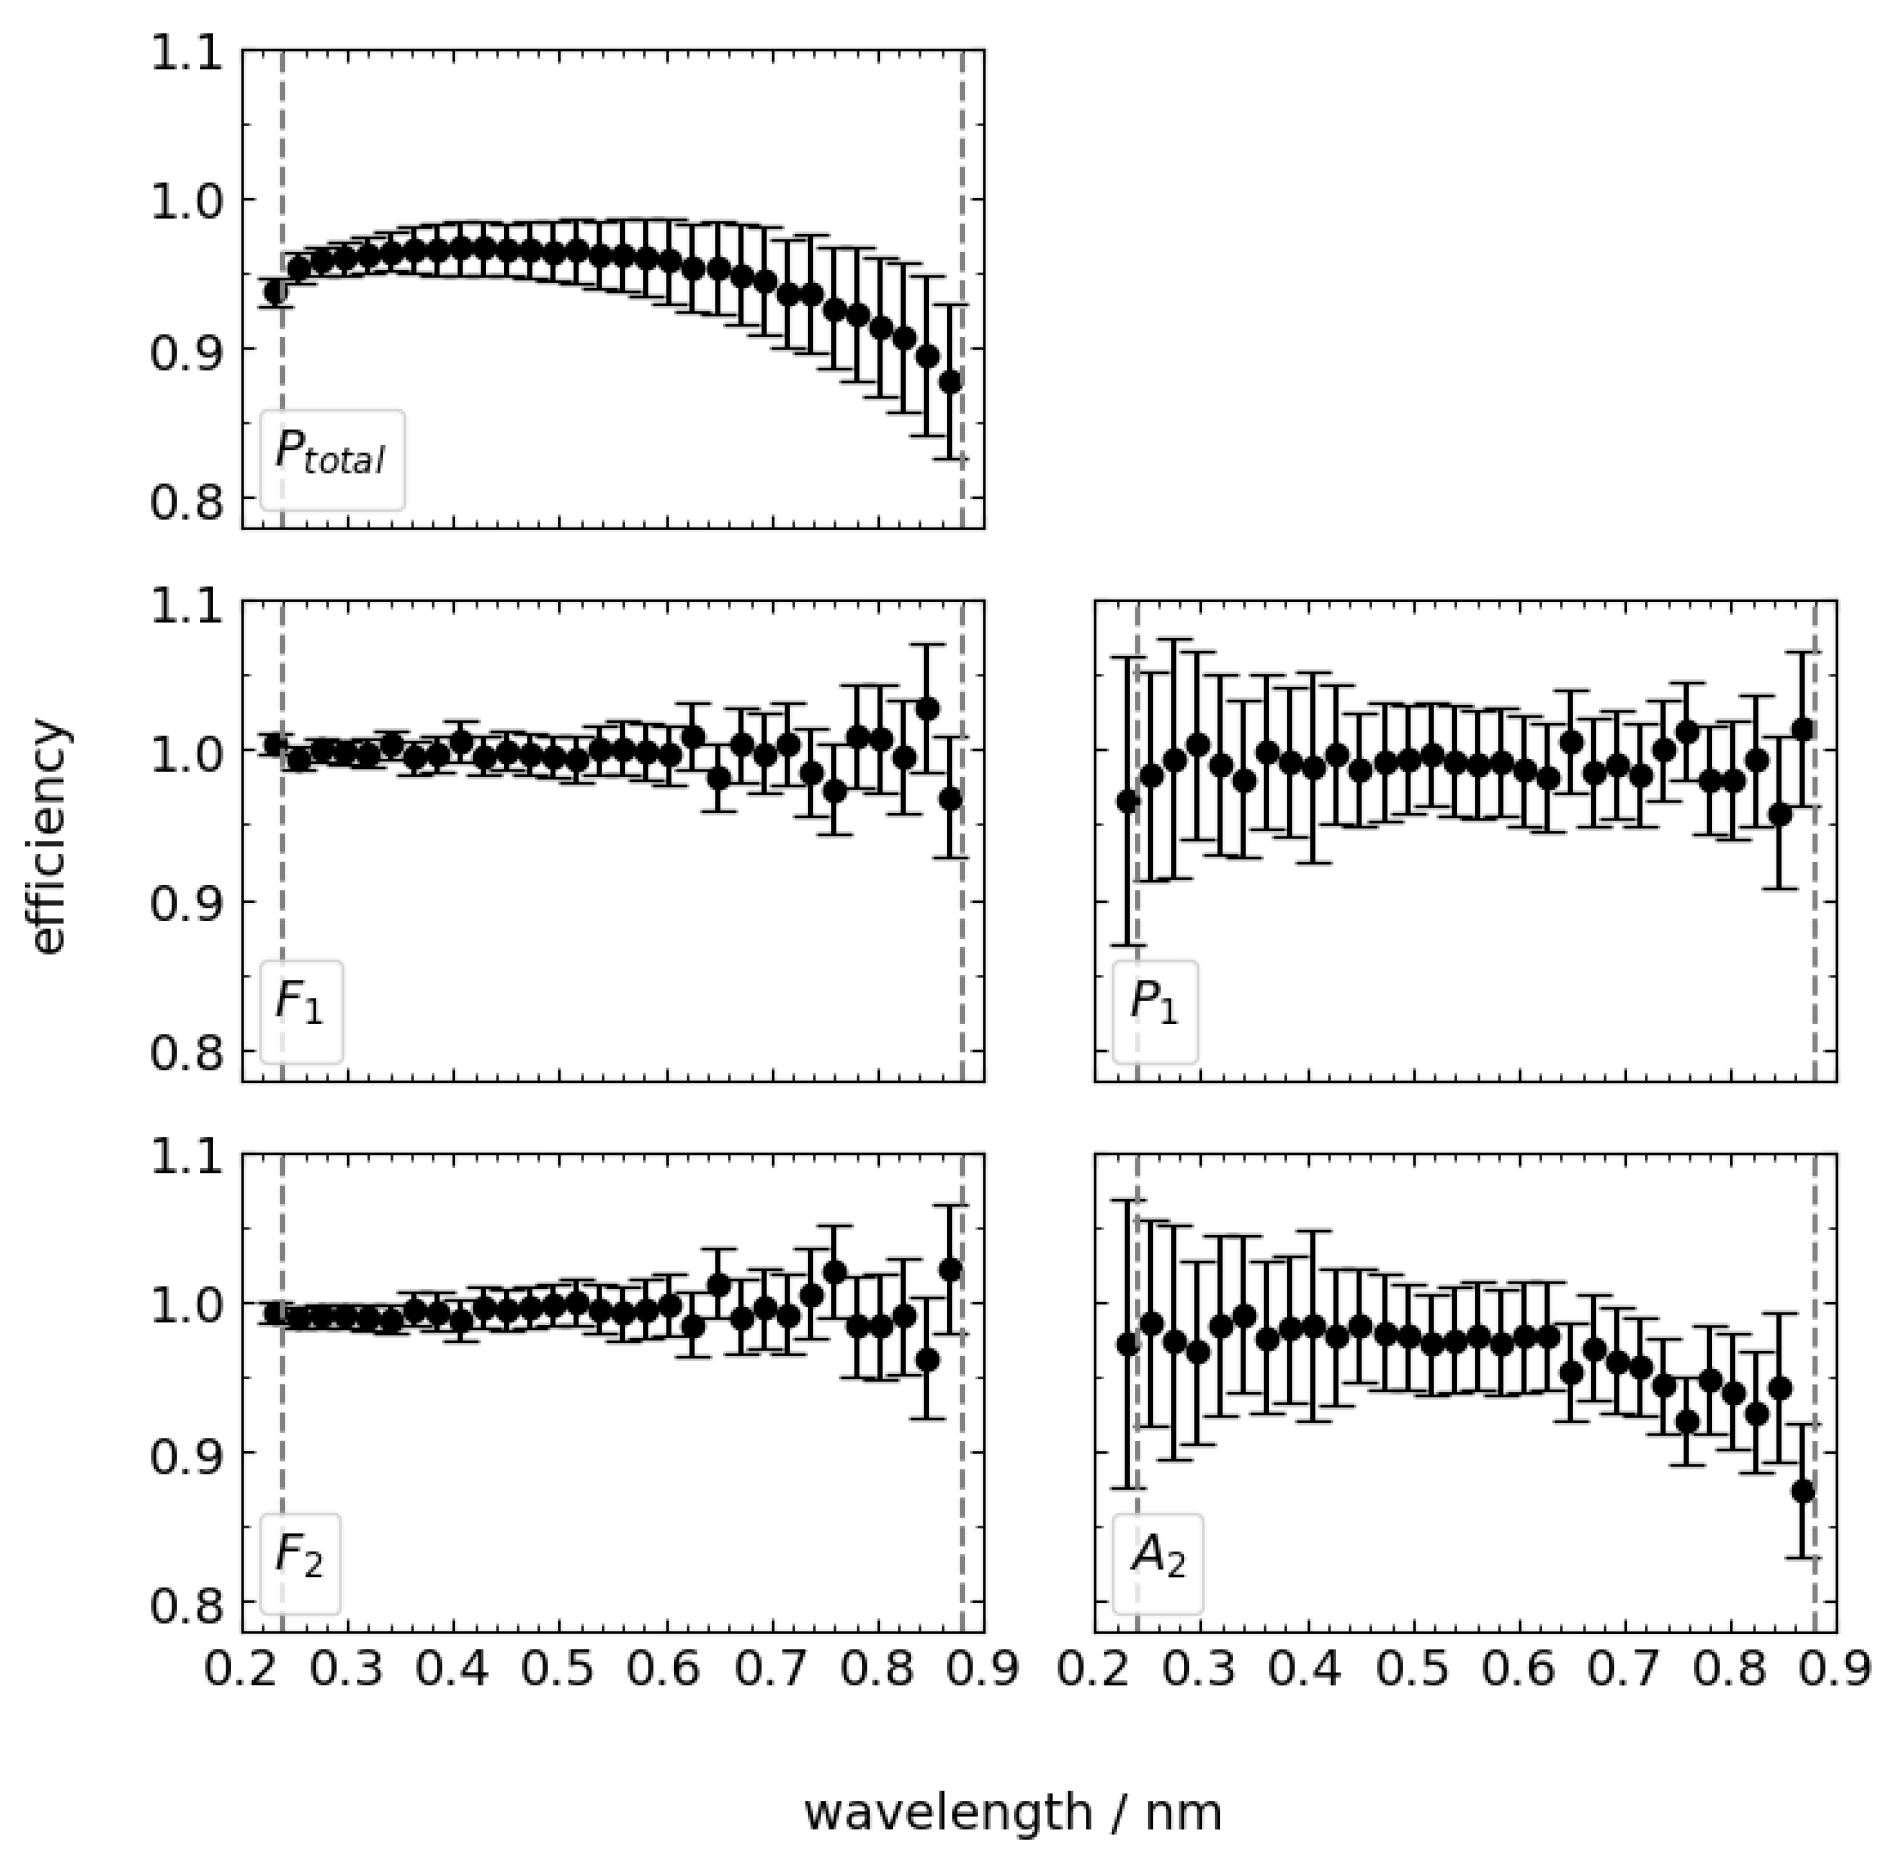
Figure 6.
Magnetic field dependence of the total polarization efficiency (Ptotal) measured at varying wavelengths in the horizontal field configuration. Ptotal remained nearly constant over the range of 0.4–125.9 Oe, demonstrating stable polarization performance under weak magnetic field conditions.
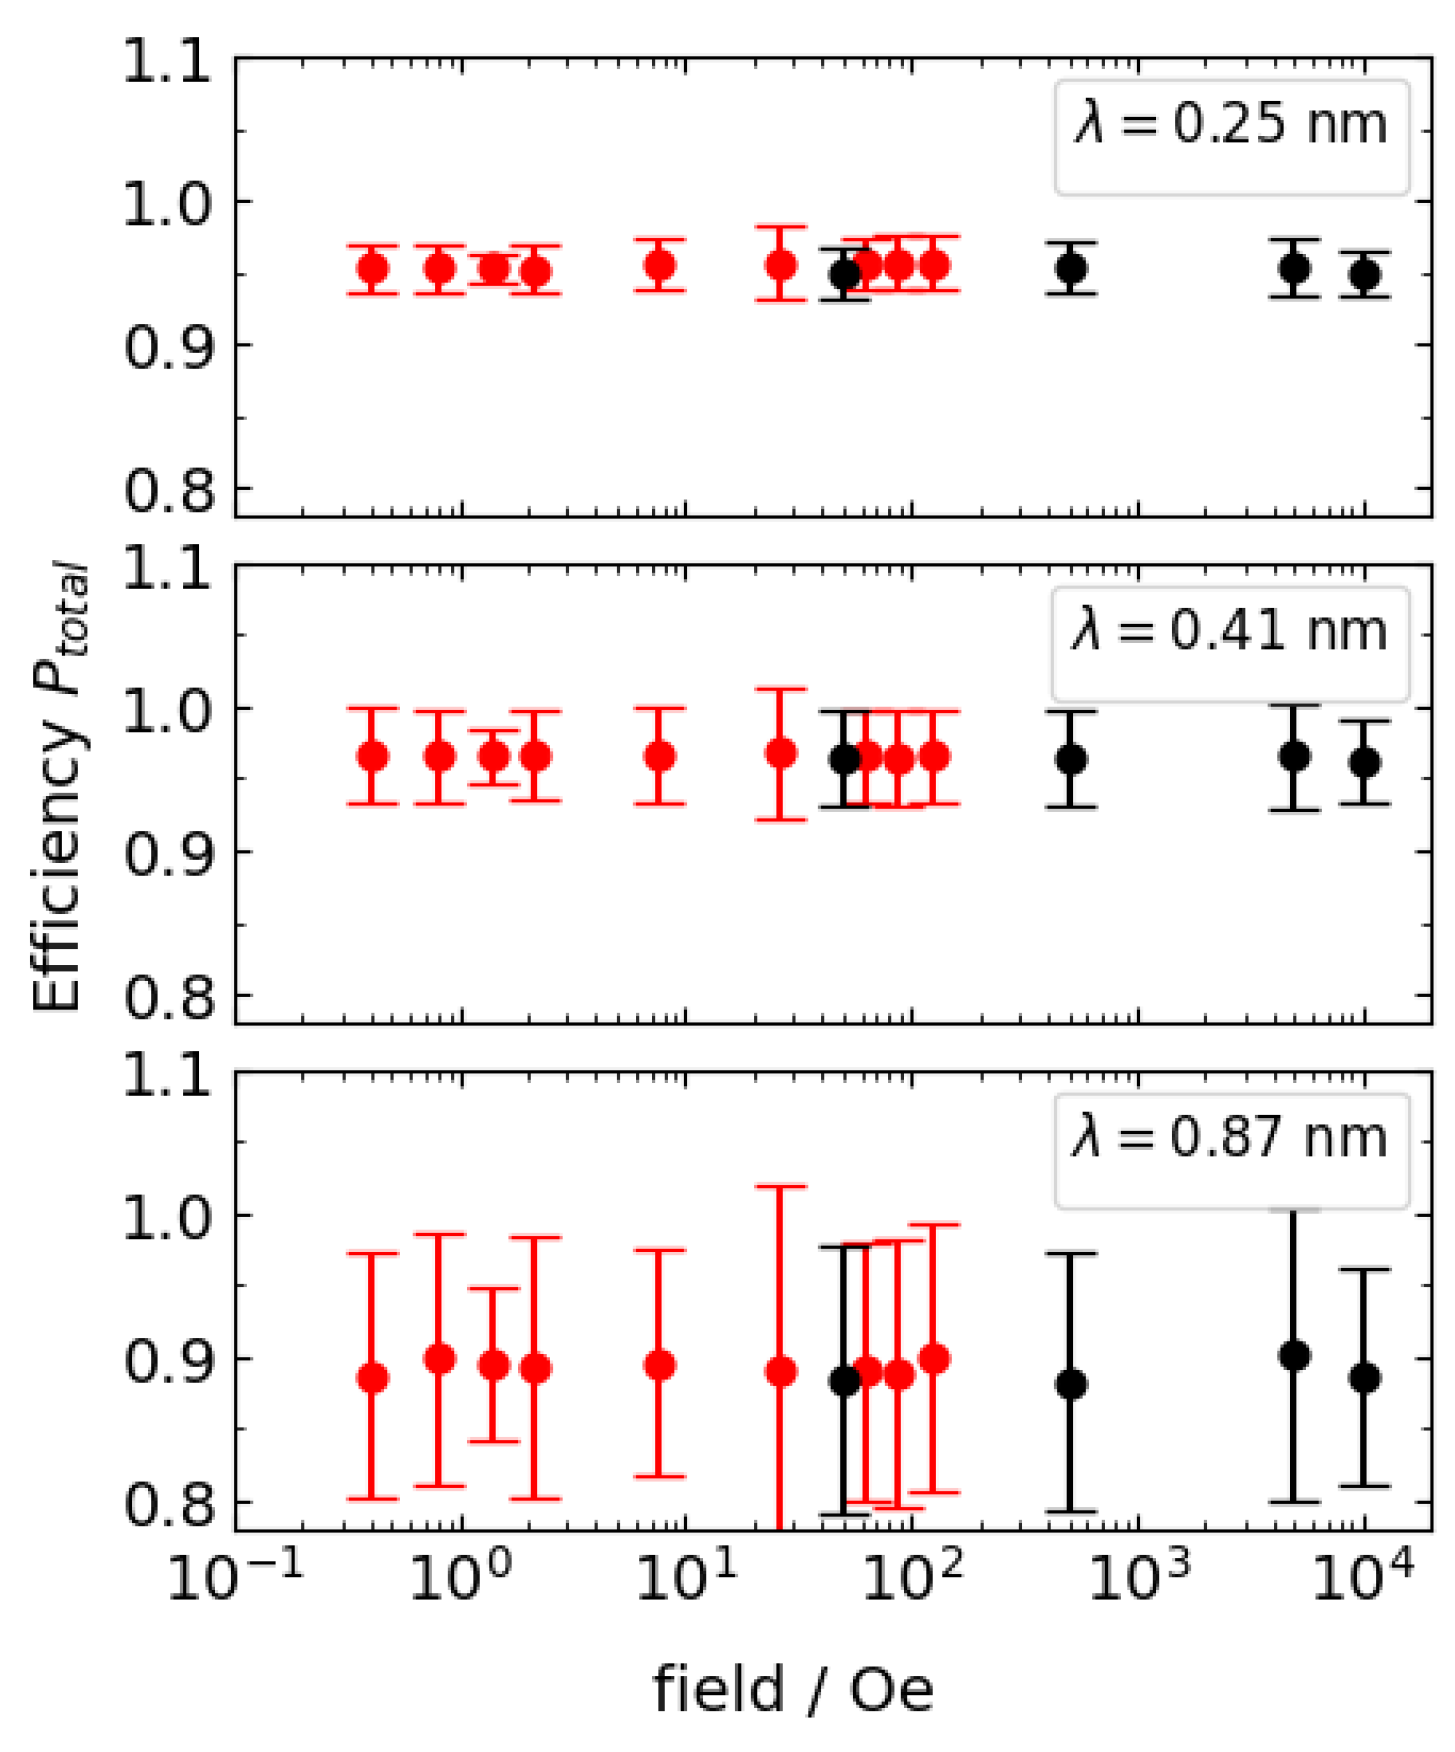
Figure 7.
Magnetization curve and PNR-derived magnetic structure of SiO2(100 nm)/Fe(20 nm)/MgO. (a) SQUID M–H curve. (b) Four-channel PNR spectra acquired at +10 Oe after presetting the magnetic history at −120 Oe. (c) Depth profiles of nuclear and magnetic scattering-length densities (nSLD, mSLD) and the average magnetization tilt obtained from global fits to (b). (d)–(g) Two-channel PNR at 10, 20, 30, and 66 Oe, together with the average magnetic moment per Fe atom extracted at each field.
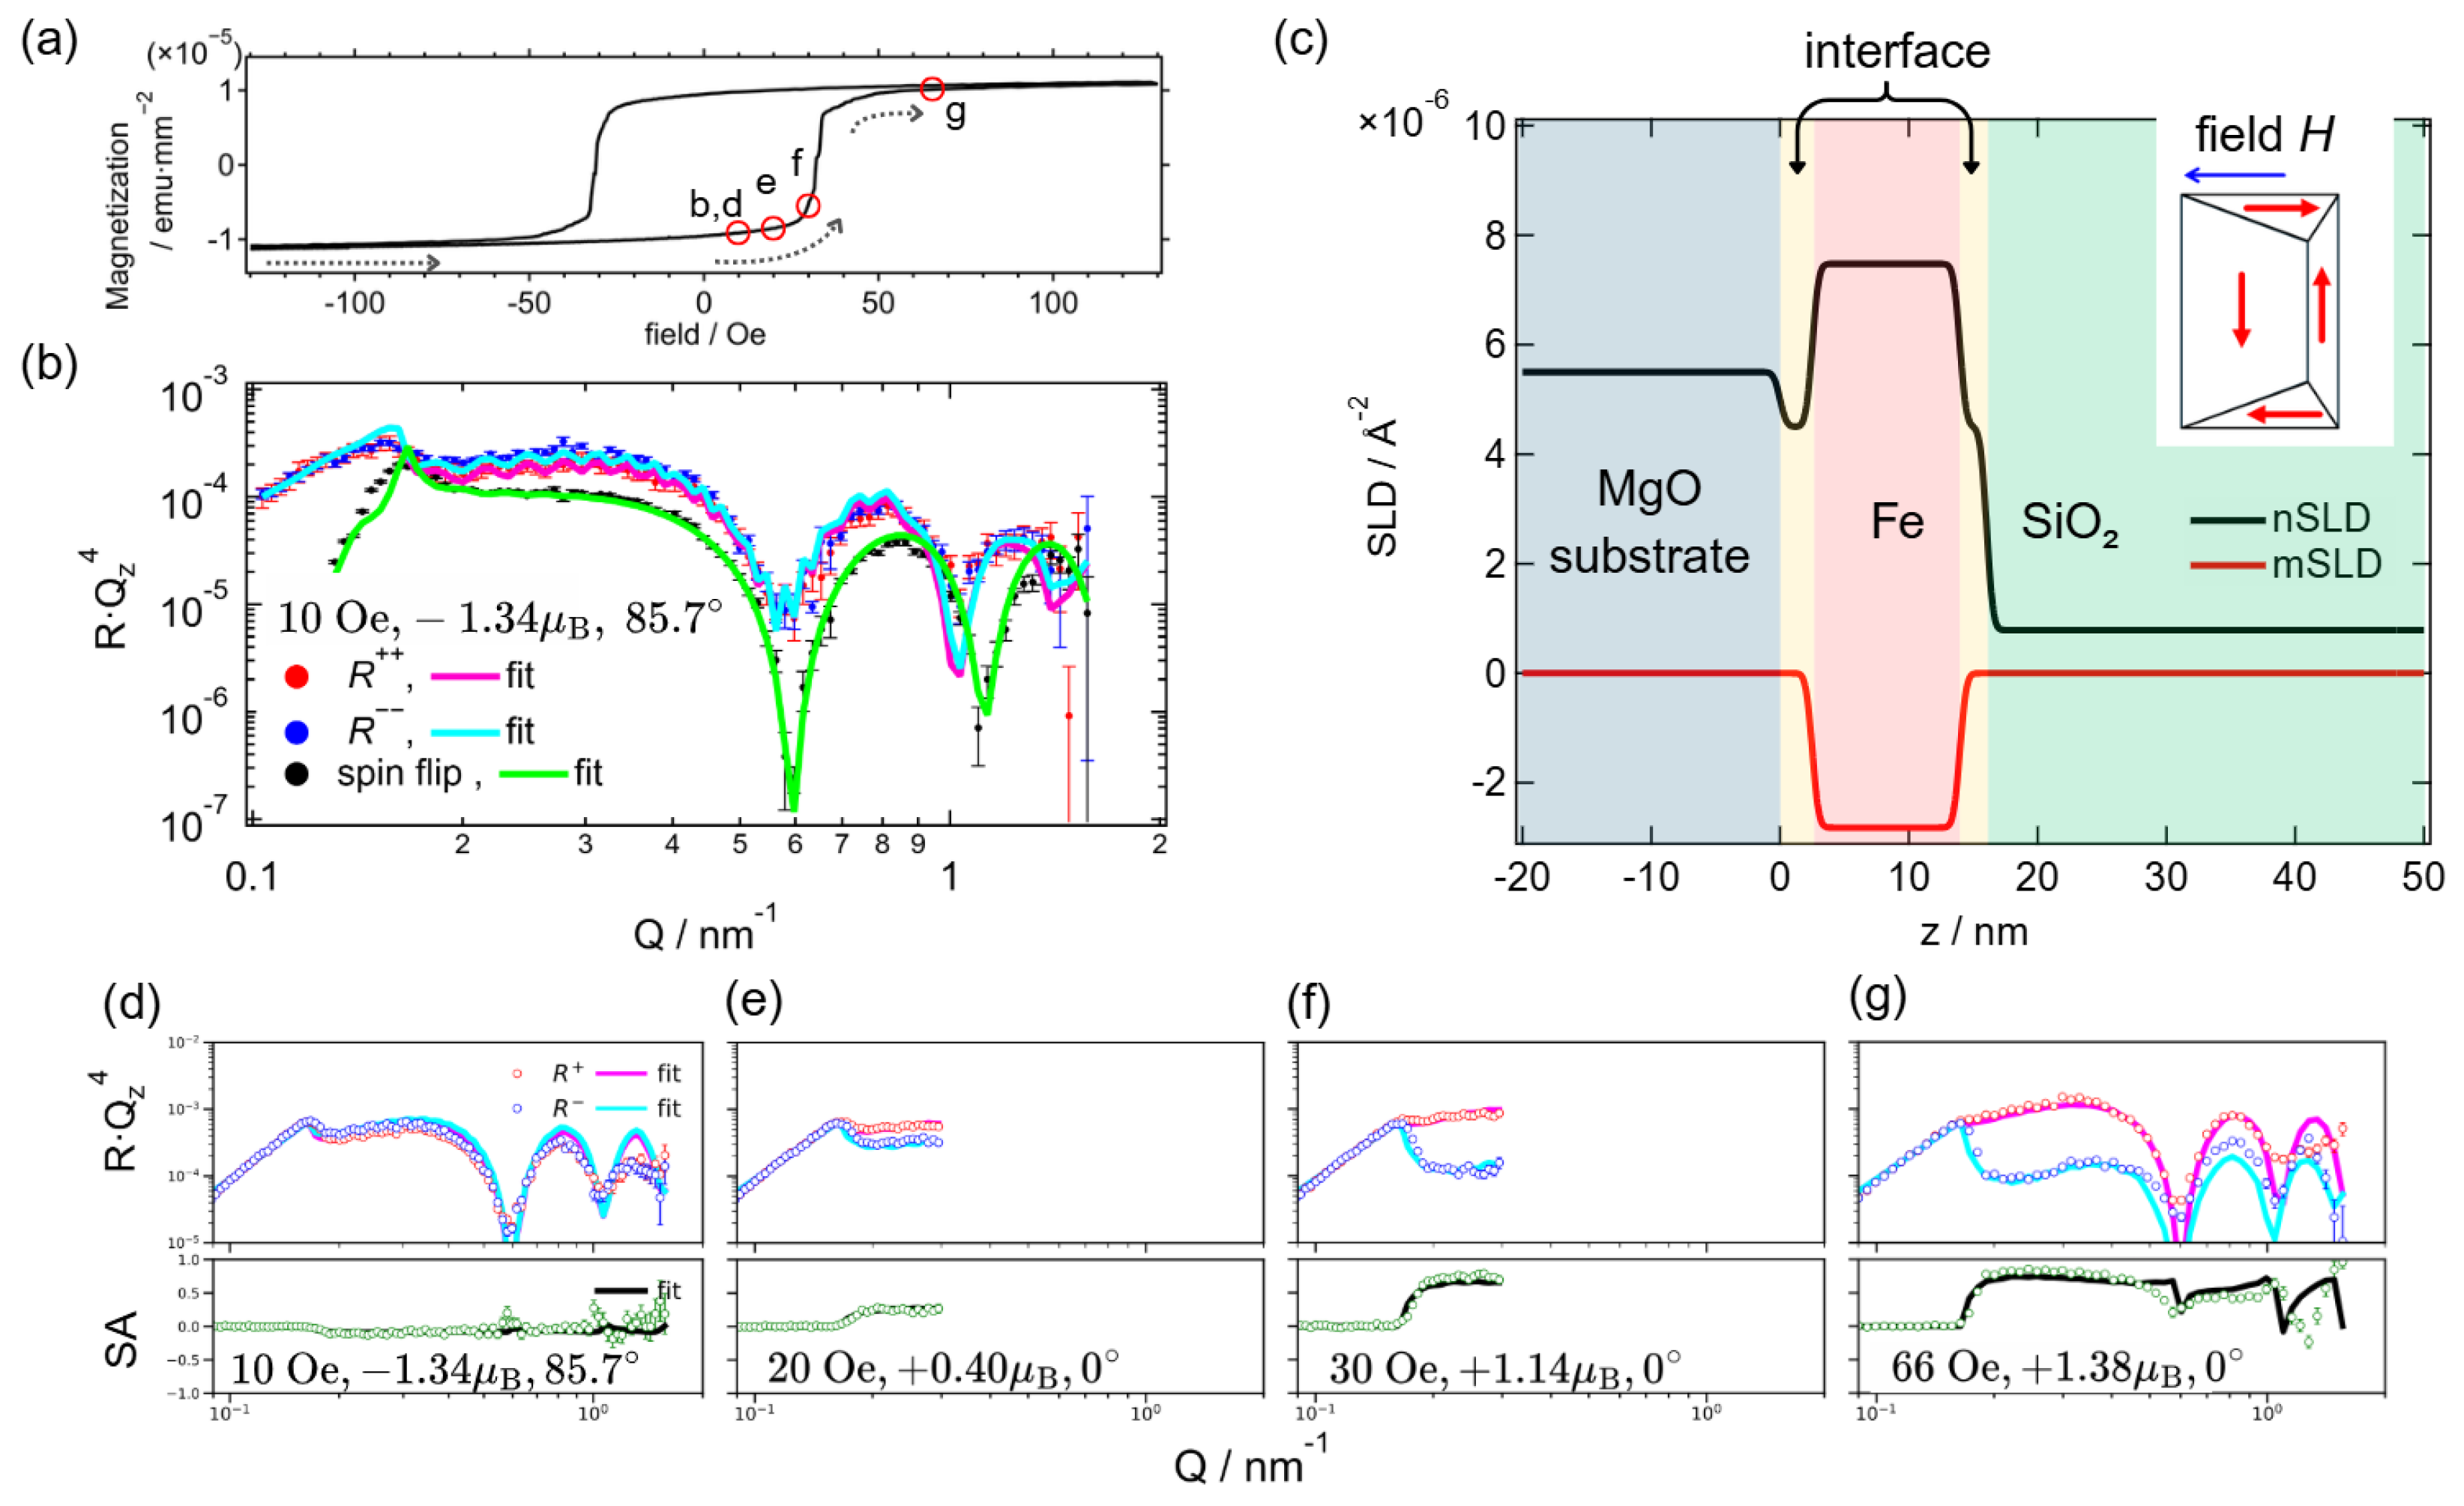

Table 1.
Operational states of the spin flippers and the corresponding measured spin-dependent reflectivity channels. "off" indicates no spin flip, and "on" indicates spin inversion. Owing to the finite polarization and flipping efficiencies, the spin states shown represent the dominant components in each configuration.
| Upstream flipper | Downstream flipper | I(ij) | Corrected intensity |
|---|---|---|---|
| off (0) | off (0) | I0(00), I(00) | I0−+, R−+ |
| off (0) | on (1) | I0(01), I(01) | I0−−, R−− |
| on (1) | off (0) | I0(10), I(10) | I0++, R++ |
| on (1) | on (1) | I0(11), I(11) | I0−+, R−+ |
Disclaimer/Publisher’s Note: The statements, opinions and data contained in all publications are solely those of the individual author(s) and contributor(s) and not of MDPI and/or the editor(s). MDPI and/or the editor(s) disclaim responsibility for any injury to people or property resulting from any ideas, methods, instructions or products referred to in the content. |
© 2025 by the authors. Licensee MDPI, Basel, Switzerland. This article is an open access article distributed under the terms and conditions of the Creative Commons Attribution (CC BY) license (http://creativecommons.org/licenses/by/4.0/).
Copyright: This open access article is published under a Creative Commons CC BY 4.0 license, which permit the free download, distribution, and reuse, provided that the author and preprint are cited in any reuse.


