
Submitted:
04 August 2024
Posted:
06 August 2024
You are already at the latest version
Abstract
There is an increasing need for compact low-cost NMR apparatus that can be used on the laboratory bench and in the field. There are four main usage variants of usage: a) Time-Domain apparatus, particularly for physical measurements; b) Frequency Domain apparatus, particularly for chemical analysis, c) NMR Cryoporometry apparatus for measuring pore-size distributions, and d) MRI apparatus for imaging. For all of these, variable temperature capability may be vital. We have developed compact low-cost apparatus targeted at these applications. We discuss a hand-held size NMR spectrometer, and three different holdable NMR magnets, with sufficiently large internal bores for the Lab-Tools compact Peltier thermo-electric cooled variable-temperature probes. Currently the NMR Spectrometer is very suitable for a), NMR time-domain relaxation and c), NMR Cryoporometry. With a suitable high-homogeneity magnet it is also appropriate for simple use b), spectral analysis, or, with a suitable gradient set, use d), MRI. Together, the NMR Spectrometer, one of the NMR variable-temperature probes, and any of these NMR magnets make an excellent NMR Cryoporometers, as demonstrated by this paper, and previously published research. Equally, they make versatile general-purpose variable-temperature NMR systems for materials-science.
Keywords:
time-domain
; nmr relaxation
; variable-temperature
; pore-size
; materials-science
; Halbach magnet
; NMR spectrometer
; NMR cryoporometer
1. Introduction
Earlier prototype and preliminary versions of a very compact NMR time-domain NMR Spectrometer (Lab-Tools MK3), with digital R.F. processing and variable-temperature capability, have been presented at the Magnetic Resonance in Porous Media (MRPM) conferences in 2019 [1] and 2022 (in this Journal [2]). We will be discussing an even more compact and contained version (Lab-Tools MK4) (think of a one pound/500g tub of butter/spread), with a frequency range up to 50 MHz. A variant, the MK5, is being evaluated, which has an NMR frequency range up to 122 MHz.
We also discuss variable-temperature NMR probes, with an even wider temperature range (-60C to +80C). These are Peltier thermo-electrically cooled NMR probes suitable for both general purpose variable-temperature materials-science measurements, and also for NMR Cryoporometric measurements of nano- to micro-scale pore information from porous materials.
We will be presenting recent measurements performed using these instruments, including preliminary experiments on the motional molecular dynamics of ice, in the bulk and in pores, using transverse relaxation time T2 as well as longitudinal relaxation in the rotating frame – the spin-lock T1ρ sequence [3].
Experimental results demonstrate that this compact NMR spectrometer is capable of working over the frequency range both down sub-MHz and up to over 100 MHz. Some groups have been extending the application of this instrument from just the time-domain into the frequency domain, at frequencies up to around 100 MHz. Collaborations are underway to bring full spectroscopy to the MK4 and MK5. Export of FIDs to the spectral manipulation and analysis tool MNova [4] is now possible, using standard data formats. Moreover various groups are applying and extending the multi-nuclear capability of this instrument, which has already been shown to be capable of working with 1H, 19F, 31P, 7Li, 11B and 23Na nuclei.
As well as the current 55mm Bore 0.3T Halbach magnet, a more compact 40mm Bore 0.5T Halbach magnet is being developed as a more homogeneous replacement for the earlier coffee-mug sized 36mm Bore 0.3T Mandhalas magnet.
2. Materials and Methods
The NMR instrumentation described may be grouped as a compatible set of : two NMR Spectrometers, a pair of thermo-electrically cooled variable-temperature NMR probes, and a set of three NMR magnets.
2.1. MK4 0 to 50 MHz Compact NMR Spectrometer
The Lab-Tools MK4 NMR Spectrometer for liquids and solids, Figure 1, is primarily a time-domain instrument, being a development of the earlier MK3 design [22], but does now have additional software in the Graphical User Interface (GUI) for spectral analysis.
The NMR low-noise receiver and NMR linear amplifier that were separate are now combined onto the same printed circuit board (PCB). Additional circuitry that was in the form of external cables, 50 Ohm load, and R.F. attenuator, are now also included on the PCB.
The NMR Probe tuning capacitor is now also included in the MK4 / MK5 boxes. There are a choice of two, the original 1.5 to 40pF capacitor, or an optional 1.5 to 120pF capacitor, giving a much wider tuning range.
The same Gate-Array module as the MK3, the Red Pitaya 125 MHz 14 bit module [5], is used for digital R.F. generation of the NMR pulses, and demodulation of the received NMR signal [1,2]. It also has the NMR Pulse Program pipeline, that is programmed from a high-level array-processing language (AplX[6.7]) sequence generator in the GUI.
The firmware for this Gate-Array is loaded in a micro-SD card, plugged into the FPGA module. This has additional features compared with the earlier firmware, in that there is additional support for a modified R.F. gate pulse, that allows for a damping control at the end of the pulse, see Section 2.1.2.
This module also contains dual 125 MHz 14 bit Digital to Analog converters : OUT1 is used for the RF drive to the NMR linear amplifier; OUT2 can be used under control of the GUI for generation of a low-level constant amplitude R.F. that can be injected (via the new circuitry) into the NMR receiver circuit. This is used for NMR probe tuning, and amplitude calibration.
This module also contains dual 125 MHz 14 bit Analog to Digital receivers : IN1 is used for the reception of the output of the low-noise NMR receiver. IN2 receives a highly attenuated version of the NMR pulse in the NMR probe. This, under control of the GUI, may be used to monitor the amplitude and shape of the R.F. pulse in the probe, and hence may also be used to plot a NMR probe tuning curve.
There is in addition a digital output from the gate array that is used to gate the NMR linear amplifier, under control of the firmware, and also a serial output that is used by the menu to fine tune the gain of the low-noise receiver, in conjunction with pins that turn it on and off, and switch a 12dB attenuator on and off.
The AplX software includes a highly effective frequency lock, that may be used to lock the NMR spectrometer frequency to that of the received NMR signal. Even with a fairly broad-band setting, suitable for capturing FID decay signals from ice or polymers, the spectrometer can follow and lock on to the NMR from a drifting magnet (say from temperature variation) from a liquid signal level of about say 1V, down to a sub 1mV level, as say a sample for NMR Cryoporometry progressively freezes on cooling, and then melts again as it is re-warmed up.
2.1.1. NMR Graphical User Interface
This is a straightforward development of the GUI for the MK3 NMR Spectrometer [2] (Figure 5), see Figure 2 for a typical example :
There are additional capabilities for frequency domain plotting, with either Hz or ppm scales, and auto or manual scaling in X or Y, see Figure 3 :
The frequency auto-lock can be used to keep the peak fairly-well centered, even if the magnet field drifts with temperature.
2.1.2. NMR Pulse Recovery; Active Damping
When the NMR linear amplifier is enabled by its gate, it amplifies the R.F. input from OUT1 and drives the NMR probe transmitter circuit. When not enabled by is gate, the output goes to a high-impedance state, so as not to damp the NMR probe.
If the amplifier is kept enabled briefly, after the end of the R.F. pulse, it goes into a low-impedance state, and will act to damp the decaying R.F. pulse circulating in the NMR tuned circuit. This brief delay is now settable in the pulse sequence firmware and adjusted in the GUI. Figure 5 shows a briefly damped receiver fast recovery signal :
2.2. MK5 0 to 122 MHz Compact NMR Spectrometer
A development of the Lab-Tools MK4 NMR Spectrometer to a wider frequency range, the MK5, uses a different Red Pitaya gate-array module, the 122.88 MHz 16 bit version [8]. This module contains dual 122.88 MHz 14 bit Digital to Analog converters and 16 bit Analog to Digital converters. The reason for the particular clock frequency chosen, is that, expressed in Hertz, it is exactly divisible by two for many times, allowing for decimations 1536, 768, 384, 192, 96, 48. The decimations are used for filtering and receiver data rate reduction.
This version of the spectrometer operates in two frequency ranges: the first Nyquist zone from 0 to 61 MHz and the second Nyquist zone from 61 to 122 MHz. Currently external filters are used to assist operation. In the lower frequency range, a 50 MHz low-pass filter removes signal images in the higher Nyquist zones. In the upper frequency range, bandpass filters (say 10 MHz wide) have been found to work best. A small fixed-gain amplifier block is used to re-amplify the filtered signal to the correct amplitude to drive the linear amplifier.
The NMR receiver and NMR linear amplifier PCB is unchanged from the MK4 version. This has been tested to over 100 MHz; Figure 6 shows a pulse of 90 MHz R.F. :
2.3. A range of CryoP Peltier Cooled NMR Probes
The Peltier thermo-electrically cooled probes have been discussed previously. The first one developed by Lab-Tools was CryoP2, used to cool a 100 Bar pressure probe for gas hydrate research [9].
Current versions are CryoP7, which is a single Peltier device, able to reach around -40C or below, and CryoP8, a dual Peltier device, able to reach around -60C. Both employ recirculating chillers set at +5C coolant temperature, to remove the waste heat. The AplX thermal control software with the Peltiers give extremely stable operation [2] (Section 8), even though the recirculating chillers only have a typical 0.5C stability. Both are sized to fit the bores of the Lab-Tools Mandhalas [10] and Halbach [12] NMR magnets.
2.3.1. CryoP7 Peltier Cooled NMR Probe
The CryoP7 Peltier cooled variable-temperature probe is shown in Figure 7, being assembled with a MK4 NMR Spectrometer, and a Halbach J1 NMR Magnet. Also shown, a Pelter cooled recirculating chiller, to remove the waste heat. This variable-temperature probe employs a single Peltier element and digitally controlled power-supply, to go down in temperature to about -40C, plus a resistance heater and digitally controlled power-supply, to also be able to reach +85C.
As the temperature decreases, the amplitude of the NMR signal from the sample increases, due to the quantum-mechanical spin-population changes – the Boltzmann Effect [12] - and also due to NMR coil resistance changes. When calculating a Cryoporometric melting curve, these changes are corrected for.
In Figure 8, the effect is seen using the CryoP7 Peltier thermo-electrically cooled variable-temperature NMR probe. With a room temperature of 27C, the sample temperature cooled to about -38C; with a room temperature of 20C it cooled to -42C :
2.3.2. CryoP8 Peltier Cooled NMR Probe
The CryoP8 Peltier cooled variable-temperature probe is Lab-Tools’ latest variable-temperature NMR probe. This variable-temperature probe, like the earlier CryoP6 NMR probe, employs a pair of Peltier elements and two digitally controlled power-supplies, to cool down to an estimated -60C, plus a resistance heater and digitally controlled power-supply, to also be able to reach +85C.
2.4. A range of Halbach and Mandhalas NMR Magnets
The Lab-Tools NMR magnets, Figure 9, are all fairly large bore, to enable their use with insulated wide-range variable-temperature NMR probes, or other internal Physical or Chemical apparatus, including gradient coils :
The 36mm bore Mandhalas M04 [2,10] magnet (Figure 9a) is constructed from 24 individual small cuboid magnets. Work is on-going to shim one of these Mandhalas magnets, to improve the field homogeneity, which is as yet not good, but is still fine for CPMG echo trains, as can be seen on the screen in Figure 9a. As a result it works well for NMR Cryoporometric measurements.
The 40 mm bore Halbach J1 [11] magnet (Figure 9b) is constructed from 8 shaped trapezoidal magnets, and is the highest field magnet of the Lab-Tools set, at 0.5T. When the shimming of the Mandhalas magnet is concluded, the same techniques will be applied to improve the homogeneity of this magnet.
The 55 mm bore Halbach magnet (Figure 9c) is supplied shimmed, and has a good homogeneity for a time-domain magnet, with a T2* of about 5 ms.
This set of 3 NMR magnets provide a good range of capabilities for compact bench-top and mobile time-domain NMR.
3. Results
As well as standard NMR relaxation measurements in liquids, polymers and solids as a function of temperature, this apparatus is capable of more unusual measurements :
3.1. NMR Transverse T2 Relaxation Measurements in Solid Brittle Ice
Very hard solids tend to have short T2 decay times that many NMR spectrometers find difficult to measure accurately. All the Lab-Tools NMR spectrometers, MK2, MK3 and now the MK4 have been able to study such samples. Figure 10 shows examples of NMR FIDs in brittle ice, for temperature from -25C to -5C, measured with a MK4 NMR Spectrometer :
These spectrometers have been used to study a wide range of solids, polymers and liquids, as well as tars and other hydrocarbons in porous rocks and biochars, as a function of temperature [13].
3.2. NMR Longitudinal Relaxation in the Rotating Frame in Water-Ice in Porous Silicas
NMR longitudinal and transverse relaxation times depend on sample temperature, and magnetic field strength, or to be more accurate, NMR frequency. One method of obtaining such data is by measuring in NMR magnets of different B0 field strengths (such as the three Lab-Tools NMR Magnets). A much more powerful method is called Fast Field Cycling, whereby the field B0 of a magnet is rapidly switched from a high value to a lower one, allowing relaxation measurements to be made at a range of NMR frequencies [14].
An alternative method, suitable for lower NMR frequencies, is, following an initial π/2 -x NMR pulse, to rapidly apply a continuous R.F. pulse in the y direction. This acts to spin-lock the rotating nuclei for the duration of the pulse, provided the B1 strength of the rotating field is larger than the local field variations in the sample. By varying the spin-lock duration, T1 in the rotating frame may be measured [3].
Temperature dependent minima may often be plotted in the Longitudinal relaxation times T1 and T1ρ. Figure 11 shows our theoretical curves, for T1ρ field strengths typical for the MK4 NMR spectrometer, plotted against correlation time τc.:
3.3. NMR Cryopopormetric Measurements Using Water/Ice in a Sol-Gel Silica
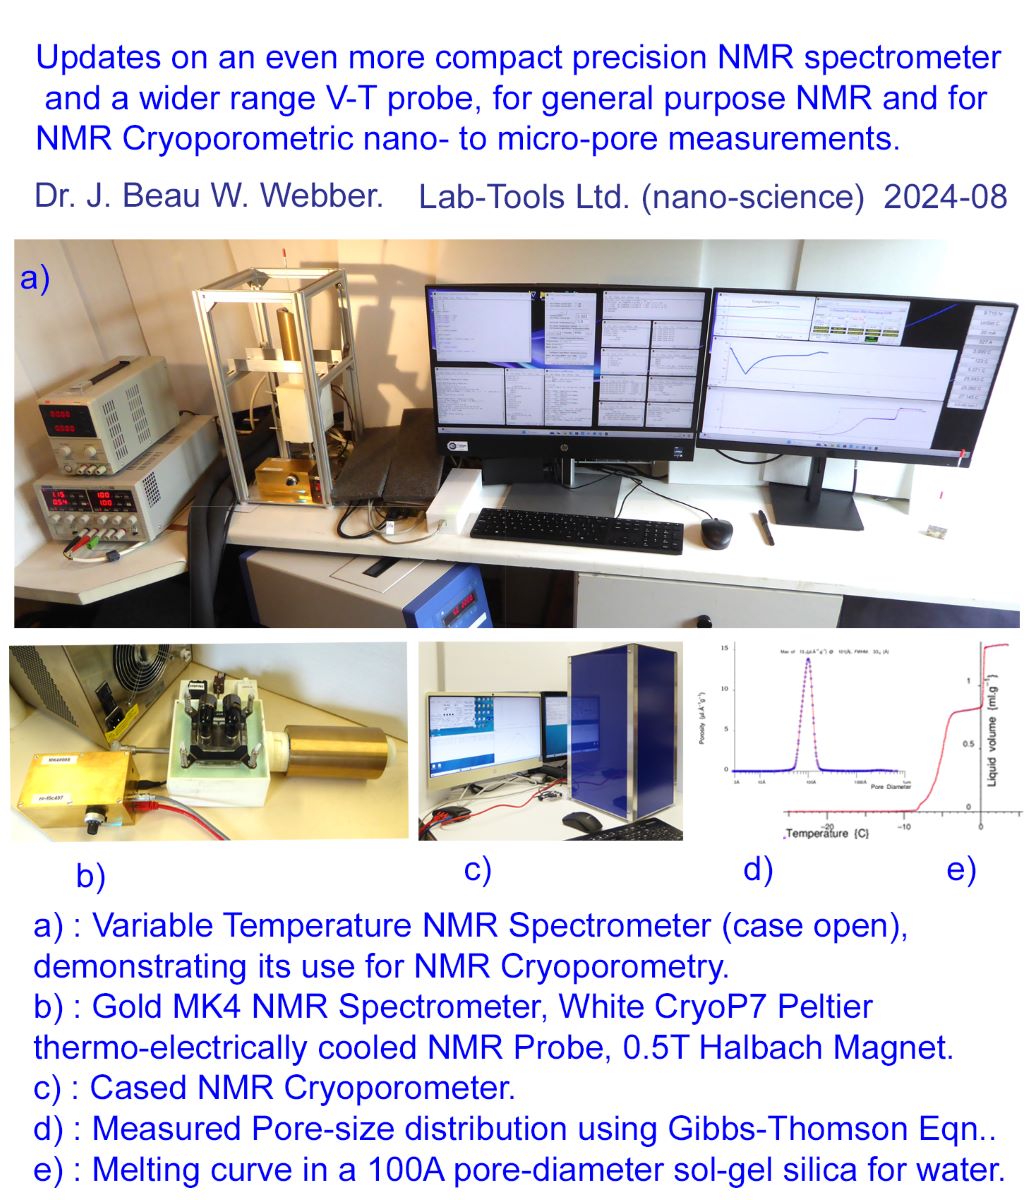
With a MK4 NMR Spectrometer, an earlier CryoP6 V-T probe, and a 55mm bore 0.33T Halbach magnet, a vertical configuration NMR Cryoporometer is shown in Figure 14 :
Figure 15 shows an example warming curve and the corresponding measured pore-size distribution for water in a nominal 100Å pore sol-gel silica:
The sol-gel silica is dried at about 120C in a NMR tube, and then weighed. A weighed quantity of water is added, to just more than fill the pores, and the sample allowed to equilibrate.
The Pelter thermo-electric device cools the sample down, and then very slowly and steadily warms it up. At low temperatures all the mobile water is frozen solid. As the sample reaches about -8C, the ice in the pores starts to melt, until at about -4C all the pore water is melted and there is a plateau. At about 0C the bulk liquid outside the grains starts to melt, and then there is a final plateau.
Standard NMR Cryoporometric theory [15,16] may then be applied to deduce a pore-size distribution, see Appendix A.
3.4. Cryoporometer Summary
This section has demonstrated the most effective NMR Cryoporometer of this series to date. The range offers various size and cost options. This result is particularly clean in terms of NMR signal-to-noise, and a precise, well-resolved resultant pore-size distribution is obtained. Measurements from sub-nanometer to about 2 micron pore diameter have been obtained using earlier versions of these NMR Cryoporometers [16,17,18]. These variable-temperature NMR / NMRC systems are now used regularly by various national and international organisations.
4. Discussion
This paper discusses the successful development of a progressive range of low-cost compact bench-top and mobile apparatus to facilitate NMR studies for materials-science.
Prior work using MK2 and Mk3 NMR Spectrometers has resulted in the writing of over 50 papers often with joint international authors [16], exploring the properties of a wide range of materials. These have included sol-gel silica, templated silicas and MOFs [16,17,18], biochar and other porous carbon material [13], nano-interface materials for batteries [19], porous meteorites [20], biological materials [21] and melanin from date palms [22].
Future work will involve further exploring the smallest and largest nano- to micro-pores that can be successfully and repeatably resolved using NMR Cryoporometry.
Further work on improving the homogeneity of the Mandhalas and Halbach NMR magnets is underway, certainly for at least time-domain relaxation studies.
Spectral resolution of at least simple organic molecules is a desirable goal, to enable chemical process monitoring. This requires considerable improvements in magnet homogeneity.
5. Patents
Webber, J.B.W. Nuclear Magnetic Resonance Probes. U.S. Patent 9,810,750 B2, 7th November 2017.
Funding
This research received no external funding.
Acknowledgments
The author would like to thank Pavel Demin for his development of the excellent firmware used in the gate-array.
Conflicts of Interest
The author declares no conflicts of interest.
Appendix A
NMR Cryoporometry (NMRC) Theory
Josiah Willard Gibbs and three different Thomsons (James Thomson, William Thomson (later Lord Kelvin) and J.J. Thomson) applied experiment, thermodynamics and generalised dynamics to produce an equation that well describes the phase-change behaviour of liquids in confined geometry; the Gibbs–Thomson equation for the melting point depression, Tm, for a small isolated spherical crystal, of diameter x, in its own liquid, may be expressed as [15] :
A development of the Gibbs–Thomson equation has been discussed that relates these phase changes so that the pore area and volume are related to the melting point depression [ nmrc 13,14,15] :
For many purposes this may be simplified so that the pore diameter x is related to a melting point depression {K} = Tm = kGT / x where we are grouping all the thermodynamic terms into a single constant, kGT {K.Å} - the Gibbs-Thomson coefficient - usually established by experiment [nmrc 15,16], and then applied, see Figure 15.
It is important to note that kGT includes a term dependent on pore geometry, as does the Kelvin equation. kd is the geometry term, and is equal to four for a spherical liquid-crystalline interface (conventionally assumed for cylindrical pores). Tm is the bulk melting point and the other terms are thermodynamic and density terms.
Thus the transformation of melting-point depression to pore-size is given by the Gibbs-Thomson equation, while the measurement of the pore volume vs. size distributions is facilitated by differentiating and re-mapping the melting curve data using the Strange-Rahman–Smith transformation :
The Strange-Rahman-Smith equation transforms the quantity of liquid measured at any particular temperature to an incremental pore-volume as a function of pore-size.
References
- J. B. W. Webber, P. Demin, Credit-card sized field and benchtop nmr relaxometers using field programmable gate arrays, Magnetic Resonance Imaging 56 (2019) 45–51. Available online: http://www.sciencedirect.com/science/article/pii/S0730725X18303102. [CrossRef]
- J. B. W. Webber, P. Demin, Digitally based precision time-domain spectrometer for nmr relaxation and nmr cryoporometry, Micro 3 (2) (2023) 404–433. Available online: https://www.mdpi.com/2673-8023/3/2/28. [CrossRef]
- G. Redfield, Nuclear magnetic resonance saturation and rotary saturation in solids, Phys. Rev. 98 (1955) 1787–1809. [CrossRef]
- J. C. Cobas, F. J. Sardina, Nuclear magnetic resonance data processing. mestre-c: A software package, Concepts in Magnetic Resonance Part A 19A (2) (2003) 80–96. Available online: https://resources.mestrelab.com/nuclear-magnetic-resonance-data-processing-mestre-c-a-software-package-for-desktop-computers/. [CrossRef]
- R. Pitaya, Stemlab 125-14 (2013). Available online: https://redpitaya.com/stemlab-125-14/.
- K. Iverson, A Programming Language, Wiley, New York, 1962.
- R. Nabavi, Microapl : Aplx, micoApl’s AplX interpreter. (2001-2007). Available online: http://www.microapl.co.uk/APL/.
- R. Pitaya, Sdrlab 122-16 (2020). Available online: https://redpitaya.com/sdrlab-122-16/.
- Grant: EPSRC, EP/d052556/1 : Capillary controls on gas hydrate growth and dissociation, Tech. rep. (2006-2009). Available online: https://gtr.ukri.org/project/8129FC4B-D0BB-40B6-9810-CFF01EA935FC.
- H. Raich, P. Blu¨ mler, Design and construction of a dipolar halbach array with a homogeneous field from identical bar magnets: NMR Mandhalas, Concepts in Magnetic Resonance Part B: Magnetic Resonance Engineering 23B (1) (2004) 16–25. [CrossRef]
- P. Blu¨mler, H. Soltner, Practical concepts for design, construction and application of halbach magnets in magnetic resonance, Applied Magnetic Resonance 54 (11-12) (2023) 1701–1739. [CrossRef]
- F. Reif, Fundamentals of Statistical and Thermal Physics, international student Edition, McGraw-Hill Kogakusha, Ltd., Tokyo, London, 1965.
- J. B. W. Webber, P. Corbett, K. T. Semple, U. Ogbonnaya, W. S. Teel, C. A. Masiello, Q. J. Fisher, J. J. Valenza-II, Y.-Q. Song, Q. Hu, An nmr study of porous rock and biochar containing organic material., Microporous and Mesoporous Materials 178 (2013) 94–98, proceedings of the 11th International Bologna Conference on Magnetic Resonance in Porous Media (MRPM11), University of Surrey, 2012. [CrossRef]
- J.-P. Korb, Multiscale nuclear magnetic relaxation dispersion of complex liquids in bulk and confinement, Progress in Nuclear Magnetic Resonance Spectroscopy 104 (2018) 12–55. [CrossRef]
- J. Mitchell, J. Webber, J. Strange, Nuclear magnetic resonance cryoporometry, Physics Reports 461 (1) (2008) 1–36. [CrossRef]
- Dr. J. Beau. W. Webber, ORCID : 0000-0002-8967-4671 (2024). Available online: https://orcid.org/my-orcid?orcid=0000-0002-8967-4671.
- J. B. W. Webber, V. Livadaris, A. S. Andreev, USY zeolite mesoporosity probed by NMR cryoporometry, Microporous and Mesoporous Materials 306 (2020) 110404. [CrossRef]
- J. Webber, A. Welle, V. Livadaris, A. Andreev, Pushing the limits of nmr cryoporometry in polymers from nanometer to micron (12 2020). [CrossRef]
- Michael J. Workman, J. Beau W. Webber and Rangachary Mukundan et al, Analysis of PEMFC electrode pore structure – bridging the mesoscale gap, in: 236th Meeting of the Electrochemical Society October 16, 2019 Atlanta, GA, Atlanta, GA, 2019. Available online: https://permalink.lanl.gov/obj.
- P. A. Bland, M. D. Jackson, R. F. Coker, B. A. Cohen, J. B. W. Webber, M. R. Lee, C. M. Duffy, R. J. Chater, M. G. Ardakani, D. S. McPhail, D. W. Mc-Comb, G. K. Benedix, Why aqueous alteration in asteroids was isochemical: High porosity does not equal high permeability, Earth and Planetary Science Letters 287 (2009) 559–568. [CrossRef]
- H. C. Eisenman, J. D. Nosanchuk, J. B. W. Webber, R. J. Emerson, T. A. Camesano, A. Casadevall, Microstructure of cell wall-associated melanin in the human pathogenic fungus cryptococcus neoformans, Biochemistry 44 (2005) 3683–3693. [CrossRef]
- M. Alam, C. Okonkwo, J. Cachaneski-Lopes, C. Graeff, A. Batagin-Neto, S. Tariq, S. Varghese, M. O’connor, A. Albadri, J. Webber, M. Tarique, M. Ayyash, A. Kamal-Eldin, Date fruit melanin is primarily based on (-)-epicatechin proanthocyanidin oligomers, Scientific Reports 14 (1) (2 2024). [CrossRef]
Figure 1.
The Lab-Tools MK4 compact high-performance NMR time-domain NMR Spectrometer.
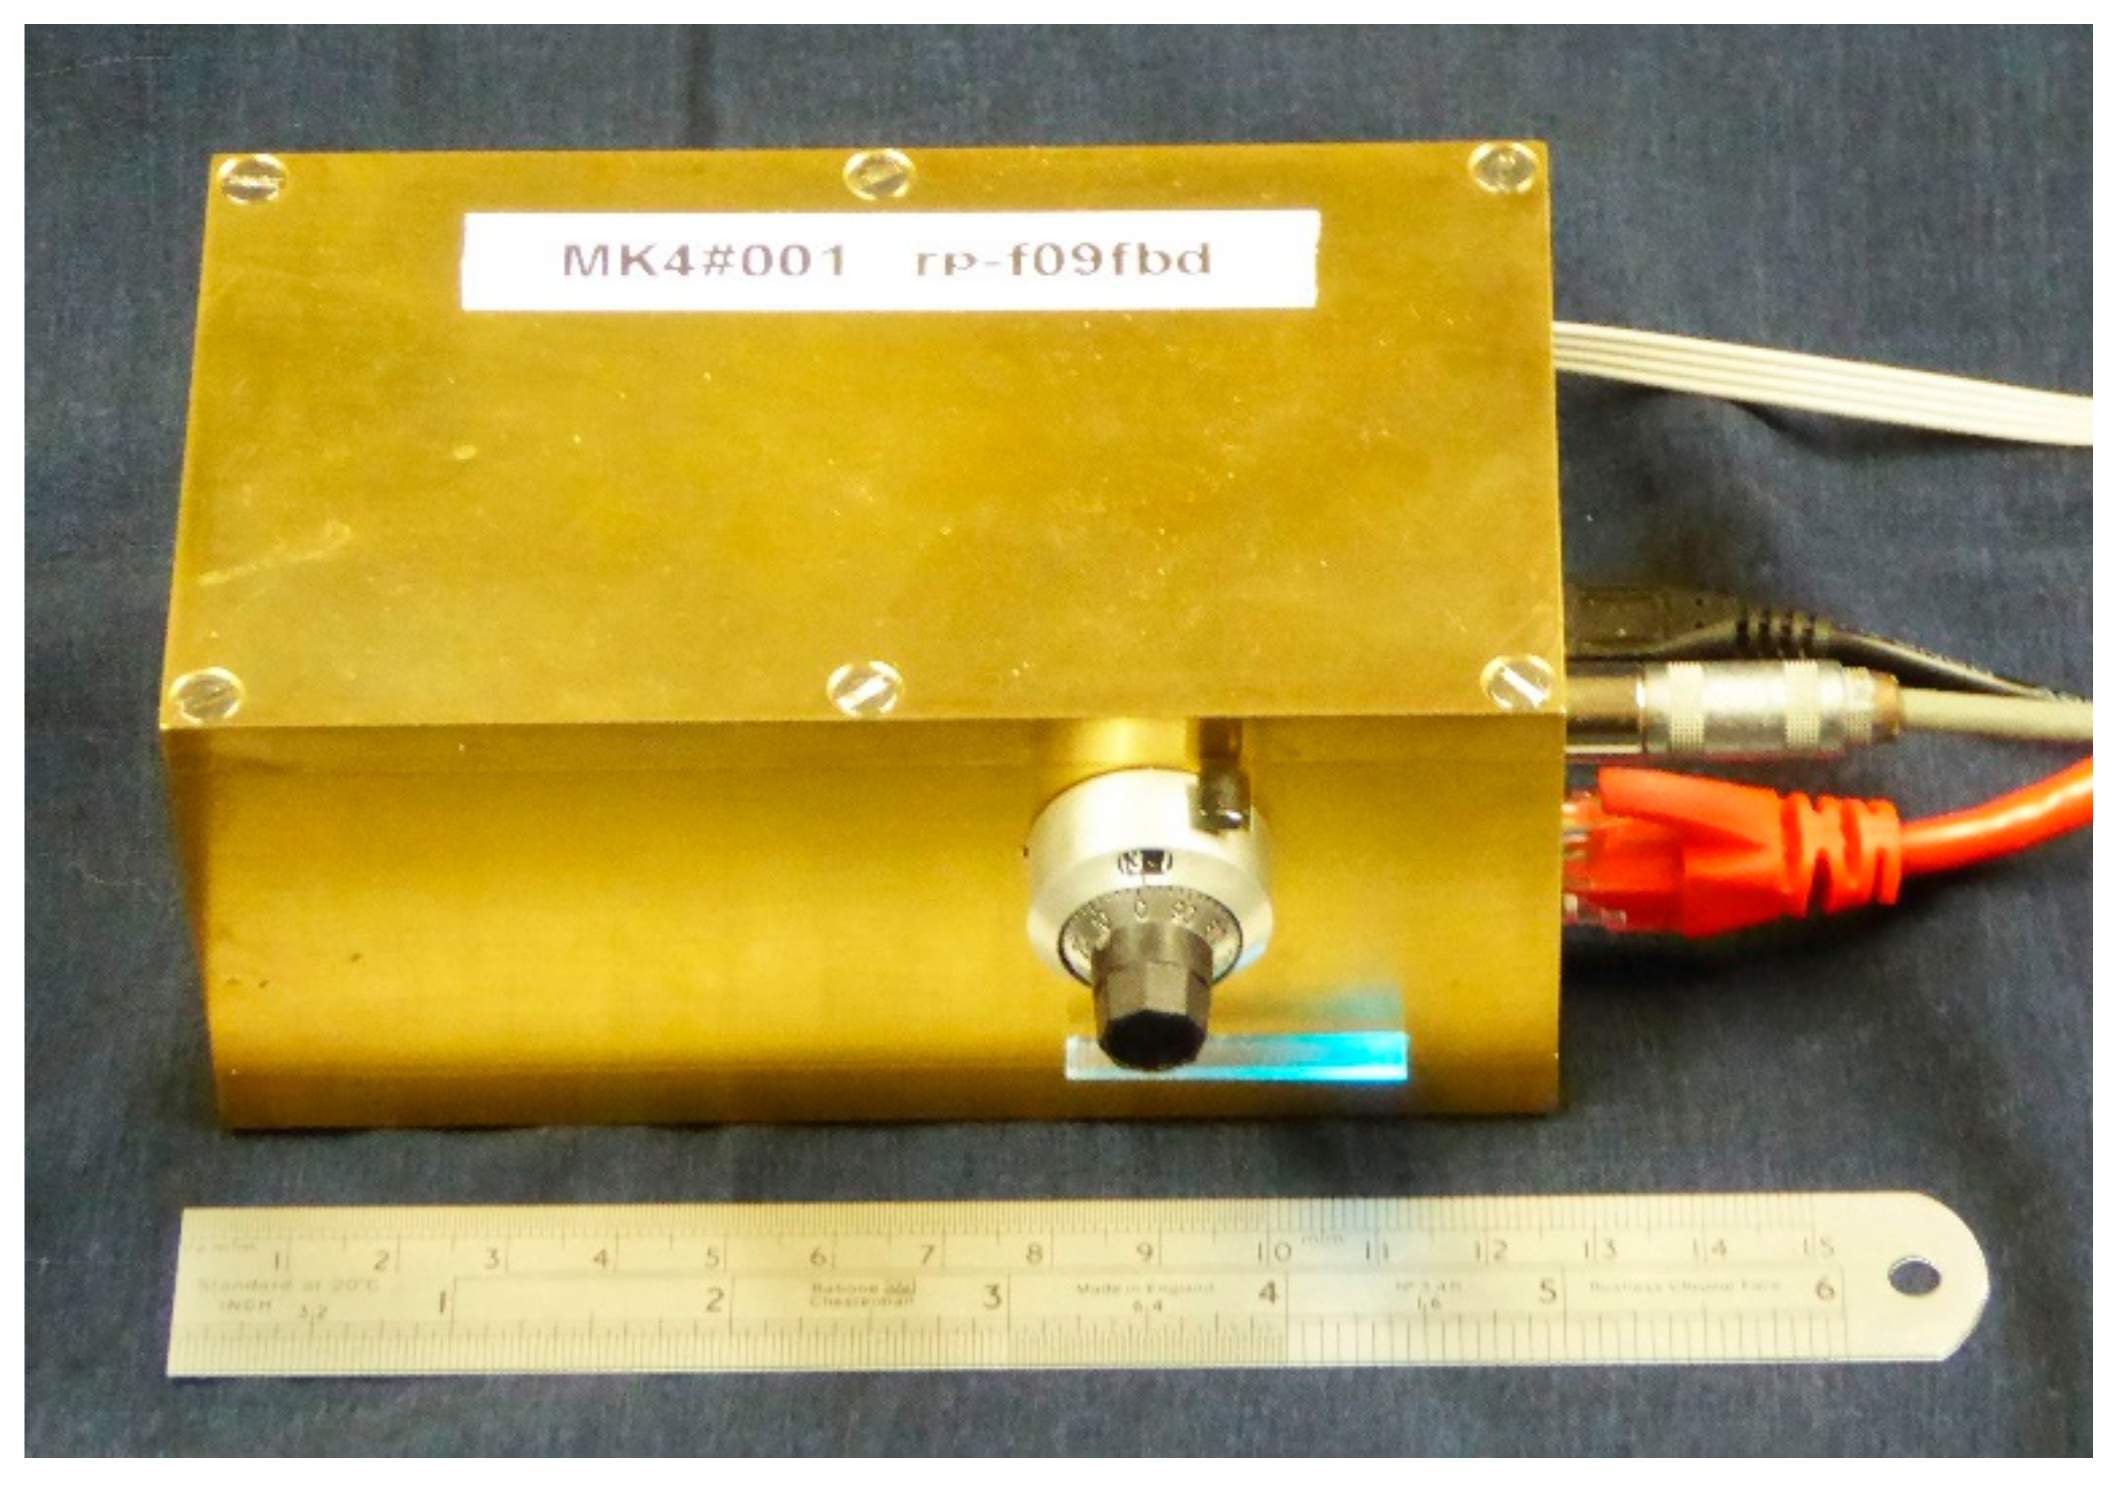
Figure 2.
A typical Graphical User Interface front-panel for a CPMG NMR pulse sequence. It now includes the ability to connect to a range of different MK3, MK4 or MK5 NMR Spectrometers.
Figure 2.
A typical Graphical User Interface front-panel for a CPMG NMR pulse sequence. It now includes the ability to connect to a range of different MK3, MK4 or MK5 NMR Spectrometers.
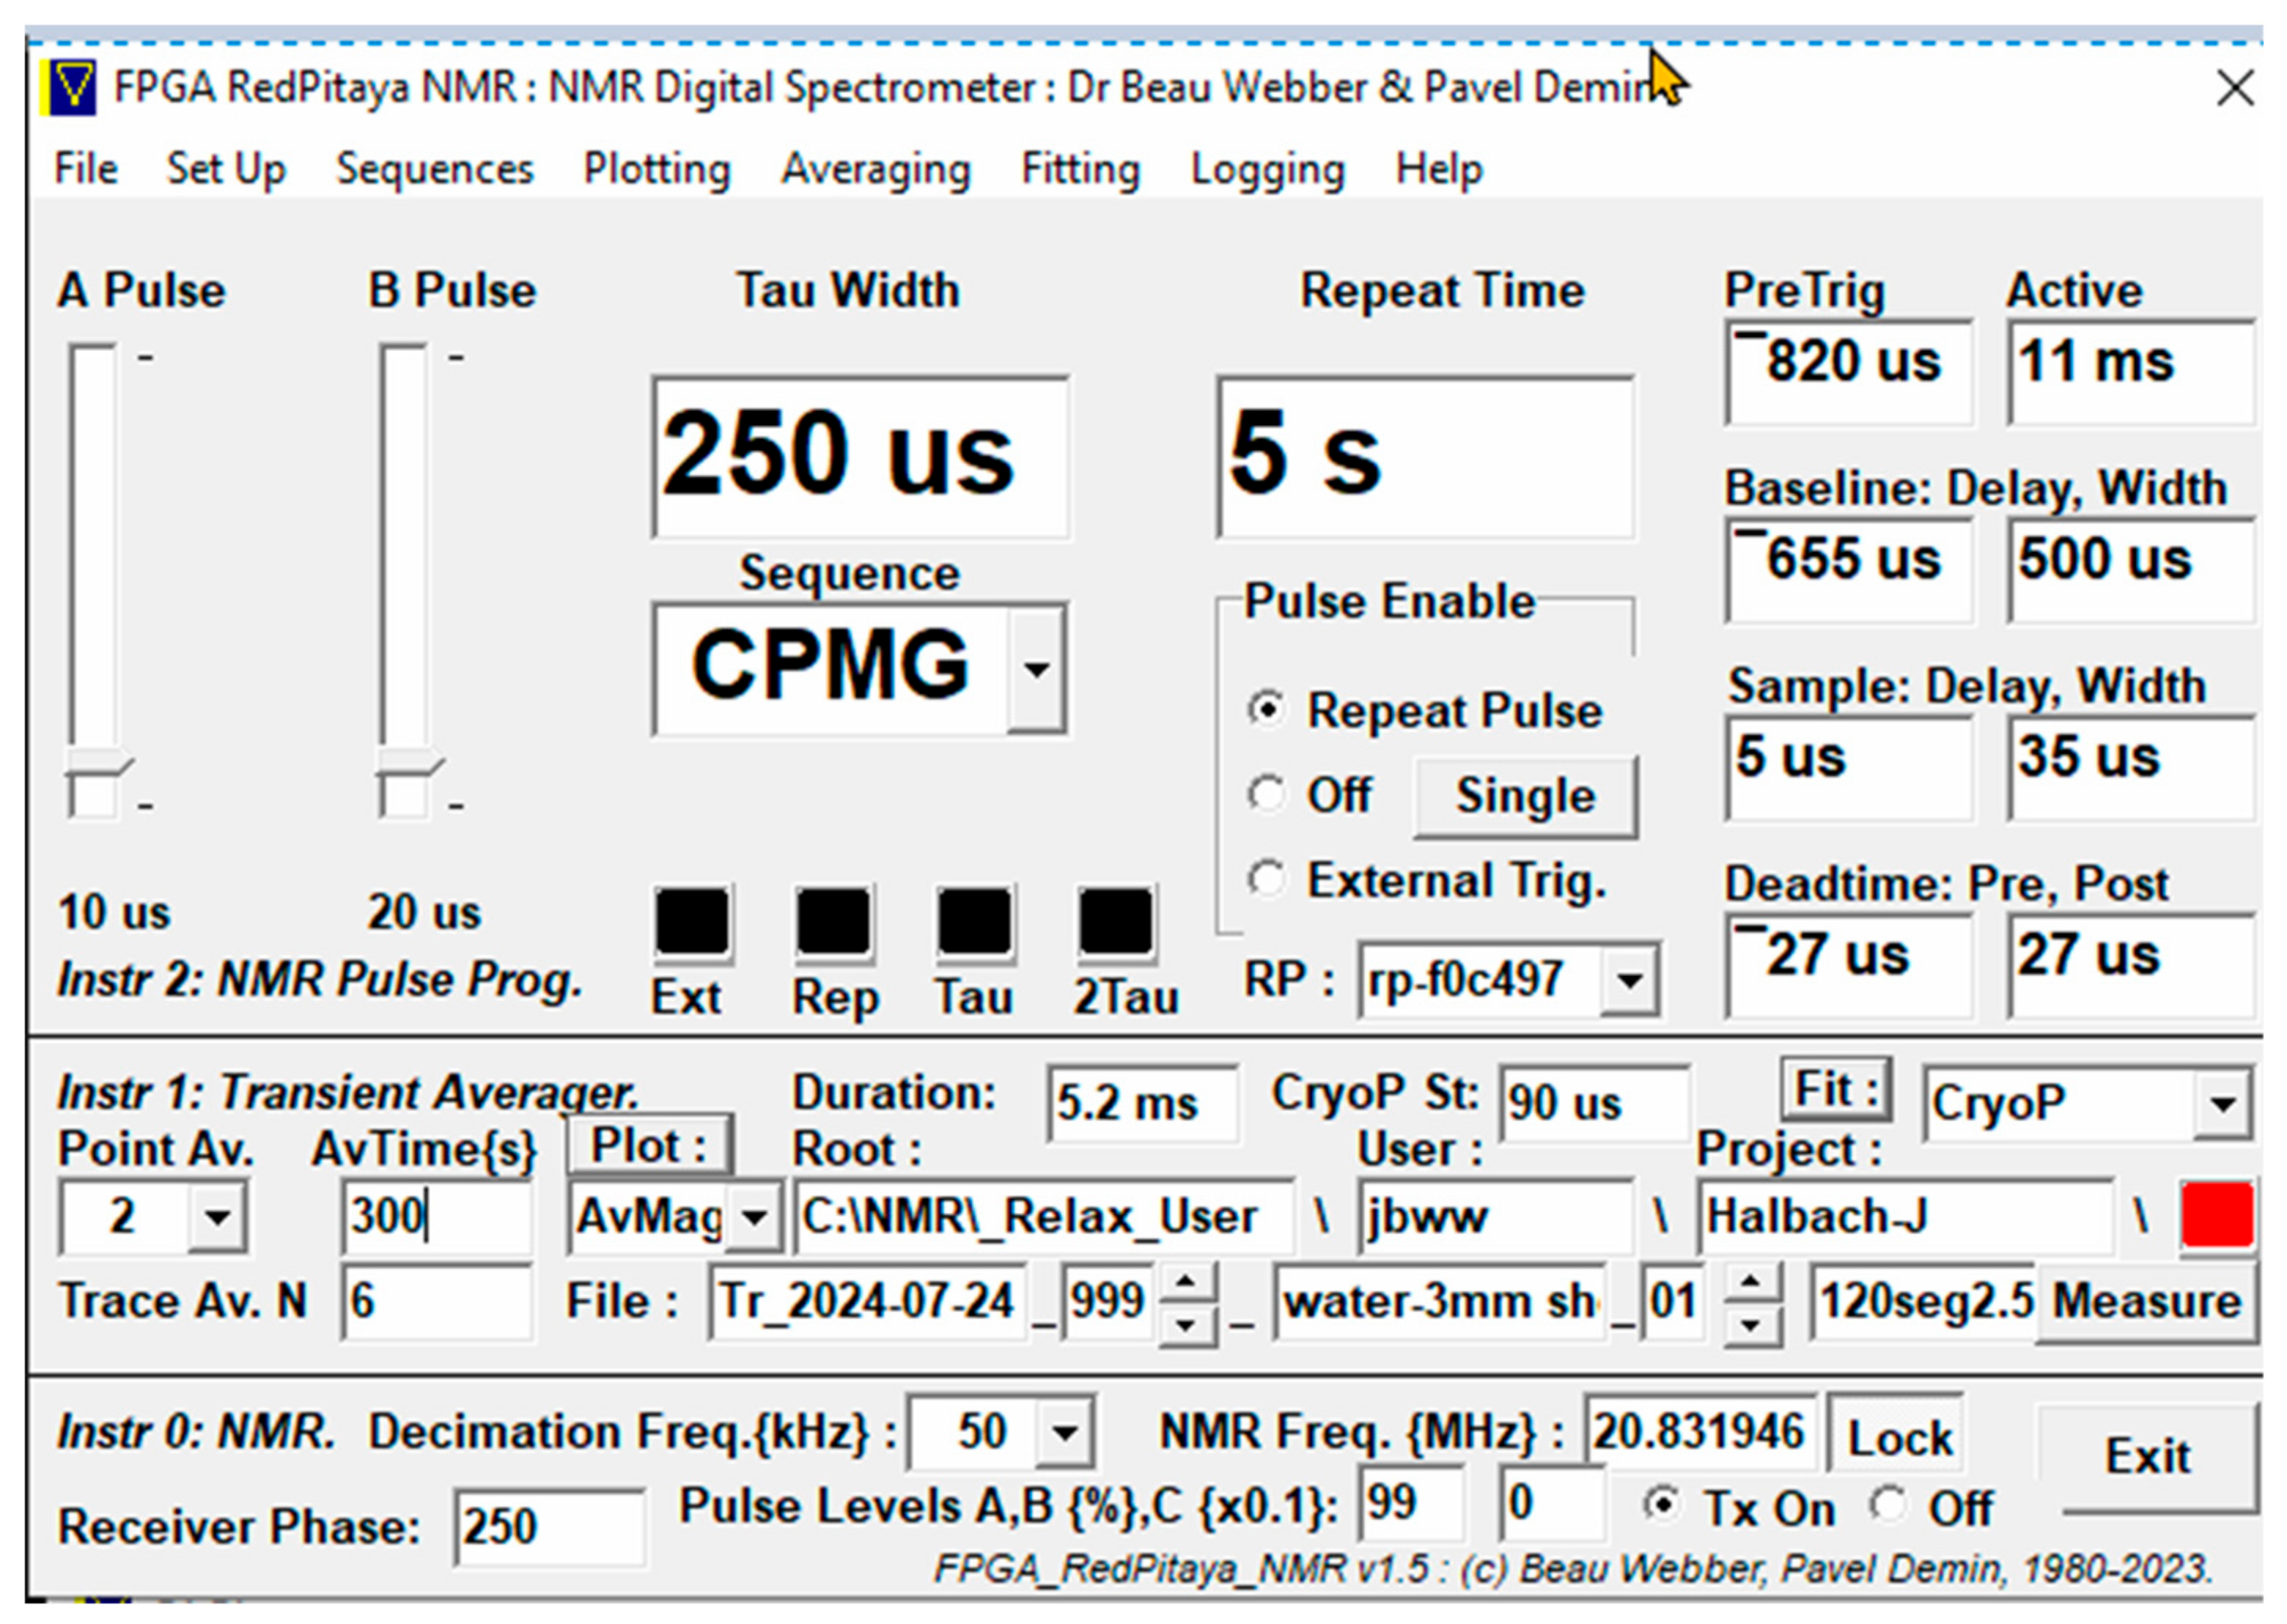
Figure 3.
Fast Fourier Transform of the first echo in a time-domain signal (The FID can alternatively be transformed.) It can be seen that the NMR magnet has slightly changed frequency since the spectrometer was tuned.
Figure 3.
Fast Fourier Transform of the first echo in a time-domain signal (The FID can alternatively be transformed.) It can be seen that the NMR magnet has slightly changed frequency since the spectrometer was tuned.
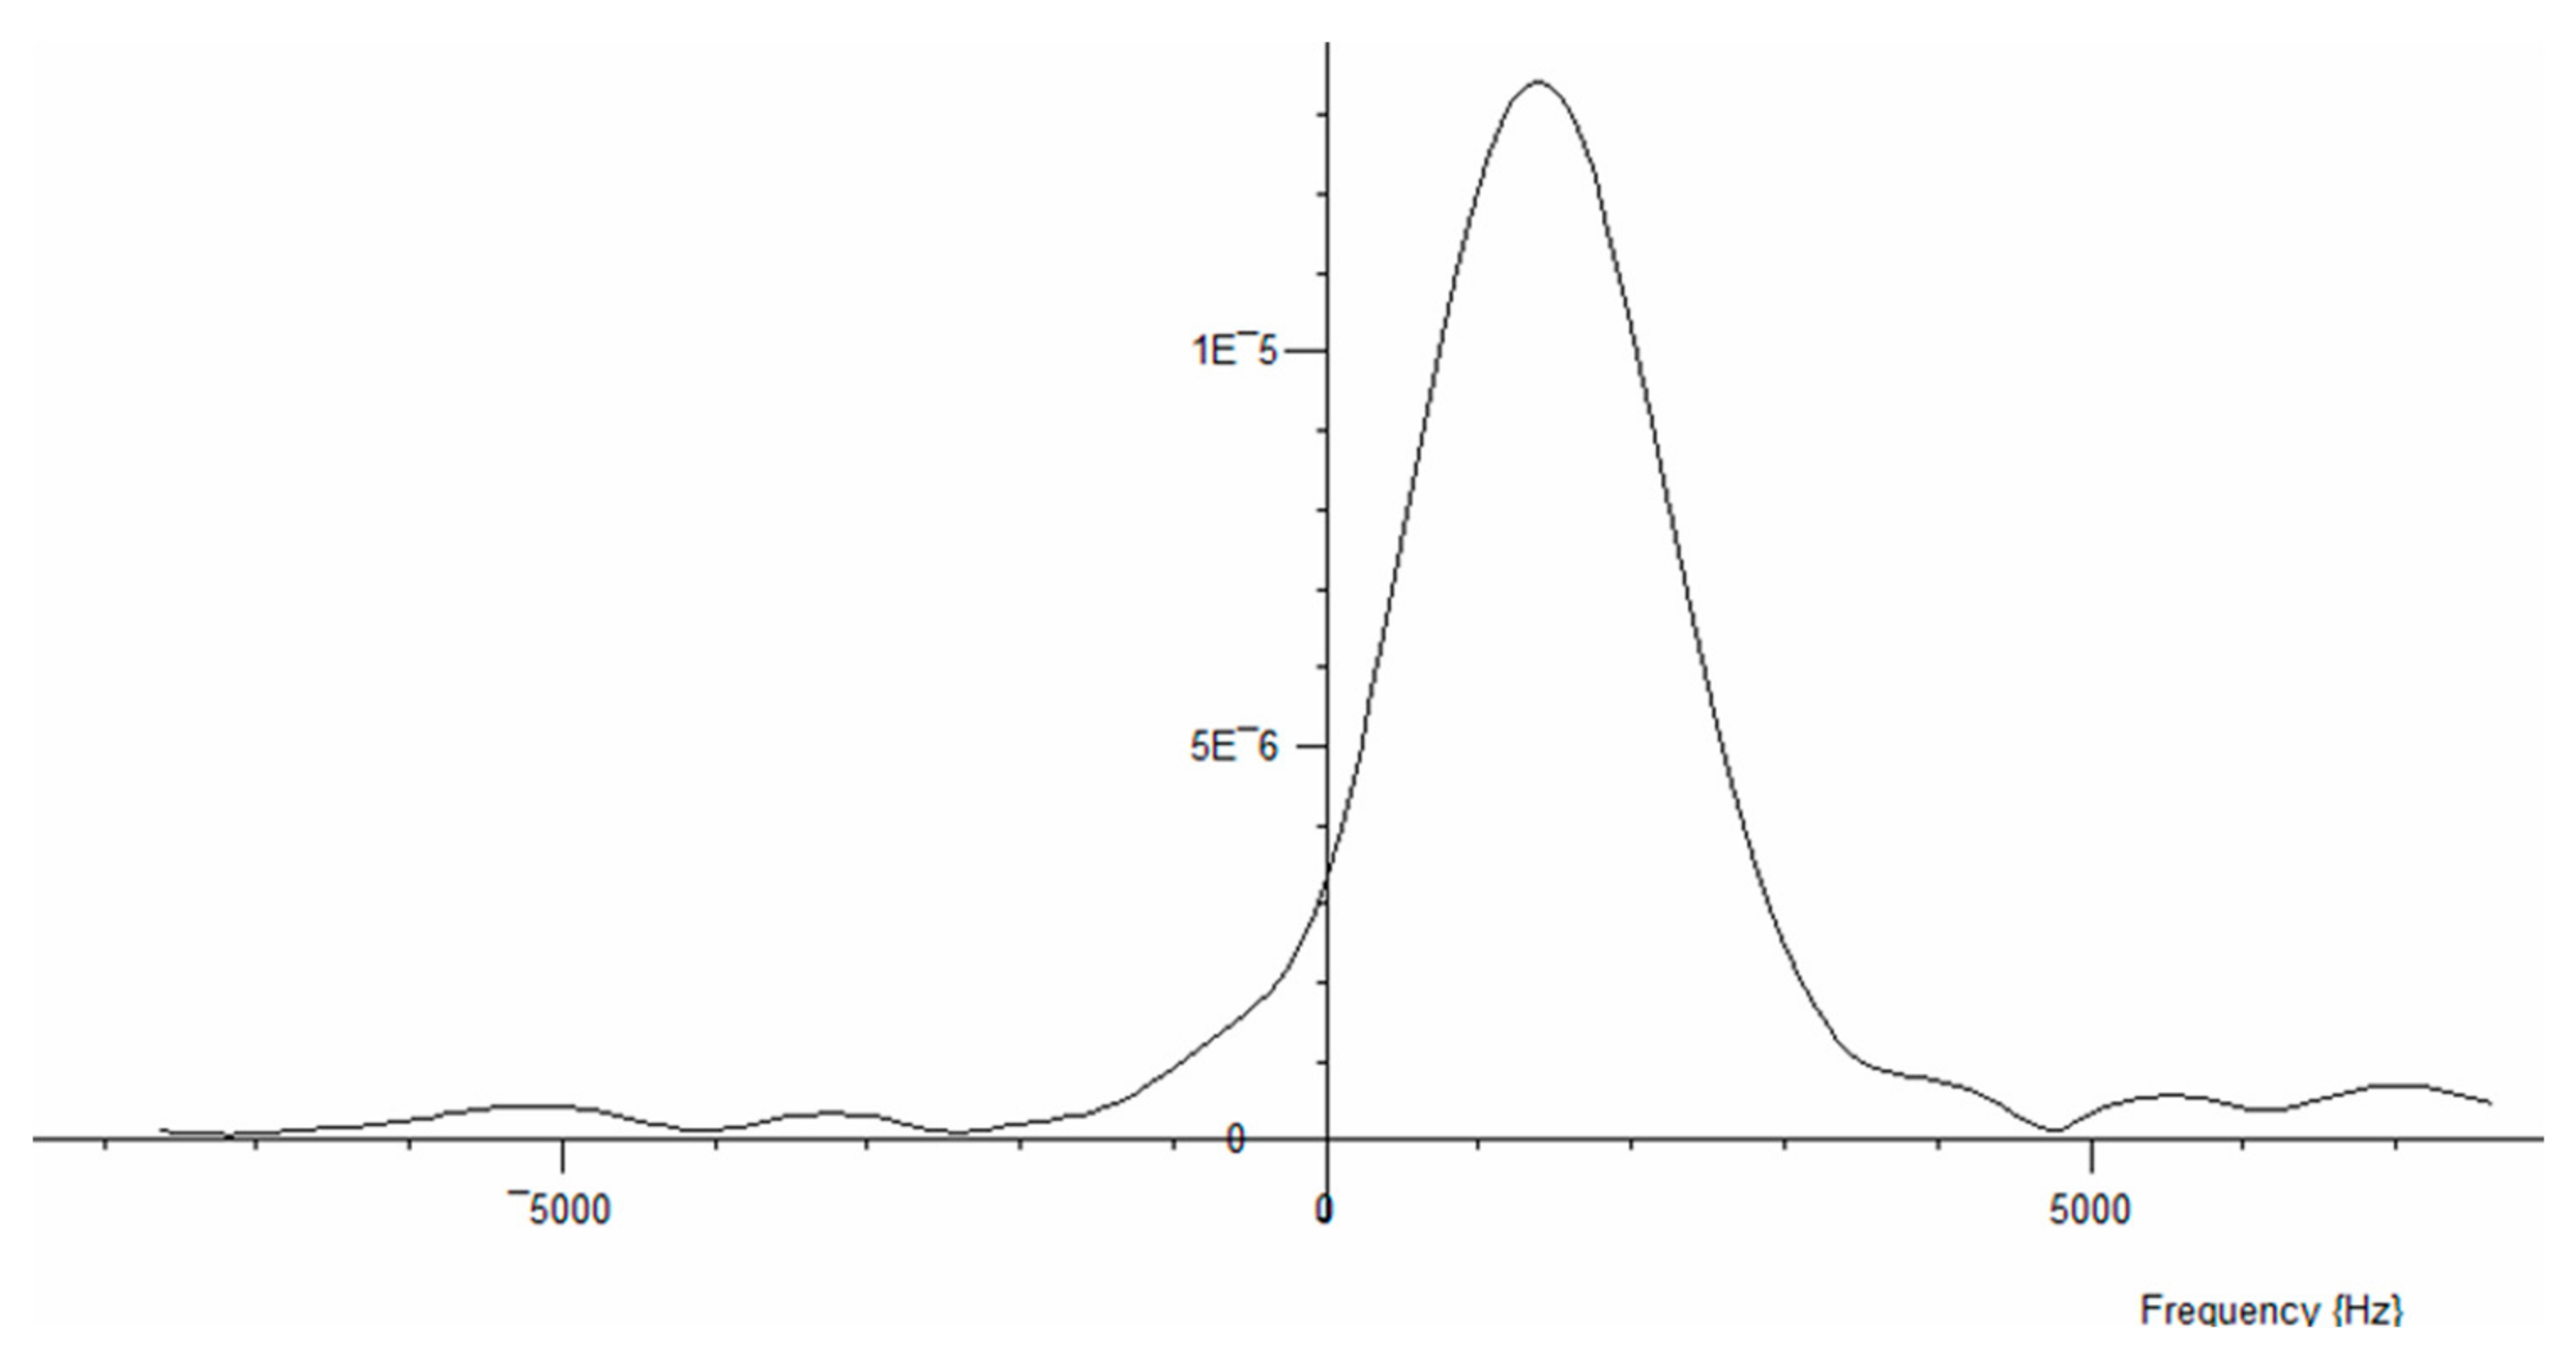
Figure 4.
An FID and Echo captured by a MK4 NMR Spectrometer, exported to and manipulated and displayed by commercial program MNova,.
Figure 4.
An FID and Echo captured by a MK4 NMR Spectrometer, exported to and manipulated and displayed by commercial program MNova,.
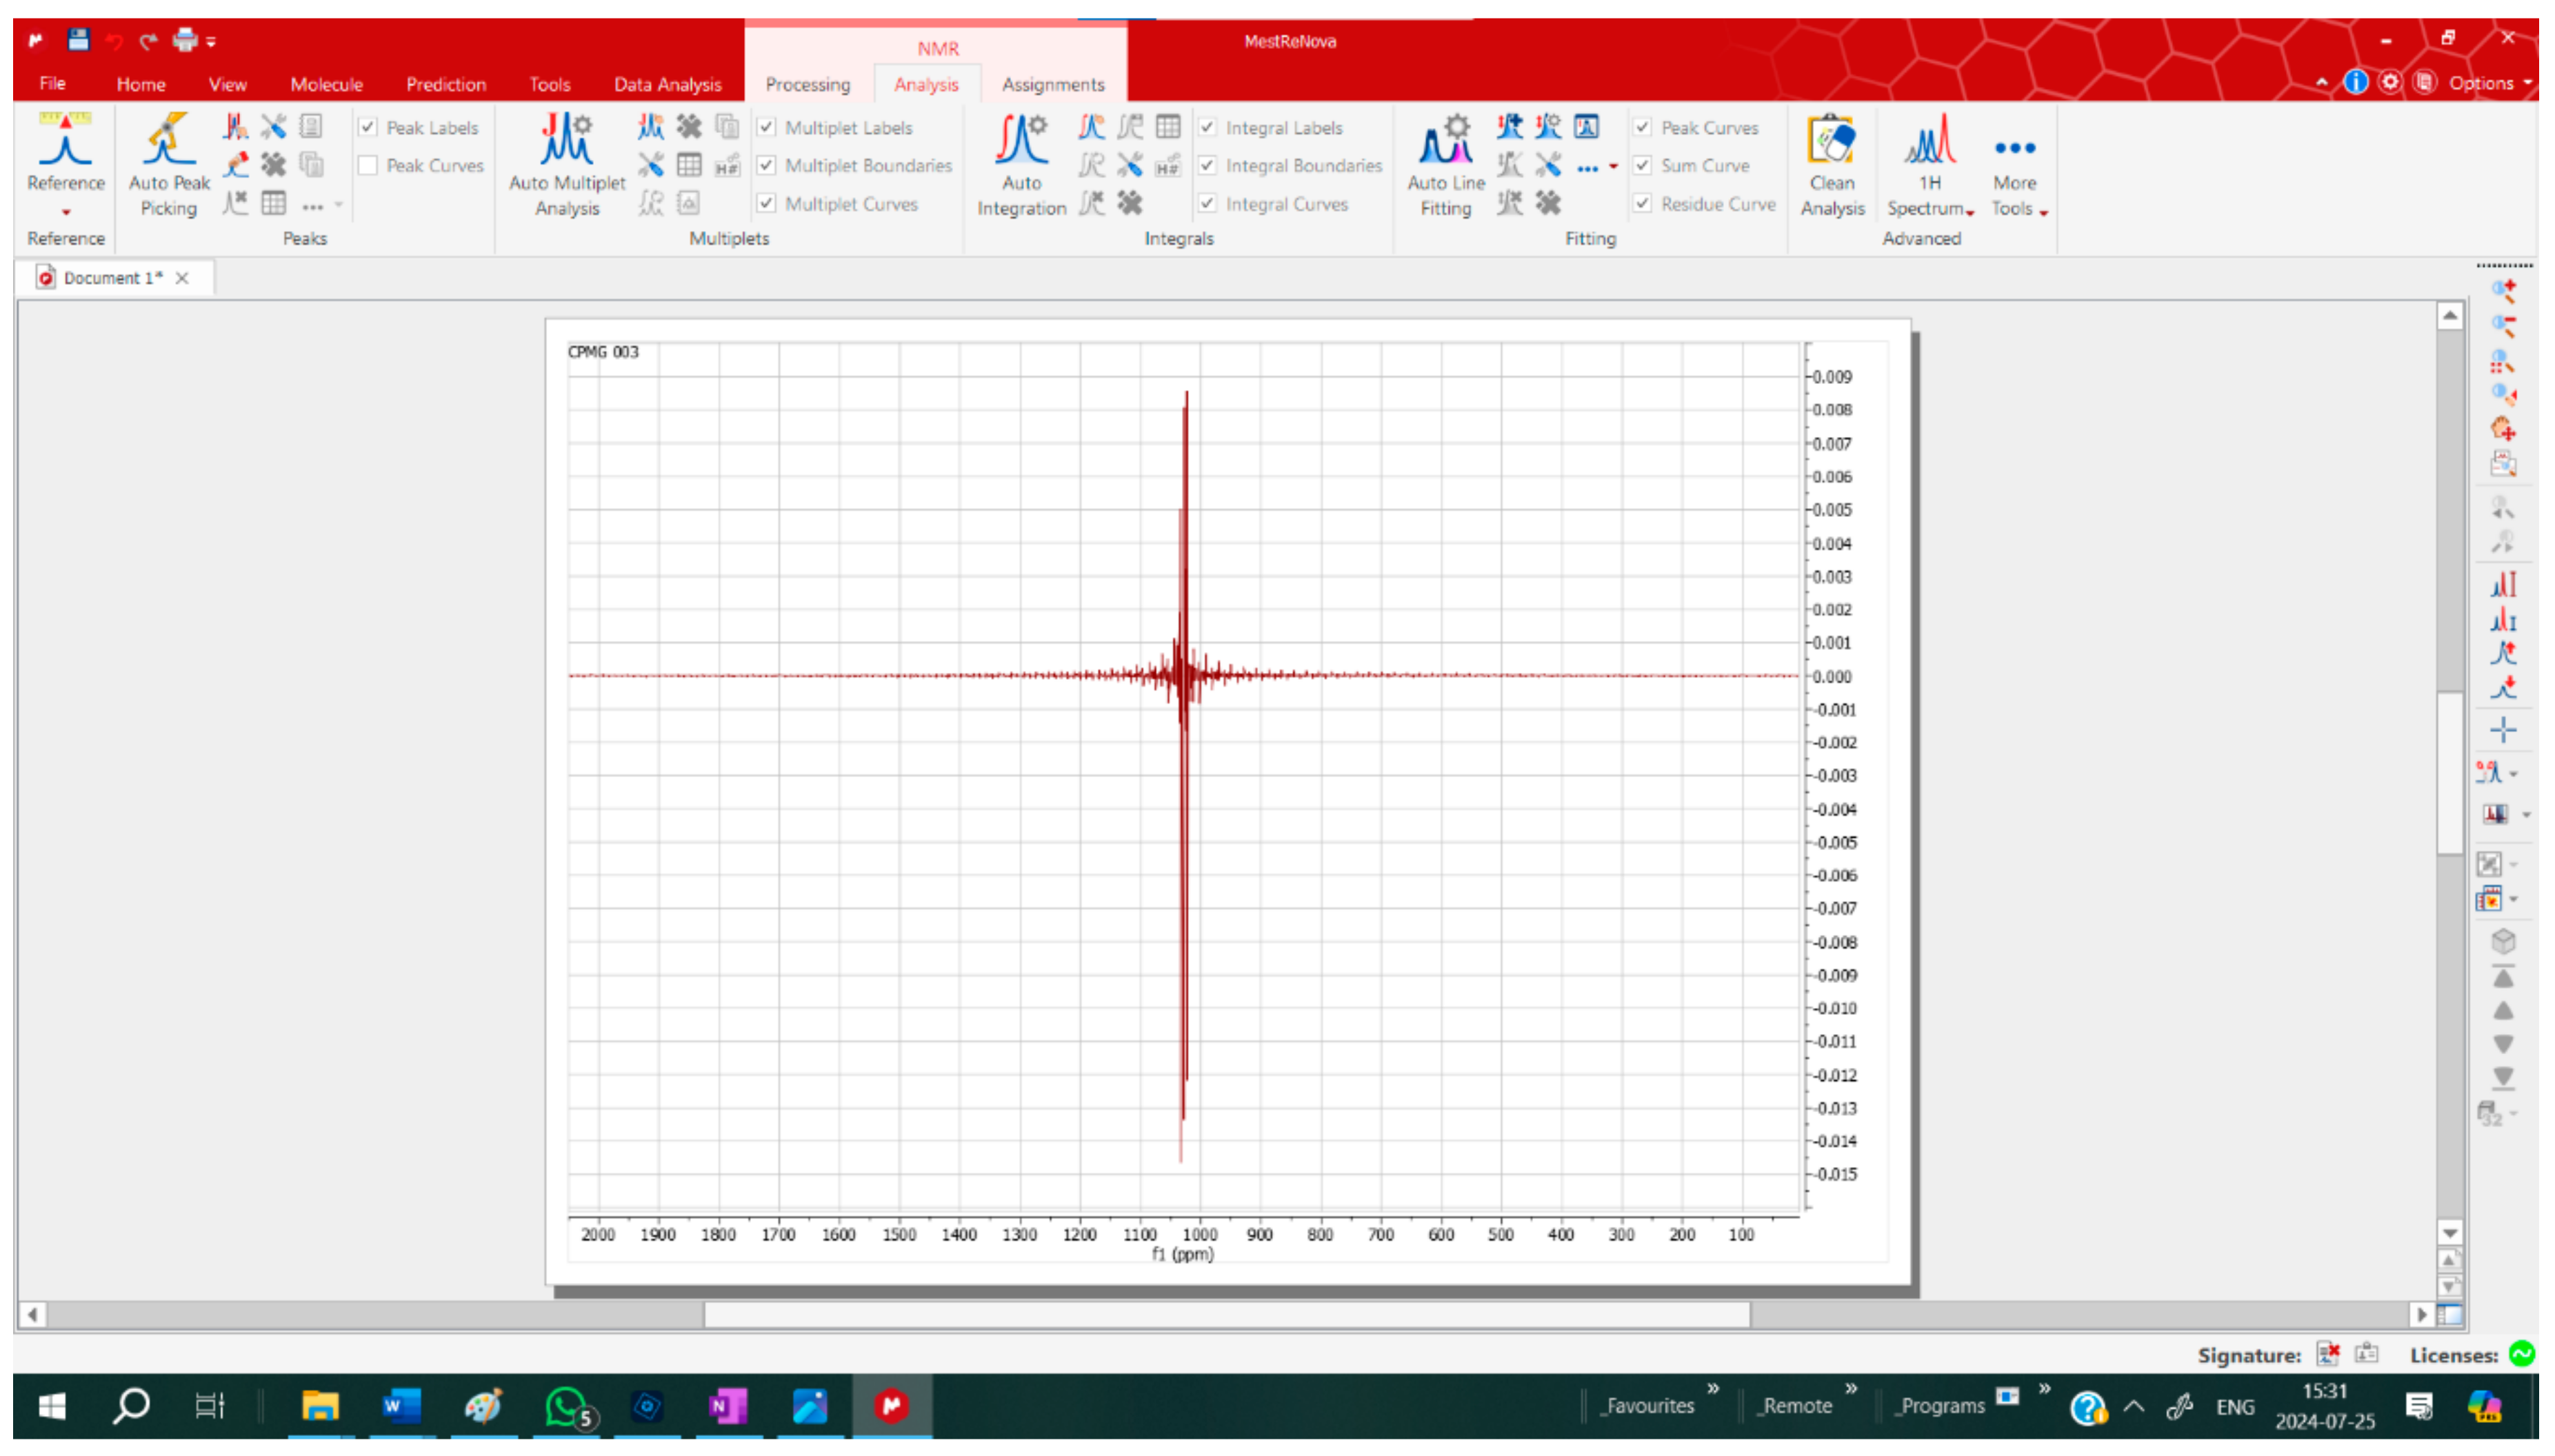
Figure 5.
With Gate set to 2 us : Orange trace : Pulse amplitude, Zero time set to middle of pulse. Red trace : Water signal, with 3 point filter . Pulse suppression but no recovery suppression. Green trace : No sample, with 3 point filter. Mauve trace : simulated deadtime (5us from middle of 90 pulse) plus recovery : Gaussian, T2 : 1.78us.
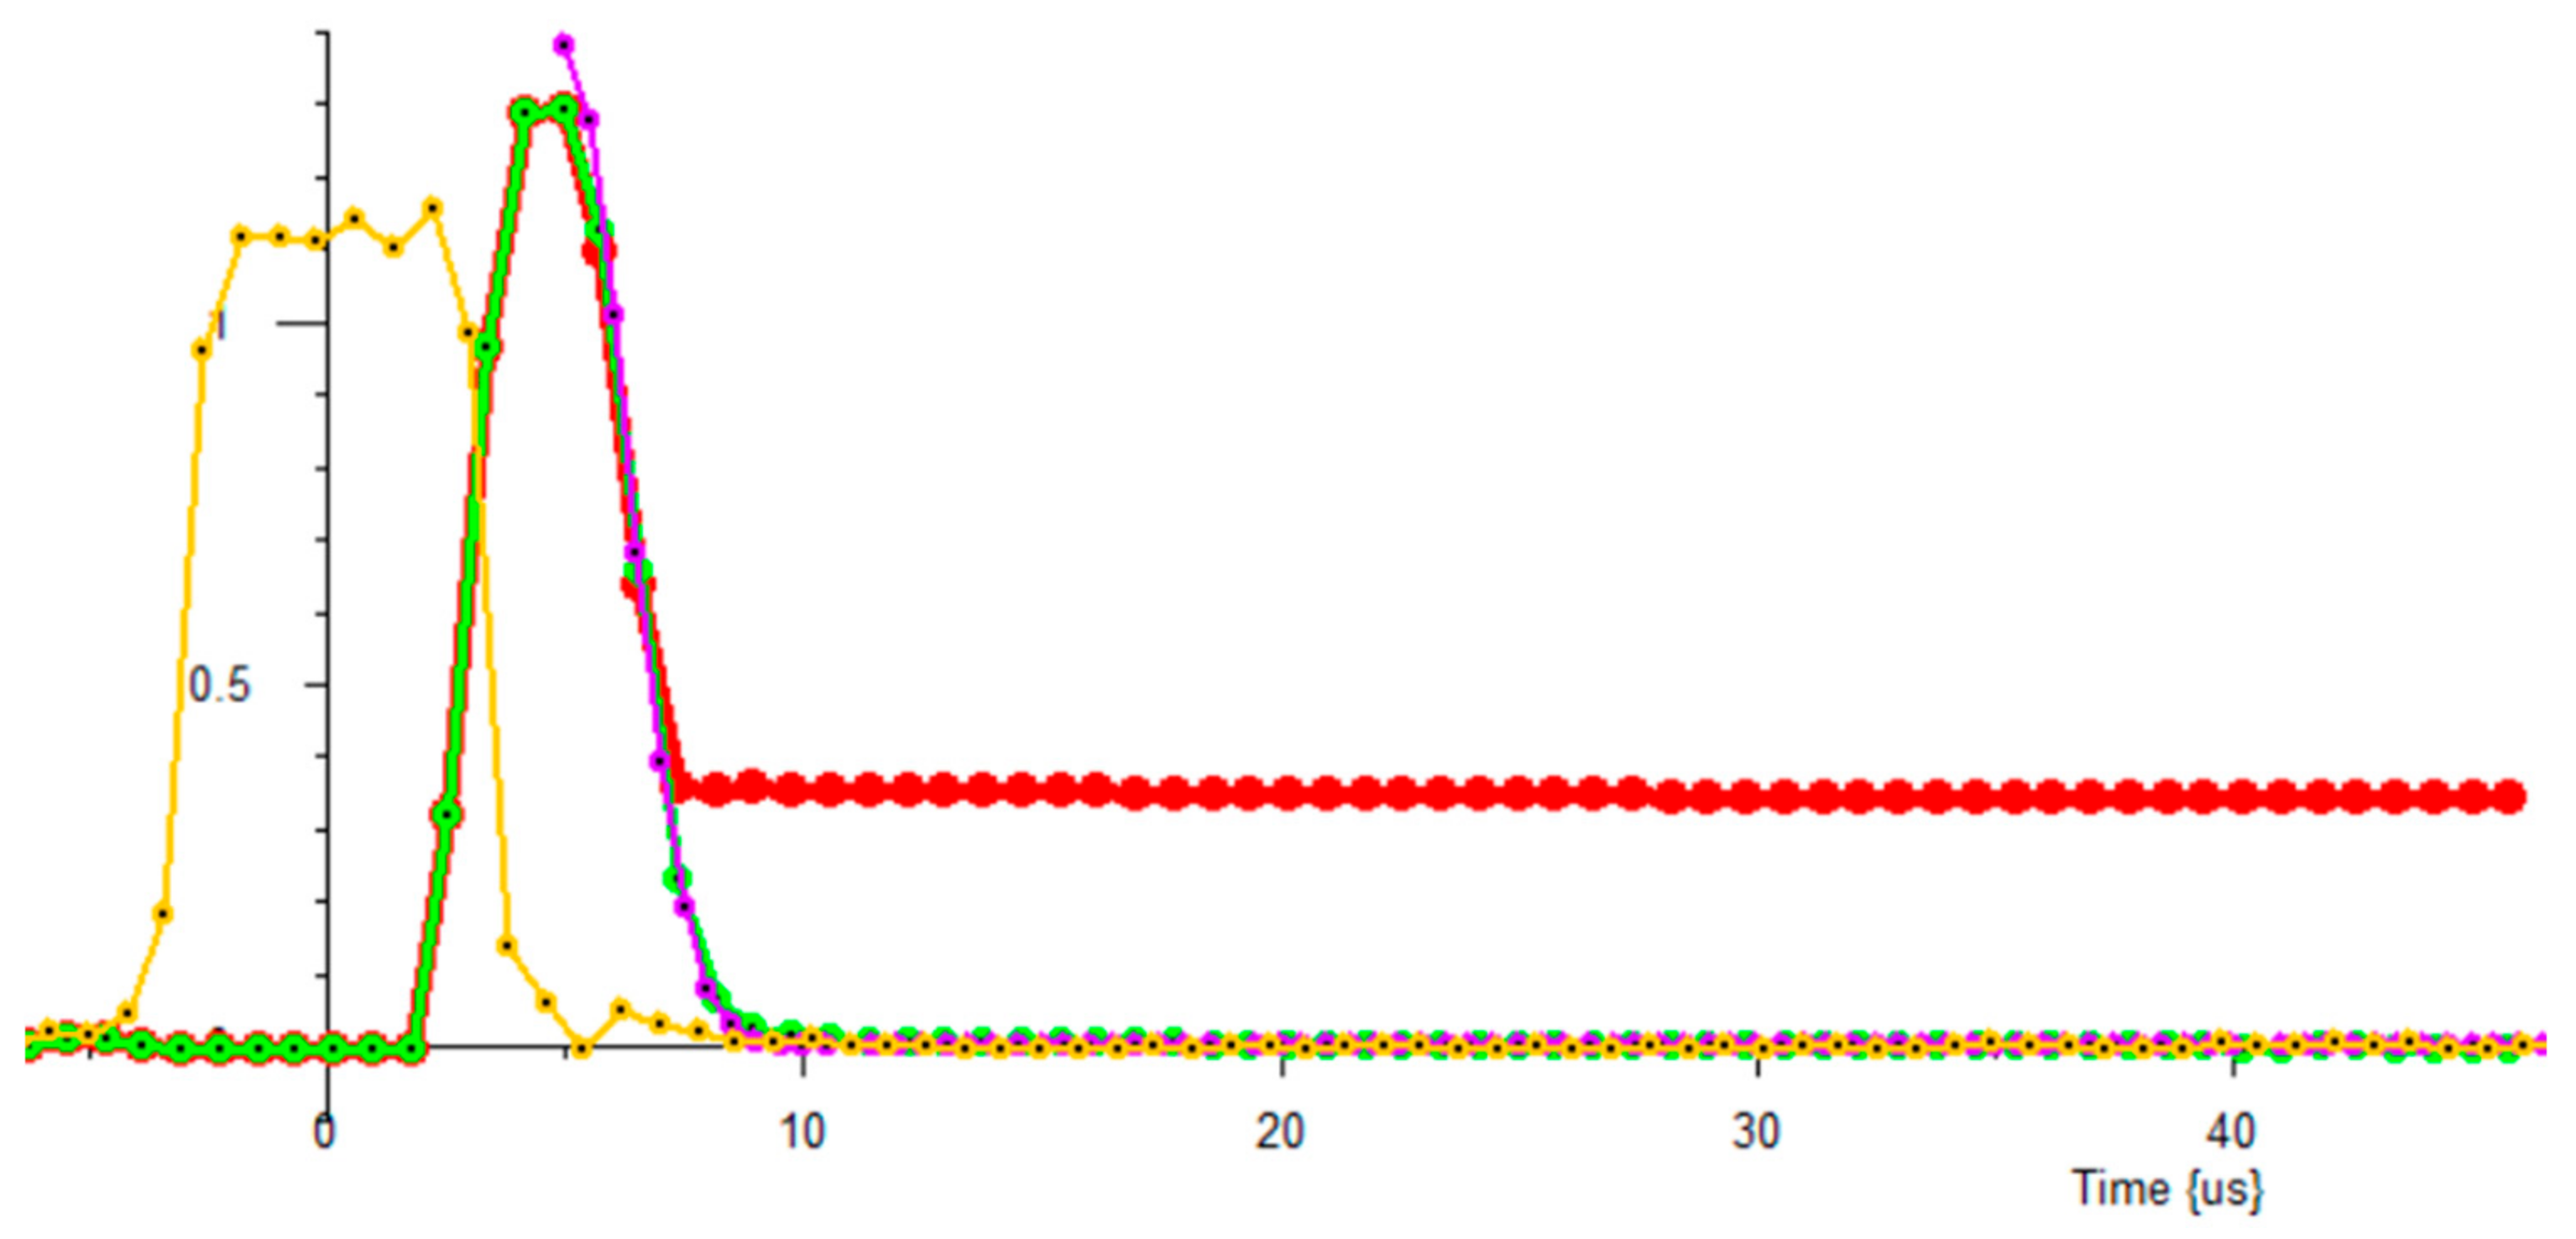
Figure 6.
A burst of 90 MHz RF; lower trace after the gain block following the band-pass filter, and then at the 50 Ohm input to the NMR linear amplifier; upper trace at the output of the low impedance NMR linear amplifier.
Figure 6.
A burst of 90 MHz RF; lower trace after the gain block following the band-pass filter, and then at the 50 Ohm input to the NMR linear amplifier; upper trace at the output of the low impedance NMR linear amplifier.
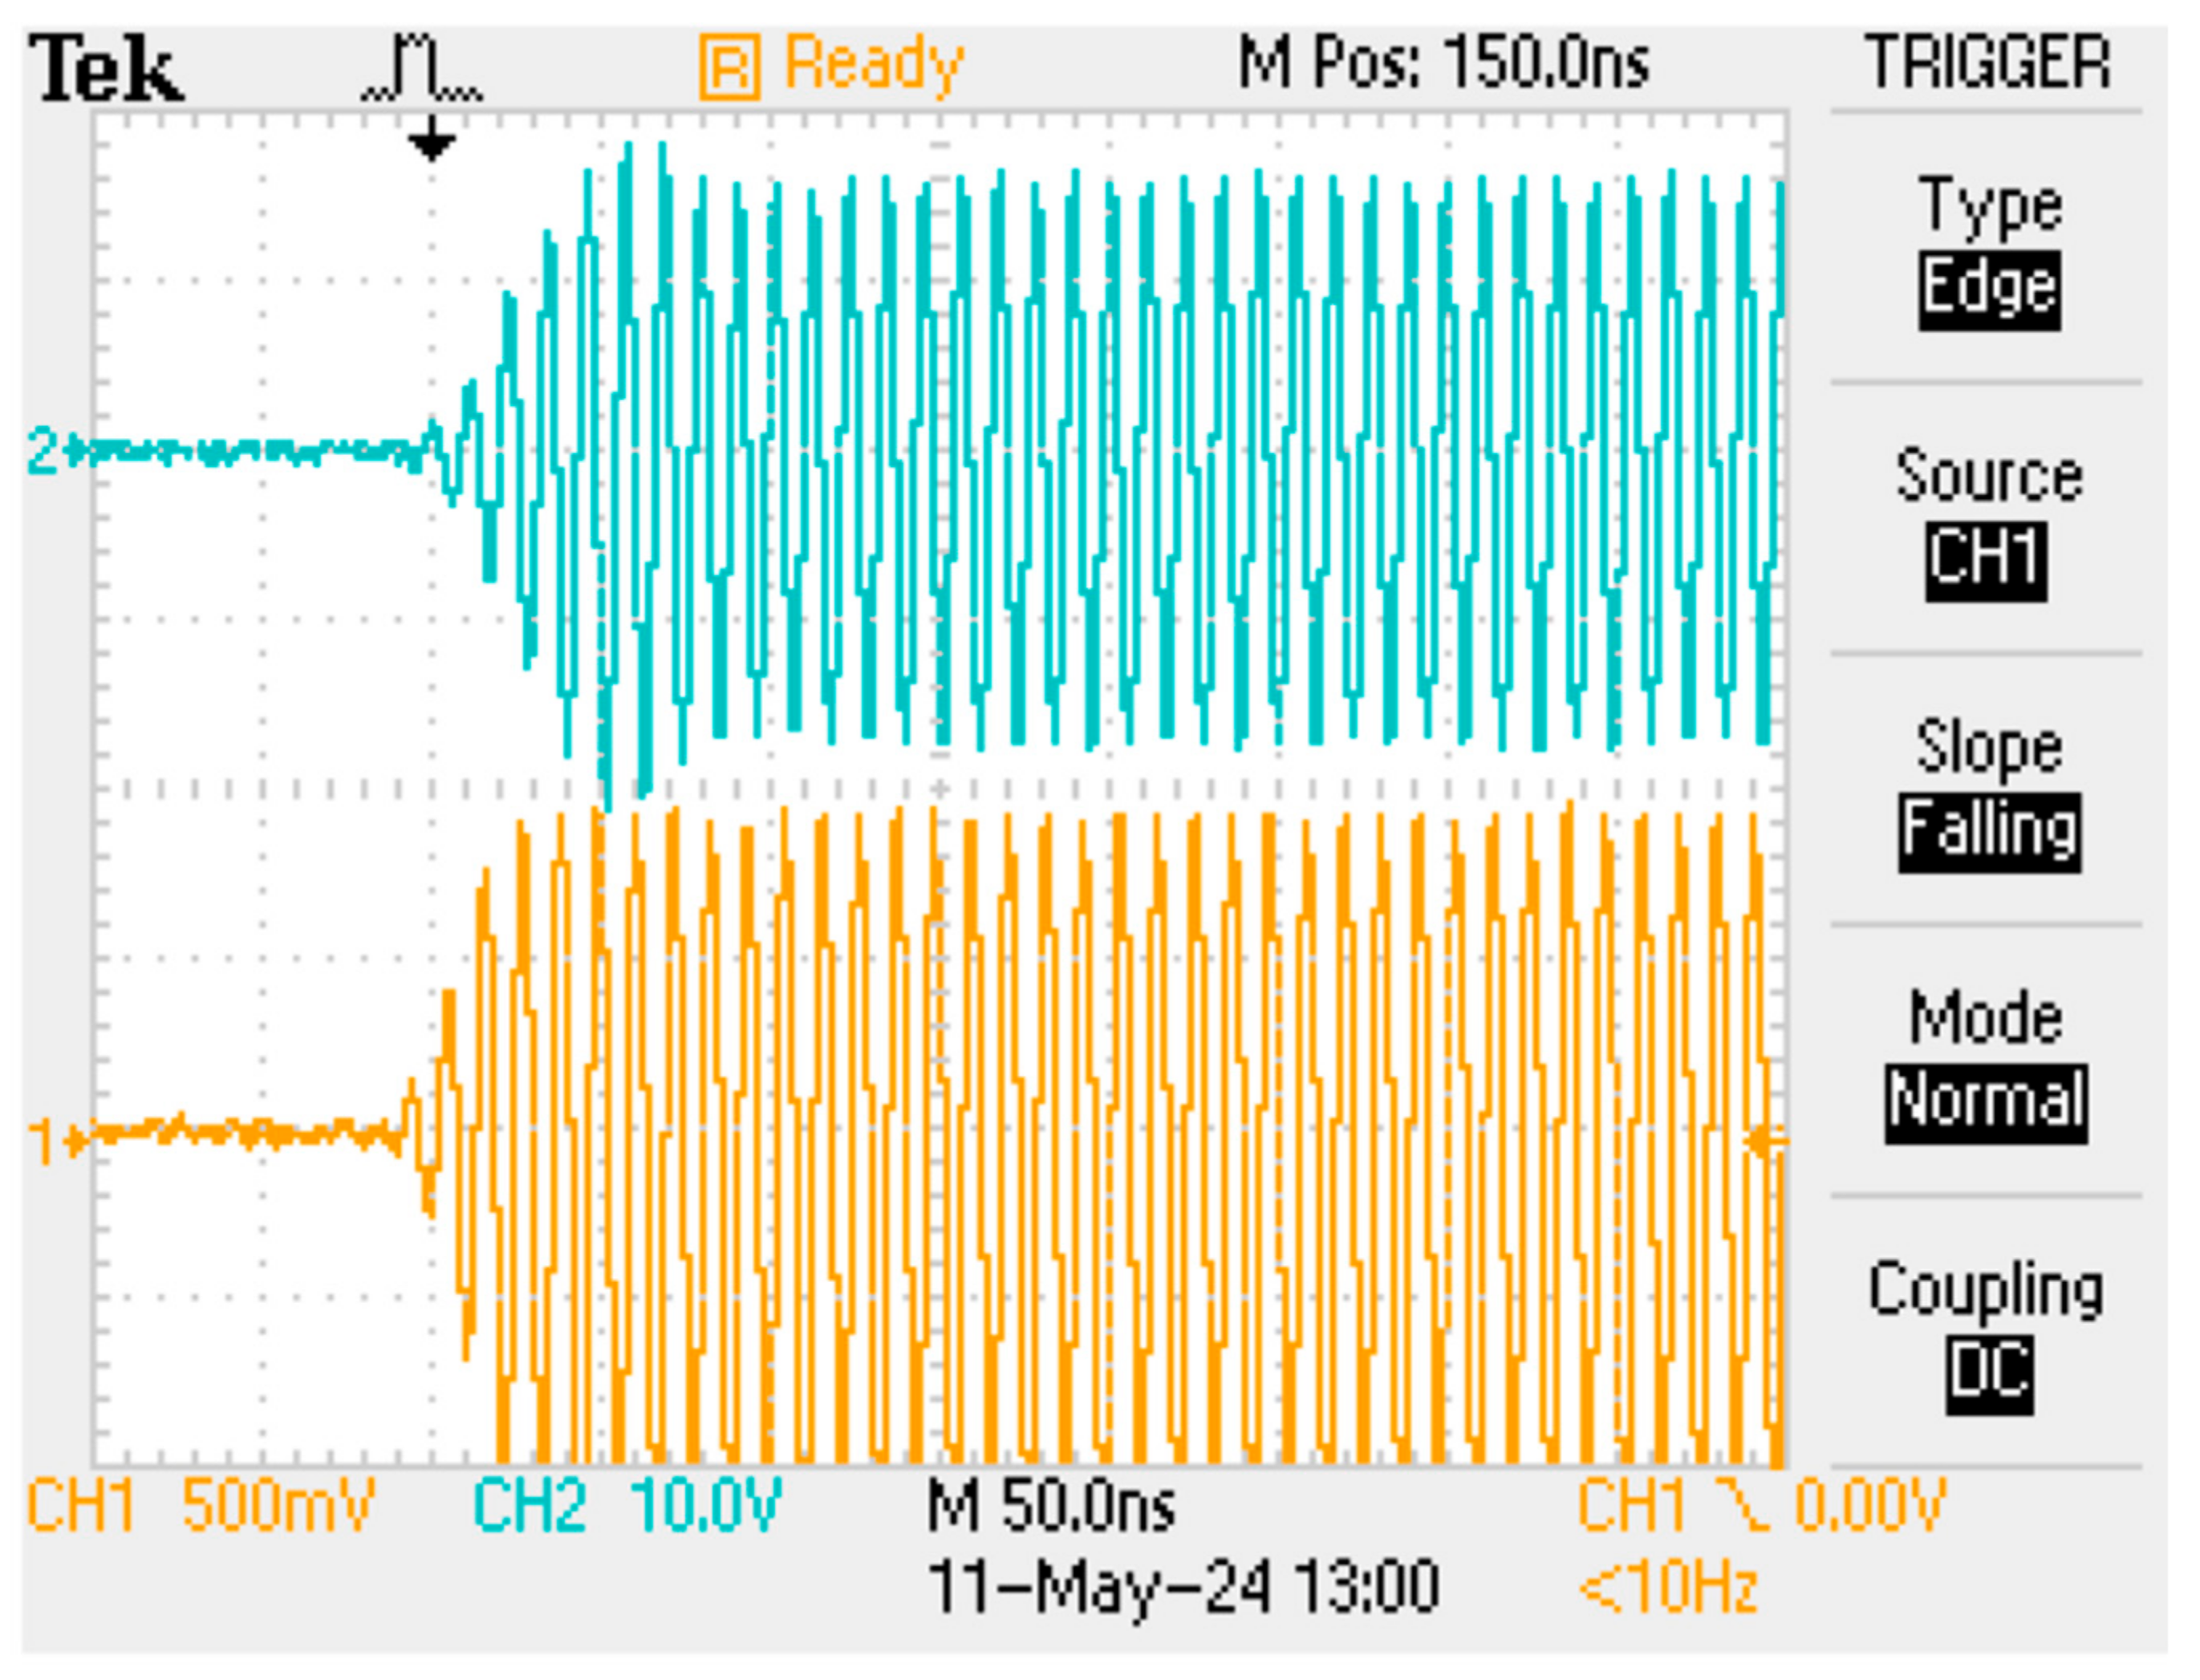
Figure 7.
CryoP7 Peltier cooled variable-temperature probe with a MK4 NMR Spectrometer, and a Halbach J1 NMR Magnet.
Figure 7.
CryoP7 Peltier cooled variable-temperature probe with a MK4 NMR Spectrometer, and a Halbach J1 NMR Magnet.
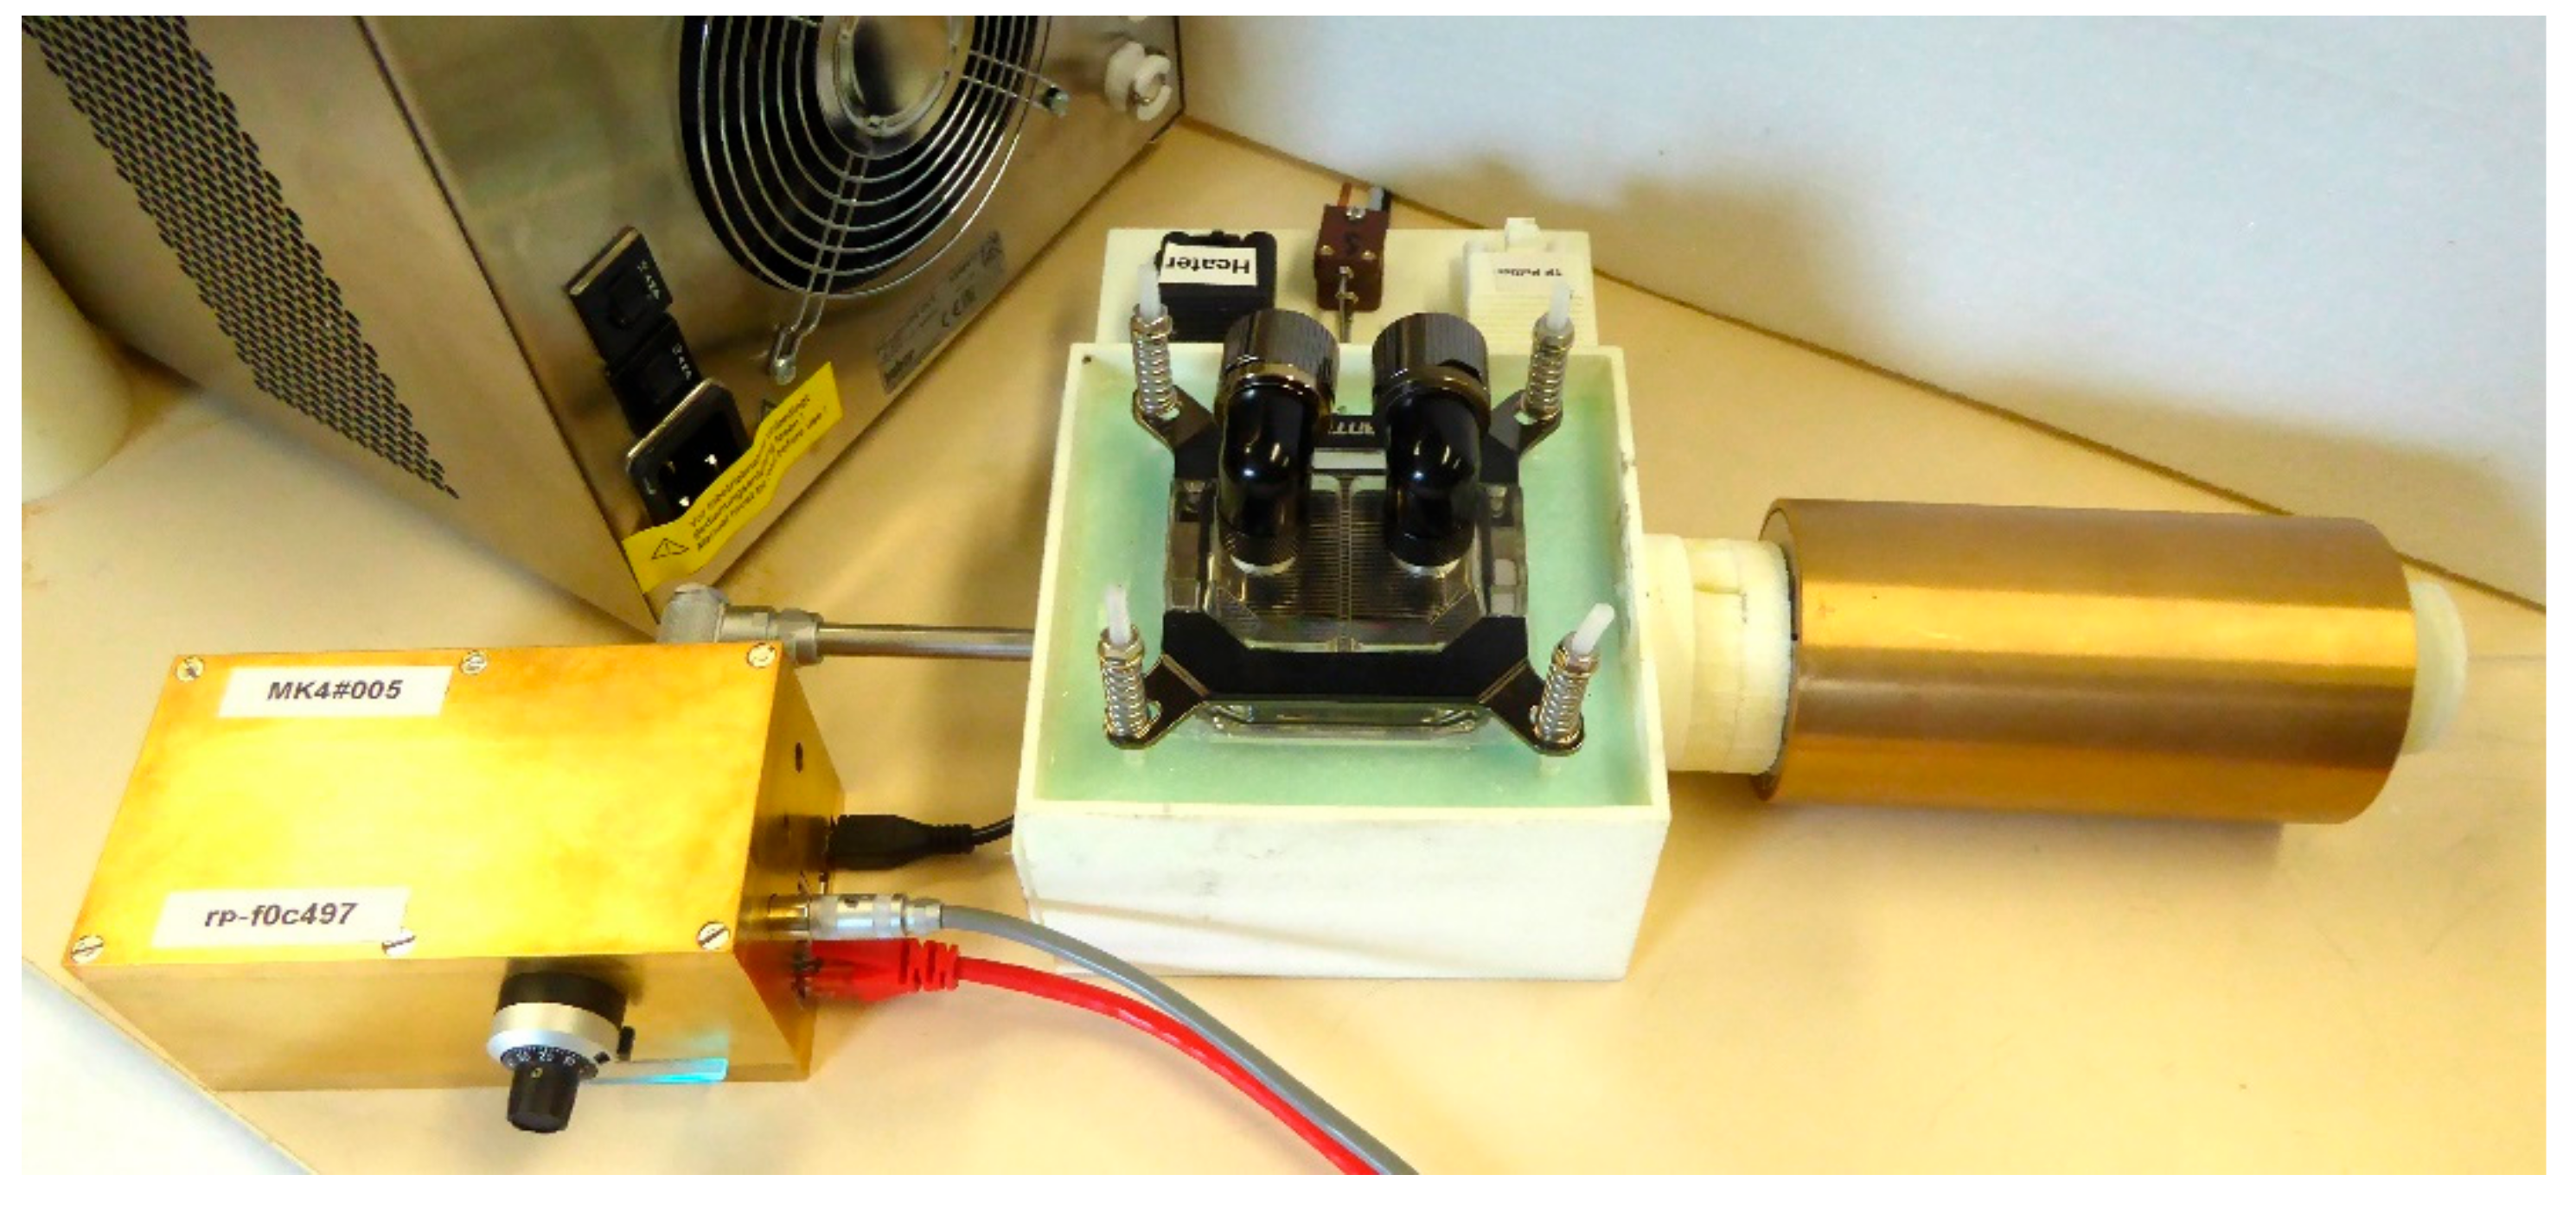
Figure 8.
A measurement of NMR signal amplitude in a non-freezing sample of Hexane, as a function of temperature, in a CryoP7 NMR probe, with room temperature +27C.
Figure 8.
A measurement of NMR signal amplitude in a non-freezing sample of Hexane, as a function of temperature, in a CryoP7 NMR probe, with room temperature +27C.
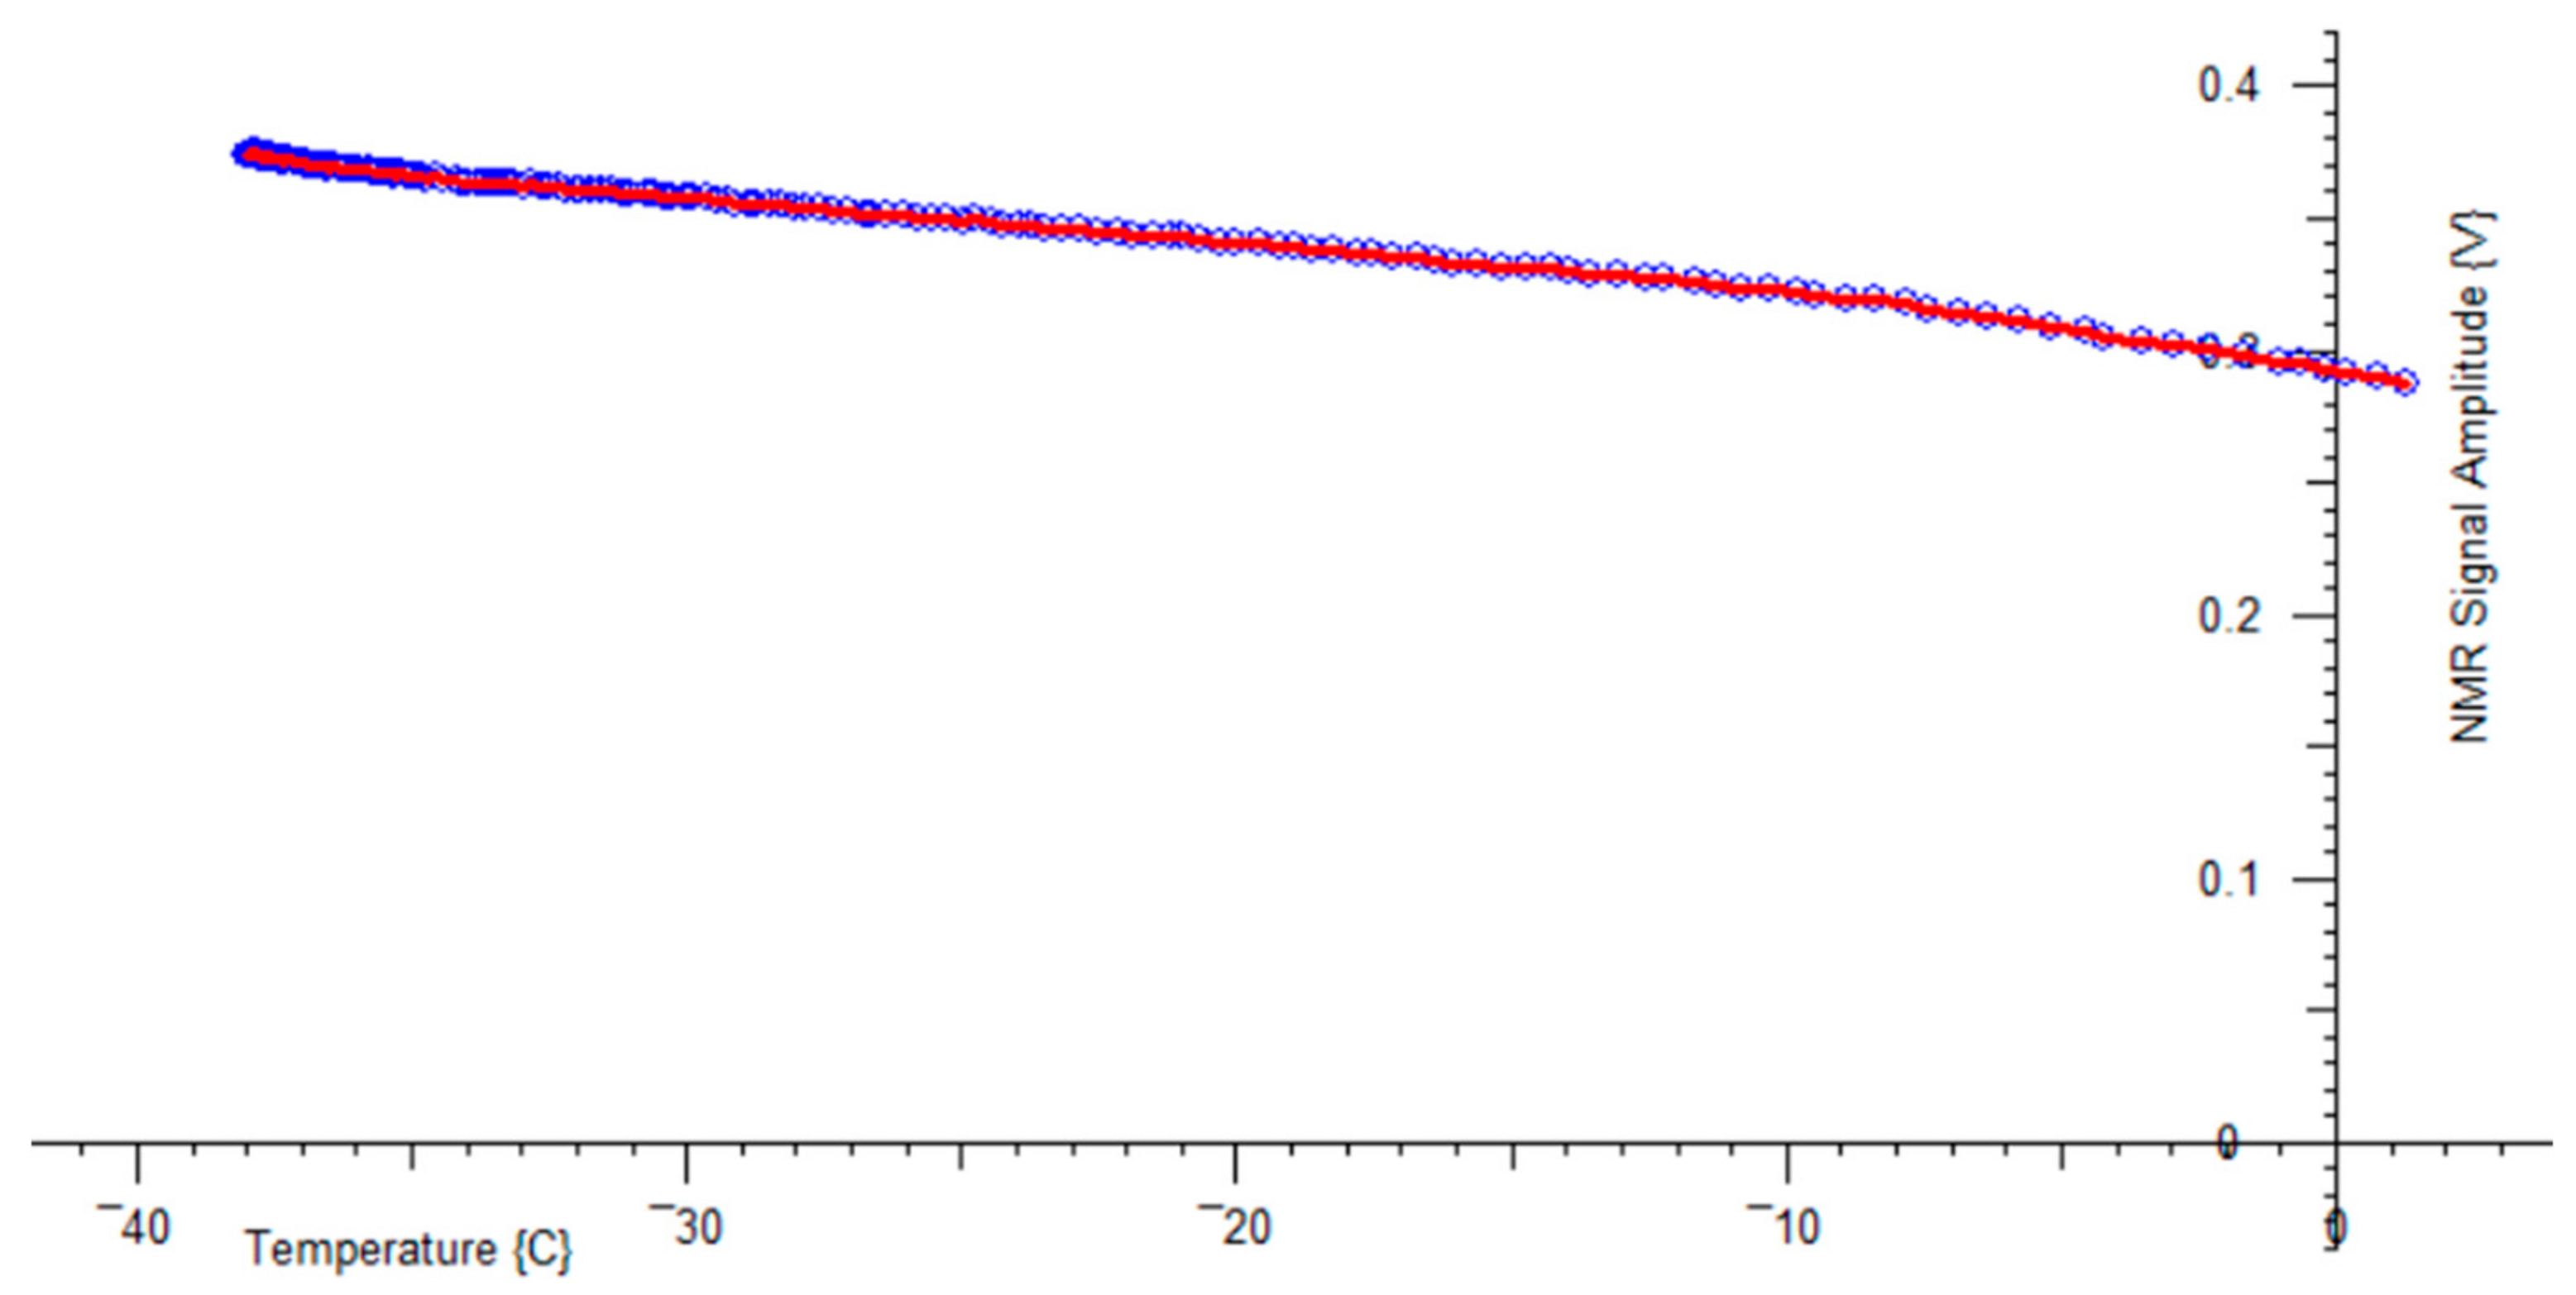
Figure 9.
Three different Lab-Tools NMR Magnets : (a) Blue 0.3 T (12 MHz 1H) 36mm ID bore Mandhalas magnet; (b) Gold 0.5T (21 MHz 1H) 40 mm ID bore Halbach J1 magnet; (c) Black 0.33 T (14 MHz 1H) 55mm ID bore Halbach H magnet (shimmed).
Figure 9.
Three different Lab-Tools NMR Magnets : (a) Blue 0.3 T (12 MHz 1H) 36mm ID bore Mandhalas magnet; (b) Gold 0.5T (21 MHz 1H) 40 mm ID bore Halbach J1 magnet; (c) Black 0.33 T (14 MHz 1H) 55mm ID bore Halbach H magnet (shimmed).
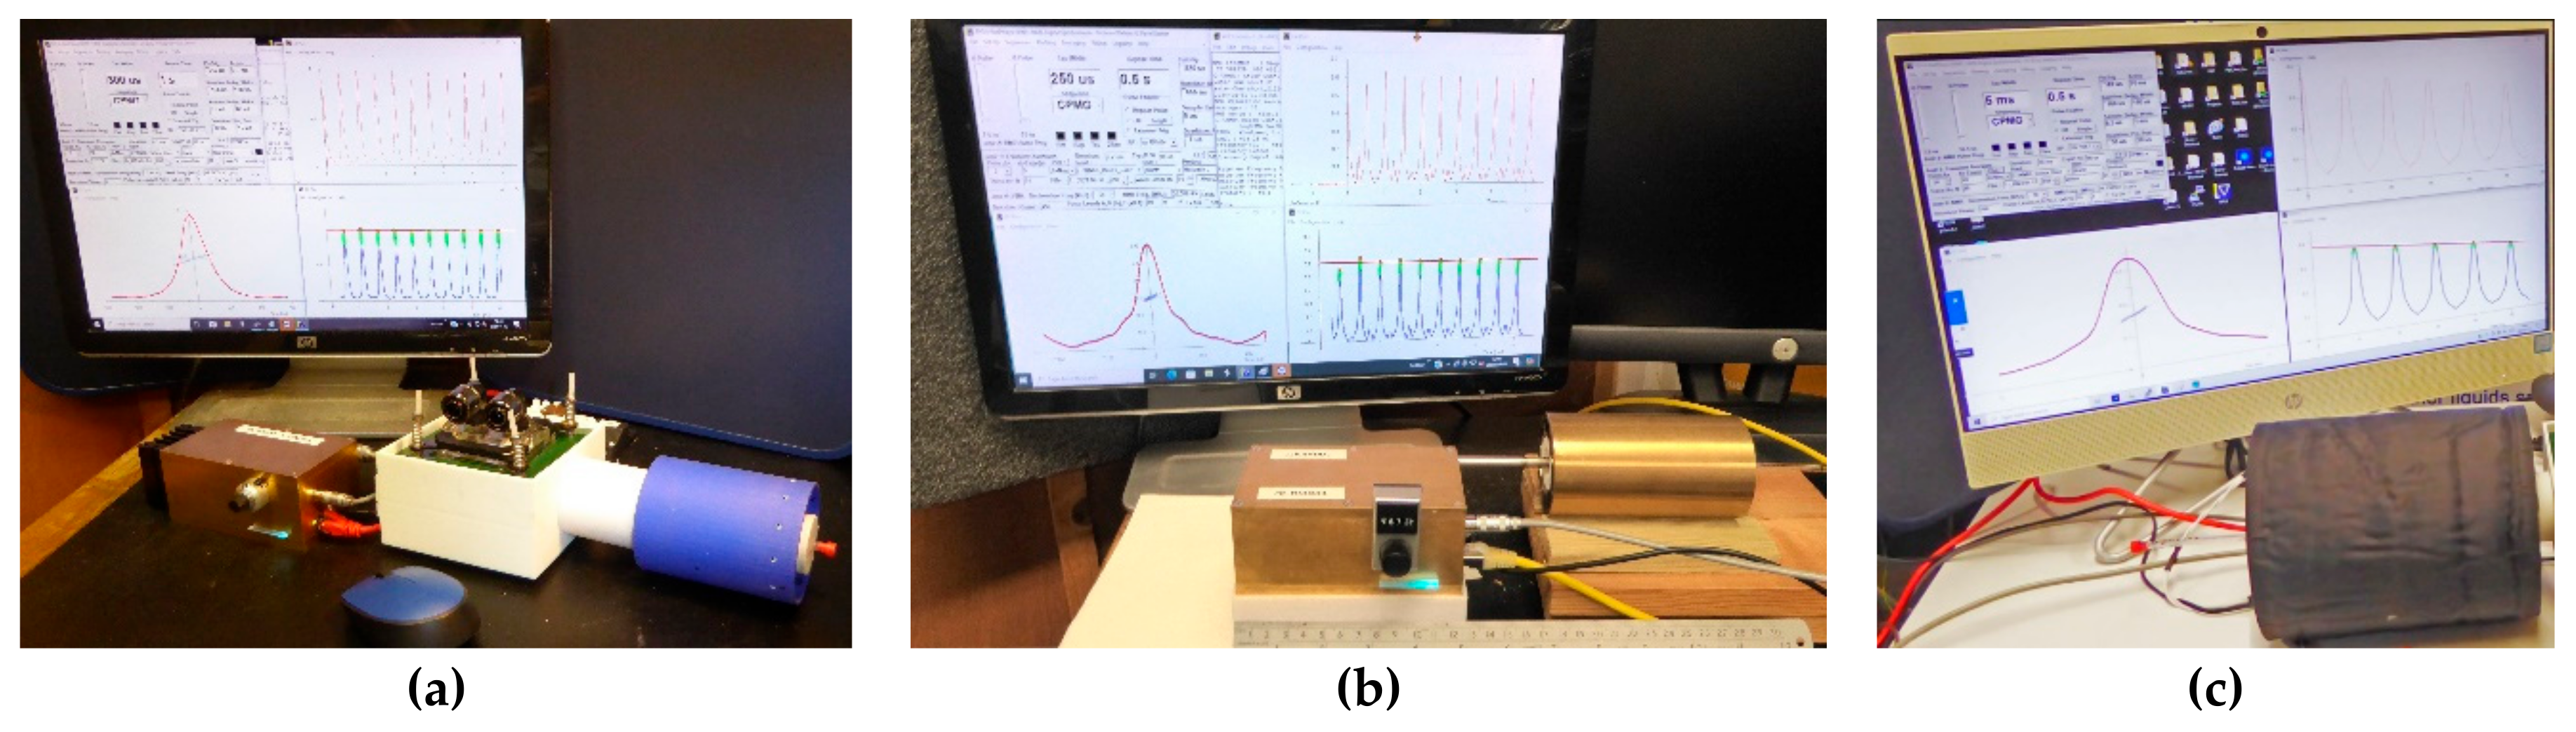
Figure 10.
Plots : Yellow Trace: NMR Pulse envelope; Cyan Trace : Recovery for empty sample; Traces Blue to Orange : Brittle ice at -25C, -20C, -15C, -10C, -5C; Green Trace: Water at +5C. No Boltzmann correction, no baseline correction.
Figure 10.
Plots : Yellow Trace: NMR Pulse envelope; Cyan Trace : Recovery for empty sample; Traces Blue to Orange : Brittle ice at -25C, -20C, -15C, -10C, -5C; Green Trace: Water at +5C. No Boltzmann correction, no baseline correction.
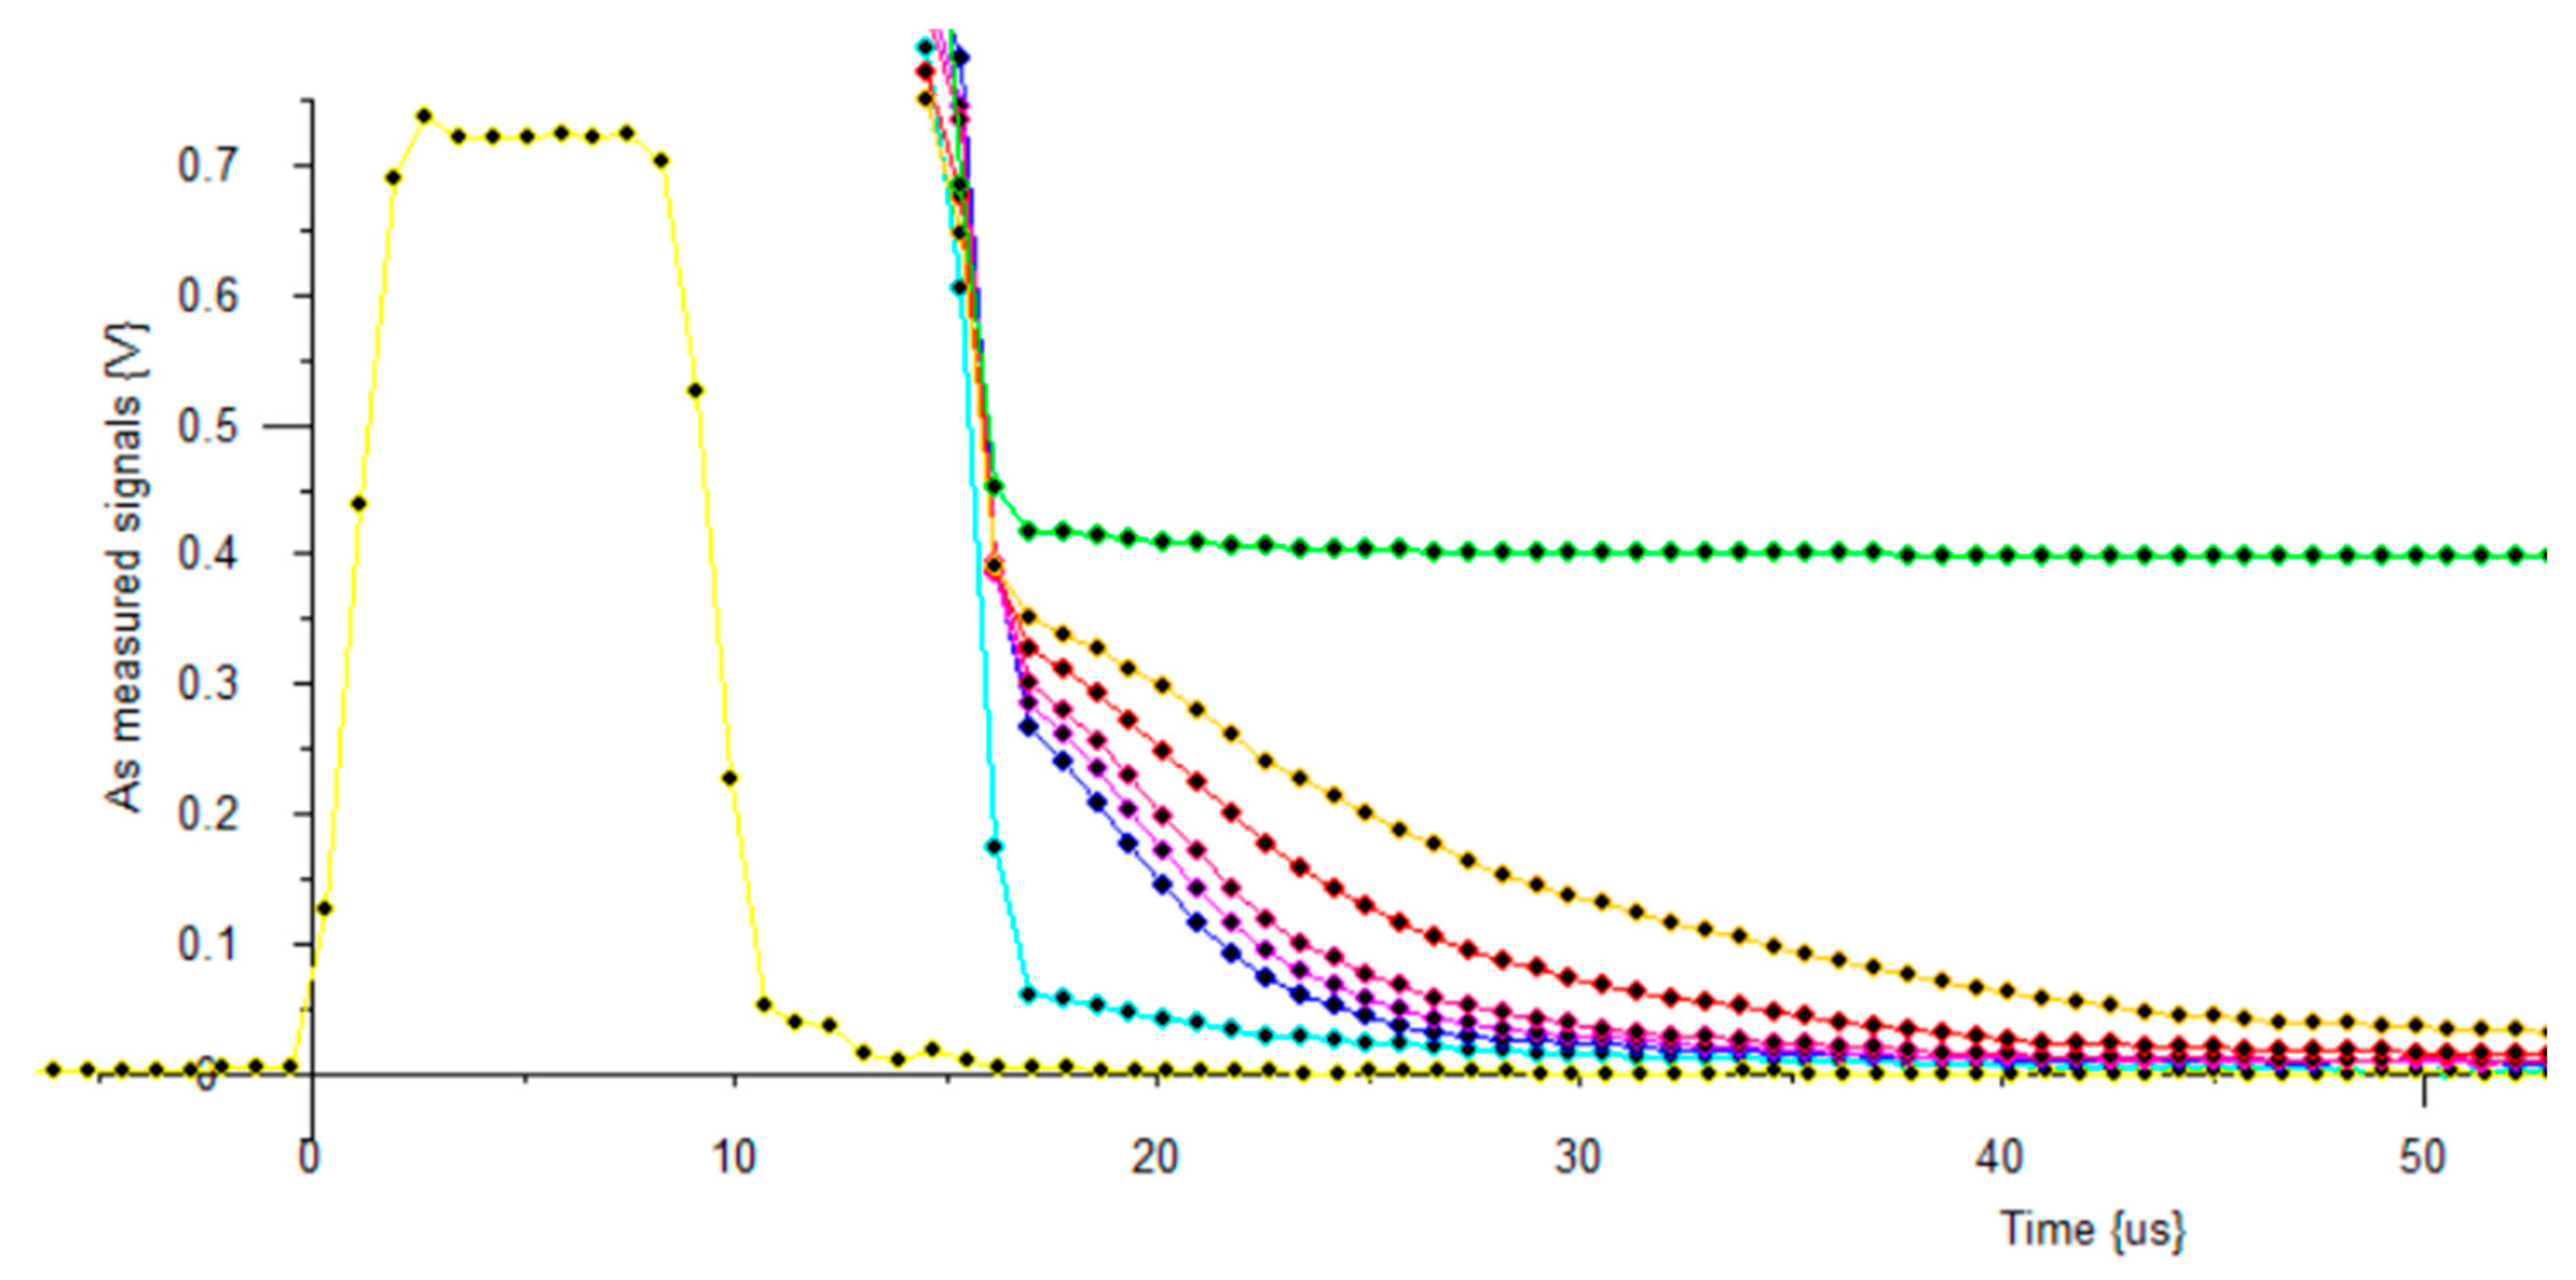
Figure 11.
Theoretical curves for relaxation times, for T1 transverse relaxation, for T1ρ transverse relaxation in the rotating frame, for B1 field strengths typical for the MK4 NMR spectrometer, and for T2 longitudinal relaxation, plotted against correlation time τc.
Figure 11.
Theoretical curves for relaxation times, for T1 transverse relaxation, for T1ρ transverse relaxation in the rotating frame, for B1 field strengths typical for the MK4 NMR spectrometer, and for T2 longitudinal relaxation, plotted against correlation time τc.
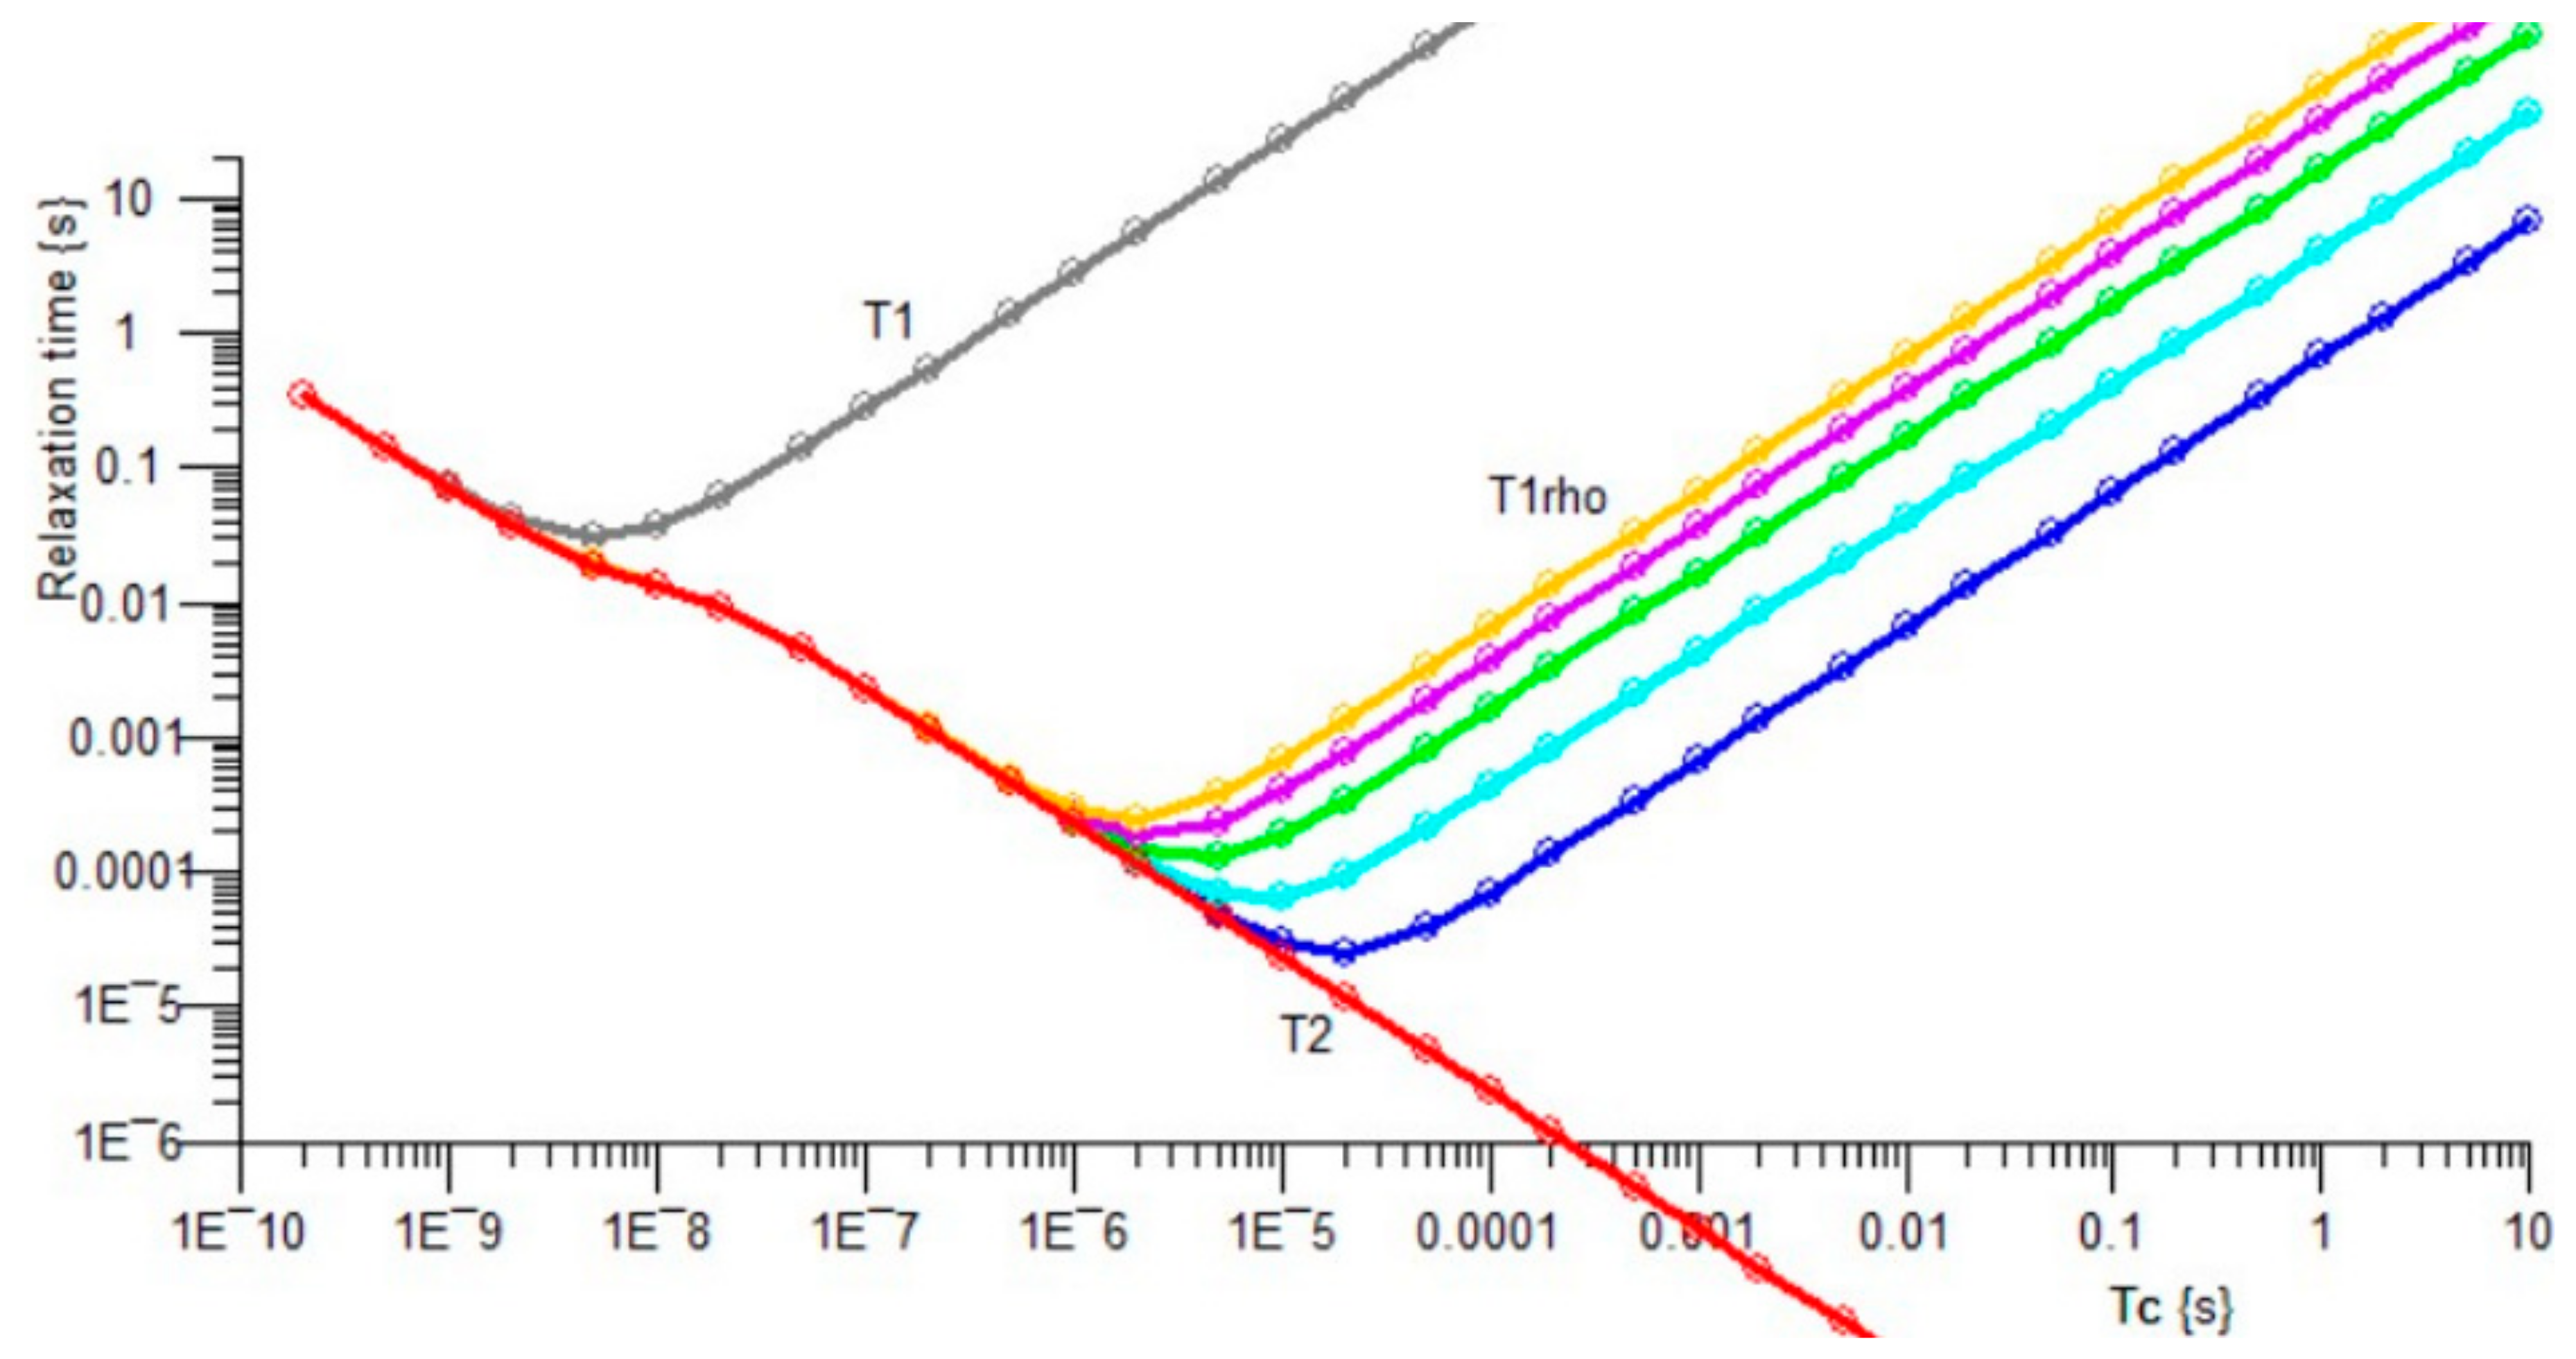
Figure 12.
T1ρ relaxation time for interfacial ice in a 100Å pore size sol-gel silica. Traces Purple to Black : Rotational frequencies 22 kHz to 2.3 kHz.
Figure 12.
T1ρ relaxation time for interfacial ice in a 100Å pore size sol-gel silica. Traces Purple to Black : Rotational frequencies 22 kHz to 2.3 kHz.
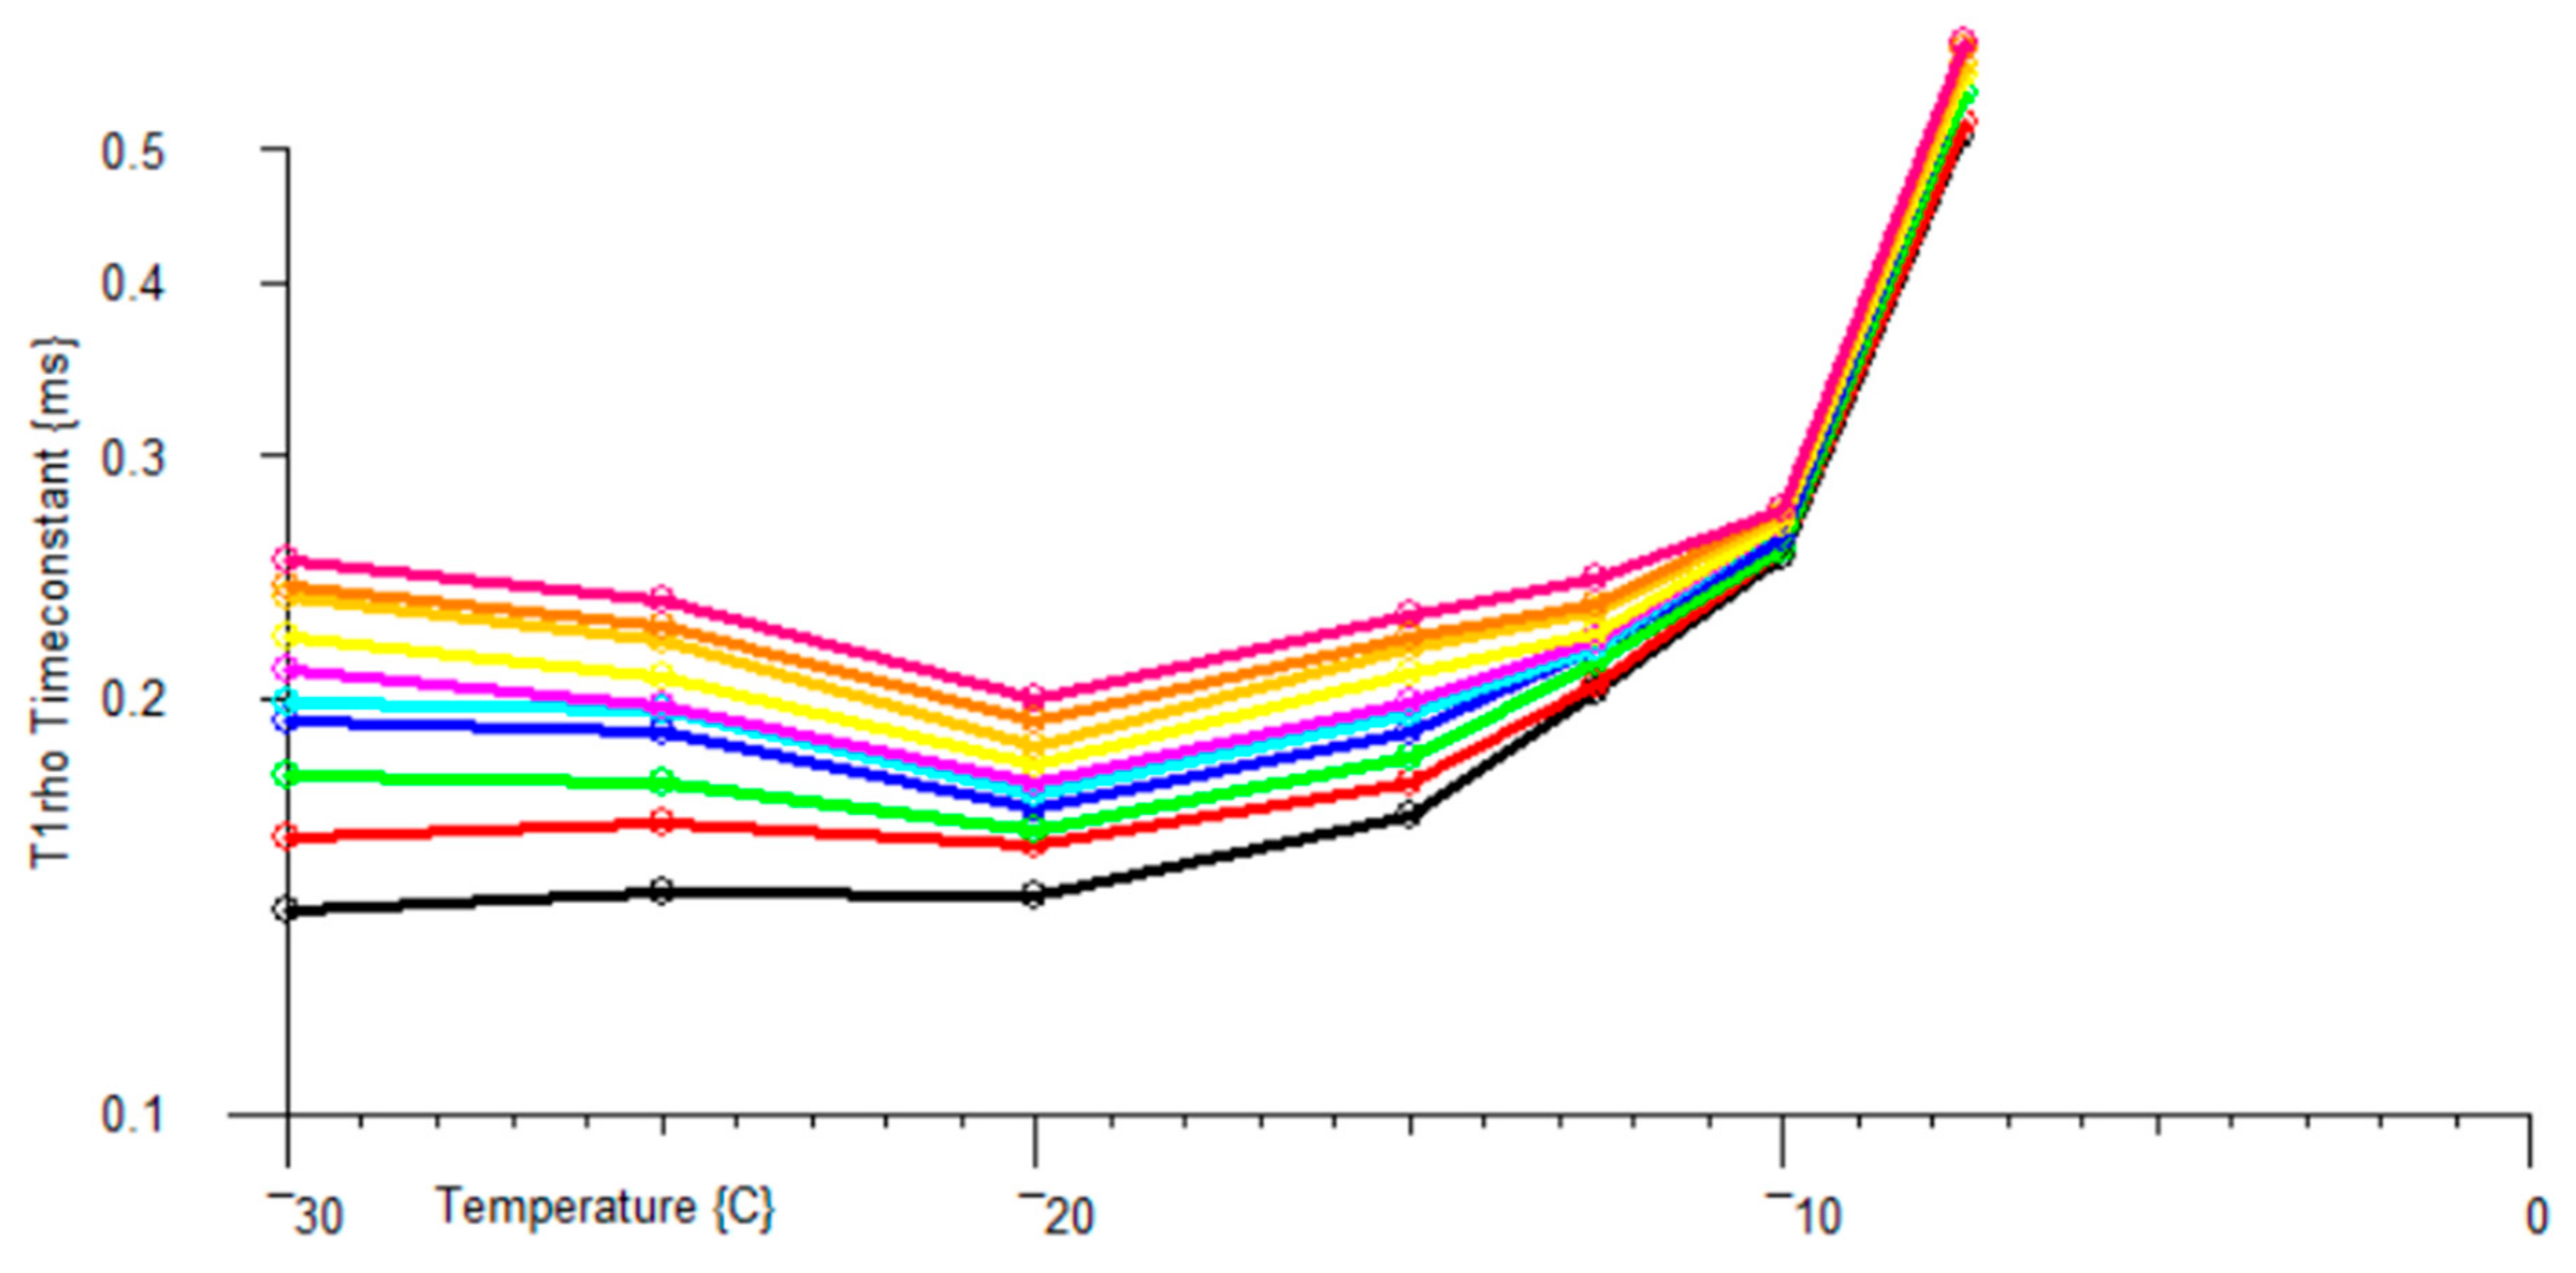
Figure 13.
This data is plotted as relaxation rate R1, as a sequence of temperatures, on a MHz frequency scale, as is conventional for Fast Field Cycling measurements.
Figure 13.
This data is plotted as relaxation rate R1, as a sequence of temperatures, on a MHz frequency scale, as is conventional for Fast Field Cycling measurements.
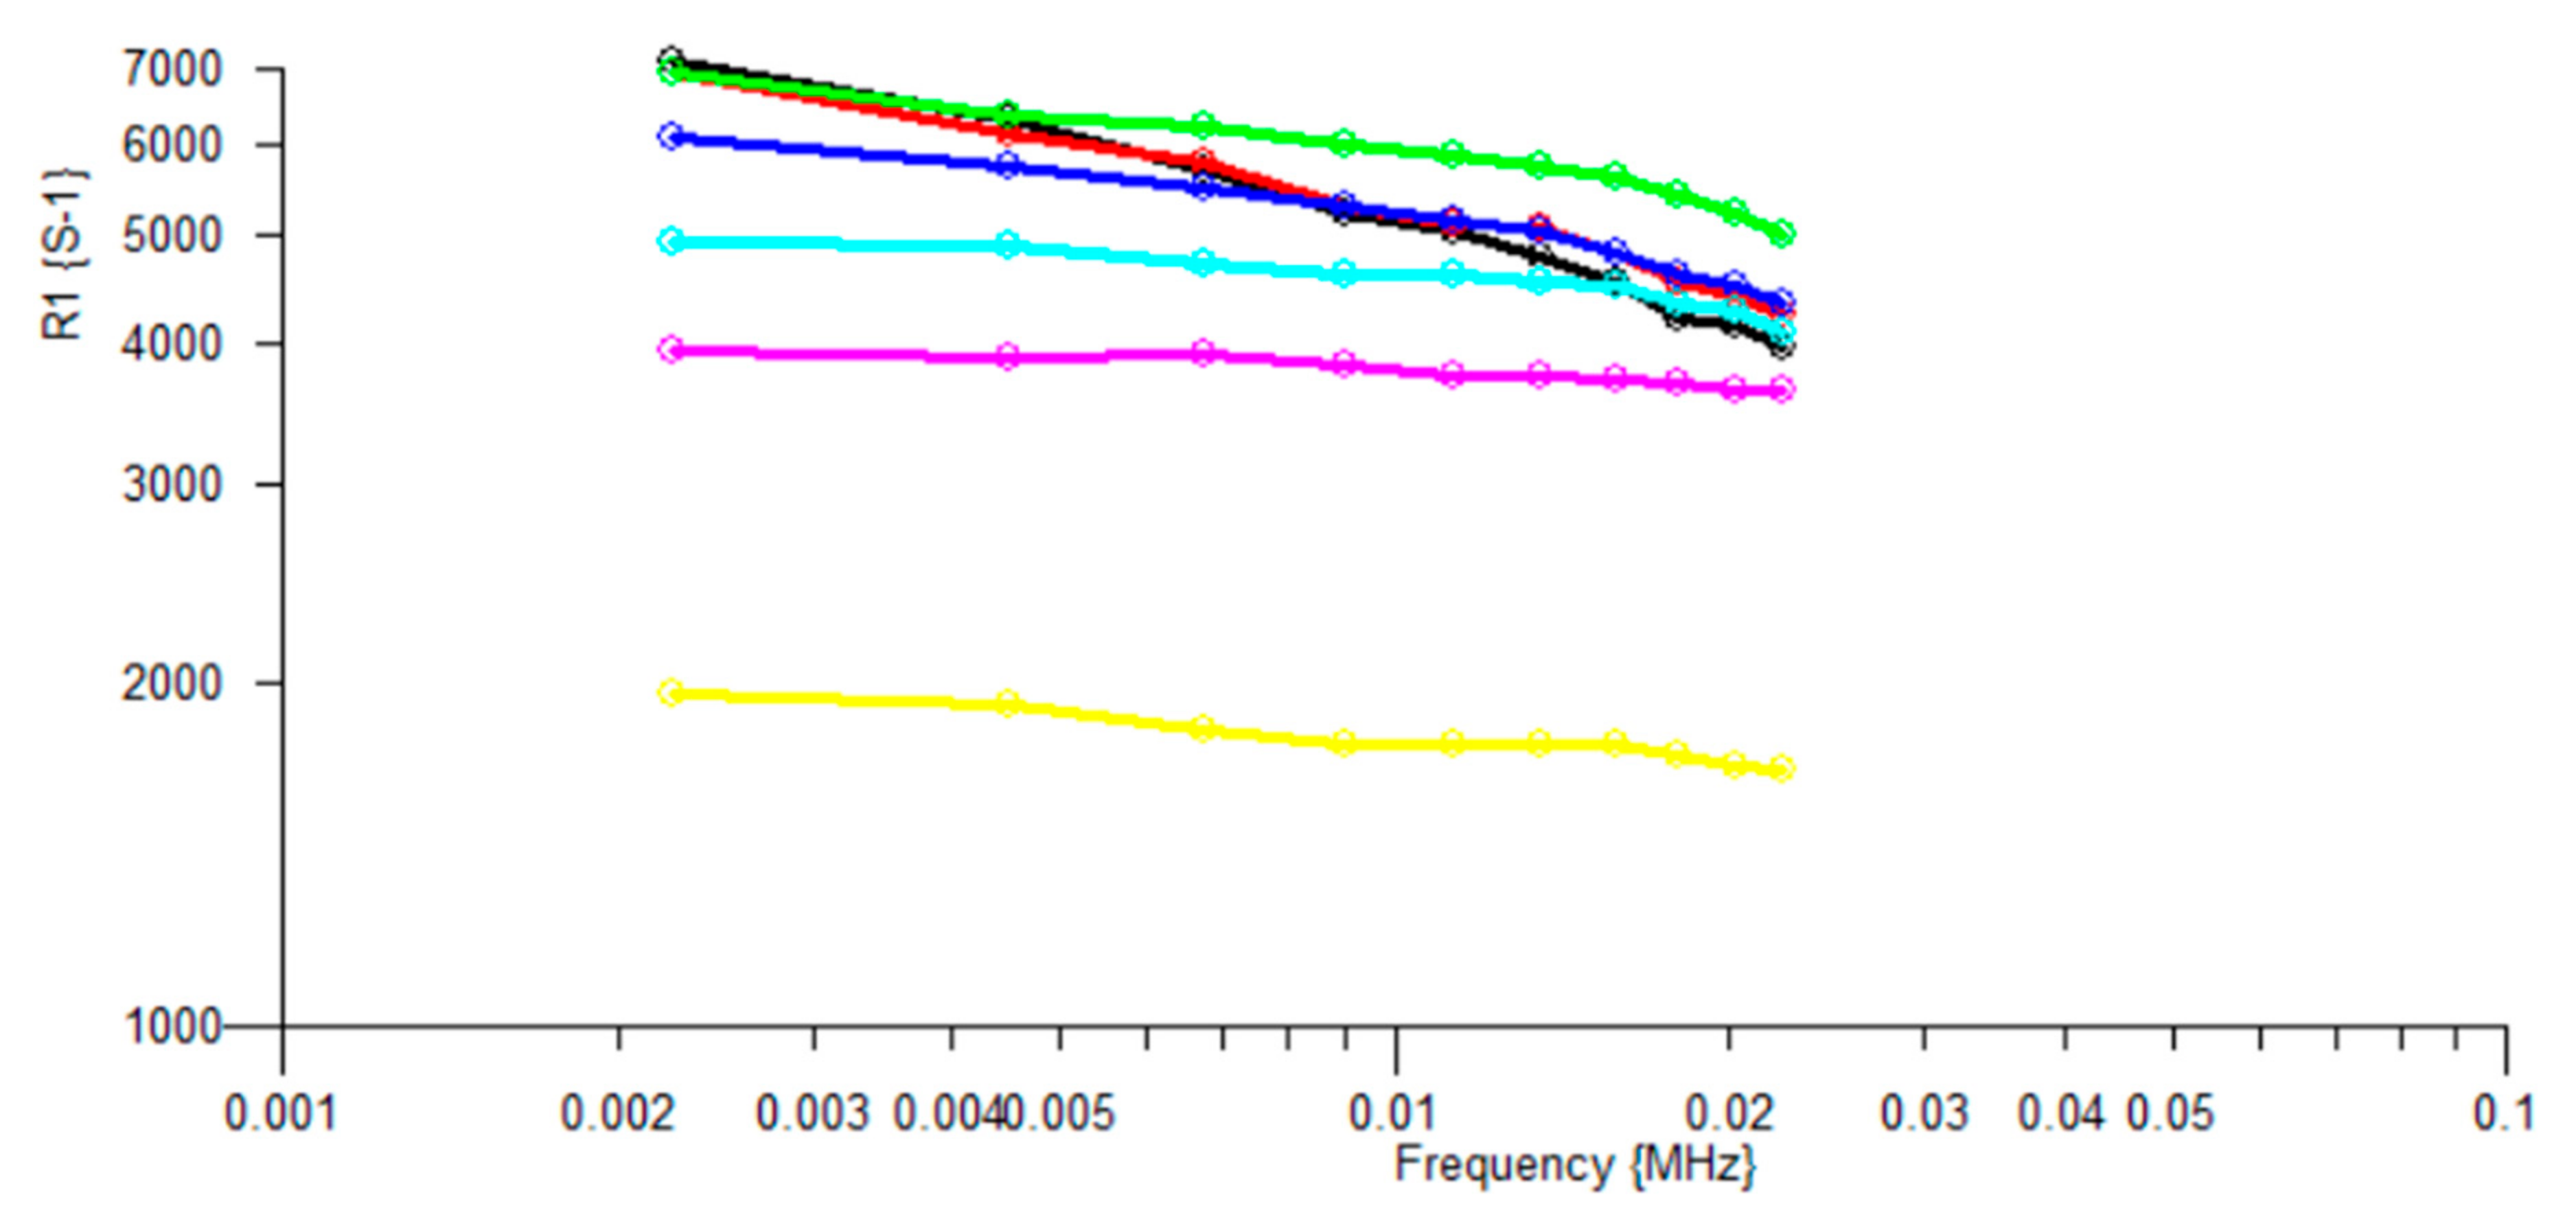
Figure 14.
An extremely effective variable-temperature NMR system, and NMR Cryoporometer, based on a MK4 NMR Spectrometer, a CryoP6 V-T probe, and a 55mm bore 0.33T Halbach magnet, with a dual-screen all-in-one HP computer and monitor.
Figure 14.
An extremely effective variable-temperature NMR system, and NMR Cryoporometer, based on a MK4 NMR Spectrometer, a CryoP6 V-T probe, and a 55mm bore 0.33T Halbach magnet, with a dual-screen all-in-one HP computer and monitor.
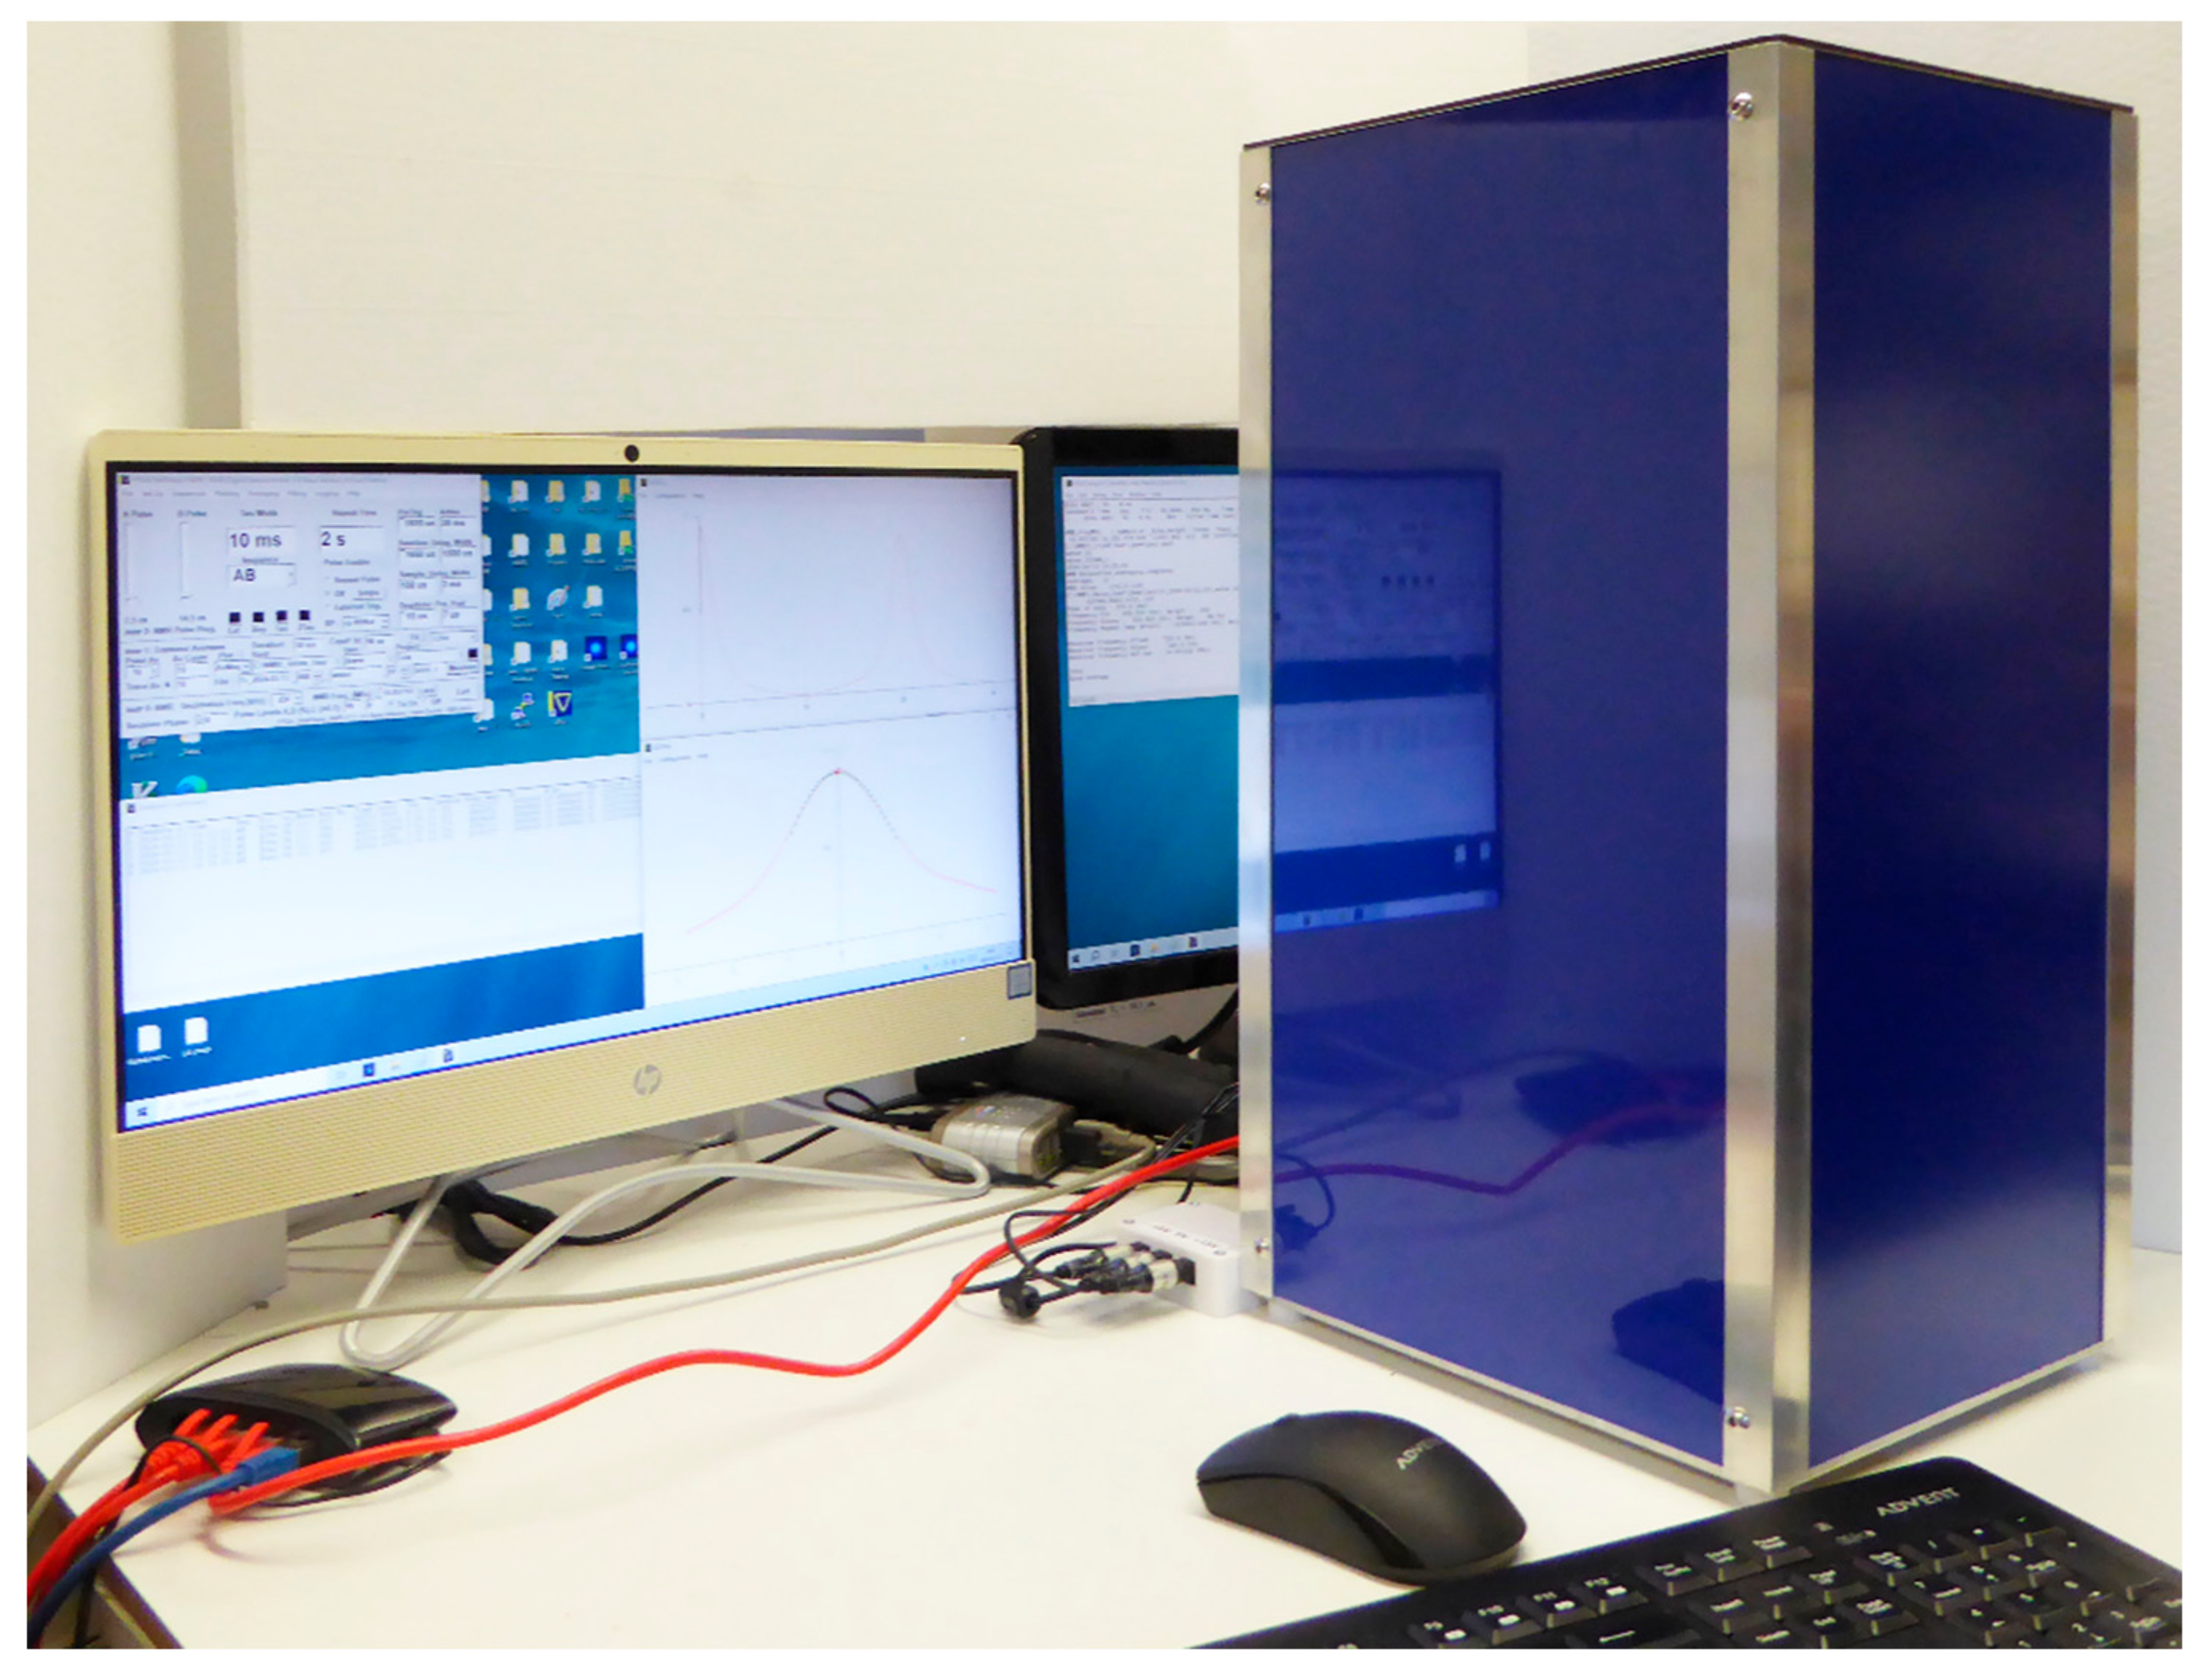
Figure 15.
(a) On the left side is a melting curve, from -25C, for water in a sol-gel silica with nominal 100Å pores. (b) On the right is shown the corresponding pore-size distribution, as calculated from this data, by the Gibbs-Thomson equation.
Figure 15.
(a) On the left side is a melting curve, from -25C, for water in a sol-gel silica with nominal 100Å pores. (b) On the right is shown the corresponding pore-size distribution, as calculated from this data, by the Gibbs-Thomson equation.
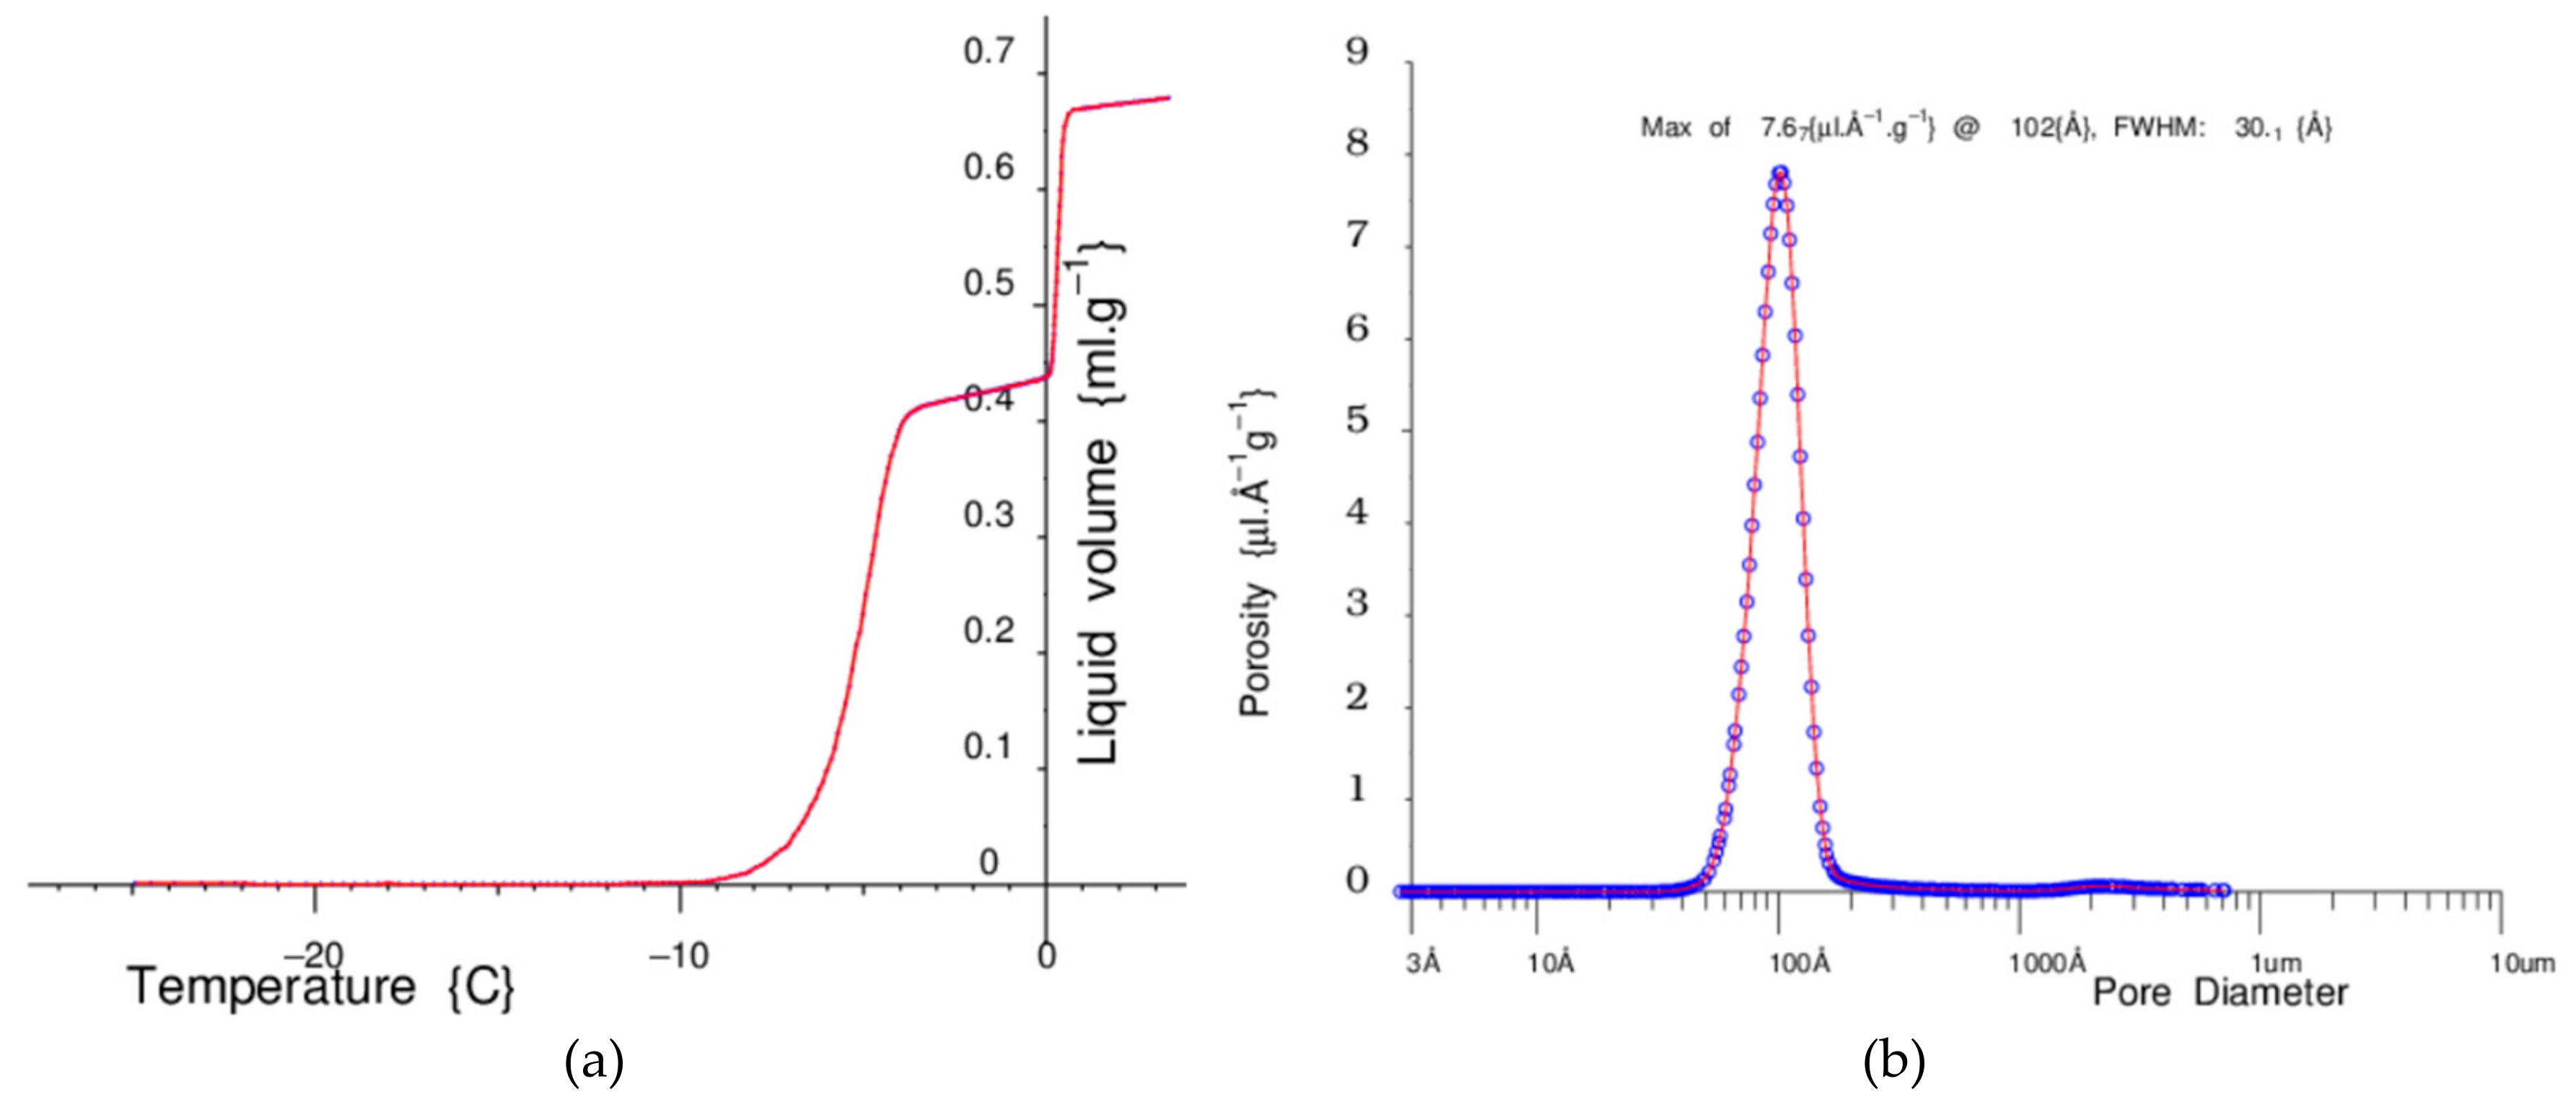

Table 1.
Parameters for T1ρ powers, B1 fields and rotation rates for the ice in Figure 12.
Table 1.
Parameters for T1ρ powers, B1 fields and rotation rates for the ice in Figure 12.
| Power {%} | B1 {Gauss} | Freq {kHz} | Colour |
|---|---|---|---|
| 99 | 5.24 | 22.3 | purple |
| 90 | 4.77 | 20.3 | redgreen |
| 80 | 4.23 | 18.0 | orange |
| 70 | 3.71 | 15.8 | yellow |
| 60 | 3.17 | 13.5 | magenta |
| 50 | 2.65 | 11.3 | cyan |
| 40 | 2.11 | 9.0 | blue |
| 30 | 1.6 | 6.8 | green |
| 20 | 1.06 | 4.5 | red |
| 10 | 0.54 | 2.3 | black |
Table 2.
Temperature parameters for the relaxation rate data in Figure 13.
Table 2.
Temperature parameters for the relaxation rate data in Figure 13.
| Temperature {C} | Colour |
|---|---|
| ¯30 | black |
| ¯25 | red |
| ¯20 | green |
| ¯15 | blue |
| ¯12.5 | cyan |
| ¯10 | magenta |
| ¯7.6 | yellow |
Disclaimer/Publisher’s Note: The statements, opinions and data contained in all publications are solely those of the individual author(s) and contributor(s) and not of MDPI and/or the editor(s). MDPI and/or the editor(s) disclaim responsibility for any injury to people or property resulting from any ideas, methods, instructions or products referred to in the content. |
© 2024 by the author. Licensee MDPI, Basel, Switzerland. This article is an open access article distributed under the terms and conditions of the Creative Commons Attribution (CC BY) license (http://creativecommons.org/licenses/by/4.0/).
Copyright: This open access article is published under a Creative Commons CC BY 4.0 license, which permit the free download, distribution, and reuse, provided that the author and preprint are cited in any reuse.


