
Submitted:
27 October 2025
Posted:
28 October 2025
You are already at the latest version
Abstract
Biochar has gained attention as a promising soil amendment capable of improving soil structure, nutrient retention and plant resilience to stress. However, its performance in perennial horticultural systems, particularly during the early stages of orchard establishment, remains insufficiently documented. The effectiveness of three methods of using biochar at a dose of 10 t ha-1 (application before ploughing prior to orchard establishment, application to planting holes, and surface spreading) in combination with compost or mineral nitrogen fertilisation was assessed in a young apple orchard of the ‘Gala Brookfield Baigent’ cultivar grafted onto dwarfing P 60 rootstock. Neither growth nor fruiting potential were affected by biochar, which made the comparison of its application methods inconclusive. Mineral nitrogen showed a tendency to promote the formation of mixed-type buds on short shoots, a propitious growing pattern for intensive orchard management. In contrast, compost fertilisation favoured vegetative growth over generative development. Nonetheless, the overall growth response of apple trees in the first year after planting to the applied soil-enriching practices was rather modest, with this observation validating the strategy of reducing fertiliser doses during orchard establishment on productive soils maintained in good agricultural condition.
Keywords:
orchard establishment
; soil amendment
; soil fertility
; fruiting potential
; Malus domestica
; maiden tree
1. Introduction
According to the data of the Food and Agriculture Organisation of the United Nations for 2023, apple production in all 27 countries of the European Union amounted to 12.06 million tonnes harvested from over 471,870 hectares. This represents 12.4% of the global production volume. Poland remains the leading player in the region with 3.9 million tonnes of apples harvested from 150,000 hectares in 2023 [1].
However, approximately half of Poland’s area is covered by light-textured soils with a mechanical composition of loose, weakly loamy or loamy sand, including nearly a 35% share of podzolic soils of low agricultural suitability. Such soils are characterised by a loose structure, drought susceptibility, high acidity, low organic matter content and poor nutrient sorption [2,3,4]. This limits the possibilities for establishing apple orchards, especially intensive, high-yielding ones with trees grafted onto dwarf rootstocks and planted at high density, which require fertile soils with a high water holding capacity [5].
Moreover, fruit production in Poland is not evenly distributed across the country but is concentrated in a few centres such as the Grójec-Warka, Sandomierz, Opole Lubelskie and Skierniewice regions, where fruit trees are grown in monoculture or under very limited crop rotation. Consequently, there have been common problems with replanting disease, which early research had already identified almost three decades ago [6].
In this context, biochar could be a promising solution for improving the productivity of apple orchards. This material, defined as a man-made product of biomass heating at relatively low temperatures (< 700 °C) in a closed system with low atmospheric oxygen concentration or in its absence [7], has gained widespread interest as a soil conditioner. Its properties and applications in agriculture were summarised in a review by Das et al. [8]. Briefly, the potential advantages of using biochar in crops include increased water retention in the soil [9,10] and mitigating the negative effects of drought on plants [11], reducing nutrient losses to the environment [12,13,14] mostly by improving their sorption in the soil [15,16], counteracting soil erosion [17], loosening excessively compacted soils [18,19], stimulating soil microbial activity [20] as well as reducing replanting disease [21,22,23]. Biochar itself also possesses high fertiliser value [24,25,26], provided it is not purified of mineral components [27].
Although the growth- and yield-stimulating effect of biochar has been confirmed by hundreds of individual studies and several derived meta-analyses [28,29,30], the vast majority of these works concerned annual crops only. Few similar studies have been performed on fruit crops, with their findings being rather inconclusive. Taking apple orchards as an example, Li et al. [31] reported an increase in fruit yield in response to biochar amendment, with no such effect noted by Ventura et al. [13]. According to Eyles et al. [32] and Khorram et al. [33], the yield was not affected but tree growth was improved. von Glisczynski et al. [34], on the other hand, not only observed no yield-stimulating effect due to biochar but even suggested a negative impact on tree vigour.
No detailed assessment has been made of the impact of interactions between biochar and fertilisation on the growing pattern of apple trees in the first season after planting, even though this has a decisive influence on the yields in subsequent years of orchard operation [35,36]. Nor have biochar application methods been compared, despite orchard management, unlike the annual cropping system, allowing for its use in various ways both before and after tree planting.
Given the above, the aim of this study was to assess the impact of three methods of biochar application (application before ploughing prior to orchard establishment; application to planting holes, and surface spreading after tree planting) in combination with two fertilisation regimes (use of compost or mineral nitrogen) on the growth and fruiting potential of apple trees in the first season after orchard establishment.
2. Materials and Methods
2.1. Trial Layout
A field trial was established in Wieluń, central Poland (51°13′55”N 18°31′26”E) in April 2021. The experimental site featured sandy loam soil formed on limestone, characterised by granulometric composition shown in Table 1 and the chemical properties given in Table 2. Monthly meteorological data and the corresponding values of the Selyaninov’s hydro-thermal coefficient (a drought indicator; [37]) for the months preceding tree planting (January–March 2021) and during their growth, are presented in Table 3.
The experimental orchard was established using high-quality, feathered maiden apple trees (Malus domestica Borkh.) cv. ‘Gala Brookfield Baigent’ grafted onto P 60 rootstock (a semi-dwarf rootstock of Polish breeding with growth vigour intermediate between M9 and M26 [39]). The maiden trees were obtained from a private nursery ‘JANKOWSKI & SYN’ based in Gąbin, Poland. The nursery material was of uniform quality and characterised by a well-developed canopy with several (8–12) long lateral shoots forming a wide angle with the leader.
The forecrop for the apple orchard was potatoes. Over the preceding few years, the land had been under an annual rotation of potatoes with buckwheat or phacelia, which were used as green manure. The soil had been managed with a plough tillage system. Fruit crops had never been grown there before.
The orchard was planted at a spacing of 3 × 1 m. After planting, the trees were pruned by cutting back side shoots longer than 50 cm by ⅔ of their length. In May, the emerging flowers were removed manually in order to prevent fruit setting in favour of vegetative growth. Plant protection treatments were performed using approved chemical pesticides in accordance with the needs identified on the basis of regular monitoring. The soil in the 1 m wide tree rows was kept weed-free by spraying with glyphosate, whereas spontaneous vegetation was allowed to grow in the inter-rows and was regularly mowed. The orchard was not irrigated.
Three methods of biochar application, i.e. plough incorporation, planting-hole application and surface spreading, each in combination with compost or mineral nitrogen fertilisation, were tested against the fertilisers applied singly and an untreated control. This gave a total of nine treatments, each represented by three replicates arranged in a completely randomised design. A single replicate consisted of four contiguous trees growing in a row, with a gap of four trees not included in the experiment between the replicates.
The plough incorporation involved introducing biochar into the soil profile by ploughing to a depth of 20 cm before establishing the orchard. The planting-hole application consisted of pouring it into the hole in which the tree was then planted, whilst the surface application involved spreading biochar evenly in the tree rows and mixing it with the topsoil using a hoe after the orchard had been established. In each treatment, the proportion of biochar per unit area of 10 t ha-1 (1 kg m-2) was observed, whereby (i.) in the plough incorporation, it was spread over the entire surface of the experimental plot (tree rows and half of the inter-rows on both sides); (ii.) in the planting-hole application, a dose of 1 kg per tree was used, i.e. a value corresponding to 1 m²; and (iii.) in the surface application, biochar was used only in the space planned for 1 m wide herbicide strips. This approach was intended to stimulate various possible methods of applying biochar, both before and after the orchard establishment, accounting for differences in material consumption. A diagram comparing the plough incorporation and surface spreading methods of using biochar is presented in Figure 1.
The biochar used in the study was produced by FLUID S.A., based in Sędziszów, Poland. It was obtained by heating cattle manure at a temperature of approx. 300 °C in a low-oxygen environment. It was applied in powder form. The material contained 1.90% total nitrogen, 0.78% phosphorus and 3.49% potassium, with a dry matter content of 84%. Organic matter accounted for 69% of the dry matter of biochar, and its pH was 9.5.
Compost under the trade name ‘Próchniaczek’ was purchased from the Municipal Waste Management Company (MPO) based in Łódź, Poland. The main substrates used in its production were biodegradable municipal waste and residues from the maintenance of urban green areas. The mineral composition of the compost used is presented in Table 4. In the relevant treatments, compost was applied at a dose of 67 t ha-1 before the orchard establishment, in a manner analogous to that described for biochar in the plough incorporation.
In the appropriate treatments, mineral nitrogen was applied in two doses after planting the orchard. In the third decade of April 2021, 5 g N m-2 were spread in the form of urea, and a month later, 15 g N m-2 were spread in the form of ammonium nitrate. Both nitrogen fertilisers were produced by AZOTY Puławy, Poland. The nitrogen fertilisation was applied only in tree rows, in the area of herbicide strips.
The following basic parameters were assessed: (i.) trunk circumference; (ii.) total length of current-year shoots; (iii.) number of long shoots; (iv.) number of short shoots; (v.) number of mixed-type buds; (vi.) leaf area, and (vii.) leaf dry matter. The measurements i.–v. were taken during the dormancy period following the first year of tree growth in the orchard. Trunk circumference was measured at a height of 30 cm above the grafting site. Shoots shorter than 20 cm were considered short shoots, while longer ones were considered long shoots. Leaf sampling (measurements vi.–vii.) was carried out in the third decade of August 2021 during the growing season. Fourteen leaves were collected from the middle part of long shoots at half the height of each of the four trees per replicate. The leaves were scanned at 1200 DPI using a Brother DCP-L2622DW scanner. Their surface area was assessed by means of pliman programme [40]. The leaf samples were dried at room temperature until a constant weight was achieved (no more water was evaporating), and then weighed using a calibrated and officially legalised electronic laboratory scale with a measurement accuracy of 0.01 g (model RADWAG 1/A2/C/2; RADWAG Electronic Scales, Radom, Poland).
Trunk circumference was converted to trunk cross-sectional area (TCSA) using the formula for the area of a circle. Growth-related fruiting potential was then calculated as the ratio of the number of mixed-type buds to TCSA.
2.2. Statistical Analyses
The primary method used to assess the impact of the studied factors on the evaluated parameters was analysis of variance. The data was checked for normality using the Shapiro-Wilk test, and for variance homogeneity using the Levene test. If both conditions were fulfilled, classical one-way analysis of variance (ANOVA) was applied, followed by the Tukey HSD test as a post-hoc procedure. If the assumption of variance homogeneity was not fulfilled, ANOVA with Welch’s F” correction was used, followed by the Games-Howell post-hoc procedure. Non-normal variables were analysed using the Kruskal-Wallis one-way analysis of variance by rank.
In addition, parameters for which statistically significant results were obtained through one-way analyses of variance were subjected to multiple linear regression models, broken down by particular fertilisation-related factors. Thus, the explanatory variables were “method of biochar application” (levels: not applied; plough incorporation; planting-hole application; surface application), “compost application” (levels: not applied; applied) and “mineral nitrogen fertilisation” (levels: not applied; applied). These categorical variables were dummy codded, with the absence of each treatment being considered a reference category. For each model applied, III type sum of squares was used.
The normality of model residuals was assessed visually based on a normal Q-Q plot, with Lilliefors test applied as an adjunctive method. The homoscedasticity of the model residuals was evaluated visually based on plots presenting the residuals and residual squares against the predicted and observed values. The dependent variable ‘ratio of the number of mixed-type buds to trunk cross-sectional area’ had to be converted using the Box-Cox transformation to meet the assumptions of the regression model. The autocorrelation of model residuals was controlled using the Durbin-Watson test, with reference to established critical values [41]. Outliers were identified using a criterion whereby an observation was considered to be an outlier if its residual exceeded three standard deviations of the model residuals. No observations exceeded this threshold.
The measures of effect size presented for the ANOVA and Kruskal-Wallis tests, and multiple regression models were η2 (eta-squared), ε² (epsilon-squared), and R2, respectively.
Moreover, principal component analysis (PCA) was performed on the seven basic parameters describing tree growth and fruiting potential. The PCA was based on the correlation matrix. The original variables had been standardised (z-score) before the procedure. Relevance of the analysis had been confirmed by the result of Bartlett’s test (p < .001) and value of Keiser-Mayer-Olkin coefficient equal to 0.68.
The significance level of α ≤ 0.05 was adopted for testing the hypotheses. The PQStat v.1.8.6 package (PQStat Software, Poznań, Poland) was used for all the statistical calculations.
3. Results
The growth of apple trees, expressed both as the trunk circumference (ANOVA: F8,18 = 1.13, p = .39, η2 = 0.34) and the total length of current-year shoots (ANOVA: F8,18 = 1.34, p = .29, η2 = 0.37), was not significantly affected by biochar and fertilisation combinations, despite relatively large effect size estimates (Figure 2 and Figure 3).
Even though the soil-enriching practices tested did not exert a statistically significant impact on the number of apple tree long shoots (ANOVA: F8,18 = 0.45, p = .87, η2 = 0.17) (Figure 4), the count of short shoots was significantly affected, with the variability of this parameter having been explained to a large extent (ANOVA: F8,18 = 2.84, p < .05, η2 = 0.56). The surface application of biochar combined with mineral nitrogen fertilisation increased the number of spurs compared to compost application along with soil-surface and planting-hole biochar amendments. In the other treatments, including the control, an intermediate result was obtained (Figure 5). The multiple linear regression model (F5,21 = 2.34, p = .08, R2 = 0.36) did not allow for a statistically significant assessment of the individual contributions of fertilisation-related factors on the number of short shoots, despite accounting for 36% of the variance in this parameter (Table 5).
Despite not affecting the number of mixed-type buds (Kruskal-Wallis test: H8 = 13.52, p = .10, ε² = 0.31) (Figure 6), the soil amendments had a statistically significant impact on the growth-related fruiting potential of apple trees, which was calculated as a ratio of generative buds to the trunk cross-sectional area (Welch’s ANOVA: F”8,7.40 = 3.74, p < .05, η2 = 0.50). Consequently, plants fertilised with mineral nitrogen in combination with surface-applied biochar had a significantly higher index value than those fertilised with compost (Figure 7), which suggests the better use of growth vigour to initiate generative buds. Eventually, partitioning off all fertilisation-related factors in the regression model (F5,21 = 3.52, p < .05, R2 = 0.46) revealed that compost promoted tree vegetative growth at the expense of formation of mixed-type buds for the subsequent year’s yield, with this being reflected in the significantly negative value of coefficient b (Table 6).
Neither the leaf area (ANOVA: F8,18 = 1.21, p = .35, η2 = 0.35) nor dry matter (Kruskal-Wallis test: H8 = 8.60, p = .38, ε² = 0.03) depended significantly on the biochar and fertiliser combinations applied (Figure 8 and Figure 9).
Seven original parameters describing tree growth and fruiting potential were subjected to the principal component analysis. Based on the scree plot, the first three principal components (PC1–PC3), which explain together 79.04% of the variance in the original variables, were retained for further explanatory analyses (Figure 10).
From the factor loadings for the three selected principal components presented in Table 7, it can be concluded that PC1 is mainly determined by growth-related parameters (trunk circumference, total length of shoots, number of long shoots), whilst PC2 and PC3 mainly refer to variables describing the yield potential for the following year (number of short shoots and mixed-type buds). Leaf dry matter, which is a conventional measure of the nutritional status of trees, and leaf area, have a similar contribution to all retained components, although it is greater in PC1 than in PC2 and PC3. Therefore, let us consider PC1 as tree vigour, and PC2 and PC3 as fruiting potential.

Table 1.
Factor loadings of the first three principal components (PC1–PC3).
| Original variable | PC1 | PC2 | PC3 |
| Trunk circumference | 0.76 | 0.35 | –0.20 |
| Total length of current-year shoots | 0.88 | 0.13 | –0.01 |
| Number of long shoots | 0.84 | 0.18 | –0.22 |
| Number of short shoots | –0.13 | 0.65 | 0.71 |
| Number of mixed-type buds | 0.29 | 0.74 | –0.05 |
| Leaf area | 0.68 | –0.54 | 0.29 |
| Leaf dry matter | 0.69 | –0.42 | 0.37 |
When the original data was reduced to two dimensions (PC1 vs. PC2), the most noticeable pattern was the clustering of points representing trees fertilised with mineral nitrogen (black symbols) almost exclusively in the first and second quadrants of the coordinate system (Figure 11A). Their positive PC2 values indicate higher fruiting potential. In contrast, trees fertilised with compost (white symbols) were characterised by negative values of this component. The acute angle between the vectors for the number of short shoots and mixed-type buds in Figure 11A reflects their strong positive correlation, suggesting that this type of generative development was mainly expressed through the formation of fruiting spurs.
In turn, in Figure 11B, the vector for the number of buds is nearly perpendicular to the vector for short shoots (negligible correlation) but forms an acute angle with the vector for long shoots. Therefore, this pattern of generative development was mainly related to the formation of mixed-type buds on long shoots. However, in the PC1 vs. PC3 configuration, it is not possible to derive as clear of a distinction between point clusters as in the previous case. Roughly equal distribution of points on both sides of the Y-axis suggests that flower buds on long shoots were formed regardless of the fertilisation regime.
Nevertheless, in both projections (Figure 11A,B), any particular pattern that would depend on the methods of biochar application is difficult to discern, whilst the points representing the untreated control are scattered more or less throughout the coordinate system.
4. Discussion
Orchard management differs fundamentally from annual crop production. Nonetheless, most of the studies documenting the role of biochar in stimulating plant growth and yields refer to annual crops [8,28,30], with transferring these findings by analogy to perennial fruit tree systems being problematic.
First of all, the primary way to use biochar in annual crop rotation is to introduce it into the soil during regular tillage operations. Meanwhile, in perennial fruit crops, deep soil tillage (usually ploughing) is only carried out at the stage of preparing the field for planting an orchard. This could be a convenient time to apply biochar but alternative methods are also possible, including planting-hole application and surface spreading.
In the case of plough incorporation, biochar would be mixed into the soil across the entire area using a plough, in a similar way to organic or phosphate fertilisers. This would ensure its availability in the root system zone as it expands over subsequent years of tree growth, including after the soil in the inter-rows has been overgrown. The planting-hole application involves lower biochar consumption but the material would not be able to benefit the roots as they expand. In turn, the surface application could be used particularly in existing orchards where soil tillage options are very limited. To date, these methods of biochar application have been used separately in several studies performed in orchards [13,34,42] but no comparison has been made between them. Nor has sufficient attention been paid to the interaction between biochar and fertilisation, despite strong evidence that biochar requires supplementation with fertilisers to exert its full stimulating effect [28].
According to the results of this study, the soil-enriching practices affected the early-stage growth performance of apple trees to a relatively small extent, with the effect of biochar having been masked by fertilisation regimes. Consequently, it was not possible to compare the effectiveness of the biochar application methods. However, biochar may take many years to show its impact on tree-based crops [43]. Long-term research may be necessary to assess its effects. The results from the subsequent years of the present experiment, which include data on the tree growth and fruit yield and quality, are being prepared for separate publication.
Apart from the short experimental period, the low effectiveness of biochar in this study may have been contributed to by the (i.) fertile soil (Table 1 and Table 2); (ii.) generally favourable weather conditions (Table 3), as a result of which biochar did not demonstrate its effectiveness in mitigating drought stress [11]; (iii.) establishment of the orchard on land with no previous history of fruit production, and consequently no possibility for biochar to demonstrate its replanting disease-mitigating properties [21,22,23]; and (iv.) low nutrient requirements of fruit trees due to the presence of perennial elements (rootstock, trunk) in which mineral components are stored [44].
A particularly interesting finding of this study was the contrasting effect of the fertilisation regime on bud formation observed in the regression and principal component analyses. Compost showed a tendency towards reducing the formation of mixed-type buds on short shoots, with the opposite observation made in the case of mineral nitrogen. This suggests that compost-fertilised trees allocated more resources towards vegetative growth at the expense of generative development. Such an outcome is undesirable in intensive dwarf orchards, where a balance between growth and fruiting is crucial for efficient fruit production [36]. This observation is consistent with the results of Eyles et al. [32], who also noticed enhanced vigour in apple trees after combining biochar with compost, without any benefits to fruit yield. A possible explanation is the prolonged release of nitrogen from the organic compounds present in compost [45], which extended into the second half of the growing season, stimulating tree growth at a time when they should already be building potential for next year’s yield. However, the role of organic matter in shaping soil fertility in orchards should not be devalued [46], considering that site preparation for new planting is the most appropriate time to introduce it deep into the soil profile whilst performing tillage operations.
It should be emphasised that the present study did not provide sufficient evidence that the administered mineral nitrogen fertilisation yielded any measurable benefits in terms of tree growth or fruiting potential, as reflected in the series of one-way analyses performed. This result stands in line with the long-term observations made in the Wilanów Experimental Orchard in Poland [47,48,49,50], according to which, in fertile soils rich in organic matter, the release of plant-available nitrogen forms from the mineralisation of soil organic matter is sufficient to fully cover the requirements of apple trees. The response of the trees to additional mineral fertilisation is negligible or non-existent, with excessive doses of fertiliser posing a risk of environmental pollution. The soil organic matter content at the experimental site was relatively high for Polish conditions, which might explain the results obtained (Table 2).
As no evidence was found to confirm any beneficial effect of biochar on apple tree growth in the first year after planting, further research should focus on the long-term assessment of its effectiveness in conditions where the orchard is exposed to stress, e.g. drought [51], replant disease [21,22,23], or managed under limited mineral fertilisation [52].
5. Conclusions
The results presented herein are not conclusive on the effectiveness of particular methods of applying biochar in orchards due to its lack of significant impact. Longer-term studies are necessary for a reliable comparison. Mineral nitrogen fertilisation tended to increase the number of mixed-type buds on short shoots, thereby favouring the growing pattern particularly desired in intensive dwarf orchards. Compost fertilisation, on the other hand, tended to promote vegetative growth at the expense of generative bud formation. Nonetheless, the overall growth response of apple trees to the soil-enriching practices applied was rather modest, indicating the validity of limiting mineral and organic fertiliser doses when establishing an orchard on fertile soils with sufficient organic matter content.
Author Contributions
Conceptualization, G.P. and S.P.; methodology, G.P. and S.P.; validation, S.P.; formal analysis, G.P.; investigation, G.P.; resources, G.P.; data curation, G.P. and S.P.; writing—original draft preparation, G.P.; writing—review and editing, S.P.; visualization, G.P.; supervision, S.P. All authors have read and agreed to the published version of the manuscript.
Funding
This research received no external funding.
Data Availability Statement
The raw experimental data that supports the findings of this study is publicly available through the RepOD Repository for Open Data at https://doi.org/10.18150/YUORE9.
Conflicts of Interest
The authors declare no conflicts of interest.
References
- FAO. Production/Crops and livestock products. Available online: https://www.fao.org/faostat/en/#data/QCL (accessed on 1 October 2025).
- Musierowicz, A. Gleby lekkie Polski. Zesz. Probl. Postęp. Nauk Rol. 1956, 21, 49–55.
- Bieganowski, A.; Witkowska-Walczak, B.; Gliński, J.; Sokołowska, Z.; Sławiński, C.; Brzezińska, M.; Włodarczyk, T. Database of Polish arable mineral soils: A review. Int. Agrophys. 2013, 27, 335–350.
- Niewiadomski, A.; Tołoczko, W. Characteristics of soil cover in Poland with special attention paid to the Łódź region. In Natural Environment of Poland and its Protection in Łódź University Geographical Research. 1st ed.; Kobojek, E., Marszał, T., Eds.; Łódź University Press: Łódź, Poland, 2014; pp. 75–99.
- Piestrzeniewicz, C.; Sadowski, A.; Dziuban, R. Suitability of different dwarfing rootstocks for ‘Rubin’ apple trees grown in fertile soil. J. Fruit Ornam. Plant Res. 2009, 17, 53–62.
- Szczygieł, A.; Zepp, A. An occurrence and importance of apple replant disease in Polish orchards. Acta Hortic. 1998, 47, 99–102.
- Lehmann, J.; Joseph, S. Biochar for environmental management: An introduction. In Biochar for environmental management – science and technology. 1st ed.; Lehmann, J., Joseph, S., Eds.; Earthscan: London, UK, 2015; pp. 1–9.
- Das, S.K.; Ghosh, G.K.; Avasthe, R. Application of biochar in agriculture and environment, and its safety issues. Biomass Convers Biorefin. 2023, 13, 1359–1369.
- Chen, C.; Wang, R.; Shang, J.; Liu, K.; Irshad, M.K.; Hu, K; Arthur, E. Effect of biochar application on hydraulic properties of sandy soil under dry and wet conditions. Vadose Zone J. 2018, 17, 1–8.
- Mao, J.; Zhang, K.; Chen, B. Linking hydrophobicity of biochar to the water repellency and water holding capacity of bio-char-amended soil. Environ. Pollut. 2018, 253, 779–789.
- Akhtar, S.S.; Li, G.; Andersen, M.N.; Liu, F. Biochar enhances yield and quality of tomato under reduced irrigation. Agric. Water Manag. 2014, 138, 37–44.
- Altland, J.E.; Locke, J.C. Biochar affects macronutrient leaching from a soilless substrate. HortScience 2012, 47, 1136–1140.
- Ventura, M.; Sorrenti, G.; Panzacchi, P.; George, E.; Tonon, G. Biochar reduces short-term nitrate leaching from a horizon in an apple orchard. J. Environ. Qual. 2013, 42, 76–82.
- Nguyen, B.T.; Phan, B.T.; Nguyen, T.X.; Nguyen, V.N.; Tran, T.V.; Bach, Q.V. Contrastive nutrient leaching from two differently textured paddy soils as influenced by bio-char addition. J. Soils Sediments 2020, 20, 297–307.
- Igaz, D.; Šimanský, V.; Horák, J.; Kondrlová, E.; Domanová, J.; Rodný, M.; Buchkina, N.P. Can a single dose of biochar affect selected soil physical and chemical characteristics? J. Hydrol. Hydromech. 2018, 66, 421–428.
- Šimanský, V.; Horák, J.; Igaz, D.; Balashov, E.; Jonczak, J. Biochar and biochar with N fertilizer as a potential tool for improving soil sorption of nutrients. J. Soils Sediments 2018, 18, 1432–1440.
- Gholami, L.; Karimi, N.; Kavian, A. Soil and water conservation using biochar and various soil moisture in laboratory conditions. CATENA 2019, 182, 104151.
- Karhu, K.; Mattila, T.; Bergström, I.; Regina, K. Biochar addition to agricultural soil increased CH4 uptake and water holding capacity – Results from a short-term pilot field study. Agric. Ecosyst. Environ. 2011, 140, 309–313.
- Vaccari, F.P.; Baronti, S.; Lugato, E.; Genesio, L.; Castaldi, S.; Fornasier, F.; Miglietta, F. Biochar as a strategy to sequester carbon and increase yield in durum wheat. Eur. J. Agron. 2011, 34, 231–238.
- Bamminger, C.; Zaiser, N.; Zinsser, P.; Lamers, M.; Kammann, C.; Marhan, S. Effects of biochar, earthworms, and litter addition on soil microbial activity and abundance in a temperate agricultural soil. Biol. Fertil. Soils 2014, 50, 1189–1200.
- Wang, Y.; Pan, F.; Wang, G.; Zhang, G.; Wang, Y.; Chen, Y.; Mao, Z. Effects of biochar on photosynthesis and antioxidative system of Malus hupehensis Rehd. seedlings under replant conditions. Sci. Hortic. 2014, 175, 9–15.
- Atucha, A.; Litus, G. Effect of biochar amendments on peach replant disease. HortScience 2015, 50, 863–868.
- Wang, Y.; Ma, Z.; Wang, X.; Sun, Q.; Dong, H.; Wang, G.; Chen, X.; Yin, C.; Han, Z.; Mao, Z. Effects of biochar on the growth of apple seedlings, soil enzyme activities and fungal communities in replant disease soil. Sci. Hortic. 2019, 256, 108641.
- Zhao, L.; Cao, X.; Zheng, W.; Wang, Q.; Yang, F. Endogenous minerals have influences on surface electrochemistry and ion exchange properties of biochar. Chemosphere 2015, 136, 133–139.
- Tian, J.; Miller, V.; Chiu, P.C.; Maresca, J.A.; Guo, M.; Imhoff, P.T. Nutrient release and ammonium sorption by poultry litter and wood biochars in stormwater treatment. Sci. Total Environ. 2016, 553, 596–606.
- Wu, H.; Che, X.; Ding, Z.; Hu, X.; Creamer, A.E.; Chen, H.; Gao, B. Release of soluble elements from biochars derived from various biomass feedstocks. Environ. Sci. Pollut. Res. 2016, 23, 1905–1915.
- Tan, X.; Liu, Y.; Zeng, G.; Wang, X.; Hu, X.; Gu, Y.; Yang, Z. Application of biochar for the removal of pollutants from aqueous solutions. Chemosphere 2015, 125, 70–85.
- Ye, L.; Camps-Arbestain, M.; Shen, Q.; Lehmann, J.; Singh, B.; Sabir, M. Biochar effects on crop yields with and without fertilizer: A meta-analysis of field studies using separate controls. Soil Use Manag. 2020, 36, 2–18.
- Schmidt, H.P.; Kammann, C.; Hagemann, N.; Leifeld, J.; Bucheli, T.D.; Monedero, M.A.S.; Cayuela, M.L. Biochar in agriculture – A systematic review of 26 global meta-analyses. GCB Bioenergy 2021, 13, 1708–1730.
- Bai, S.H.; Omidvar, N.; Gallart, M.; Kämper, W.; Tahmasbian, I.; Farrar, M.B.; Singh, K.; Zhou, G.; Muqadass, B.; Xu, C.Y.; Koech, R.; Li, Y.; Nguyen, T.T.N.; van Zwieten, L. Combined effects of biochar and fertilizer applications on yield: A review and meta-analysis. Sci. Total Environ. 2022, 808, 152073.
- Li, W.; Gao, J.; Zhou, S.; Zhou, F. Effect of biochar on apple yield and quality in aged apple orchards on the Loess Plateau (China). Agronomy 2024, 14, 1125.
- Eyles, A.; Bound, S.A.; Oliver, G.; Corkrey, R.; Hardie, M.; Green, S.; Close, D.C. Impact of biochar amendment on the growth, physiology and fruit of a young commercial apple orchard. Trees 2015, 29, 1817–1826.
- Khorram, M.S.; Zhang, G.; Fatemi, A.; Kiefer, R.; Maddah, K.; Baqar, M.; Zakaria, M.P.; Li, G. Impact of biochar and compost amendment on soil quality, growth and yield of a replanted apple orchard in a 4-year field study. J. Sci. Food Agric. 2019, 99, 1862–1869.
- von Glisczynski, F.; Sandhage-Hofmann, A.; Amelung, W.; Pude, R. Biochar-compost substrates do not promote growth and fruit quality of a replanted German orchard with fertile Haplic Luvisol soils. Sci. Hortic. 2016, 213, 110–114.
- Van Oosten, H. Effect of initial tree quality on yield. Acta Hort. 1978, 65, 123–125.
- Dominguez, L.I.; Robinson, T.L. Benefits of irrigation or fertigation on early growth and yield of a high-density apple plantaing in a humid climate. HortTechnology 2024, 34, 747–760.
- Selyaninov, G.T. K metodike sel’skohozyaïstvennoï klimatografii. Trudy po Sel’skokhozyaïstvennoï Meteorologii 1928, 20, 165–177.
- Chmist-Sikorska, J.; Kępińska-Kasprzak, M.; Struzik, P. Agricultural drought assessment on the base of hydro-thermal coefficient of Selyaninov in Poland. Ital. J. Agrometeorol. 2022, 1, 3–12.
- Czynczyk, A.; Bielicki, P.; Bartosiewicz, B. Results of growing three apple cultivars grafted on a number of Polish and English rootstocks and their subclones. J. Fruit Ornam. Plant Res. 2009, 17, 73–83.
- Olivoto, T. Lights, camera, pliman! An R package for plant image analysis. Methods Ecol. Evol. 2022, 13, 789–798.
- Savin, N.E.; White, K.J. The Durbin-Watson test for serial correlation with extreme sample sizes or many regressors. Econometrica 1977, 45, 1989–1996.
- Frąc, M.; Sas-Paszt, L.; Sitarek, M. Influence of biochar on the vegetative and generative growth of ‘Meredith’ peach trees. Acta Sci. Pol. Hortorum Cultus 2022, 21, 61–69.
- Antonangelo, J.A.; Sun, X.; de Jesus Eufrade-Junior, H. Biochar impact on soil health and tree-based crops: a review. Biochar 2025, 7, 51.
- Wu, Y.; Sun, M.; Qi, Y.; Liu, S. Remobilization of storage nitrogen in young pear trees grafted onto vigorous rootstocks (Pyrus betulifolia). Horticulturae 2021, 7, 148.
- Lim, L.Y.; Lee, C.T.; Bong, C.P.C.; Lim, J.S.; Sarmidi, M.R.; Klemeš, J.J. A review on the impacts of compost on soil nitrogen dynamics. Chem. Eng. Trans. 2018, 63, 349–354.
- Neilsen, G.; Forge, T.; Angers, D.; Neilsen, D.; Hogue, E. Suitable orchard floor management strategies in organic apple orchards that augment soil organic matter and maintain tree performance. Plant Soil 2014, 378, 325–335.
- Wrona, D. Effect of nitrogen fertilization on growth, cropping and fruit quality of ‘Šampion’ apple trees during 9 years after planting. Folia Hortic. 2004, 16, 55–60.
- Wrona D. Response of young apple trees to nitrogen fertilization on two different soils. Acta Hortic. 2006, 721, 153–158.
- Wrona, D. The influence of nitrogen fertilization on growth, yield and fruit size of ‘Jonagored’ apple trees. Acta Sci. Pol. Hortorum Cultus 2011, 10, 3–10.
- Kowalczyk, W.; Wrona, D.; Przybyłko, S. Effect of nitrogen fertilization of apple orchard on soil mineral nitrogen content, yielding of the apple trees and nutritional status of leaves and fruits. Agriculture 2022, 12, 2169.
- Wu, Y.; Wang, X.; Zhang, L.; Zheng, Y.; Liu, X.; Zhang, Y. The critical role of biochar to mitigate the adverse impacts of drought and salinity stress in plants. Front. Plant Sci. 2023, 14, 1163451.
- Sani, M.N.H.; Hasan, M.; Uddain, J.; Subramaniam, S. Impact of application of Trichoderma and biochar on growth, productivity and nutritional quality of tomato under reduced N-P-K fertilization. Ann. Agric. Sci. 2020, 65, 107–115.
Figure 1.
Diagram showing the application of biochar in surface spreading (A) and plough incorporation (B) treatments. Circles indicate the approximate canopy extent after the first year of apple tree growth in the orchard. Black dots correspond to tree trunks. Thick black outlines indicate experimental plots (single replicates), whilst grey filling corresponds to the area of biochar application.
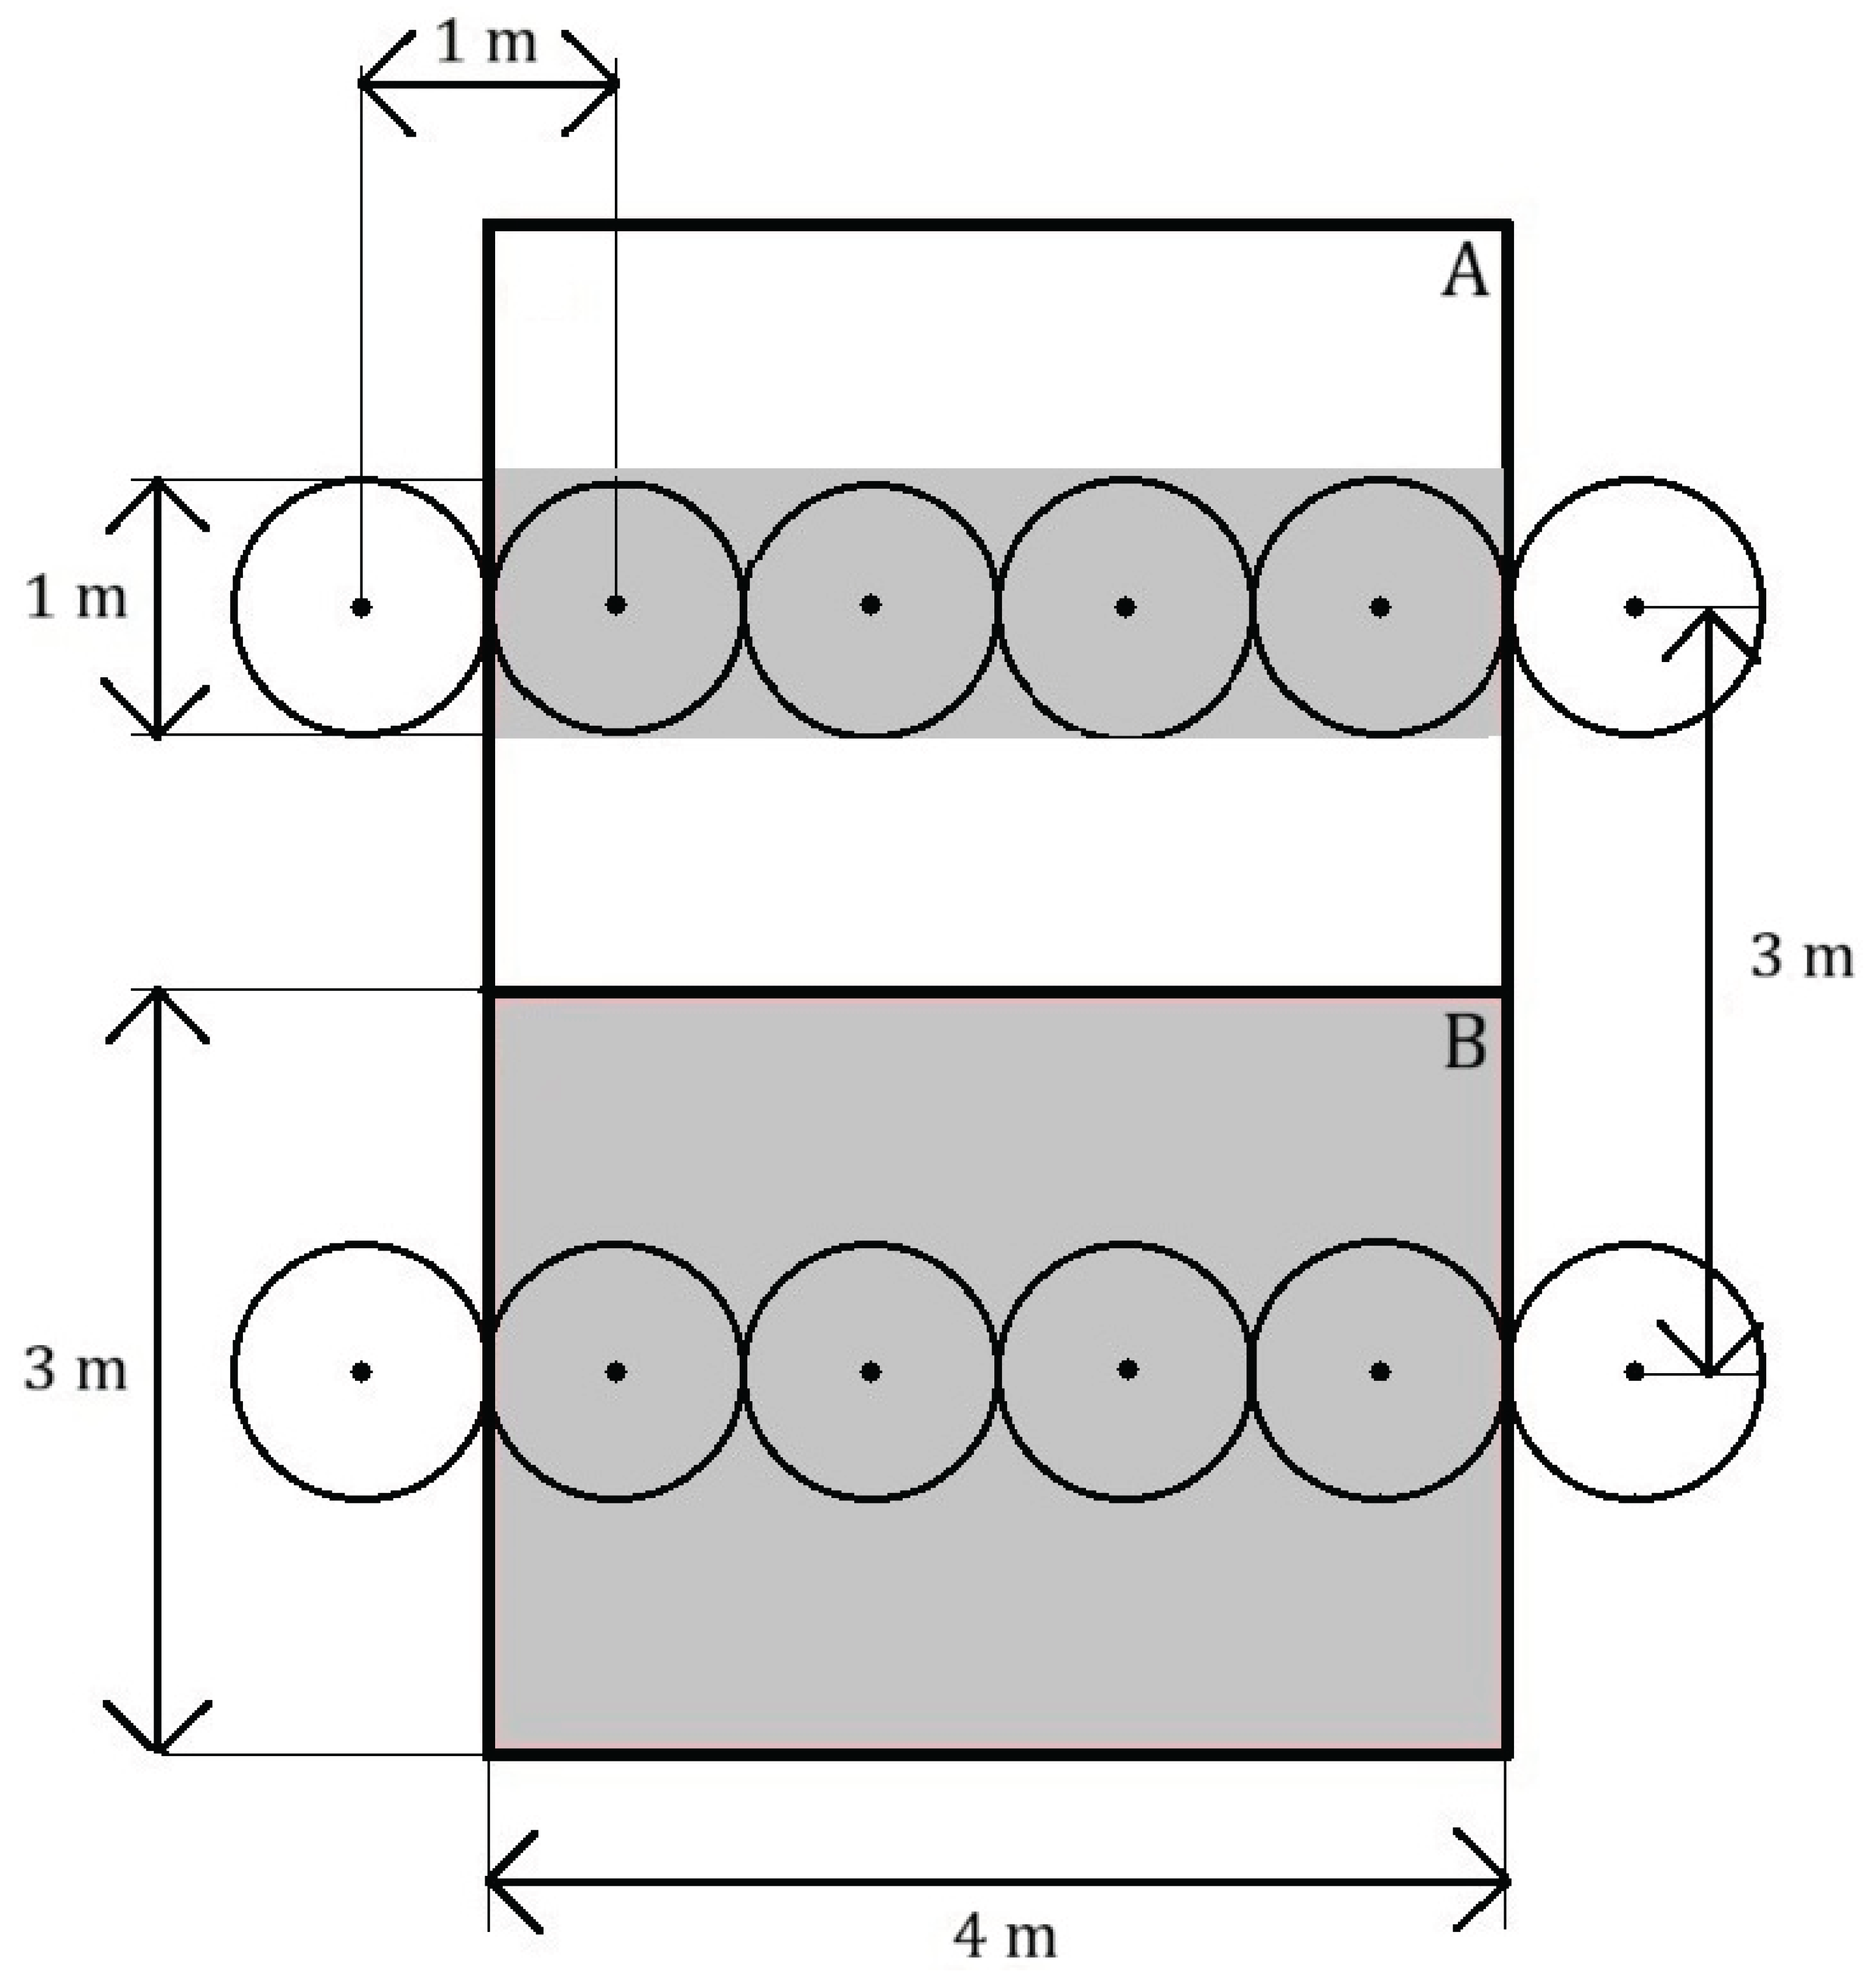
Figure 2.
Effects of biochar application methods and fertilisation regimes on the trunk circumference of apple trees measured 30 cm above the grafting site at the end of the first growing season after planting. The means (n = 3) are not significantly different (ANOVA, p = .39). Explanations: UTC – untreated control; N – nitrogen; BC – biochar; pi. – plough incorporation; ph. – planting-hole application; sa. – surface application.
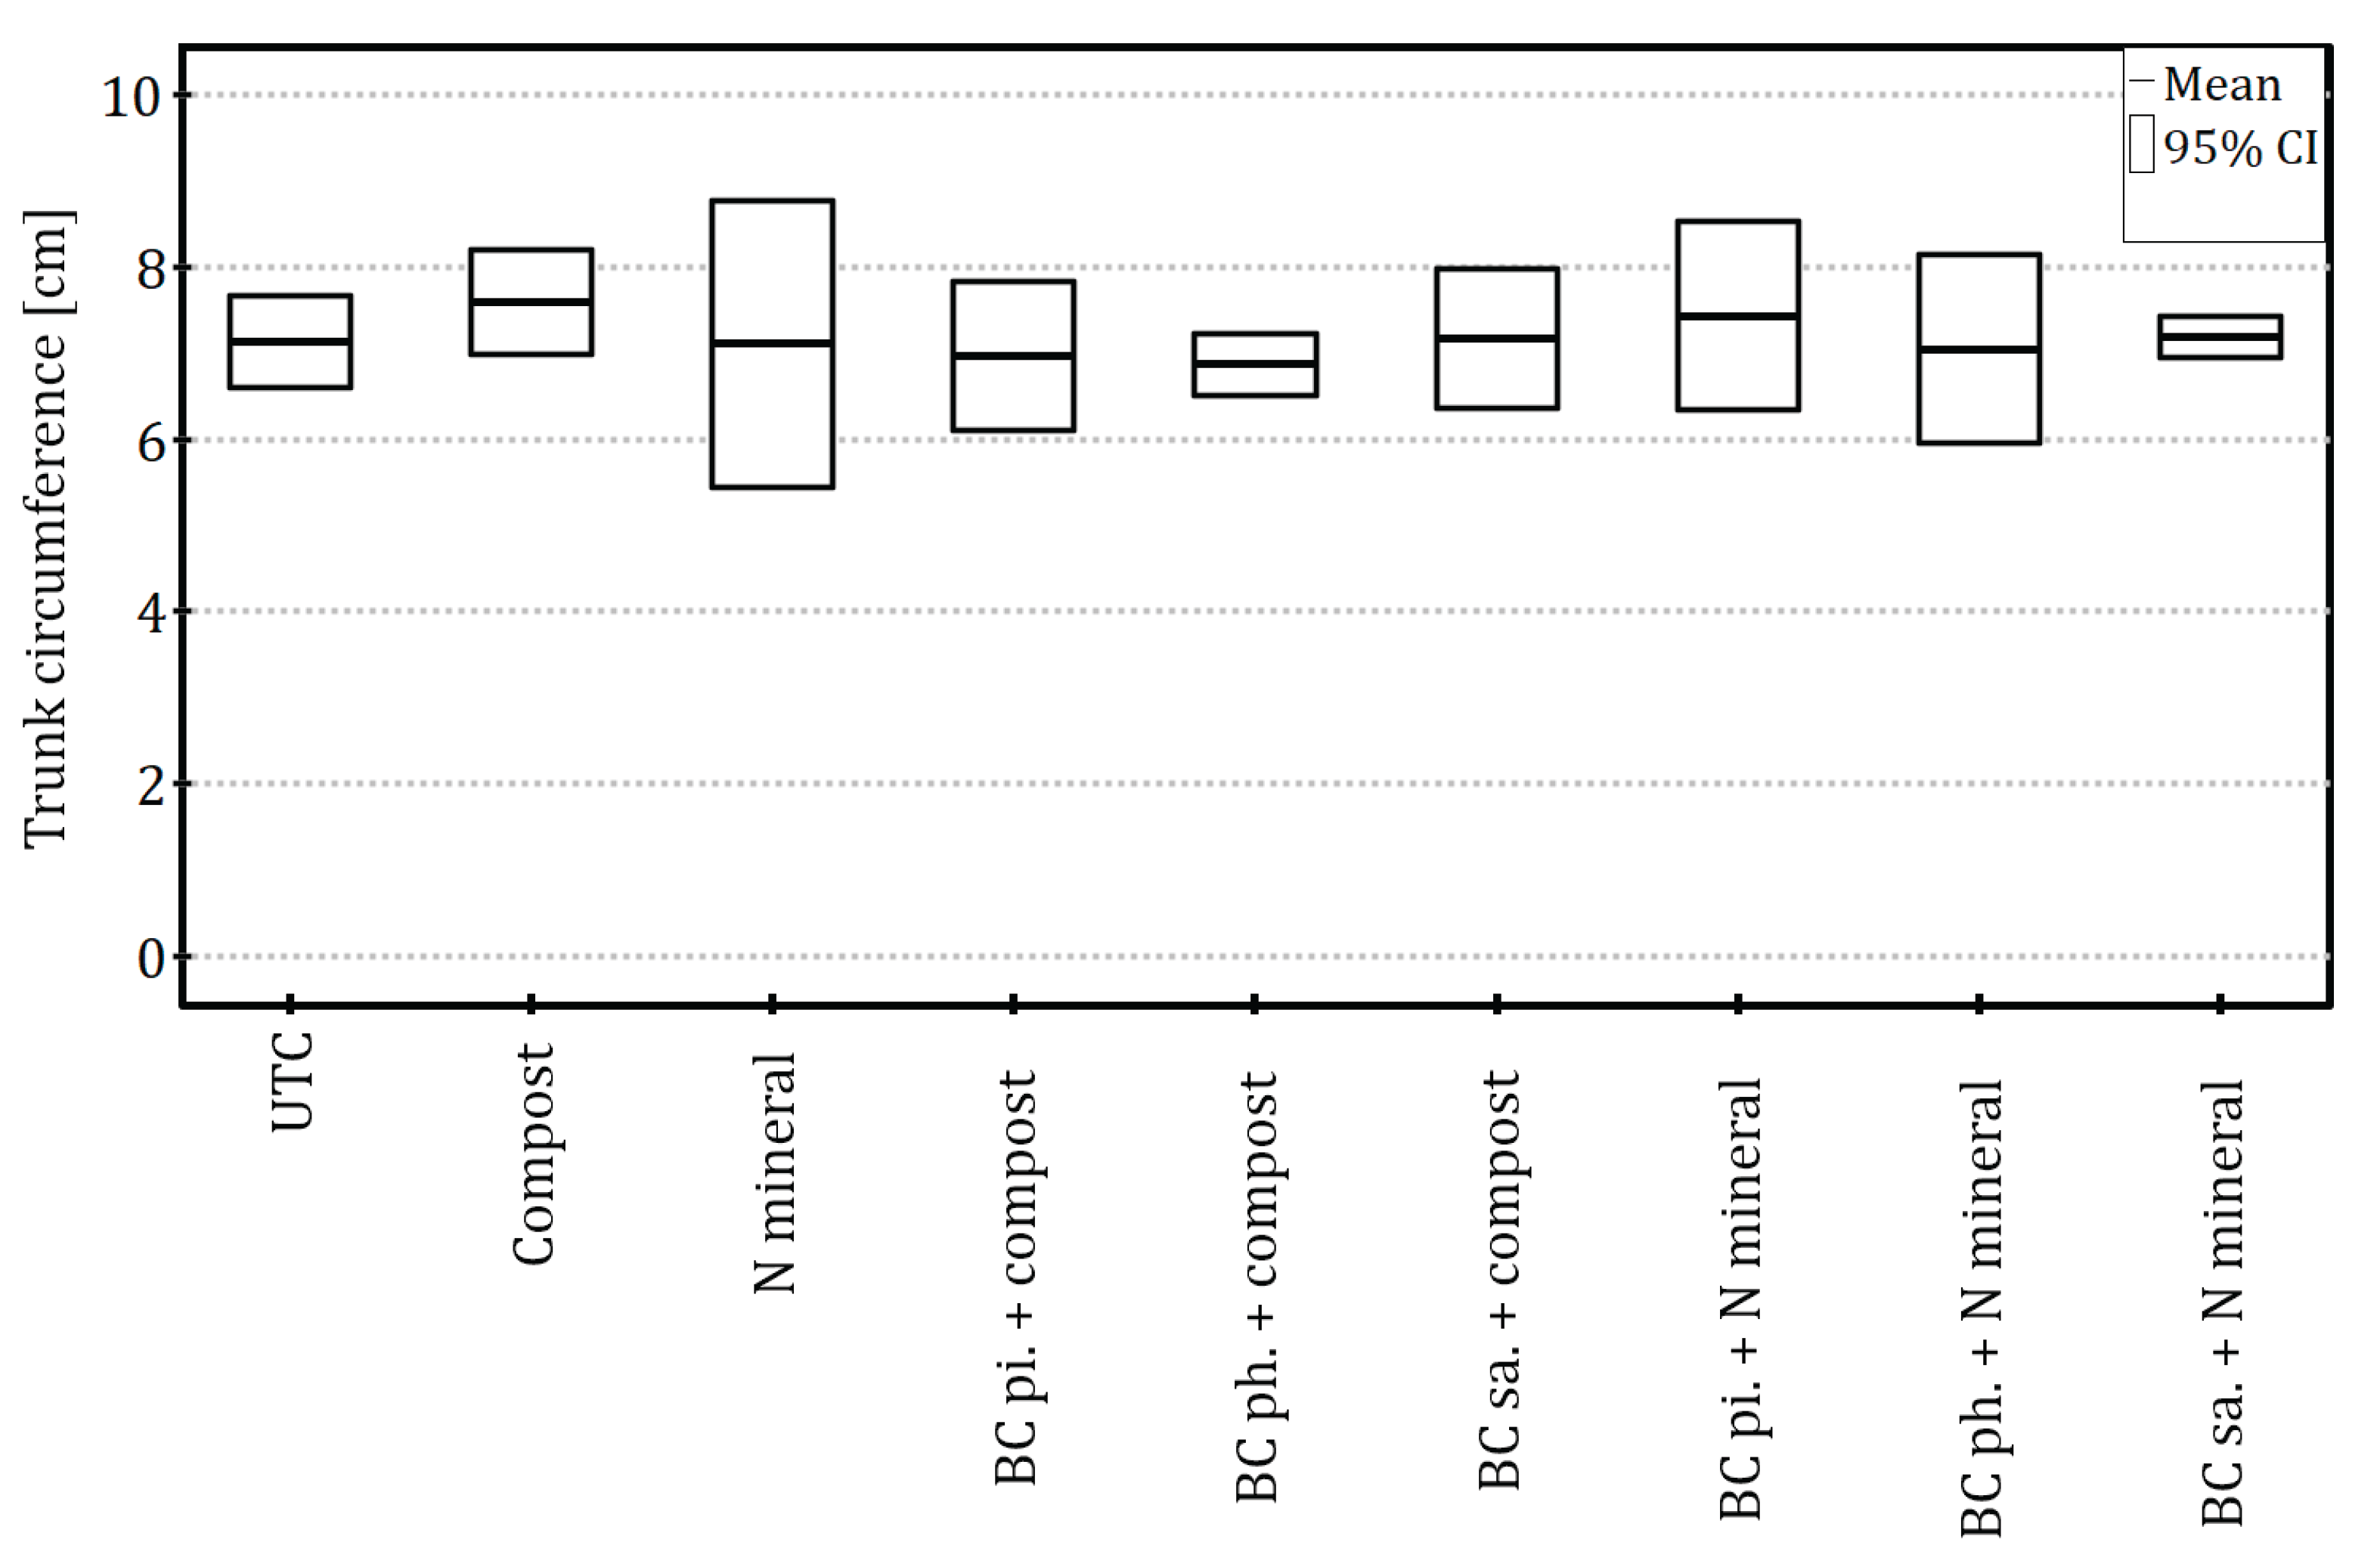
Figure 3.
Effects of biochar application methods and fertilisation regimes on the total length of current-year shoots of apple trees measured at the end of the first growing season after planting. The means (n = 3) are not significantly different (ANOVA, p = .29). Explanations: UTC – untreated control; N – nitrogen; BC – biochar; pi. – plough incorporation; ph. – planting-hole application; sa. – surface application.
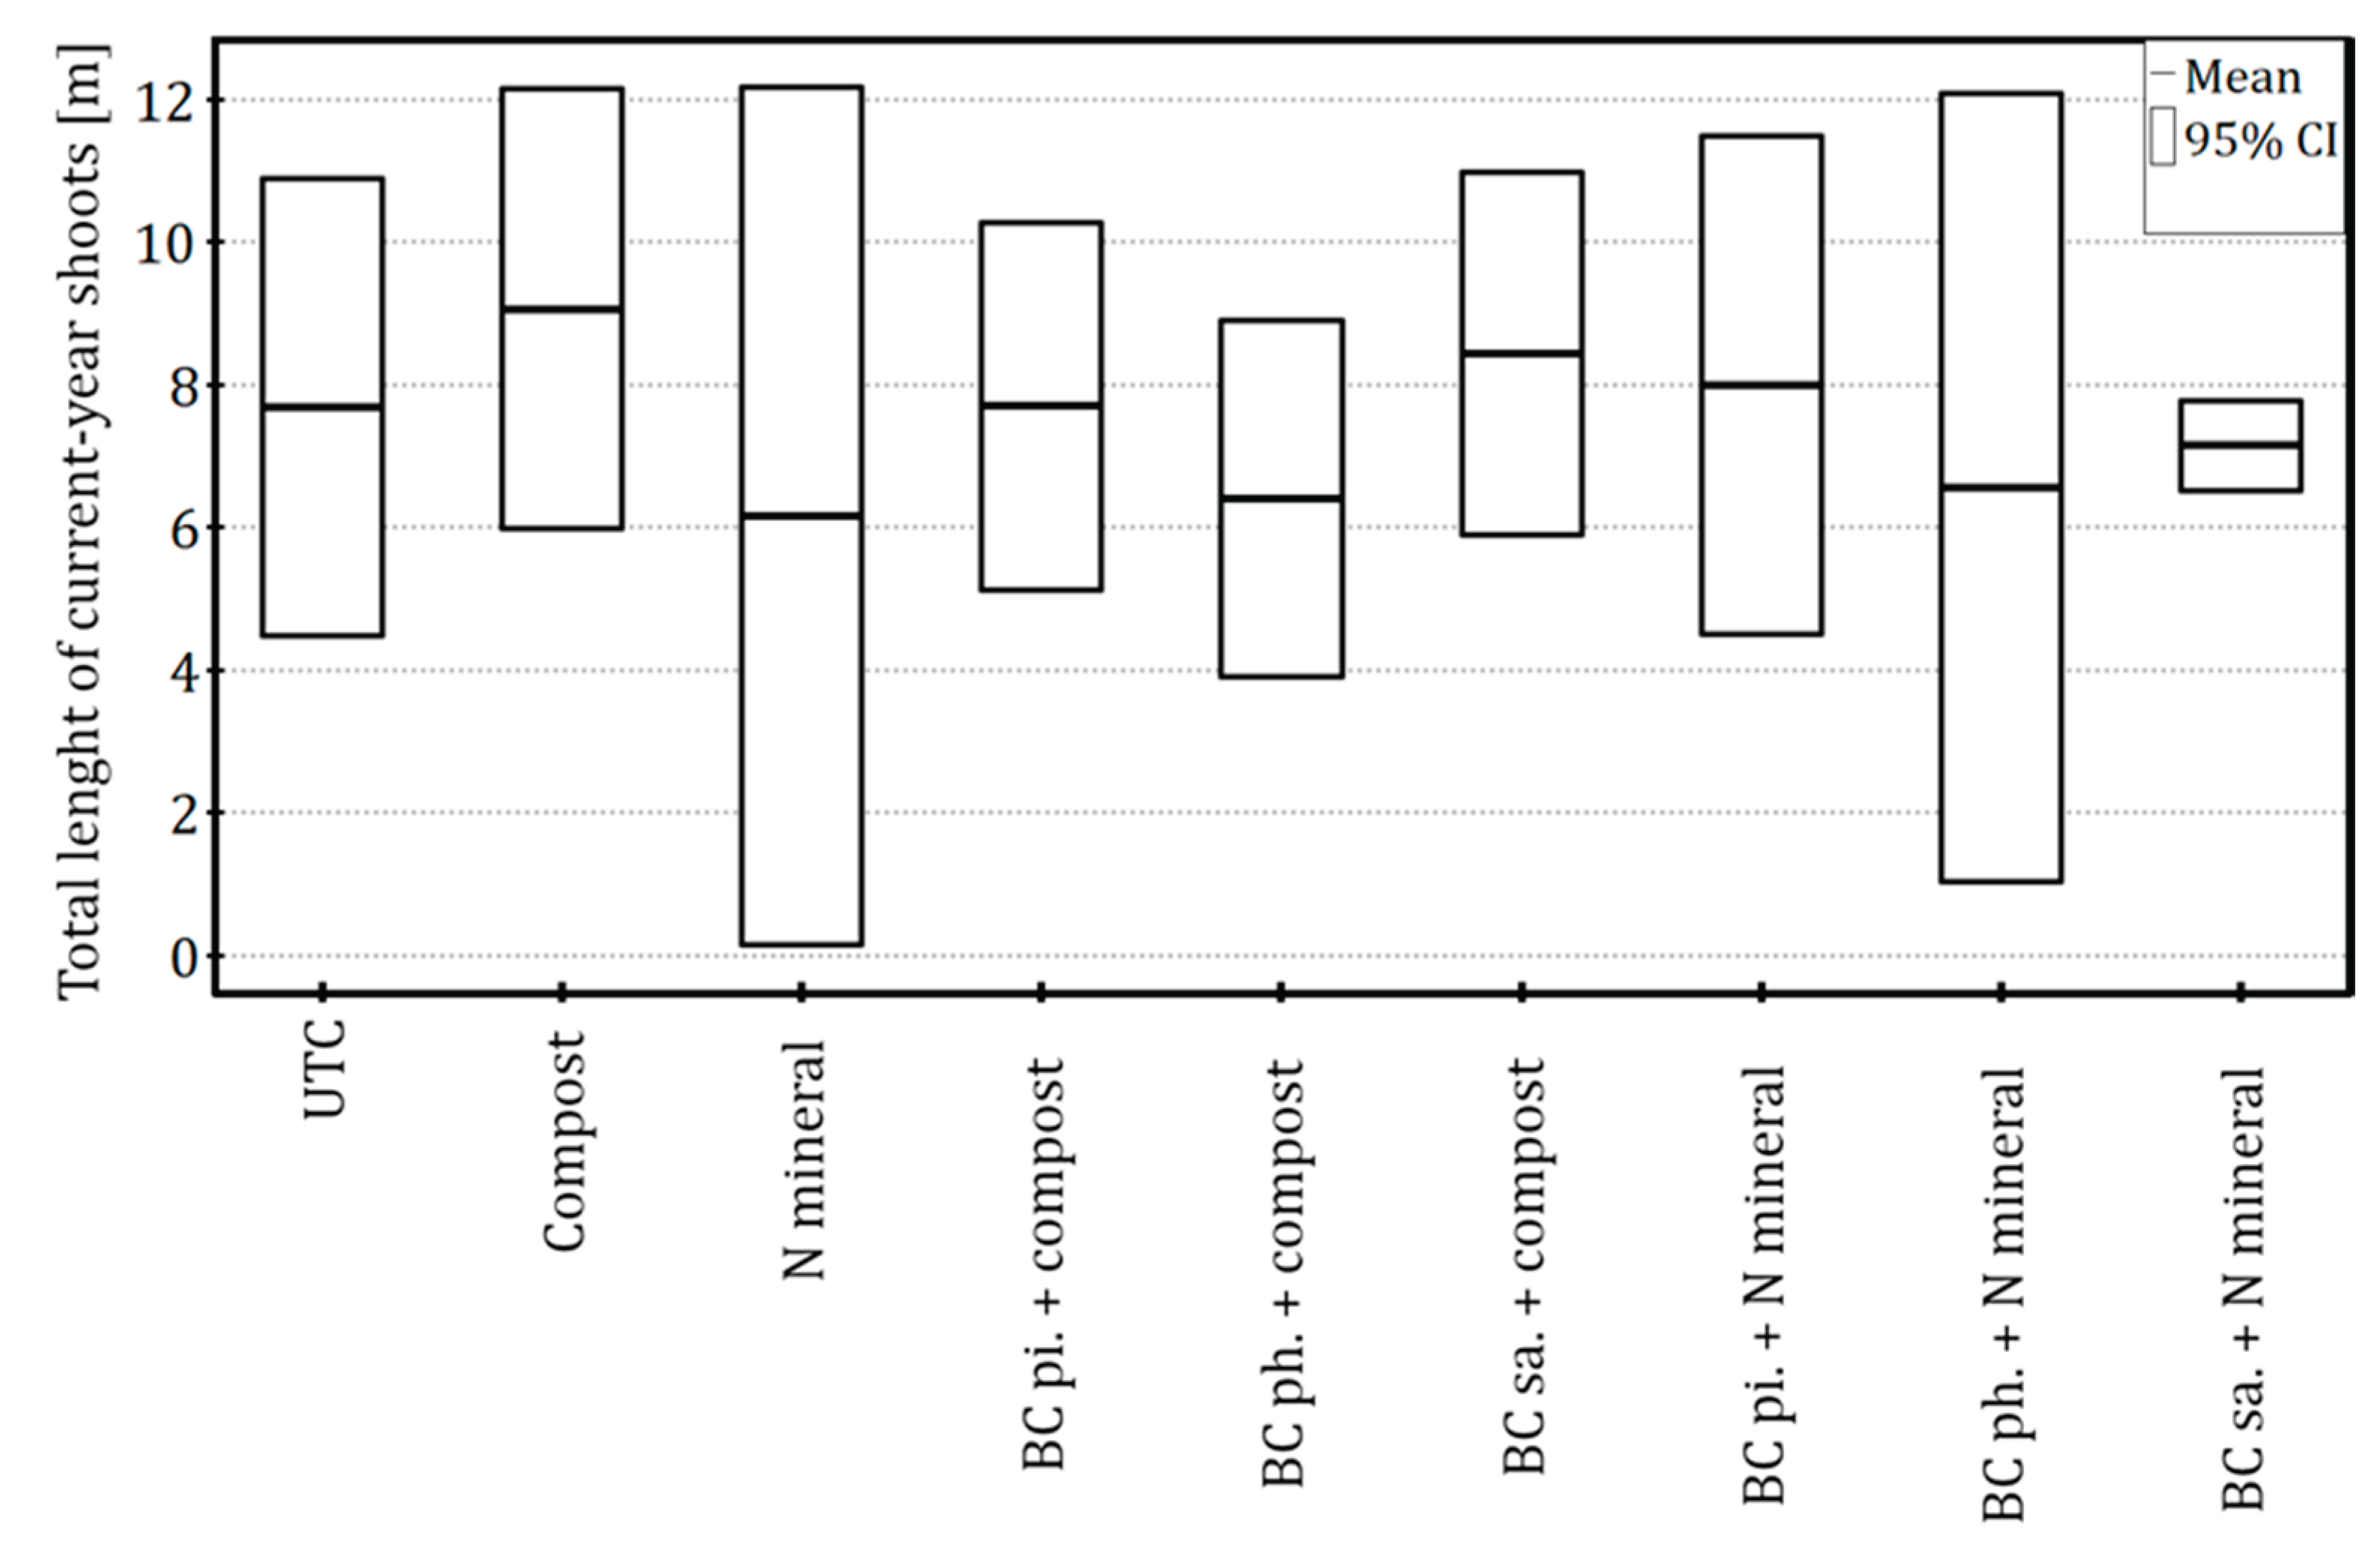
Figure 4.
Effects of biochar application methods and fertilisation regimes on the number of long shoots of apple trees in the first growing season after planting. The means (n = 3) are not significantly different (ANOVA, p = .87). Explanations: UTC – untreated control; N – nitrogen; BC – biochar; pi. – plough incorporation; ph. – planting-hole application; sa. – surface application.
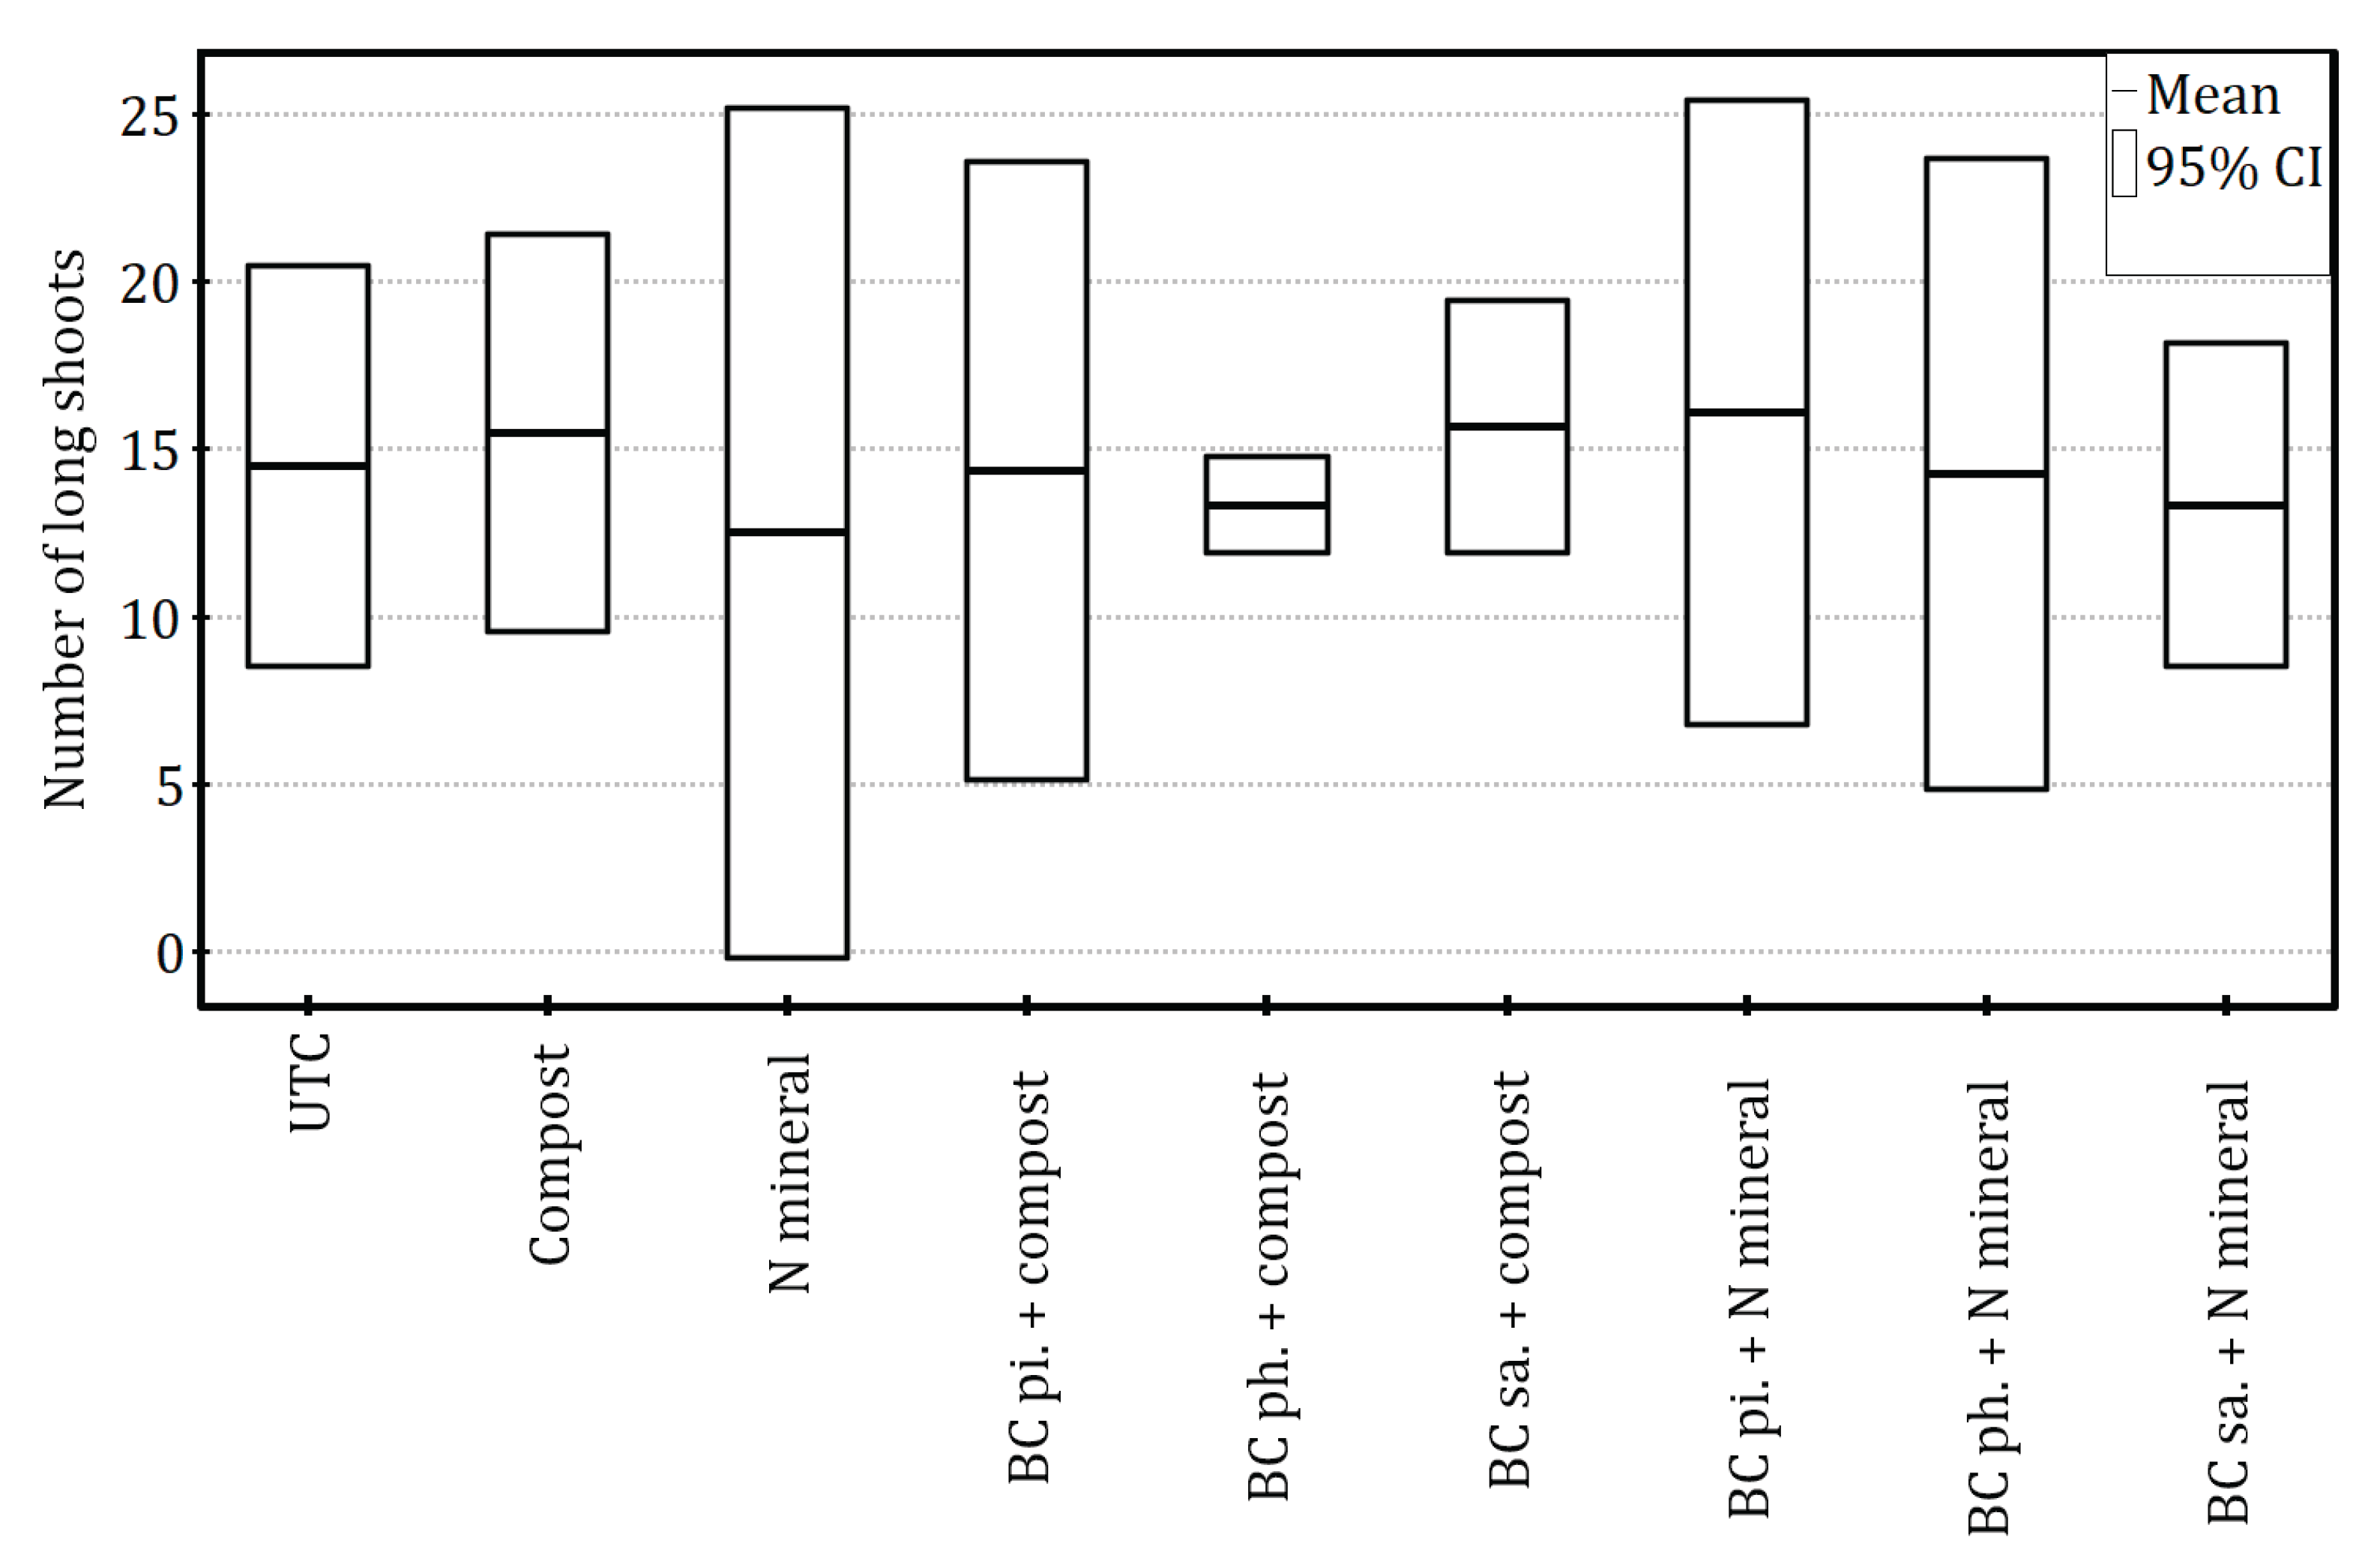
Figure 5.
Effects of biochar application methods and fertilisation regimes on the number of short shoots of apple trees in the first growing season after planting. The means (n = 3) sharing the same letter are not significantly different, according to one-way ANOVA followed by the Tukey HSD test (α = .05). Explanations: UTC – untreated control; N – nitrogen; BC – biochar; pi. – plough incorporation; ph. – planting-hole application; sa. – surface application.
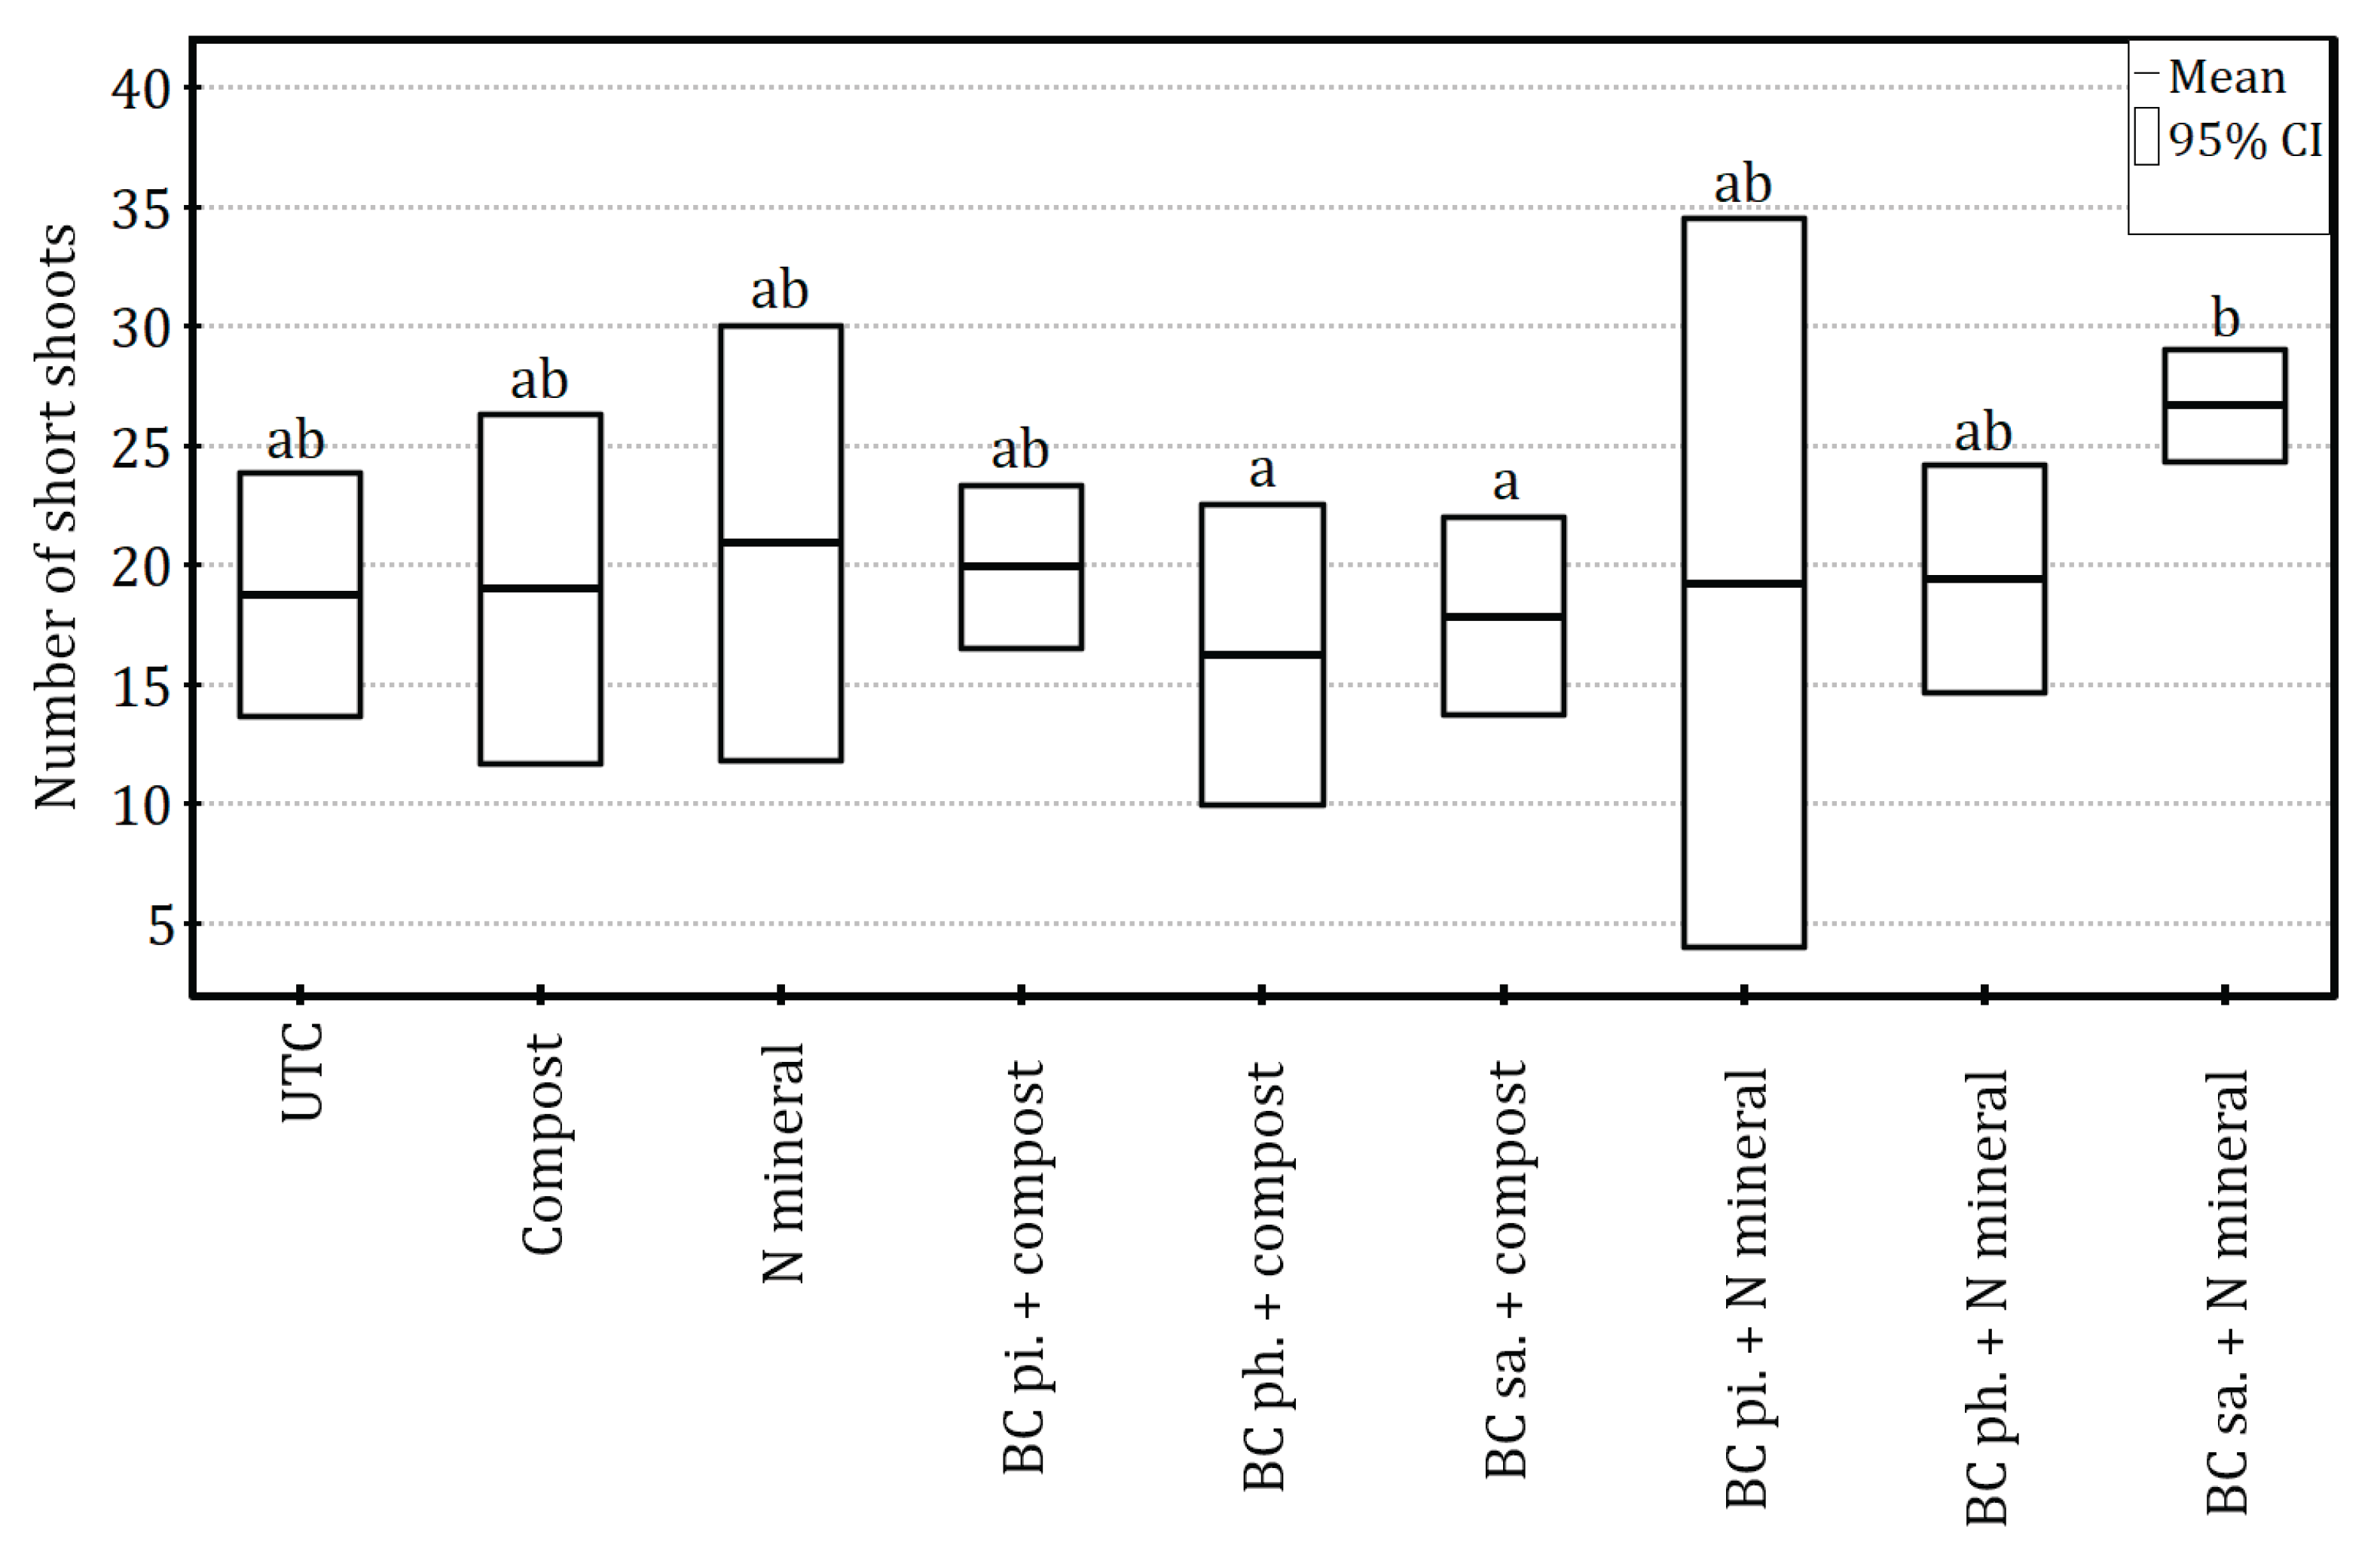
Figure 6.
Effects of biochar application methods and fertilisation regimes on the number of mixed-type buds of apple trees counted at the end of the first growing season after planting. The medians (n = 3) are not significantly different (Kruskal-Wallis test, p = .10). Explanations: UTC – untreated control; N – nitrogen; BC – biochar; pi. – plough incorporation; ph. – planting-hole application; sa. – surface application.
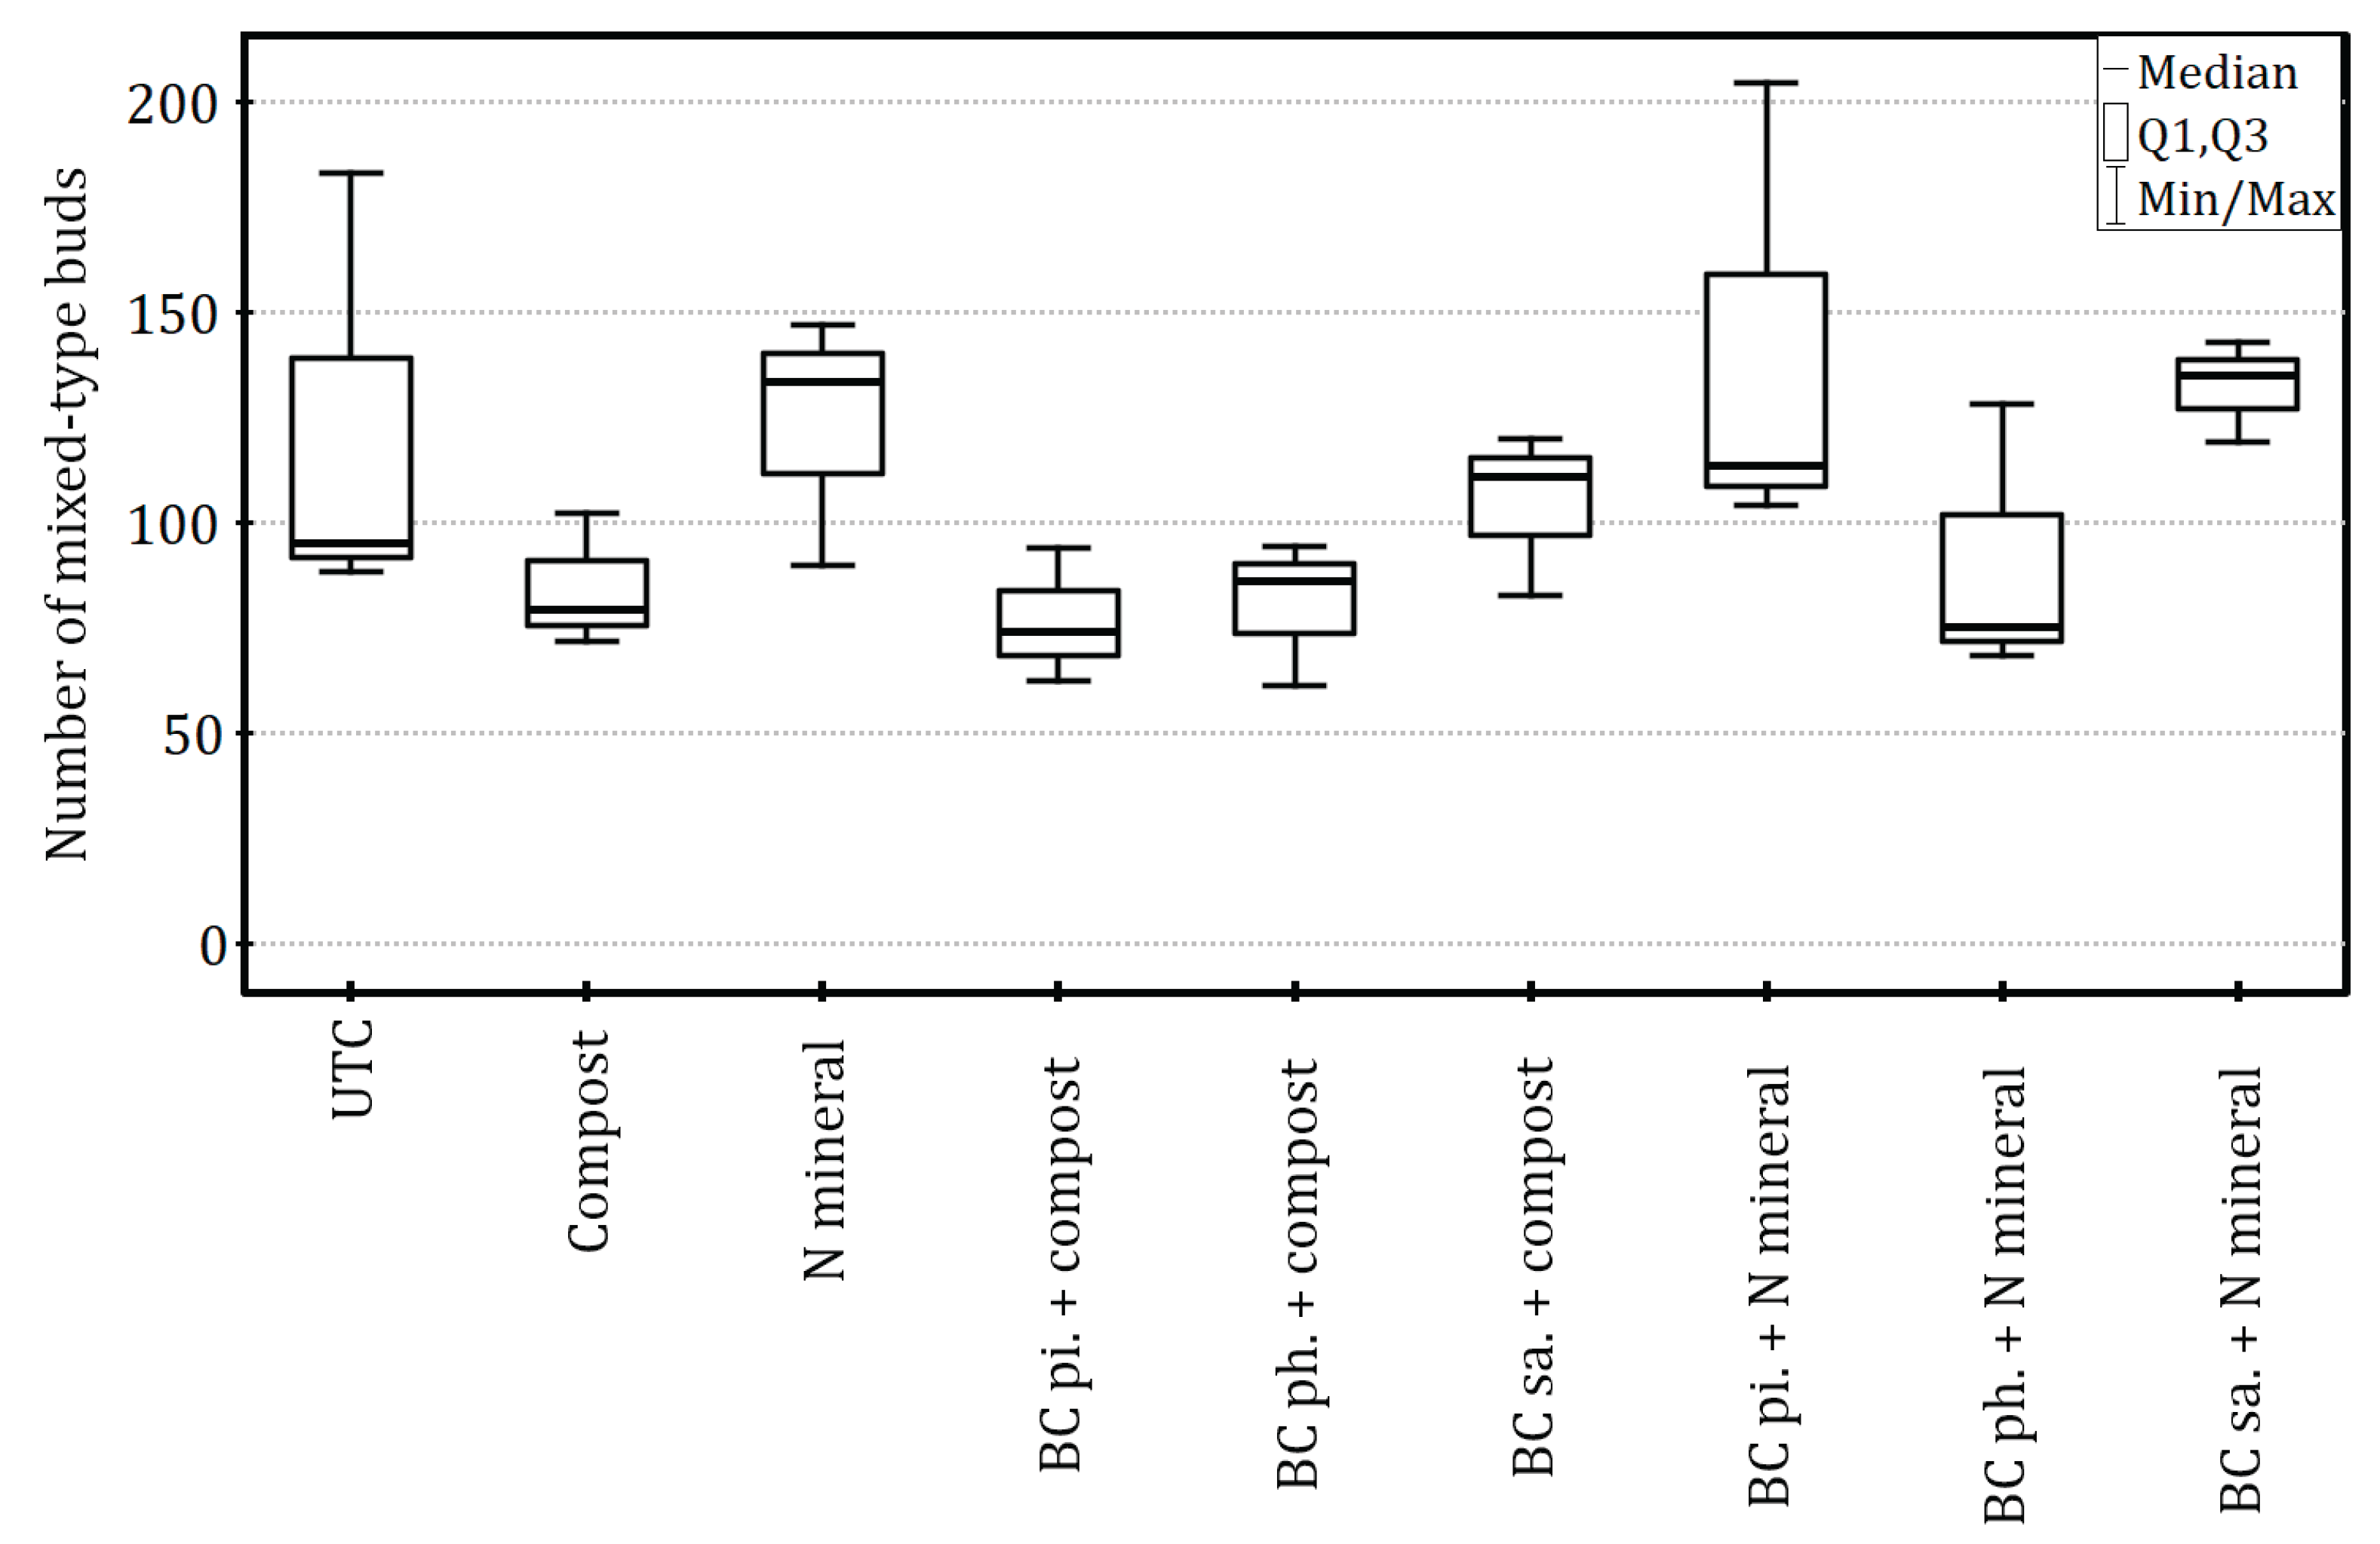
Figure 7.
Growth-related fruiting potential of apple trees expressed in the ratio of mixed-type buds to trunk cross sectional area (TCSA) as affected by different biochar application methods and fertilisation regimes. The means (n = 3) sharing the same letter are not significantly different, according to one-way ANOVA with Welch’s F” correction followed by the Games-Howell test (α = .05). Explanations: UTC – untreated control; N – nitrogen; BC – biochar; pi. – plough incorporation; ph. – planting-hole application; sa. – surface application.
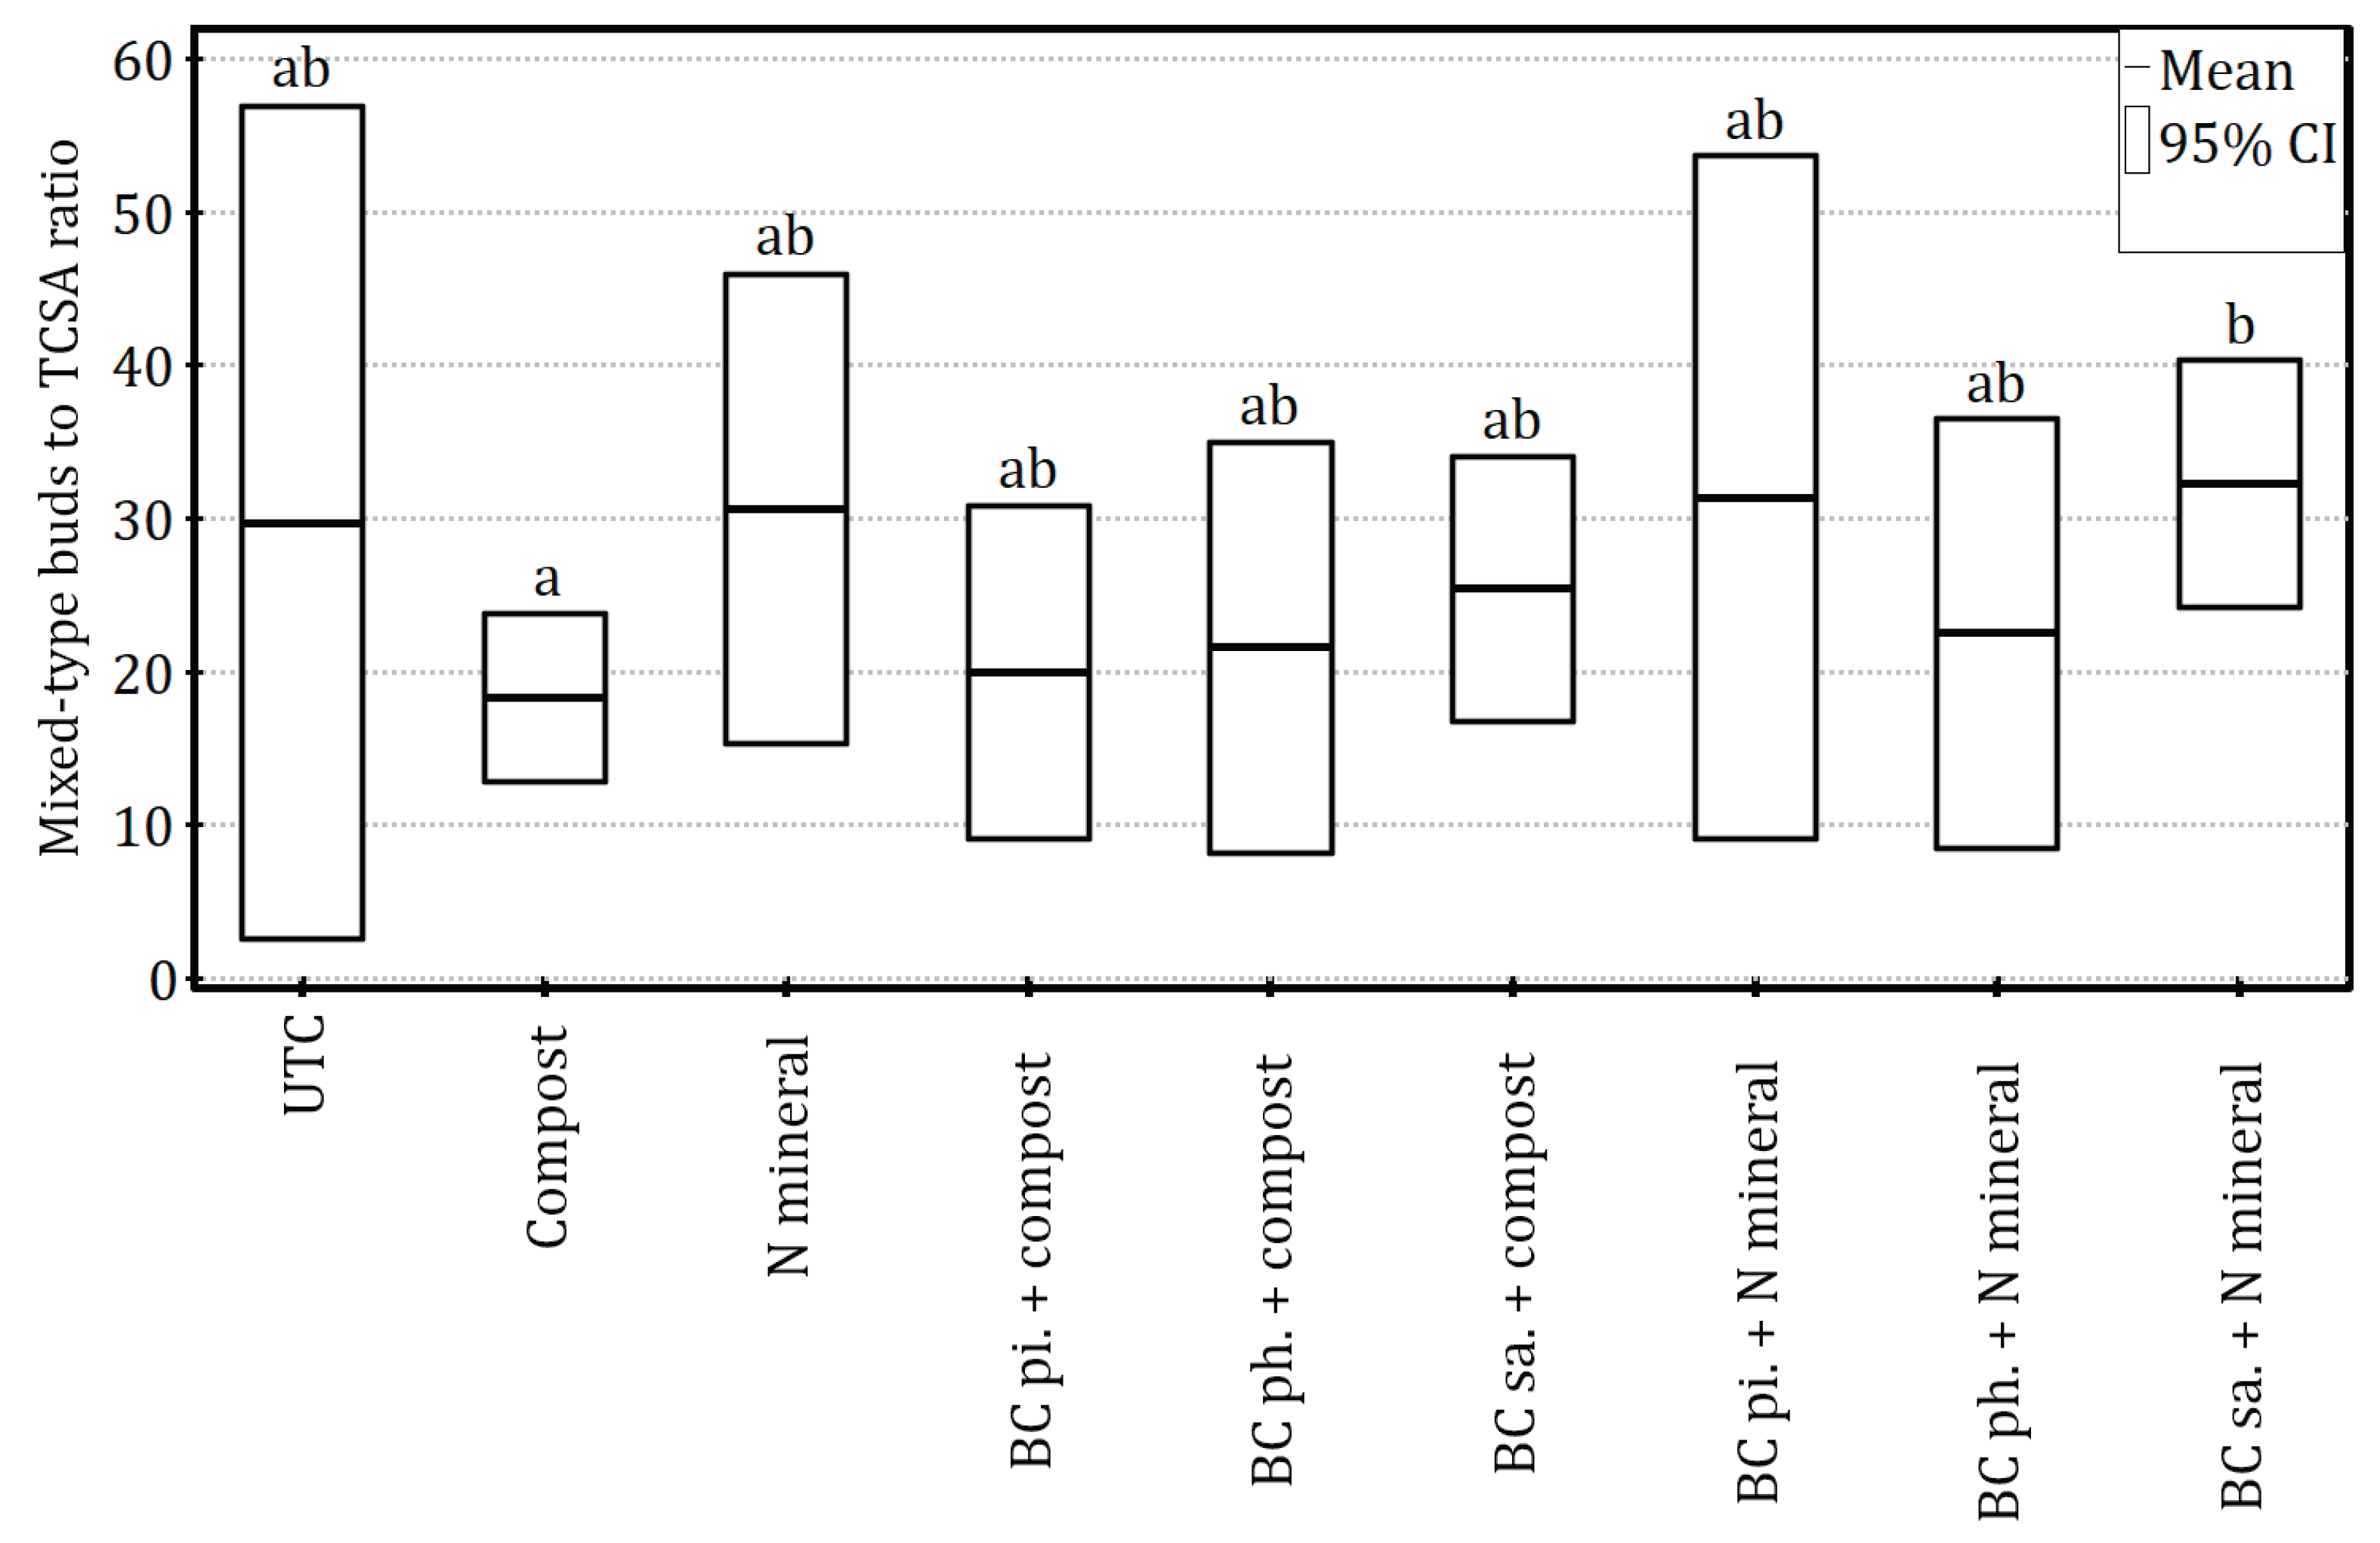
Figure 8.
Effects of biochar application methods and fertilisation regimes on the apple tree leaf area. The means (n = 3) are not significantly different (ANOVA, p = .87). Explanations: UTC – untreated control; N – nitrogen; BC – biochar; pi. – plough incorporation; ph. – planting-hole application; sa. – surface application.
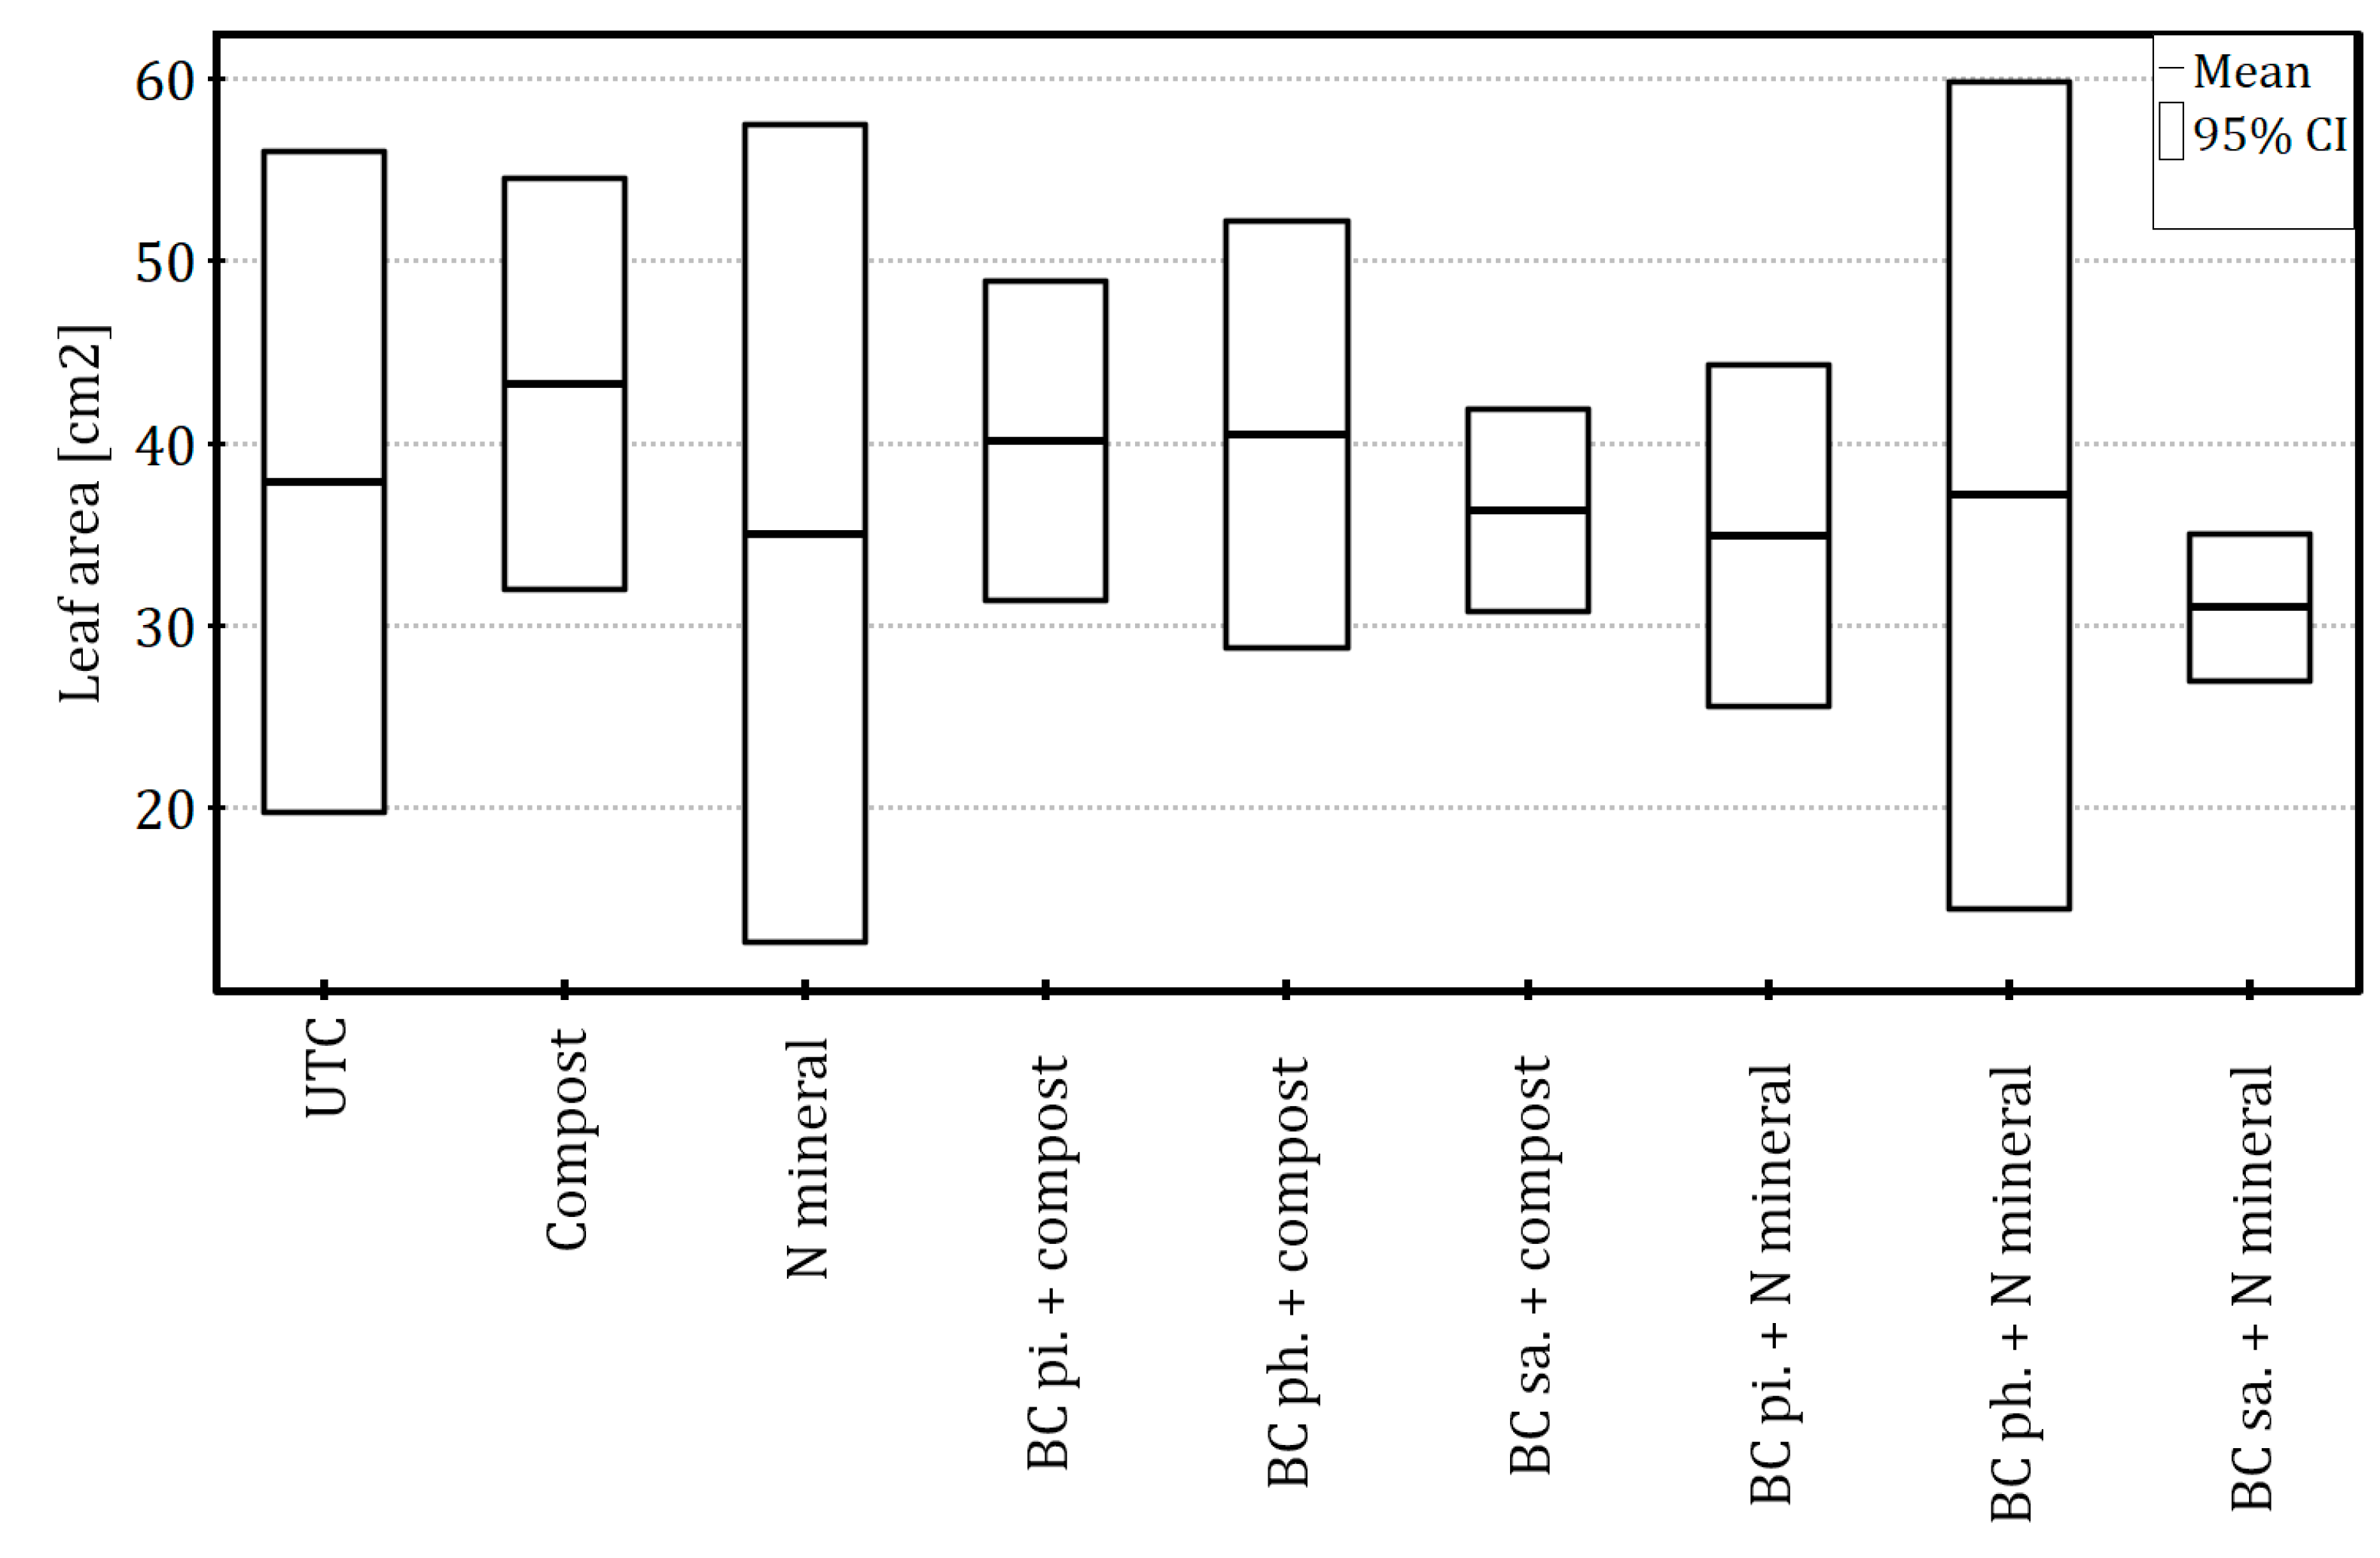
Figure 9.
Effects of biochar application methods and fertilisation regimes on the apple leaf dry matter. The medians (n = 3) are not significantly different (Kruskal-Wallis test, p = .38). Explanations: UTC – untreated control; N – nitrogen; BC – biochar; pi. – plough incorporation; ph. – planting-hole application; sa. – surface application.
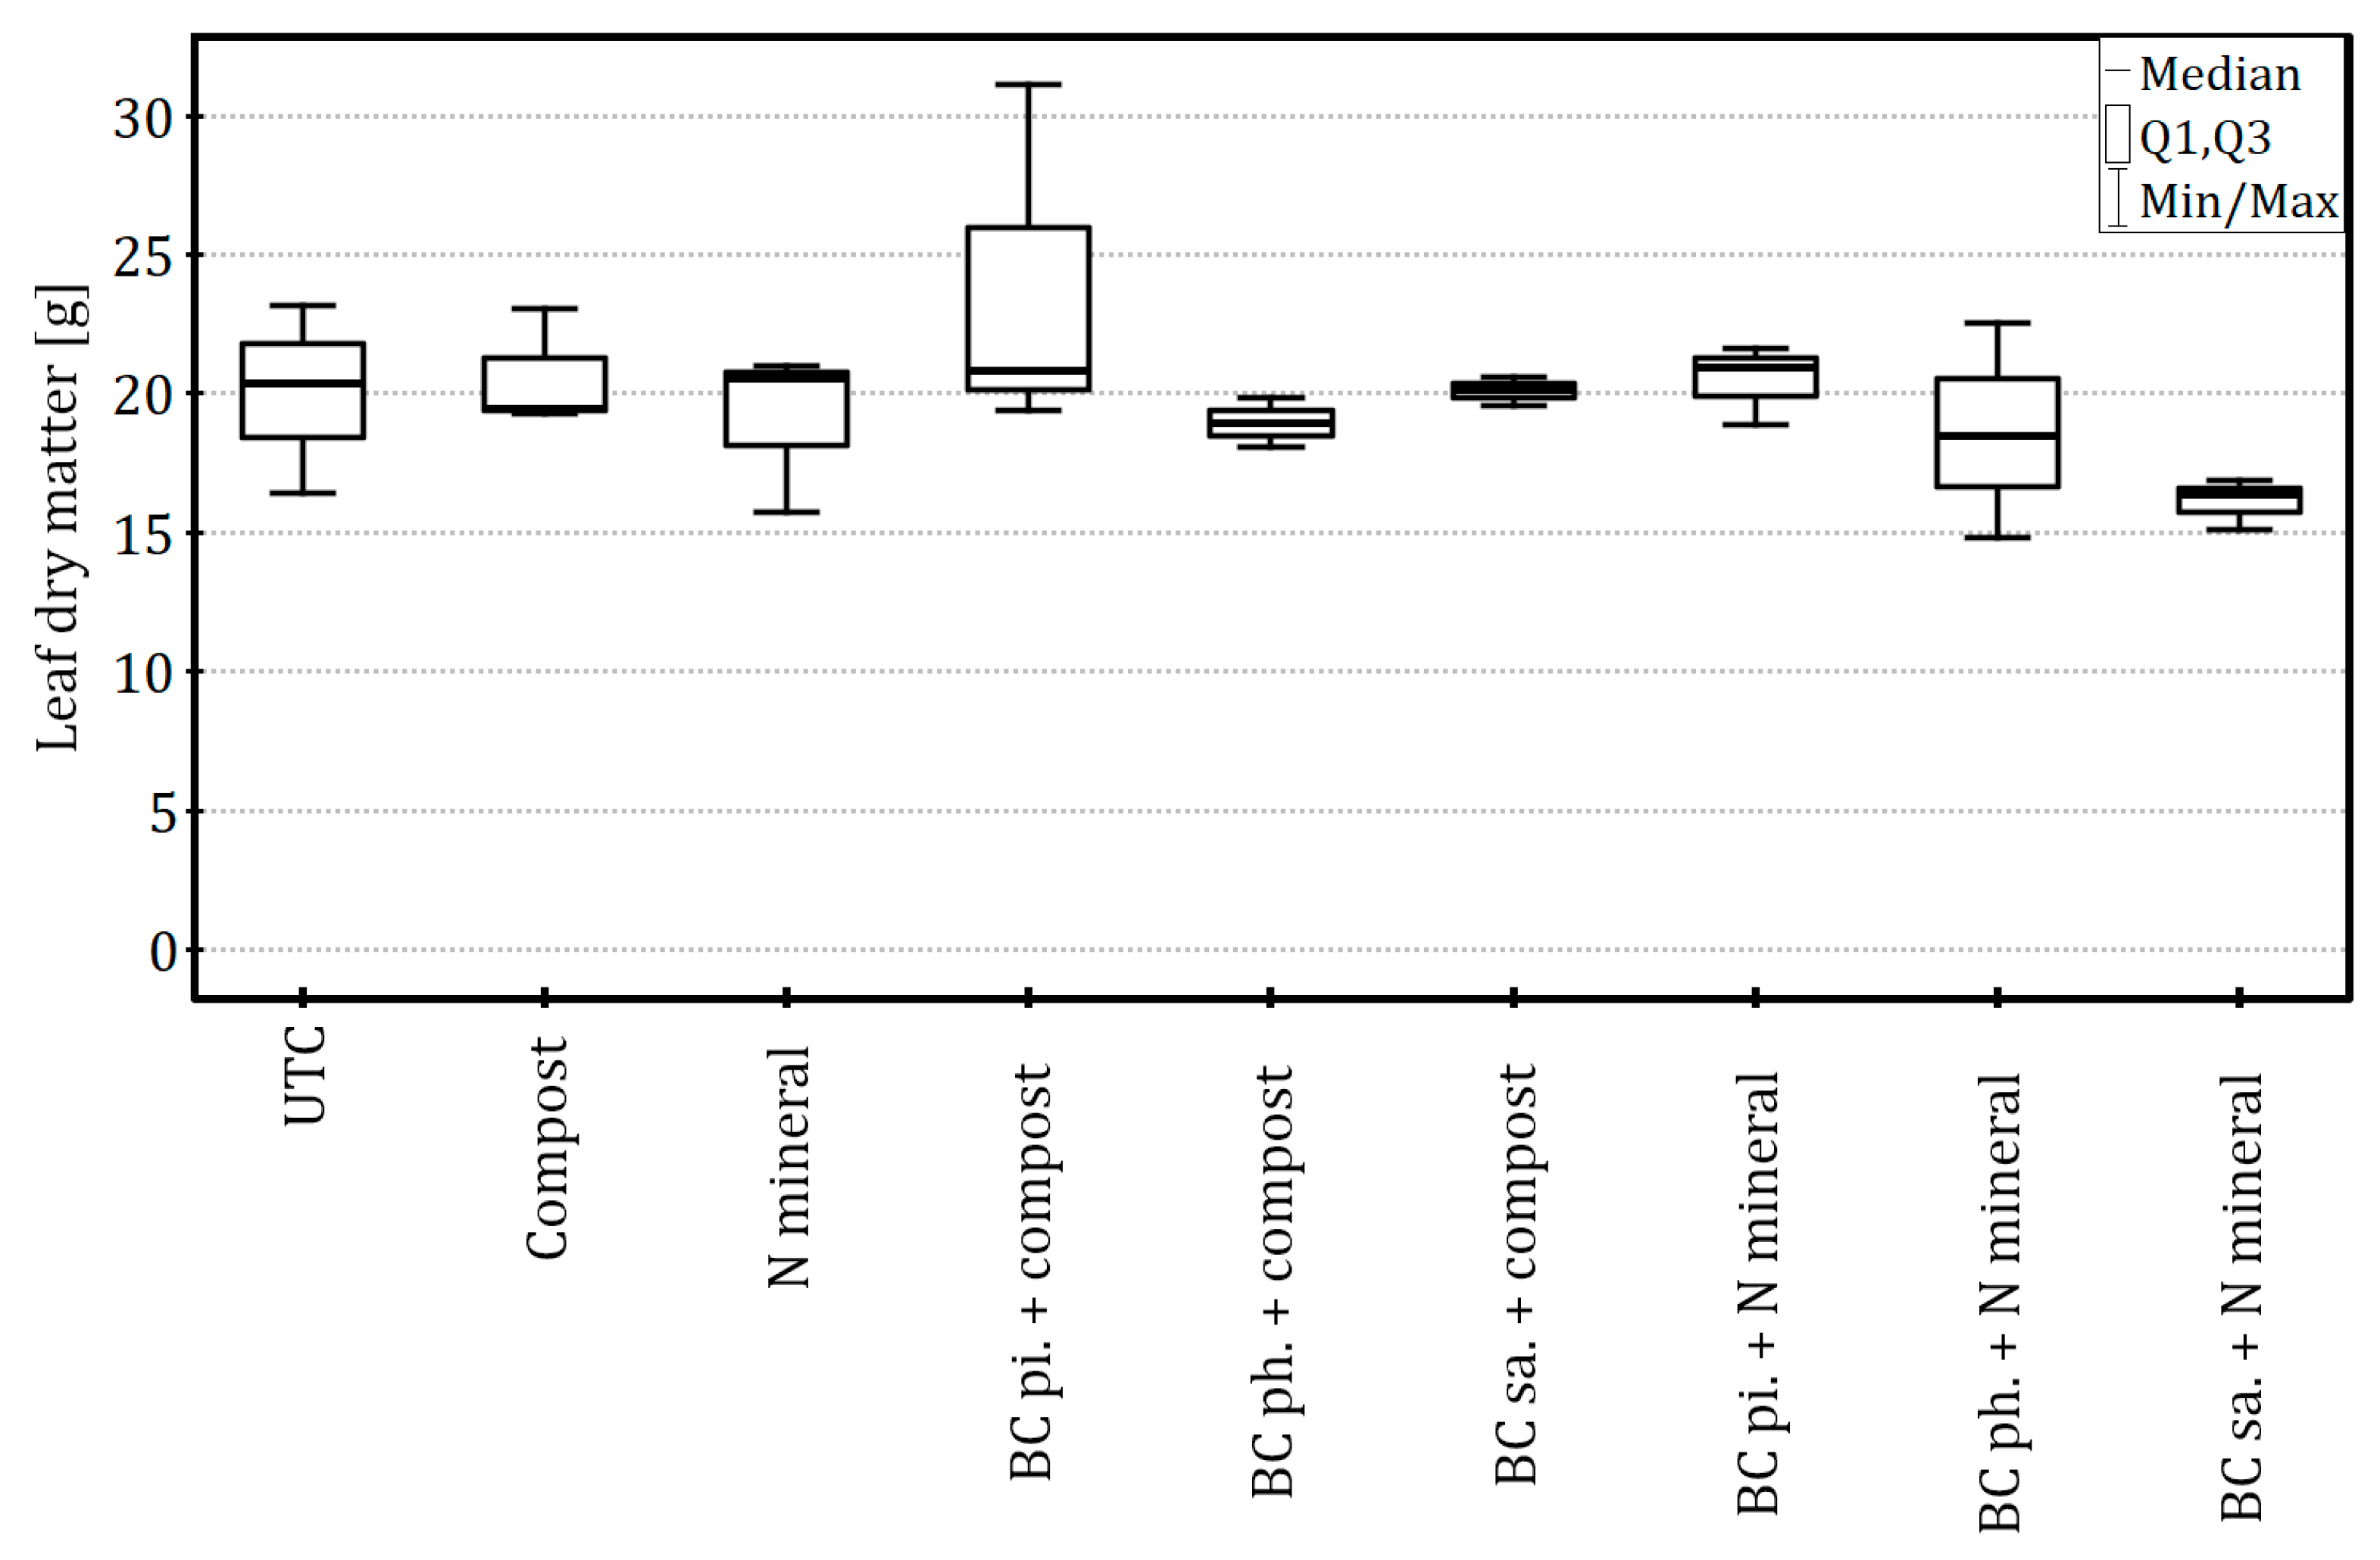
Figure 10.
Decrease in eigenvalues (Y-axis) or increase in the percentage of explained data variability (labelled next to each point) by successive principal components (PC1–PC7). The bold horizontal dashed line indicates the threshold of 80% cumulative variance explained.
Figure 10.
Decrease in eigenvalues (Y-axis) or increase in the percentage of explained data variability (labelled next to each point) by successive principal components (PC1–PC7). The bold horizontal dashed line indicates the threshold of 80% cumulative variance explained.
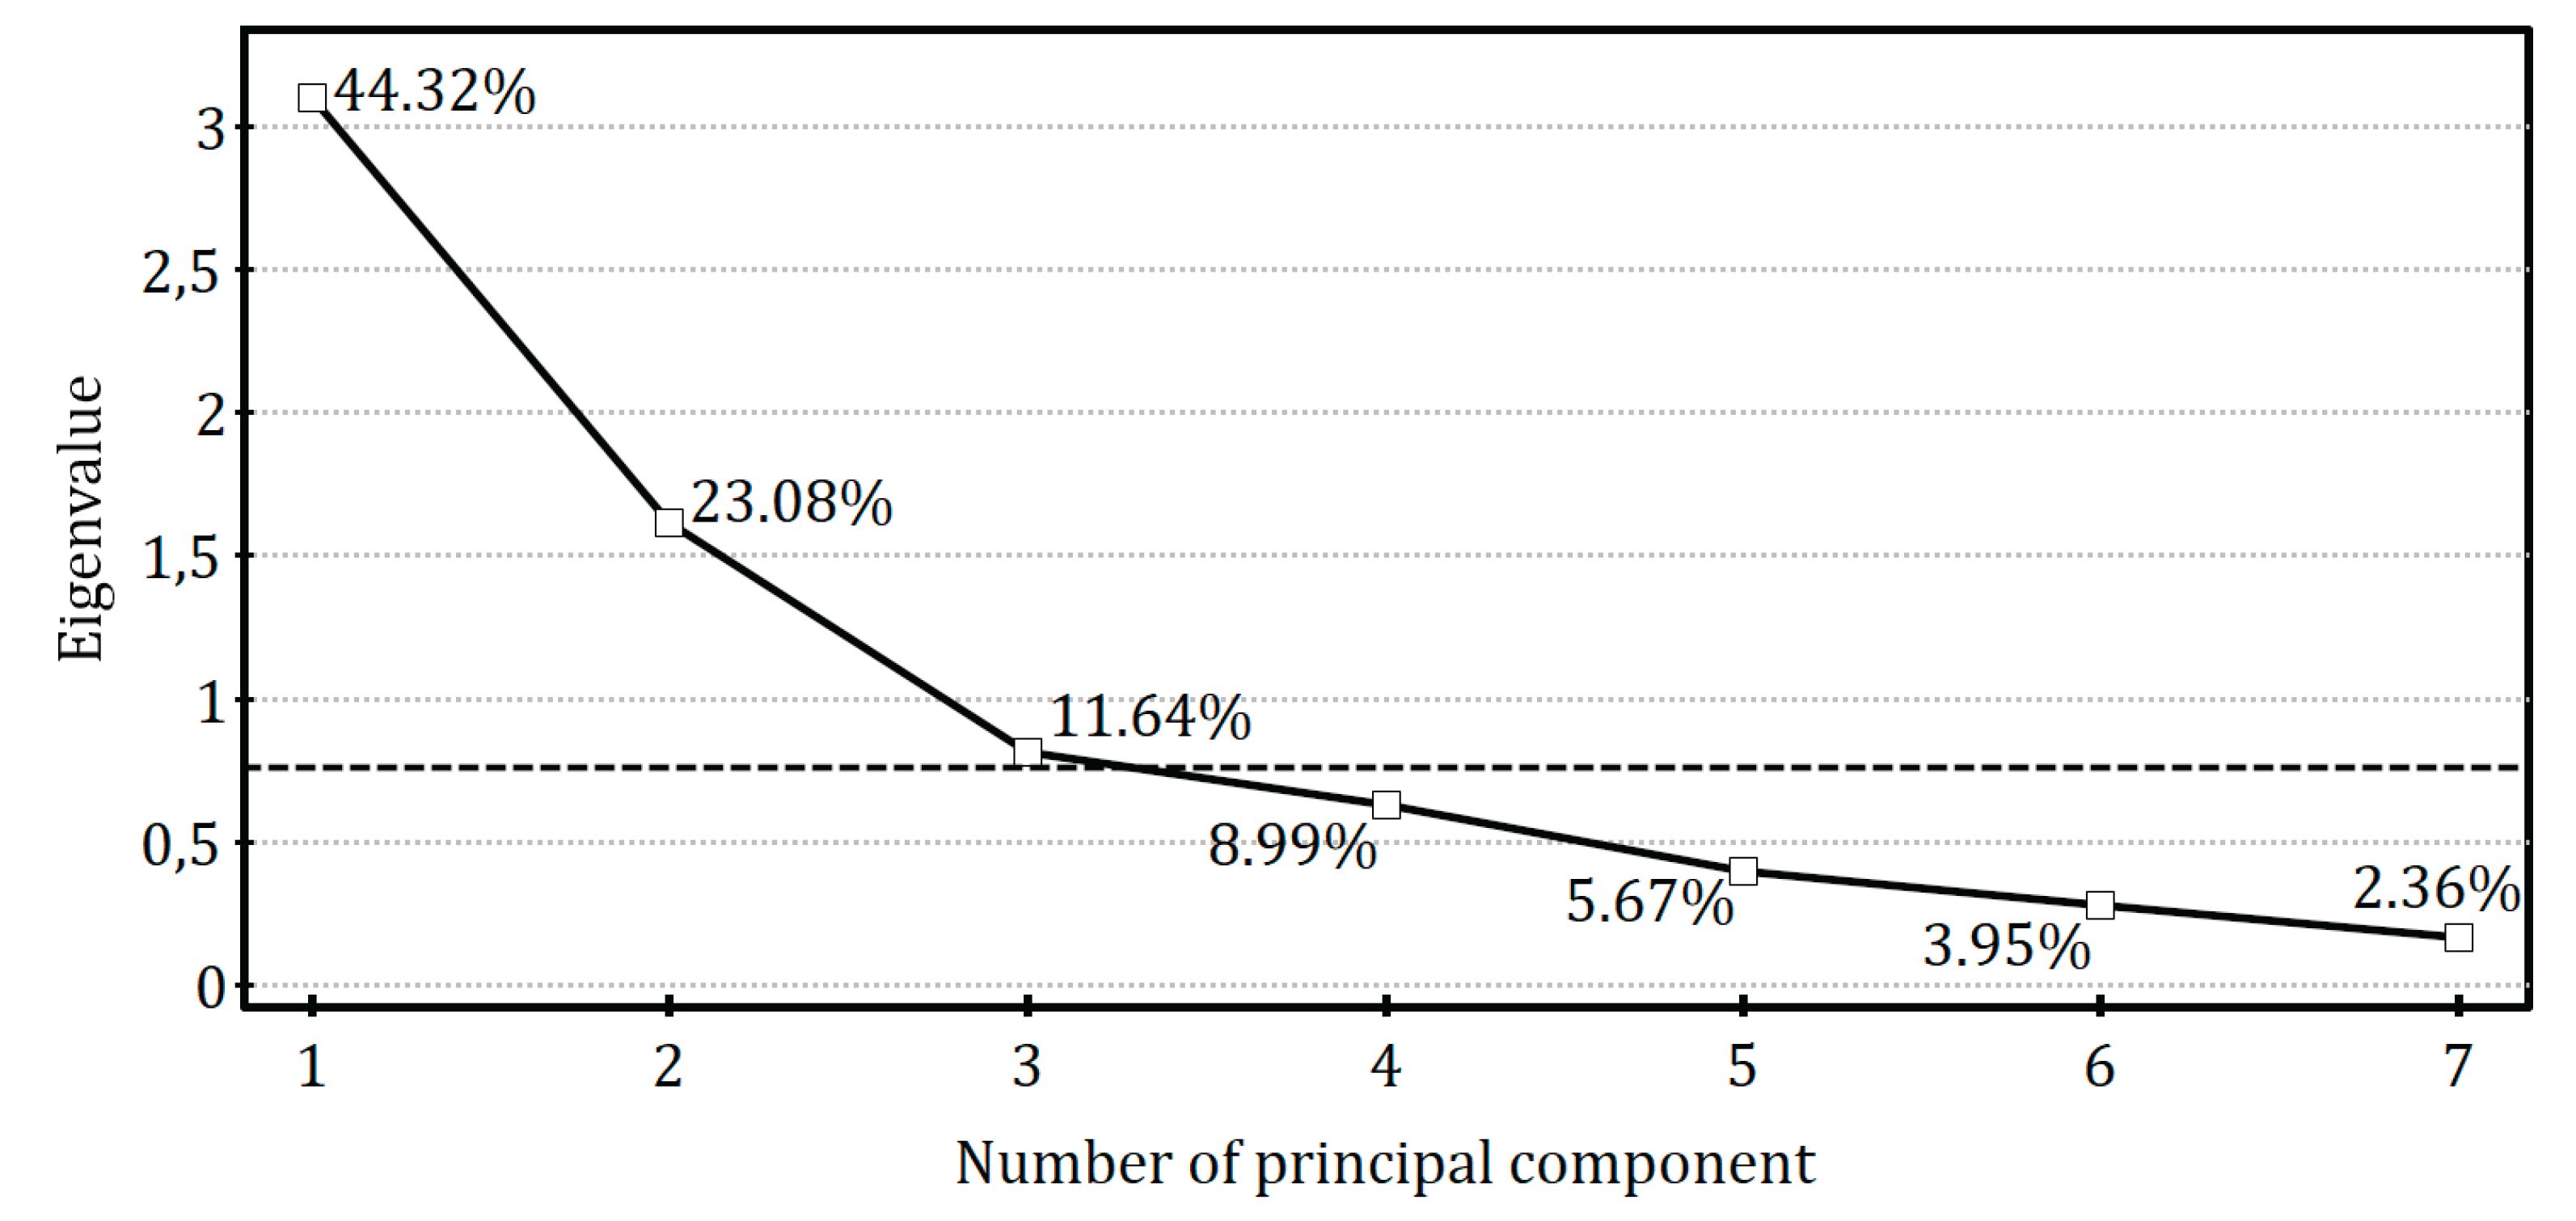
Figure 11.
Results of principal component analysis (PCA) in the space defined by the first and second principal components (panel A), and the first and third components (panel B). The percentage of variance in the original data explained by each component is given in brackets. The points represent measurements at the level of individual trees, with group affiliation specified in the legend. The vectors represent the original variables included in the analysis. Explanations: UTC – untreated control; N – nitrogen; BC – biochar; pi. – plough incorporation; ph. – planting-hole application; sa. – surface application.
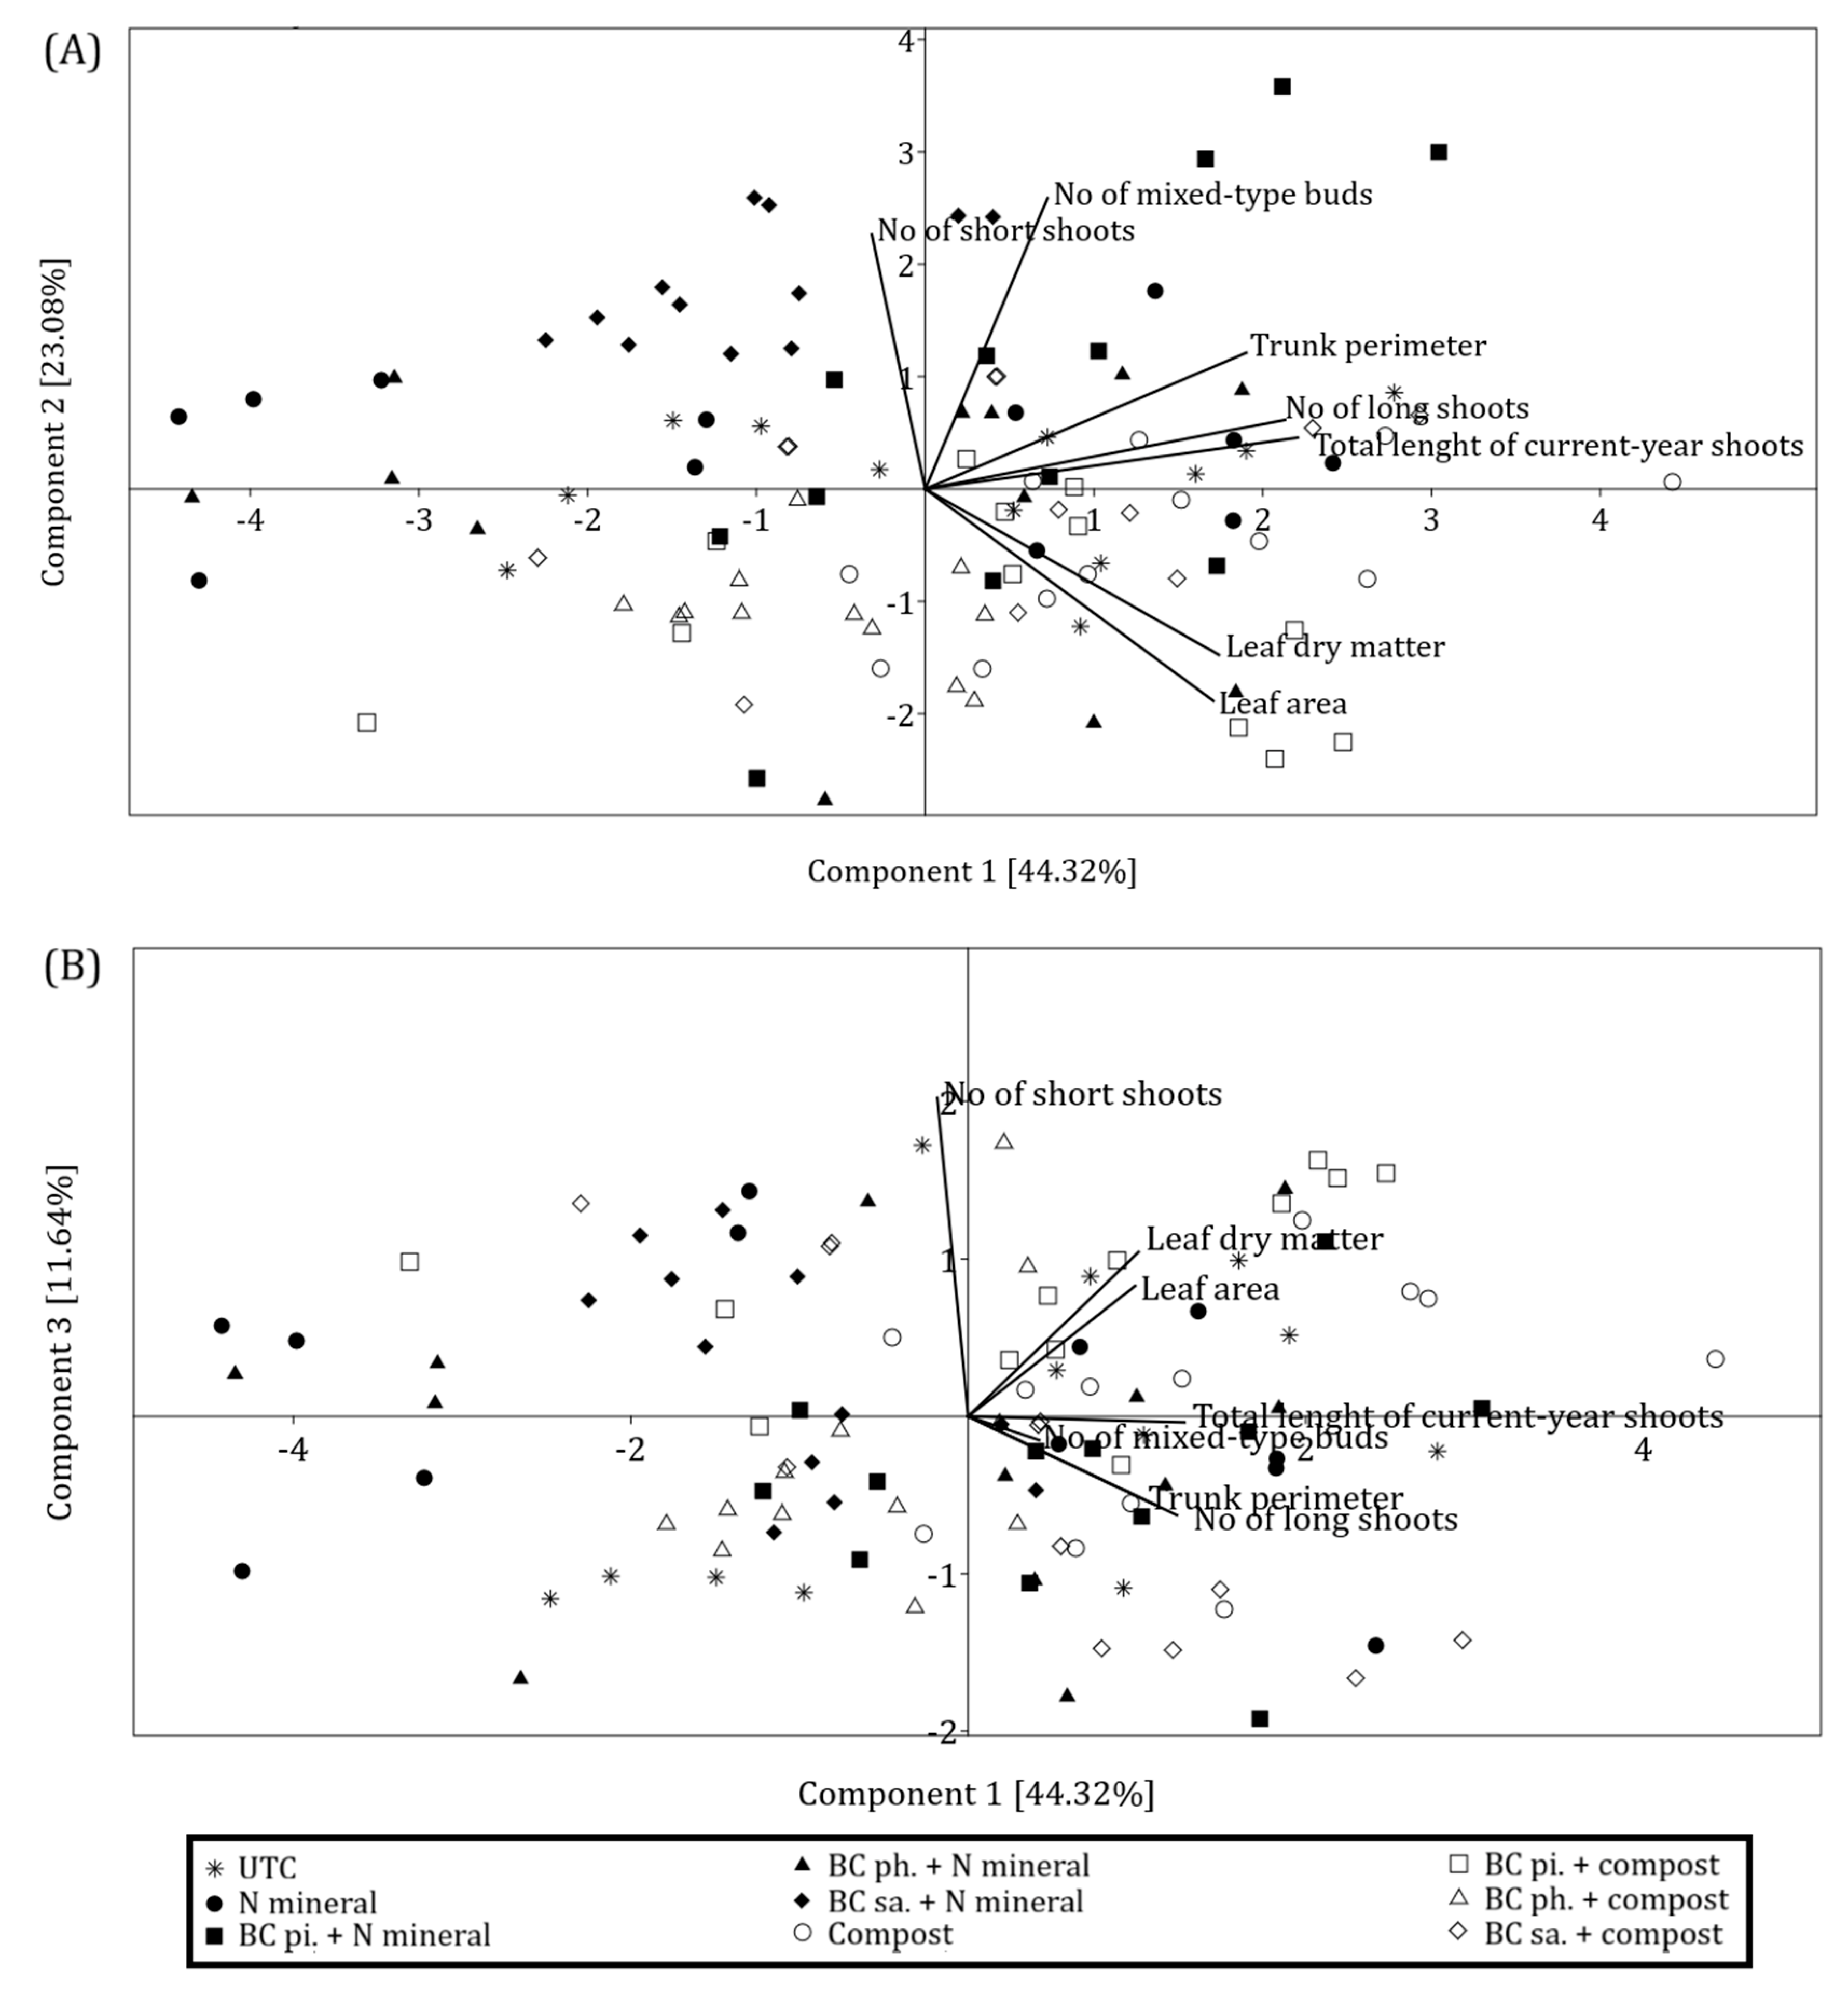
Table 1.
Granulometric composition of the soil at the experimental site. Samples were taken separately from the topsoil (0–20 cm) and subsoil (20–40 cm) layers, and analysed using the laser diffraction method.
Table 1.
Granulometric composition of the soil at the experimental site. Samples were taken separately from the topsoil (0–20 cm) and subsoil (20–40 cm) layers, and analysed using the laser diffraction method.
| Layer [cm] | Percentage distribution of soil particles by size (in mm) | |||||
| 2.0–1.0 | 1.0–0.1 | 0.10–0.05 | 0.05–0.02 | 0.02–0.002 | < 0.002 | |
| 0–20 | 0.06 | 43.88 | 16.31 | 20.34 | 16.44 | 2.97 |
| 20–40 | 0.12 | 49.94 | 14.67 | 17.88 | 14.79 | 2.60 |
Table 2.
Chemical properties of the soil at the experimental site measured in samples taken separately from the topsoil (0–20 cm) and subsoil (20–40 cm) layers.
Table 2.
Chemical properties of the soil at the experimental site measured in samples taken separately from the topsoil (0–20 cm) and subsoil (20–40 cm) layers.
| Soil parameter | Determination result |
Unit |
Method of determination |
|
| Plough layer | Subsoil layer | |||
| pH (in KCl) | 7.98 | 7.50 | n.a. 1 | potentiometric |
| Salinity | 0.37 | 0.27 | g KCl kg-1 | potentiometric |
| Total nitrogen | 0.10 | 0.07 | % DM 2 | according to Dumas |
| Phosphorus | 218.0 | 96.8 | mg kg-1 | according to Egner-Riehm, using ICP-OES 3 |
| Potassium | 396.0 | 116.0 | mg kg-1 | according to Egner-Riehm, using ICP-OES |
| Magnesium | 97.6 | 58.0 | mg kg-1 | according to Schachtschabel, using ICP-OES |
| Total carbon | 1.16 | 1.01 | % DM | according to Dumas |
| Organic matter | 2.00 | 1.73 | % DM | LOI 4 |
1 Not applicable. 2 Percentage of dry matter. 3 Inductively Coupled Plasma Optical Emission Spectroscopy. 4 Loss on ignition method.
Table 3.
Meteorological conditions prior to apple tree planting (January–March 2021) and after orchard establishment (April–October 2021). The data was obtained from a climate station belonging to the National Institute of Meteorology and Water Management. The station is located in Wieluń, approx. 3.5 km from the experimental site.
| Jan. | Feb. | Mar. | Apr. | May | Jun. | Jul. | Aug. | Sep. | Oct. | |
| Total precipitation [mm] | 27.8 | 14.2 |
14.1 |
36.3 |
72.7 |
100.5 |
63.4 |
112.0 |
22.0 |
17.7 |
| Average air temperature [ºC] | –0.9 | –0.8 |
3.9 |
6.4 |
12.2 |
19.7 |
20.8 |
17.2 |
14.8 |
10.0 |
| HTC 1 | n.a. 2 | n.a. | n.a. | n.a. | 1.92 | 1.70 | 0.98 | 2.10 | 0.50 | 0.57 |
1 Selyaninov’s hydro-thermal coefficient. Suggested interpretation [38]: HTC < 0.4 – extremely dry, HTC ∈ ⟨0.4; 0.8) – very dry, HTC ∈ ⟨0.8; 1.1) – dry, HTC ∈ ⟨1.1; 1.4) – quite dry, HTC ∈ ⟨1.4; 1.7) – optimum, HTC ∈ ⟨1.7; 2.1) – quite humid, HTC ∈ ⟨2.1; 2.6) – humid, HTC ∈ ⟨2.6; 3.0) – very humid, HTC > 3 – extremely humid. 2 Not applicable due to the average temperature having values < 8 ºC.
Table 4.
Mineral composition of the compost used in the experiment.
| Percentage of fresh matter | Dry matter content [%] | ||||
| Total nitrogen1 | Phosphorus2 | Potassium3 | Calcium3 | Magnesium4 | |
| 1.30 | 0.26 | 0.60 | 0.74 | 0.06 | 77.38 |
1 Determined according to the Kjeldahl method. 2 Spectrophotometry. 3 Flame photometry. 4 Flame Atomic Absorption Spectroscopy.
Table 5.
Expected change in the number of apple tree short shoots in response to different methods of biochar application and fertilisation regimes according to the multiple linear regression model (n = 27, p = .08).
Table 5.
Expected change in the number of apple tree short shoots in response to different methods of biochar application and fertilisation regimes according to the multiple linear regression model (n = 27, p = .08).
|
Factor |
Regression coefficient b | |
| Value (95% CI) | p | |
| Method of biochar application | ||
| Not applied | Ref. 1 | Ref. |
| Plough incorporation | –0.38 (–4.36; 3.61) | .84 |
| Planting-hole application | –2.13 (–6.11; 1.86) | .28 |
| Surface application | 2.29 (–1.70; 6.28) | .25 |
| Compost application | ||
| Not applied | Ref. | Ref. |
| Applied | –0.45 (–5.53; 4.64) | .86 |
| Mineral nitrogen fertilisation | ||
| Not applied | Ref. | Ref. |
| Applied | 2.28 (–2.21; 7.95) | .25 |
1 Reference category in the regression analysis.
Table 6.
Expected change in the growth-related fruiting potential of apple trees (ratio of the number of mixed-type buds to trunk cross sectional area) in response to different methods of biochar application and fertilisation regimes according to the multiple linear regression model (n = 27, p < .05). The model was fitted on Box-Cox transformed data (λ = –0.32), and the regression coefficients are presented in the transformed scale.
|
Factor |
Regression coefficient b | |
| Value (95% CI) | p | |
| Method of biochar application | ||
| Not applied | Ref. 1 | Ref. |
| Plough incorporation | 0.02 (–0.08; 0.11) | .74 |
| Planting-hole application | –0.03 (–0.12; 0.07) | .55 |
| Surface application | 0.07 (–0.02; 0.17) | .14 |
| Compost application | ||
| Not applied | Ref. | Ref. |
| Applied | –0.12 (–0.25; –0.00) | < .05 |
| Mineral nitrogen fertilisation | ||
| Not applied | Ref. | Ref. |
| Applied | –0.01 (–0.14; 0.11) | .81 |
1 Reference category in the regression analysis.
Disclaimer/Publisher’s Note: The statements, opinions and data contained in all publications are solely those of the individual author(s) and contributor(s) and not of MDPI and/or the editor(s). MDPI and/or the editor(s) disclaim responsibility for any injury to people or property resulting from any ideas, methods, instructions or products referred to in the content. |
© 2025 by the authors. Licensee MDPI, Basel, Switzerland. This article is an open access article distributed under the terms and conditions of the Creative Commons Attribution (CC BY) license (http://creativecommons.org/licenses/by/4.0/).
Copyright: This open access article is published under a Creative Commons CC BY 4.0 license, which permit the free download, distribution, and reuse, provided that the author and preprint are cited in any reuse.


