
Submitted:
22 October 2024
Posted:
23 October 2024
You are already at the latest version
Abstract
The circular economy with compost fertilization is included in the sustainable orchard paradigm, creating a holistic production ecosystem. Modern orchards are mostly intensive and super-intensive, requiring different rootstocks. This research presents the response to compost fertilization of two specific pear rootstocks (quince ‘CTS 212’ and ‘Farold® 40’) and own-rooted trees, analyzing six resistant cultivars in a circular production system. The dynamic of nitrogen and carbon content in leaves, soil respiration coefficient, the evolution of the fruit maturity stage in the field, and some biometric parameters such as trunk cross-section area, the annual vegetative growth, and fruiting shoots annual number were analyzed. The results highlighted the effect of compost fertilization on plants: almost all variants presented higher nitrogen amounts in leaves in the first and second years. Carbon content in leaves had a lower dynamic over time. Rootstock and compost fertilization influenced the fruit maturity dynamic, but a single pattern was not identified. Quince as pear rootstock expressed a higher sensitivity to compost application, the biometric parameters as trunk cross-section area, and almost all cultivars' annual vegetative growth were higher than the control's. Positive output can lead to future model upscaling in the farms and households.
Keywords:
circular economy
; compost
; resistant pear cultivar
; nitrogen leaf content
; carbon leaf content
1. Introduction
The present study is part of a broader set of activities of the University of Agronomic Sciences and Veterinary Medicine from Bucharest, which aims to become an integrated green campus. Thirty-eight hectares, including green spaces, experimental fields, botanical gardens, dendrological parks, and educational, dormitory, sports, and canteen buildings. This research focused on the circularity, recovering and valorizing the organic residues from several university facilities (Research Center for Studies of Food Quality and Agricultural Products and student canteen) and the vegetable residues from the green spaces through composting and their usage as fertilizer in the pear experimental field, inside the campus. It followed the circular economy and zero-waste concepts, compost as a tool for a more sustainable orchard, respectively ecosystem, pear crop as less favored in the past years in Romania due to pest and disease not fully controlled pressure.
The circular economy (CE) is an essential pillar of the European Green Deal, vital to ensuring climate neutrality by 2050. The Circular Economy Action Plan (updated in March 2020) contains proposed tools for producing responsibly, especially for lifestyle and consumption, which include options regarding the amount of waste produced, their transformation into resources, and their reintroduction into the economic circuit. Waste management and processing is an area where each community member can play an important role. The amount of waste generated annually by economic activities in the EU amounts to 2,233 million tons [1], or 4,991 tons per capita. At an individual level, the first option can consist of managing the amount of waste produced (through balanced and conscious purchase options) and recycling or composting it without introducing it into the general waste collection system [2,3].
Zero-waste (ZW) is a holistic approach to waste management and is an alternative solution addressed in recent decades [4]. The zero-waste index [5] was proposed as a tool to measure the management system’s performance. [6] explores the concept of ZW as an ethical, economic, and sustainable approach to environmental protection. It highlights that it can be critical in advancing sustainable development goals, particularly reducing waste generation and promoting circular economic practices. ZW is considered a new sustainability paradigm for global waste management [7], where citizen engagement and effective government policies can effectively address the global waste problem.
The circular economy (CE) has been addressed in the last few years as a key to future sustainability. The study of [8] provides an in-depth analysis of 114 definitions of the circular economy (CE), only three of which [9,10,11] covered all main CE dimensions, including economic prosperity, environmental quality, and social equity. The findings indicate that CE is primarily characterized by reducing, reusing, and recycling. [12] and [13] analyzes the evolution of the concept of the circular economy (CE) while [14] provides an overview of the indicators used to measure the circular economy, identifying 61 indicators classified into three spatial levels of sustainability: micro, meso, and macro. The concept of the Circular Economy (CE) about sustainability was deepened [15,16,17,18] and more targets needed to facilitate the transition to a circular economy (CE) were proposed [19].
At the same time, there are also analyses of the criticisms [20,21,22] which, in the end, comes with constructive proposals to tackle the barriers that hinder the implementation of the circular economy ( [23,24,25,26,27]). Education and youth favor the circular economy, while old age and income inequality are barriers. Ecological awareness and environmental regulations are also important for promoting the circular economy.
A similar study was projected by [28] At the University of Turku, Finland, the aim is to implement a circular food system in sustainable urban farming. The objectives were reducing food waste in university restaurants and local recycling of nutrients by composting food waste and using the compost to fertilize the soil in urban farms. The results showed that awareness campaigns reduced food waste by approximately 30% in university restaurants. Composting food waste also allowed the recycling of essential nutrients, such as nitrogen and phosphorus, used to grow food in urban gardens.
Composting the organic fraction of solid waste is one of the most environmentally friendly technologies in recent years. It involves recycling organic matter and nutrients.
[29] explores the impact of composting on the environment and the US economy. The authors argue that although there is a general perception that environmental protection involves economic costs, composting could bring substantial economic benefits by reducing waste management costs and decreasing greenhouse gas (GHG) emissions. Composting helps reduce pollution, improve soil health, and conserve resources. The study predicts that by increasing the percentage of waste composted from 10% to 18% by 2030, the US could reduce carbon emissions by 30 million tons per year and save approximately $16 billion. Composting could also create between 8,000 and 12,000 jobs. The new waste management system for Palanga municipality [30] proposed diverting 85% of biodegradable waste from public territories, including food and green waste, to compost production, reducing landfill waste to just 14%. The study highlighted the need for individualized waste management systems for resort areas due to their unique challenges, such as seasonality and the large proportion of biodegradable waste. [31] examines community composting initiatives in New York City and how they contribute to the circular economy and urban sustainability. Their study highlights that while composting is a key practice for managing organic waste, limited attention has been paid to its role in the circular economy. These initiatives effectively manage organic waste and create new material and social relationships, fostering community engagement, environmental education, and social justice [32].
[33] describes implementing a local composting program at the University of A Coruña (UDC), Spain. The program treats food waste from university canteens, using static and dynamic composting technologies and integrating it into the vegetable gardens on the campus. This decentralized system has proven to be economically sustainable, with lower costs than municipal waste treatment, and has contributed to reducing the amount of waste that needs to be transported and disposed of. In addition to the environmental benefits, the program has provided educational opportunities for students and allowed the involvement of volunteers and disadvantaged social groups to participate in composting activities.
[34] analyzed the composition of compost obtained from fruit residues from the university campus canteen, confirming its potential for use in agriculture.
The use of compost has positive effects on soil microbial activity [35] and nutrient availability [36], as well as biomass growth and orchard productivity [37]. Sustainable agriculture includes ecological technologies that support soil fertility stability by stimulating the formation of soil aggregates and erosion-resistant structure [38].
Among the composting solutions, besides the controlled or uncontrolled composting of organic residues in a specific outdoor space, which can last three to six months [39,40,41]. There are composters, which can be industrial or domestic/laboratory [42] that provides faster composting and more positive traits (eliminating odors, fast decomposition, high-quality compost) [43,44].
[45] analyzes patented technologies in organic waste composting, highlighting that in recent decades, automated composting has become increasingly popular due to the need to manage waste at source, especially in urban environments. More than 457 patents have been identified, most of which relate to automated composting systems to the detriment of manual ones. This shift towards automation is motivated by the increased efficiency of automated systems in managing organic waste quickly and efficiently.
The results indicate that aerobic composting technologies are the most widely used, accounting for 86% of the patents analyzed. They are faster and produce higher-quality composts than anaerobic composting. In addition, automated composting is preferred due to its reduced space requirements, minimal user intervention, and shorter processing time.
One of the newest and most innovative is the Oklin brand, tested and used in the USAMV Bucharest since 2021. The compost is produced using a composter Oklin GG-50S that can transform 125 kg of organic residues daily in compost, with an average transforming rate of 15% [46]. It was also analyzed in the study of [47], of an on-site composting system for biodegradable waste (BDW) generated by catering companies using the Oklin GG 10s composter. The system was presented as a sustainable alternative to conventional BDW management, which requires energy-intensive storage and external treatment. Results show that on-site composting can significantly reduce waste volume, lower environmental emissions, and produce high-quality compost. The compost produced contained high organic matter (>75% dry matter), nitrogen (1.85% dry matter), and potassium, making it suitable for agricultural use. The environmental impact was also significantly lower compared to centralized food waste composting. On-site intensive composting could contribute to a circular economy by promoting nutrient recycling while reducing greenhouse gas emissions and transportation costs.
Some of the studies [48] focused on evaluating the quality and ecotoxicity of compost produced from waste using automatic composters, sometimes the output requires the following treatment before spreading in the field [49]. Also, insufficient information about nutrient content, effective pricing systems, and supportive regulations can be barriers to the adoption of composting products derived from solid organic waste [50,51].
Sustainable fertilization in the orchards.
Compost is one of the most sustainable solutions for orchard fertilization [52,53] and can be an alternative to inorganic fertilizers in tree orchards [54]. [55] detailed the impact of annual compost amendments in peach orchards, explicitly aiming to replace synthetic fertilizers and improve soil quality, tree nutrients, water status, and overall orchard performance in a humid subtropical climate. Results indicated that the 2x compost application rate effectively improved soil moisture and nutrient availability in the replant orchard, increasing tree size and yield without negatively affecting fruit quality. The compost treatments also reduced or replaced the need for synthetic fertilizers, demonstrating potential benefits for orchard sustainability.
The environmental impact of variable rate fertilizer application (VRA) in a pear orchard in Greece, compared to uniform fertilizer application, was studied by [56], highlighting significantly reduced environmental impacts, especially in terms of air emissions, while maintaining high yields, thus providing a sustainable model for fruit farm management.
The addition of mature compost can accelerate the composting process and improve efficiency by inoculating specific bacteria [57]. Their research investigates the impact of bioorganic fertilizers on pear production by modifying the rhizosphere microbiome. Bioorganic fertilizers also improve the chemical properties of the soil and the rhizosphere microbiome, increasing microbial and functional diversity. [58] analyzes the impact of the rhizosphere microbiota on pear productivity when organic fertilizers partially replace chemical fertilizers.
Pear orchards. The value of pear production has doubled worldwide in the last 25 years. However, Romania has a constant downward trend. The high demand for these fruits is unmet, with the price/kg being consistently high compared to other crops (e.g. apple, plum). The sensitivity of traditional varieties to diseases such as bacterial blight (Erwinia amylovora) or pests (Psylla piricola) led over time to the reduction of areas cultivated with pear [59,60]. In recent years, breeding programs have led to the creation of several cultivars with resistance/tolerance to bacterial blight, respectively Psylla, which could also be included in projects regarding establishing orchards in an ecological system. Varieties such as ‘Euras’, ‘Corina’, ‘Cristal’, ‘Tudor’, ‘Romcor’, and ‘Orizont’ [61] have special fruit quality [62].
Modern orchards implement different planting systems correlated to specific rootstock, appropriated to the local soil and climatic conditions [59,63]. Besides the own-rooted trees, Quince (less vigor) or pear seedlings are used as pear rootstock [64]. Biometric parameters such as trunk cross-section area, tree height, annual vegetative growth, numbers and types of fruiting shoots, and production parameters are followed in almost every study besides the other ecosystem parts. Comparisons between less or more vigor trees due to the rootstocks used besides the fruit quality and total production are highlighted [65,66,67,68,69,70,71,72,73,74,75,76].
Fertilization in pear orchards using compost application was scarcely monitored until now, although studies regarding conventional fertilization, such as nitrogen or potassium fertilization, on the pear fruit yield and quality [77] were conducted. [78] studied how fractionated fertilizer application affects the uptake and use of nitrogen by pears in rain-fed orchards. This significantly improved nitrogen use efficiency, reduced nitrogen losses, and increased the amount of residual nitrogen in the soil. Nitrogen is crucial for tree growth, leaf development, flower formation, fruit setting, and fruit size, all influencing crop yield. Nitrogen deficiency is typically first seen in the leaves [79].
This study aimed to analyze the influence of compost application in the field on a pear tree plot through (1) monitoring the influence of the cultivar, rootstock, and compost fertilization on Nitrogen absorption in pear tree leaves, (2) Soil microbiota dynamics expressed through soil respiration coefficient, (3) the influence of compost fertilization on the fruit maturity stage in the field until harvest, (4) the influence of compost fertilization on some biometric parameters as trunk cross-section area, the annual vegetative grow, dynamics in the fruiting shoots annual number.
2. Materials and Methods
2.1. Biological Material
Six disease-resistant pear cultivars ‘Corina’, ‘Cristal’, ‘Euras’, ‘Orizont’, ‘Romcor’, and ‘Tudor’ (Figure 1), released by Voineşti Research Station for Fruit Growing (Romania) ([62,80]), seven years age, were monitored and analyzed in the Experimental Orchard of the Faculty of Horticulture within the USAMV of Bucharest (44º28‘12”, 26º03‘51”, 86 m altitude).
Trees grafted on ‘CTS 212’ quince rootstock (Quince) were planted at 3.0 x 0.8 m (4,166 trees ha-1) with a Parallel U training system. The Trident training system was used for trees grafted on ‘Farold® 40’ pear rootstock (Franc) ([81]) and on their roots (Own roots), in vitro propagated, planted at 3.0 x 1.6 m (2,083 trees ha-1).
Integrated orchard management, including drip irrigation, was applied. The interrow was kept covered with grass and mowed periodically.
2.2. Compost Fertilization
In this study, a fertilization scheme was implemented that utilizes compost derived from plant materials (such as leaves, residues from mowing the vegetable carpet, chopped branches, etc.) from the orchard and campus, as well as compost obtained from food residues sourced locally and from the university cafeteria.
Two pear rows were included in the observations, with the same cultivar x rootstock variants. One row, kept as control, was mulched at the beginning of the experiment (February 2022) with chopped branches, and on the other row was applied a mix of vegetal compost obtained on the university campus from all the vegetative material, and the compost obtained from a 24h composter (Oklin), 2 kg/tree. In the Oklin composter, food waste from various sources was composted in the Research Center for Studies of Food Quality and Agricultural Products ([46]).
In June-July 2022, a second application of compost from food waste was made to the row of trees. Subsequently, compost was applied regularly; after a sufficient amount was prepared, it was transported to the plantation and spread on a row of pear trees. During a single vegetative cycle, the amount of compost from organic residues applied was 3-4 kg per tree, representing 5.45-7.13% of the total compost applied per row over the course of one year.
Experimental design
The following experimental design was included in the experiment (Figure 2): the first row is for Control, and the second row is for Compost fertilization.
2.3. Total Nitrogen (N) and Carbon (C) Content in Leaves Analyses
In the first stage (August-December 2021), two determinations were made, the first in August and the second in October. Four determinations were made after applying the compost in the second stage (January - December 2022). Five determinations were made in the third year (January - November 2023).
Method. Leaf samples from each experimental variant were taken from the experimental lot. They were dried at 70°C for 5 hours. Dried leaves were ground with a small mill and placed in a desiccator in 15 ml Falcon tubes.
The total nitrogen (N) and carbon (C) content were analyzed using the Dumas method with an EA 3000 elemental analyzer. This method involved the complete combustion of the well-homogenized sample (1.5-2.5 mg) at 950°C in pure oxygen. Combustion produces a series of gases, mainly water, carbon dioxide, sulfur oxides, and nitrogen in various oxides (NyOx). This gas mixture passes through a reduction chamber containing heated copper. This stage converts nitrogen oxides into elemental nitrogen and captures the excess oxygen. The gases are carried by a carrier gas (helium) through a column where they are separated, and the total content of each gas reaches, after a specific time (retention time), a thermal conductivity detector, which quantifies the amount of gas. Standards were prepared using the Cystine standard substance (B2131-1, Elemental Microanalysis), with known quantities of total N (11.64%), total C (29.95%), and total S (26.67%). Five different cystine standards were weighed, ranging from 0.5 to 2.5 mg, evenly covering this range [82].
2.4. Determination of the Soil Respiration Coefficient as Soil Microbiota Parameter Indicator
The measurements were carried out in 2021, before compost fertilization, and again in 2022 to monitor the effect of compost application on soil microbiota. The LCpro+ device, equipped with the soil respiration module, was used for this purpose. Measurements were taken in the morning, between 10:00 and 11:00. Four cultivars, all grafted onto quince rootstock, were analyzed across two fertilization variants: ‘Cristal’, ‘Romcor’, ‘Corina’, and ‘Orizont.’
2.5. Fruit Ripening (Phenophases BBCH70-87) Corresponding to the Experimental Variants, Measured in IAD (Using a Da-meter)
The evolution of fruit ripening was analyzed with a non-destructive equipment, Da-meter, created by the former Department of Fruit Tree and Woody Plant Sciences of the University of Bologna (Turoni, Italy) [83,84,85,86,87,88,89,90,91].
For each tree, in the 2022 – 2023 period, in each variant, two to three measurements were done on fruits at several moments, starting with the BBCH 70 stage (IAD ≤ 2.2) until the harvest moment (BBCH 87).
2.6. Analysis of Annual Vegetative Growth After Compost Application (2022 – 2023)
Biometric parameters such as trunk cross-sectional surface area (TCSA), tree height, and the number and length of fruiting branches were measured.
The formula determined the area of the trunk section:
TCSA = π x r2, where r = D/2, D = trunk diameter.
The trunk diameter was measured 20 cm above the grafting point (root collar for the Own roots trees), using a digital caliper, averaging the longitudinal and transverse measurements. The tree height was determined using a graduated ruler from the point of grafting/ root collar to the top.
The number and length of the fruiting branches were determined yearly during winter.
2.7. Statistical Data Analyses
R program (with RStudio 2024.04.2+764) and MS Office (Microsoft Excel 2016) were used, with a significance level of p = 0.05, for the descriptive statistics of the data. ANOVA and Tuckey post-hoc tests were applied.
3. Results
3.1. Compost Application’s Influence on Nitrogen (N) Absorption in the Pear Tree Leaves and Carbon Content Is Correlated to Cultivar X Rootstock
3.1.1. Nitrogen Absorption in Pear Leaves
The study followed each cultivar pattern and compared cultivars’ dynamic of N absorption specific for each rootstock (Figure 3, Figure 4, Figure 5, Figure 6, Figure 7 and Figure 8).
For ‘Tudor’ cultivar (Figure 3), comparing the N content in leaves in the two fertilization variants, it was similar to Quince (1.835% - 1.791%) and Own roots (1.579% - 1.534%) and higher for Franc (1.756% - 2.267%) on the control raw, at the beginning of the experiment (2021).
In the first year of compost fertilization (2022), N content ranged to values higher for Own roots (2.519% - 1.986%, May; 2.699% - 2.088%, June) and similar for Quince (2.108% - 1.855%, May) and Franc (2.571% - 2.408%, June) on the Compost raw compared to Control one. At the end of the vegetative stage, in October, the values were similar for Own roots (1.344% - 1.307%) and Quince (1.510% - 1.356%) and lower on the compost variants for Franc (1.166% - 1.521%).
In the second year of compost fertilization (2023), Quince had values higher on Compost variants than Control from May to October (2.528%-1.723%, May; 2.679% - 2.096%, June; 2.042% - 1.417%, August; 1.815% - 1.406%, October). Own roots had higher values on the Compost variants until the end of the vegetative stage when they were similar (2.396% - 1.913%, May; 2.256% - 1.817%, June; 1.880% - 1.570%, August; 1.691% - 1.446%, October). Franc started with similar values in May (2.259% - 2.403%), lower in June (2.286% - 2.952%), then higher in August (1.872% - 1.768%), and similar in the end (1.747% - 1.674%).
At the ‘Corina’ cultivar, at Quince rootstock, before the compost application, N content in leaves was similar in summer and lower at the end of vegetation in the Compost variant (1.387-1.670, August; 0.989-1.194, October). After compost application, values have increased in the first year, being higher than the control (1.843-1.775, May; 2.499-1.618, June; 1.627-1.150, September; 1.164-0.894, October). In the second year, N content in leaves remained higher in the Compost variants all the season (2.209-1.795, May; 2.410-2.099, June; 2.033-1.641, August; 1.656-1.111, October).
Before compost application, the trees on their Own roots had higher N content in the control variants (1.697-2.059, August). In the first year of compost fertilization, values were similar to Control until the end of vegetation, when they were higher (2.522-2.211, May; 2.261-2.437, June; 1.676-1.114, October). In the second year, values were similar on the two rows, except August, when higher than Control (2.458-2.188, May; 2.351-2.485, June; 2.036-1.544, August; 1.616-1.504, October).
Franc rootstock at this cultivar generally led to similar values on both rows. They started a bit lower before the experiment (1.705-2.361, August; 1.483-1.484, October) and remained identical in the first year, 2022 (2.597-2.692, May; 2.542-2.654, June; 2.070-2.011, September; 1.522-1.655, October), and in the second year, 2023, except October when were higher than Control (2.419-2.398, May; 2.894-3.011, June; 2.089-2.130, August; 1.863-1.625, October) (Figure 4).
At ‘Cristal’ cultivar, before the compost application, at Quince rootstock, N content in leaves was higher in summer and lower at the end of vegetation in the Compost variant (1.828-1.612, August; 0.699-1.004, October). After compost application, in the first year, values were higher than the control (2.401-2.243, May; 2.262-1.934, June; 2.688-1.951, October). In the second year, N content in leaves was higher in the Compost variants at the beginning and end of the season and similar in summer (2.324-1.820, May; 1.788-1.678, June; 1.726-1.239, October).
Before compost application, the trees on their Own roots had higher N content in the control variants at the beginning and similar at the end of the vegetation stage (1.641-1.984, August; 0.883-1.000, October). In the first year of compost fertilization, values were similar to Control until the end of vegetation, when they were higher (2.577-1.750, May; 2.202-1.890, June; 1.555-1.063, October). In the second year, values were higher than Control at the beginning and similar for the rest of the season (2.493-2.150, May; 2.670-2.581, June; 1.905-1.871, August; 1.492-1.346, October).
On the Franc rootstock, before the experiment (2021), N values in leaves were lower in the summer and higher at the end of the season than in Control (1.686-2.058, August; 1.188-0.917, October). The experiment‘s first year was higher than the control (2.557-2.195, May; 2.688-1.951, June; 1.538-1.010, October). In the second year, 2023, values were similar except in October, when they were higher than Control (2.368-2.304, May; 2.539-2.462, June; 2.007-1.860, August; 1.944-1.678, October) (Figure 5).
At the ‘Orizont’ cultivar, before the compost application, at Quince rootstock, N content in leaves was higher in the Control variant (1.006-1.441, August; 0.724-0.822, October). After compost application, in the first year, values were similar to the Control until the end of vegetation, when they were lower (2.211-2.164, May; 2.099-2.044, June; 0.870-1.078, October). In the second year, N content in leaves was higher in the Compost variants in all seasons (2.704-1.770, May; 2.953-1.967, June; 2.169-1.582, August; 1.652-1.143, October).
Before compost application, the trees on their Own roots had the lowest N content in the control variants (1.967-1.814, August; 1.549-1.112, October). In the first year of compost fertilization, values were similar to Control, all seasons (2.398-2.204, May; 2.550-2.424, June; 1.043-0.956, October). In the second year, values were higher than Control (2.612-2.034, May; 2.393-2.452, June; 1.796-1.447, August; 1.919-1.415, October).
On the Franc rootstock, before the experiment (2021), N values in leaves were similar in the summer and higher at the end of the season than in Control (1.818-1.907, August; 1.322-1.062, October). In the first year of the experiment, N content in leaves was similar until the end of vegetation season, when it was lower than the Control (2.238-2.258, May; 2.277-2.487, June; 1.033-1.242, October). In the second year, 2023, values were similar except in June, when they were lower than Control (2.689-2.517, May; 2.575-3.028, June; 1.749-1.848, August; 1.542-1.710, October) (Figure 6).
At the ‘Romcor’ cultivar, 2021, before the compost application, at Quince rootstock, N content in leaves was higher in the Control variant (1.360-1.685, August; 0.952-0.947, October). After compost application, in the first year, values became higher than in the Control variants (1.921-1.816, May; 1.818-1.572, June; 1.614-0.658, October). In the second year, N content in leaves remained higher in the Compost variants all season (2.296-2.025, May; 2.739-2.091, June; 1.558-1.482, October).
Before compost application, the trees on their Own roots had the highest N content in the Control variants (1.906-2.041, August; 1.091-1.336, October). In the first year of compost fertilization, values became higher than the Control all seasons (2.804-2.180, June; 1.340-1.116, October). In the second year, values were similar to Control, except in August, when they were higher (2.290-2.533, May; 2.819-2.798, June; 2.008-1.862, August; 1.561-1.555, October).
On the Franc rootstock, before the experiment (2021), N values in leaves were similar and higher than Control (1.791-1.560, August; 1.414-1.150, October). In the first year of the experiment, N content in leaves was higher than Control (2.234-1.760, May; 2.794-1.813, June; 1.676-0.935, October). In the second year, 2023, values remained higher than Control (2.621-1.609, May; 2.650-1.814, June; 2.160-1.239, August; 1.980-0.963, October) (Figure 7).
At the ‘Euras’ cultivar, before the compost application, at Quince rootstock, N content in leaves was higher than the Control variant (2.107-1.949, August; 0879-0.760, October). After compost application, values remained higher in the first year than in the Control variants except at the end of vegetation season, when they were lower (2.510-2.226, May; 2.773-2.334, June; 1.146-1.242, October). In the second year, N content in leaves remained higher in the Compost variants all season (2.348-1.809, May; 2.188-2.210, June; 1.721-1.577, August; 1.682-1.250, October).
The trees on their Own roots had the highest N content in the Control variants before compost application (2.064-2.332, August). In the first year of compost fertilization, values became higher than the Control all season (2.619-2.269, May; 2.934-2.336, June; 1.456-0.654, October). In the second year, values remained higher than Control (2.510-2.188, May; 2.599-2.071, June; 1.958-1.731, August; 1.368-0.981, October).
On the Franc rootstock, before the experiment (2021), N values in leaves were similar and higher than Control (1.480-1.885, August; 0.929-0.778, October). In the first year of the experiment, N content in leaves was higher than Control (2.952-1.978, May; 2.739-2.311, June; 1.318-1.002, October). In the second year, 2023, values were similar or higher than Control, except in June, when they were lower (2.496-2.425, May; 2.314-2.605, June; 2.102-1.980, August; 1.868-1.563, October) (Figure 8).
The differences are highlighted when we compare the N content in leaves between cultivars on the same rootstock (Figure 9, Figure 10 and Figure 11).
At the Quince rootstock, N content in leaves was higher on the Control variants or similar before applying compost. After compost fertilization, trees grafted on Quince had the highest values on the compost variants at almost every moment compared to Control. Between cultivars, ‘Euras’, ‘Orizont’, and ‘Romcor’ presented higher values.
Before the experiment, the trees on their Own roots had higher N content in leaves than the Control, and after compost application, all cultivars presented higher N absorption.
The leaves on the Franc grafted trees have higher N values than on other rootstock cultivars.
3.1.2. Carbon Content in Pear Leaves Correlated to Cultivar X Rootstock
Comparing the Carbon in the pear leaves, the values were quite similar at the ‘Corina’ cultivar between variants and also between rootstock values. ‘Cristal’, at Franc rootstock, presented higher values after compost application. The trees on their Own roots had lower values in summer in both years and at the end of vegetation in the first year (2022). At Quince rootstock, if values were higher on the Control before the compost application, after both years, they became similar for all seasons.
At the ‘Euras’ cultivar, the Carbon in the pear leaves didn’t have a pattern, and the values were variable on both the Compost and Control variants.
At the ‘Orizont’ cultivar, on the Franc rootstock, C values were higher on the Control variants. On trees on Own roots in the first year were higher and in the second similar. On Quince were similar or sometimes higher on the Control (end of vegetation).
At the ‘Romcor’ cultivar, C content was higher in the first year after compost application on the Franc rootstock in the summer—a similar pattern on the trees on Own roots and Quince.
The ‘Tudor’ cultivar had a similar pattern to the rest of the cultivars when lower summer values were registered on some Compost variants. The rest were similar, most of them (Table 1).
3.2. Determination of the Soil Respiration Coefficient as Soil Microbiota Parameter Indicator
The soil respiration coefficient is a vital soil health parameter that can be determined with various simple or complex equipment, even in different sites and farms. The present study analyzed the dynamic of this parameter in the year before compost application and in the first year (2022) after. The results (Figure 15, 2022 data) highlight the sensitivity of this parameter, with higher values being recorded in the first 15-20 days after compost application to some cultivars. ‘Corina’, ‘Cristal’, ‘Orizont’, and ‘Romcor’, grafted on Quince rootstock, were monitored.
3.3. Maturity Stage of the Fruits
The fertilization scheme influences tree phenology; however, a definitive relationship has not yet been established between the plant‘s optimal nutritional status and its earliness or tardiness compared to a lower nutritional status.
Fruit ripening stages were monitored with a Da-meter, which measured IAD regularly 45-60 days before harvest when values dropped under 2.2. A heatmap was determined based on the average values (Figure 16), comparing fertilization variants. If in the 2022 year, slight differences were present between variants on some rootstocks (Own roots – ‘Euras’, ‘Tudor’; Quince – ‘Cristal’; Franc – ‘Romcor’, ‘Orizont’, ‘Corina’) in the second year (2023) differences remained at ‘Tudor’/ Own roots, ‘Cristal’/Quince, ‘Tudor’/Quince, ‘Romcor’/Franc, where Control variants ripened earlier than Compost ones. In the second year, ‘Orizont’/ Franc, ‘Corina’/Franc, and ‘Tudor’/Franc had higher values on the Control variants, with the compost ones attending more early the harvest moment (Figure 17, Figure 18, Figure 19, Figure 20, Figure 21 and Figure 22).
3.4. Influence of the Compost Fertilization on the Annual Vegetative Growth
3.4.1. Trunk Cross-Section Area Growth Rate
One of the biometric parameters for tree development is the trunk cross-sectional area, which is measured each year during the dormancy period. When comparing the cultivars with their respective rootstocks (Figure 23), the Quince rootstock was the most responsive to compost application, with all cultivars exhibiting significantly higher values than the control. ‘Cristal’ and ‘Romcor’ responded similarly to the trees on ‘Franc’ and ‘Own roots’ rootstocks, while ‘Euras’ exhibited a higher growth rate in the control group than these.
3.4.2. Total Annual Vegetative Growth
Some of the cultivars on Quince rootstock didn’t have similar patterns as TCSA, with some higher growths on the control (‘Cristal’, ‘Orizont’). Pear trees on their own roots presented higher or similar values in the compost variants compared to the control. Franc rootstock with compost application led to higher vegetative growth in all cultivars except ‘Corina’ and ‘Tudor’ (Figure 24).
3.4.3. Total Annual Fruiting Shoots by Number
Annual fruiting shoots are directly and strongly correlated to total production.
At the ‘Corina’ cultivar, for Franc grafted trees and own-rooted ones, Spurs and Dards dominate in both periods, with relatively equal weights; water shoots slightly increased in 2023 on both Compost and control. At Quince, in 2022, Spurs dominate, but in 2023, Dards increase significantly, reversing the proportions between the two types of branches for both variants (Figure 25).
At the ‘Crystal’ cultivar, Franc rootstock, on the Compost variant, Dards has a majority weight in both periods, with a small presence of Offshoots and Brindles. Water shoots are absent compared to the Control, which is similar to Compost, but in 2023, a slight decrease in Dards and an increase in the weight of Spurs is observed. On the Compost variant, the trees on their Own roots, the share of Dards was lower compared to Franc, but Offshoots had a higher contribution. Spurs and Brindles remained at low values. At the Control, Dards had a high share, and Offshoots and Spurs were more present than other rootstocks. At the Quince rootstock, on the Compost variant, Dards dominated in both periods, and Water shoots and Spurs had a minimal presence. On the Control, in 2022, Spurs had a high share, but in 2023, Dards became more dominant.
At the ‘Euras’ cultivar, at the Franc rootstock, on the Compost variant, Spurs have a majority share in both periods, and Dards remain at constant values. Water shoots had a slight increase in 2023. Spurs and Dards dominate on the Control, with slight variations between years. Water shoots had a small but visible share in 2023. On the Compost variant, Spurs values dominated the Own roots trees, but Brindles and Dards had lower shares than the Franc rootstock. On the Control, the values were similar to Compost, but the shares for Dards and Spurs were more balanced. At the Quince rootstock, on the Compost variant, Dards and Spurs were present in relatively equal proportions, with an increase in the share of Offshoots in 2023, while on the Control, a more balanced share between Spurs and Dards and Offshoots appears with a small share in 2023.
At the ‘Orizon’ cultivar, the trees grafted on Franc, and in the Compost variant, Spurs had a majority share, and Dards and Brindles had constant values in both periods. Spurs and dards were predominant in control, but their proportions varied slightly between years, with a slight increase in water shoots in 2023. At the trees on their Own roots, on the Compost variant, Dards had a relatively low presence, while Brindles and Water shoots remained stable. The proportion of dards and brindles in the control group was almost equal, while the Spurs remained dominant in both periods. At Quince rootstock, on the Compost variant, in 2022, Spurs and Dards were equal, and in 2023, Water shoots became more present. Dards and Spurs were predominant in the control, and water shoots only appeared in 2023 at a small rate.
At the ‘Romcor’ cultivar, at the Franc rootstock, on the Compost variant, in 2022, Spurs and Dards were equal, and in 2023, Spurs increased considerably, becoming predominant. At the Control, Spurs were dominant in both periods, but Brindles increased in 2023. At the trees on their Own roots, on the Compost variant, the share of Spurs and Dards was relatively balanced in both periods. Spurs had a majority share of the Control, but Brindles and Dards were present in significant proportions. On the Compost variant, Dards dominated in 2023 at the Quince rootstock, and Offshoots appears with a small share. On the Control, the share of Spurs and Dards remained constant between the two years without significant variations.
At the ‘Tudor’ cultivar, at the Franc grafted trees, on the Compost variant, in 2022, Spurs and Dards had equal values, but in 2023, Spurs became predominant. At the Control, Spurs dominated in both periods, but Water shoots had a smaller share. Dards and Offshoots values were relatively constant at the trees on their own roots and the Compost variant, but Spurs increased in 2023. At the Control, Dards and Spurs weights were constant, but there was an increase in the weight of Brindles in 2023. At the Quince rootstock and the Compost variant, Spurs dominated in both periods, with an increase in Brindles and Offshoots in 2023. At the Control, Spurs dominated in both periods, but Offshoots increased slightly in 2023.
Spurs and Dards were generally the dominant branches in most combinations, with minor exceptions. Fertilization with Compost compared to Control does not drastically affect the distribution of weights between branch types, but there were subtle variations depending on cultivar and rootstock. There was a general trend for Water shoots to be less present but to increase in some combinations in 2023.
4. Discussion
This study aimed to analyze the influence of compost application in the field on a pear tree plot through several parameters in a circular system.
In most cases, soil parameter changes require more time, and an efficient method to evaluate fertilizer efficiency is to assess the mineral composition of leaves and other plant parts. Total nitrogen and carbon determined through elemental analyses proved to be an easy and supportive method to analyze the dynamic of leaf nutrient accumulation.
The maximum values maintained the same increase after the application of compost, presenting higher values on the Compost variants. The Franc rootstock (‘Farold® 40’) had greater vigor, with trees grafted on Franc much more vigorous than those on Quince or their Own roots. This is also reflected in the higher total nitrogen content recorded between the variants.
Corresponding results regarding the total C content in the leaves were analyzed similarly, but values were more or less constant in the period studied.
The literature contains research using the same method, comparing the parameters determined from the leaf using the elemental analyzer with those evaluated with non-destructive devices or hyperspectral images taken with drones. [92] analyzed the management of nitrogen fertilizer application in a pear orchard using non-destructive methods, comparing the results with those obtained by the Dumas method on the elemental analyzer. They applied different fertilization schemes based on different nitrogen concentrations and evaluated their influence on the total N concentration in leaves and the quality of fruits. The results obtained within the project can be compared with those in this experiment for certain phenological stages, using the results in absolute value.
Another study by [93] it also demonstrated a direct relationship between leaf nutrient content and pear fruit quality and yield. Fruit length, diameter, weight, and yield showed a strong positive correlation with the nitrogen content in the leaves. This may be because nitrogen is an essential component of cells, directly influencing leaf growth and development, as well as bud growth and flowering. A positive effect was also found on fruit development, leading to improvements in both yield and quality through intense photosynthetic activity.
At the same time, some studies have shown that although the nitrogen content in the leaves did not experience significant changes compared to the control, a high amount of nitrogen in the soil positively affected the number of fruits and other yield indicators. Therefore, nitrogen can benefit the fruits even without visible effects on the leaves [77,94].
Fractionated fertilizer application benefits on the plants were also determined in the [78] study, when application treatments favored nitrogen uptake from the soil and improved the growth and distribution of nitrogen in various tree structures. The fractionated fertilizer application can reduce nitrogen losses and improve its use efficiency in pears, offering significant advantages over a single application.
The dynamic evaluation of the total nitrogen and carbon content generated complex and essential data, which, from this point of view, characterize the influence of the fertilization scheme, respectively, and the applied technology on the experimental variants.
For the soil respiration coefficient at ‘Cristal’/Quince, the first measurements had significantly higher values on the control compared to the Compost variant at the same time. Starting with August 3rd, 2022, the respiration coefficient on the Compost variant presented higher values than control (5.052 µmol m-2 s-1 compared to 1.540 µmol m-2 s-1, respectively 6.101 µmol m-2 s-1 compared to 0.433 µmol m-2 s-1).
At ‘Romcor’/Quince, the values of the soil respiration coefficient fluctuated between the two experimental variants, presenting a maximum also at the time point August 3rd, 2022, on the Compost variant (3.380 µmol m-2 s-1) compared to the control (1.846 µmol m-2 s-1). ‘Corina’/Quince showed higher values on the control than on the Compost variant except for the first month and the last measured moment, where they were lower.
‘Orizont’/Quince showed similar behavior to the first two cultivars, with significantly higher values on the Compost variant (4.209 µmol m-2 s-1) compared to the control (0.988 µmol m-2 s-1) on August 3rd, 2022.
A possible justification for the increases in the level of the respiration coefficient values on August 3rd, 2022, was the application of compost in July. Except for one variant (‘Cristal’/Quince), these values decreased significantly after six days. Research conducted by [95] mentions the influence of the time of day and the calendar month on the values of the soil respiration coefficient, along with temperature and relative humidity in the soil. The same method was used in the study [96] to measure the influence of abiotic and biotic factors on the respiration coefficient. The most important abiotic factor was temperature. Our present study‘s results provided important details, with absolute values analyzed in correlation with the two measured parameters (temperature and relative humidity, valued not displayed).
The fruit ripening dynamic was measured and expressed using the Absorption Difference Index (IAD), a portable DA-meter based on vis-NIR technology. According to past studies on the cultivars, the optimum values for harvest were established in a range between 1.5 and 1.7, with a slight increase in the ‘Euras’, a winter cultivar. The results showed a strong negative correlation between harvest date and IAD value for all varieties, similar to [84,85,88]. Rootstock and Compost fertilization influenced the maturity index at the cultivars analyzed, results compared to [87]. No pattern was identified for the dynamics of the compost fertilization variants compared to the control, requiring more detailed future research.
Biometric parameters analyzed, such as TCSA, annual vegetative growth, and fruiting shoot number, were the most sensitive indicators of the efficiency of the compost application, with Quince rootstock presenting significant differences compared to the control. Compared to Franc rootstock, which leads to higher growth, Quince is known as less vigorous and is used in super-intensive orchards due to the low root volume developed and its quality to the orchard productivity [59,64].
The cultivars responded differently to the rootstock influence when comparing the TCSA growth rate between the two years of compost applications. But at the Quince rootstock, all the compost variants presented higher values than the control, confirming the low vigor and relatively small root system volume where the fertilizer could have acted in the experiment time (the compost was always placed at the soil surface, with no incorporation). The highest growing rates were recorded at the Own rooted trees on the Compost variant of ‘Cristal’ and ‘Tudor’, although on that Own rooted, there was no similar pattern.
The total annual vegetative growth presented similarities to [66,67,72,74,75], highlighting the differences between the Franc rootstock. The Franc rootstock led to the highest vegetative yearly growth, followed by the own-rooted trees and, in the end, the lower values for the Quince rootstock, sometimes lower than half of the Francs. Compost variants generally presented higher or similar values to the control ones in all rootstocks for this parameter.
The total annual vegetative growth quality was analyzed using the number of fruiting shoots for production. For the present year, spurs and water shoots don’t directly contribute to the potential flowering buds and future fruits, respectively, or the total production of the tree. The number of fruiting shoots is determined by the tree complex, cultivar x rootstock, and all the abiotic and biotic factors, including the technology used especially pruning and canopy shape. In the experiment period, the cultivars showed different behaviors. ‘Cristal’ and ‘Euras’ on the compost variants increased the direct fruiting shoots. No similarities in the rootstock influence were found in this period, so extended research is necessary.
5. Conclusions
The study begins by introducing the circular agriculture component into the ecosystem, using an innovative composter and outlining the framework for the separate and appropriate collection of organic waste, recycling with the help of this equipment, and then used as fertilizer (in our case, in the pear orchard). Thus, (1) the costs of waste disposal are considerably reduced, (2) the costs of purchasing fertilizers are reduced/eliminated, and especially (3) an awareness of the personnel involved in the environmental and health aspects is stimulated. This component of voluntary contribution to the recycling process is one of the most important in the system, having at least two aspects: the material one – according to (1) and (2) and the contribution to the creation and strengthening of the civic motivation of each person, fundamentally strengthening the local community in the respective ecosystem. The study brought a complex answer regarding the application of this technology in the pear orchard, with results regarding its influence on the nutritional status of plants and some soil quality parameters, as well as on the biometric tree parameters and fruit maturity dynamics.
Author Contributions
Conceptualization, A.C.B., F.S., and D.H.; methodology, A.C.B., C.A.M., A.M., R.G., F.S., D.H.; software, A.C.B.; validation, A.C.B., F.S.; formal analysis, A.C.B., F.S., C.A.M.; writing—original draft preparation, A.C.B.; visualization, F.S. All authors have read and agreed to the published version of the manuscript.
Funding
This research was funded by the University of Agronomic Sciences and Veterinary Medicine of Bucharest, Romania, grant number 2022-007/16.05.2022 and 2021-6/2021.07.17. The University of Agronomic Sciences and Veterinary Medicine of Bucharest, Romania, funded the APC.
Data Availability Statement
Data for the specific analysis are unavailable due to privacy restrictions.
Conflicts of Interest
The authors declare no conflict of interest.
References
- Eurostat Waste Statistics; Europa.eu. 2024.
- Awasthi, A.K.; Cheela, V.R.S.; D’Adamo, I.; Iacovidou, E.; Islam, M.R.; Johnson, M.; Miller, T.R.; Parajuly, K.; Parchomenko, A.; Radhakrishan, L.; et al. Zero Waste Approach towards a Sustainable Waste Management. Resources, Environment and Sustainability 2021, 3, 100014. [Google Scholar] [CrossRef]
- Klug, K.; Niemand, T. The Lifestyle of Sustainability: Testing a Behavioral Measure of Precycling. Journal of Cleaner Production 2021, 297, 126699. [Google Scholar] [CrossRef]
- Zaman, A.U. A Comprehensive Review of the Development of Zero Waste Management: Lessons Learned and Guidelines. Journal of Cleaner Production 2015, 91, 12–25. [Google Scholar] [CrossRef]
- Zaman, A.U.; Lehmann, S. The Zero Waste Index: A Performance Measurement Tool for Waste Management Systems in a ‘Zero Waste City. ’ Journal of Cleaner Production 2013, 50, 123–132. [Google Scholar] [CrossRef]
- Bogusz, M.; Matysik-Pejas, R.; Krasnodębski, A.; Dziekański, P. The Concept of Zero Waste in the Context of Supporting Environmental Protection by Consumers. Energies 2021, 14, 5964. [Google Scholar] [CrossRef]
- Zaman, A. Zero-Waste: A New Sustainability Paradigm for Addressing the Global Waste Problem. In The Vision Zero Handbook; Edvardsson Björnberg, K., Hansson, S.O., Belin, M.-Å., Tingvall, C., Eds.; Springer International Publishing: Cham, 2023; pp. 1195–1218. ISBN 978-3-030-76504-0. [Google Scholar]
- Kirchherr, J.; Reike, D.; Hekkert, M. Conceptualizing the Circular Economy: An Analysis of 114 Definitions. Resources, Conservation and Recycling 2017, 127, 221–232. [Google Scholar] [CrossRef]
- Liu, Q.; Li, H.; Zuo, X.; Zhang, F.; Wang, L. A Survey and Analysis on Public Awareness and Performance for Promoting Circular Economy in China: A Case Study from Tianjin. Journal of Cleaner Production 2009, 17, 265–270. [Google Scholar] [CrossRef]
- Lieder, M.; Rashid, A. Towards Circular Economy Implementation: A Comprehensive Review in Context of Manufacturing Industry. Journal of Cleaner Production 2016, 115, 36–51. [Google Scholar] [CrossRef]
- Van Buren, N.; Demmers, M.; Van Der Heijden, R.; Witlox, F. Towards a Circular Economy: The Role of Dutch Logistics Industries and Governments. Sustainability 2016, 8, 647. [Google Scholar] [CrossRef]
- Kirchherr, J.; Yang, N.-H.N.; Schulze-Spüntrup, F.; Heerink, M.J.; Hartley, K. Conceptualizing the Circular Economy (Revisited): An Analysis of 221 Definitions. Resources, Conservation and Recycling 2023, 194, 107001. [Google Scholar] [CrossRef]
- Arruda, E.H.; Melatto, R.A.P.B.; Levy, W.; Conti, D.D.M. Circular Economy: A Brief Literature Review (2015–2020). Sustainable Operations and Computers 2021, 2, 79–86. [Google Scholar] [CrossRef]
- De Pascale, A.; Arbolino, R.; Szopik-Depczyńska, K.; Limosani, M.; Ioppolo, G. A Systematic Review for Measuring Circular Economy: The 61 Indicators. Journal of Cleaner Production 2021, 281, 124942. [Google Scholar] [CrossRef]
- Nikolaou, I.E.; Tsagarakis, K.P. An Introduction to Circular Economy and Sustainability: Some Existing Lessons and Future Directions. Sustainable Production and Consumption 2021, 28, 600–609. [Google Scholar] [CrossRef]
- Borrello, M.; Pascucci, S.; Cembalo, L. Three Propositions to Unify Circular Economy Research: A Review. Sustainability 2020, 12, 4069. [Google Scholar] [CrossRef]
- Geissdoerfer, M.; Savaget, P.; Bocken, N.M.P.; Hultink, E.J. The Circular Economy – A New Sustainability Paradigm? Journal of Cleaner Production 2017, 143, 757–768. [Google Scholar] [CrossRef]
- Velenturf, A.P.M.; Purnell, P. Principles for a Sustainable Circular Economy. Sustainable Production and Consumption 2021, 27, 1437–1457. [Google Scholar] [CrossRef]
- Morseletto, P. Targets for a Circular Economy. Resources, Conservation and Recycling 2020, 153, 104553. [Google Scholar] [CrossRef]
- Corvellec, H.; Stowell, A.F.; Johansson, N. Critiques of the Circular Economy. J of Industrial Ecology 2022, 26, 421–432. [Google Scholar] [CrossRef]
- Calisto Friant, M.; Vermeulen, W.J.V.; Salomone, R. Analysing European Union Circular Economy Policies: Words versus Actions. Sustainable Production and Consumption 2021, 27, 337–353. [Google Scholar] [CrossRef]
- Awan, U.; Sroufe, R. Sustainability in the Circular Economy: Insights and Dynamics of Designing Circular Business Models. Applied Sciences 2022, 12, 1521. [Google Scholar] [CrossRef]
- Grafström, J.; Aasma, S. Breaking Circular Economy Barriers. Journal of Cleaner Production 2021, 292, 126002. [Google Scholar] [CrossRef]
- Sandu, M.A.; Virsta, A. The Water Footprint in Context of Circular Economy. AGROLIFE 2021, 10, 170–177. [Google Scholar] [CrossRef]
- Neves, S.A.; Marques, A.C. Drivers and Barriers in the Transition from a Linear Economy to a Circular Economy. Journal of Cleaner Production 2022, 341, 130865. [Google Scholar] [CrossRef]
- Vîrsta, A.; Sandu, M.A.; Daraban, A.E. Dealing with the Transition from in Line Economy to Circular Economy - Public Awareness Investigation in Bucharest. AgroLife Scientific Journal 2020, 9, 355–361. [Google Scholar]
- Koul, B.; Yakoob, M.; Shah, M.P. Agricultural Waste Management Strategies for Environmental Sustainability. Environmental Research 2022, 206, 112285. [Google Scholar] [CrossRef]
- Erälinna, L.; Szymoniuk, B. Managing a Circular Food System in Sustainable Urban Farming. Experimental Research at the Turku University Campus (Finland). Sustainability 2021, 13, 6231. [Google Scholar] [CrossRef]
- Farhidi, F.; Madani, K.; Crichton, R. How the US Economy and Environment Can Both Benefit From Composting Management. Environ Health Insights 2022, 16, 11786302221128454. [Google Scholar] [CrossRef]
- Kliopova, I. Integrated Waste Management System for Resort Town. EREM 2016, 72, 31–55. [Google Scholar] [CrossRef]
- Morrow, O.; Davies, A. Creating Careful Circularities: Community Composting in New York City. Trans Inst British Geog 2022, 47, 529–546. [Google Scholar] [CrossRef]
- Bruni, C.; Akyol, Ç.; Cipolletta, G.; Eusebi, A.L.; Caniani, D.; Masi, S.; Colón, J.; Fatone, F. Decentralized Community Composting: Past, Present and Future Aspects of Italy. Sustainability 2020, 12, 3319. [Google Scholar] [CrossRef]
- Torrijos, V.; Calvo Dopico, D.; Soto, M. Integration of Food Waste Composting and Vegetable Gardens in a University Campus. Journal of Cleaner Production 2021, 315, 128175. [Google Scholar] [CrossRef]
- Olukanni, D.O.; Ogedengbe, V.O.; Ogundare, O.J. Examining the Potential Recovery of Compost from Mixed Fruit Wastes from a Campus Eatery Wastes. IOP Conf. Ser.: Mater. Sci. Eng. 2021, 1036, 012065. [Google Scholar] [CrossRef]
- Dusa, E.M.; Sicuia, O.; Stan, V. Study on the Effects of Fertilization on the Abundance of Soil Microbial Community, Its Composition and Antifungal Efficacy. AGROLIFE 2022, 11, 39–51. [Google Scholar] [CrossRef]
- Bertici, R.; Dicu, D.; Herbei, M.; Sala, F. Model for Describing the Variation of Some Agrochemical Indices of the Soil. AGROLIFE 2022, 11, 18–26. [Google Scholar] [CrossRef]
- Sharaf, H.; Thompson, A.A.; Williams, M.A.; Peck, G.M. Compost Applications Increase Bacterial Community Diversity in the Apple Rhizosphere. Soil Science Soc of Amer J 2021, 85, 1105–1121. [Google Scholar] [CrossRef]
- Cojocaru, O. Ecosystem - Reproduction of Sustainable Structure in Agriculture as a Factor of Soil Fertility. AgroLife Scientific Journal 2019, 8, 71–76. [Google Scholar]
- Ayilara, M.; Olanrewaju, O.; Babalola, O.; Odeyemi, O. Waste Management through Composting: Challenges and Potentials. Sustainability 2020, 12, 4456. [Google Scholar] [CrossRef]
- Waqas, M.; Hashim, S.; Humphries, U.W.; Ahmad, S.; Noor, R.; Shoaib, M.; Naseem, A.; Hlaing, P.T.; Lin, H.A. Composting Processes for Agricultural Waste Management: A Comprehensive Review. Processes 2023, 11, 731. [Google Scholar] [CrossRef]
- Zhou, Y.; Xiao, R.; Klammsteiner, T.; Kong, X.; Yan, B.; Mihai, F.-C.; Liu, T.; Zhang, Z.; Kumar Awasthi, M. Recent Trends and Advances in Composting and Vermicomposting Technologies: A Review. Bioresource Technology 2022, 360, 127591. [Google Scholar] [CrossRef]
- Von Heynicz, K. Compost in the Household. 2012. [Google Scholar]
- Palaniveloo, K.; Amran, M.A.; Norhashim, N.A.; Mohamad-Fauzi, N.; Peng-Hui, F.; Hui-Wen, L.; Kai-Lin, Y.; Jiale, L.; Chian-Yee, M.G.; Jing-Yi, L.; et al. Food Waste Composting and Microbial Community Structure Profiling. Processes 2020, 8, 723. [Google Scholar] [CrossRef]
- Liu, M.; Wang, J.; Wang, L.; Liu, P.; Zhao, J.; Zhao, Z.; Yao, S.; Stănică, F.; Liu, Z.; Wang, L.; et al. The Historical and Current Research Progress on Jujube–a Superfruit for the Future. Hortic Res 2020, 7, 119. [Google Scholar] [CrossRef] [PubMed]
- Azis, F.A.; Rijal, M.; Suhaimi, H.; Abas, P.E. Patent Landscape of Composting Technology: A Review. Inventions 2022, 7, 38. [Google Scholar] [CrossRef]
- Peticilă, A.G.; Madjar, R.M.; Drăghici, E.M.; Stănică, F.; Asănică, A.; Ciubotărăşu, R.; Butcaru, A.C. Results Regarding the 24-Hour Composts (Oklin) Composition and Their Use as Fertiliser. Scientific Papers. Series B, Horticulture 2023, LXVII, 536–545. [Google Scholar]
- Kliopova, I.; Staniškis, J.K.; Stunžėnas, E.; Jurovickaja, E. Bio-Nutrient Recycling with a Novel Integrated Biodegradable Waste Management System for Catering Companies. Journal of Cleaner Production 2019, 209, 116–125. [Google Scholar] [CrossRef]
- Raclavská, H.; Růžičková, J.; Juchelková, D.; Šafář, M.; Brťková, H.; Slamová, K. The Quality of Composts Prepared in Automatic Composters from Fruit Waste Generated by the Production of Beverages. Bioresource Technology 2021, 341, 125878. [Google Scholar] [CrossRef]
- Kucbel, M.; Raclavská, H.; Růžičková, J.; Švédová, B.; Sassmanová, V.; Drozdová, J.; Raclavský, K.; Juchelková, D. Properties of Composts from Household Food Waste Produced in Automatic Composters. Journal of Environmental Management 2019, 236, 657–666. [Google Scholar] [CrossRef]
- Chen, T.; Zhang, S.; Yuan, Z. Adoption of Solid Organic Waste Composting Products: A Critical Review. Journal of Cleaner Production 2020, 272, 122712. [Google Scholar] [CrossRef]
- Walling, E.; Trémier, A.; Vaneeckhaute, C. A Review of Mathematical Models for Composting. Waste Management 2020, 113, 379–394. [Google Scholar] [CrossRef]
- DuPont, T.; Granatstein, D.; Sallato, B. Soil Health in Orchards.
- Assefa, S. The Principal Role of Organic Fertilizer on Soil Properties and Agricultural Productivity -A Review. ARTOAJ 2019, 22. [Google Scholar] [CrossRef]
- Chatzistathis, T.; Kavvadias, V.; Sotiropoulos, T.; Papadakis, I.E. Organic Fertilization and Tree Orchards. Agriculture 2021, 11, 692. [Google Scholar] [CrossRef]
- Lawrence, B.T.; Melgar, J.C. Annual Compost Amendments Can Replace Synthetic Fertilizer, Improve Soil Moisture, and Ensure Tree Performance during Peach Orchard Establishment in a Humid Subtropical Climate. Front. Plant Sci. 2023, 14, 1172038. [Google Scholar] [CrossRef] [PubMed]
- Vatsanidou, A.; Fountas, S.; Liakos, V.; Nanos, G.; Katsoulas, N.; Gemtos, T. Life Cycle Assessment of Variable Rate Fertilizer Application in a Pear Orchard. Sustainability 2020, 12, 6893. [Google Scholar] [CrossRef]
- Wang, Y.; Tang, Y.; Yuan, Z. Improving Food Waste Composting Efficiency with Mature Compost Addition. Bioresource Technology 2022, 349, 126830. [Google Scholar] [CrossRef] [PubMed]
- Shi, C.; Wang, X.; Jiang, S.; Zhang, L.; Luo, J. Revealing the Role of the Rhizosphere Microbiota in Reproductive Growth for Fruit Productivity When Inorganic Fertilizer Is Partially Replaced by Organic Fertilizer in Pear Orchard Fields. Microbial Biotechnology 2023, 16, 1373–1392. [Google Scholar] [CrossRef]
- Musacchi, S. Analysis of Pear Sustainability: What Are the Limitations and Opportunities? Acta Hortic. 2024, 1–20. [Google Scholar] [CrossRef]
- Ghena, N.; Braniste, N. Cultura Specială a Pomilor [Tree Special Cultivation]; Matrix Rom: Bucharest, 2003. [Google Scholar]
- Andreies, N. Achievements in Pear Breeding Obtained at the Voinești Fruit Growing Research and Development Station; Pitesti: Arges, 2017. [Google Scholar]
- Stănică, F.; Asănică, A.C.; Mihai, C.A.; Butcaru, A.C.; Andreieș, N. Fire-Blight Tolerant/Resistant Romanian Pear Cultivars. Acta Hortic. 2024, 95–104. [Google Scholar] [CrossRef]
- Musacchi, S.; Iglesias, I.; Neri, D. Training Systems and Sustainable Orchard Management for European Pear (Pyrus Communis L.) in the Mediterranean Area: A Review. Agronomy 2021, 11, 1765. [Google Scholar] [CrossRef]
- Sharma, J.B.; Chauhan, N.; Rana, K.; Bakshi, M. Evaluation of Rootstocks for Temperate Fruit Crops-A Review. Int.J.Curr.Microbiol.App.Sci 2020, 9, 3533–3539. [Google Scholar] [CrossRef]
- Plavcová, L.; Mészáros, M.; Šilhán, K.; Jupa, R. Relationships between Trunk Radial Growth and Fruit Yield in Apple and Pear Trees on Size-Controlling Rootstocks. Annals of Botany 2022, 130, 477–489. [Google Scholar] [CrossRef]
- Öztürk, A. The Effects of Different Rootstocks on the Graft Success and Stion Development of Some Pear Cultivars. International Journal of Fruit Science 2021, 21, 932–944. [Google Scholar] [CrossRef]
- Spornberger, A.; Osterc, G.; Schüller, E.; Noll, D. Vermehrung von Birnenbäumen der Sorte ‘Uta’ als Grünsteckling und Anbauverhalten im Vergleich zu Wurzelechten aus in vitro Vermehrung und auf zwei Unterlagen veredelten Bäumen unter biologischen Anbaubedingungen in Ostösterreich. Erwerbs-Obstbau 2021, 63, 125–133. [Google Scholar] [CrossRef]
- Coban, N. Effect of Rootstock and Cultivars on Some Branch and Leaf Characteristics in Pear. Turk J Food Agric Sci 2020. [Google Scholar] [CrossRef]
- Kurt, T.; Öztürk, A.; FaíZí, Z.A. Survival Rate of Young Pear Trees in Different Rootstock and Cultivar Combinations under Field Conditions: Preliminary Results. ANADOLU JOURNAL OF AGRICULTURAL SCIENCES. [CrossRef]
- Pasa, M.D.S.; Schmitz, J.D.; Rosa Júnior, H.F.D.; Souza, A.L.K.D.; Malgarim, M.B.; Mello-Farias, P.C.D. Performance of ‘William’s’ Pear Grafted onto Three Rootstocks. Rev. Ceres 2020, 67, 133–136. [Google Scholar] [CrossRef]
- Mészáros, M.; Laňar, L.; Kosina, J.; Náměstek, J. Aspects Influencing the Rootstock - Scion Performance during Long Term Evaluation in Pear Orchard. Hortic. Sci. 2019, 46, 1–8. [Google Scholar] [CrossRef]
- Kul, Y.M.; Öztürk, A.; Faizi, Z.A. Evaluation of Different Rootstocks and Cultivars on Pruning Weight in Young Pear Trees. Black Sea Journal of Agriculture 2022, 5, 440–447. [Google Scholar] [CrossRef]
- Almeida, G.K.D.; Fioravanço, J.C.; Marodin, G.A.B. Vegetative Growth and Productive Performance of “Abate Fetel” and “Rocha” Pear Trees on Quince Rootstocks. Pesq. agropec. bras. 2020, 55, e01306. [Google Scholar] [CrossRef]
- Caracciolo, G.; Pietrella, M.; Pallotti, G.; Faedi, G.; Sirri, S.; Baruzzi, G. Productivity and Fruit Quality of ‘FalstaffPBR’ Pear Variety Grafted on Different Rootstocks. Horticulturae 2024, 10, 237. [Google Scholar] [CrossRef]
- Hudina, M.; Jakopic, J.; Veberic, R. Long-Term Performance of the Pear ( Pyrus Communis L.) Cultivars ‘Williams’, ‘Abate Fetel’ and ‘Conference’ Grafted on Various Rootstocks. Acta Hortic. [CrossRef]
- Iqbal, M.; Singh, K.K. Propagation of Temperate Fruit Crops.
- Sete, P.B.; Comin, J.J.; Nara Ciotta, M.; Almeida Salume, J.; Thewes, F.; Brackmann, A.; Toselli, M.; Nava, G.; Rozane, D.E.; Loss, A.; et al. Nitrogen Fertilization Affects Yield and Fruit Quality in Pear. Scientia Horticulturae 2019, 258, 108782. [Google Scholar] [CrossRef]
- Wu, Y.; Sun, M.; Liu, J.; Wang, W.; Liu, S. Fertilizer and Soil Nitrogen Utilization of Pear Trees as Affected by the Timing of Split Fertilizer Application in Rain-Fed Orchard. Scientia Horticulturae 2019, 252, 363–369. [Google Scholar] [CrossRef]
- Bright, J. Apple and Pear Nutrition.
- Chira, L.; Chira, A.; Delian, E.; Ion, L.; Nicolae, C. Studies Regarding the Economical Approach of Pear Fruits Commercialization According to the Qualitative Aspects. Scientific Papers Series Management, Economic Engineering in Agriculture and Rural Development 2020, 20, 131–136. [Google Scholar]
- Wertheim, S.J. Rootstocks for European Pear: A Review. Acta Hortic. 2002, 299–309. [Google Scholar] [CrossRef]
- Moț, A.; Ion, V.A.; Madjar, R.M.; Bădulescu, L. Dynamic PREGL-DUMAS Technique Applied in Nitrogen Determination from Inputs Used in Organic Agriculture. Scientific Papers. Series A. Agronomy 2022, LXV, 105–110. [Google Scholar]
- Butcaru, A.C. Post-Harvest Monitoring of Pear Fruit Quality Parameters Using Da-Meter. An. U Craiova, Biol. Hortic. Food. Env. 2021, 26, 21–26. [Google Scholar] [CrossRef]
- Tahir, I.; Vangdal, E. Determination of Optimum Harvest Maturity for Five Apple Cultivars Using the Chlorophyll Absorbance Index. Acta Hortic. 2019, 219–224. [Google Scholar] [CrossRef]
- Turpin, S.R.; Stefanelli, D.; Jones, L.; Norton, J.; Probst, R.; Konings, J.; Langford, G. Perfect Pears for the next Generation of Consumers. Acta Hortic. 2016, 507–514. [Google Scholar] [CrossRef]
- Bonora, E. Modeling Systems and Vis/NIR Device to Improve Peach and Nectarine Pre and Post-Harvest Fruit Maturity Management 2013.
- Vidoni, S.; Rocchi, L.; Donati, I.; Spinelli, F.; Costa, G. Combined Use of Planttoon® and IAD to Characterize Fruit Ripening Homogeneity in “Abbé Fétel” Pears. Acta Hortic. 2015, 495–499. [Google Scholar] [CrossRef]
- Torres, C.A.; Valdivia, A.; Jorquera, G.; Hernandez, O. The Use of DA Meter to Assess Apple and Pear Maturity in Chile. Acta Hortic. 2019, 63–70. [Google Scholar] [CrossRef]
- Gomes, R.; Silva, F.; Oliveira, C.M. Utilizing the I AD Index to Predict ‘Rocha’ Pear Quality and Physiological Disorders after Storage. Acta Hortic. 2021, 461–468. [Google Scholar] [CrossRef]
- Costa, G.; Rocchi, L.; Farneti, B.; Busatto, N.; Spinelli, F.; Vidoni, S. Use of Nondestructive Devices to Support Pre- and Postharvest Fruit Management. Horticulturae 2016, 3, 12. [Google Scholar] [CrossRef]
- Wang, Y.; Castagnoli, S.; Sugar, D. Yan Wang; Castagnoli, S.; Sugar, D. Integrating IAD Index into the Current Firmness-Based Maturity Assessment of European Pears. Acta Hortic. [CrossRef]
- Wang, D.; Ding, C.; Feng, Z.; Ji, S.; Cui, D. Recent Advances in Portable Devices for Fruit Firmness Assessment. Critical Reviews in Food Science and Nutrition 2023, 63, 1143–1154. [Google Scholar] [CrossRef]
- Dar, M.A.; Wani, J.A.; Sanjay Kumar, R.; Bhat, M.Y.; Malik, M.A. Relationship of Leaf Nutrient Content with Fruit Yield and Quality of Pear. Journal of Environmental Biology 36, 649–655.
- Perazzoli, B.E.; Pauletti, V.; Quartieri, M.; Toselli, M.; Gotz, L.F. Changes in Leaf Nutrient Content and Quality of Pear Fruits by Biofertilizer Application in Northeastern Italy. Rev. Bras. Frutic. 2020, 42, e-530. [Google Scholar] [CrossRef]
- Kučinskas, O.; Marozas, V.; Kučinskas, O. Diurnal and Seasonal Soil CO2 Efflux Variation in Scots Pine (Pinus Sylvestris L.) Forests in the European Hemi-Boreal Zone, Lithuania. J. Elem. [CrossRef]
- Sasnauskienė, J.; Sabienė, N.; Marozas, V.; Česonienė, L.; Lingytė, K. Soil respiration in stands of different tree species. In Proceedings of the Proccedings of International Scientific Conference “RURAL DEVELOPMENT 2017”; Aleksandras Stulginskis University: Aleksandras Stulginskis University, Lithuania, February 15 2018. [Google Scholar]
Figure 1.
Romanian disease-resistant pear cultivars
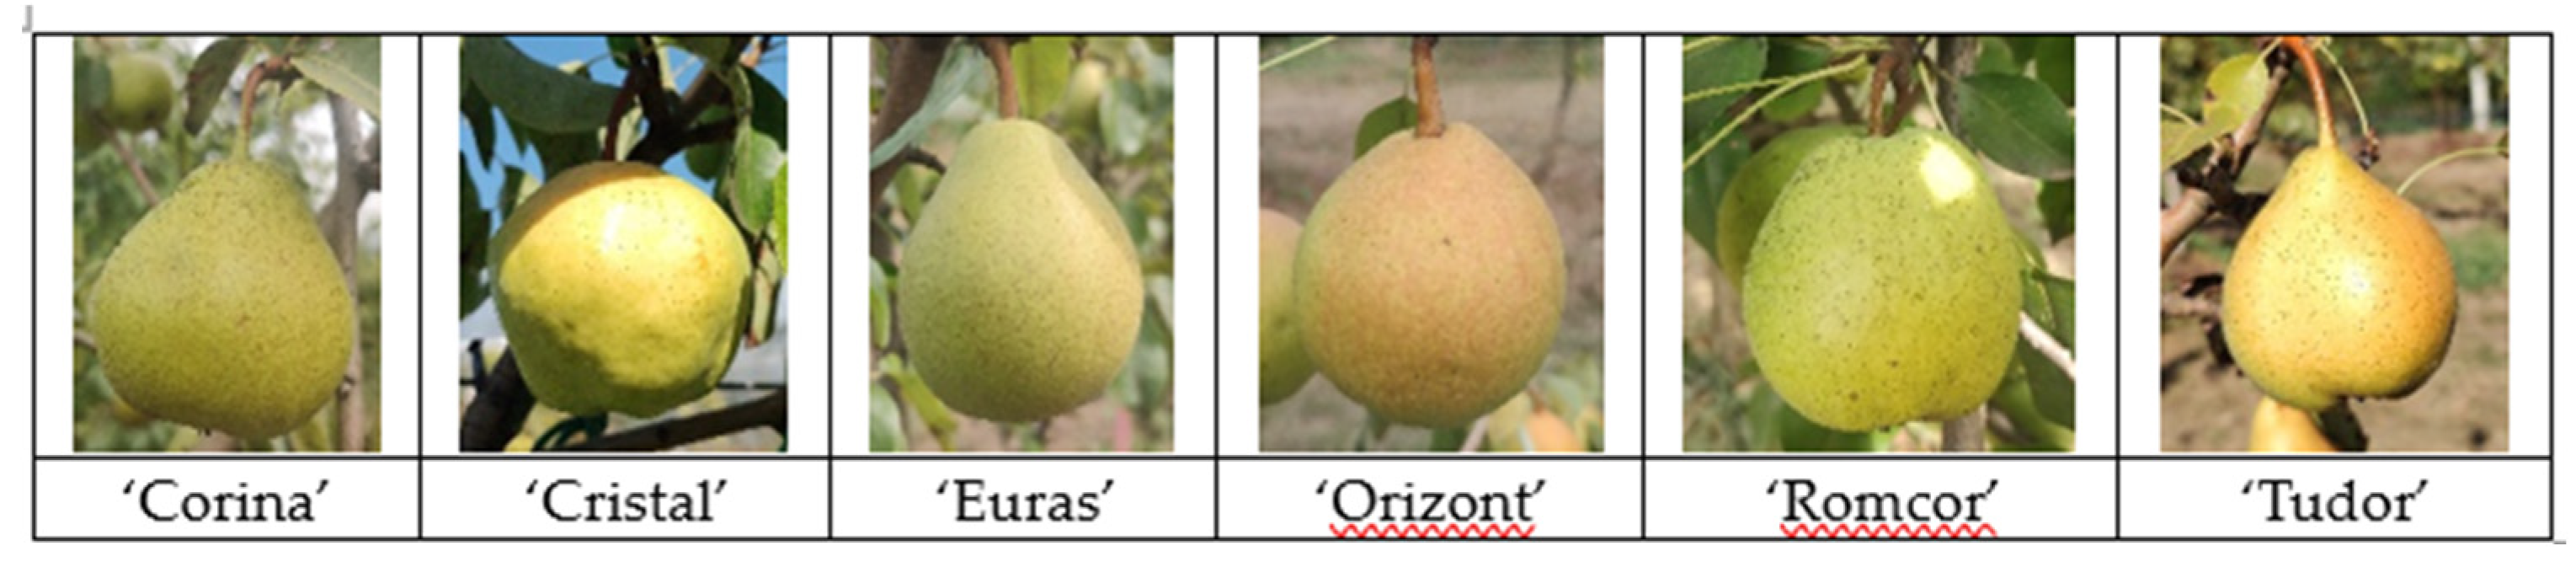
Figure 2.
The experimental design for compost fertilization study
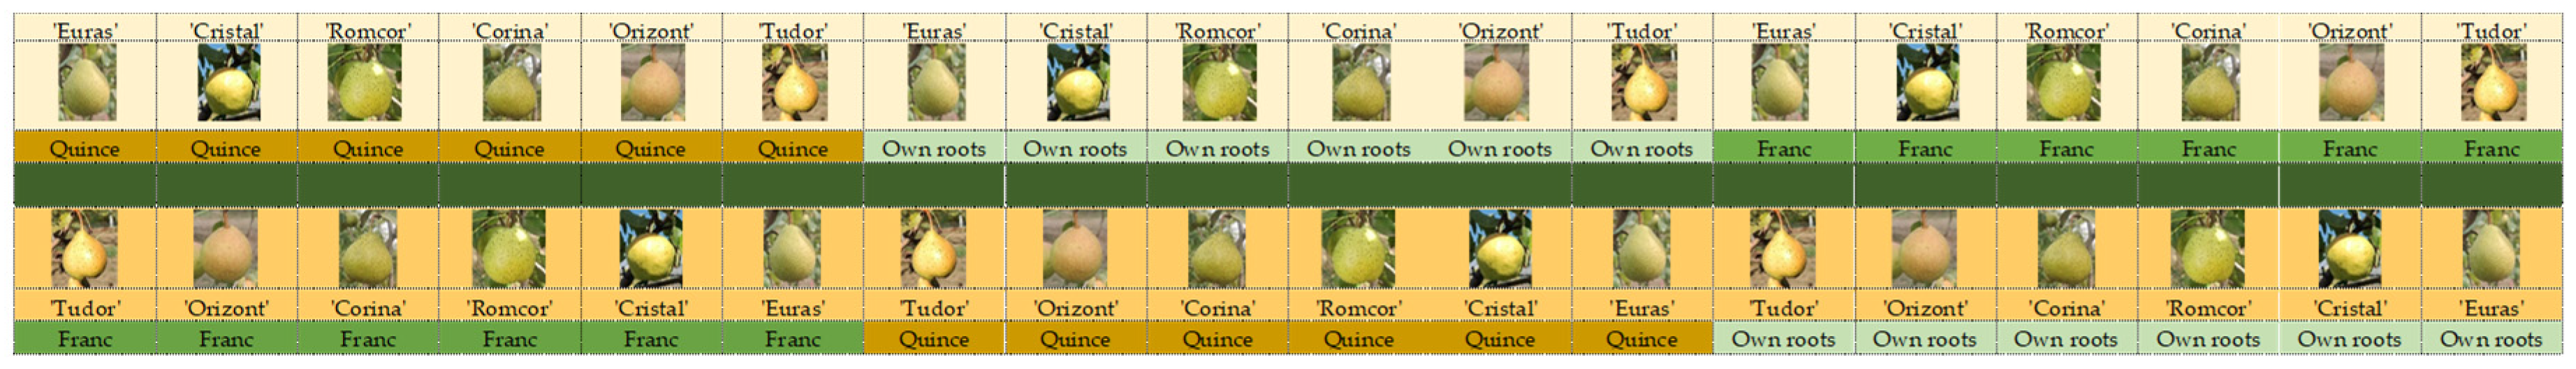
Figure 3.
Total N content (%) dynamic for ‘Tudor’ cultivar.
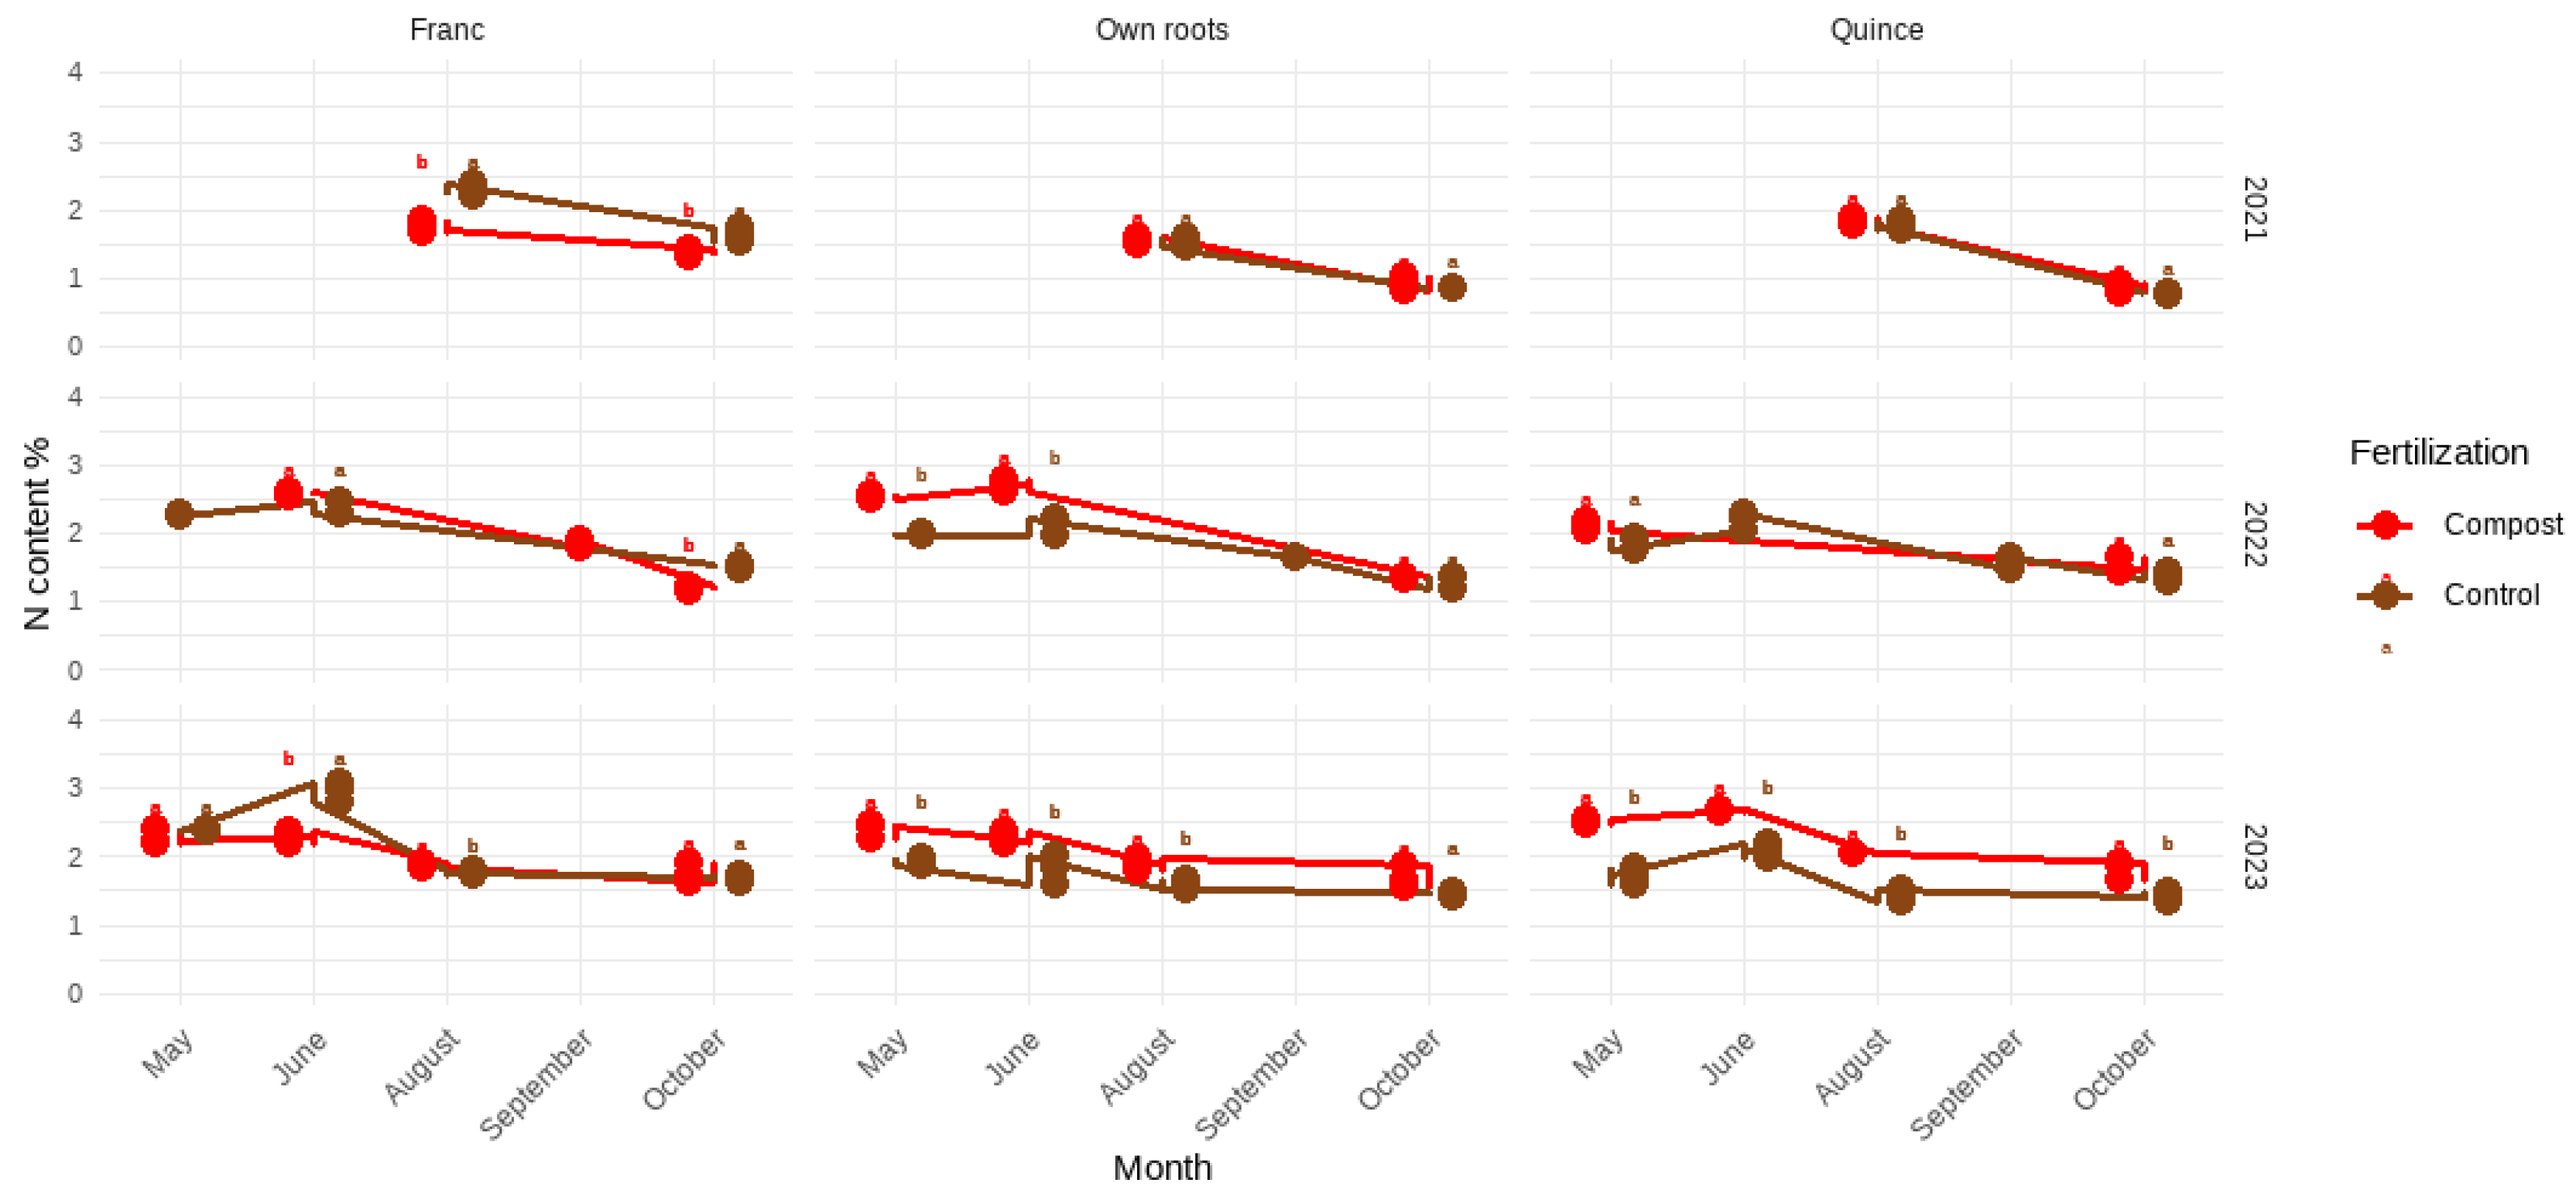
Figure 4.
Total N content (%) dynamic for ‘Corina’ cultivar
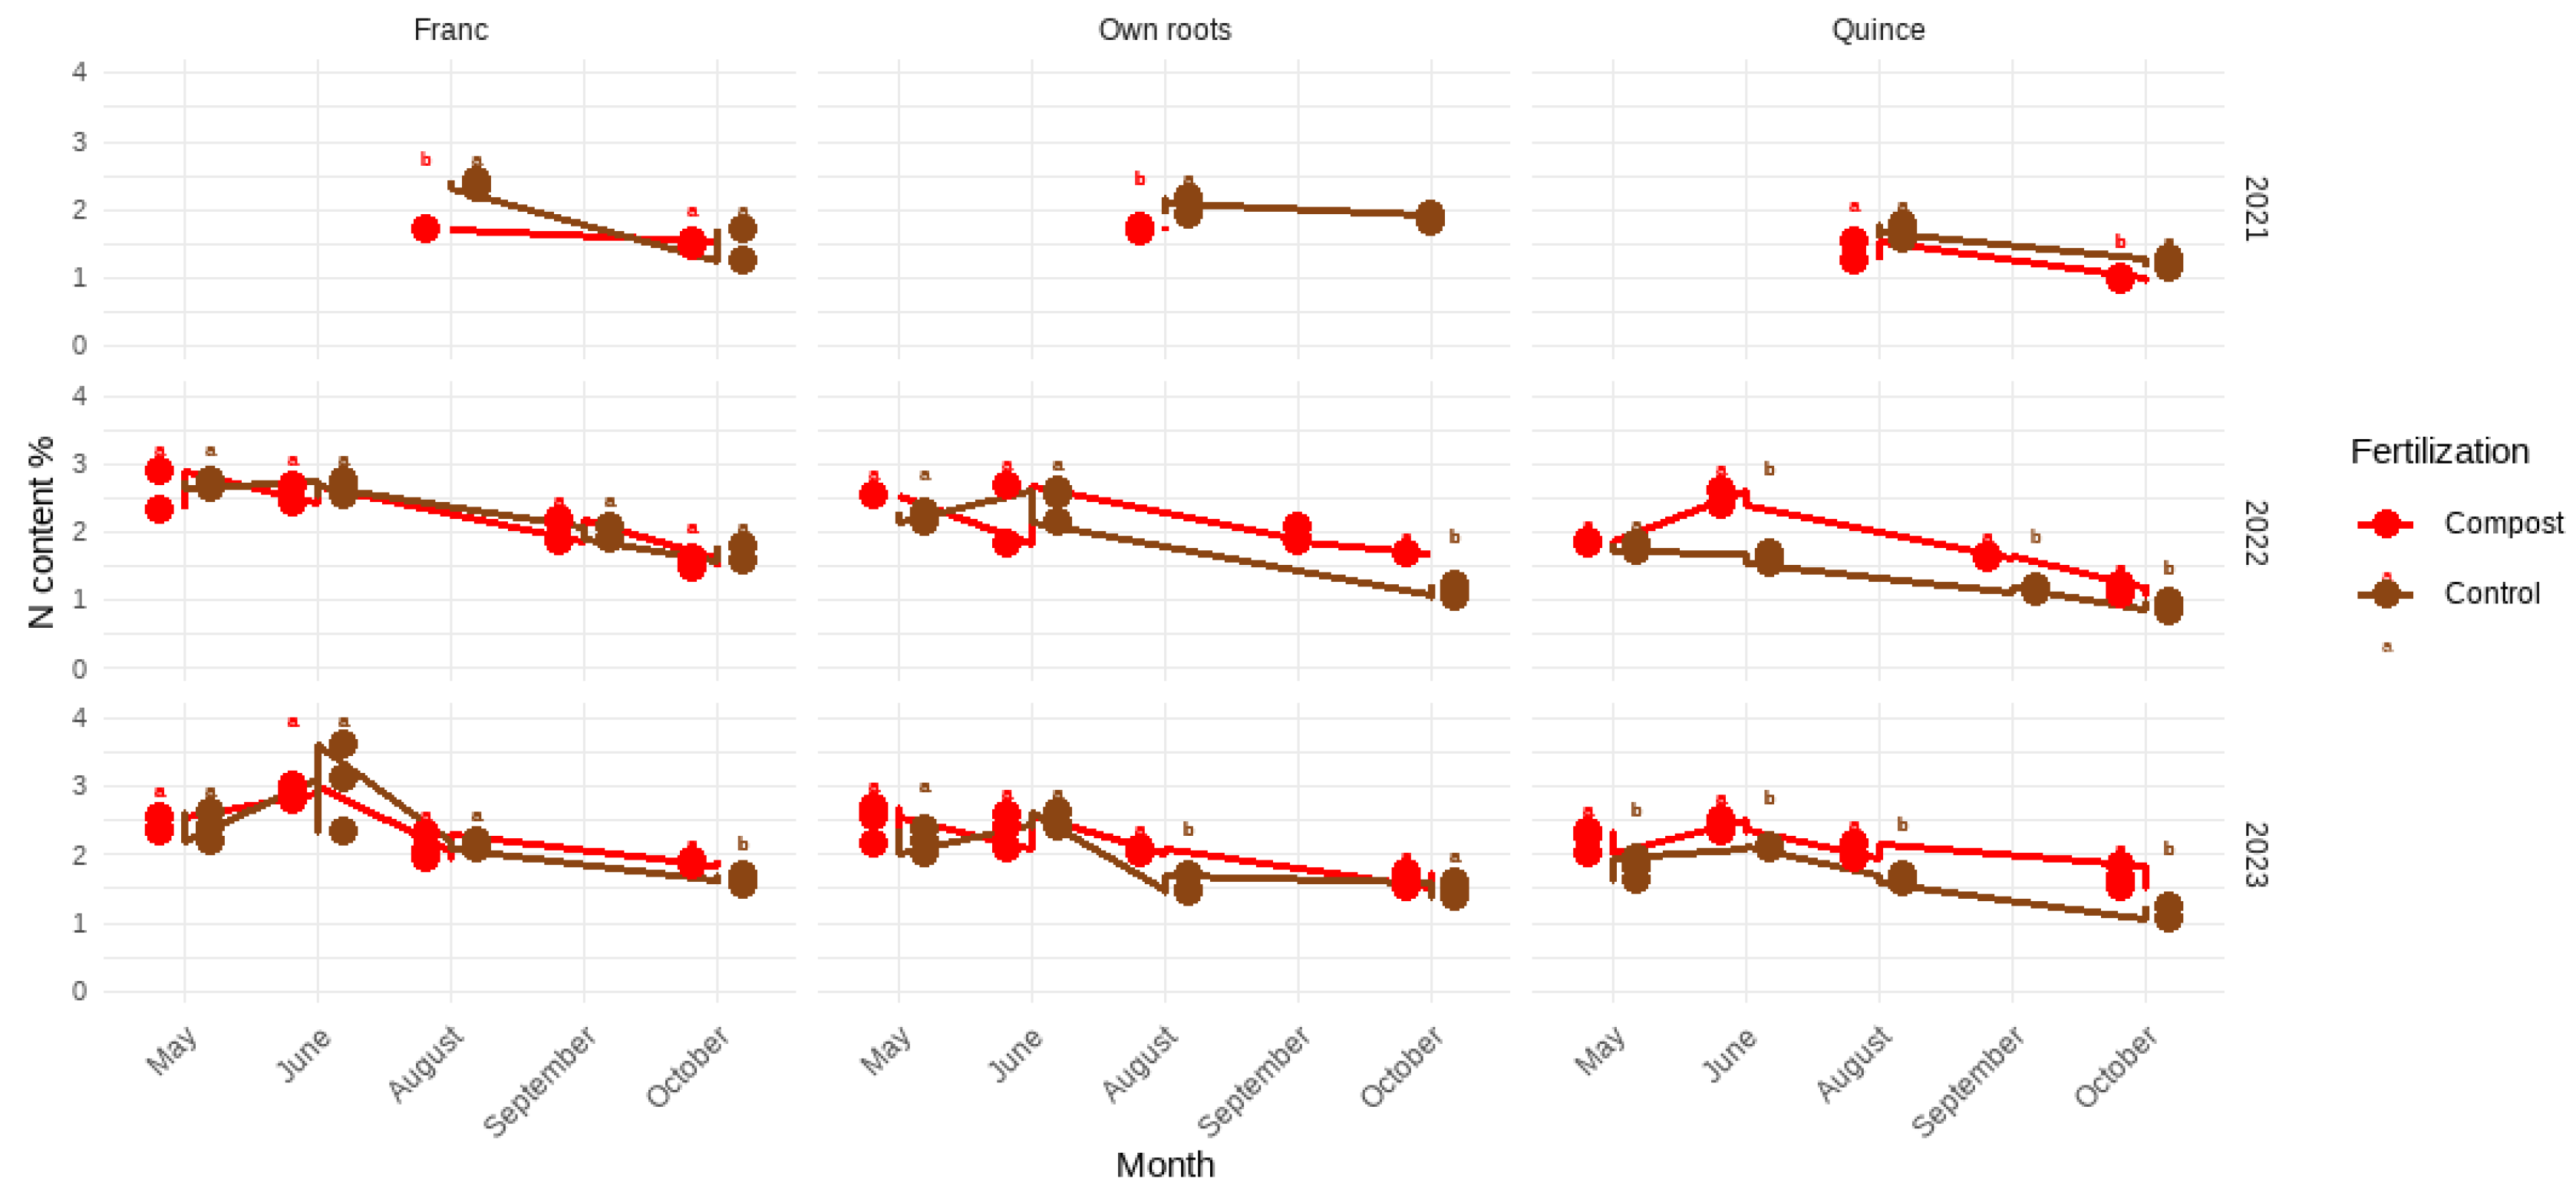
Figure 5.
Total N content (%) dynamic for the ‘Cristal’ cultivar
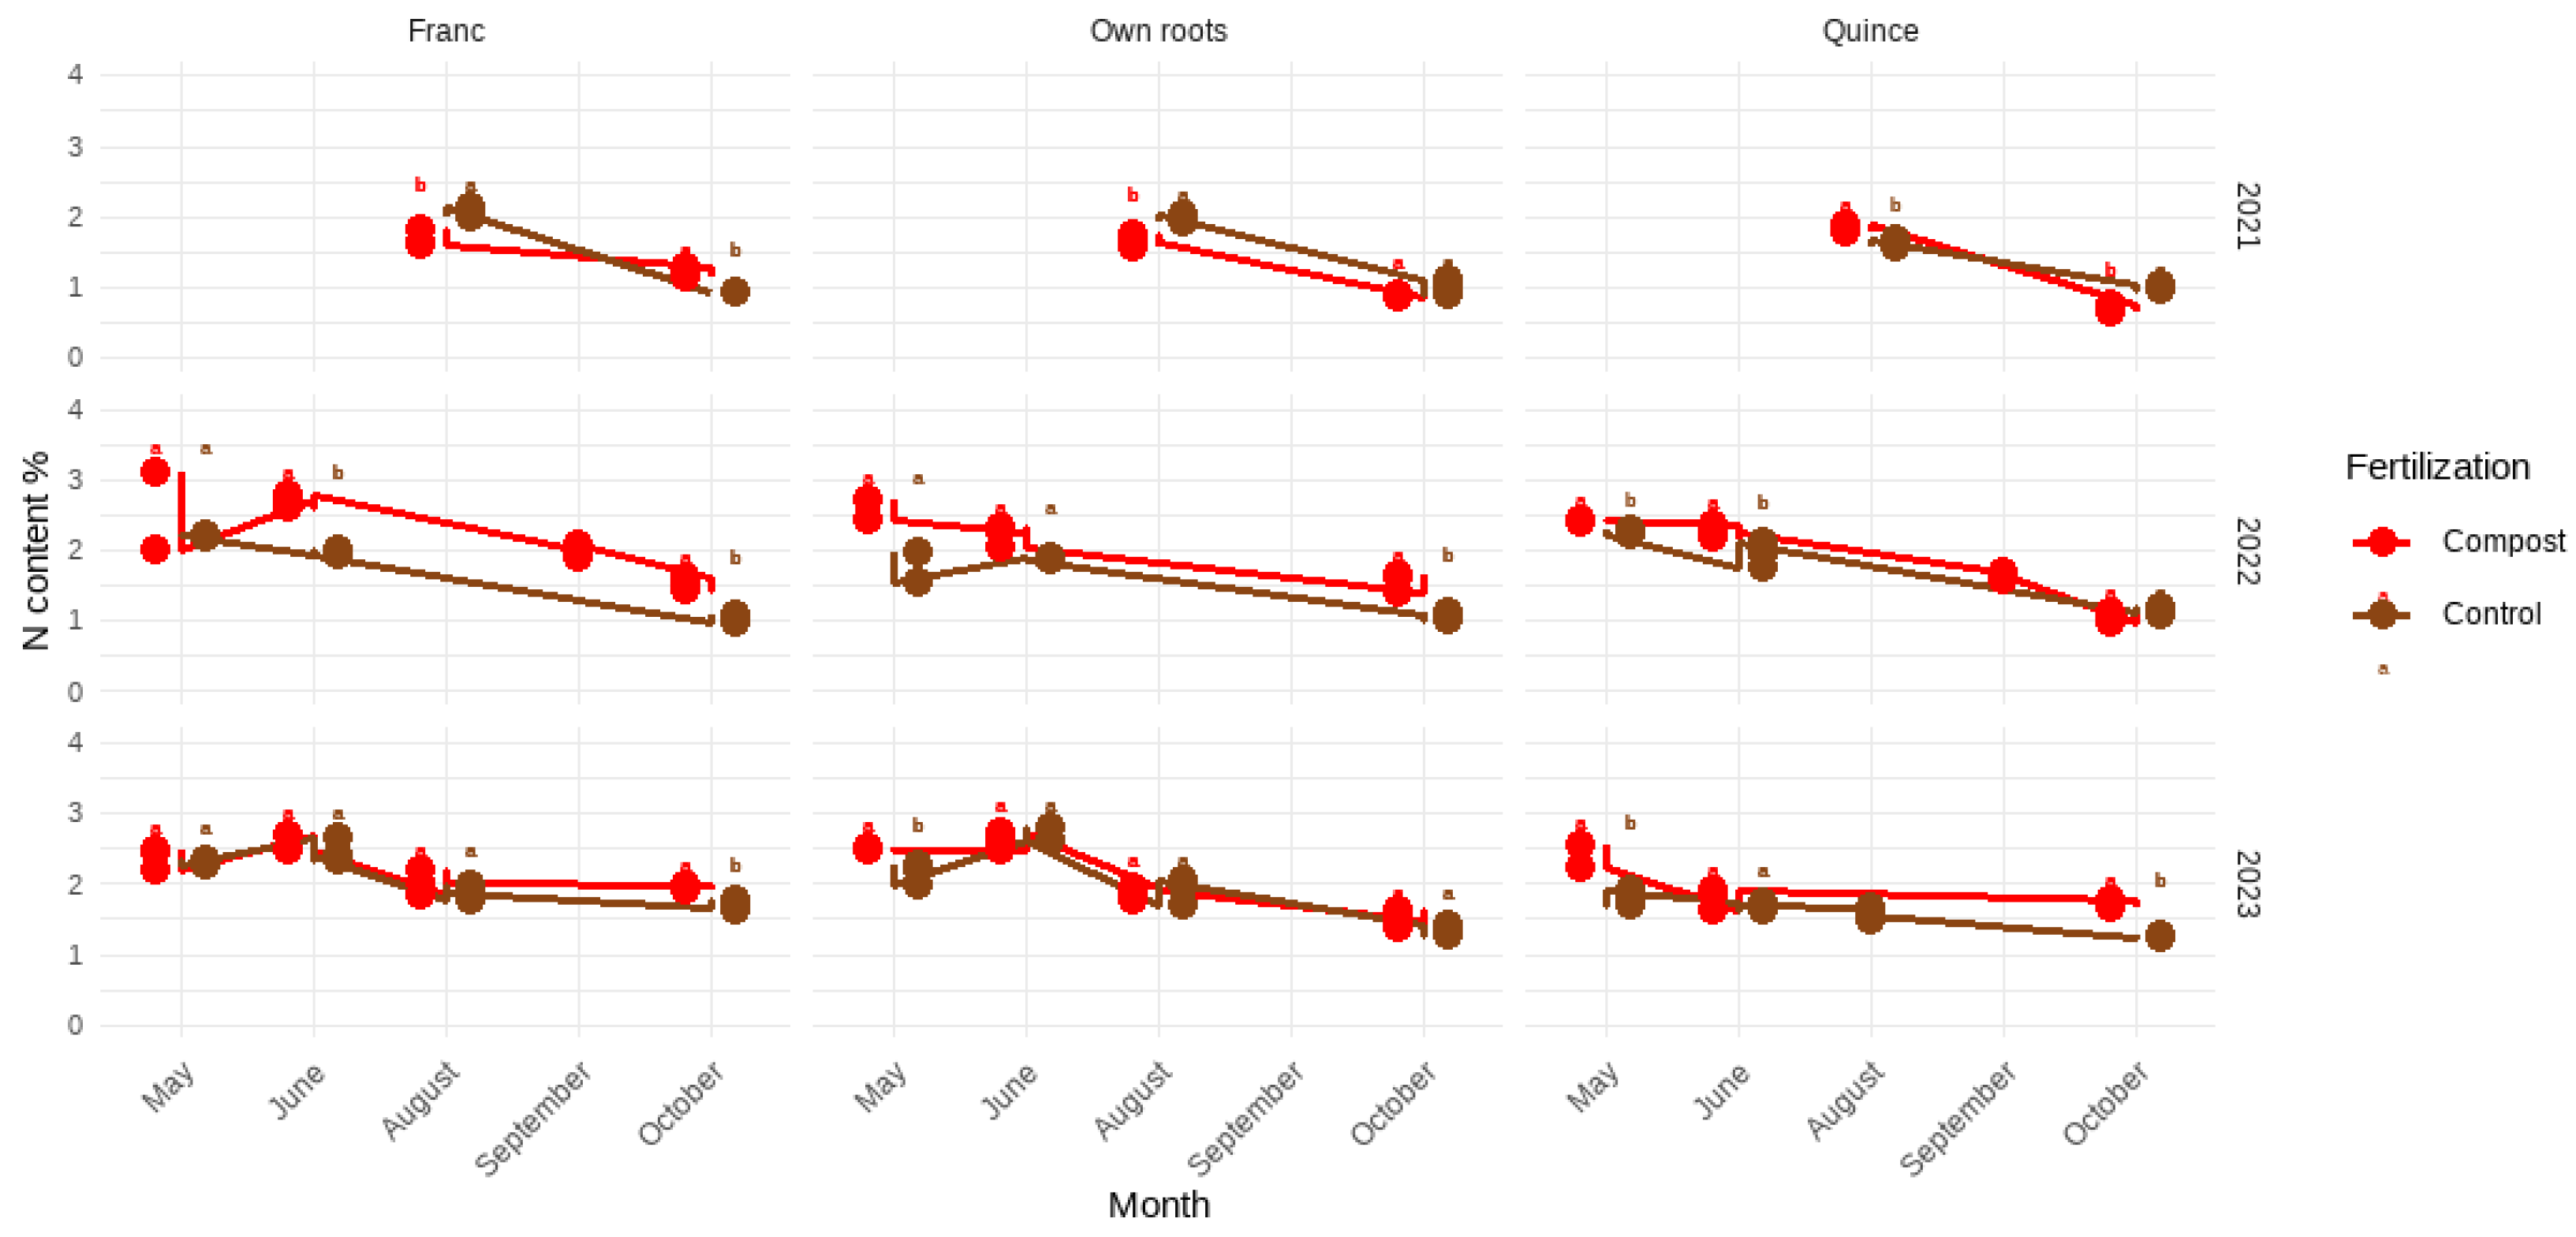
Figure 6.
Total N content (%) dynamic for ‘Orizont’ cultivar
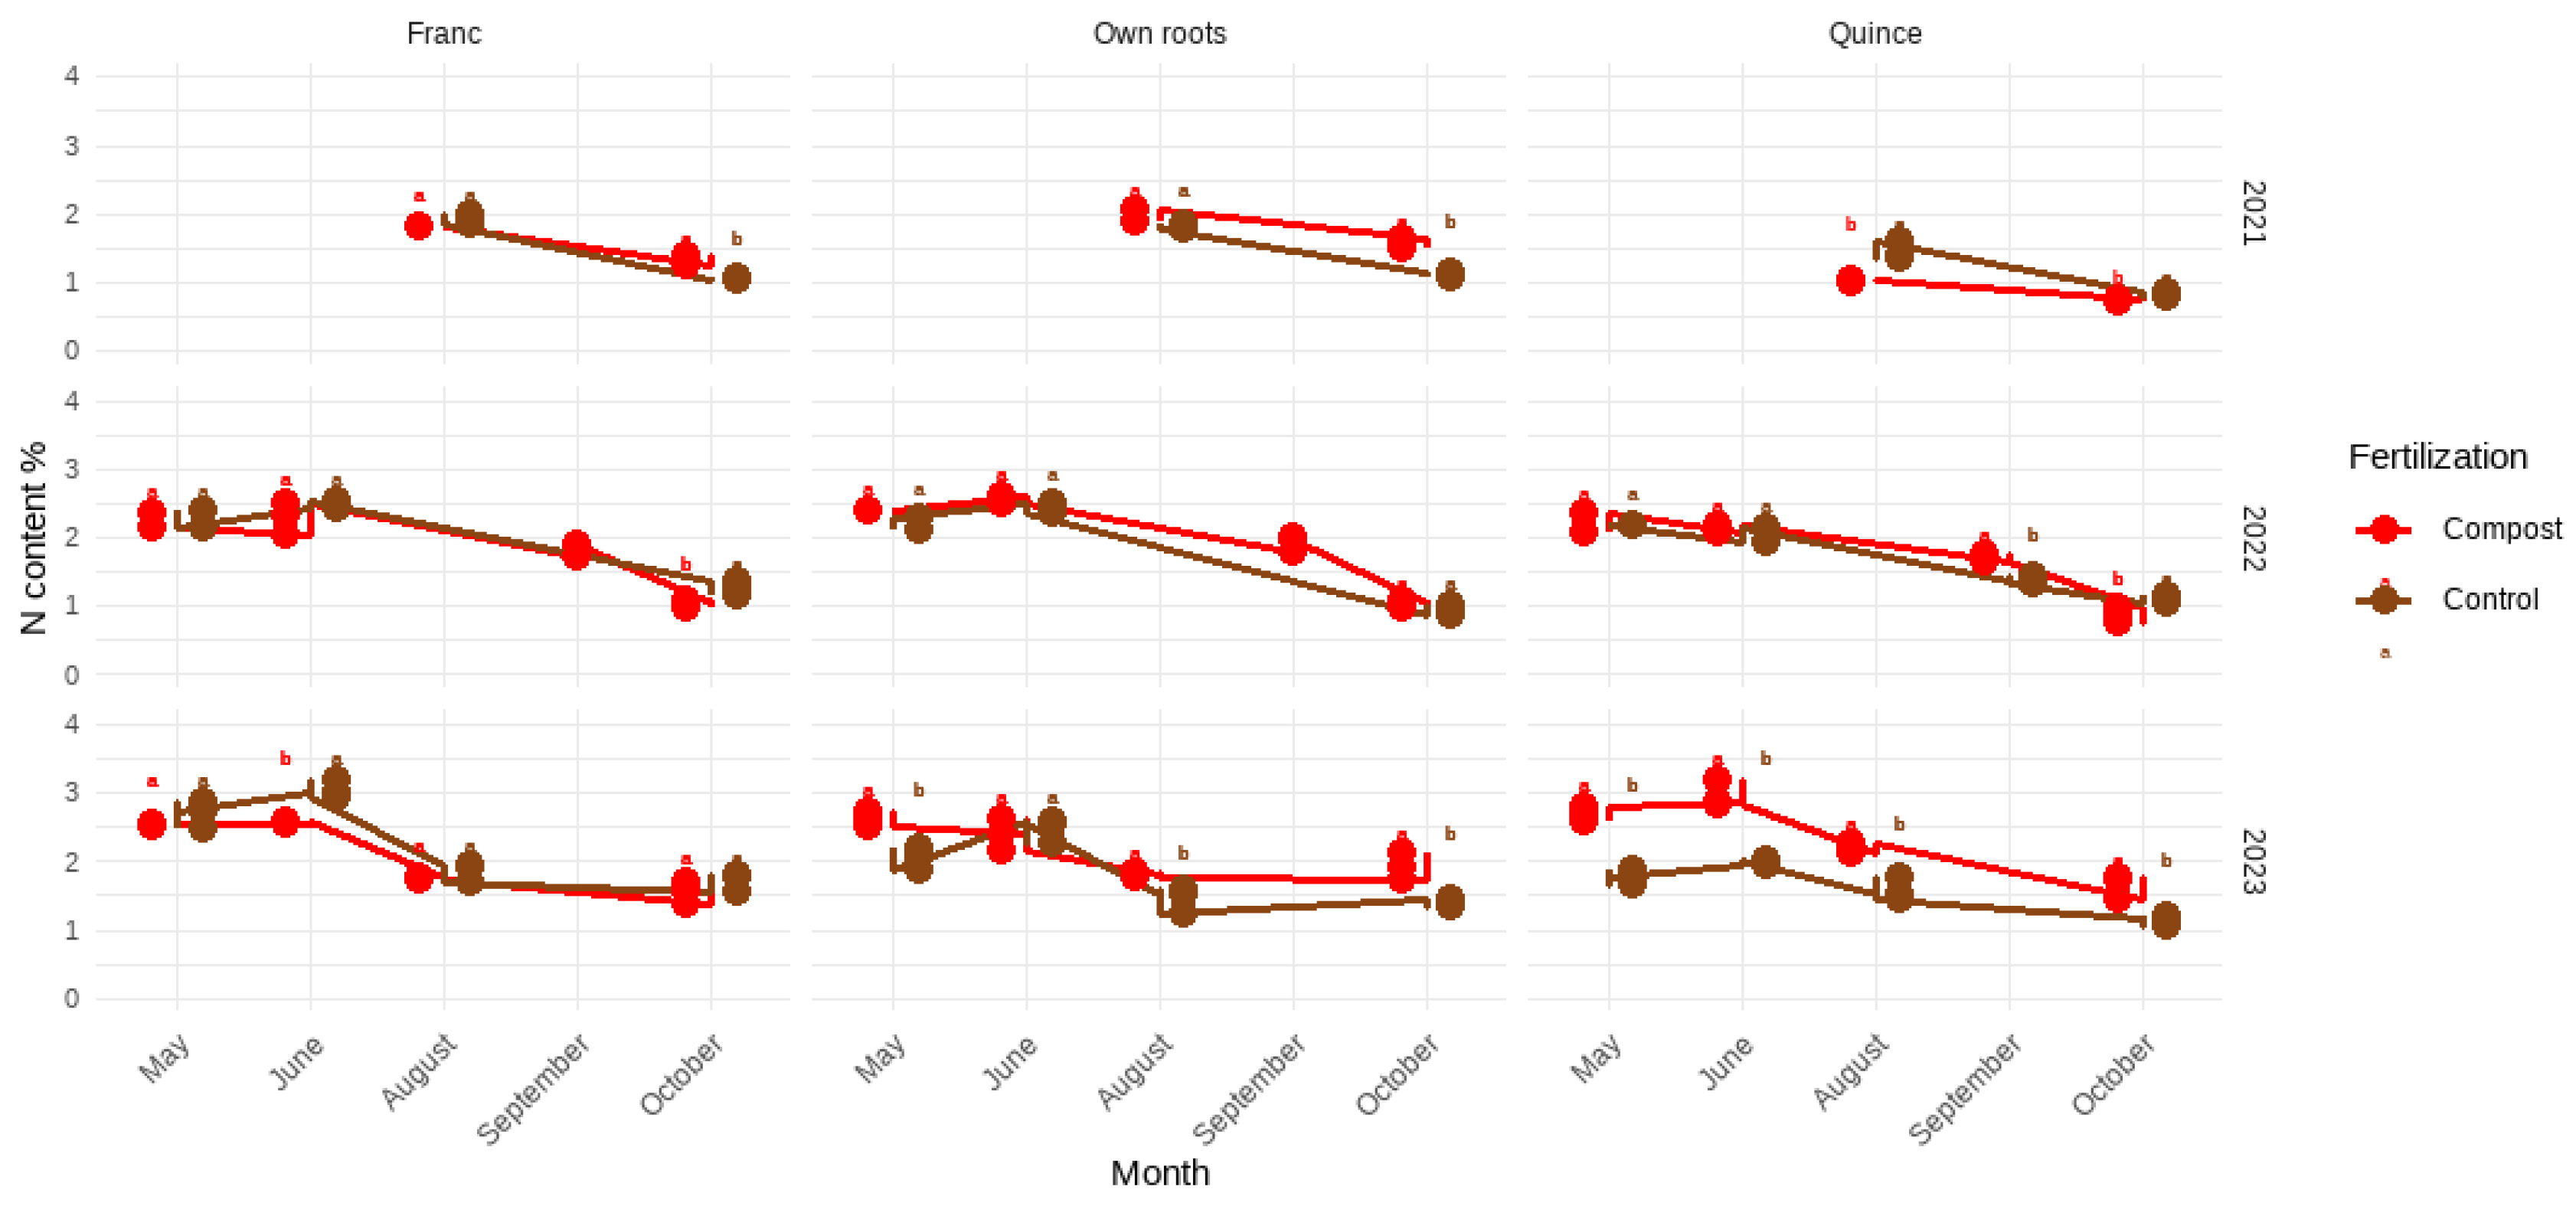
Figure 7.
Total N content (%) dynamic for ‘Romcor’ cultivar
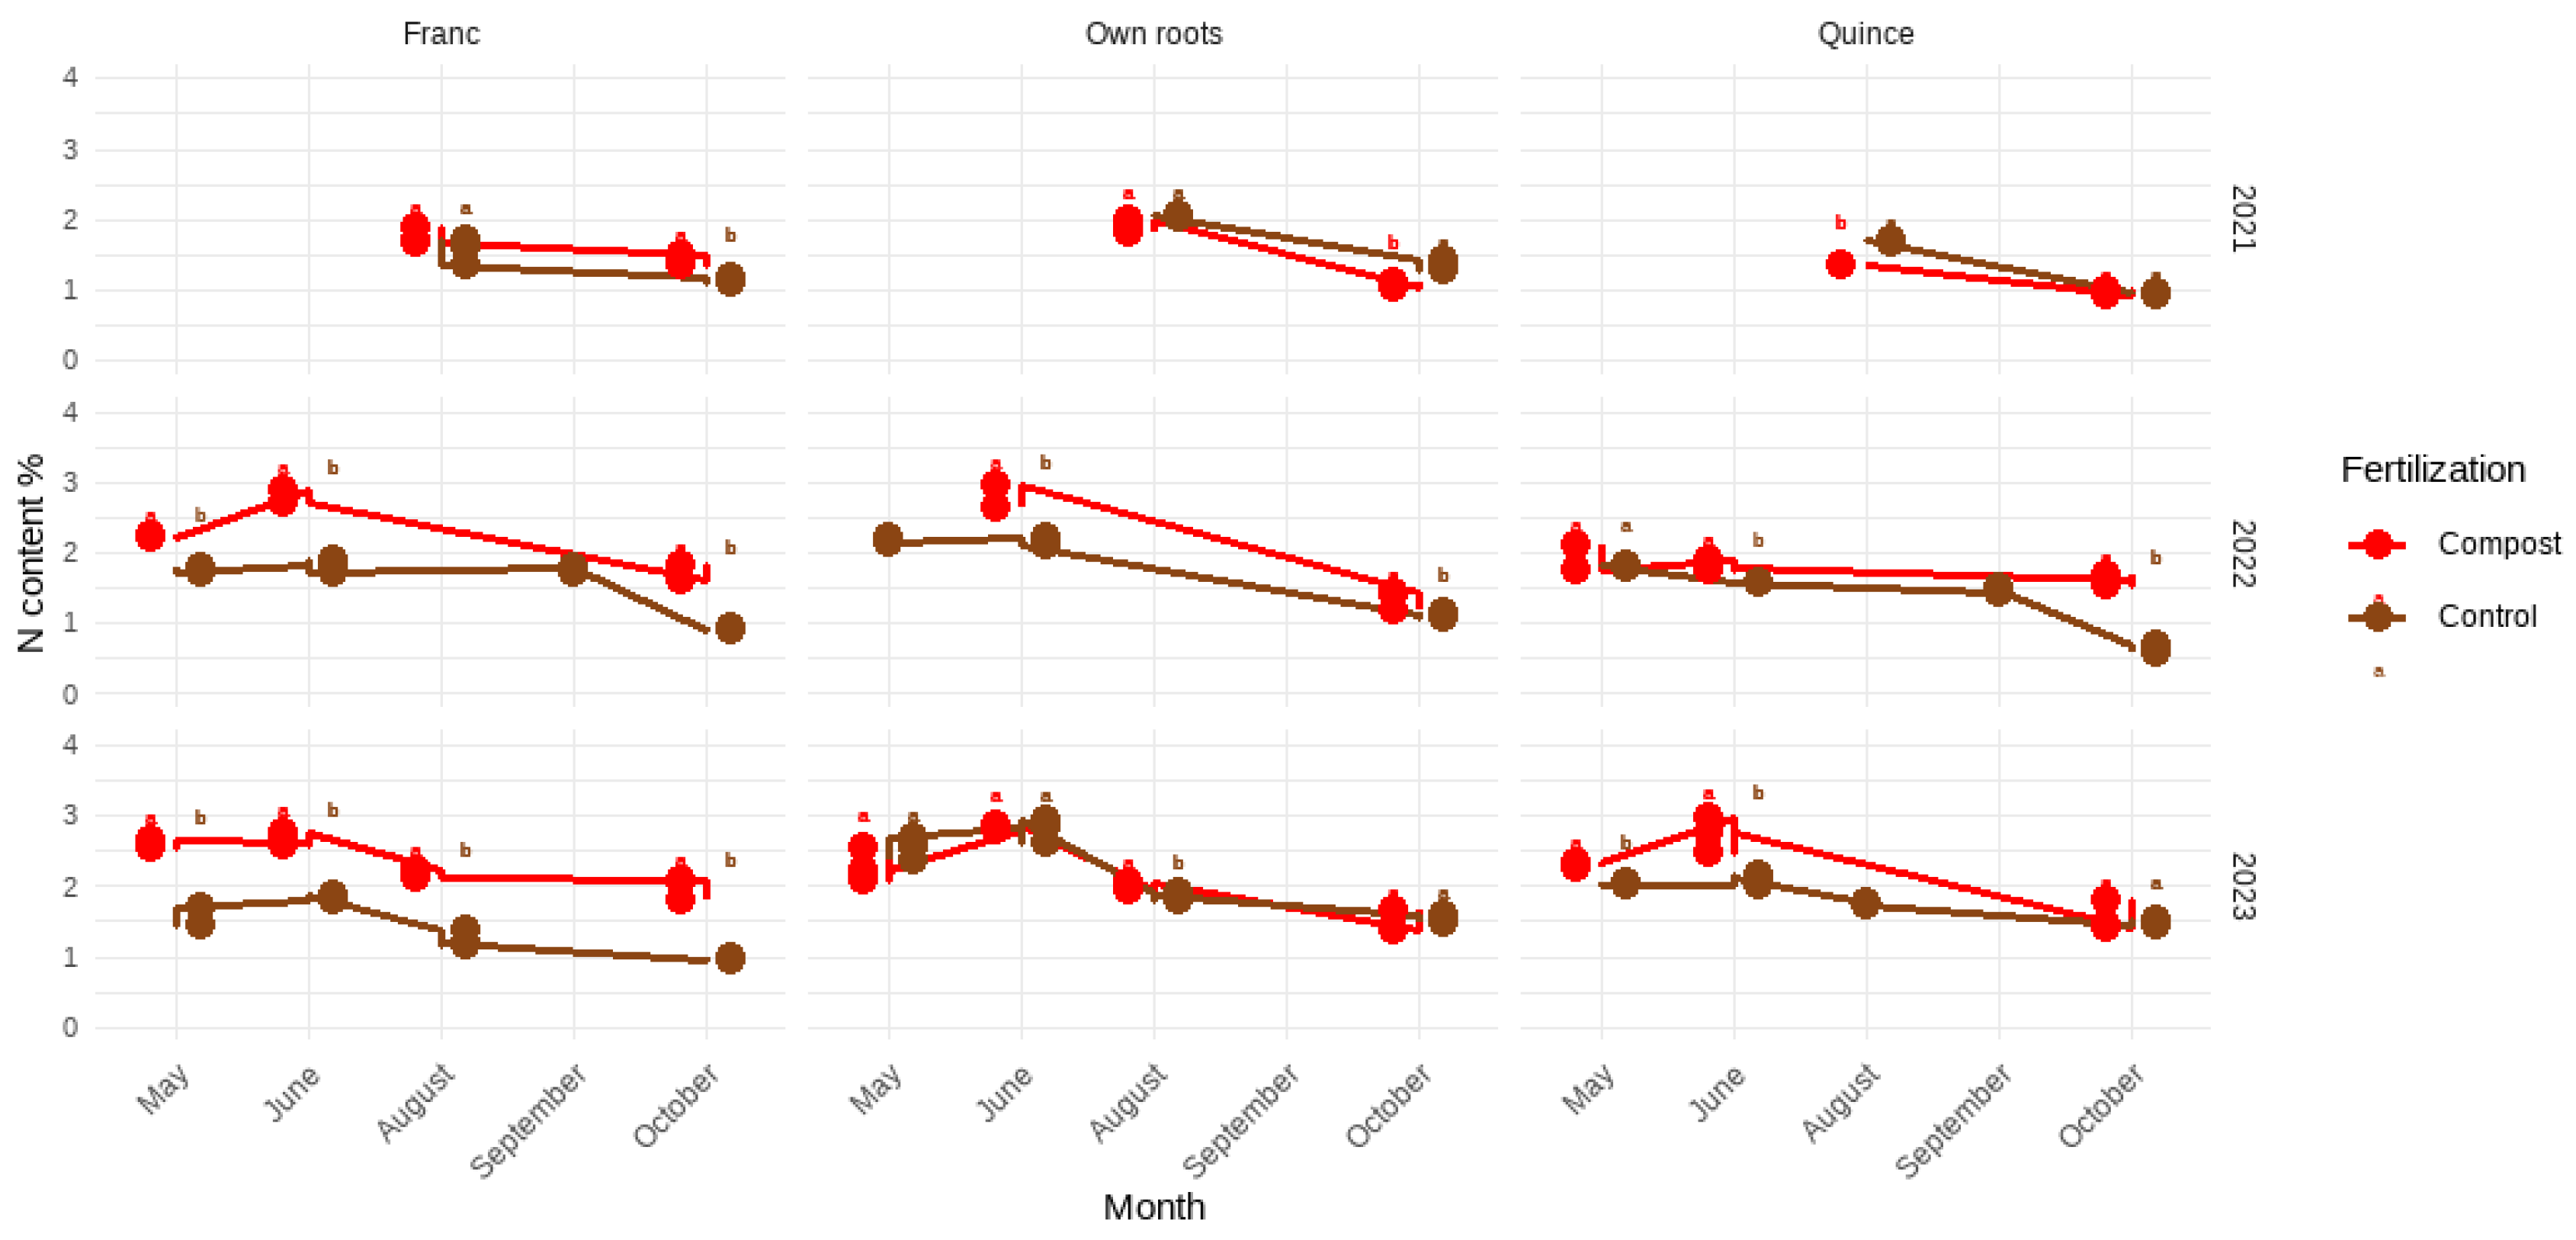
Figure 8.
Total N content (%) dynamic for ‘Euras’ cultivar
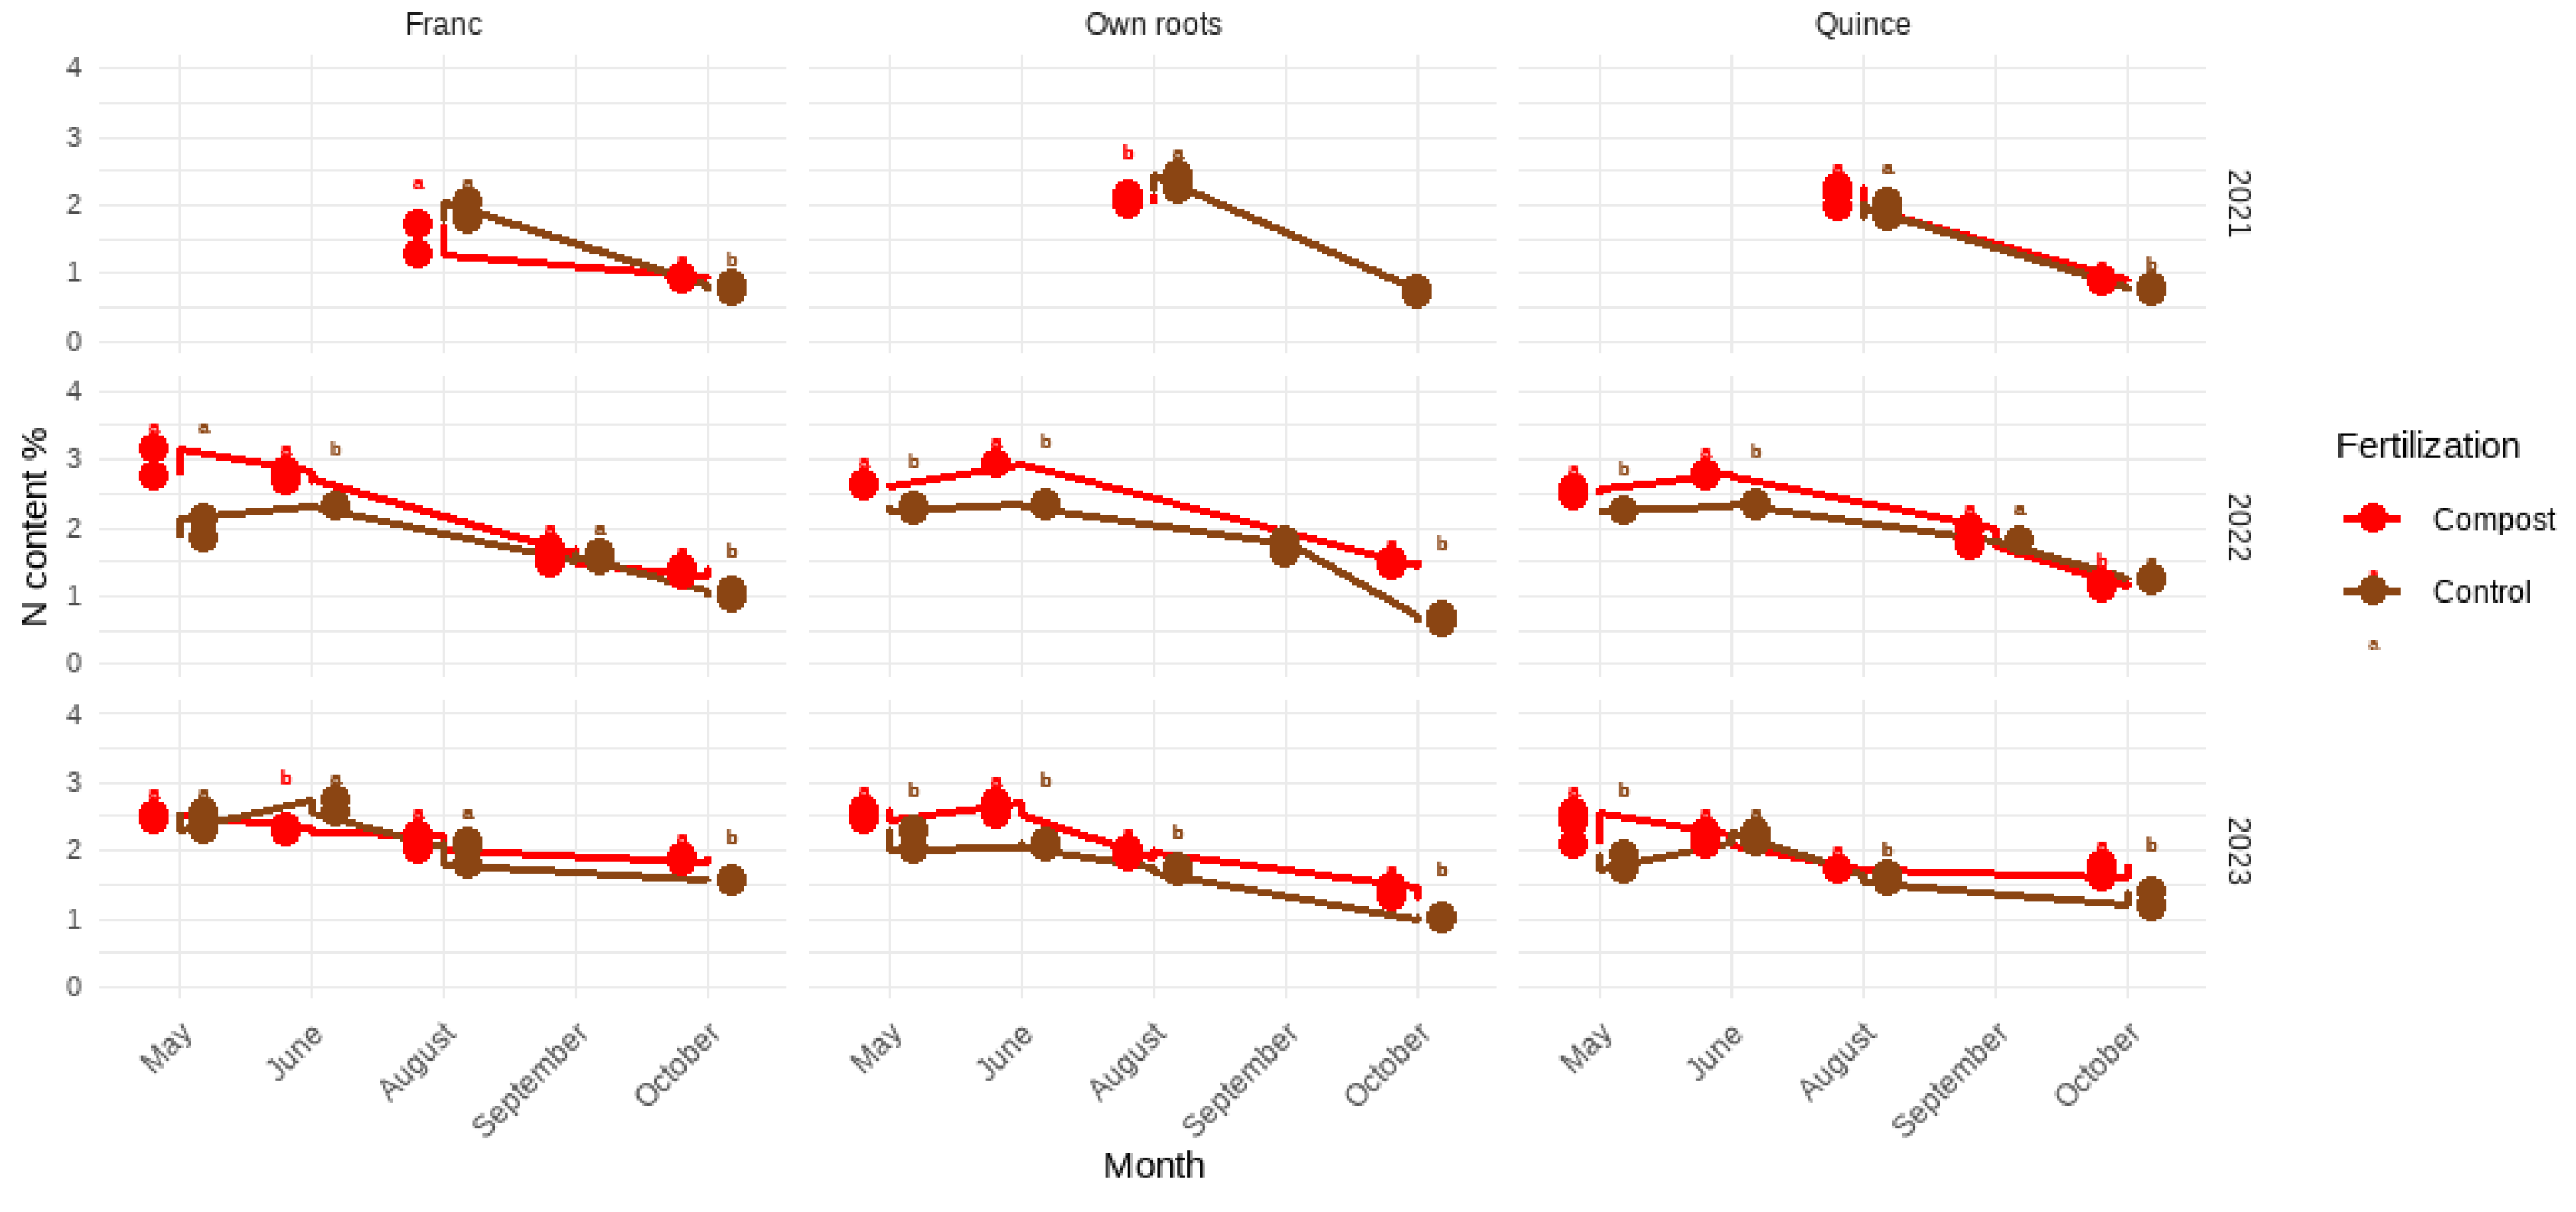
Figure 9.
Comparison between cultivars on Quince rootstock, total N content (%) dynamic.
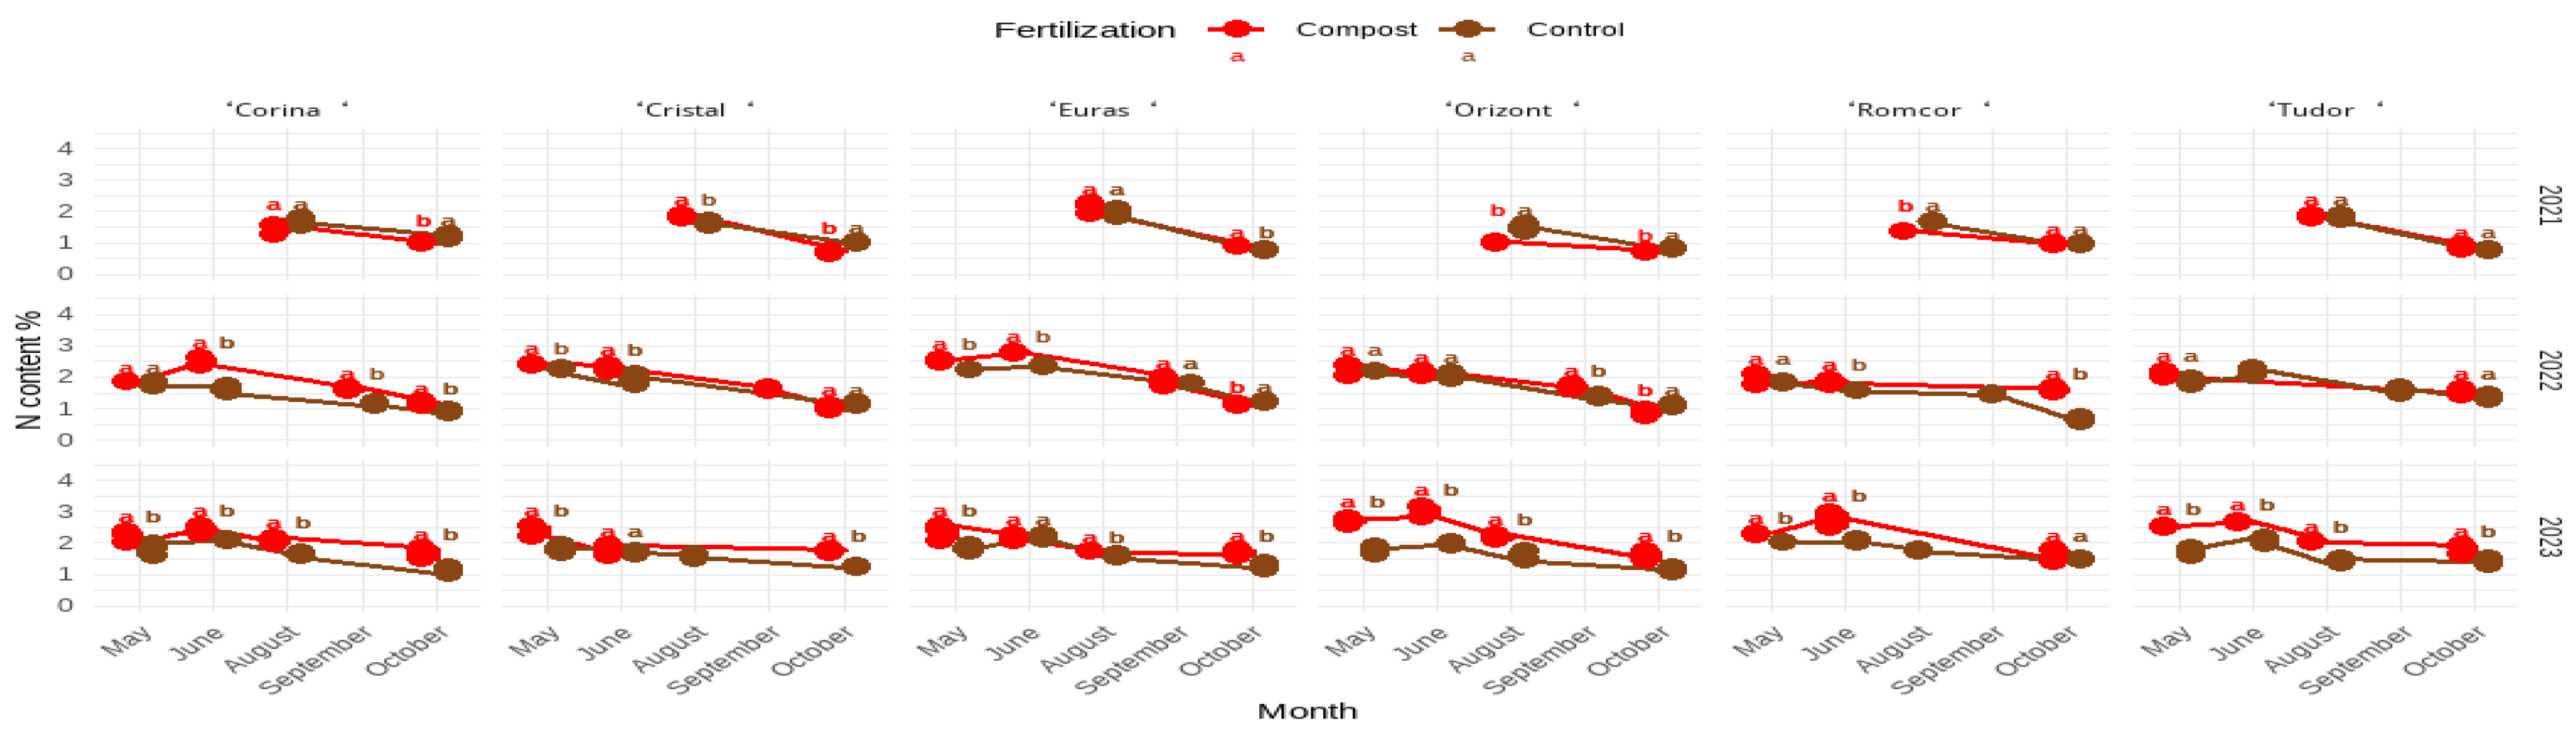
Figure 10.
Comparison between cultivars on Own roots, total N content (%) dynamic.
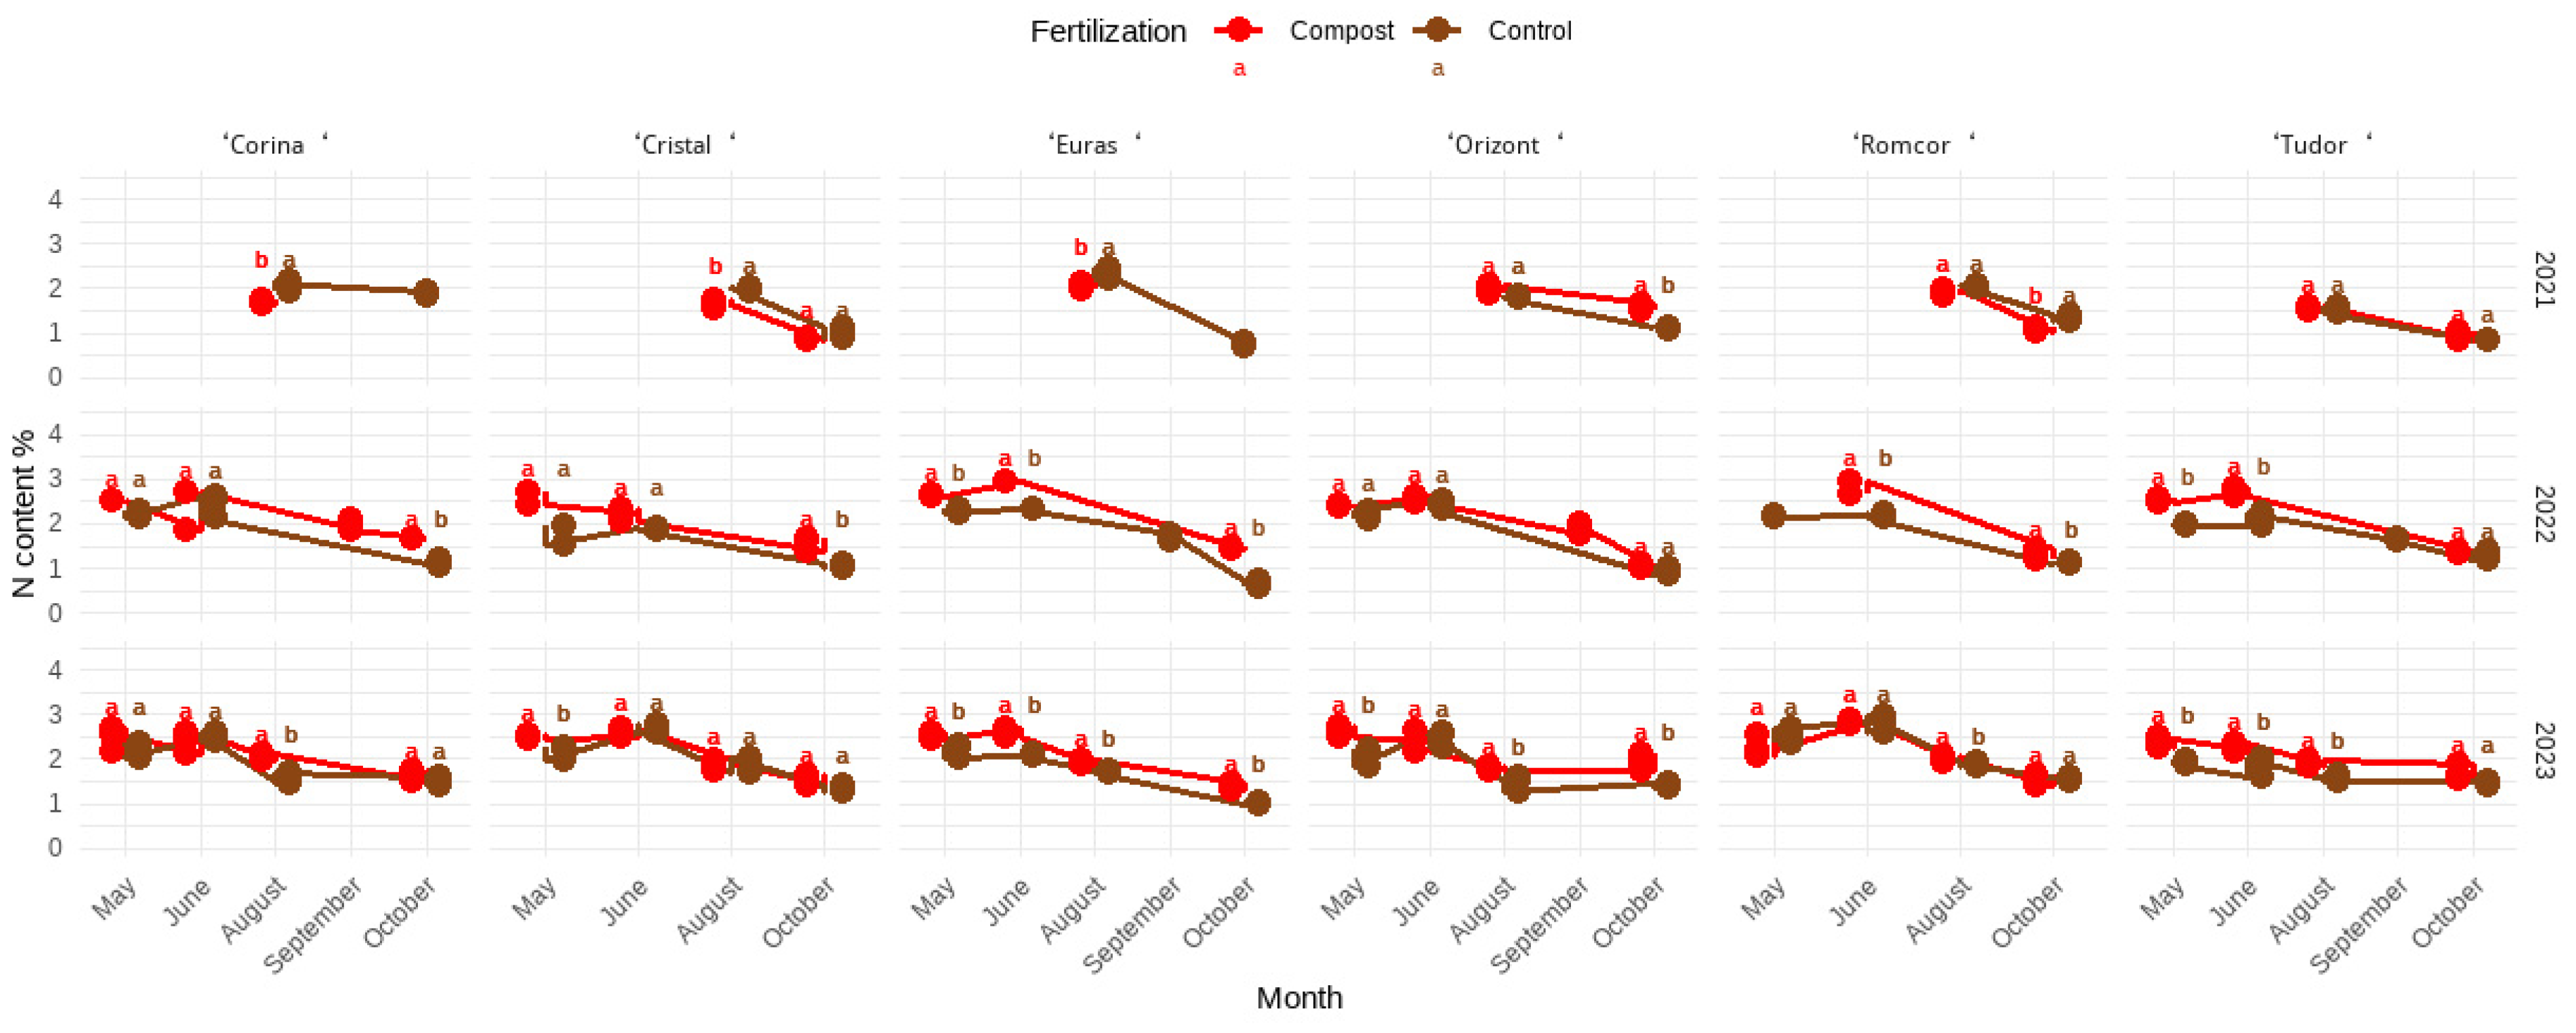
Figure 11.
Comparison between cultivars on Franc rootstock, total N content (%) dynamic.
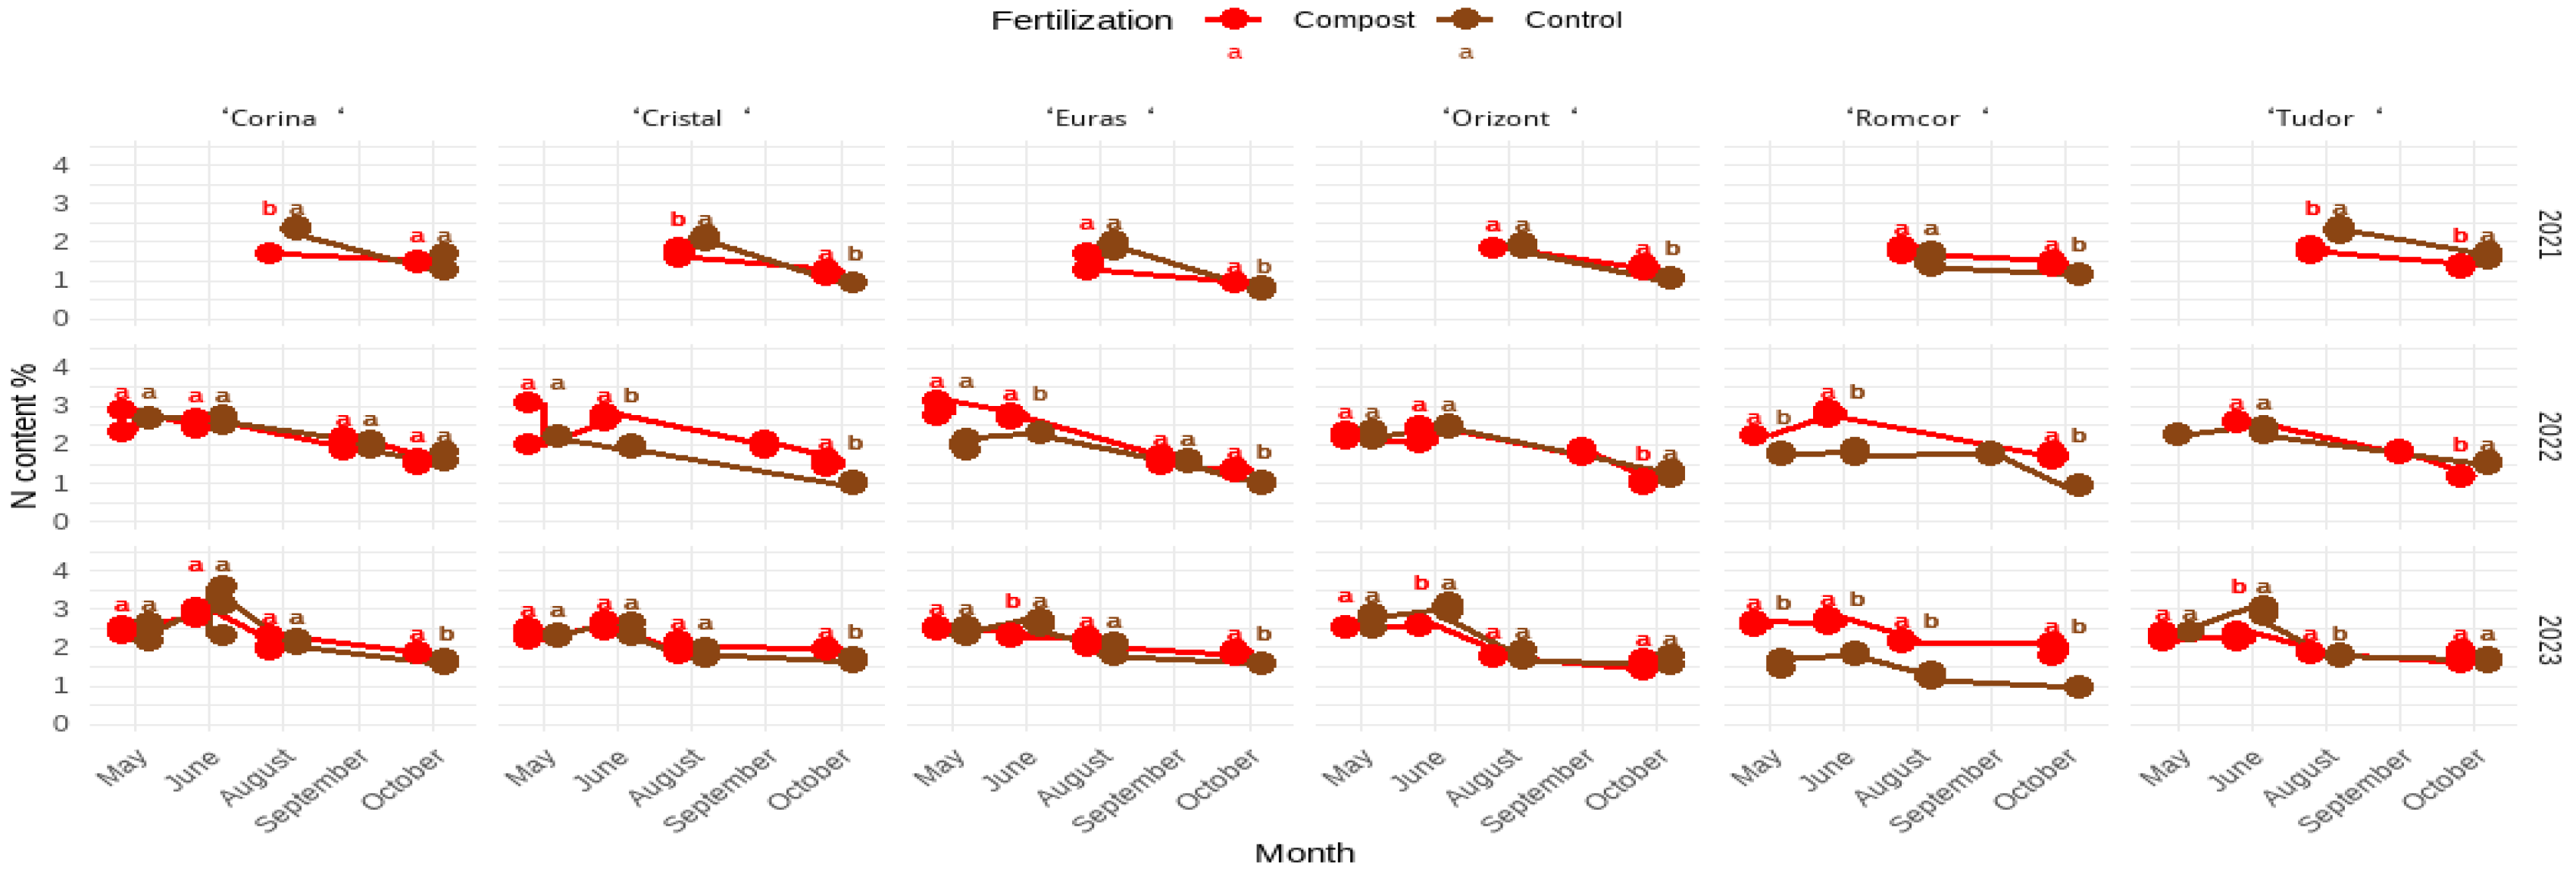
Figure 12.
Comparison between cultivars on Quince rootstock, total C content (%) dynamic
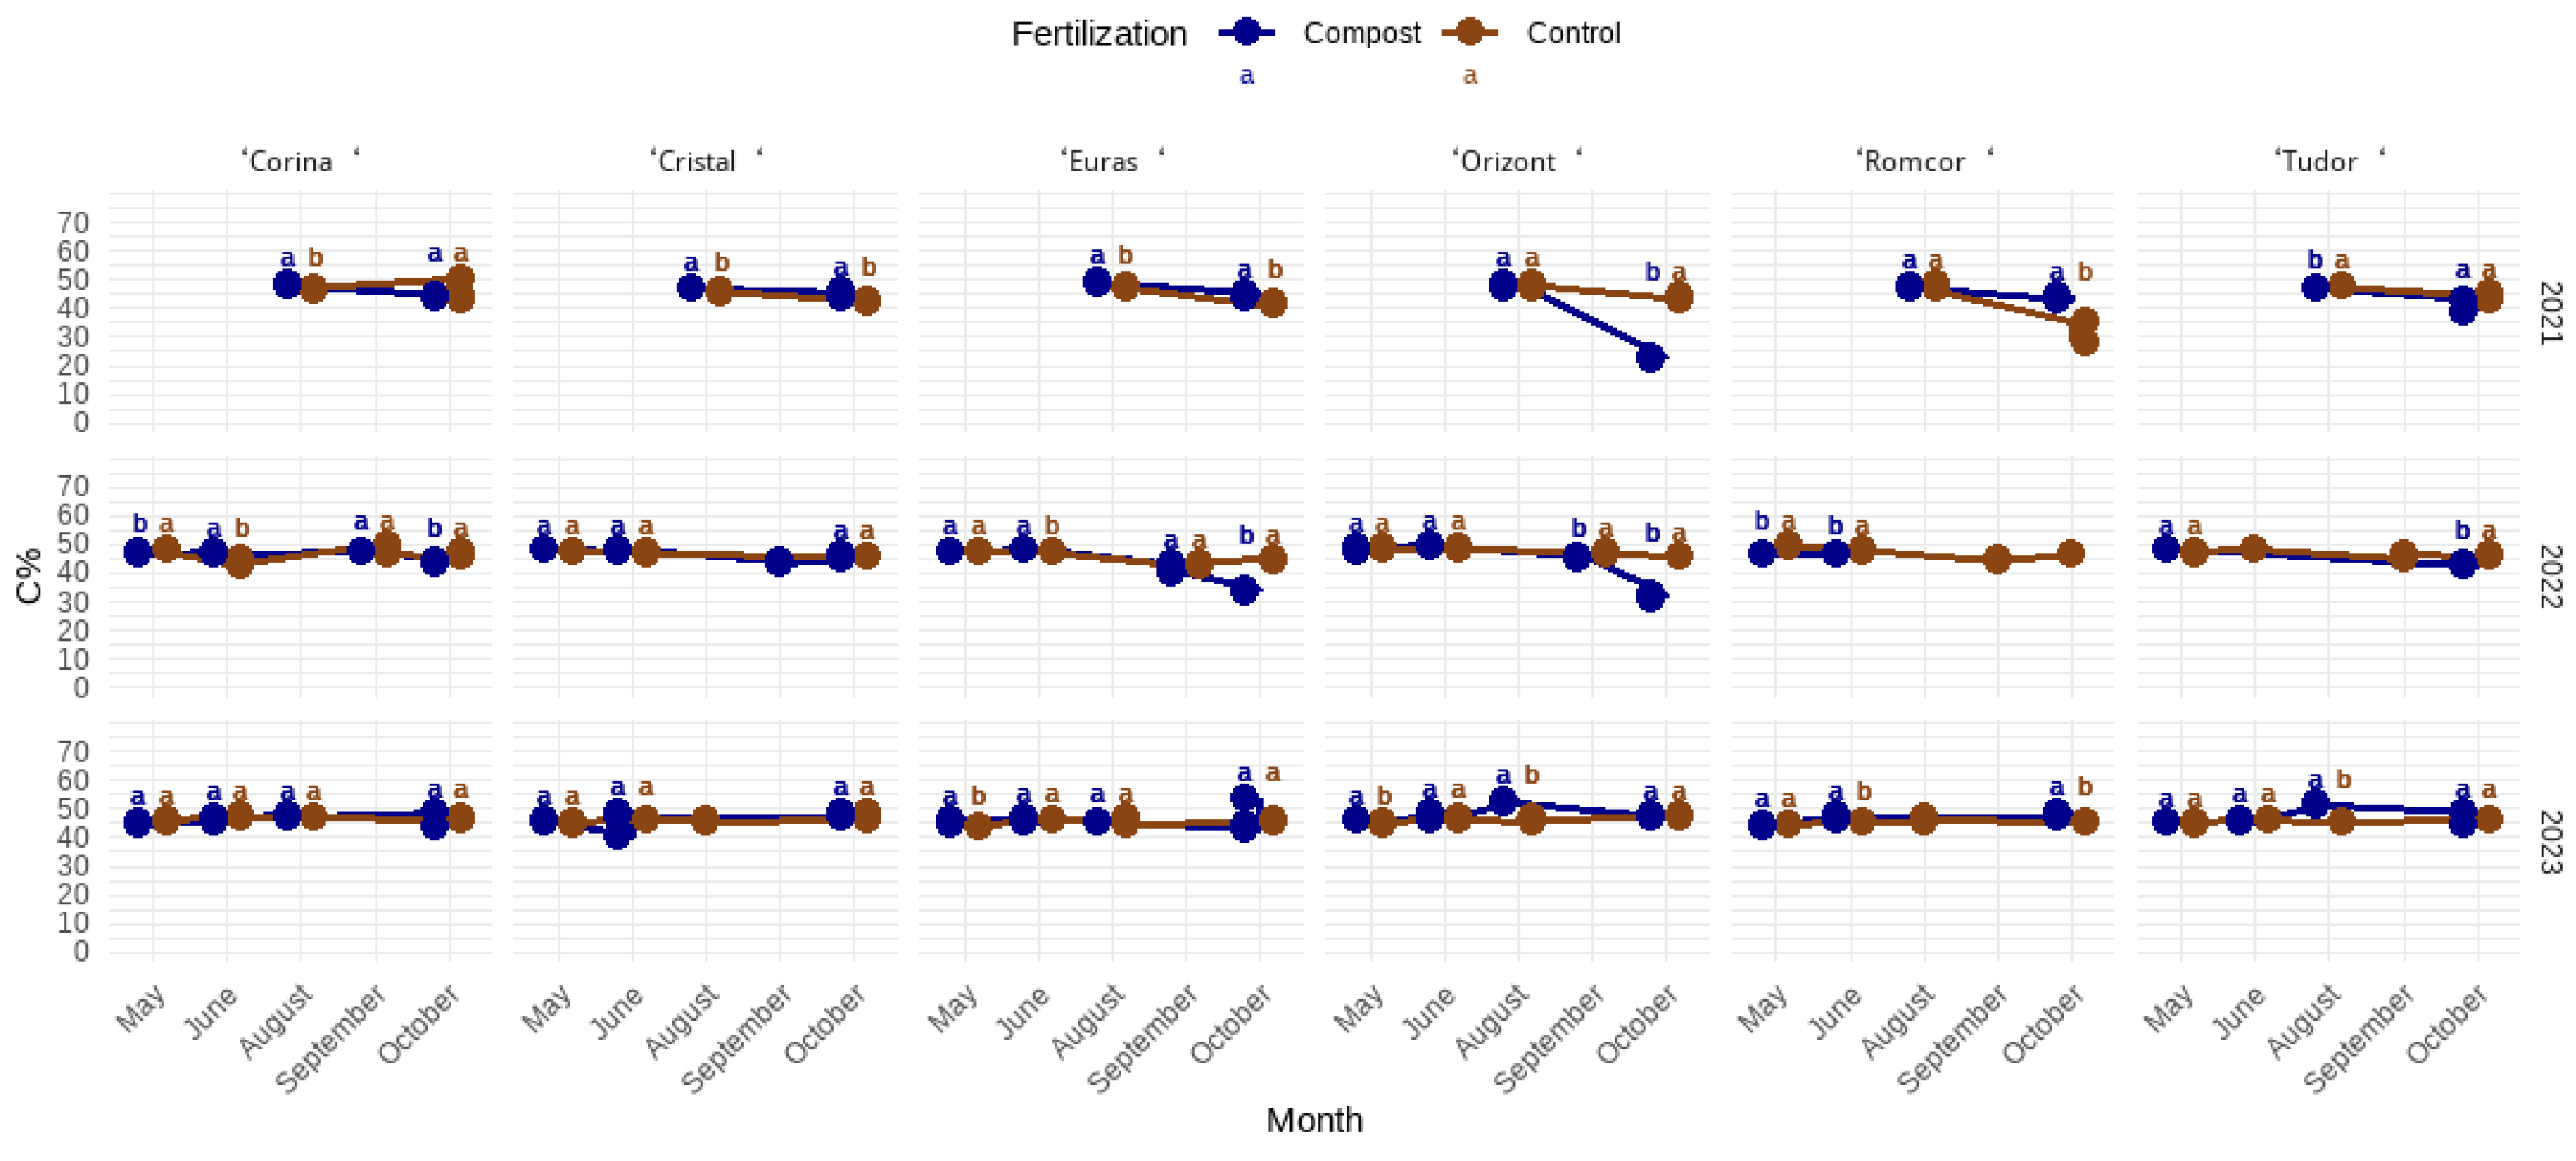
Figure 13.
Comparison between cultivars on Own roots, total C content (%) dynamic
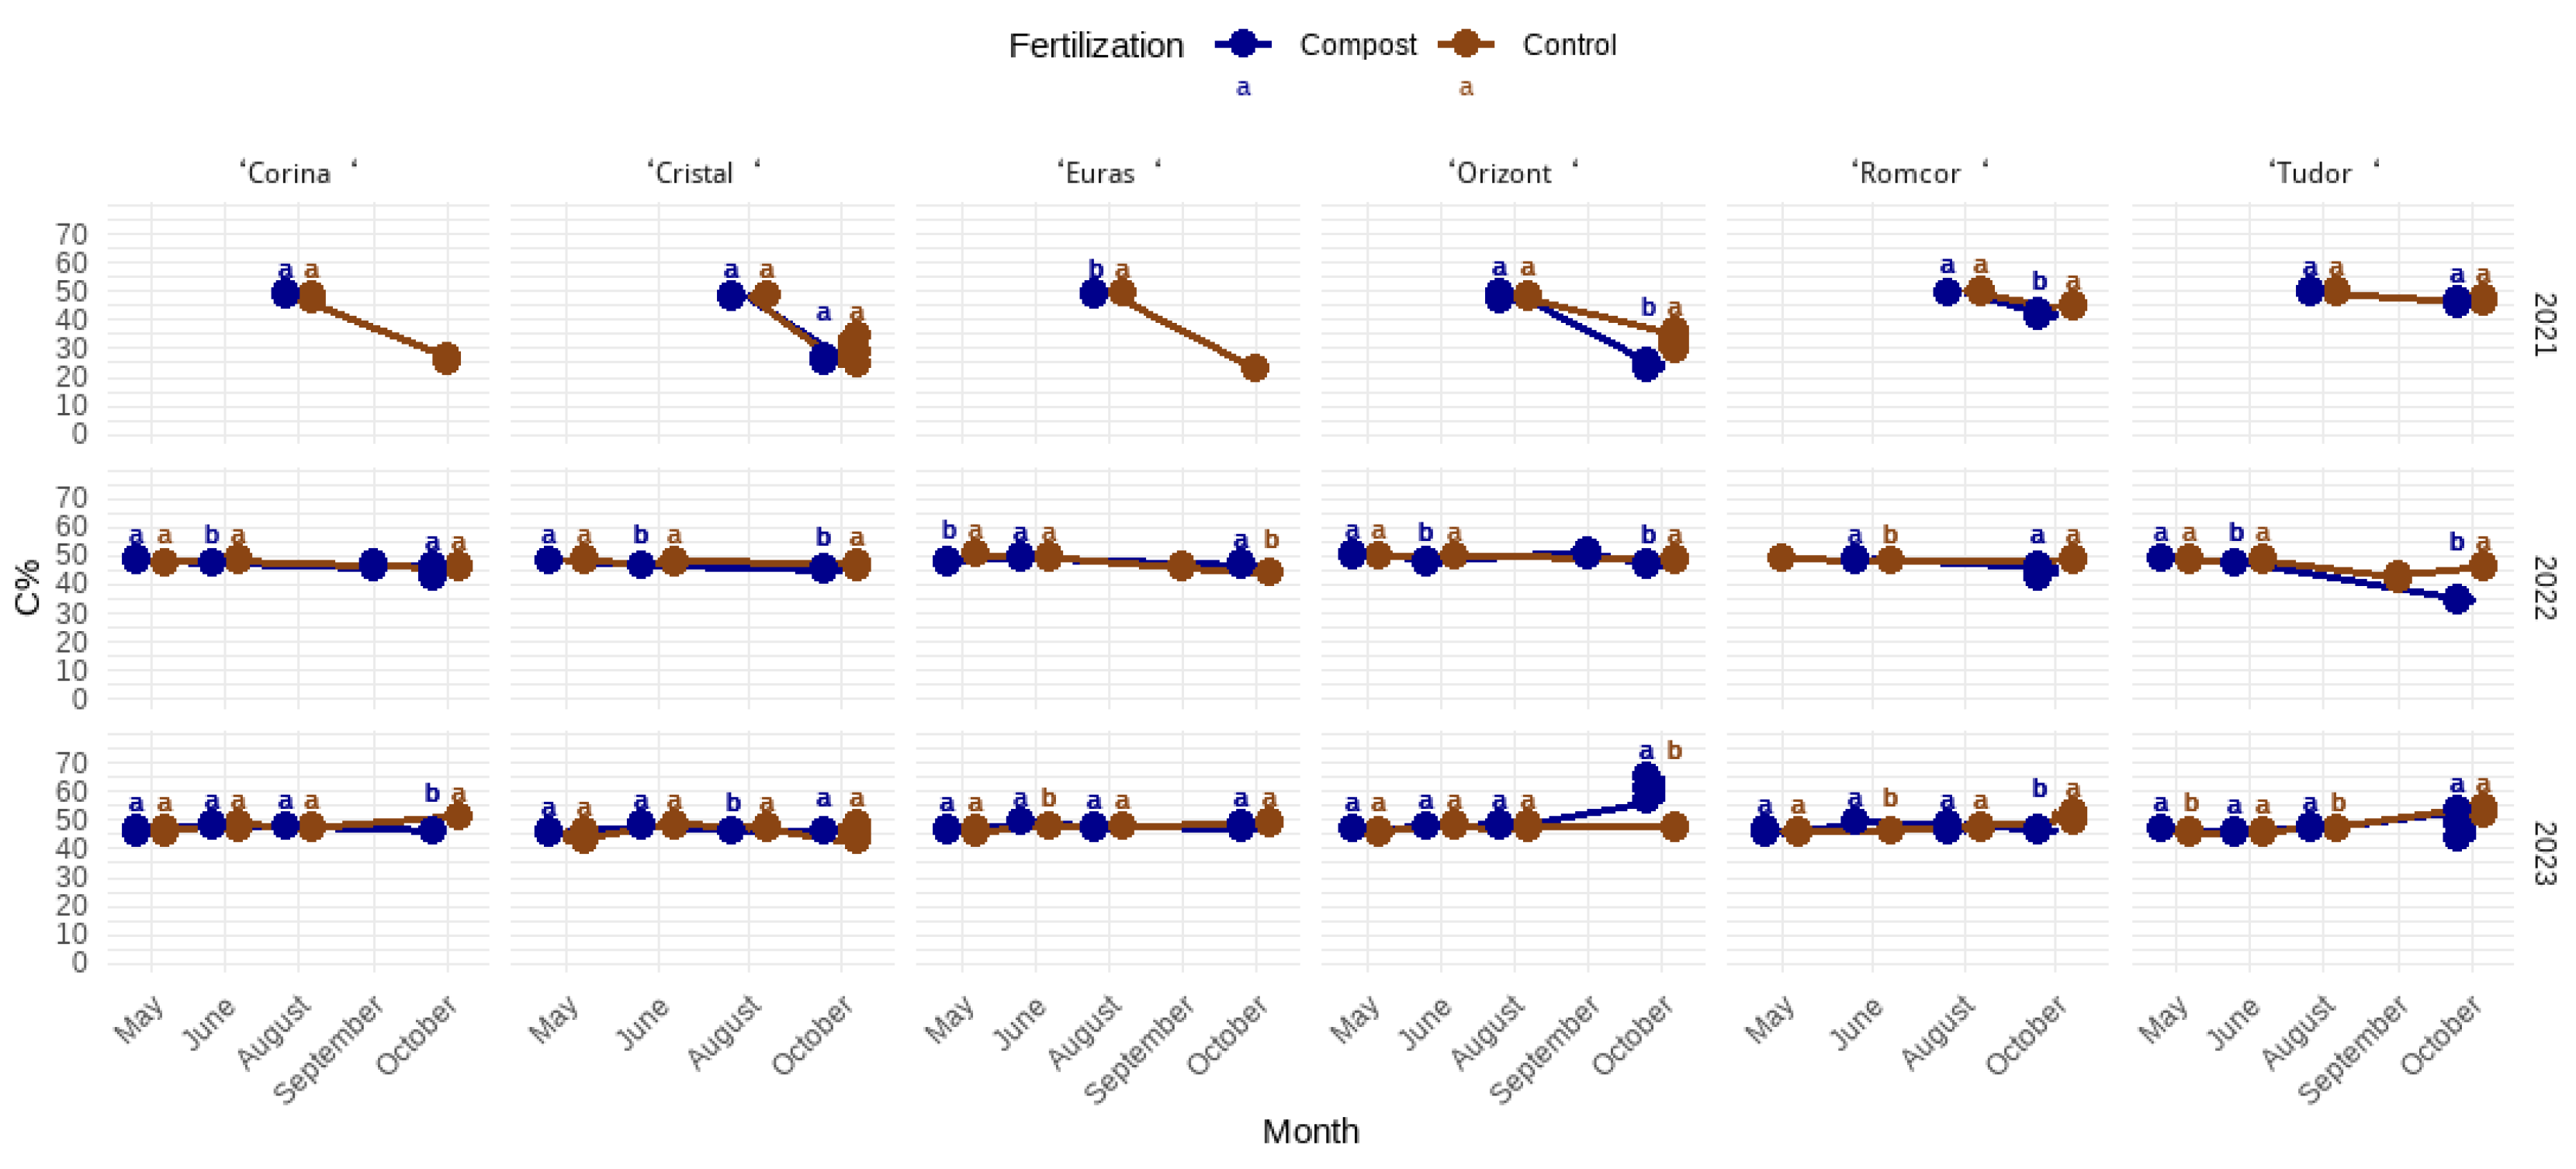
Figure 14.
Comparison between cultivars on Franc rootstock, total C content (%) dynamic
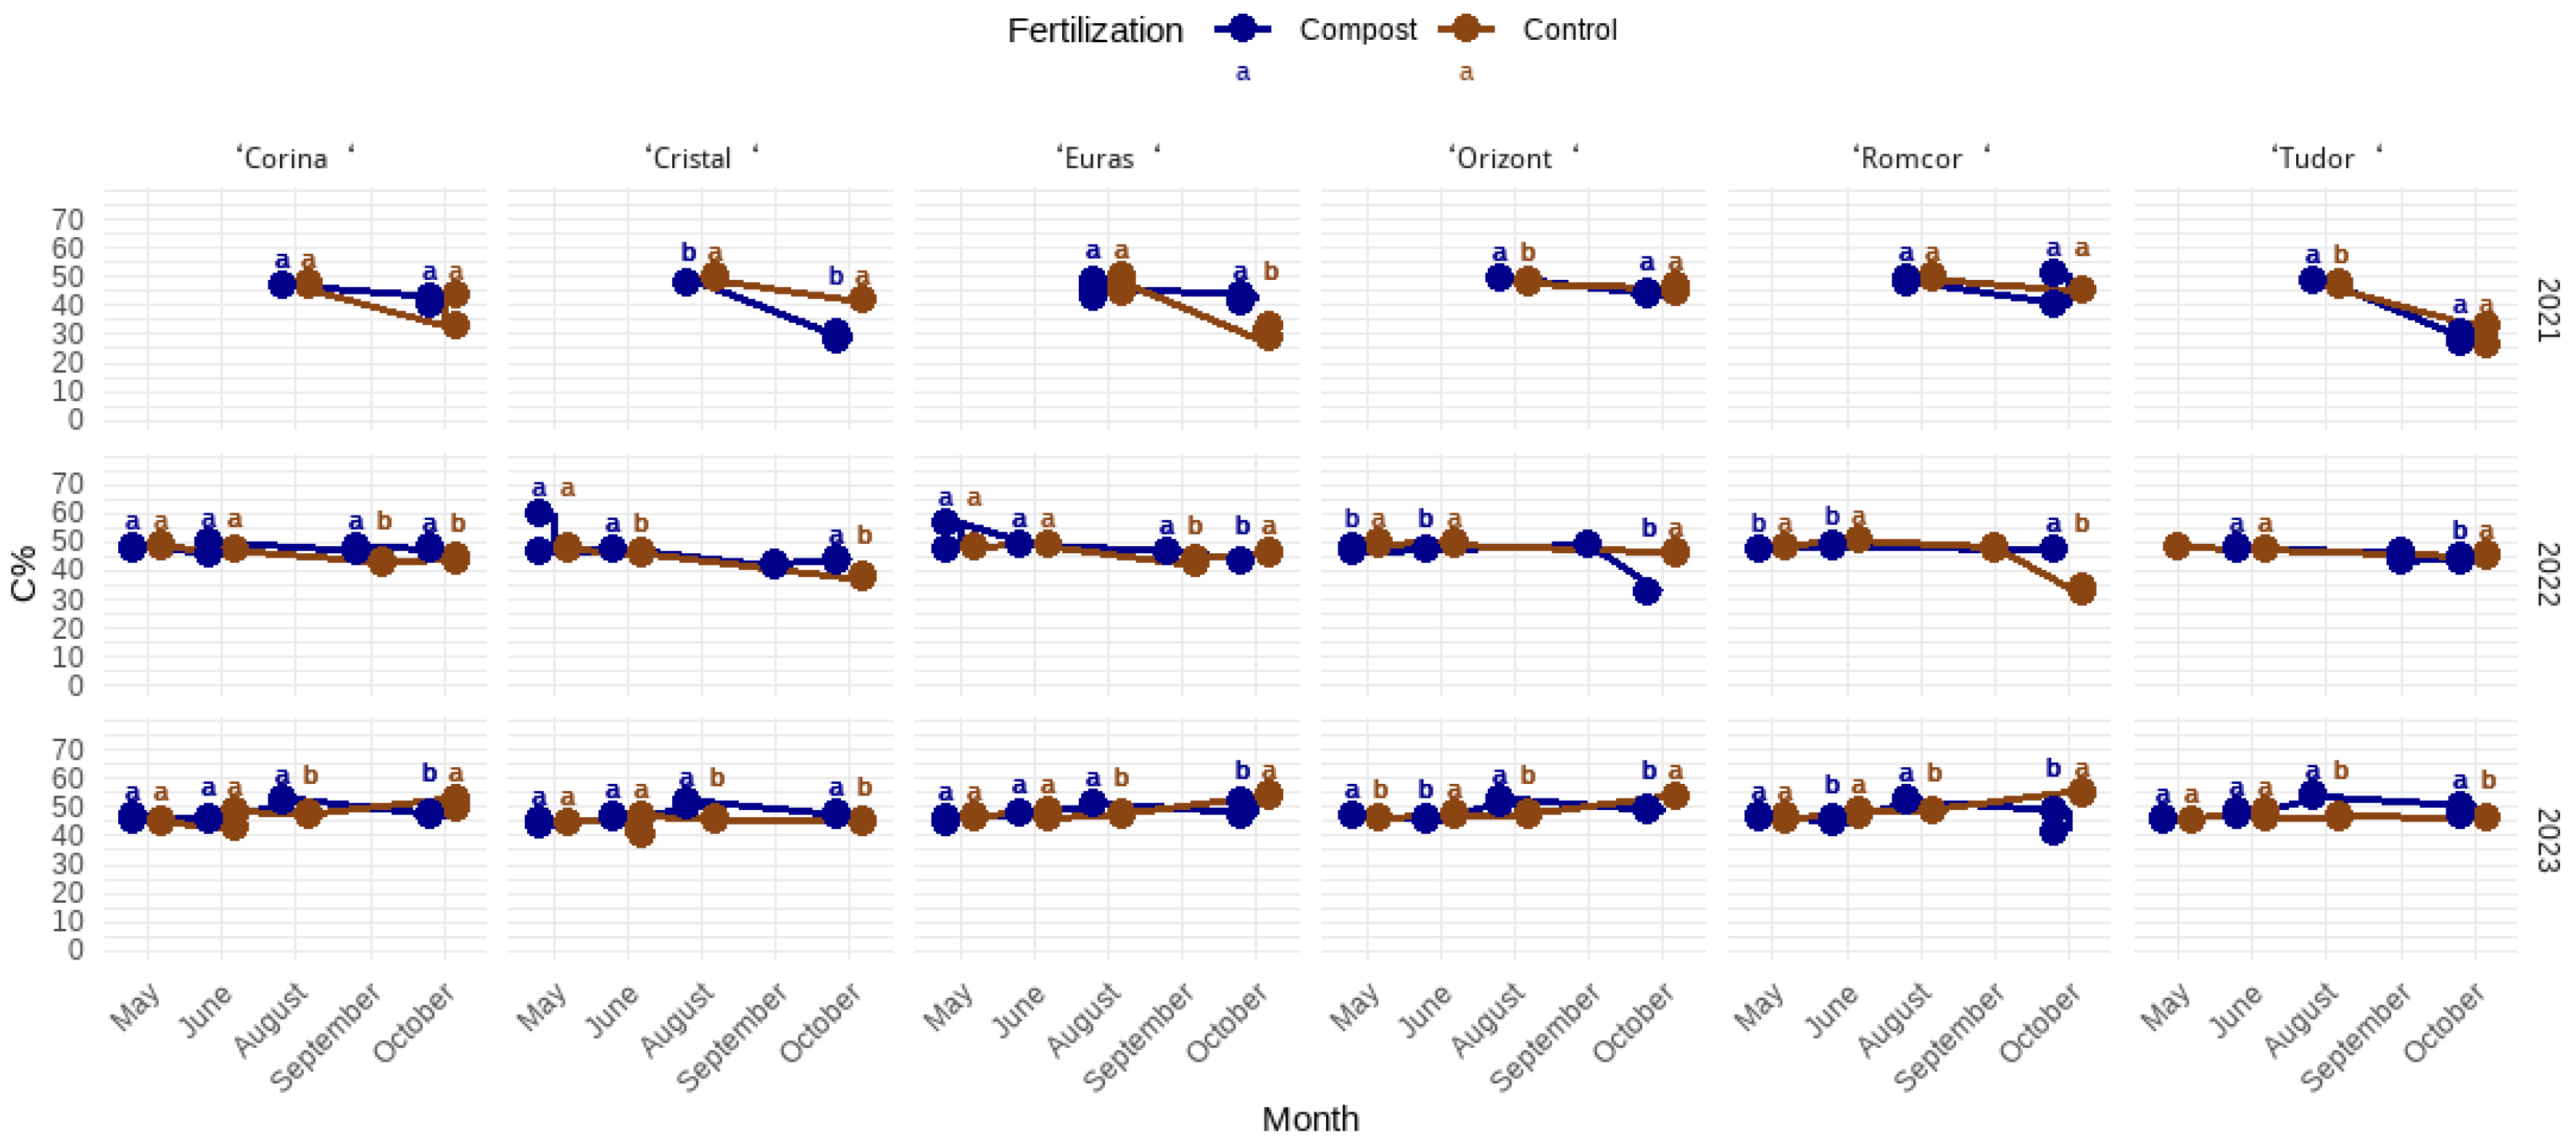
Figure 15.
The influence of the fertilization scheme on the soil respiration coefficient (µmol m-2 s-1)
Figure 15.
The influence of the fertilization scheme on the soil respiration coefficient (µmol m-2 s-1)
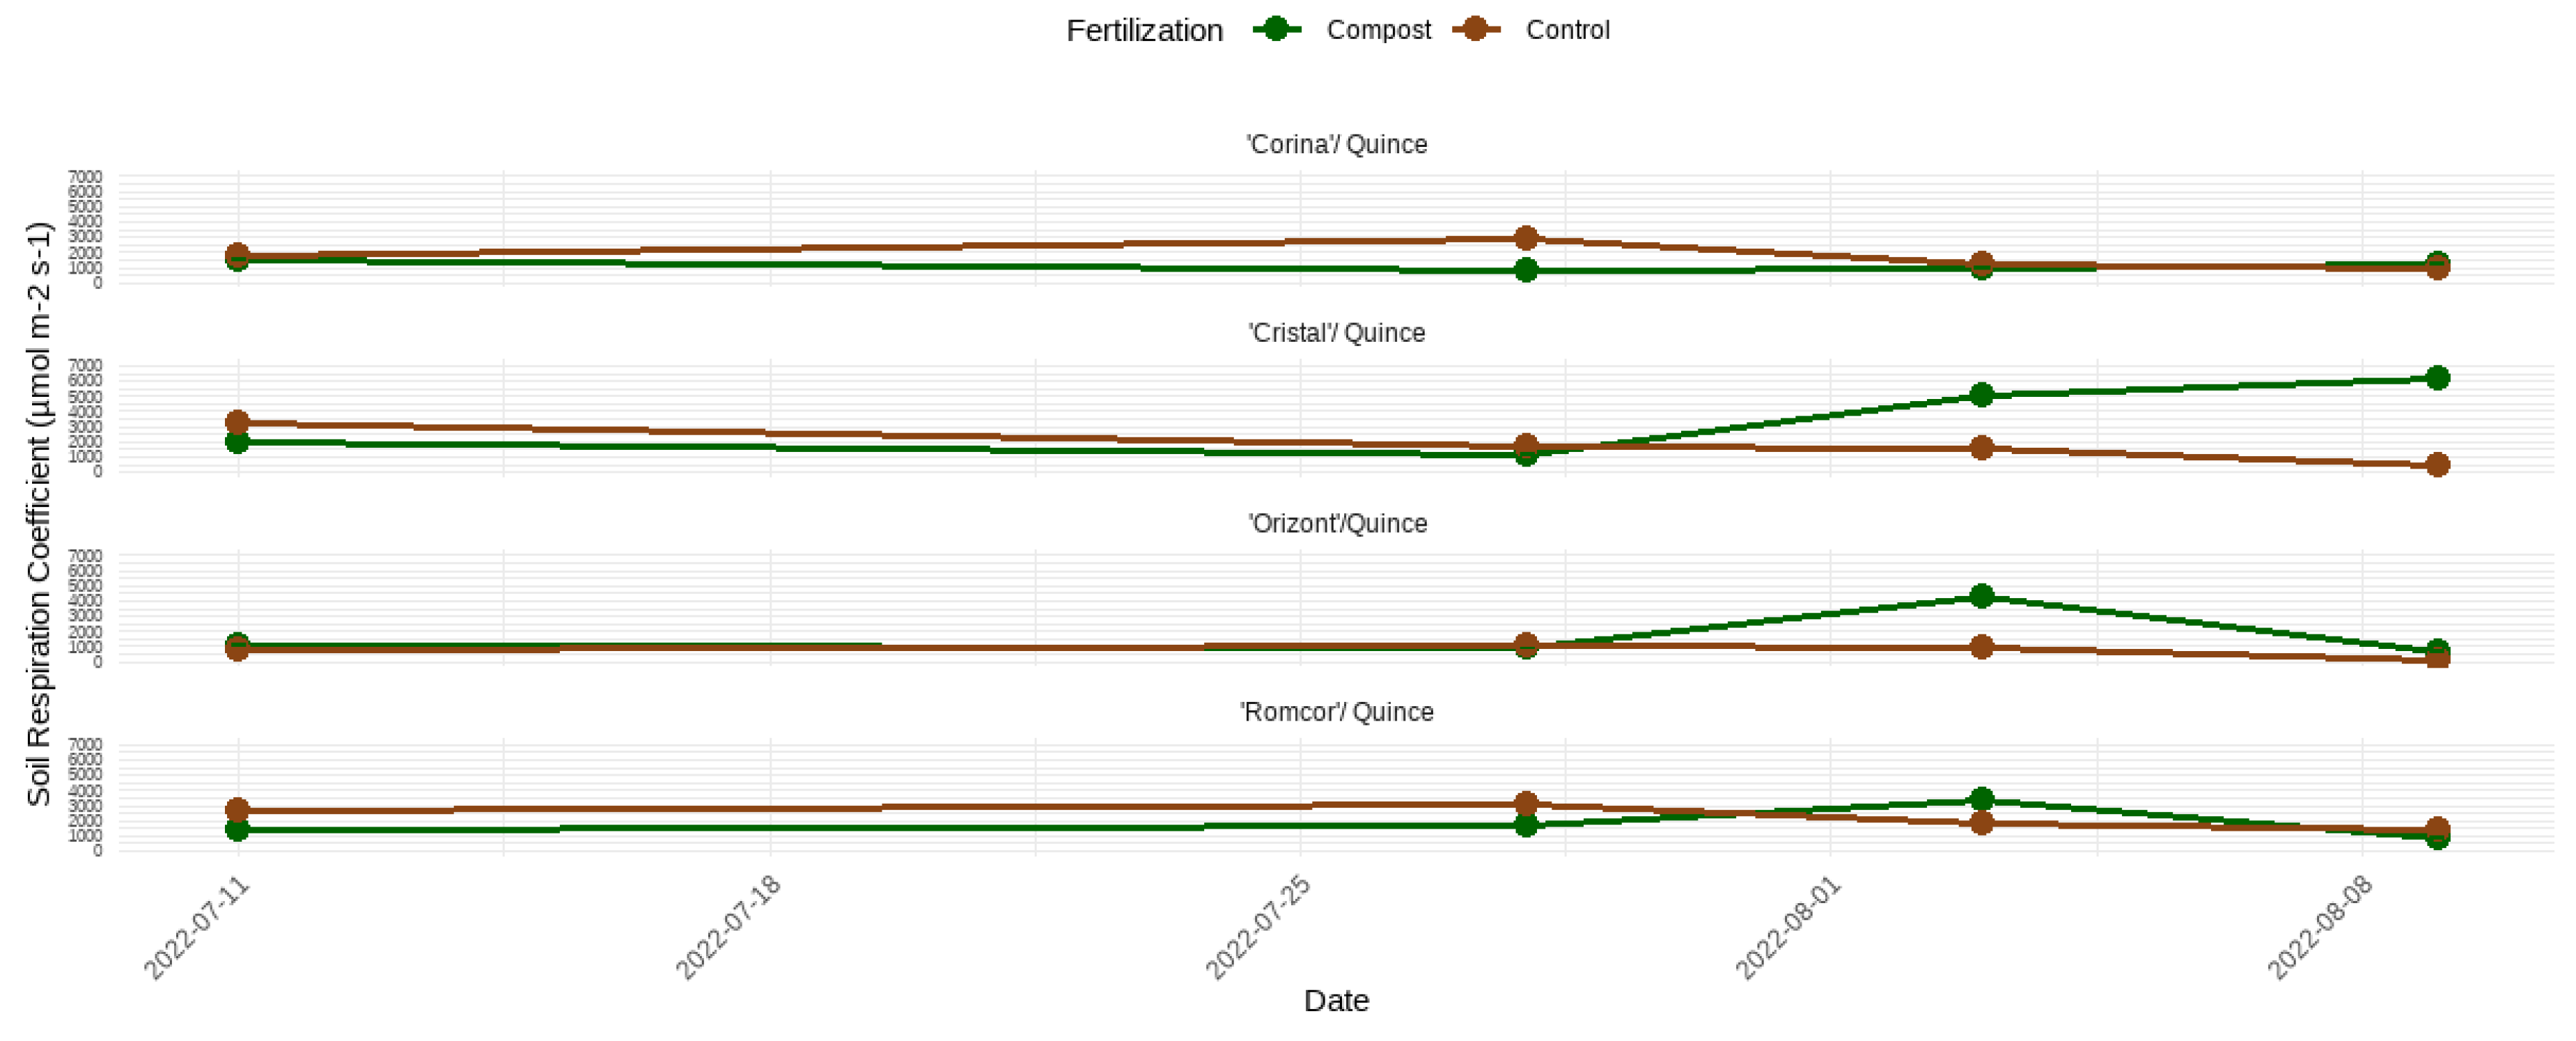
Figure 16.
Heatmap of average IAD in fruits correlated by Cultivar x Rootstock x Fertilization
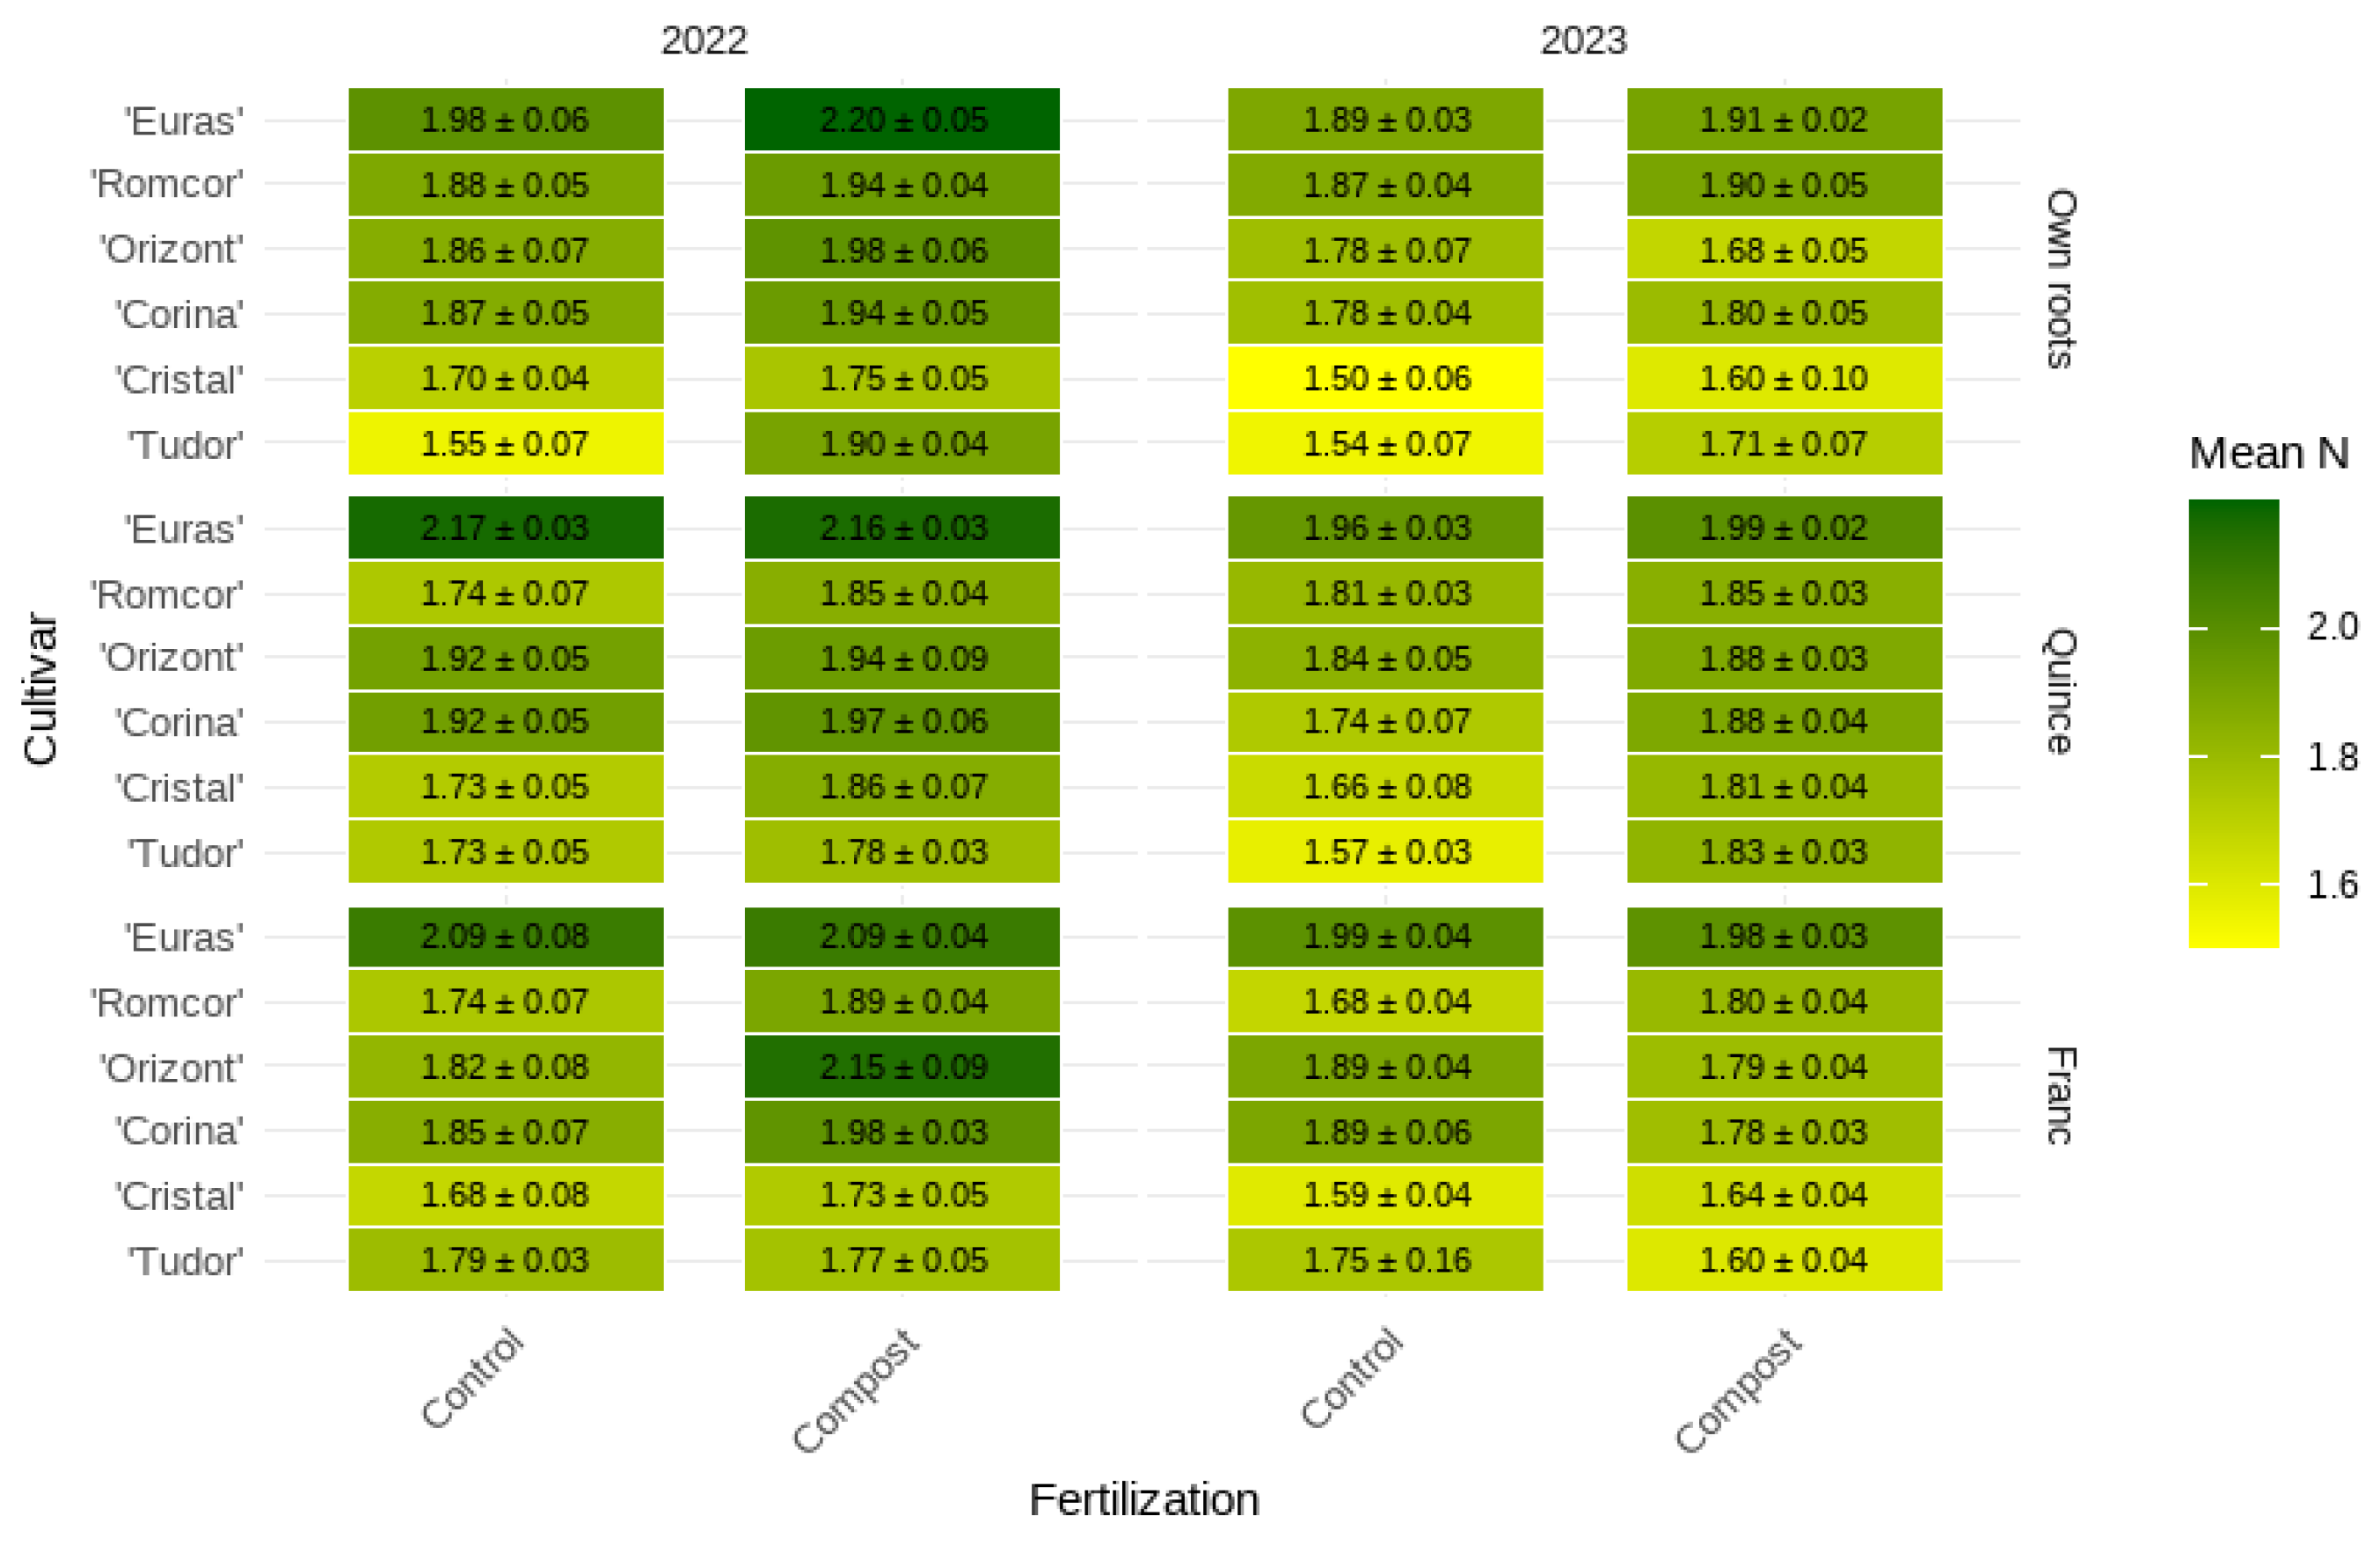
Figure 17.
Dynamics of IAD for ‘Tudor’ cultivar by Rootstock x Fertilization

Figure 18.
Dynamics of IAD for ‘Cristal’ cultivar by Rootstock x Fertilization
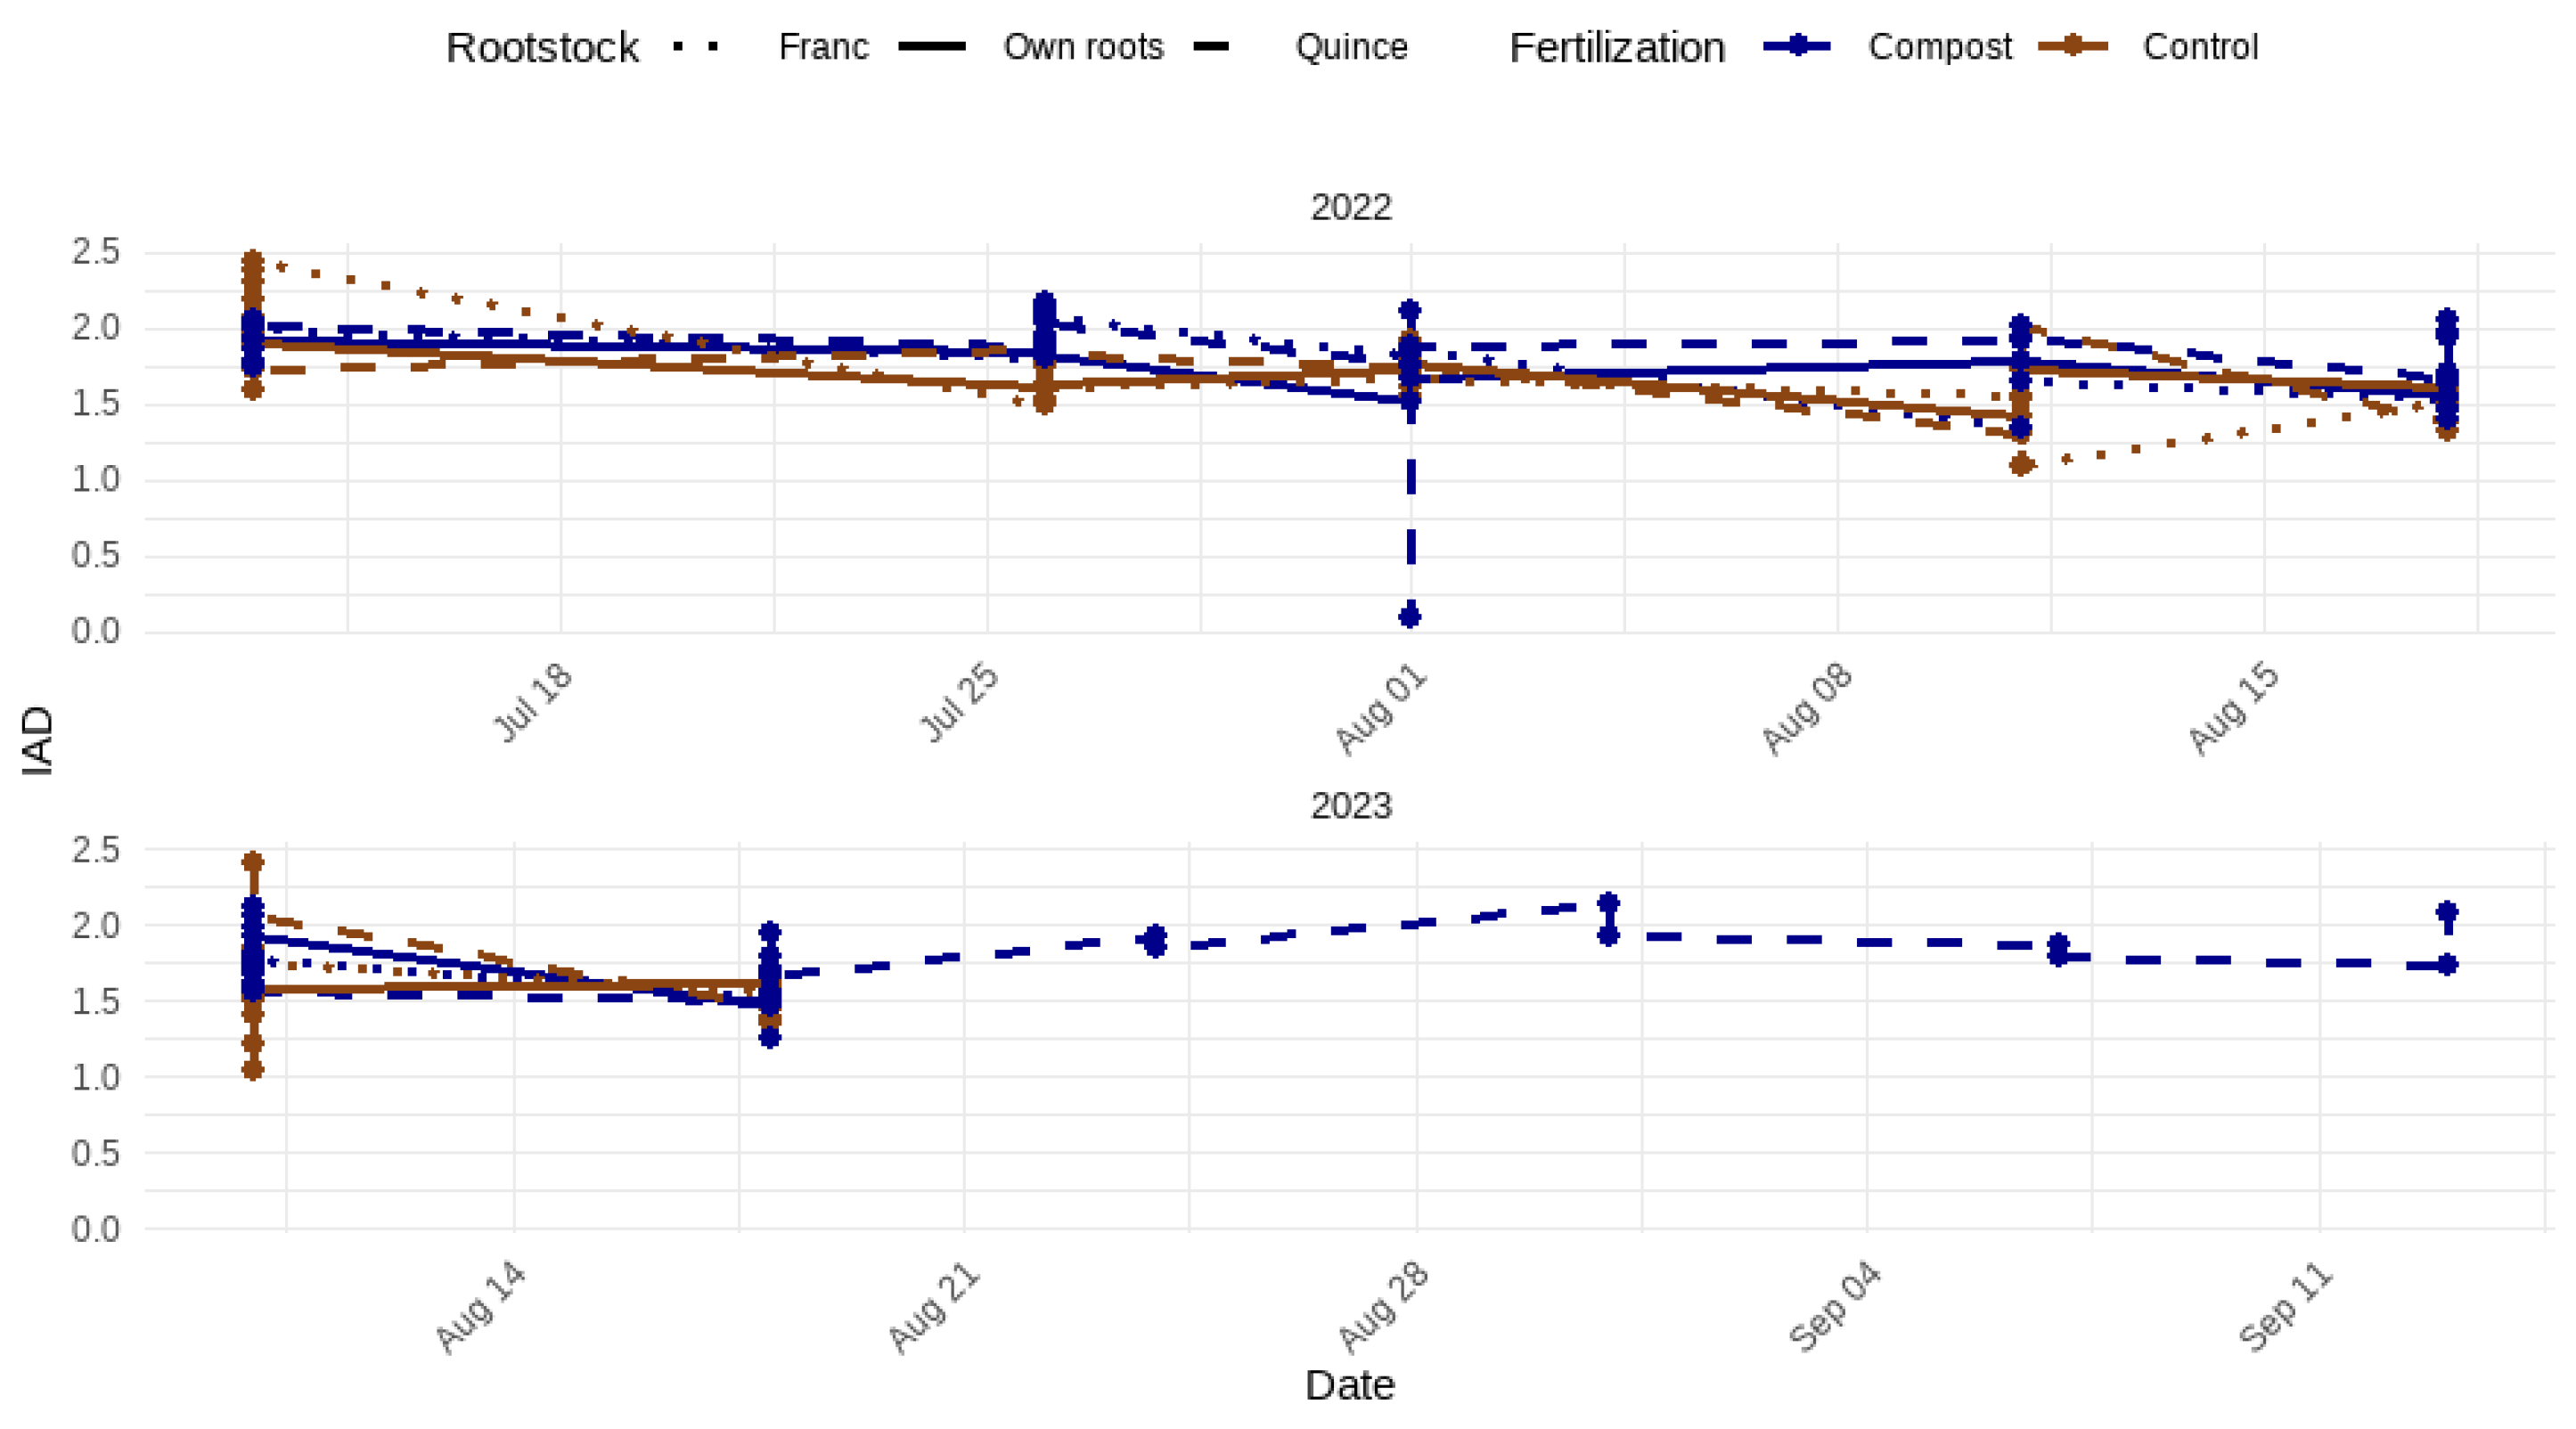
Figure 19.
Dynamics of IAD for ‘Corina’ cultivar by Rootstock x Fertilization
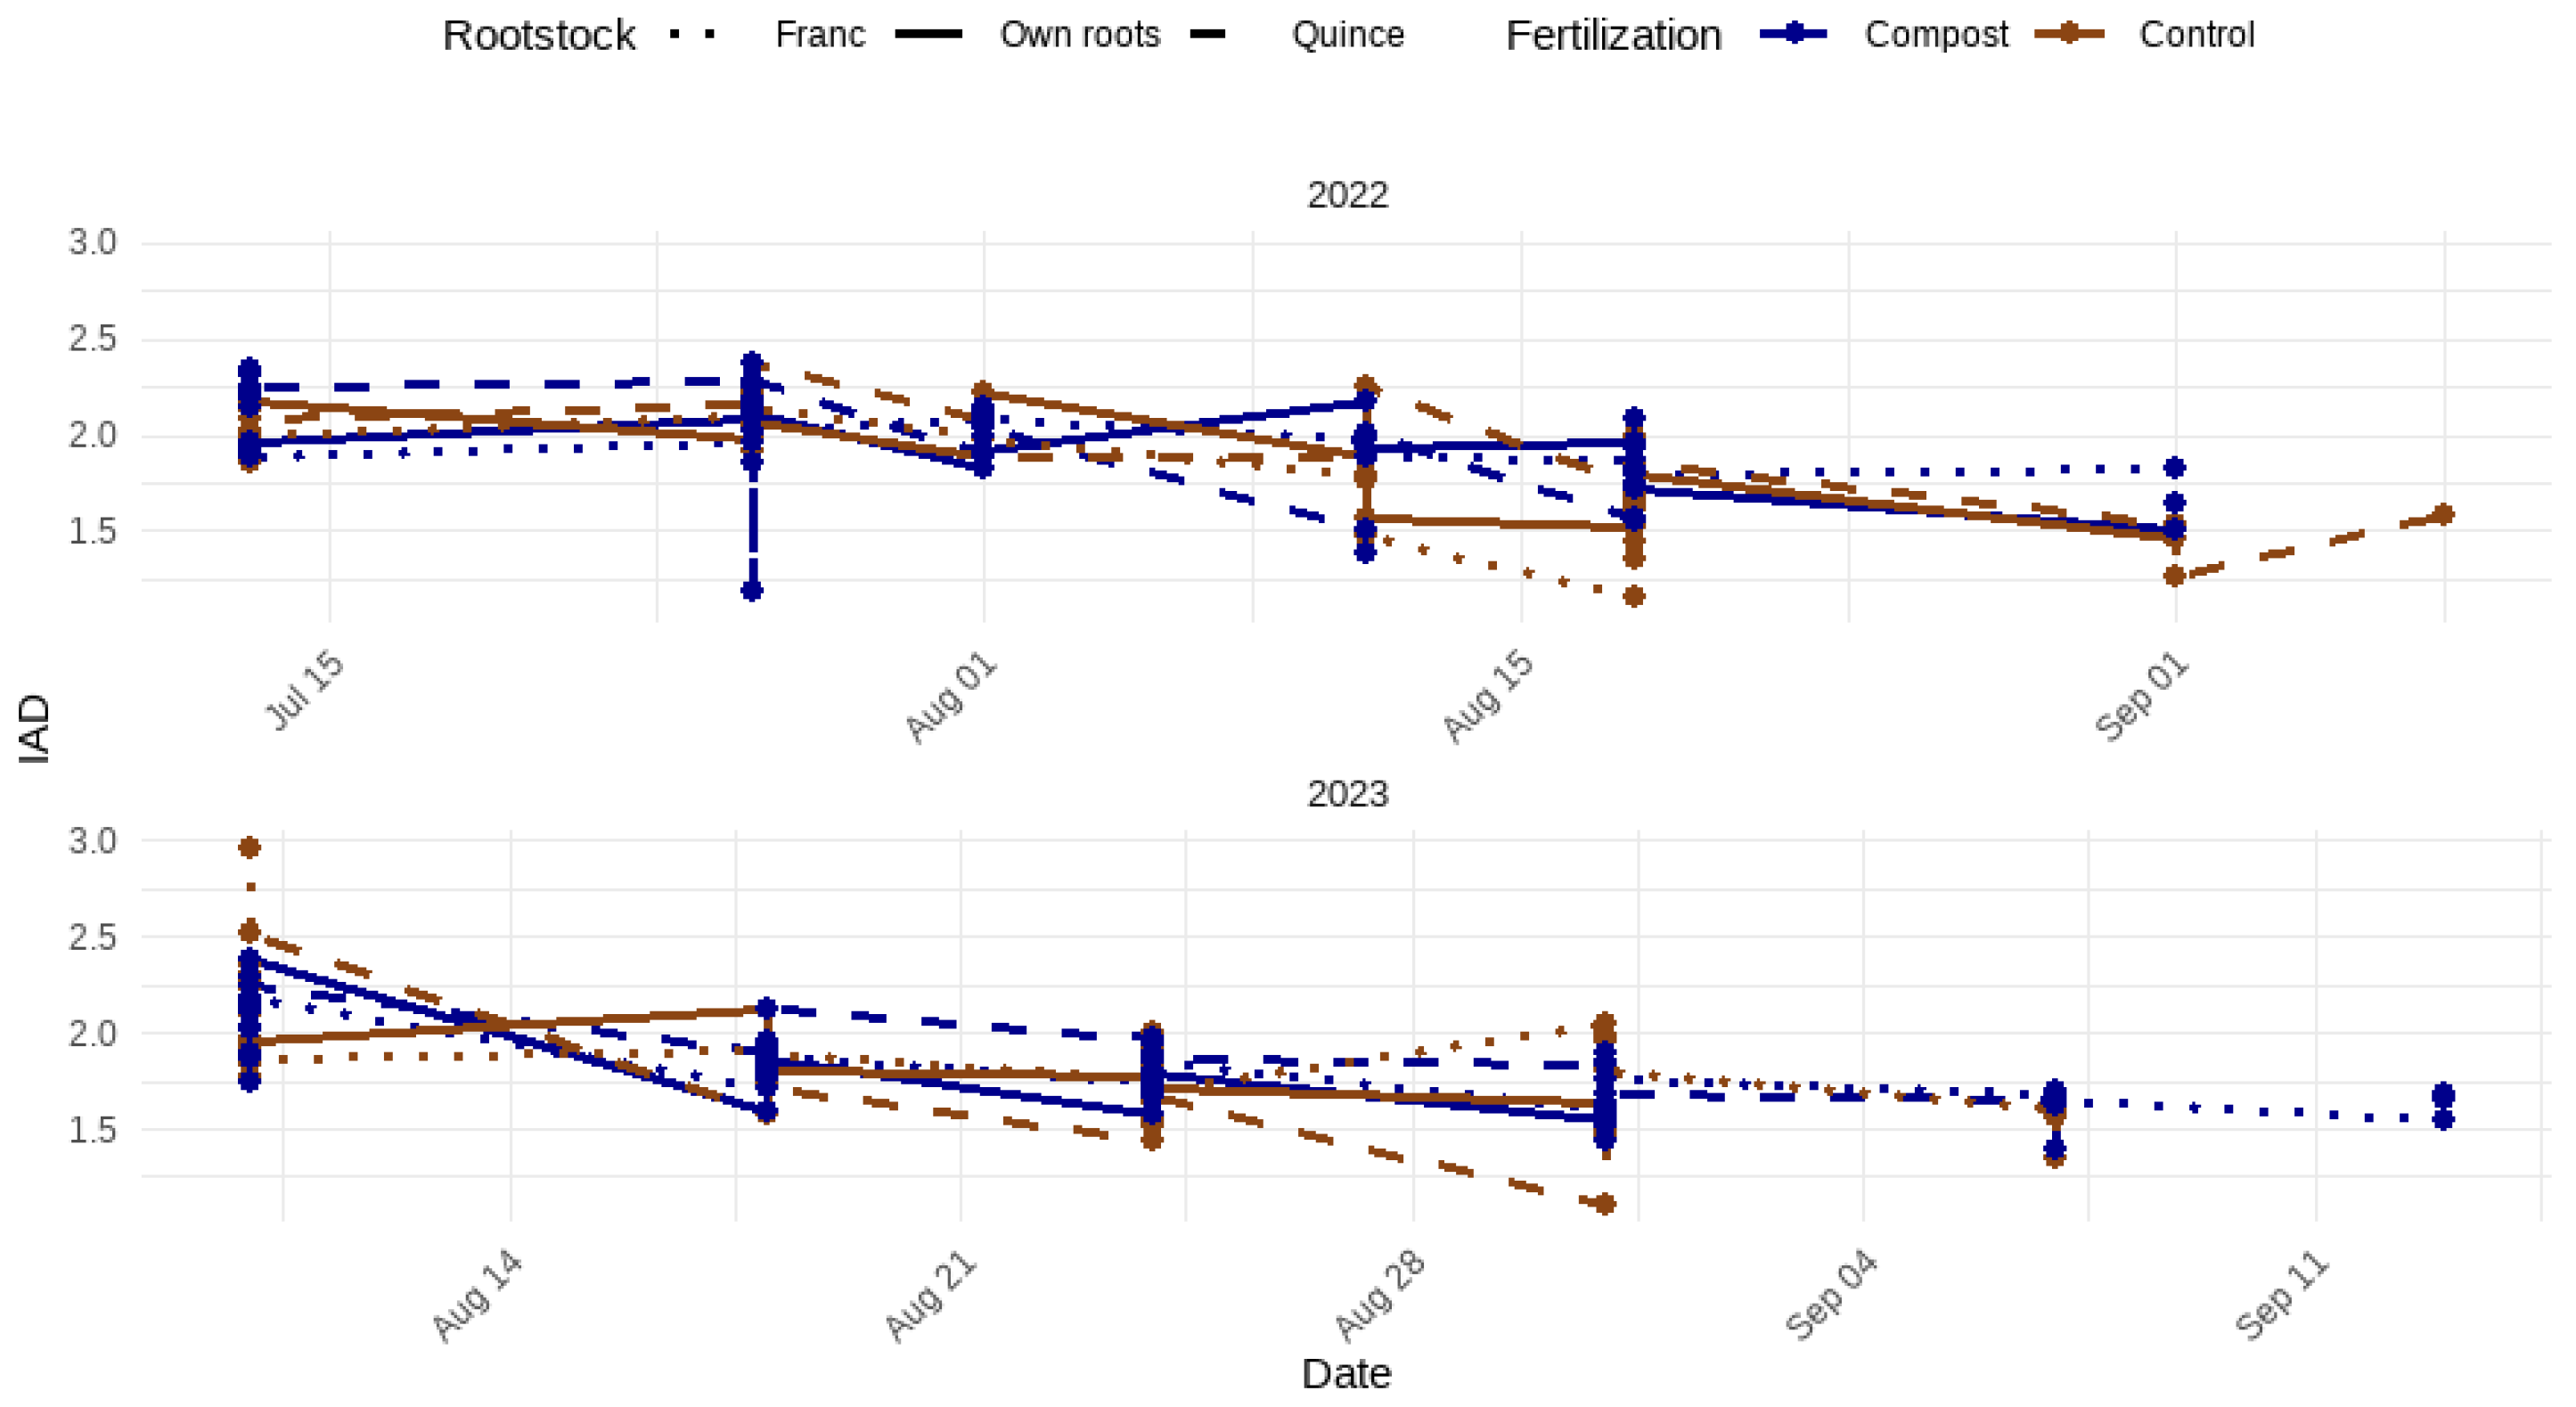
Figure 20.
Dynamics of IAD for ‘Orizont’ cultivar by Rootstock x Fertilization
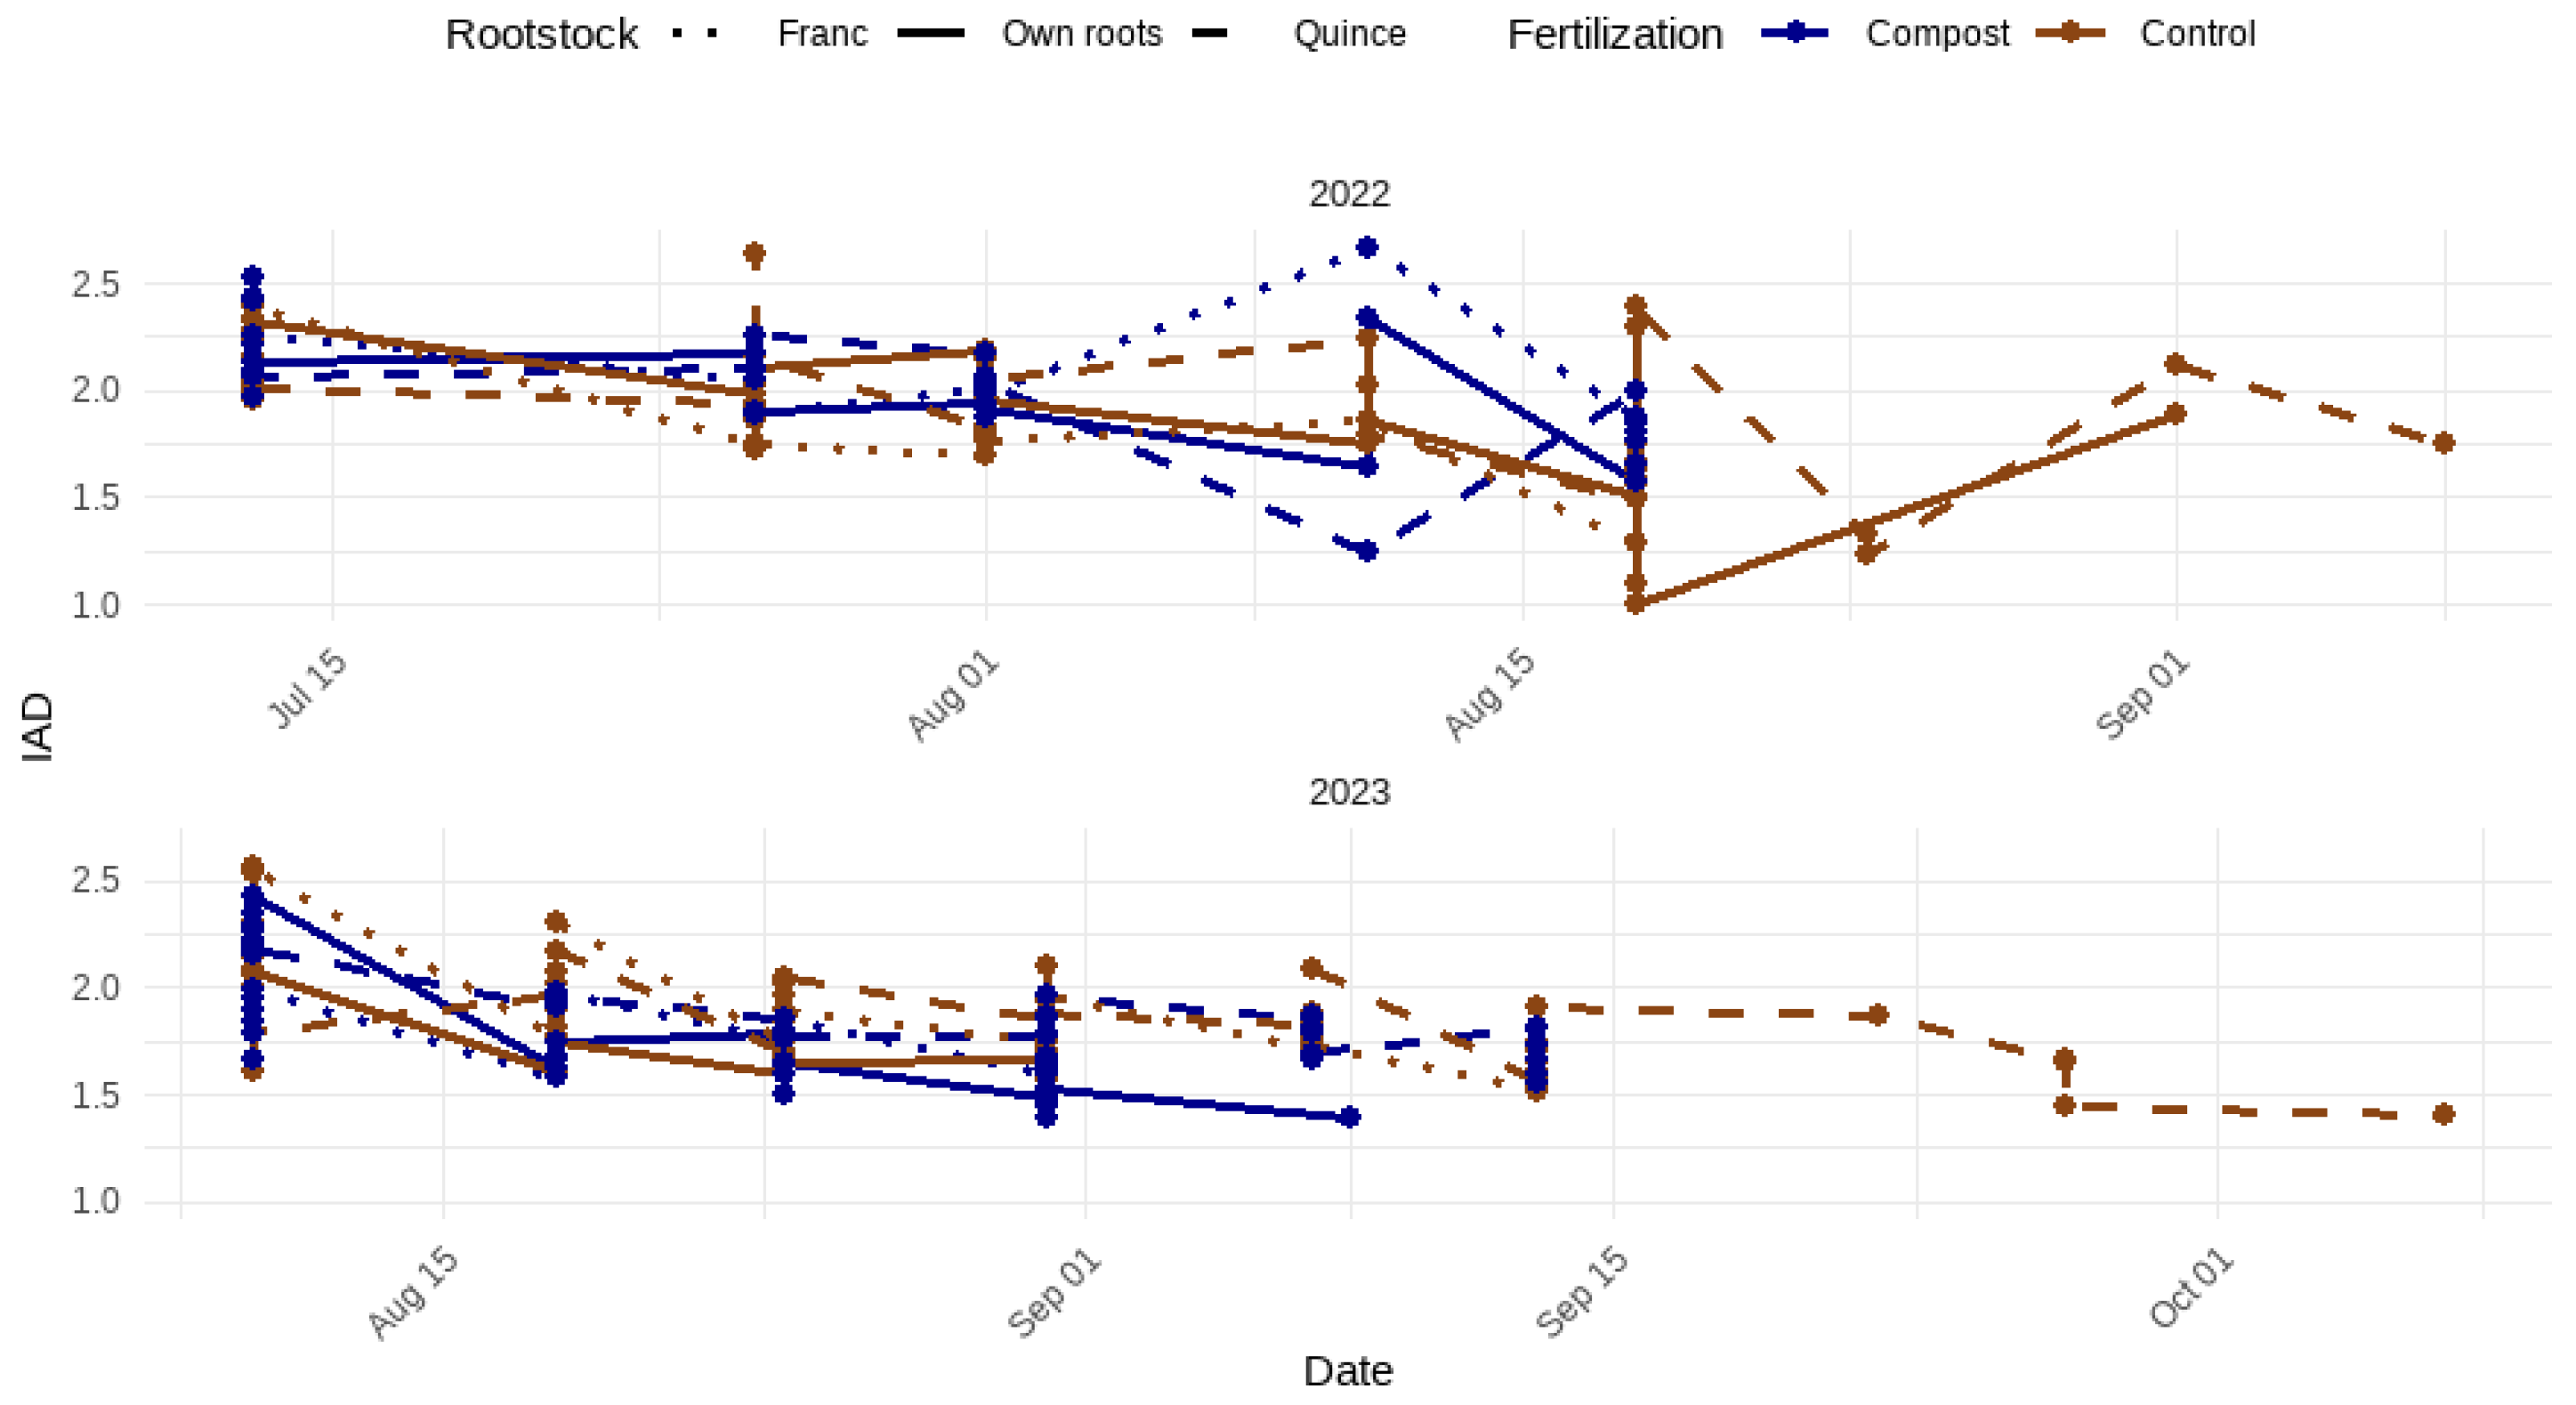
Figure 21.
Dynamics of IAD for ‘Romcor’ cultivar by Rootstock x Fertilization
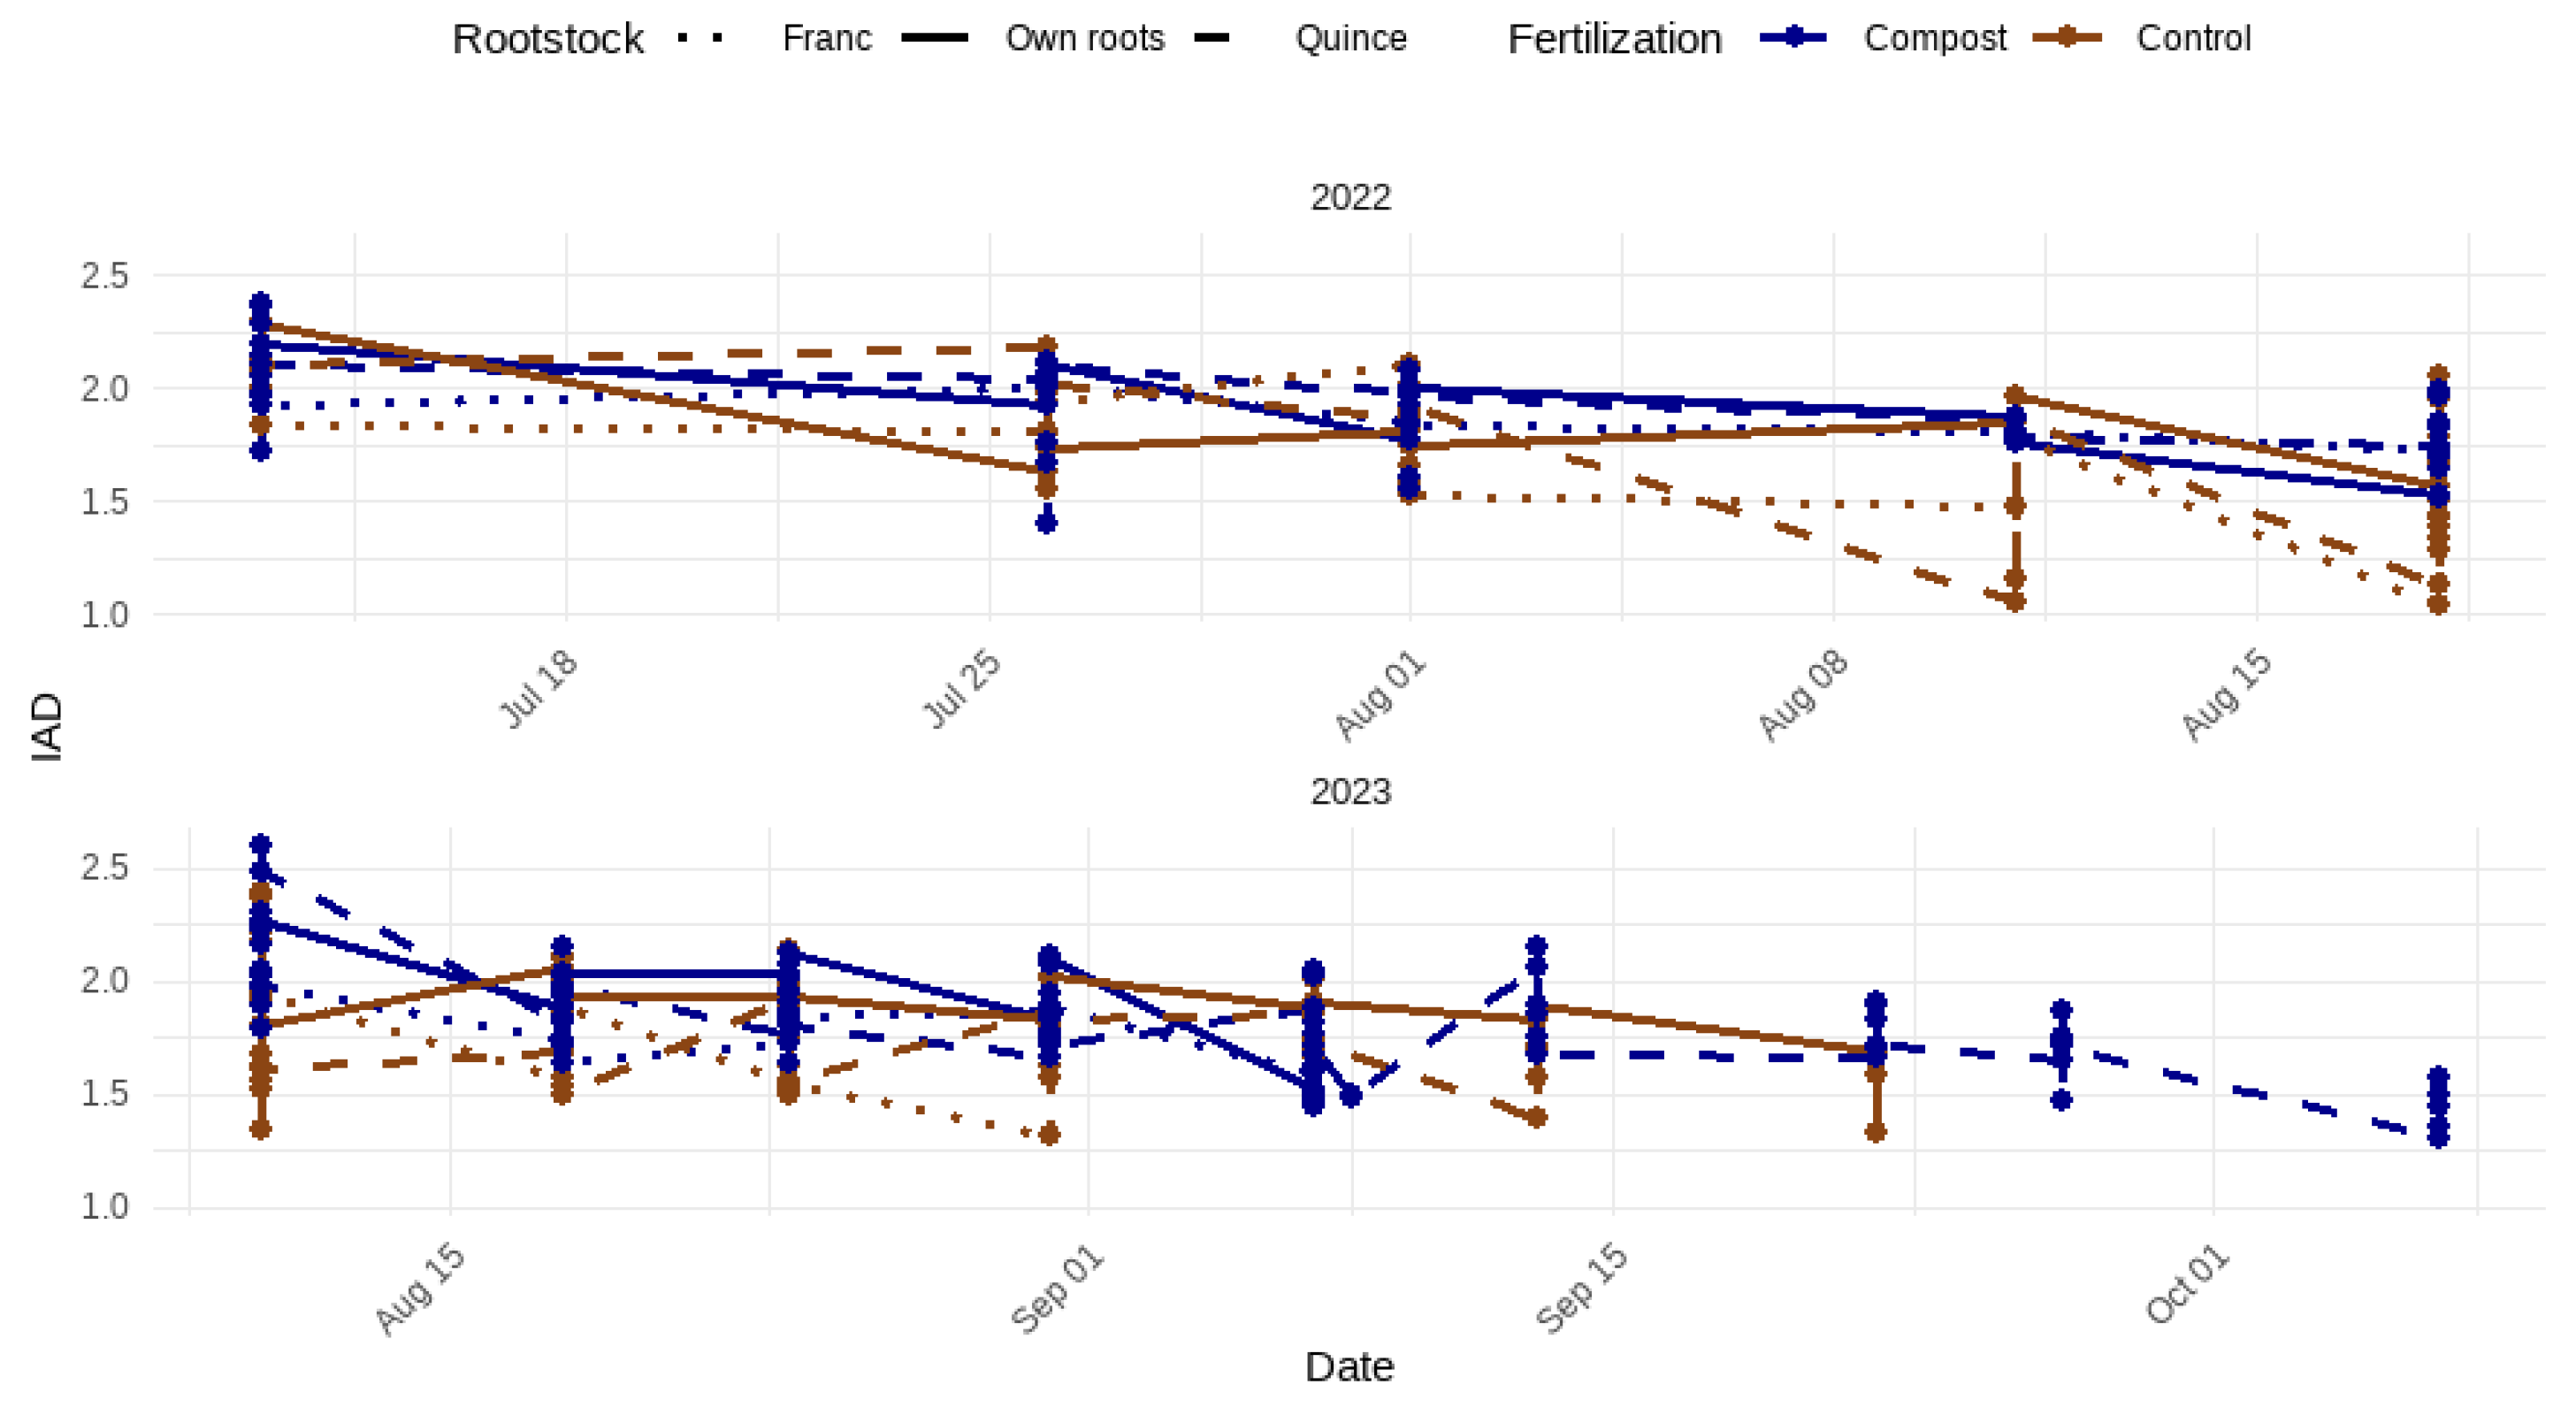
Figure 22.
Dynamics of IAD for ‘Euras’ cultivar by Rootstock x Fertilization
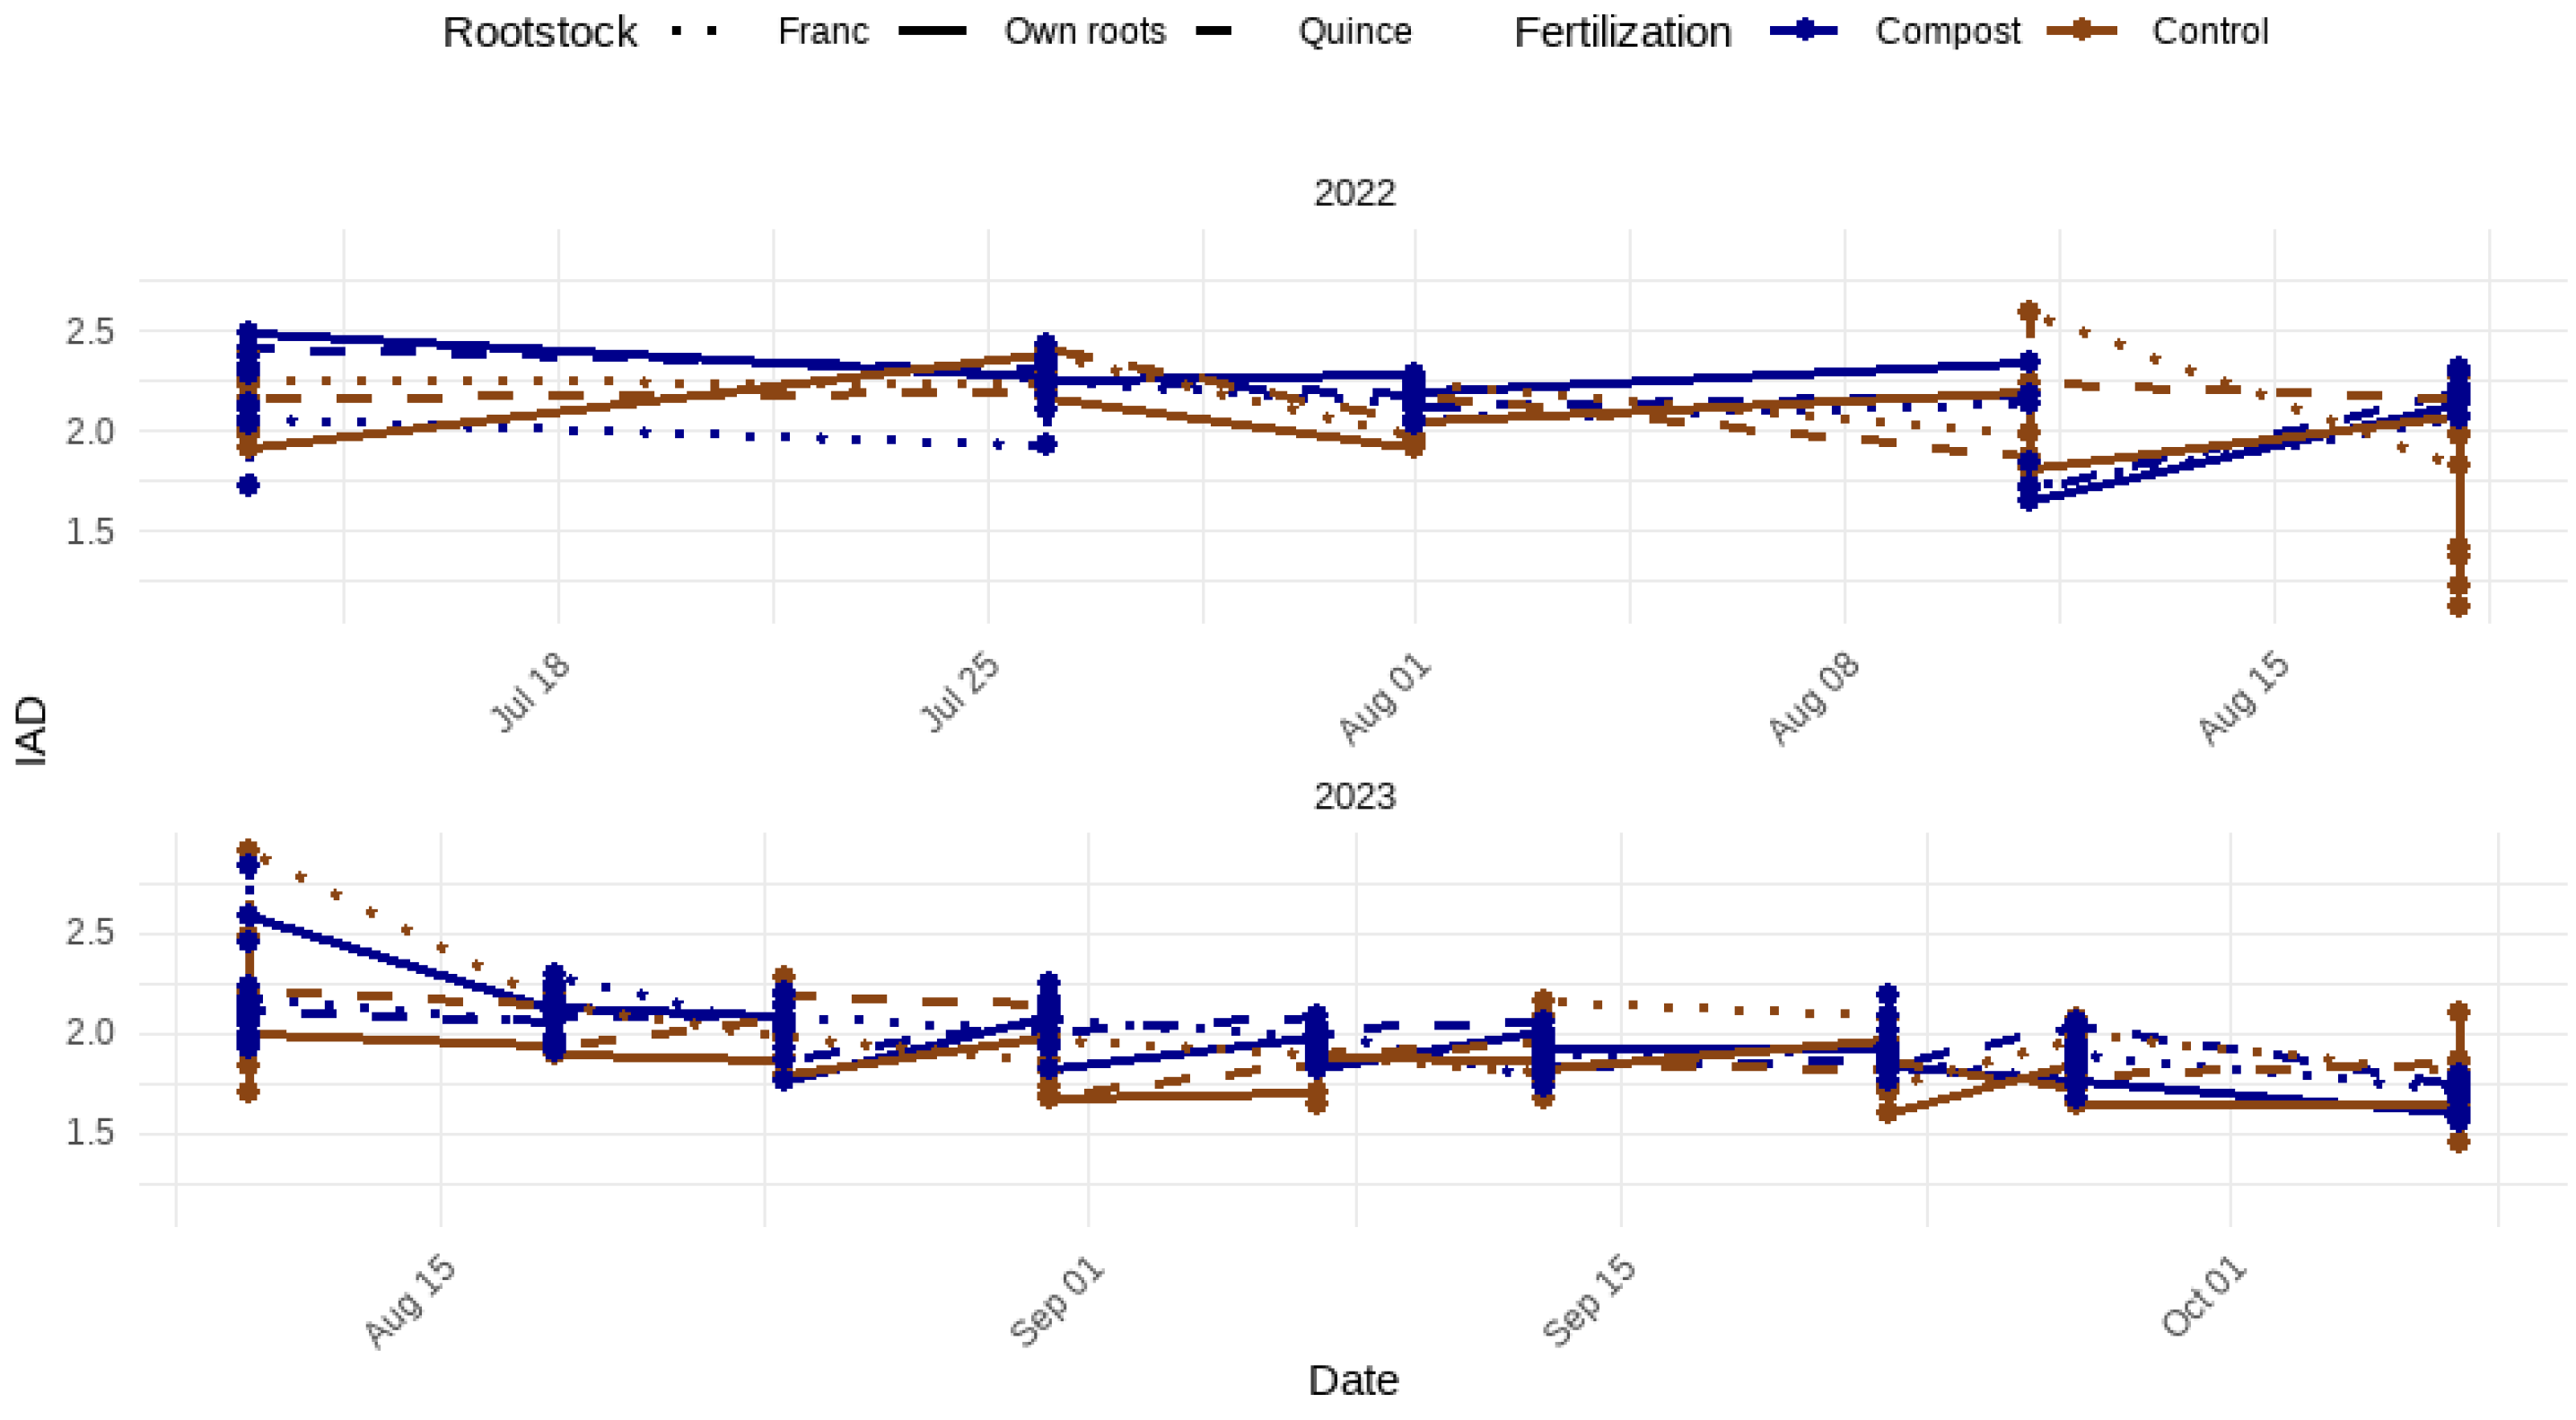
Figure 23.
TCSA growth rate (2023 – 2022) comparison by Cultivar x Rootstock x Fertilization
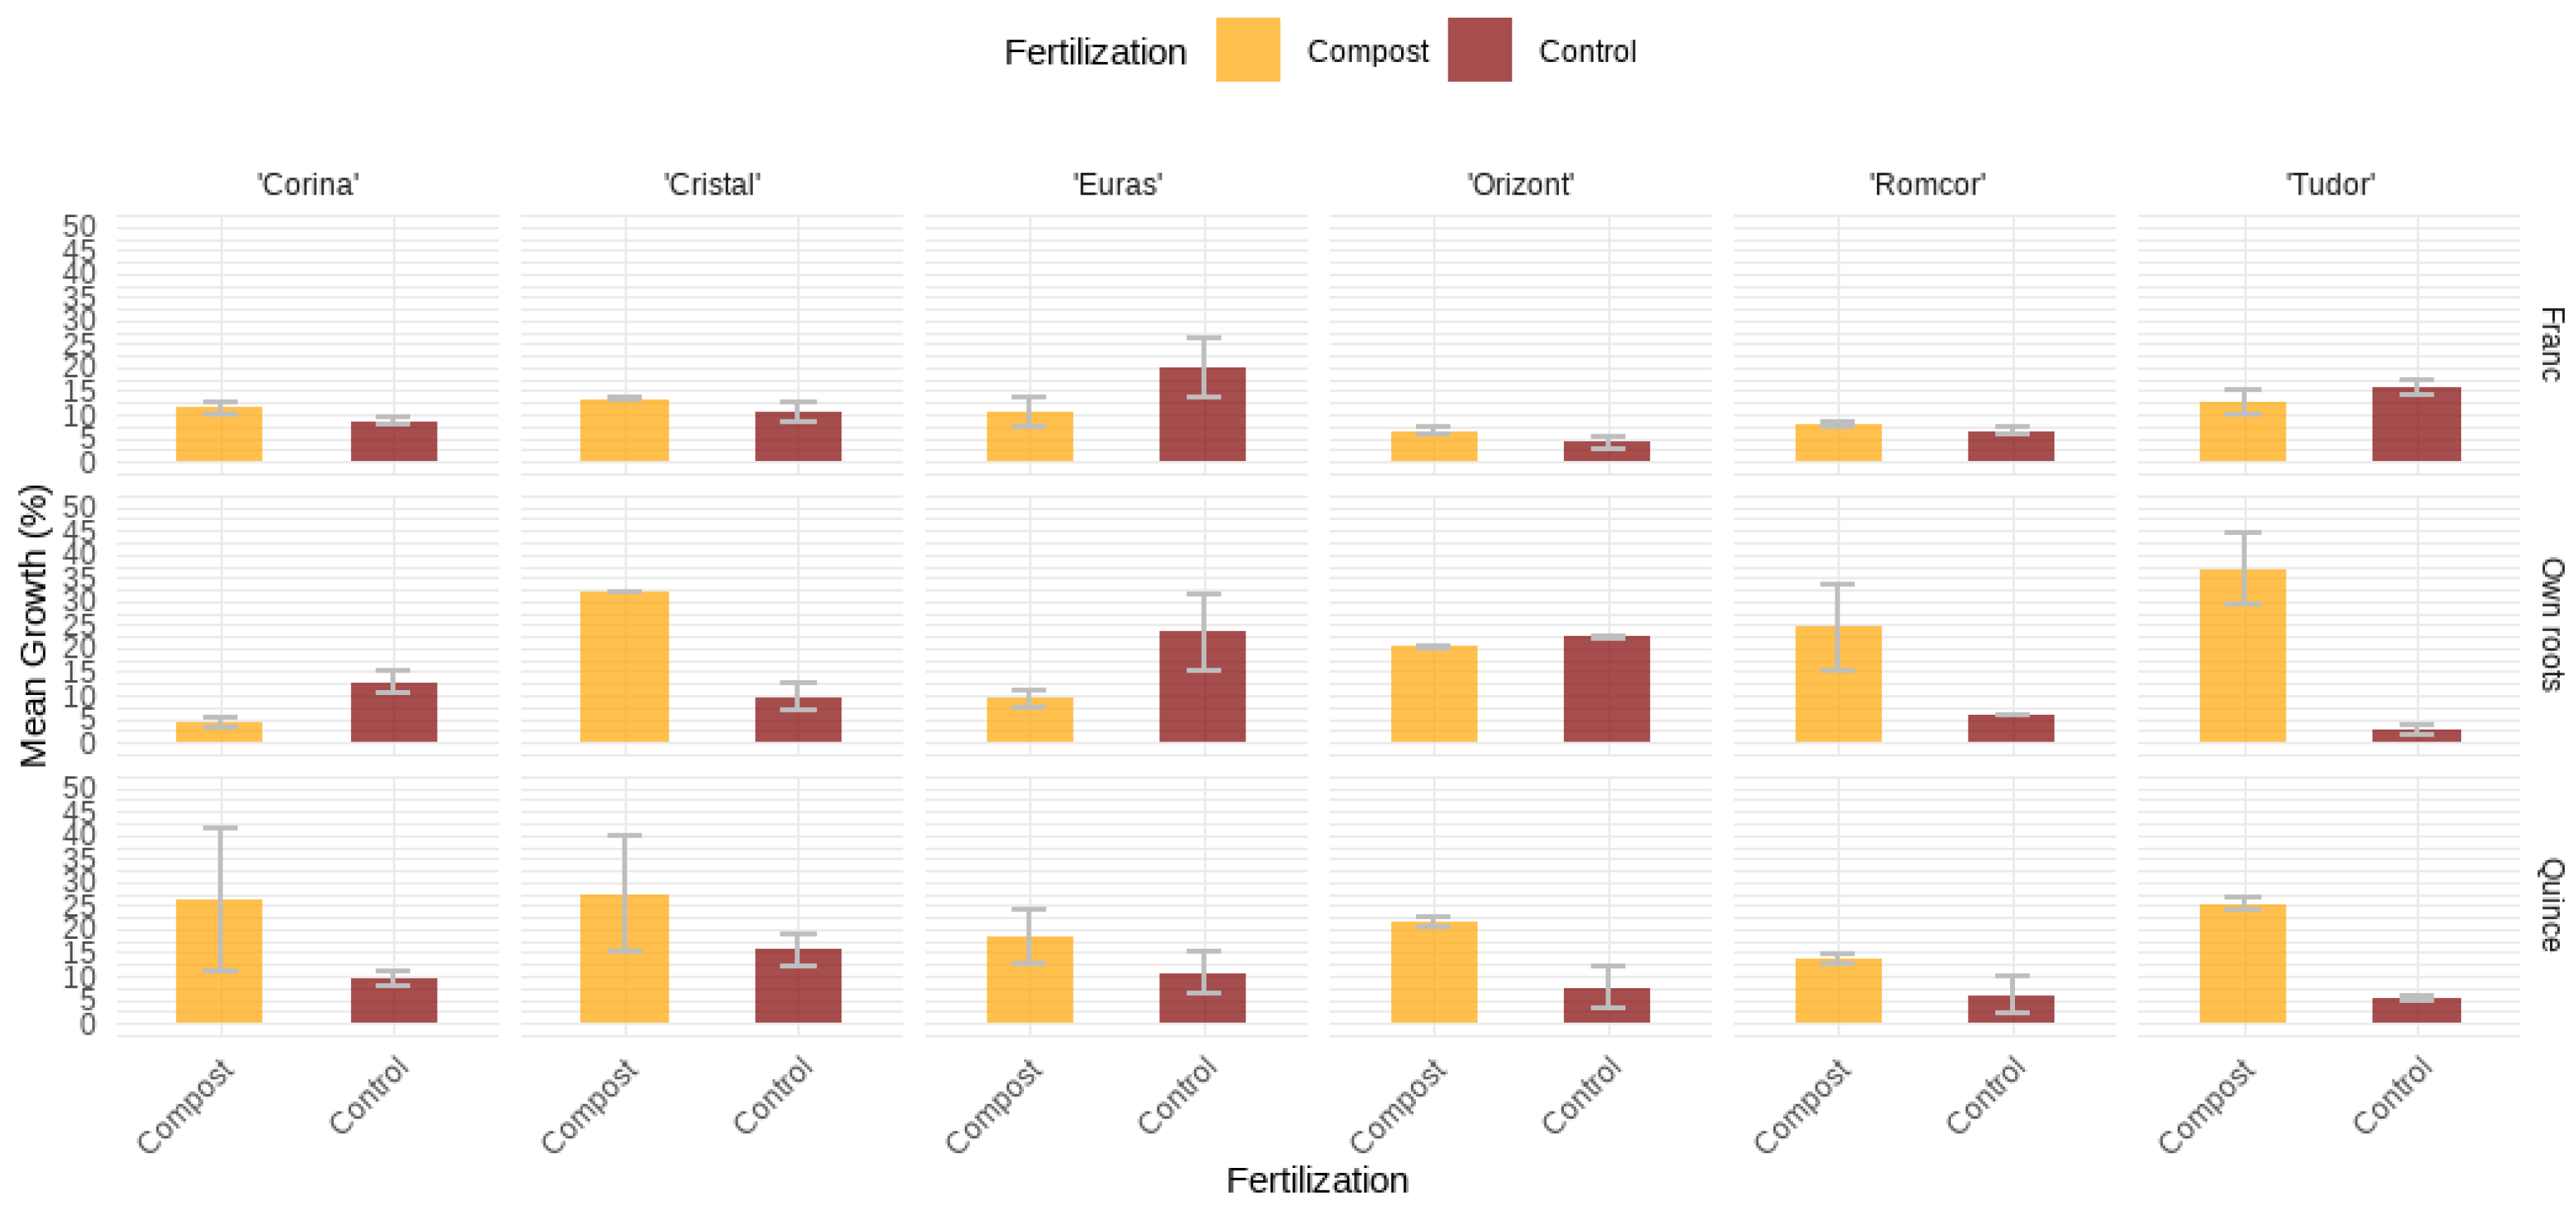
Figure 24.
Total annual vegetative growth rate (2023 – 2022) comparison by Cultivar x Rootstock x Fertilization.
Figure 24.
Total annual vegetative growth rate (2023 – 2022) comparison by Cultivar x Rootstock x Fertilization.
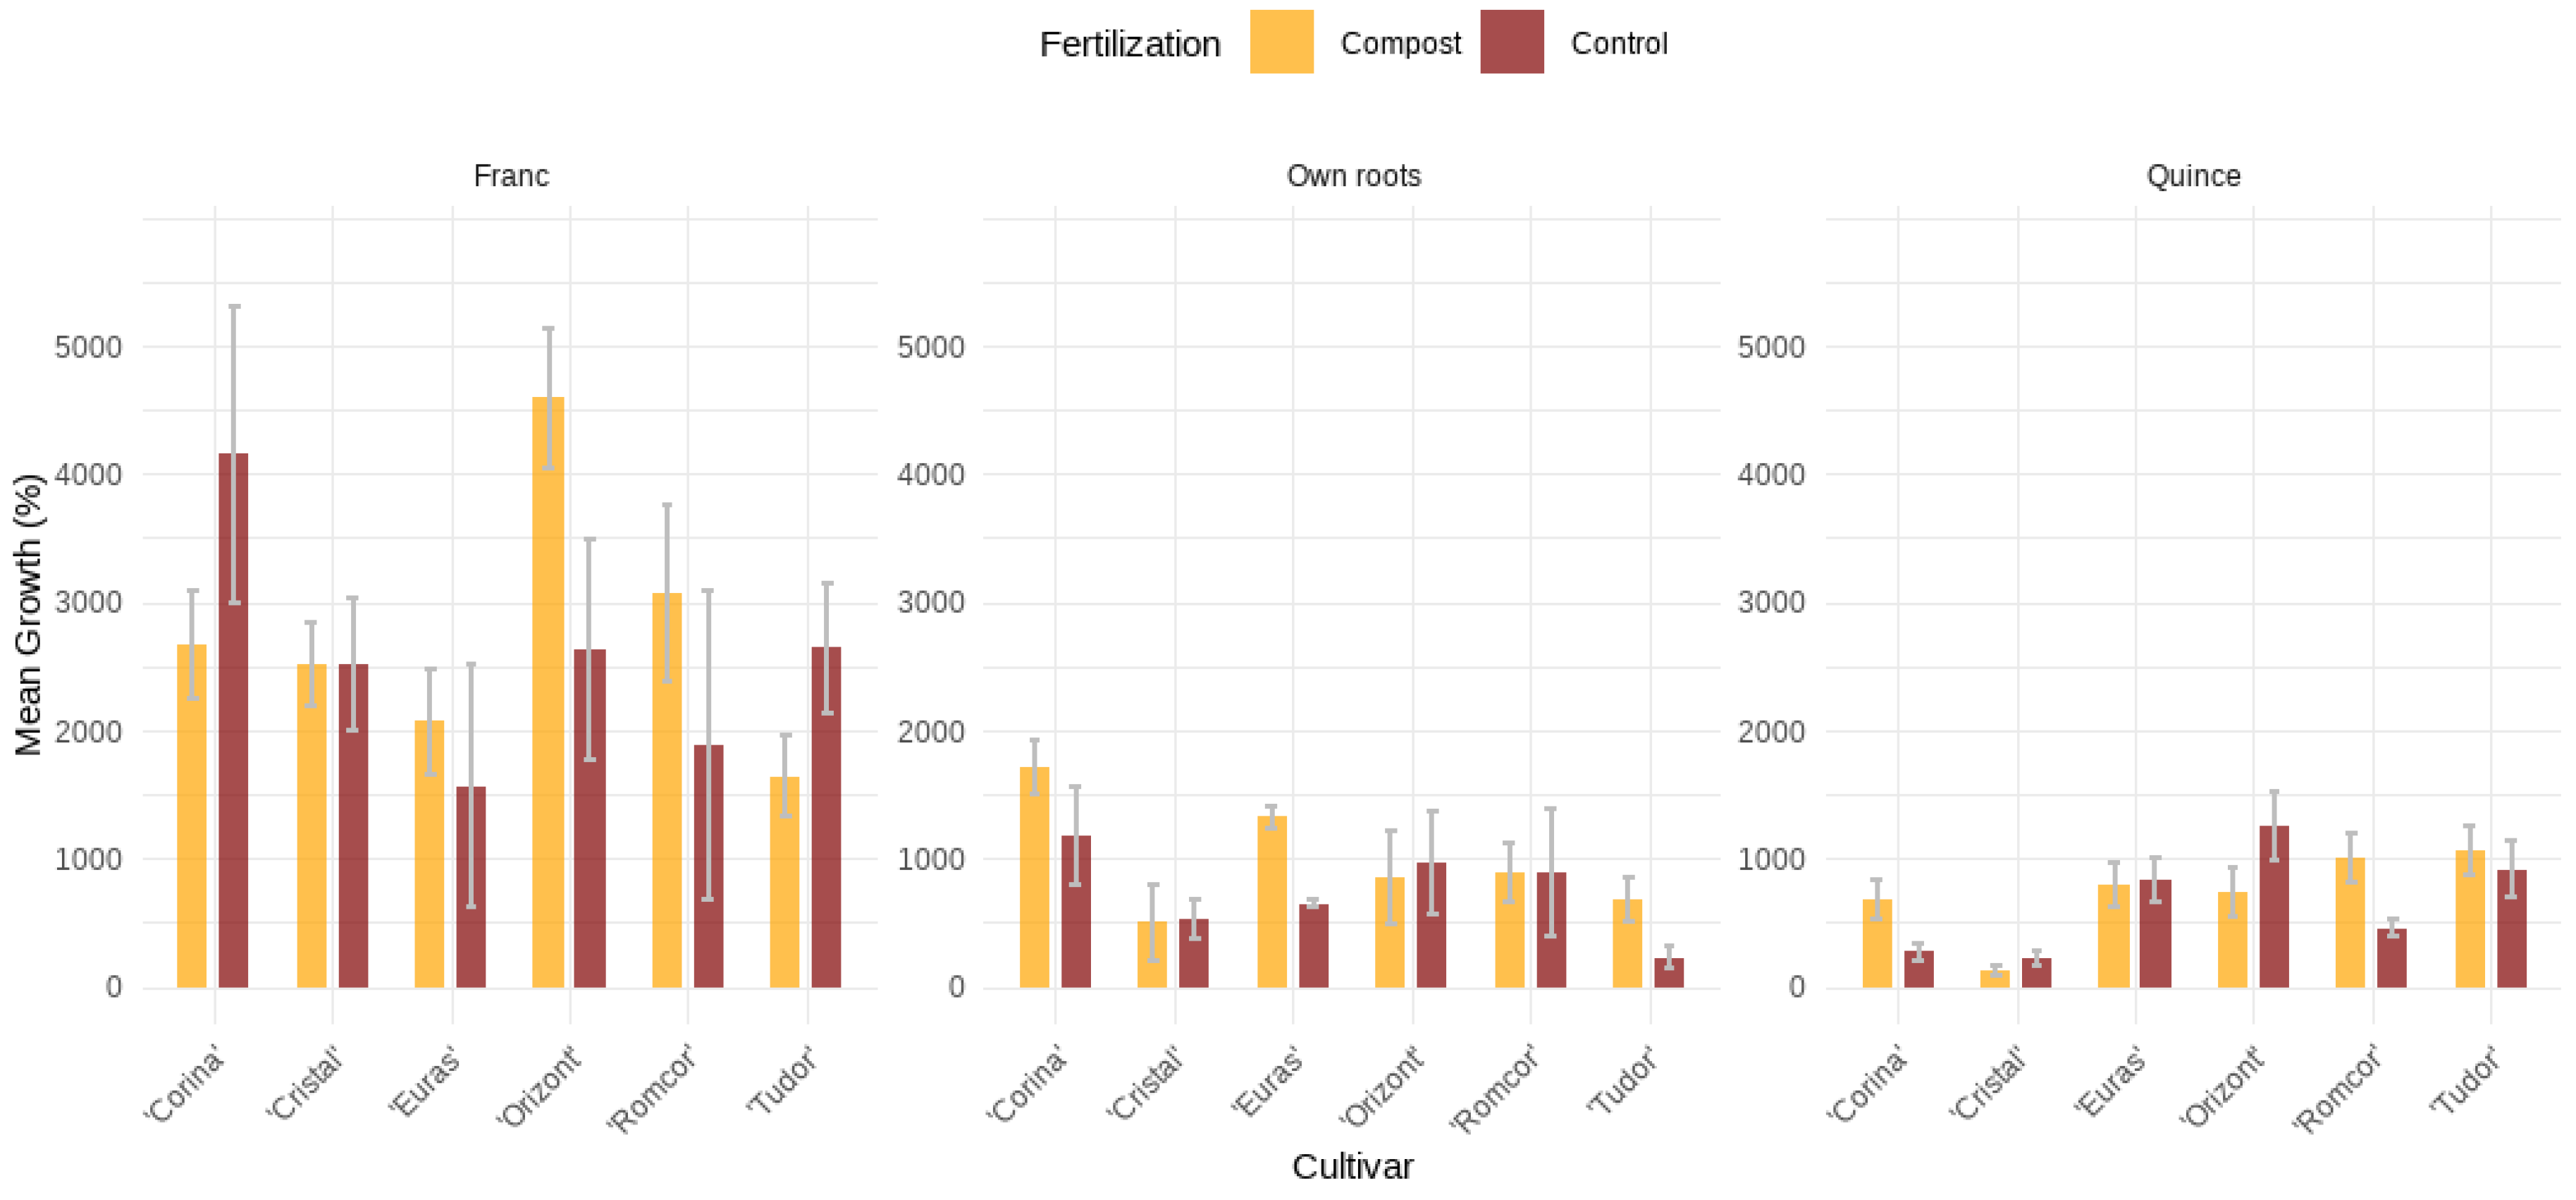
Figure 25.
Total rate (2023 – 2022) comparison by Cultivar x Rootstock x Fertilization for annual fruiting shoots
Figure 25.
Total rate (2023 – 2022) comparison by Cultivar x Rootstock x Fertilization for annual fruiting shoots
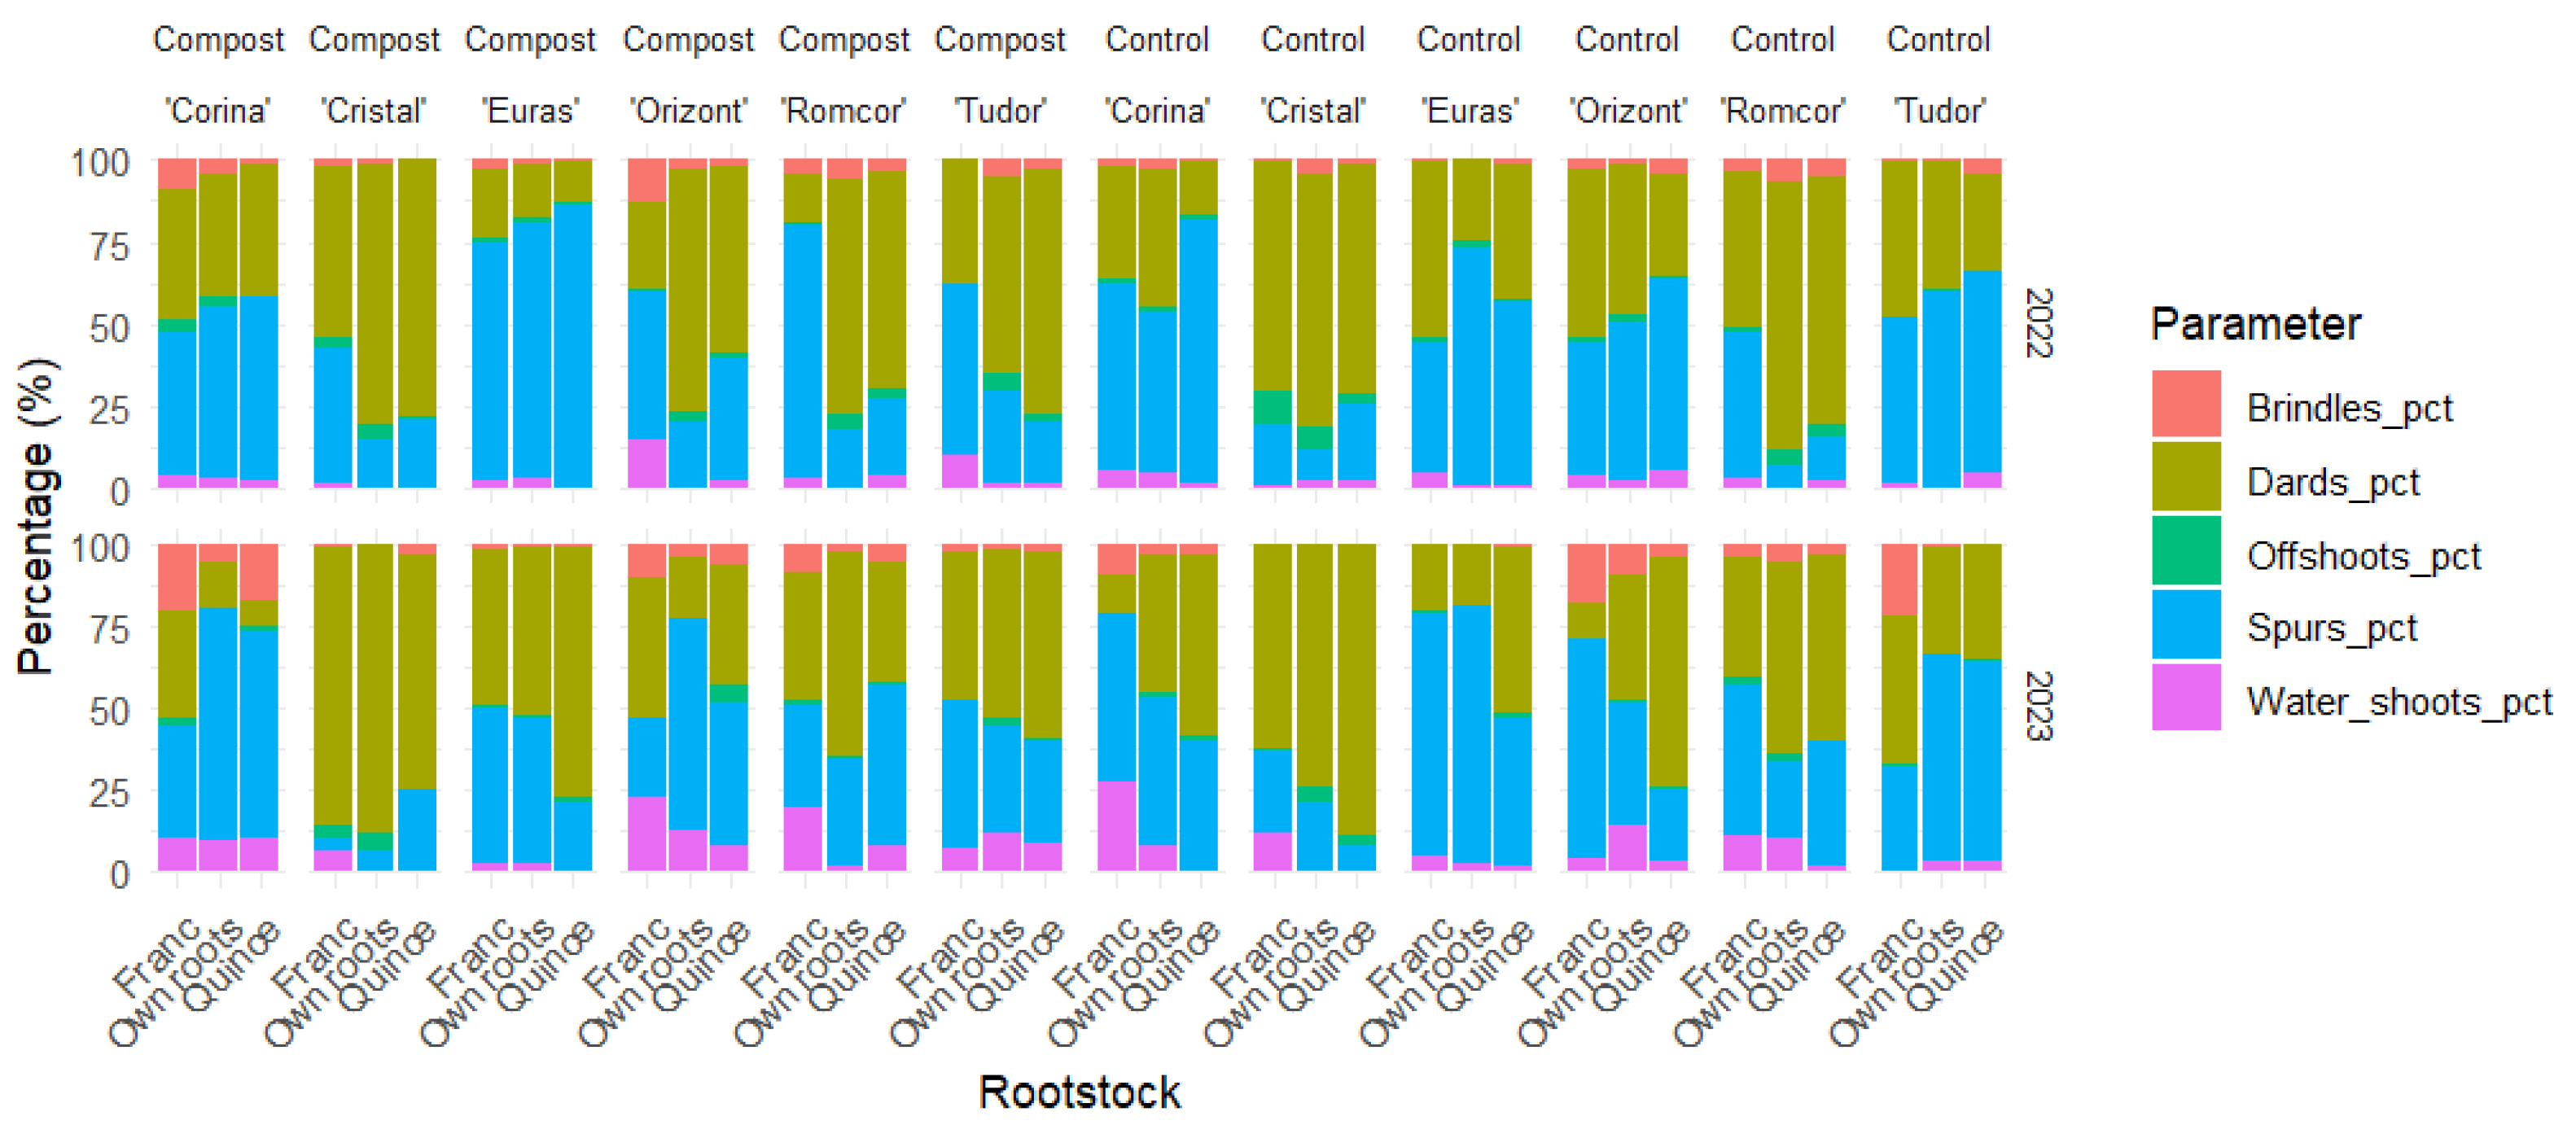

Table 1.
C dynamics measured in pear leaves correlated to cultivar x rootstock.
| Cultivar | Rootstock | Fertilization | 2021 | 2022 | 2023 | ||||||
|---|---|---|---|---|---|---|---|---|---|---|---|
| August | October | May | June | October | May | June | August | October | |||
| ‘Corina‘ | Franc | Compost | 47.01 (a) | 41.67 (a) | 47.71 (a) | 47.45 (a) | 47.52 (a) | 46.02 (a) | 45.56 (a) | 52.14 (a) | 47.45 (b) |
| Control | 47.22 (a) | 38.12 (a) | 48.57 (a) | 47.42 (a) | 44.15 (b) | 45.16 (a) | 46.03 (a) | 47.19 (b) | 51.36 (a) | ||
| Own roots | Compost | 48.90 (a) | - | 48.40 (a) | 47.43 (b) | 44.69 (a) | 46.56 (a) | 48.24 (a) | 47.75 (a) | 46.30 (b) | |
| Control | 47.65 (a) | - | 47.51 (a) | 48.44 (a) | 46.02 (a) | 46.11 (a) | 47.95 (a) | 47.55 (a) | 50.95 (a) | ||
| Quince | Compost | 48.40 (a) | 43.92 (a) | 47.00 (b) | 46.76 (a) | 43.50 (b) | 45.06 (a) | 46.10 (a) | 46.90 (a) | 46.88 (a) | |
| Control | 46.51 (b) | 46.03 (a) | 48.22 (a) | 43.49 (b) | 46.41 (a) | 45.65 (a) | 47.25 (a) | 46.92 (a) | 46.6 (a) | ||
| ‘Cristal‘ | Franc | Compost | 47.69 (b) | 29.02 (b) | 53.12 (a) | 47.48 (a) | 43.44 (a) | 44.59 (a) | 46.5 (a) | 51.14 (a) | 47.28 (a) |
| Control | 49.43 (a) | 42.04 (a) | 47.84 (a) | 46.13 (b) | 37.6 (b) | 44.61 (a) | 44.5 (a) | 45.77 (b) | 45.00 (b) | ||
| Own roots | Compost | 47.92 (a) | 25.99 (a) | 48.41 (a) | 46.61 (b) | 44.96 (b) | 45.74 (a) | 48.02 (a) | 45.94 (b) | 46.4 (a) | |
| Control | 48.64 (a) | 29.51 (a) | 48.39 (a) | 48.13 (a) | 46.92 (a) | 44.73 (a) | 48.02 (a) | 47.43 (a) | 45.66 (a) | ||
| Quince | Compost | 47.01 (a) | 45.07 (a) | 48.03 (a) | 47.6 (a) | 45.59 (a) | 45.64 (a) | 45.44 (a) | - | 48.10 (a) | |
| Control | 45.63 (b) | 42.39 (b) | 47.53 (a) | 47.18 (a) | 45.79 (a) | 44.91 (a) | 46.15 (a) | - | 46.83 (a) | ||
| ‘Euras‘ | Franc | Compost | 45.58 (a) | 42.27 (a) | 52.02 (a) | 48.76 (a) | 43.35 (b) | 45.48 (a) | 48.09 (a) | 51.03 (a) | 48.69 (b) |
| Control | 47.65 (a) | 30.29 (b) | 48.16 (a) | 49.00 (a) | 46.21 (a) | 46.46 (a) | 47.84 (a) | 47.29 (b) | 53.67 (a) | ||
| Own roots | Compost | 48.70 (b) | - | 47.73 (b) | 49.54 (a) | 46.91 (a) | 46.62 (a) | 49.38 (a) | 47.52 (a) | 47.77 (a) | |
| Control | 49.29 (a) | - | 50.32 (a) | 49.05 (a) | 44.15 (b) | 46.34 (a) | 47.65 (b) | 47.83 (a) | 48.87 (a) | ||
| Quince | Compost | 49.10 (a) | 44.80 (a) | 47.31 (a) | 48.24 (a) | 33.72 (b) | 45.29 (a) | 46.22 (a) | 45.52 (a) | 47.01 (a) | |
| Control | 47.56 (b) | 41.46 (b) | 47.49 (a) | 47.52 (b) | 44.49 (a) | 43.74 (b) | 46.24 (a) | 45.91 (a) | 45.57 (a) | ||
| ‘Orizont‘ | Franc | Compost | 49.45 (a) | 44.01 (a) | 47.34 (b) | 47.33 (b) | 32.45 (b) | 47.05 (a) | 45.74 (b) | 51.93 (a) | 48.69 (b) |
| Control | 48.37 (b) | 45.74 (a) | 49.49 (a) | 49.37 (a) | 46.38 (a) | 46.21 (b) | 47.03 (a) | 47.22 (b) | 53.49 (a) | ||
| Own roots | Compost | 48.47 (a) | 24.20 (b) | 50.21 (a) | 48.07 (b) | 46.86 (b) | 46.95 (a) | 47.67 (a) | 48.12 (a) | 60.70 (a) | |
| Control | 48.26 (a) | 32.86 (a) | 49.83 (a) | 49.78 (a) | 48.82 (a) | 45.87 (a) | 48.33 (a) | 47.94 (a) | 47.51 (b) | ||
| Quince | Compost | 47.84 (a) | 22.83 (b) | 48.03 (a) | 49.14 (a) | 31.64 (b) | 46.18 (a) | 47.06 (a) | 52.25 (a) | 47.20 (a) | |
| Control | 47.86 (a) | 43.63 (a) | 48.68 (a) | 48.49 (a) | 45.79 (a) | 45.24 (b) | 46.23 (a) | 46.27 (b) | 46.97 (a) | ||
| ‘Romcor‘ | Franc | Compost | 48.71 (a) | 45.72 (a) | 47.35 (b) | 48.66 (b) | 47.46 (a) | 46.31 (a) | 45.49 (b) | 52.67 (a) | 46.21 (b) |
| Control | 49.74 (a) | 45.30 (a) | 48.20 (a) | 50.57 (a) | 33.26 (b) | 46.23 (a) | 48.21 (a) | 48.77 (b) | 54.80 (a) | ||
| Own roots | Compost | 49.28 (a) | 41.8 (b) | - | 48.83 (a) | 45.17 (a) | 45.78 (a) | 49.2 (a) | 47.58 (a) | 46.67 (b) | |
| Control | 49.8 (a) | 44.7 (a) | - | 48.01 (b) | 48.22 (a) | 45.86 (a) | 46.11 (b) | 47.39 (a) | 51.33 (a) | ||
| Quince | Compost | 47.19 (a) | 43.47 (a) | 46.67 (b) | 46.45 (b) | - | 44.01 (a) | 47.03 (a) | - | 47.97 (a) | |
| Control | 47.69 (a) | 31.48 (b) | 49.3 (a) | 47.92 (a) | - | 44.53 (a) | 45.32 (b) | - | 45.32 (b) | ||
| ‘Tudor‘ | Franc | Compost | 48.75 (a) | 28.95 (a) | - | 47.81 (a) | 43.94 (b) | 45.56 (a) | 47.85 (a) | 53.71 (a) | 49.33 (a) |
| Control | 47.58 (b) | 29.51 (a) | - | 47.65 (a) | 45.18 (a) | 45.09 (a) | 46.97 (a) | 46.82 (b) | 46.10 (b) | ||
| Own roots | Compost | 49.90 (a) | 45.89 (a) | 49.12 (a) | 47.19 (b) | 34.65 (b) | 47.19 (a) | 45.93 (a) | 47.45 (a) | 48.42 (a) | |
| Control | 49.64 (a) | 46.77 (a) | 48.79 (a) | 48.76 (a) | 46.25 (a) | 45.77 (b) | 45.86 (a) | 46.81 (b) | 53.39 (a) | ||
| Quince | Compost | 46.91 (b) | 41.24 (a) | 47.96 (a) | - | 42.93 (b) | 45.24 (a) | 45.90 (a) | 51.24 (a) | 47.26 (a) | |
| Control | 47.75 (a) | 44.29 (a) | 47.14 (a) | - | 45.92 (a) | 44.99 (a) | 46.08 (a) | 45.55 (b) | 46.38 (a) | ||
Disclaimer/Publisher’s Note: The statements, opinions and data contained in all publications are solely those of the individual author(s) and contributor(s) and not of MDPI and/or the editor(s). MDPI and/or the editor(s) disclaim responsibility for any injury to people or property resulting from any ideas, methods, instructions or products referred to in the content. |
© 2024 by the authors. Licensee MDPI, Basel, Switzerland. This article is an open access article distributed under the terms and conditions of the Creative Commons Attribution (CC BY) license (https://creativecommons.org/licenses/by/4.0/).
Copyright: This open access article is published under a Creative Commons CC BY 4.0 license, which permit the free download, distribution, and reuse, provided that the author and preprint are cited in any reuse.


