Submitted:
24 October 2025
Posted:
27 October 2025
You are already at the latest version
Abstract
Brain-network temporal variability is a widely used metric for characterizing temporal fluctuations in the dynamic brain connectome. Despite its wide application, however, the reliability of this metric in estimating brain dynamics remains inadequately investigated. To fill such a gap, this study evaluated the test-retest reliability of temporal variability across four separate resting-state functional magnetic resonance imaging (fMRI) scans, as measured by the intraclass correlation coefficient (ICC), and explored potential influencing factors using a test-retest fMRI dataset from 337 healthy adults. The main findings are: (1) Using a step length of 40 seconds and a window width of 100 seconds for dynamic network construction with the sliding-window approach, temporal variability demonstrated at least moderate (ICC > 0.4) test-retest reliability across the whole brain and in most networks. (2) With other parameters fixed, the reliability was not significantly altered by different step lengths but decreased with longer window widths and shorter total fMRI scan durations. These results were generally consistent when using two different atlases across two randomly split subsamples. Our results indicate that temporal variability is a relatively reliable metric for identifying inter-subject differences in brain dynamics. Nevertheless, moderate window widths and sufficient scan durations are necessary for producing reliable results.
Keywords:
neuroimaging
; functional magnetic resonance imaging
; dynamic functional connectivity
; dynamic brain network
; test-retest reliability
1. Introduction
Recent years have witnessed the growing application of brain connectomic methods to investigate the intricate organization of brain functions and the neural underpinnings of various dysfunctions [1,2]. On the basis of functional magnetic resonance imaging (fMRI) and graph theory, functional brain connectomics provides a non-invasive window into the brain functioning by measuring blood-oxygen-level-dependent (BOLD) signals, which serve as a proxy for neural activity. By analyzing the statistical dependencies between BOLD time series from different brain regions, researchers can reconstruct functional connectivity network maps of the brain’s functional communication pathways and further estimate topological metrics of these networks [1,2,3]. Using the brain connectomic approach, disrupted interactions within and between large-scale brain networks have been demonstrated in multiple common psychological conditions and disorders, such as addictions [4], schizophrenia [5], autism spectrum disorders [6], and mood disorders [7,8].
The earlier brain connectome studies were predominantly performed under a critical assumption: that the architecture of large-scale functional brain networks remains stationary over the duration of a typical fMRI scanning session. However, this “static” functional connectivity model has been argued to be too simplistic by some researchers later since the brain is not a static organ; it is a highly adaptive system whose functional configuration evolves continuously in response to internal goals and external demands [9,10]. In response to this limitation, the “dynamic functional connectivity/dynamic brain network” model has rapidly gained prominence and has been widely adopted in recent years [9,11,12]. Dynamic functional connectivity/dynamic brain network methods aim to capture the fluctuations of functional interaction patterns over time, providing a more precise picture of brain function. Approaches in such a framework can capture transient brain-network states [13], rapid reconfigurations of dynamic brain community structures [14,15], and meta-stable dynamics of edges (connections) in brain network that can be ignored by conventional static analyses [16]. The emergence of this dynamic framework has profoundly shifted our understanding of brain function from a “static” to a dynamic viewpoint.
One of the influential metrics within the dynamic brain connectome framework is the temporal variability of functional brain networks. As proposed by Zhang et al. [17], this measure quantifies the degree to which the functional connectivity profile within a given brain network, or between particular pairs of brain networks, fluctuates over time. The study by Zhang et al. [17] demonstrated significantly lower temporal variability within regions of the default-mode network, but higher temporal variability within the subcortical regions, in patients with autism/attention deficit hyperactivity disorder compared with normal controls. The latter studies have further reported excessively increased or decreased temporal variability of brain networks in various neuropsychiatric disorders, such as schizophrenia [18,19,20], bipolar disorder [18], major depressive disorder [21,22], Parkinson’s disease [23], alcohol use disorder [24], and internet gaming disorder [25]. Alterations in brain-network temporal variability have also been associated with aging [26], sleeping [27], verbal creativity [28], social behaviors [29], problematic smartphone use [30], as well as depressive symptoms in general populations [31]. Generally, both excessive decreases and increases in brain-network temporal variability can be considered indicative of brain dysfunction [12]. Reduced temporal variability may imply an impaired ability to flexibly integrate information and switch between different states; in contrast, excessively increased temporal variability may indicate neural dynamics that are overly flexible and even randomized [16]. Thus, this metric has emerged as a powerful tool to characterize brain functional changes in both healthy and clinical populations, and as a potential core biomarker of psychopathology.
Despite its wide application, however, a fundamental question remains not adequately investigated: the reliability of using brain-network temporal variability to estimate brain dynamics, particularly during the resting state. In the field of neuroimaging, satisfactory test-retest reliability is of great importance for any proposed brain connectomic metric to be a potential biomarker for brain dysfunction [32]. Test-retest reliability, which is often estimated by the intraclass correlation coefficient (ICC) in neuroimaging studies, assesses the consistency of a measurement when the same individual is scanned repeatedly [33,34]. High test-retest reliability is essential for precisely characterizing an object and its associations with other variables of interest [35]. To date, while the test-retest reliabilities of static brain functional connectivity [33,34,36] and several other dynamic metrics [32,37,38,39] are relatively well-documented, the test-retest reliability of brain-network temporal variability is still little known to our knowledge. Furthermore, it is unclear whether the reliability of brain-network temporal variability could be influenced by key parameters in the data acquisition and processing steps (e.g., the total fMRI scan duration), which can affect the reliability of resting-state fMRI metrics as reported in other studies [40,41].
Therefore, this study is designed to directly address the above questions by evaluating the test-retest reliability of brain-network temporal variability using a relatively large-sample, test-retest resting-state fMRI dataset. Our investigation will also explore the influence of several critical factors: (1) the step length and window width parameters chosen during the sliding-window steps when constructing dynamic brain networks, and (2) the total fMRI scan duration. By examining how these factors affect test-retest reliability, we seek to establish evidence-based methodological guidelines for applying brain-network temporal variability. The findings will provide practical guidance for future studies utilizing this metric.
2. Materials and Methods
2.1. Data Acquirement and Preprocessing
The present study utilized a sample of 337 healthy, unrelated individuals from the Human Connectome Project (HCP) [42] “S1200” dataset, which is consistent with a prior published study [32]. The participants consisted of 157 males and 180 females, ranging in age from 22 to 37 years (mean age = 28.61 ± 3.69). To ensure that results were not dependent on the specific sample, we randomly split the entire sample into two subsamples (N = 168 and N = 169, respectively) (Figure 1A). All subsequent analyses were performed separately in these two subgroups to see whether the results were consistent across different sets of participants. There were no significant differences in age, sex distribution, or head motion measured by mean framewise displacement (FD) between the two subsamples (all p > 0.05, see Table 1).
For each subject, four distinct resting-state fMRI scans were acquired over two separate sessions (Figure 1B). Each scanning run was acquired with a repetition time (TR) of 0.72 seconds and contained 1200 time points. The HCP’s minimal preprocessing pipelines were applied to all fMRI data, which incorporated ICA-FIX denoising. This procedure is suggested as a more targeted and effective method for removing non-neural noise components compared to conventional global signal regression. For comprehensive details regarding the sample and preprocessing, readers are referred to prior publications [43,44,45,46,47]. Informed consent was obtained from all participants under the protocol approved by the Institutional Review Board at Washington University. The ethical committee of the Second Xiangya Hospital, Central South University (Changsha, China) also granted approval for this analysis (2024013).
2.2. Constructing Dynamic Brain Networks
A dynamic brain network is characterized by the temporal evolution of connections between its nodes [48]. In the current study, to ensure that results were not dependent on the specific atlas, we used two different atlases to define brain nodes: the automated anatomical labeling (AAL) [49] and the Power [50] atlas. Both these two atlases have been validated for neuroimaging analyses [32,34] and widely used in previous studies of dynamic brain networks [15,30,51,52,53]. All subsequent analyses were performed separately using the two atlases. A total of 90 nodes were defined based on the AAL atlas, and 264 nodes were defined based on the Power atlas. According to previous published work [15,32,50,54,55], these nodes were assigned into nine large-scale brain networks including the default-mode, salience, visual, subcortical, auditory, fronto-parietal, cingulo-opercular, sensorimotor, and attention networks.
Time-varying dynamic brain networks were constructed using the commonly used sliding-window approach [21,32,56,57]. Briefly, mean fMRI signals were extracted from all 90 or 264 nodes and segmented into a sequence of successive, partly overlapping time windows. In the primary analyses, we employed a 100-second window width (approximately 139 TRs) with a 40-second sliding step length (56 TRs), yielding a total of 19 time windows. The selection of such window width was based on recommendations in previous work [21,32,58,59], and we examined how window width and step length affected the results in subsequent analyses. For each time window, we computed the dynamic functional connectivity between all node pairs using Pearson correlation, resulting in a 90 × 90 or 264 × 264 connectivity matrix. Each of these continuous correlation matrices represents a weighted, time-dependent “snapshot” of brain-network structures. Finally, we assembled these sequential matrices into a multilayer dynamic graph, G = (Gt)t = 1, 2, 3, …,T, where the tth “snapshot” (Gt) represents the brain-network structures at the tth time window. Note that while T = 19 in the primary analysis, its value varied in subsequent analyses depending on the specific combinations of window width, step length, and scan duration.
2.3. Temporal Variability
After constructing dynamic brain networks, brain-network temporal variability was calculated to quantify the degree to which the network connectivity profiles fluctuate over different time windows (Figure 1C). Temporal variability was computed at two spatial scales: the network level (encompassing connectivity within a single network or between pairs of networks) and the global whole-brain level. Briefly, the within-network temporal variability for a given network (e.g., the visual network) was computed as:
where Fi (visual) is a vector representing the dynamic function connectivity between all node pairs within the visual network at the ith time window; T is the total number of time windows and equals to 19 in the primary analysis; the value of T changed in subsequent analyses with different combinations of parameters (e.g., window width and step length). Similarly, the between-network temporal variability for a pair of networks (e.g., the visual and auditory networks) was computed as:
where Fi (visual-auditory) is a vector representing the dynamic function connectivity between all nodes in the visual network and all nodes in the auditory network at the ith time window; T is the total number of time windows (equals to 19 in the primary analysis and changed in subsequent analyses). The temporal variabilities for all other individual networks and pairs of networks were calculated using the same method. Additionally, global temporal variability was computed by treating all 90 or 264 nodes as a single whole-brain network. Consequently, the above analyses produced a total of 45 network-level (9 within-network and 36 between-network) and one global temporal variability values. More details about the process of computing brain-network variability can be found in previous publications [17,18,19,28].
2.4. Test-Retest Reliability
As in previous studies [32,33,34,60,61,62], following computing brain-network temporal variability, the test-retest reliability of temporal variability across four fMRI scans was evaluated by the intraclass correlation coefficient (ICC) with a two-way mixed, single measure model (ICC(3,1)) (Figure 1D). The ICC analysis was performed separately for each of the two brain atlases, each of the two subsamples, and each of the network-level/global temporal variability values. Theoretically, values of ICC range from 0 (suggesting no reliability) to 1 (suggesting perfect reliability). Based on established criteria in prior research [32,33,34,63,64,65,66], test-retest reliability was categorized into four levels using the following criterion: poor (ICC < 0.4), moderate (0.4 ≤ ICC < 0.6), good (0.6 ≤ ICC < 0.75), and excellent (ICC > 0.75). In the primary analysis, the ICCs were calculated with the following fixed data acquisition and processing parameters: scan duration = 14.4 minutes (1200 TRs; using the entire scan), window width = 100 seconds (139 TRs), and step length = 40 seconds (56 TRs).
2.5. Effects of Data Acquisition and Processing Parameters
Following the primary analysis, we performed several follow-up analyses to assess the effects of data acquisition and processing parameters. This was done by repeating the test-retest analyses with different settings for a particular parameter while keeping others constant. Details are as follows:
(1) Effect of step length: Following our primary analysis (which used a 40-second step length), we tested the possible impact of step length during the sliding-window approach by repeating the analyses with different values (including 10, 20, 60, 80, and 100 seconds) while keeping all other parameters fixed at their default values.
(2) Effect of window width: Following our primary analysis (which used a 100-second window width), we tested the possible impact of window width during the sliding-window approach by repeating the analyses with different values (including 40, 70, 150, 200, 300, and 400 seconds) while keeping all other parameters fixed.
(3) Effect of scan duration: Following our primary analysis (which used the full 14.4-minute scan), we tested the possible impact of scan duration by repeating the analyses using shorter segments of the fMRI data (3, 4, 5, 6, 8, 10, and 12 minutes) while keeping all other parameters fixed.
2.6. Exploratory Analyses of Sex and Age Effects
Previous publications have widely reported the significant effects of sex and age in neuroimaging and psychiatric research [3,32,67,68]. Thus, for exploratory purposes, we performed additional analyses to investigate the possible relationships between sex/age and brain-network temporal variability. The analyzing steps are as follows: (1) for each participant, the overall values of brain-network temporal variability were firstly obtained by averaging the values across the four fMRI scans; (2) to assess possible sex effects, the overall brain-network temporal variability was compare between the male and female participants using the analysis of covariance (ANCOVA) controlling for age and head motion (mean FD); (3) to assess possible sex effects, partial correlations were performed between the overall brain-network temporal variability and age, adjusted for sex and head motion (mean FD). The above analyses were performed for both the network-level and global temporal variability values. False discovery rate (FDR) corrections were performed across multiple tests at the network level, and results were considered significant at corrected p < 0.05. These analyses were performed independently for each combination of brain atlas (AAL and Power) and subsample, similar to the test-retest reliability analyses.
3. Results
3.1. Primary Analysis
The test-retest reliability of brain-network temporal variability from the primary analysis is shown in Figure 2. It was shown that with the default settings (window width = 100 seconds, step length = 40 seconds, and scan duration = 14.4 minutes), the temporal variability exhibited moderate (0.4 ≤ ICC < 0.6) to good (0.6 ≤ ICC < 0.75) test-retest reliability at the whole-brain level (Figure 2B), and for most networks/network pairs at the network level (Figure 2A). Such findings were generally consistent across the AAL and Power atlases, with the exceptions of slightly higher reliability for the Power atlas at the network level and for the AAL atlas at the whole-brain level. Furthermore, although similar trends were observed in both subsamples, the ICCs were overall higher in the first subsample (N = 168) than in the second subsample (N = 169). Among the network-level temporal variability metrics, temporal variability within the subcortical network was the only one showing poor reliability (ICC < 0.4) in both subsamples.
3.2. Effects of Data Acquisition and Processing Parameters
Effects of data acquisition and processing parameter on the test-retest reliability of brain-network temporal variability are presented in Figure 3, Figure 4 and Figure 5. The effect of step length used in the sliding-window approach is shown in Figure 3. Generally, we found that ICC values for temporal variability were similar across step lengths from 10 to 100 seconds. This consistency was evident at both the network (Figure 3A) and global (Figure 3B) levels, in both subsamples, and for both the AAL and Power atlases. Therefore, our results that the test-retest reliability of brain-network temporal variability is not significantly influenced across the tested range.
The effect of window width used in the sliding-window approach is shown in Figure 4. We found that ICC values for temporal variability generally decreased as the window width increased from 40 to 400 seconds, with a more pronounced decline beyond 100 seconds. Such a trend was observed for most networks at the network level (Figure 4A) and for the whole brain at the global level (Figure 4B). Furthermore, this trend was consistent across both subsamples, and for both the AAL and Power atlases. Therefore, our results demonstrate that excessively long window widths can reduce the test-retest reliability of brain-network temporal variability.
The impact of fMRI scan duration on reliability is shown in Figure 5. We found that ICC values for temporal variability generally decreased with shorter fMRI scan durations from 14.4 to 3 minutes. This trend was consistent at both the network (Figure 5A) and global (Figure 5B) levels, in both subsamples, and for both the AAL and Power atlases. Notably, the reliability of global temporal variability fell into the poor range (ICC < 0.4) in both samples when the scan duration was shorter than 5 minutes. These results suggest that shorter fMRI scan durations can substantially reduce the test-retest reliability of brain-network temporal variability.
3.3. Exploratory Analyses of Sex and Age Effects
As for analyses on sex and age effects of temporal variability, no results survived corrections at the network level (corrected p > 0.05). At the global level, most tests for the effects of sex and age on whole-brain temporal variability were not significant (p > 0.05). However, a consistent, albeit non-significant, trend was observed across both subsamples and atlases: female participants tended to show higher whole-brain temporal variability than males, and a positive relationship was suggested between age and whole-brain temporal variability (Figure 6A and Figure 7A). Notably, these trends became statistically significant (p < 0.05) when the entire sample was pooled together (Figure 6B and Figure 7B).
4. Discussion
In this study, we assessed the test-retest reliability of brain-network temporal variability during the resting state, as well as potential impacts of multiple data acquisition and processing parameters on its reliability using a test-retest fMRI dataset. Our main findings include: (1) when using conventional parameters during the data acquisition and dynamic network construction, temporal variability demonstrated at least moderate (ICC > 0.4) test-retest reliability across the whole brain and in most networks. (2) with other parameters held constant, the reliability was not significantly altered by different step lengths but decreased with longer window widths and shorter total fMRI scan durations.
The first important result of this study was that, when using a conventional window width of 100 seconds and a step length of 40 seconds for dynamic network construction with the sliding-window approach, the temporal variability exhibited moderate (0.4 ≤ ICC < 0.6) to good (0.6 ≤ ICC < 0.75) test-retest reliability at both the network and whole-brain levels (Figure 2). In the field of neuroimaging, at least moderate test-retest reliability (with an ICC > 0.4) is generally considered necessary for a brain connectomic metric to convincingly measure alterations in brain functions [32,33,34,63,64]. Despite the wide applications in both healthy [27,28,30] and clinical [17,18,19,20,21,22,23,24,25] populations, however, previous studies have seldom investigated the reliability of brain-network temporal variability based on resting-state fMRI. Here, our study filled this gap, providing evidence to support temporal variability as a relatively reliable metric in estimating brain dynamics.
Notably, while at least moderate test-retest reliability was observed for most brain networks, the subcortical network was an exception, with its temporal variability showing only poor reliability (ICC < 0.4) for both the AAL/power atlases and across both subsamples (Figure 2B). Several previous studies have reported that functional connectivity profiles of the subcortical network are more variable over time than those of other cortical brain networks [18,32]. This characteristic may be attributed to the central role of the thalamus and other subcortical structures as “relay stations” for cortical information flow, which involves complex and fluctuating dynamics [18,69,70]. Possibly due to such a reason, the subcortical network has consistently demonstrated the lowest reliability across multiple static and dynamic metrics (beyond temporal variability) in previous research [32]. Therefore, our results are in line with previous reports, suggesting that findings related to the subcortical network should be interpreted with more caution.
Our findings that both network-level and whole-brain temporal variability exhibited at least moderate test-retest reliability were generally consistent across two different atlases (AAL and Power) and across two randomly split subsamples. Although we observed slightly higher reliability with the functional Power atlas at the network level (Figure 2A) and with the AAL atlas at the whole-brain level (Figure 2B), the results suggest that brain-network temporal variability is a reliable metric largely independent of the specific atlas chosen. This may represent an advantage of temporal variability over some other functional brain network metrics, which have shown significantly poorer test-retest reliability with certain atlases (e.g., AAL) [34]. Furthermore, ICCs were overall lower in one subsample than in the other. Therefore, while generally satisfactory, the reliability of temporal variability may vary slightly across different study populations.
With other parameters fixed, we found that the test-retest reliability of brain-network temporal variability was not significantly altered by different step lengths (across 10 to 100 seconds) at both network and global levels (Figure 3). A key practical implication of such results is that researchers can opt for longer step lengths without significantly compromising the reliability of temporal variability when constructing dynamic brain networks. During the sliding-window approach, longer step lengths and longer window widths will reduce the number of windows, thereby decreasing computational cost for dynamic brain network analyses [71]. Consequently, a moderate increase in step length can be an effective strategy to achieve an optimal balance between methodological rigor and computational efficiency in large-scale studies. In contrast to the findings on step length, our results demonstrated a clear decline in test-retest reliability with longer window widths, which became particularly pronounced beyond 100 seconds (Figure 4). Therefore, employing a moderately sized window is crucial, as it ensures a sufficient number of time windows to reliably estimate fluctuations in connectivity strength between brain networks [72].
As for the effect of fMRI scan duration, our results revealed that test-retest reliability of the brain-network temporal variability exhibited a clear and progressive decrease as the total fMRI acquisition time was shortened (Figure 5). This finding directly corroborates many previous recommendations for employing longer scans to ensure data reliability in fMRI studies [73,74,75]. Here, we extend this principle to the domain of brain-network temporal variability, confirming that sufficient scan duration is necessary for computing temporal variability. A particularly critical finding was that the reliability of global temporal variability fell into the poor range (ICC < 0.4) in both subsamples when the scan duration was truncated to less than 5 minutes (Figure 5B). Therefore, too short fMRI scan durations can substantially reduce the test-retest reliability of brain-network temporal variability.
As an exploratory analysis, we additionally investigated the potential sex and age effects of brain-network temporal variability. Although most tests were not significant, we observed consistent trends across both subsamples and atlases: female participants tended to show higher whole-brain temporal variability than males, and a positive relationship was suggested between age and whole-brain temporal variability (Figure 6A and Figure 7A). Notably, these trends became statistically significant when the entire sample was pooled together (Figure 6B and Figure 7B). These findings align with some previous studies which report that the temporal stability of functional brain network is higher in females than males [32,76] and decreases with aging [26,32]. Thus, our study supports these conclusions from the perspective of temporal variability, highlighting the necessity of controlling for sex/age effects in related research. Furthermore, the emergence of significance in the larger pooled sample may highlight the enhanced sensitivity of larger sample sizes for detecting subtle effects in neuroimaging research.
Our study has several limitations. First, we used ony the AAL and Power atlases; future work may benefit from comparing a broader range of parcellation schemes. Second, the limited duration of each HCP run (14.4 minutes) precluded a thorough investigation of the effects of longer scan lengths on our findings. Third, our investigation was confined to the resting state; extending this research to task-based fMRI would be a valuable direction for future studies.
In conclusion, this study demonstrated that brain-network temporal variability is a relatively reliable metric for identifying inter-subject differences in brain dynamics. This reliability was shown to be robust across different brain atlases. However, producing consistent results requires the use of moderate window widths and sufficient scan durations. The exploratory analysis indicates that whole-brain temporal variability is higher in females and increases with age, highlighting the necessity of controlling for these demographic factors in related research. Accordingly, this study provides a valuable guide for future research that utilizes this metric.
Author Contributions
Conceptualization, Q.Z., S.T. and Y.L.; methodology, Q.Z. and Y.L.; formal analysis, Y.L.; data curation, Y.L.; writing—original draft preparation, Q.Z. and Y.L.; writing—review and editing, L.P., H.Z., J.L. and S.T.; funding acquisition, Q.Z, P.L., J.L. and Y.L. All authors have read and agreed to the published version of the manuscript.
Funding
This research was funded by the Department of Education of Hunan Province (No.HNJG-20231283 to QZ), the Joint Fund Project of the Hunan Provincial Natural Science Foundation (No. 2024JJ8242 to LP), the Department of Education of Hunan Province (No. 202401001522 to JL), the National Natural Science Foundation of China (No. 82201692 to YL), and the Health Research Project of Hunan Provincial Health Commission (W20243225 to YL).
Institutional Review Board Statement
The Human Connectome Project (HCP) protocol was approved by the Institutional Review Board at Washington University. The ethical committee of the Second Xiangya Hospital, Central South University (Changsha, China) also granted approval for this analysis (2024013).
Informed Consent Statement
Informed consent was obtained from all participants under the protocol approved by the Institutional Review Board at Washington University.
Data Availability Statement
Data used in this study is publicly available on the Human Connectome Project (HCP) website (https://www.humanconnectome.org/study/hcp-youngadult).
Acknowledgments
We thank all participants who provided functional magnetic resonance imaging scans in the Human Connectome Project (HCP).
Conflicts of Interest
The authors declare no conflicts of interest.
References
- Smith, S.M.; Vidaurre, D.; Beckmann, C.F.; Glasser, M.F.; Jenkinson, M.; Miller, K.L.; Nichols, T.E.; Robinson, E.C.; Salimi-Khorshidi, G.; Woolrich, M.W.; et al. Functional Connectomics from Resting-State FMRI. Trends Cogn Sci 2013, 17, 666–682. [Google Scholar] [CrossRef]
- Yen, C.; Lin, C.-L.; Chiang, M.-C. Exploring the Frontiers of Neuroimaging: A Review of Recent Advances in Understanding Brain Functioning and Disorders. Life 2023, 13, 1472. [Google Scholar] [CrossRef]
- Zhou, Y.; Long, Y. Sex Differences in Human Brain Networks in Normal and Psychiatric Populations from the Perspective of Small-World Properties. Front Psychiatry 2024, 15. [Google Scholar] [CrossRef] [PubMed]
- Huang, X.; Wu, Z.; Liu, Z.; Liu, D.; Huang, D.; Long, Y. Acute Effect of Betel Quid Chewing on Brain Network Dynamics: A Resting-State Functional Magnetic Resonance Imaging Study. Front Psychiatry 2021, 12, 701420. [Google Scholar] [CrossRef] [PubMed]
- Cao, H.; Zhou, H.; Cannon, T.D. Functional Connectome-Wide Associations of Schizophrenia Polygenic Risk. Mol Psychiatry 2021, 26, 2553–2561. [Google Scholar] [CrossRef]
- Zhang, H.; Peng, D.; Tang, S.; Bi, A.; Long, Y. Aberrant Flexibility of Dynamic Brain Network in Patients with Autism Spectrum Disorder. Bioengineering 2024, 11, 882. [Google Scholar] [CrossRef]
- Long, Y.; Li, X.; Cao, H.; Zhang, M.; Lu, B.; Huang, Y.; Liu, M.; Xu, M.; Liu, Z.; Yan, C.; et al. Common and Distinct Functional Brain Network Abnormalities in Adolescent, Early-Middle Adult, and Late Adult Major Depressive Disorders. Psychol Med 2024, 54, 582–591. [Google Scholar] [CrossRef] [PubMed]
- Tan, W.; Ouyang, X.; Huang, D.; Wu, Z.; Liu, Z.; He, Z.; Long, Y. Disrupted Intrinsic Functional Brain Network in Patients with Late-Life Depression: Evidence from a Multi-Site Dataset. J Affect Disord 2023, 323, 631–639. [Google Scholar] [CrossRef]
- Hutchison, R.M.; Womelsdorf, T.; Allen, E.A.; Bandettini, P.A.; Calhoun, V.D.; Corbetta, M.; Della Penna, S.; Duyn, J.H.; Glover, G.H.; Gonzalez-Castillo, J.; et al. Dynamic Functional Connectivity: Promise, Issues, and Interpretations. Neuroimage 2013. [Google Scholar] [CrossRef]
- Geng, H.; Xu, P.; Aleman, A.; Qin, S.; Luo, Y.-J. Dynamic Organization of Large-Scale Functional Brain Networks Supports Interactions Between Emotion and Executive Control. Neurosci Bull 2024, 40, 981–991. [Google Scholar] [CrossRef]
- Sporns, O. The Complex Brain: Connectivity, Dynamics, Information. Trends Cogn Sci 2022, 26, 1066–1067. [Google Scholar] [CrossRef]
- Long, Y.; Liu, X.; Liu, Z. Temporal Stability of the Dynamic Resting-State Functional Brain Network: Current Measures, Clinical Research Progress, and Future Perspectives. Brain Sci 2023, 13, 429. [Google Scholar] [CrossRef]
- Barber, A.D.; Lindquist, M.A.; DeRosse, P.; Karlsgodt, K.H. Dynamic Functional Connectivity States Reflecting Psychotic-like Experiences. Biol Psychiatry Cogn Neurosci Neuroimaging 2018, 3, 443–453. [Google Scholar] [CrossRef]
- Tian, S.; Chattun, M.R.; Zhang, S.; Bi, K.; Tang, H.; Yan, R.; Wang, Q.; Yao, Z.; Lu, Q. Dynamic Community Structure in Major Depressive Disorder: A Resting-State MEG Study. Prog Neuropsychopharmacol Biol Psychiatry 2019, 92, 39–47. [Google Scholar] [CrossRef]
- Long, Y.; Chen, C.; Deng, M.; Huang, X.; Tan, W.; Zhang, L.; Fan, Z.; Liu, Z. Psychological Resilience Negatively Correlates with Resting-State Brain Network Flexibility in Young Healthy Adults: A Dynamic Functional Magnetic Resonance Imaging Study. Ann Transl Med 2019, 7, 809–809. [Google Scholar] [CrossRef]
- Huang, D.; Xiang, Z.; Liu, K.; Lv, L.; Tang, S.; Zou, Q.; Liu, Z.; Li, W.; Yang, Y.; Long, Y. Disrupted Static and Dynamic Small-World Brain Network Topologies in Patients with Schizophrenia. Schizophr Res 2025, 284, 101–110. [Google Scholar] [CrossRef]
- Zhang, J.; Cheng, W.; Liu, Z.; Zhang, K.; Lei, X.; Yao, Y.; Becker, B.; Liu, Y.; Kendrick, K.M.; Lu, G.; et al. Neural, Electrophysiological and Anatomical Basis of Brain-Network Variability and Its Characteristic Changes in Mental Disorders. Brain 2016, 139, 2307–2321. [Google Scholar] [CrossRef] [PubMed]
- Long, Y.; Liu, Z.; Chan, C.K.Y.; Wu, G.; Xue, Z.; Pan, Y.; Chen, X.; Huang, X.; Li, D.; Pu, W. Altered Temporal Variability of Local and Large-Scale Resting-State Brain Functional Connectivity Patterns in Schizophrenia and Bipolar Disorder. Front Psychiatry 2020, 11, 422. [Google Scholar] [CrossRef] [PubMed]
- Dong, D.; Duan, M.; Wang, Y.; Zhang, X.; Jia, X.; Li, Y.; Xin, F.; Yao, D.; Luo, C. Reconfiguration of Dynamic Functional Connectivity in Sensory and Perceptual System in Schizophrenia. Cerebral Cortex 2019, 29, 3577–3589. [Google Scholar] [CrossRef]
- Jiang, L.; Wang, J.; Dai, J.; Li, F.; Chen, B.; He, R.; Liao, Y.; Yao, D.; Dong, W.; Xu, P. Altered Temporal Variability in Brain Functional Connectivity Identified by Fuzzy Entropy Underlines Schizophrenia Deficits. J Psychiatr Res 2022, 148, 315–324. [Google Scholar] [CrossRef] [PubMed]
- Long, Y.; Cao, H.; Yan, C.; Chen, X.; Li, L.; Castellanos, F.X.; Bai, T.; Bo, Q.; Chen, G.; Chen, N.; et al. Altered Resting-State Dynamic Functional Brain Networks in Major Depressive Disorder: Findings from the REST-Meta-MDD Consortium. Neuroimage Clin 2020, 26, 102163. [Google Scholar] [CrossRef]
- Liu, X.; Ding, K.; Li, F.; Zhang, X.; Hou, Z.; Yin, Y.; Kong, Y.; Yuan, Y. Default Mode Network Static-Dynamic Functional Signatures in First-Episode Drug-Naive Major Depressive Disorder. Compr Psychoneuroendocrinol 2025, 23, 100306. [Google Scholar] [CrossRef]
- Zhu, H.; Huang, J.; Deng, L.; He, N.; Cheng, L.; Shu, P.; Yan, F.; Tong, S.; Sun, J.; Ling, H. Abnormal Dynamic Functional Connectivity Associated With Subcortical Networks in Parkinson’s Disease: A Temporal Variability Perspective. Front Neurosci 2019, 13. [Google Scholar] [CrossRef]
- Abdallah, M.; Zahr, N.M.; Saranathan, M.; Honnorat, N.; Farrugia, N.; Pfefferbaum, A.; Sullivan, E. V.; Chanraud, S. Altered Cerebro-Cerebellar Dynamic Functional Connectivity in Alcohol Use Disorder: A Resting-State FMRI Study. The Cerebellum 2021, 20, 823–835. [Google Scholar] [CrossRef]
- Fu, J.; Chen, S.; Wang, M.; Dong, D.; Dong, G.-H. Temporal Variability-Based Alternations in Dynamic Functional Networks in Internet Gaming Disorder. J Psychiatr Res 2025, 187, 34–43. [Google Scholar] [CrossRef]
- Tang, S.; Wu, Z.; Cao, H.; Chen, X.; Wu, G.; Tan, W.; Liu, D.; Yang, J.; Long, Y.; Liu, Z. Age-Related Decrease in Default-Mode Network Functional Connectivity Is Accelerated in Patients With Major Depressive Disorder. Front Aging Neurosci 2022, 13, 809853. [Google Scholar] [CrossRef]
- Sun, J.; Zhao, R.; He, Z.; Chang, M.; Wang, F.; Wei, W.; Zhang, X.; Zhu, Y.; Xi, Y.; Yang, X.; et al. Abnormal Dynamic Functional Connectivity after Sleep Deprivation from Temporal Variability Perspective. Hum Brain Mapp 2022, 43, 3824–3839. [Google Scholar] [CrossRef]
- Sun, J.; Liu, Z.; Rolls, E.T.; Chen, Q.; Yao, Y.; Yang, W.; Wei, D.; Zhang, Q.; Zhang, J.; Feng, J.; et al. Verbal Creativity Correlates with the Temporal Variability of Brain Networks during the Resting State. Cerebral Cortex 2019, 29, 1047–1058. [Google Scholar] [CrossRef] [PubMed]
- Feng, Y.; Kang, X.; Wang, H.; Cong, J.; Zhuang, W.; Xue, K.; Li, F.; Yao, D.; Xu, P.; Zhang, T. The Relationships between Dynamic Resting-State Networks and Social Behavior in Autism Spectrum Disorder Revealed by Fuzzy Entropy–Based Temporal Variability Analysis of Large-Scale Network. Cerebral Cortex 2023, 33, 764–776. [Google Scholar] [CrossRef] [PubMed]
- Liu, D.; Liu, X.; Long, Y.; Xiang, Z.; Wu, Z.; Liu, Z.; Bian, D.; Tang, S. Problematic Smartphone Use Is Associated with Differences in Static and Dynamic Brain Functional Connectivity in Young Adults. Front Neurosci 2022, 16, 1010488. [Google Scholar] [CrossRef] [PubMed]
- Geng, L.; Feng, Q.; Wang, X.; Sun, J.; Tang, S.; Jia, H.; Li, Y.; Qiu, J. Depression Links to Unstable Resting-State Brain Dynamics: Insights from Hidden Markov Models and Functional Network Variability. Psychol Med 2025, 55, e200. [Google Scholar] [CrossRef] [PubMed]
- Long, Y.; Ouyang, X.; Yan, C.; Wu, Z.; Huang, X.; Pu, W.; Cao, H.; Liu, Z.; Palaniyappan, L. Evaluating Test–Retest Reliability and Sex-/Age-related Effects on Temporal Clustering Coefficient of Dynamic Functional Brain Networks. Hum Brain Mapp 2023, 44, 2191–2208. [Google Scholar] [CrossRef] [PubMed]
- Braun, U.; Plichta, M.M.; Esslinger, C.; Sauer, C.; Haddad, L.; Grimm, O.; Mier, D.; Mohnke, S.; Heinz, A.; Erk, S.; et al. Test-Retest Reliability of Resting-State Connectivity Network Characteristics Using FMRI and Graph Theoretical Measures. Neuroimage 2012, 59, 1404–1412. [Google Scholar] [CrossRef]
- Cao, H.; Plichta, M.M.; Schäfer, A.; Haddad, L.; Grimm, O.; Schneider, M.; Esslinger, C.; Kirsch, P.; Meyer-Lindenberg, A.; Tost, H. Test–Retest Reliability of FMRI-Based Graph Theoretical Properties during Working Memory, Emotion Processing, and Resting State. Neuroimage 2014, 84, 888–900. [Google Scholar] [CrossRef]
- Noble, S.; Scheinost, D.; Constable, R.T. A Guide to the Measurement and Interpretation of FMRI Test-Retest Reliability. Curr Opin Behav Sci 2021, 40, 27–32. [Google Scholar] [CrossRef]
- Wang, J.; Ren, Y.; Hu, X.; Nguyen, V.T.; Guo, L.; Han, J.; Guo, C.C. Test–Retest Reliability of Functional Connectivity Networks during Naturalistic FMRI Paradigms. Hum Brain Mapp 2017, 38, 2226–2241. [Google Scholar] [CrossRef]
- Choe, A.S.; Nebel, M.B.; Barber, A.D.; Cohen, J.R.; Xu, Y.; Pekar, J.J.; Caffo, B.; Lindquist, M.A. Comparing Test-Retest Reliability of Dynamic Functional Connectivity Methods. Neuroimage 2017, 158, 155–175. [Google Scholar] [CrossRef] [PubMed]
- Zhang, C.; Baum, S.A.; Adduru, V.R.; Biswal, B.B.; Michael, A.M. Test-Retest Reliability of Dynamic Functional Connectivity in Resting State FMRI. Neuroimage 2018, 183, 907–918. [Google Scholar] [CrossRef]
- Fang, X.; Marxen, M. Test-Retest Reliability of Dynamic Functional Connectivity Parameters for a Two-State Model. Network Neuroscience 2025, 9, 371–391. [Google Scholar] [CrossRef]
- Termenon, M.; Jaillard, A.; Delon-Martin, C.; Achard, S. Reliability of Graph Analysis of Resting State FMRI Using Test-Retest Dataset from the Human Connectome Project. Neuroimage 2016, 142, 172–187. [Google Scholar] [CrossRef]
- Vedaei, F.; Alizadeh, M.; Romo, V.; Mohamed, F.B.; Wu, C. The Effect of General Anesthesia on the Test–Retest Reliability of Resting-State FMRI Metrics and Optimization of Scan Length. Front Neurosci 2022, 16. [Google Scholar] [CrossRef]
- Van Essen, D.C.; Smith, S.M.; Barch, D.M.; Behrens, T.E.J.; Yacoub, E.; Ugurbil, K. The WU-Minn Human Connectome Project: An Overview. Neuroimage 2013, 80, 62–79. [Google Scholar] [CrossRef] [PubMed]
- Glasser, M.F.; Sotiropoulos, S.N.; Wilson, J.A.; Coalson, T.S.; Fischl, B.; Andersson, J.L.; Xu, J.; Jbabdi, S.; Webster, M.; Polimeni, J.R.; et al. The Minimal Preprocessing Pipelines for the Human Connectome Project. Neuroimage 2013, 80, 105–124. [Google Scholar] [CrossRef] [PubMed]
- Glasser, M.F.; Coalson, T.S.; Bijsterbosch, J.D.; Harrison, S.J.; Harms, M.P.; Anticevic, A.; Van Essen, D.C.; Smith, S.M. Using Temporal ICA to Selectively Remove Global Noise While Preserving Global Signal in Functional MRI Data. Neuroimage 2018, 181, 692–717. [Google Scholar] [CrossRef] [PubMed]
- Glasser, M.F.; Coalson, T.S.; Bijsterbosch, J.D.; Harrison, S.J.; Harms, M.P.; Anticevic, A.; Van Essen, D.C.; Smith, S.M. Classification of Temporal ICA Components for Separating Global Noise from FMRI Data: Reply to Power. Neuroimage 2019, 197, 435–438. [Google Scholar] [CrossRef]
- Marcus, D.S.; Harms, M.P.; Snyder, A.Z.; Jenkinson, M.; Wilson, J.A.; Glasser, M.F.; Barch, D.M.; Archie, K.A.; Burgess, G.C.; Ramaratnam, M.; et al. Human Connectome Project Informatics: Quality Control, Database Services, and Data Visualization. Neuroimage 2013, 80, 202–219. [Google Scholar] [CrossRef]
- Ji, J.L.; Spronk, M.; Kulkarni, K.; Repovš, G.; Anticevic, A.; Cole, M.W. Mapping the Human Brain’s Cortical-Subcortical Functional Network Organization. Neuroimage 2019, 185, 35–57. [Google Scholar] [CrossRef]
- Sizemore, A.E.; Bassett, D.S. Dynamic Graph Metrics: Tutorial, Toolbox, and Tale. Neuroimage 2018, 180, 417–427. [Google Scholar] [CrossRef]
- Tzourio-Mazoyer, N.; Landeau, B.; Papathanassiou, D.; Crivello, F.; Etard, O.; Delcroix, N.; Mazoyer, B.; Joliot, M. Automated Anatomical Labeling of Activations in SPM Using a Macroscopic Anatomical Parcellation of the MNI MRI Single-Subject Brain. Neuroimage 2002, 15, 273–289. [Google Scholar] [CrossRef]
- Power, J.D.; Cohen, A.L.; Nelson, S.M.; Wig, G.S.; Barnes, K.A.; Church, J.A.; Vogel, A.C.; Laumann, T.O.; Miezin, F.M.; Schlaggar, B.L.; et al. Functional Network Organization of the Human Brain. Neuron 2011, 72, 665–678. [Google Scholar] [CrossRef]
- Ouyang, X.; Long, Y.; Wu, Z.; Liu, D.; Liu, Z.; Huang, X. Temporal Stability of Dynamic Default Mode Network Connectivity Negatively Correlates with Suicidality in Major Depressive Disorder. Brain Sci 2022, 12, 1263. [Google Scholar] [CrossRef]
- Gholam Tamimi, M.; Daliri, M.R. State-Base Dynamic Functional Connectivity Analysis of FMRI Data during Facial Emotional Processing. Brain Imaging Behav 2025. [Google Scholar] [CrossRef]
- Li, X.; Huang, Y.; Liu, M.; Zhang, M.; Liu, Y.; Teng, T.; Liu, X.; Yu, Y.; Jiang, Y.; Ouyang, X.; et al. Childhood Trauma Is Linked to Abnormal Static-Dynamic Brain Topology in Adolescents with Major Depressive Disorder. International Journal of Clinical and Health Psychology 2023, 23, 100401. [Google Scholar] [CrossRef] [PubMed]
- Mohr, H.; Wolfensteller, U.; Betzel, R.F.; Mišić, B.; Sporns, O.; Richiardi, J.; Ruge, H. Integration and Segregation of Large-Scale Brain Networks during Short-Term Task Automatization. Nat Commun 2016, 7, 13217. [Google Scholar] [CrossRef]
- Cao, H.; Chung, Y.; McEwen, S.C.; Bearden, C.E.; Addington, J.; Goodyear, B.; Cadenhead, K.S.; Mirzakhanian, H.; Cornblatt, B.A.; Carrión, R.; et al. Progressive Reconfiguration of Resting-State Brain Networks as Psychosis Develops: Preliminary Results from the North American Prodrome Longitudinal Study (NAPLS) Consortium. Schizophr Res 2020, 226, 30–37. [Google Scholar] [CrossRef] [PubMed]
- Shunkai, L.; Su, T.; Zhong, S.; Chen, G.; Zhang, Y.; Zhao, H.; Chen, P.; Tang, G.; Qi, Z.; He, J.; et al. Abnormal Dynamic Functional Connectivity of Hippocampal Subregions Associated with Working Memory Impairment in Melancholic Depression. Psychol Med 2023, 53, 2923–2935. [Google Scholar] [CrossRef]
- Zhou, Y.; Zhu, Y.; Ye, H.; Jiang, W.; Zhang, Y.; Kong, Y.; Yuan, Y. Abnormal Changes of Dynamic Topological Characteristics in Patients with Major Depressive Disorder. J Affect Disord 2024, 345, 349–357. [Google Scholar] [CrossRef]
- Sun, Y.; Collinson, S.L.; Suckling, J.; Sim, K. Dynamic Reorganization of Functional Connectivity Reveals Abnormal Temporal Efficiency in Schizophrenia. Schizophr Bull 2019, 45, 659–669. [Google Scholar] [CrossRef]
- Zalesky, A.; Breakspear, M. Towards a Statistical Test for Functional Connectivity Dynamics. Neuroimage 2015, 114, 466–470. [Google Scholar] [CrossRef]
- Yang, Z.; Telesford, Q.K.; Franco, A.R.; Lim, R.; Gu, S.; Xu, T.; Ai, L.; Castellanos, F.X.; Yan, C.G.; Colcombe, S.; et al. Measurement Reliability for Individual Differences in Multilayer Network Dynamics: Cautions and Considerations. Neuroimage 2021, 225. [Google Scholar] [CrossRef]
- Jing, B.; Liu, B.; Li, H.; Lei, J.; Wang, Z.; Yang, Y.; Sun, P.Z.; Xue, B.; Liu, H.; Xu, Z.Q.D. Within-Subject Test-Retest Reliability of the Atlas-Based Cortical Volume Measurement in the Rat Brain: A Voxel-Based Morphometry Study. J Neurosci Methods 2018, 307, 46–52. [Google Scholar] [CrossRef]
- Du, H.X.; Liao, X.H.; Lin, Q.X.; Li, G.S.; Chi, Y.Z.; Liu, X.; Yang, H.Z.; Wang, Y.; Xia, M.R. Test-Retest Reliability of Graph Metrics in High-Resolution Functional Connectomics: A Resting-State Functional MRI Study. CNS Neurosci Ther 2015, 21, 802–816. [Google Scholar] [CrossRef]
- Compère, L.; Siegle, G.J.; Young, K. Importance of Test–Retest Reliability for Promoting FMRI Based Screening and Interventions in Major Depressive Disorder. Transl Psychiatry 2021, 11, 387. [Google Scholar] [CrossRef]
- Gesierich, B.; Tuladhar, A.M.; ter Telgte, A.; Wiegertjes, K.; Konieczny, M.J.; Finsterwalder, S.; Hübner, M.; Pirpamer, L.; Koini, M.; Abdulkadir, A.; et al. Alterations and Test–Retest Reliability of Functional Connectivity Network Measures in Cerebral Small Vessel Disease. Hum Brain Mapp 2020, 41, 2629–2641. [Google Scholar] [CrossRef]
- Wu, Z.; Liu, Z.; Jiang, Z.; Fu, X.; Deng, Q.; Palaniyappan, L.; Xiang, Z.; Huang, D.; Long, Y. Overprotection and Overcontrol in Childhood: An Evaluation on Reliability and Validity of 33-Item Expanded Childhood Trauma Questionnaire (CTQ-33), Chinese Version. Asian J Psychiatr 2022, 68, 102962. [Google Scholar] [CrossRef] [PubMed]
- Zhang, J.; Wu, Z.; Chen, M.; Gao, Y.; Liu, Z.; Long, Y.; Chen, X. Factor Analysis and Evaluation of One-Year Test-Retest Reliability of the 33-Item Childhood Trauma Questionnaire in Chinese Adolescents. Front Psychol 2024, 15. [Google Scholar] [CrossRef] [PubMed]
- Wu, Z.; Liu, D.; Zhang, J.; Zhang, W.; Tao, H.; Ouyang, X.; Wu, G.; Chen, M.; Yu, M.; Zhou, L.; et al. Sex Difference in the Prevalence of Psychotic-like Experiences in Adolescents: Results from a Pooled Study of 21,248 Chinese Participants. Psychiatry Res 2022, 317, 114894. [Google Scholar] [CrossRef] [PubMed]
- Wu, Z.; Wang, B.; Xiang, Z.; Zou, Z.; Liu, Z.; Long, Y.; Chen, X. Increasing Trends in Mental Health Problems Among Urban Chinese Adolescents: Results From Repeated Cross-Sectional Data in Changsha 2016–2020. Front Public Health 2022, 10, 1–7. [Google Scholar] [CrossRef]
- Skåtun, K.C.; Kaufmann, T.; Brandt, C.L.; Doan, N.T.; Alnæs, D.; Tønnesen, S.; Biele, G.; Vaskinn, A.; Melle, I.; Agartz, I.; et al. Thalamo-Cortical Functional Connectivity in Schizophrenia and Bipolar Disorder. Brain Imaging Behav 2018, 12, 640–652. [Google Scholar] [CrossRef]
- Sherman, S.M.; Guillery, R.W. The Role of the Thalamus in the Flow of Information to the Cortex. In Proceedings of the Philosophical Transactions of the Royal Society B: Biological Sciences; 2002; Vol. 357. 1695–1708.
- Kraft, D.; Fiebach, C.J. Probing the Association between Resting-State Brain Network Dynamics and Psychological Resilience. Network Neuroscience 2022, 6, 175–195. [Google Scholar] [CrossRef]
- Jiao, Z.; Gao, P.; Ji, Y.; Shi, H. Integration and Segregation of Dynamic Functional Connectivity States for Mild Cognitive Impairment Revealed by Graph Theory Indicators. Contrast Media Mol Imaging 2021, 2021, 1–13. [Google Scholar] [CrossRef] [PubMed]
- Ma, L.; Braun, S.E.; Steinberg, J.L.; Bjork, J.M.; Martin, C.E.; Keen II, L.D.; Moeller, F.G. Effect of Scanning Duration and Sample Size on Reliability in Resting State FMRI Dynamic Causal Modeling Analysis. Neuroimage 2024, 292, 120604. [Google Scholar] [CrossRef] [PubMed]
- Murphy, K.; Bodurka, J.; Bandettini, P.A. How Long to Scan? The Relationship between FMRI Temporal Signal to Noise Ratio and Necessary Scan Duration. Neuroimage 2007, 34, 565–574. [Google Scholar] [CrossRef]
- Ooi, L.Q.R.; Orban, C.; Zhang, S.; Nichols, T.E.; Tan, T.W.K.; Kong, R.; Marek, S.; Dosenbach, N.U.F.; Laumann, T.O.; Gordon, E.M.; et al. Longer Scans Boost Prediction and Cut Costs in Brain-Wide Association Studies. Nature 2025, 644, 731–740. [Google Scholar] [CrossRef]
- de Lacy, N.; McCauley, E.; Kutz, J.N.; Calhoun, V.D. Sex-Related Differences in Intrinsic Brain Dynamism and Their Neurocognitive Correlates. Neuroimage 2019, 202, 116116. [Google Scholar] [CrossRef] [PubMed]
Figure 1.
Schematic overview of the data acquisition and analysis procedures (see details in Section 2.1-2.4). (A) Data were drawn from the Human Connectome Project (HCP) dataset and were randomly split into two subsamples. (B) For each subject, four distinct resting-state functional magnetic resonance imaging (fMRI) scans were acquired. (C) Brain-network temporal variability (TV) was computed to quantify the fluctuations of functional connections over time. (D) The test-retest reliability of TV was assessed by evaluating its consistency across the four fMRI scans.
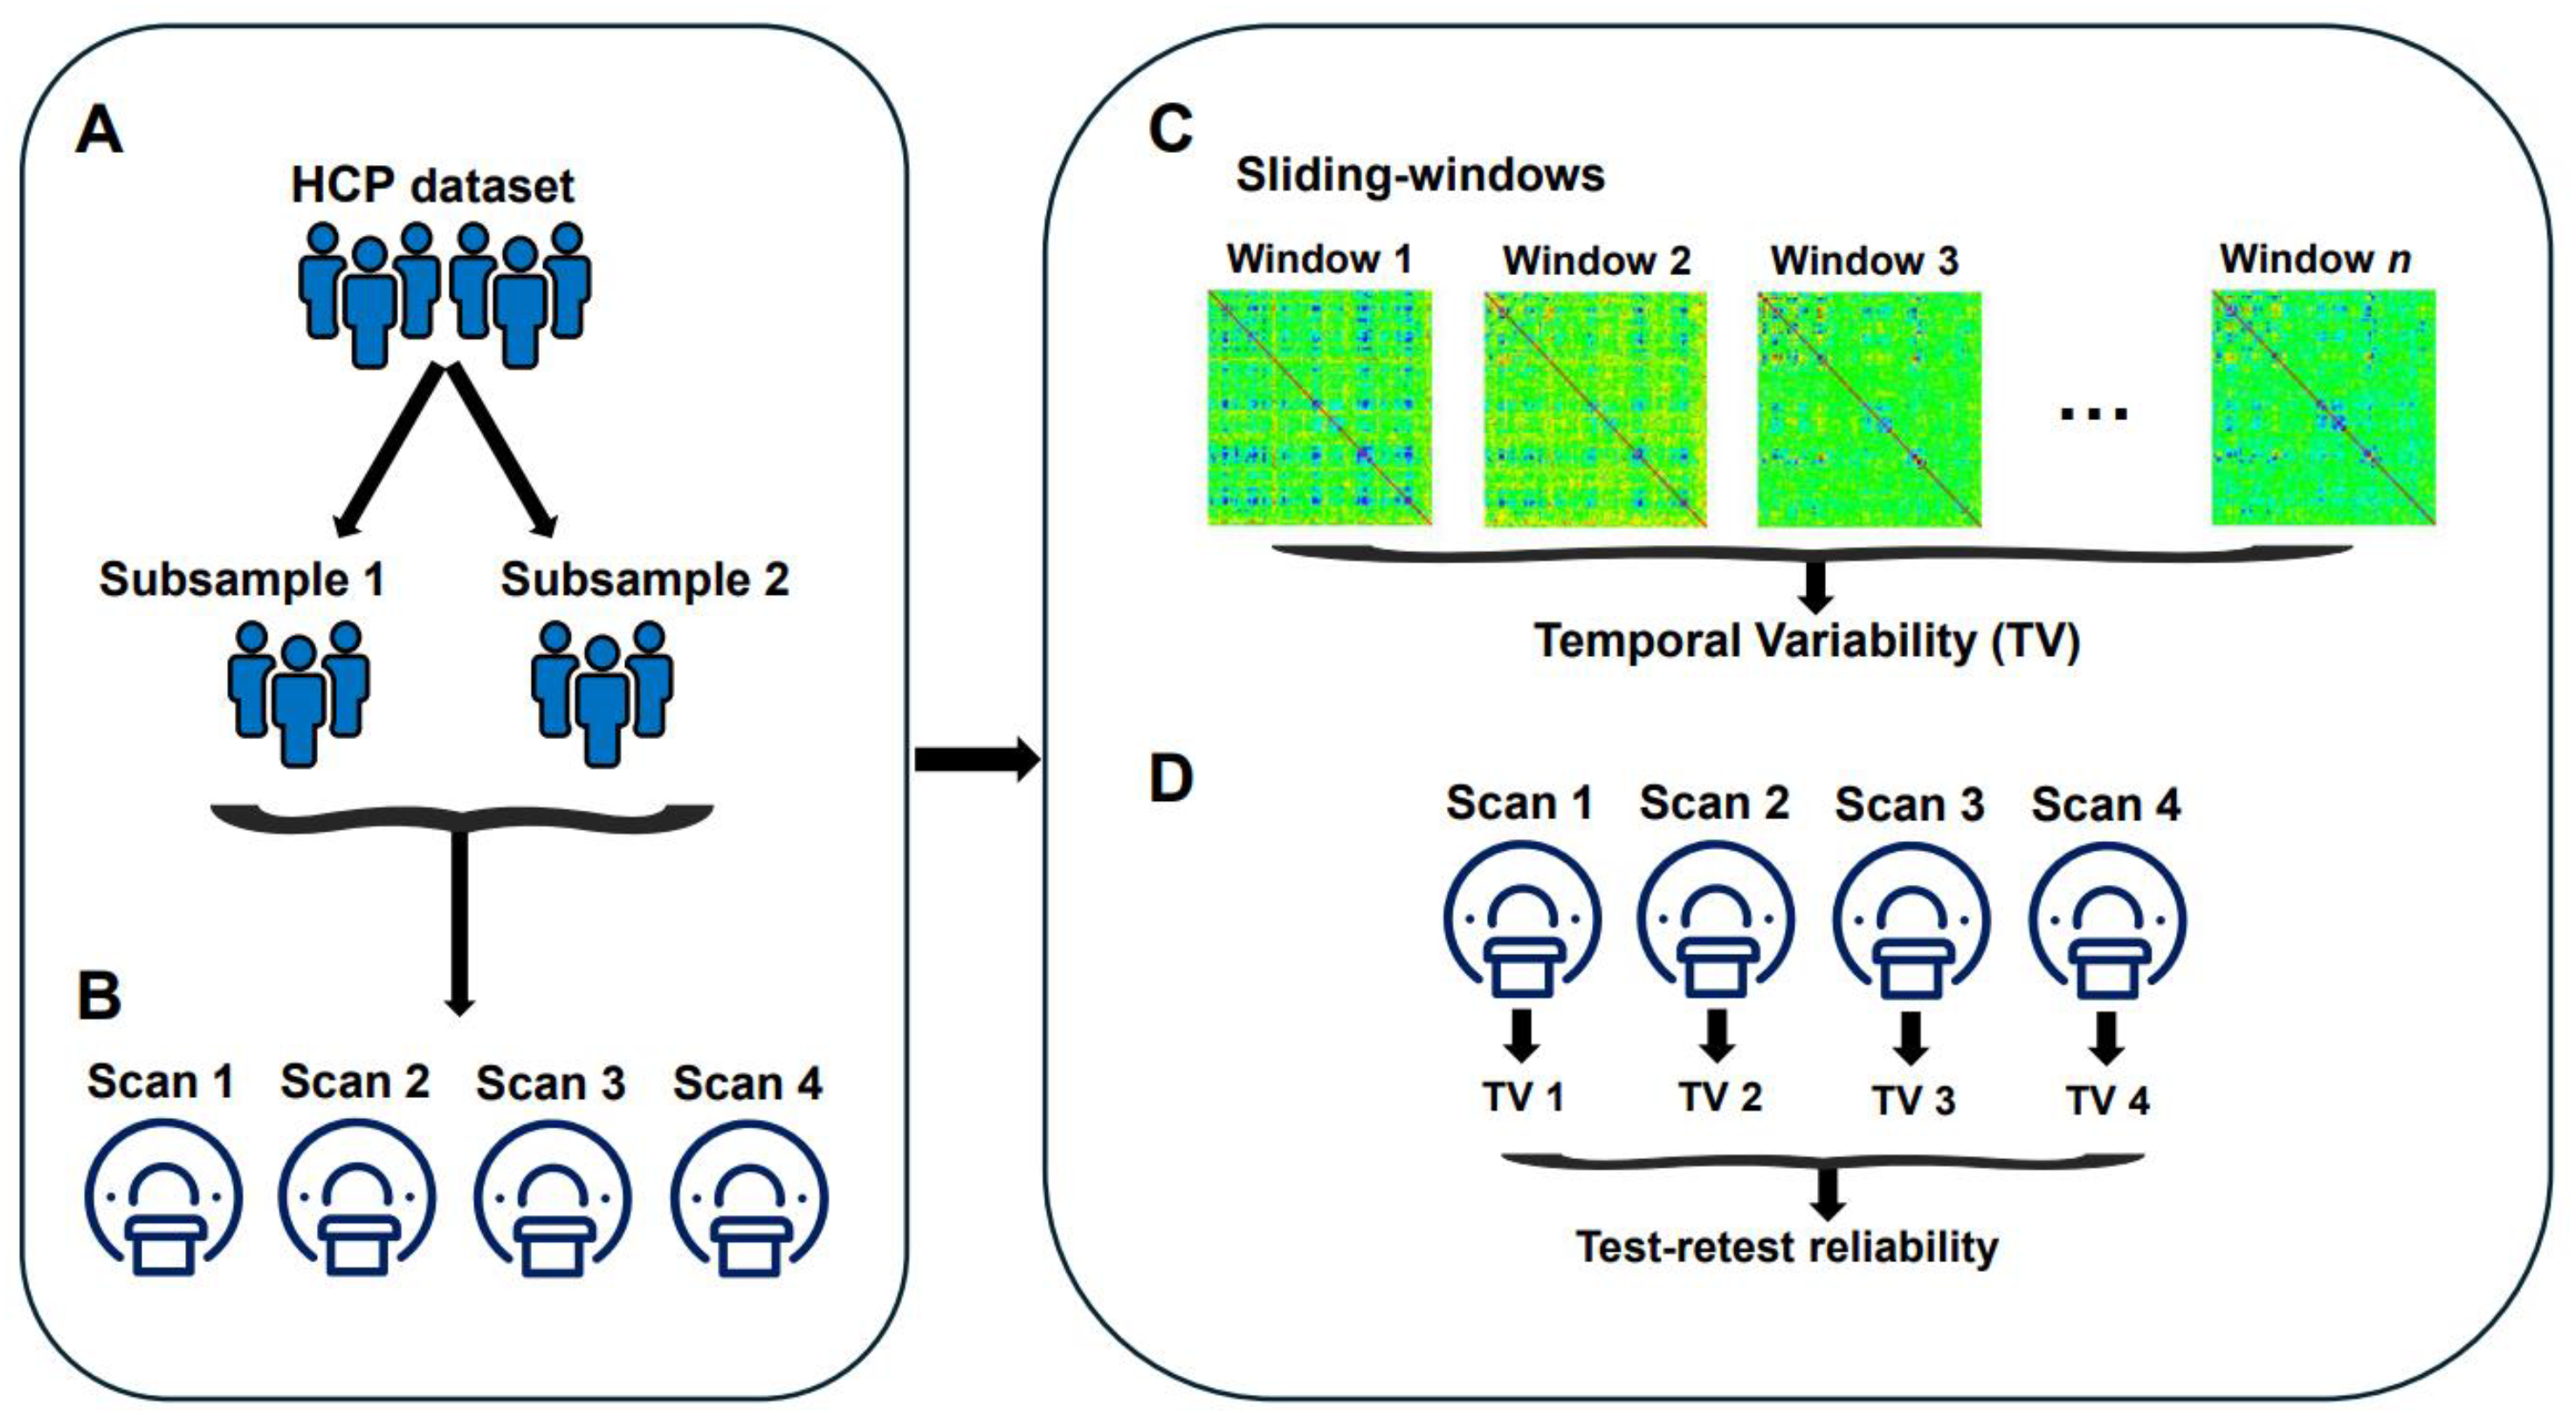
Figure 2.
Test-retest reliability of brain-network temporal variability (TV) from the primary analysis. (A) Results on the network-level (within- and between-network) temporal variability. (B) Results on the global (whole-brain) temporal variability. Abbreviations: AAL = automated anatomical labeling; ATT = attention network; AUD = auditory network; CON = cingulo-opercular network; DMN = default-mode network; FPN = fronto-parietal network; ICC = intraclass correlation coefficient; SAL = salience network; SM = sensorimotor network; UB = subcortical network; VIS = visual network.
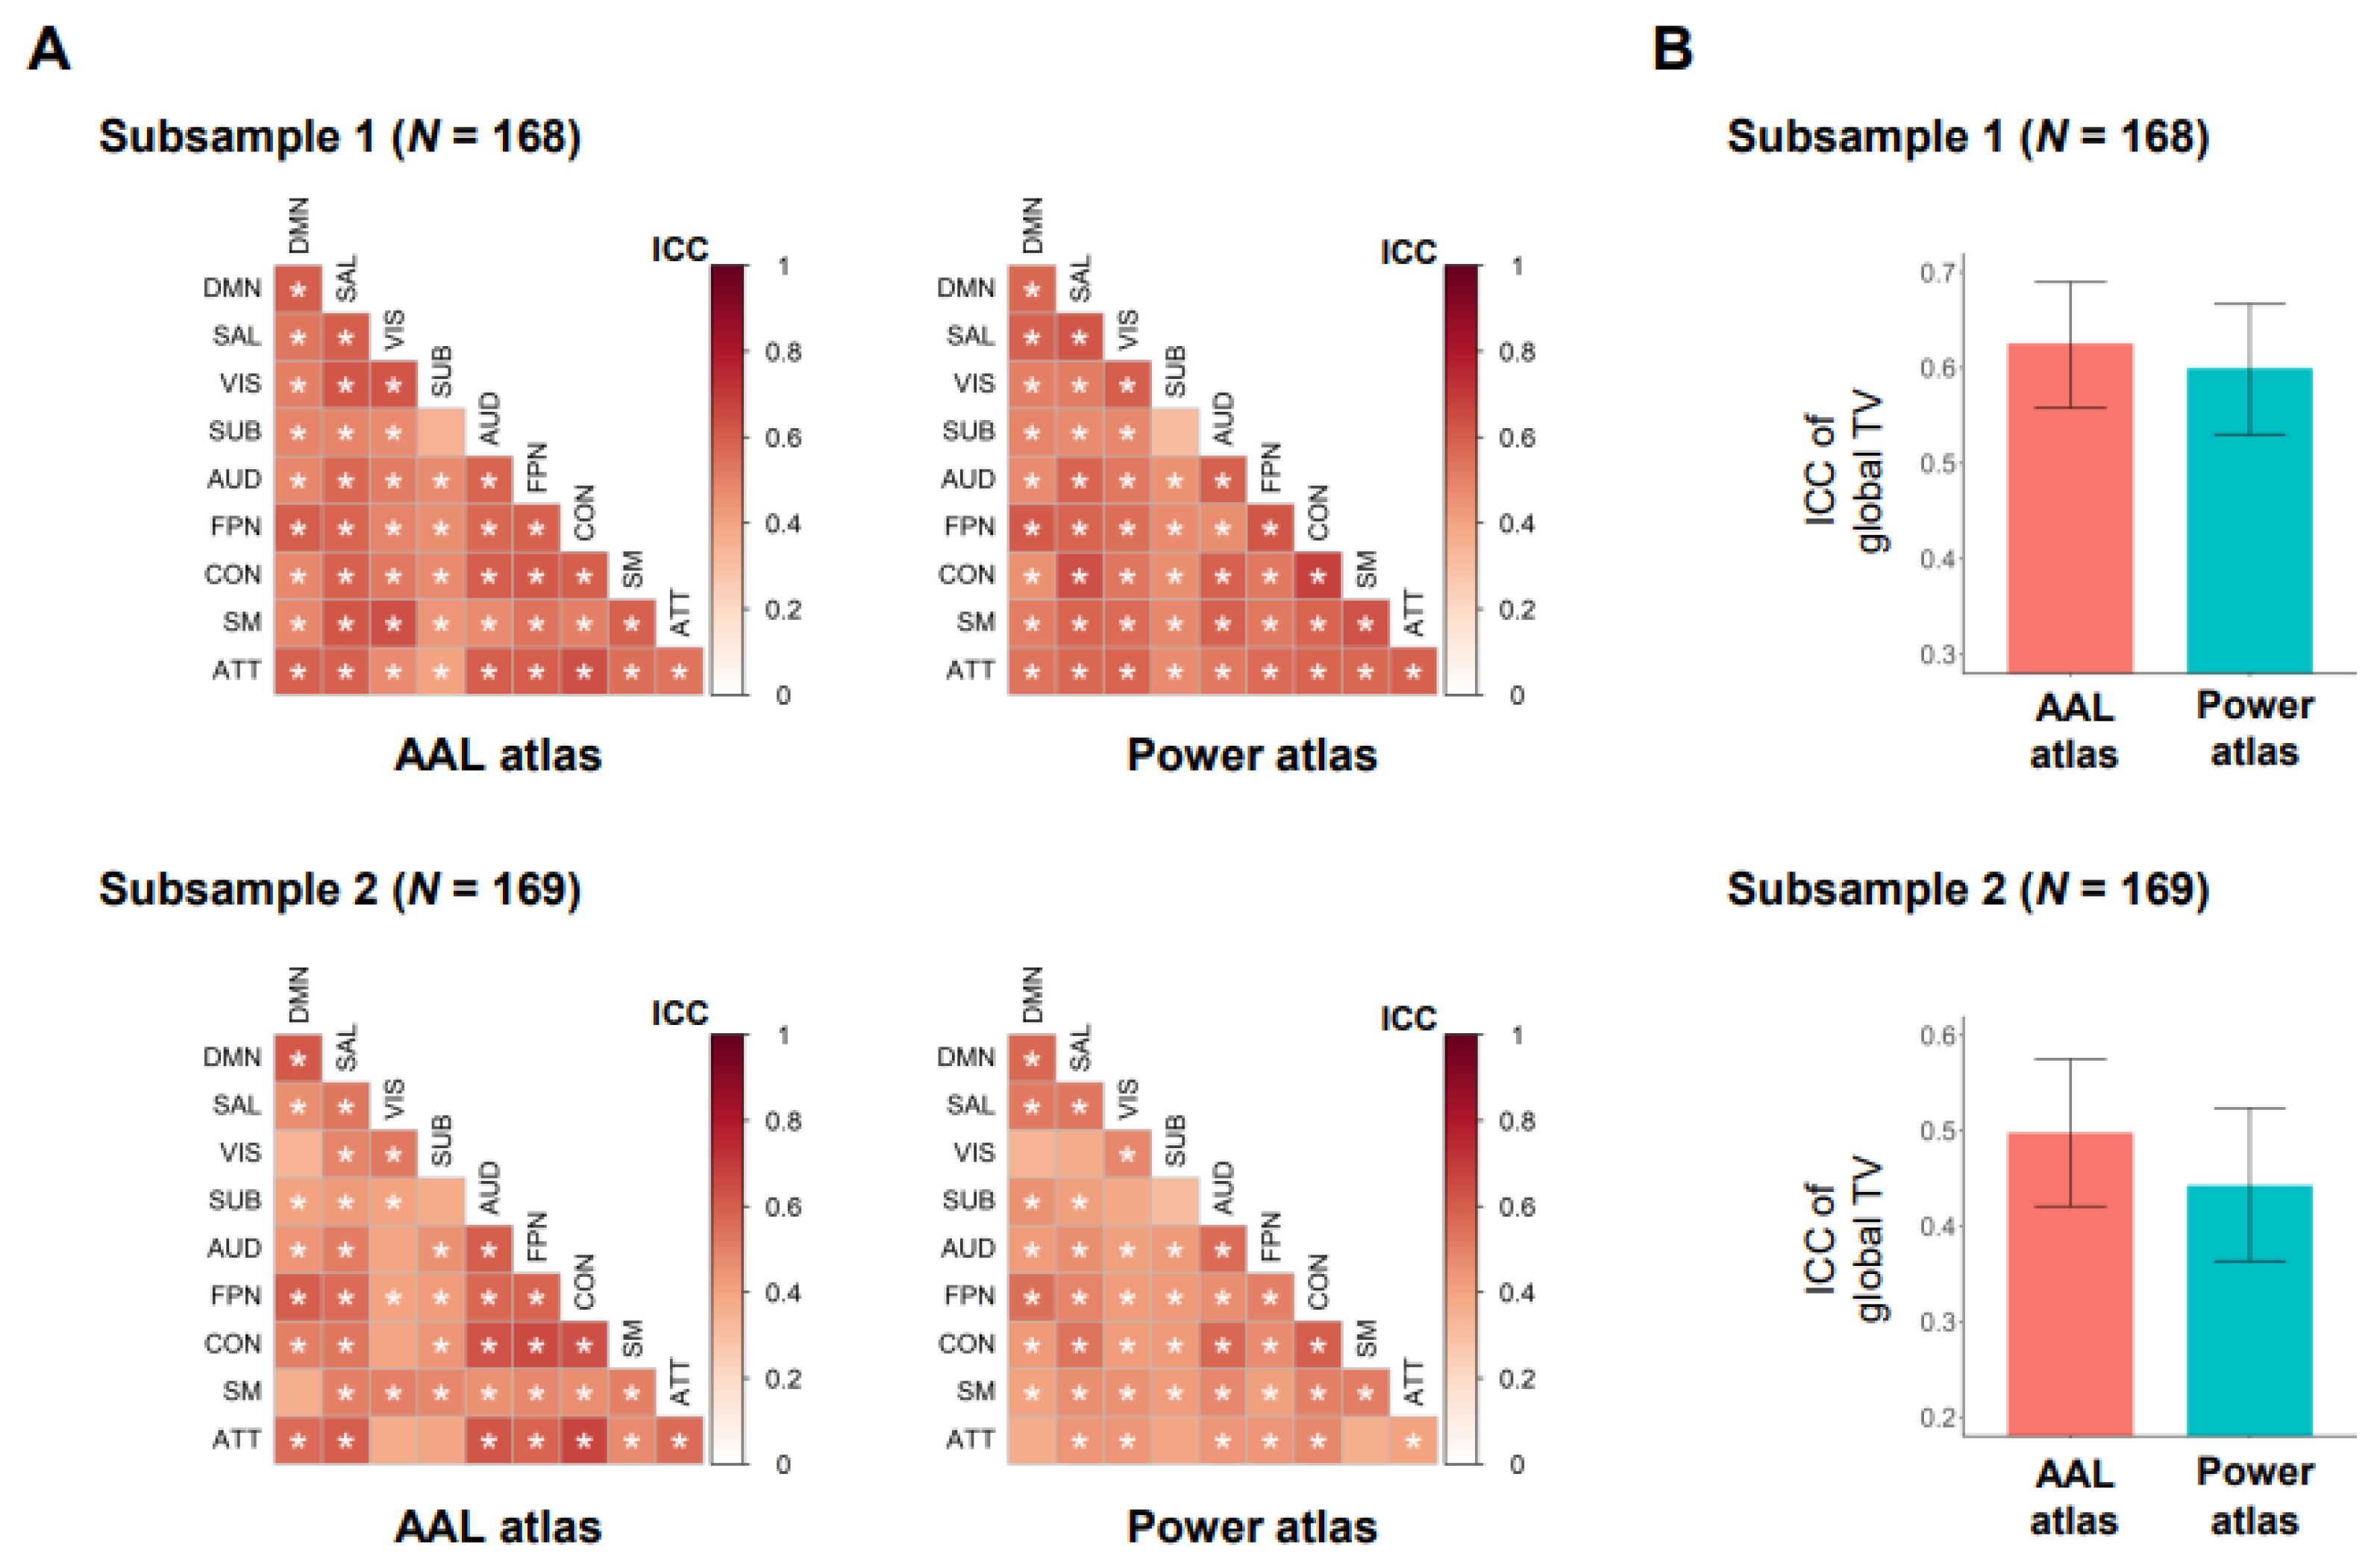
Figure 3.
Effect of step length on the test-retest reliability of brain-network temporal variability. (A) Results on the network-level (within- and between-network) temporal variability; different networks and network pairs are depicted with distinct colors. (B) Results on the global (whole-brain) temporal variability. Abbreviations: AAL = automated anatomical labeling; ICC = intraclass correlation coefficient.
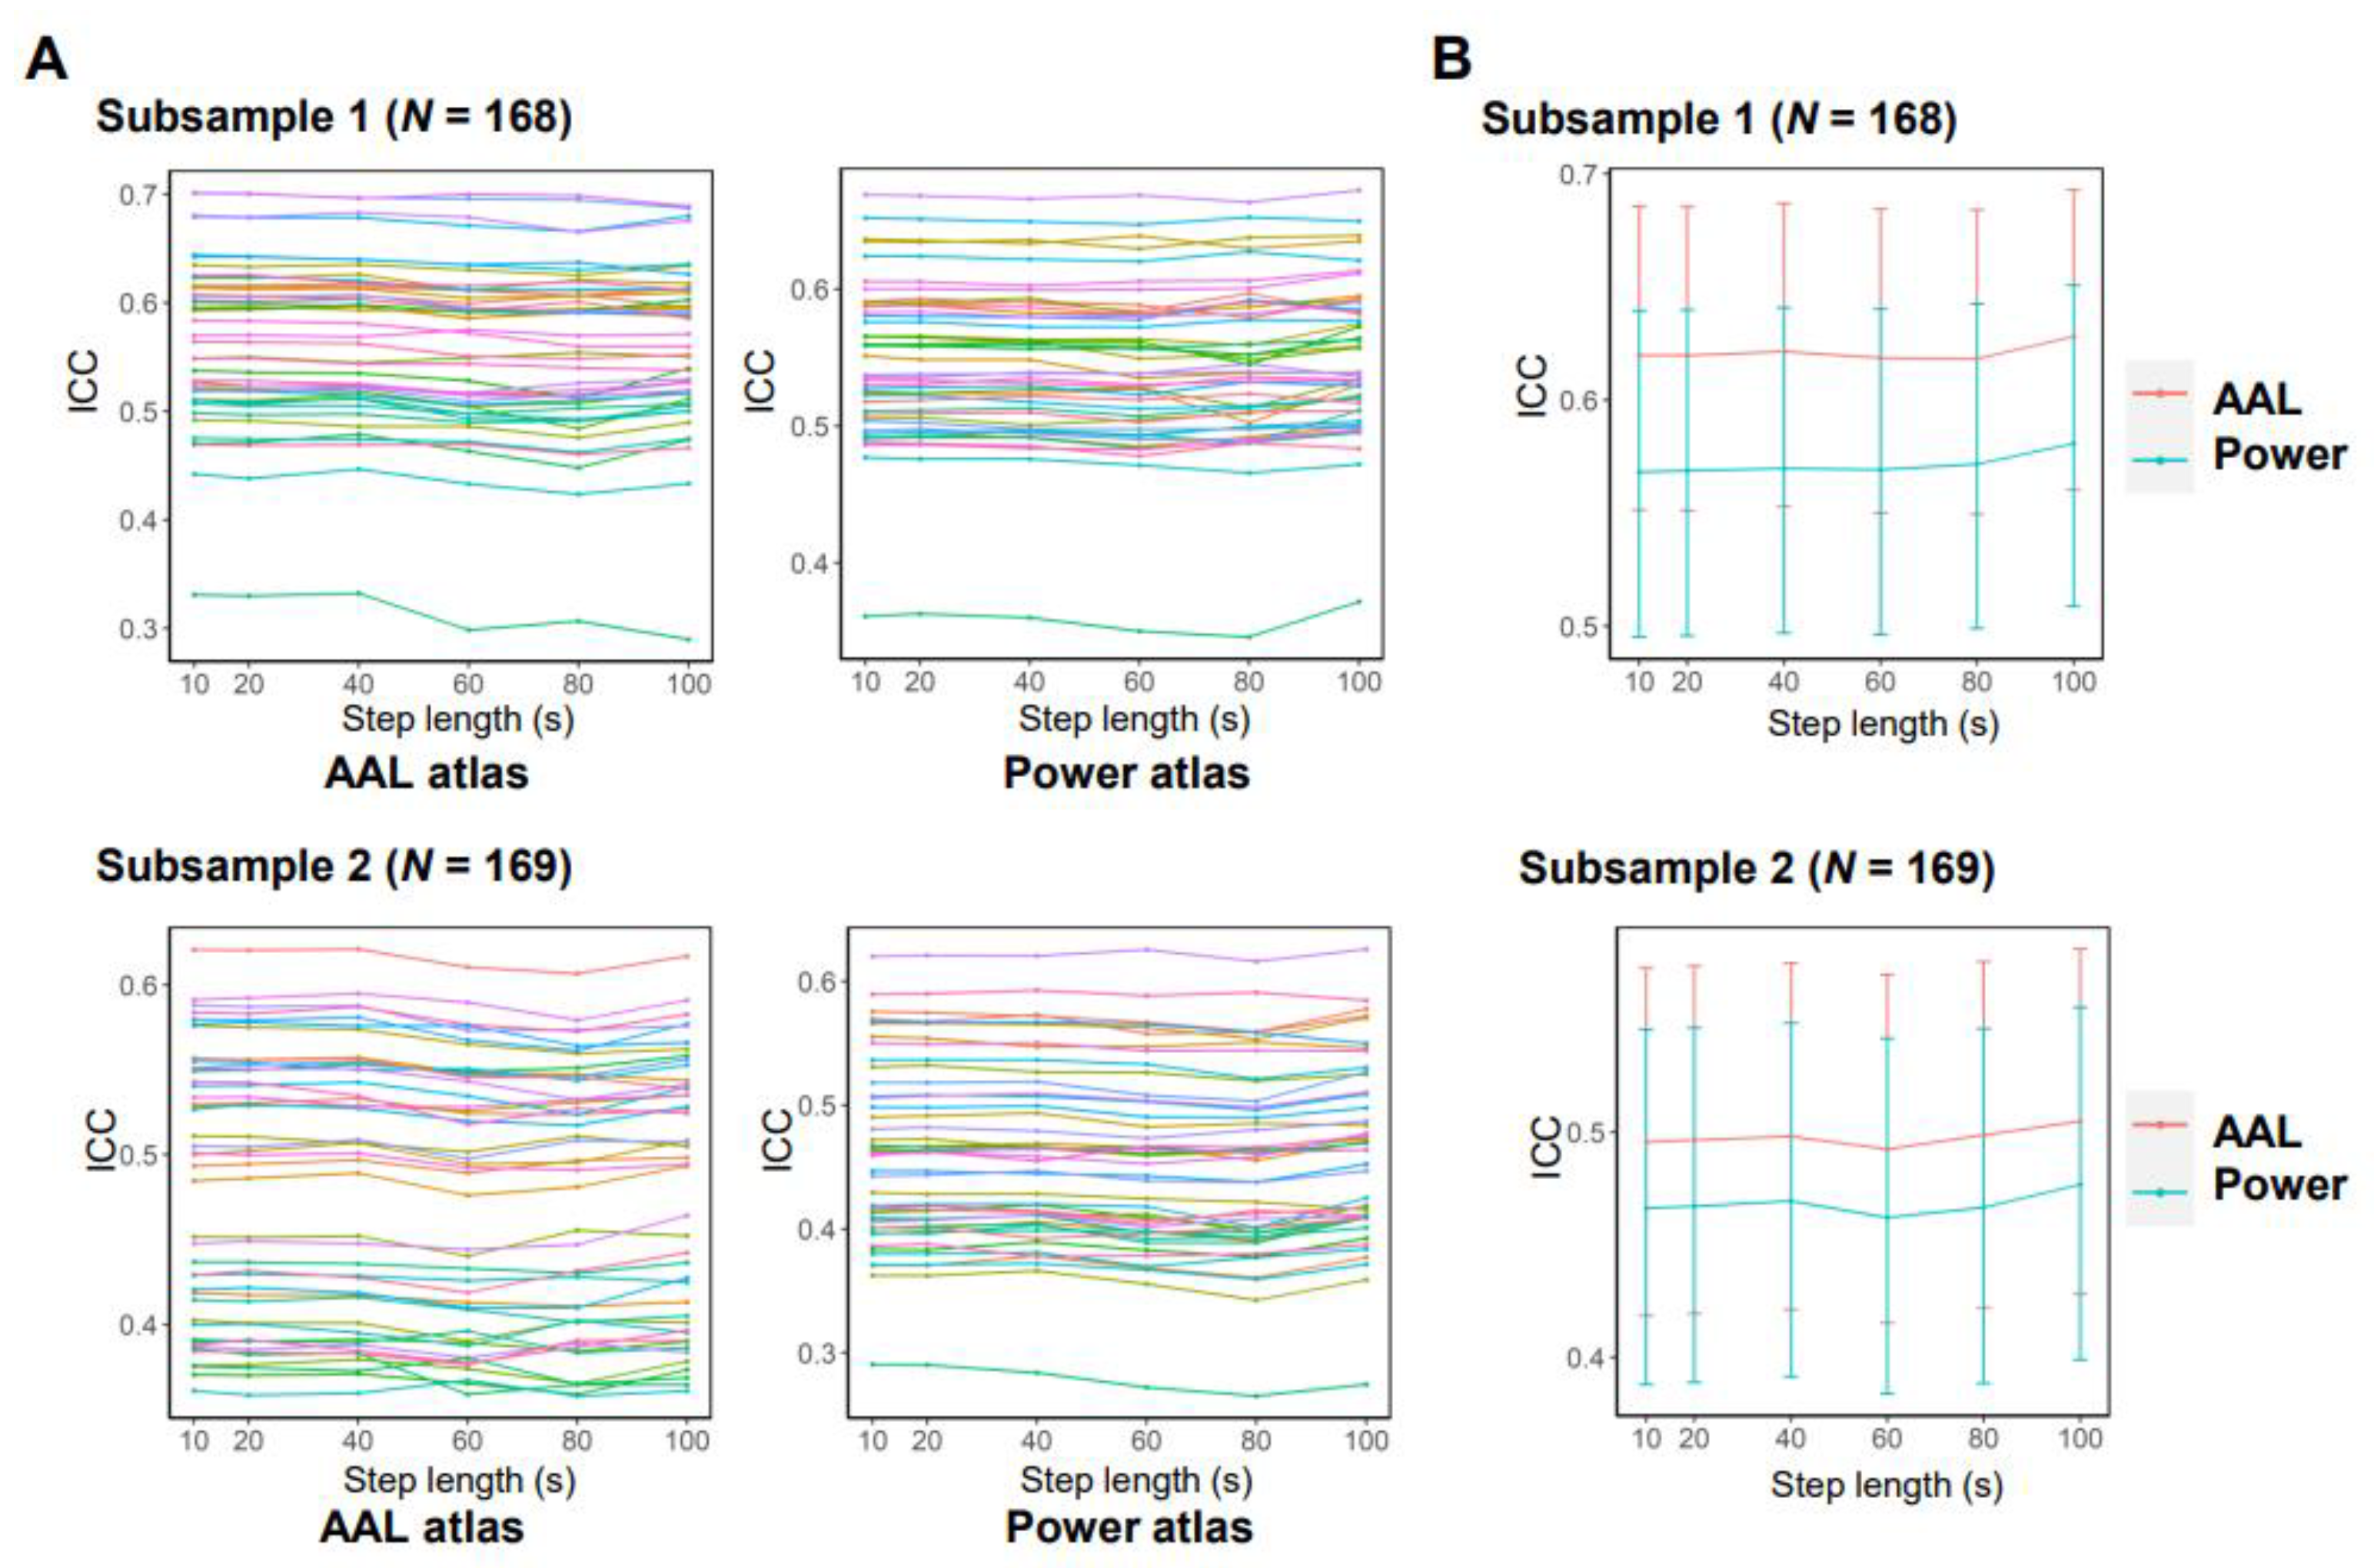
Figure 4.
Effect of window width on the test-retest reliability of brain-network temporal variability. (A) Results on the network-level (within- and between-network) temporal variability; different networks and network pairs are depicted with distinct colors. (B) Results on the global (whole-brain) temporal variability. Abbreviations: AAL = automated anatomical labeling; ICC = intraclass correlation coefficient.
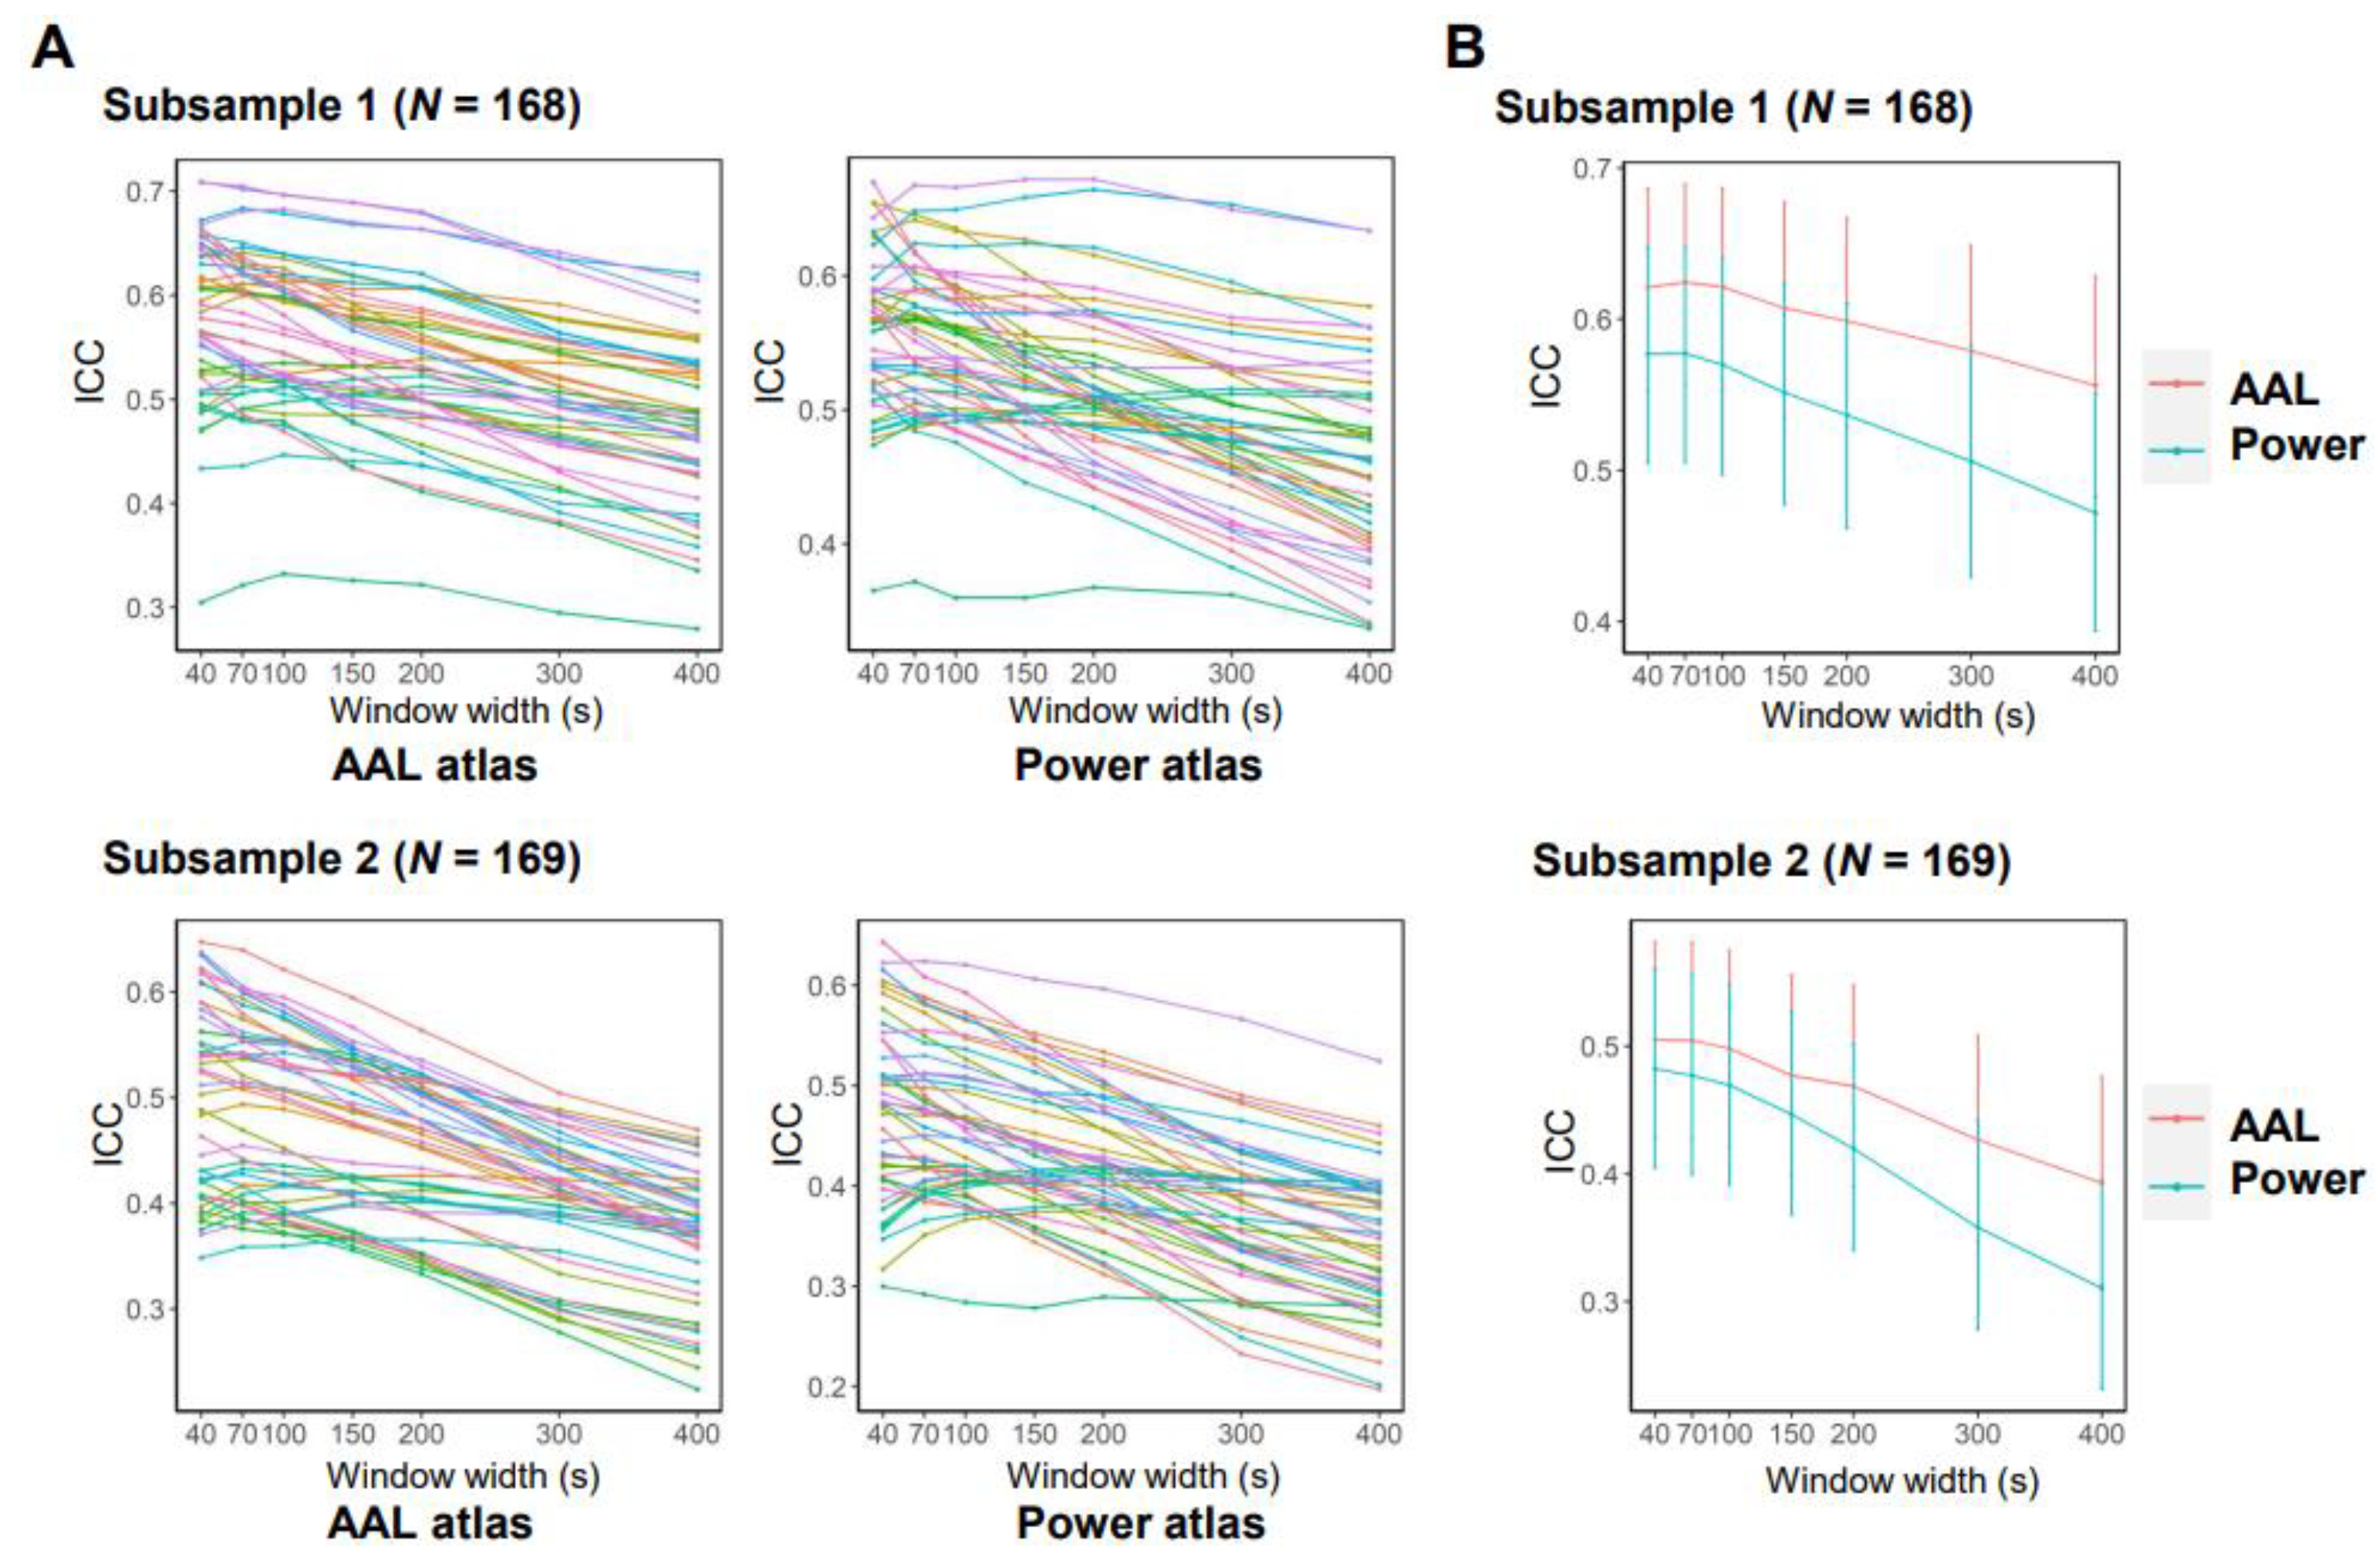
Figure 5.
Effect of scan duration on the test-retest reliability of brain-network temporal variability. (A) Results on the network-level (within- and between-network) temporal variability; different networks and network pairs are depicted with distinct colors. (B) Results on the global (whole-brain) temporal variability. Abbreviations: AAL = automated anatomical labeling; ICC = intraclass correlation coefficient.
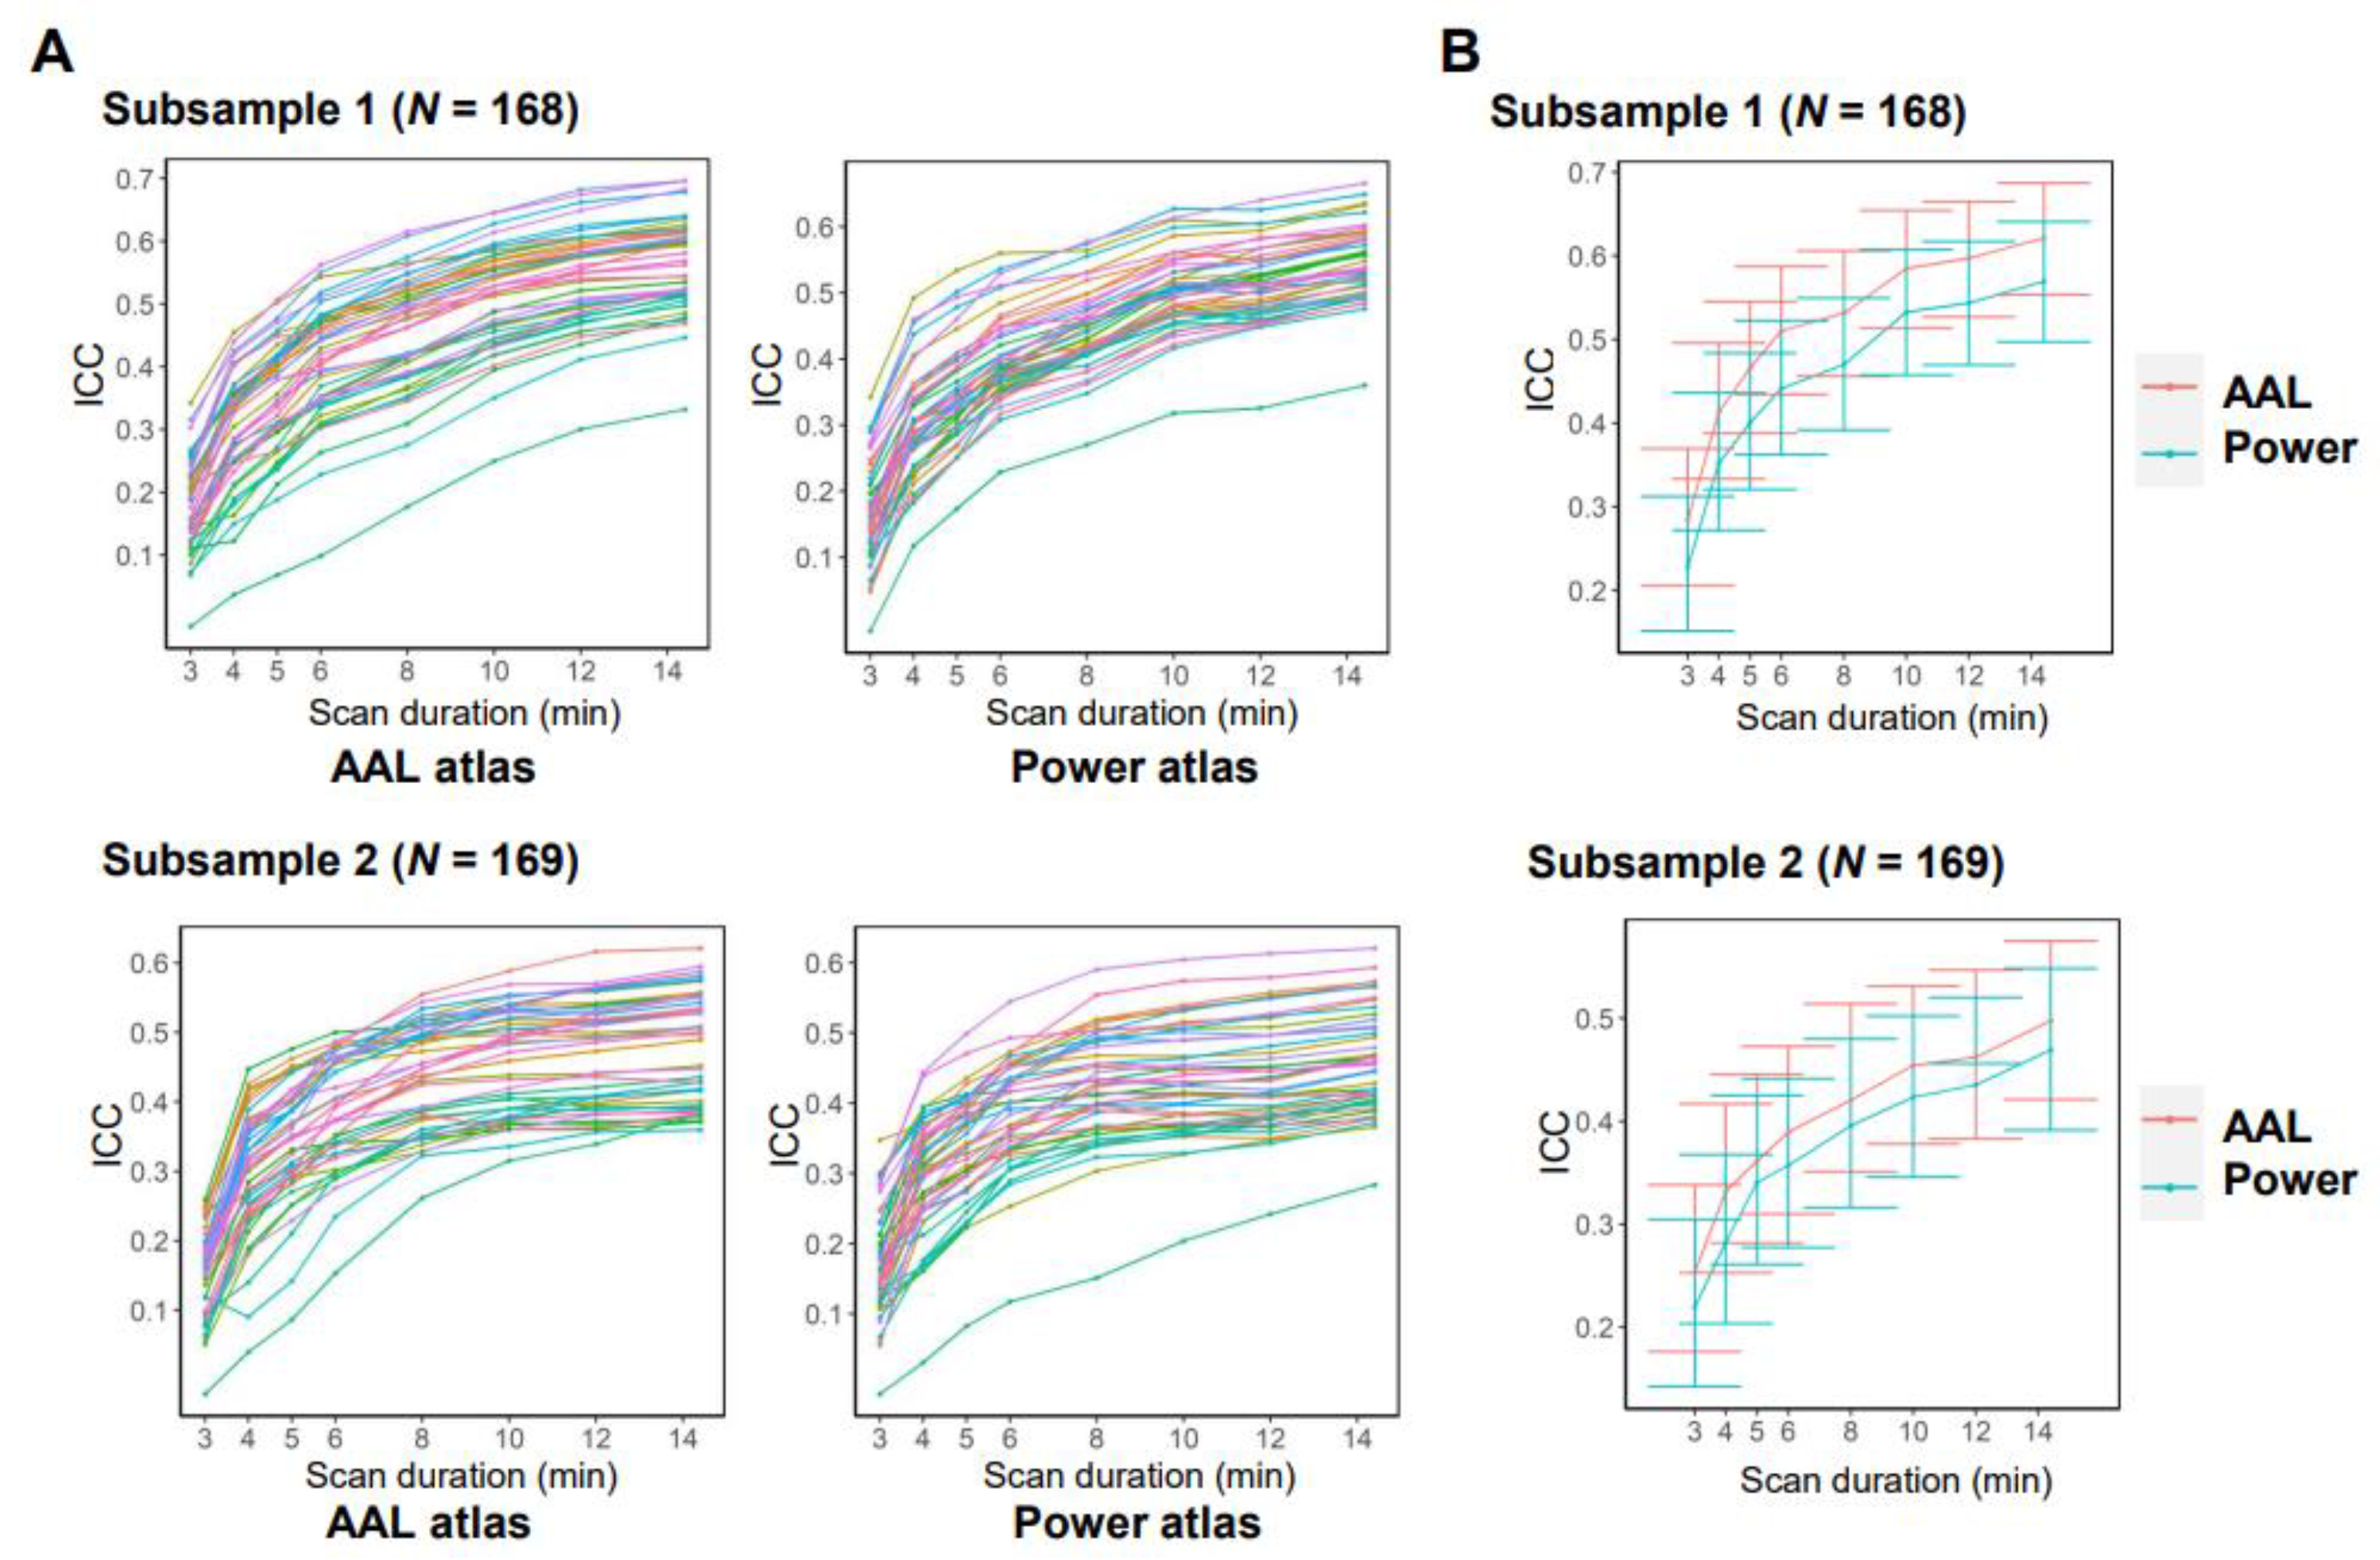
Figure 6.
Comparisons of the whole-brain temporal variability (TV) between male and female subjects. on the test-retest reliability of brain-network temporal variability. (A) Results obtained in each of the two subsamples. (B) Results obtained in the entire sample. Abbreviation: AAL = automated anatomical labeling; *p < 0.05.
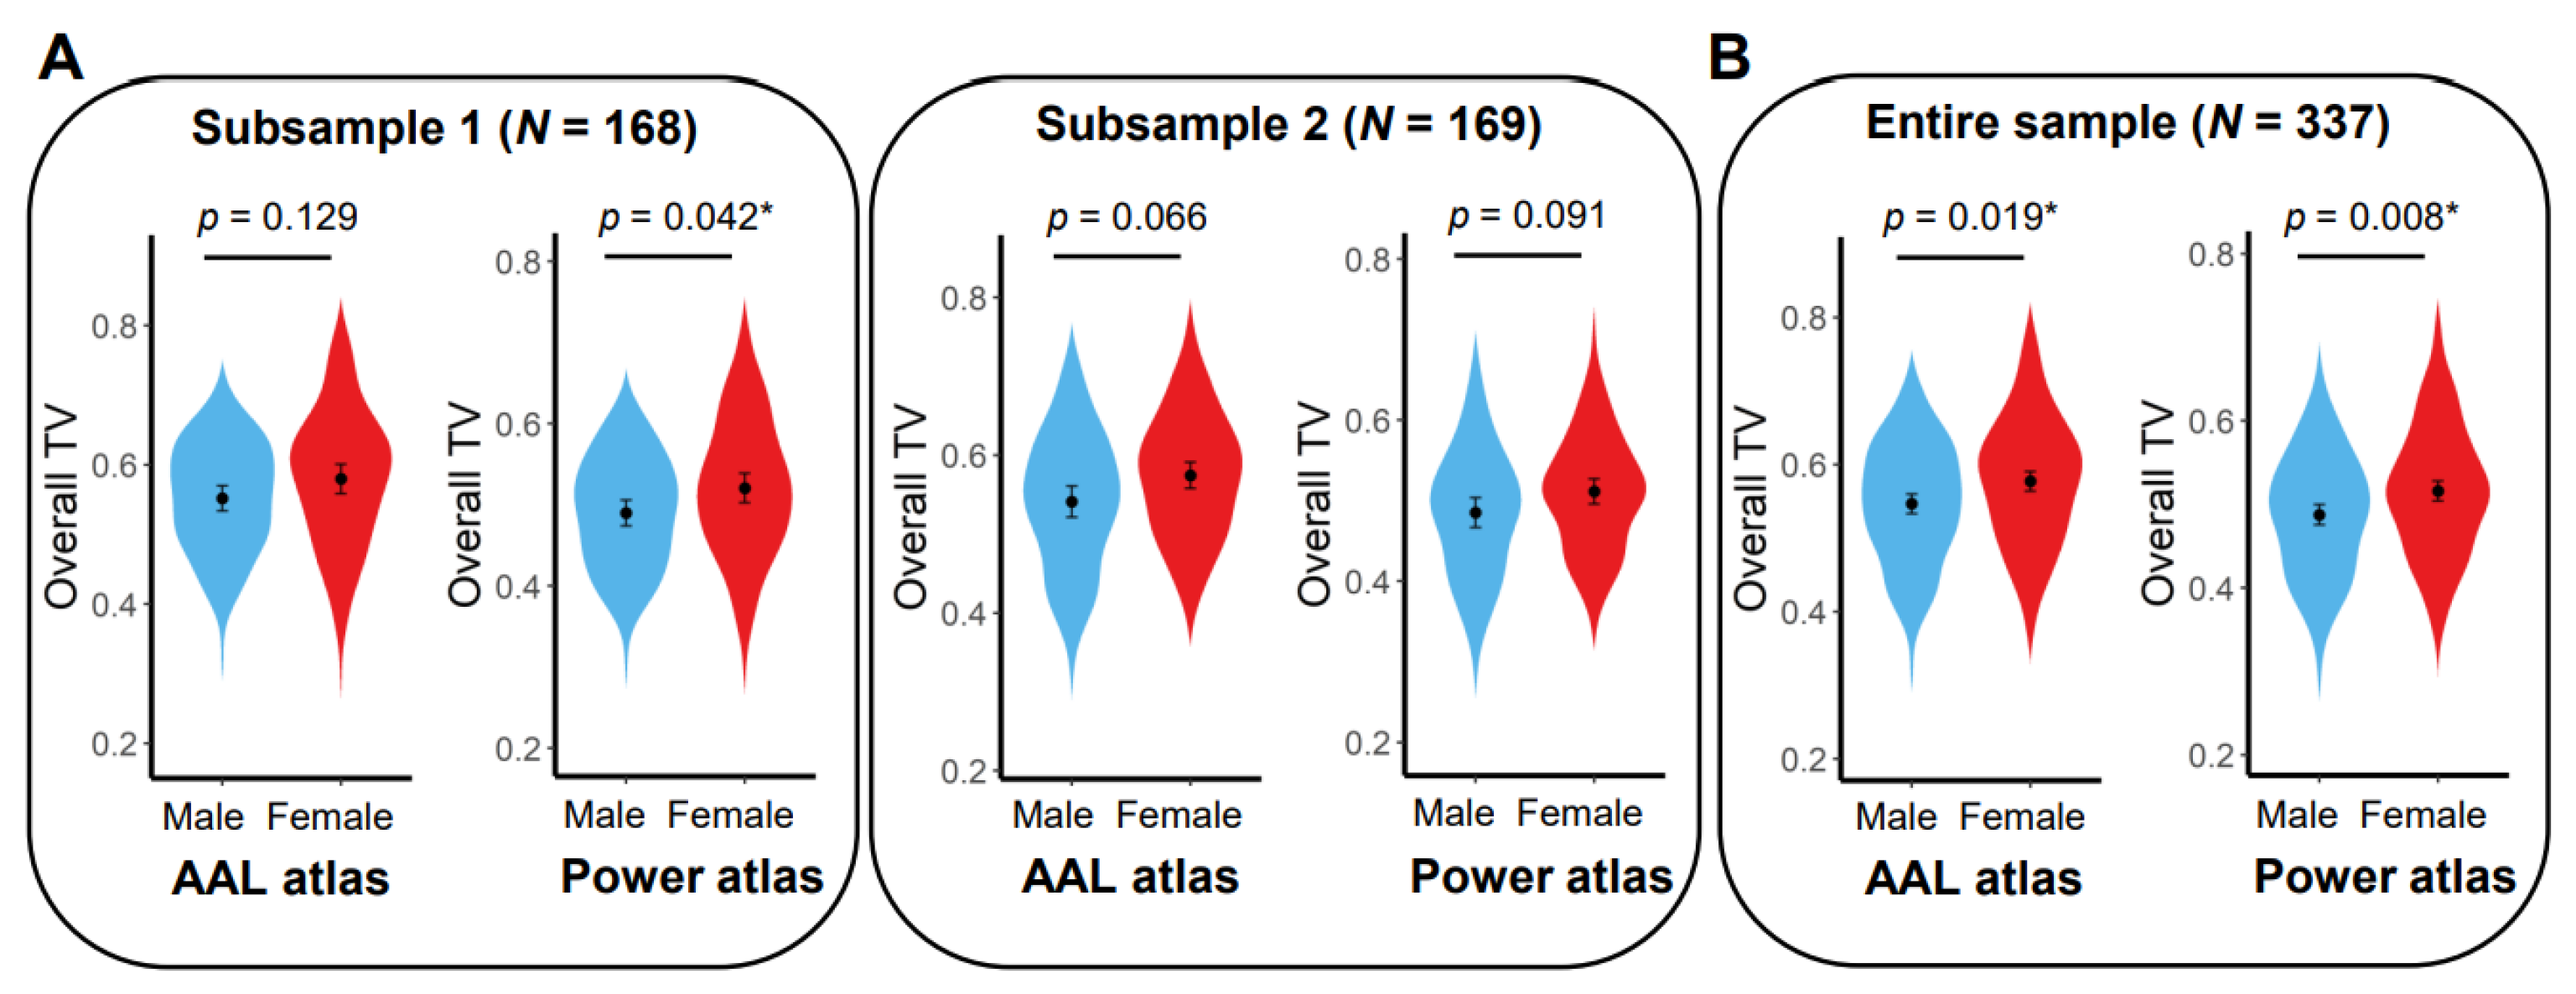
Figure 7.
Results of partial correlations between age and whole-brain temporal variability (TV). (A) Results obtained in each of the two subsamples. (B) Results obtained in the entire sample. Abbreviation: AAL = automated anatomical labeling; *p < 0.05.
Figure 7.
Results of partial correlations between age and whole-brain temporal variability (TV). (A) Results obtained in each of the two subsamples. (B) Results obtained in the entire sample. Abbreviation: AAL = automated anatomical labeling; *p < 0.05.
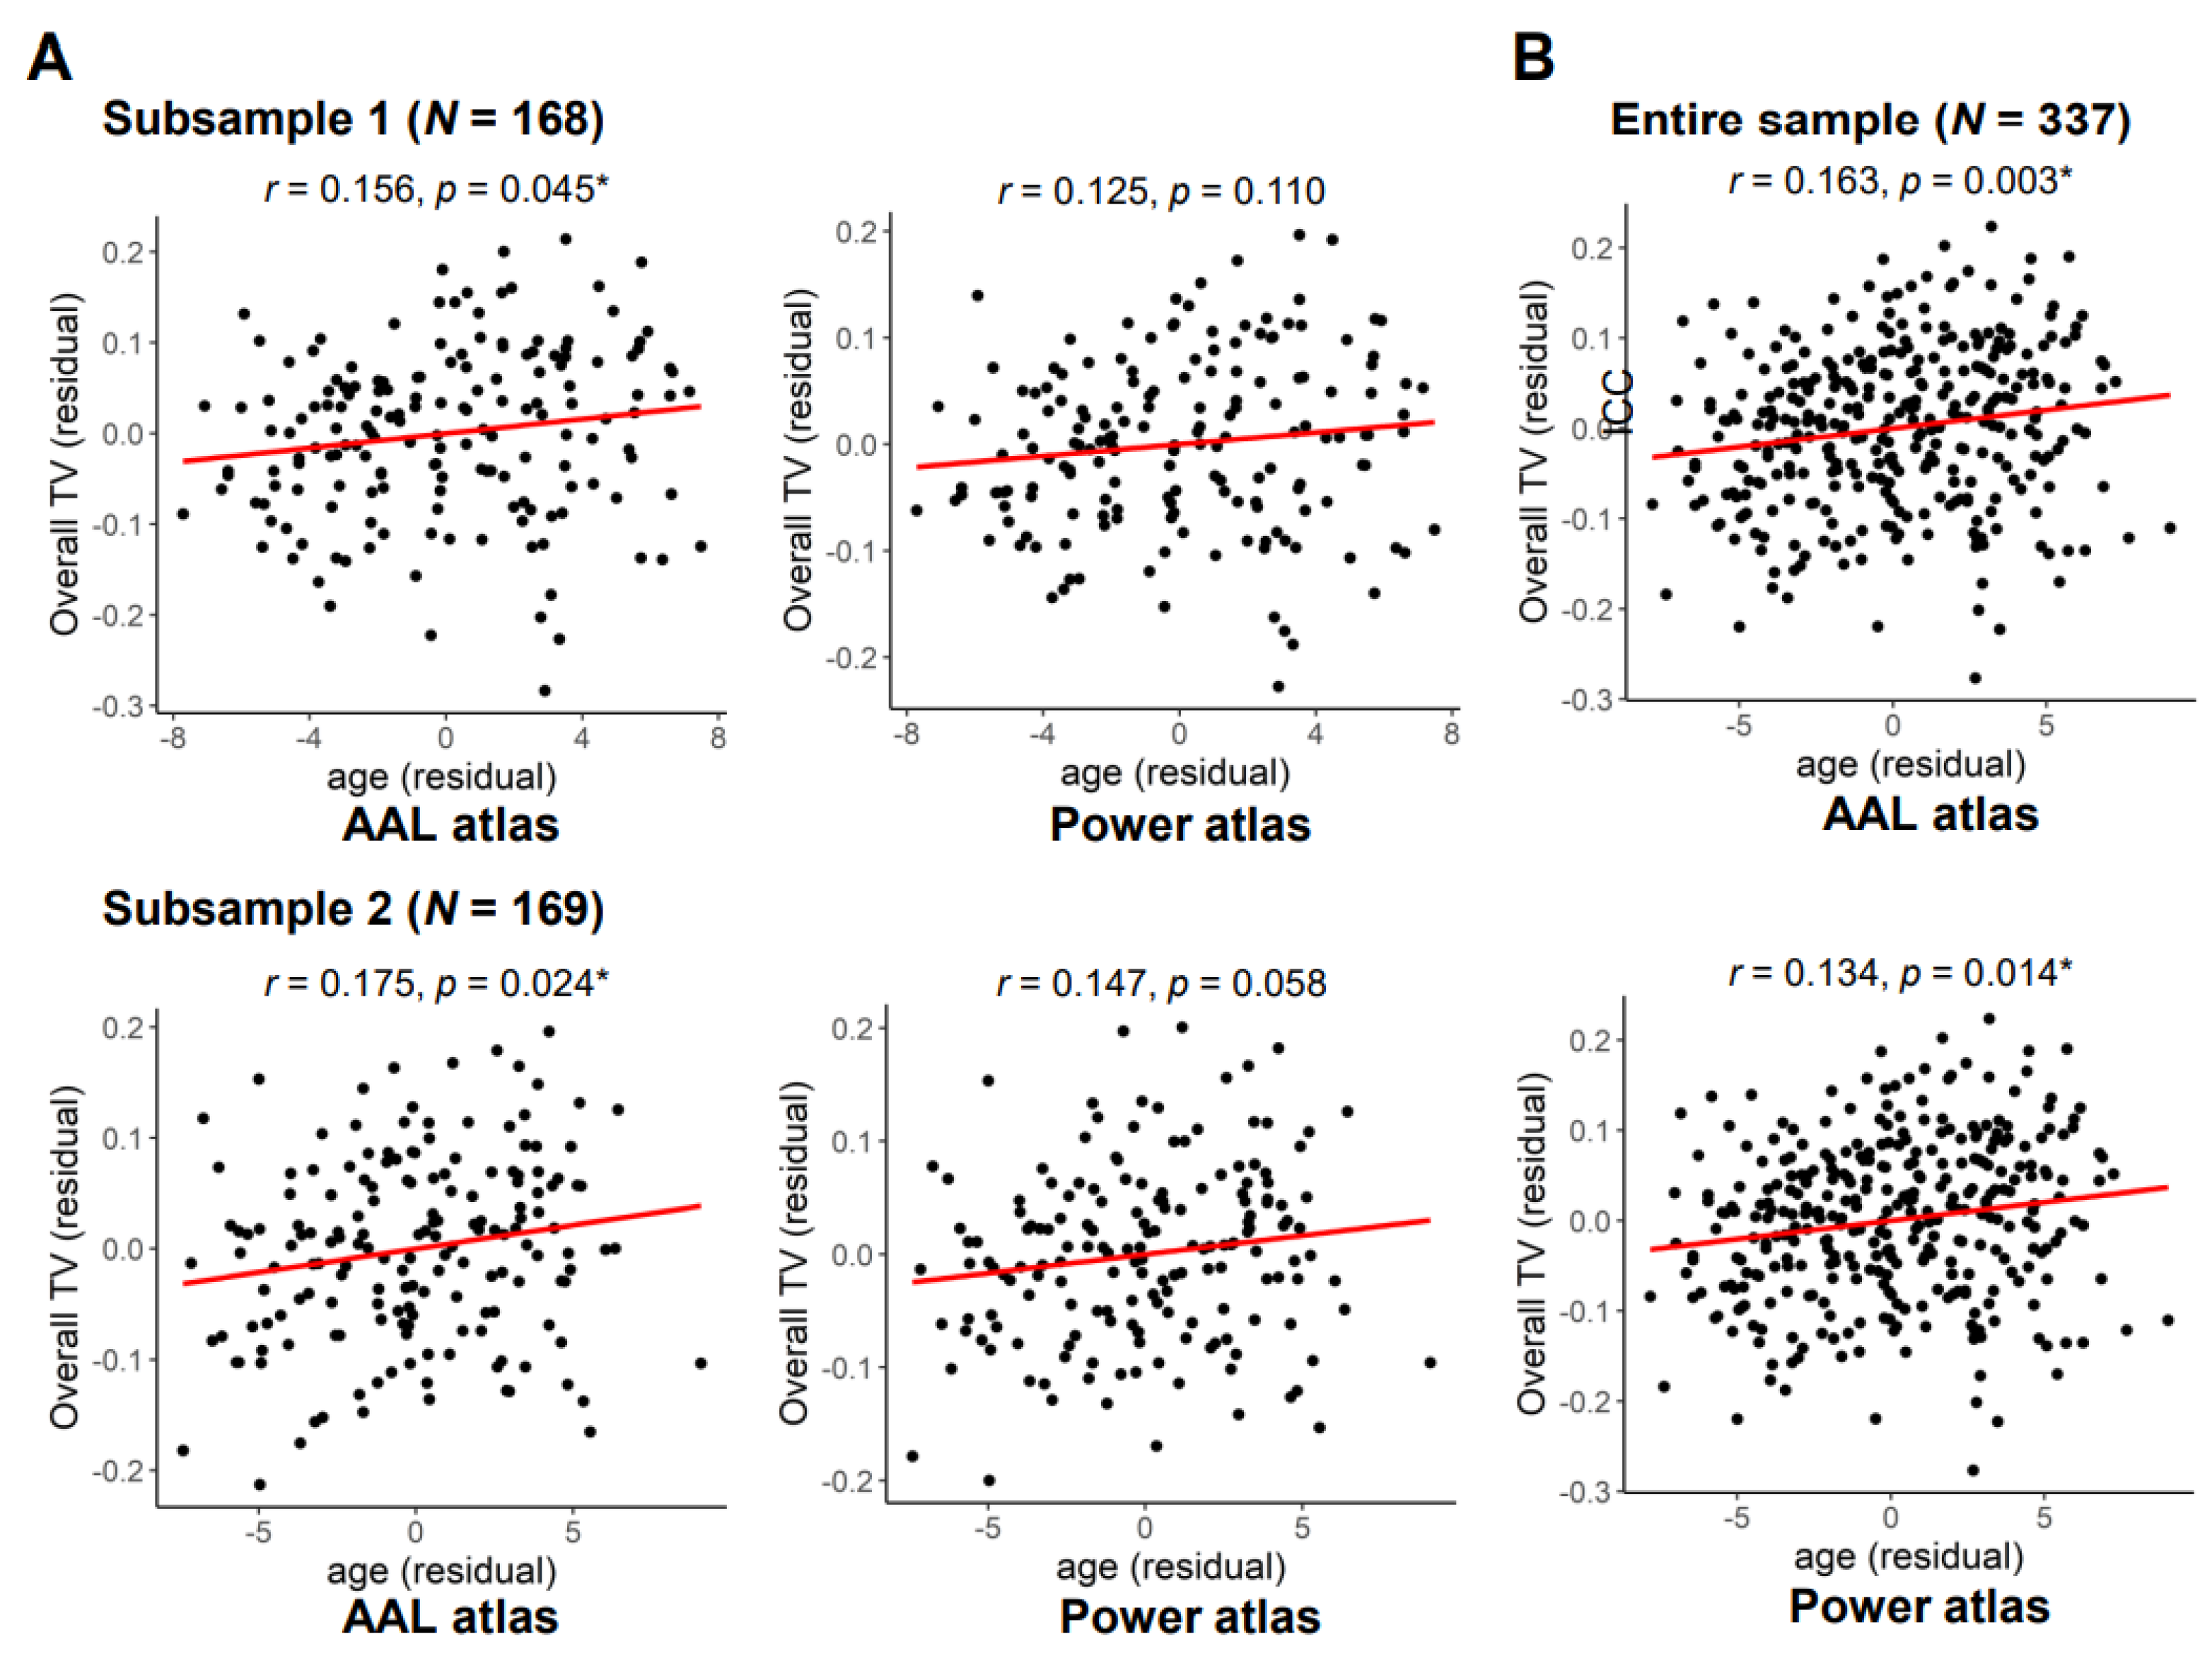

Table 1.
Comparisons of demographic characteristics and head motion between the two subsamples.
| Subsample 1 (N = 168), Mean ± SD |
Subsample 2 (N = 169), Mean ± SD |
Group Comparisons | |
|---|---|---|---|
| Age (years) | 28.65 ± 3.74 | 28.57 ± 3.66 | t = 0.186, p = 0.853 |
| Sex (male/female) | 78/90 | 79/90 | χ2 = 0.003, p = 0.953 |
| Mean FD (mm) a | 0.16 ± 0.06 | 0.16 ± 0.06 | t = -0.019, p = 0.985 |
Abbreviations: FD = framewise displacement; SD = standard deviation. a Mean FD was calculated by averaging the FD values across the four scans.
Disclaimer/Publisher’s Note: The statements, opinions and data contained in all publications are solely those of the individual author(s) and contributor(s) and not of MDPI and/or the editor(s). MDPI and/or the editor(s) disclaim responsibility for any injury to people or property resulting from any ideas, methods, instructions or products referred to in the content. |
© 2025 by the authors. Licensee MDPI, Basel, Switzerland. This article is an open access article distributed under the terms and conditions of the Creative Commons Attribution (CC BY) license (http://creativecommons.org/licenses/by/4.0/).
Copyright: This open access article is published under a Creative Commons CC BY 4.0 license, which permit the free download, distribution, and reuse, provided that the author and preprint are cited in any reuse.


