
Submitted:
30 April 2024
Posted:
01 May 2024
You are already at the latest version
Abstract
Over the past decade and a half, dynamic functional imaging has revolutionized the neuroimaging field. Since 2009, it has revealed low dimensional brain connectivity measures, has identified potential common human spatial connectivity states, has tracked the transition patterns of these states, and has demonstrated meaningful alterations in these transition and spatial patterns in neurological disorders, psychiatric disorders, and over the course of development. Recently, researchers have begun to analyze this data from the perspective of dynamic system and information theory in the hopes of understanding how these dynamics support less easily quantified processes, such as information processing, cortical hierarchy, and consciousness. Consciousness, in particular, appears to be strongly linked to entropy production in the brain. Little attention has been paid to the effects of psychiatric disease on entropy production in the human brain, however. Even disorders characterized by substantial changes in conscious experience have not been widely analyzed from this perspective. We begin to rectify this by examining the complexity of subject trajectories in state space through the lens of information theory. Specifically, we identify a basis for the dynamic functional connectivity state space and track subject trajectories through this space over the course of the scan. The dynamic complexity of these trajectories is assessed along each dimension of the proposed basis space. Using these estimates, we demonstrate that schizophrenia patients display substantially simpler trajectories than demographically matched healthy controls, and that this drop in complexity concentrates along specific dimensions. We also demonstrate that entropy generation in at least one of these dimensions is linked to cognitive performance. Overall, results suggest great value in applying dynamic systems theory to problems of neuroimaging and reveal a substantial drop in the complexity of schizophrenia patients’ brain function.
Keywords:
functional network connectivity
; dynamic functional connectivity
; Shannon entropy
; NeuroMark
; independent component analysis
; principal component analysis
; sliding window correlation
; multiple linear regression
1. Introduction
Schizophrenia, or split mind, ranks among the most studied disorders in modern psychiatry and neuroscience. There are manifold reasons for this, but perhaps the two most prominent are the extent of its resultant social problems and the sheer variety of symptoms which it can produce. Symptoms of schizophrenia broadly fall into three categories, positive, negative, and cognitive, and can range from delusion, paranoia, and hallucination to apathy, anhedonia, and social withdrawal. This wide range of symptoms makes schizophrenia a difficult disorder to treat, as treatments for one group of symptoms may have limited or no effect on another. Indeed, it has been suggested that schizophrenia should not be considered a single disorder at all, but rather a family of disorders aggregated by historical precedent [1].
For the past quarter-century, the most prevalent hypotheses on schizophrenia’s causes have focused on the interactions between brain regions. Perhaps the most prominent is the dysconnectivity hypothesis [2], which may be summarized as the proposition that aberrant connectivity, rather than focal abnormalities, is the primary cause of schizophrenia. In this sense, it may be considered a forerunner to the concept of distributed cognition—quite an early forerunner, as it was first proposed at the beginning of the 20th century [3–5]. The past half-century of research into schizophrenia has amassed considerable evidence in its favor [6], with experimental results suggesting that schizophrenia affects connectivity and plasticity from the level of individual synapses [7–11] to interregional communication [12–14] and white matter tracts. Most of these studies, however, base their analyses on anatomically rather than functionally derived atlases and do not examine time courses through a dynamic systems-inspired latent or state space. They may, therefore, miss some of the crucial insights which examining such systems through these lenses can provide.
At the “global”, or whole-brain, scale, most studies have examined static functional connectivity (FC) or structural connectivity (SC). Such studies have reported reduced global connectivity in schizophrenia patients [15,16], particularly between auditory, sensorimotor, and visual networks [17]. In addition, network-based analyses of functional connectivity in schizophrenia indicate a general reduction in organization and efficiency in the structural and functional connectivity of schizophrenia patients [18]. Beyond this, however, findings have been inconsistent. Some reports suggest decreased communication between frontal and temporal areas of the brain [12]; others have found increased connectivity within the default-mode network [19]; still others imply decreased connectivity within and between the default-mode network and cortical regions [20]. Attempts to model the static functional connectivity of schizophrenia patients have provided equally confused results, with both reduced effective connectivity and increased structural connectivity suggested [21]. Overall, then, analysis of structural and static functional connectivity has been unable to conclusively identify the large-scale changes which underly the symptoms of schizophrenia.
One potential reason for the inconclusiveness of static analyses is that they, by nature, neglect the dynamism of real brain activity. For decades, electroencephalography (EEG) has demonstrated that functional microstates constantly and fluidly change [22–24], a fact which was captured in fMRI in 2010 [25,26]. Although fMRI captures microstate alterations at a timescale of seconds rather than the milliseconds of EEG, its superior spatial resolution compared to EEG allowed researchers to precisely identify recurring connectivity states [15,27–30]. Schizophrenia patients have displayed altered dynamics of these states. For instance, a 2014 study suggested that patients have a higher probability of entering states with attenuated cortical-subcortical connections and increased intra-sensory connectivity than controls, and that these same patients also display elevated low-frequency power in thalamo-sensory communication [17]. This same study suggested that the thalamo-sensory hyperconnectivity reported in its static FC analysis may result from these alterations. However, aside from state transition probabilities and average dwell times, this study did not report any metrics designed to capture state dynamics. This lack of metrics designed to capture the dynamics of functional connectivity has proven a problem, not just for schizophrenia research, but for the broader field of functional neuroimaging.
This study begins to bridge that gap by applying a previously developed framework of measuring the entropy rate of individual fMRI scans [31] to a dataset consisting of medicated schizophrenia patients and demographically matched controls. Rather than attempting to explicitly track interactions between brain regions, this framework defines a basis for a state space within which to plot each subject’s time course. This approach allows direct application of tools and metrics from dynamic systems analysis and information theory to subject time courses and thus reduces the challenge of comparing subject trajectories. The decision to quantify fMRI dynamics in a state space is not novel [32], but the present framework specifically seeks to define a basis, i.e. a minimal linearly independent spanning set, for this space to make most efficient use of the Shannon entropy. The results of this analysis suggest substantially disordered state dynamics in the patient population, with patients displaying simpler trajectories in five out of eight state space dimensions, one of which correlates with cognitive performance. Overall, this represents a positive step towards quantifying the dynamic connectivity alterations which underly psychiatric disease and towards the discovery of a clinically useful basis space in which to diagnose and predict patient treatment.
2. Materials and Methods
A high-level overview of the pipeline is displayed in Figure 1. Detailed explanations of each step follow.
A version of the Kozachenko-Leonenko estimator [63,65,66] is employed to estimate the entropy rate for each subject. Specifically, in each subject, this estimator computes the entropy rate of each source over the course of the scan. The temporal independence which ICA enforces between sources ensures that the entropy rate of source has minimal effect on the entropy rate of source . The joint entropy rate of each subject may thus be estimated by summing the subject-wise entropy rates of all sources.
Data Collection
This study utilizes control and schizophrenia patient data from the Function Biomedical Informatics Research Network (FBIRN) repository [33] preprocessed according to the description given in [34]. To summarize, the statistical parametric mapping package (SPM12) was used to correct for subject head motion, slice timing differences, to warp subject anatomy to the Montreal Neurological Institute (MNI) echo planar imaging (EPI) template space, to resample the collected data to mm3 isotropic voxels, and to smooth the resampled fMRI images with a Gaussian kernel with a full width at half maximum (FWHM) of mm. Subjects with head motion greater than were excluded from study, as were subjects whose full brains could not be normalized due to incomplete imaging data. These criteria led to a final dataset of 151 schizophrenia (SZ) patients and 160 healthy controls (HC).
Estimation of the Functional Networks
Spatial functional networks were estimated using NeuroMark’s adaptive independent component analysis (adaptive-ICA) [34], which extends spatially constrained independent component analysis [35,36] to map known fMRI network templates to novel subject data. This requires balancing two at times competing goals: to maximize the spatial independence of networks in each subject, and to ensure that the network maps in each subject correspond to known group-level templates. Here we use the multi-objective optimized ICA with reference (MOO-ICAR) approach which maximizes two competing objective functions in turn until a solution is achieved. This allows adaptive-ICA to capture subject-unique characteristics while maintaining comparable functional networks across datasets. It should be noted that this method allows the capture of both the internal structure of brain functional connectivity networks and the extent of inter-network connectivity via static and sliding-window functional connectivity estimates.
Estimation of the Functional Networks
Before estimating the functional network connectivity (FNC), Du et al., 2020 chose to remove noise sources from each functional network’s subject-level time series. Removal of noise sources involved four steps: first, the removal of linear, quadratic, and cubic trends in the data; second, multiple regressions of the six realignment parameters and their temporal derivatives to control for in-scanner motion; third, de-spiking to remove outliers; and fourth, band-pass filtration to select for signals in the 0.01-0.15 Hz frequency bands. Once these steps were completed, subject-level static functional network connectivity (sFNC) was computed via Pearson correlation. Other measures of statistical similarity could have been used; for instance, mutual information has been proposed due to its sensitivity to nonlinear interactions [37,38]. However, Pearson correlation’s simplicity, interpretability, and ease of computation means it remains the dominant method for estimating functional connectivity.
While the static FNC provides valuable information on the extent of inter-network communication, its poor time resolution makes it unable to capture the dynamics of this communication. The two most notable methods proposed to circumvent this problem are the sliding time window approach [25,27,39] and coherence-based connectivity [40–43]. The present study uses the sliding window approach. As the name suggests, this method slides a window over the time series of each ICN in small steps, thus segmenting the total time series into many short, overlapping time series. The functional network connectivity of each time series window is computed in the same way as for static FNC, and the resulting connectivity matrices concatenated into an array ( being the number of functional networks and the number of time series windows). This study convolved a normal distribution of zero mean and standard deviation of three with a rectangle 40 times-to-repetition (TRs) long [34] to generate its selection window.
Number of Temporally Independent Sources
Most clustering or source separation algorithms require users to specify the number of sources for which the algorithm should search. This poses a problem in neuroimaging analysis, as the number of recurrent connectivity states which the human brain expresses has not been fully established. As such, researchers do not know a priori the appropriate model order to input into their separation algorithm. It is common to circumvent this problem by testing several numbers of recurrent states, usually within the range of four to eight [44–48] and determining the optimal number by applying a validity index or comparing the results of runs with different source counts. In this instance, eight sources provide the best balance between model order and goodness of fit.
Temporal Functional Network Connectivity Profiles (tFNCPs)
The goal of this study is to identify recurring, overlapping, temporally invariant functional brain patterns and to capture their dynamics. Both clustering and source separation algorithms may be used to achieve this goal, dependent on how these states are hypothesized to manifest in time-resolved fMRI images. A clustering algorithm, such as k-means, may be appropriate if each time-resolved fMRI “snapshot” primarily consists of a single state . If, on the other hand, each time-resolved snapshot contains a mixture of states , a blind source separation algorithm may be more applicable. As this study presumes that each time-resolved fMRI image consists of a linear mixture of underlying “source” connectivity states , a linear source separation algorithm is required. In addition, an entropy-based analysis is made considerably simpler when the time courses are statistically unrelated. As such, we required a linear source separation algorithm which maximizes the statistical independence of each predicted source. Independent component analysis (ICA) is the obvious solution to this problem, as it has been proven to minimize the statistical dependencies between sources in neuroimaging data [49] and to isolate functionally meaningful communities in spike train data [50].
Most ICA algorithms accept two-dimensional inputs, with one dimension representing input variables and the second representing samples. For instance, the time series of functional networks should produce a data array of , with being the number of samples taken over the course of recording. A dFNC array, on the other hand, has three dimensions: , which standard ICA algorithms cannot process. We circumvent this by converting the upper triangle of each sample dFNC array to a vector. Repeating this process across all samples converts the data array from to , which can be decomposed into maximally independent sources by any standard ICA algorithm.
Before maximizing independence, researchers typically whiten the data via principal component analysis (PCA). This serves to reduce the dimensionality of the input data and to improve the estimation of independent components, both of which optimize and stabilize ICA outputs. We apply InfoMax [51–53] for the independent maximization step (ICA). This algorithm was run 150 times and the results consolidated via the ICASSO method [54] to identify stable, repeatable tFNCPs and time courses.
Entropy Analysis
We used a Kozachenko-Leonenko entropy estimator [55–58] to estimate each state’s subject-level rate of entropy production. This produces an array of entropy rate values, with being the number of sources and the number of subjects. The substates’ temporal independence allows us to estimate the joint entropy of all sources by summing the entropy rate across substates [59]:
Note that this calculation requires that source signals be statistically independent. Dependencies between sources must be accounted for when estimating source entropy, which makes evaluating joint entropy quite difficult when dealing with statistically related signals. ICA’s minimization of inter- source relationships was a major motivation for its selection.
Comparison Tests
We utilized both a difference-of-means permutation test [60] and the Kolmogorov-Smirnov two-sample test to search for differences between groups. Student’s t-test was also employed when the Jarque-Bara test indicated normally distributed data. Multiple-comparison correction consists of the false-discovery rate [61].
Regression Analysis
To correct for possible confounds in the data, a multiple linear regression is employed alongside standard hypothesis tests. This regression separately models the effects of site, age, gender, and diagnosis on subject-level joint and source entropies. Additional regression analyses examine the effects of clinical (PANSS positive and negative) and cognitive (CMINDS composite) scores on subject entropy distributions, again while correcting for site, age, and gender effects. As cognitive scores are highly correlated (Figure 2), it was decided to examine only the most general score, namely the CMINDS composite score [62], to avoid effect cross-contamination.
3. Results
3.1. Static Functional Network Connectivity
As a pre-analysis sanity test, we compared static functional network connectivity (sFNC) in the same fashion as [34] for comparison purposes. Figure 3.a displays the mean sFNCs of the FBIRN dataset and 3.b the joint entropy distributions of controls and patients. Notably, healthy controls display visibly greater mean absolute FNC values than schizophrenic patients across the majority of the sFNC matrices’ correlation coefficients. This is due to a reduction in sFNC variance in patients, visible in bar chart format (Figure 3.c) and in the absolute difference between control and patient means (3.d, 3.e). This visible reduction in patient sFNC values provides initial support for the dysconnectivity hypothesis, as it suggests that schizophrenia is broadly characterized by reduced inter-network communication compared to controls. This, in addition to the block-diagonal structure of the sFNC matrices, suggests that the data have been correctly reconstructed.
3.2. Joint Entropy
We estimate each tFNCP’s subject-level entropy rate with a variation of the Kozachenko-Leonenko estimator [63,64] based on k-nearest-neighbor distances between sample points [65,66]. This estimation algorithm is necessary due to the unavailability of source signals’ complete probability distribution, which is necessary for an exact calculation of signal entropy. Fortunately, the statistical independence of the tFNCPs prevents any dependence between their respective entropy rates. As such, the joint entropy rate of each subject can be estimated simply by summing all tFNCPs’ entropy rates within that subject. The resulting group-level distributions of the joint entropy are displayed in Figure 2, with schizophrenia patients on the left and healthy controls on the right. Healthy controls display elevated joint entropy rate relative to patients, with the Kolmogorov-Smirnov test demonstrating that this elevation is highly significant . A difference-of-means permutation test confirms this finding . Student’s -test was not employed because the joint distribution fails the Jarque-Bara test, thus violating Student’s assumption of normality. Group-level means and standard deviations are listed in Table 1.
3.3. tFNCP Entropy
Having confirmed that subject joint entropy rate differs between populations, an obvious question is whether these differences are evenly distributed amongst tFNCPs or whether they concentrate within a subset of them. To answer this question, we compare the group-level entropy rates of each tFNCP using the Kolmogorov-Smirnov two-sample test, with the false discovery rate [61] correcting for multiple comparison. A Student’s t-test is also applied to entropy rate distributions which pass the Jarque-Bera test for normality. This approach reveals decreased patient entropy rates in five of eight tFNCPs (Figure 4), with no qualitative differences between Kolmogorov-Smirnov two-sample test and Student’s t-test results. Row 4.a of Figure 4 displays the connectivity matrices of each tFNCP, row 4.b the tFNCP connectograms, and row 4.c the group-level entropy distribution boxplots. Group entropy means, variances, and test statistics are listed in Table 2.
3.4. Multiple Linear Regression
The wide range of ages and seven collection sites of the FBIRN dataset raise the possibility of substantial age and site effects, potentially large enough to affect the outcome of the previously described hypothesis tests. To account for this, we employed a multiple linear regression analysis to separate the effects of site, age, gender, and diagnostic status (“patient” vs. “control”) on subject joint and tFNCP-level entropy rate. We used similar analyses to examine the link between subject-level entropy, clinical scores, and cognitive scores. Clinical scores consist of the PANSS positive and negative scores, while the CMINDS composite score is used as a surrogate for cognitive scores due to high correlation among the subscales (Figure 2).
3.4.1. Diagnostic Effects
Multiple linear regression diagnostic results, after controlling for site, age, and gender, remain consistent with statistical hypothesis tests. Site effects are both substantial and highly significant, but do not change the outcomes of hypothesis tests. Age and gender effects are found to be small and statistically insignificant.
3.4.2. Symptomatic Effects
Multiple linear regression finds no statistically significant relationship between patient PANSS scores and entropy rate in any tFNCP. Effect sizes are small, with only four of eighteen examined relationships displaying effect sizes of order or higher.
3.4.3. Cognitive Effects
One tFNCP, number five (5) displays a small but highly significant relationship between subject CMINDS composite score [62] and entropy rate. Interestingly, this tFNCP is characterized by strong anticorrelations between two higher cognitive domain regimes: default-mode and subcortical networks oppose visual networks and sensorimotor networks, with cognitive control networks split between these two regimes. The default mode is the most prominent of these domains, being strongly anticorrelated with both opposing domains. Joint entropy rate is also positively related to the CMINDS composite score, although this relationship does not reach statistical significance .
4. Discussion
This article presents a novel method for evaluating the entropy of the dynamics of temporally independent FNCs and the relationship of that entropy to psychiatric disease. Of the eight temporally independent FNC profiles identified, five display significant entropic reductions in schizophrenia patients, with the remaining three showing no such reduction. One of these five diagnostically variable tFNCPs displays a significant positive relationship with cognitive score, with this single tFNCP including strong contributions from default mode networks, cognitive control networks, and other higher cognitive domains.
Initial inspection of the group-level static functional network connectivity broadly supports previous work showing reduced global connectivity in schizophrenia patients [67]. Positive correlations between auditory, sensorimotor, and visual networks appear notably attenuated in patients compared to their healthy counterparts. This reduced connectivity strength and structure may reduce patients’ ability to rapidly reconfigure network relationships [68,69].
Extant research in dynamic functional connectivity consistently suggests an attenuation in the complexity of connectivity dynamics in psychiatric disorders, particularly in schizophrenia. Prior work [32] has shown that patients explore less of their connectivity state space than comparable healthy controls do, and that their trajectories within this state space are both more rigid and more repetitive than controls as well. These findings imply a simplification of dynamics in patients, in line with the reduction in entropy described in this article. Such simplification may underlie the cognitive rigidity and inflexibility known to characterize some psychiatric disorders. Interestingly, the findings of Miller et al., 2016 and the present article contrast with other research which has found that intake of psychedelic substances increase activity diversity, turbulence, and information flow compared to placebo [70–72]. This suggests that hallucinatory experiences in the psychiatric and psychedelic realms possess fundamentally different operational mechanisms. Future research should attempt to identify the mechanisms in each of these populations. The finding of reduced entropy in patients may also align with the finding that psychiatric patients operate in a less metastable regime than their healthy counterparts [73,74]. Similarly, it may imply that patients occupy a reduced functional manifold compared to controls [75]. The concentration of entropy declines in specific tFNCPs may suggest an alteration in the connectivity’s energy landscape as well, as described in [72]. Which, if any, of these hypotheses can best predict the subject trajectories in the tFNCP basis space may prove a valuable line of research.
Of the eight tFNCPs identified in this study, five display significant, positive, linear relationships between entropy rate and the diagnosis of schizophrenia. One of these further displays a small but highly significant positive relationship between general cognitive function (CMINDS score) and entropy rate. Within these five tFNCPs, the most notable feature of the functional domain structure is the stability of the visual-sensorimotor domain block. In four of the five tFNCPs with significant entropy-diagnosis relations, these domains strongly correlate with one another. Further, of these four tFNCPs, three extend the block to include the auditory domain. Only tFNCP eight does not display a strong visual-sensorimotor domain block. Instead, tFNCP eight mostly displays control and visual domain interactions with multiple other domains, mostly visual.
Of the five tFNCPs with altered entropy in schizophrenia patients, each displays a different block to anticorrelate, or oppose, the dominant visuo-sensorimotor-auditory domain alignment. Cerebellar and subcortical networks primarily make up tFNCP four’s opposition, along with most of the default-mode and cognitive control domains. Three default-mode and cognitive control networks align with the visuo-sensorimotor blocks as well. tFNCP five, which appears to influence CMINDS score, recruits the subcortical and default-mode networks in opposition to the sensorimotor-visual-auditory block. tFNCP seven appears to possess three distinct domain-level modules, with cognitive control and default-mode networks correlated with themselves while subcortical networks oppose the sensorimotor-auditory bloc. tFNCP eight, as noted, shows links between cognitive control, default-mode, and visual domain areas.
When observing all eight tFNCPs as well as the diagnostically significant five, two notable trends emerge. First, no tFNCP displays strong intra-domain correlation. High correlation values instead concentrate between domains, as seen in the cerebellar-subcortical block of tFNCP three (3). In fact, only two tFNCPs display high intra-domain correlation: numbers 4 and 5. Even within these tFNCPs, this is the exception rather than the rule, with tFNCP 4 showing high intra-domain correlation only in sensorimotor and visual domains and tFNCP 5 only in the default-mode networks. This consistent lack of strong intra-domain correlation stands as a notable contrast to the static FNC of both groups, the strongest connections of which are all within domains.
The second notable trend across all eight tFNCPs is that cognitive control networks seem to straddle the line between the sensorimotor-visual-auditory block and its opposition. This domain is generally divided between more evident functional modules, but its strongest correlations are consistently towards the sensorimotor-visual block even in cases where most of its networks align against it. Its nonaligned status is most apparent in tFMCP seven, in which the cognitive control and default-mode networks form a third block which largely correlate with neither the sensorimotor nor cerebellar functional modules. The cognitive control domain also displays a distinct tendency to split into two largely separate networks, with relatively weak autocorrelation and strong correlation or anticorrelation with other domains being present in four of five significant tFNCPs.
5. Conclusions
Overall, this article proposes a novel means to quantify entropy in neuroimaging signals. Its basis in well-established methods for identifying functionally relevant spatial maps [34,42,76,77] and maximizing independence of temporal signals [49] lends credence to its findings of reduced dynamic connectivity trajectory complexity in schizophrenia patients. This reduction appears specific to identifiable tFNCPs, one of which significantly relates to cognitive function. It thus represents a potential link between the fields of neuroimaging and psychological analysis and is a substantial step in the ongoing search for biomarkers of psychiatric disease.
Future work with this and related methods should focus on bridging the gap between computational psychiatry, neuroimaging, and dynamical systems models. The ability to directly identify the time courses and complexity of specific tFNCP trajectories means that similar methods may be able to complement theoretical work on cognitive manifolds [75] or confirm extant studies on the transition networks and energy landscapes of the human chronnectome [78–82]. Similar methods may also be able to identify functionally related subgroups within heterogeneous disease categories, as has been done with certain psychological models [1,83]. This, in turn, could lead to developing biomarkers of symptom dimensions directly, which may provide a more reliable and intuitive classification system for psychiatric distress than the extant Diagnostic and Statistical Manual of Mental Disorders (DSM-V) or International Classification of Diseases (ICD). We thus anticipate extensive use of this and related methodologies in future studies as part of the wider quest to catalogue and diagnose psychiatric and neurological dysfunction.
Author Contributions
Conceptualization, Vince Calhoun; Formal analysis, David Blair; Funding acquisition, Vince Calhoun; Methodology, David Blair and Vince Calhoun; Project administration, Vince Calhoun; Software, David Blair; Supervision, Robyn Miller and Vince Calhoun; Validation, David Blair; Visualization, David Blair; Writing – original draft, David Blair; Writing – review & editing, Vince Calhoun.
Funding
This research was funded by the National Institutes of Health, grant number R01MH123610 and the National Science Foundation, grant number 2112455.
Institutional Review Board Statement
not applicable. Article reports on an analysis of a previously collected and publicly available dataset. Authors had no part in data collection. Authors neither requested nor received access to personally identifiable information.
Data Availability Statement
The network templates used in this paper are available online at www.yuhuidu.com and http://trendscenter.org/software. Code used in this article is available at https://github.com/davidblair8/Calhoun.
Conflicts of Interest
The authors declare no conflicts of interest.
References
- K. H. Brodersen et al., “Dissecting psychiatric spectrum disorders by generative embedding,” Neuroimage Clin, vol. 4, pp. 98–111, 2014. [CrossRef]
- K. J. Friston, “The disconnection hypothesis,” Schizophr Res, vol. 30, no. 2, pp. 115–125, Mar. 1998. [CrossRef]
- C. Wernicke, Grundriß der Psychiatrie in klinischen Vorlesungen. 1906. Accessed: Nov. 15, 2023. [Online]. Available: https://wellcomecollection.org/works/tdy5stqg.
- E. Bleuler, “Dementia Praecox or the Group of Schizophrenias,” 1911. [CrossRef]
- A. Moskowitz and G. Heim, “Eugen Bleuler’s Dementia Praecox or the Group of Schizophrenias (1911): A Centenary Appreciation and Reconsideration,” Schizophr Bull, vol. 37, no. 3, pp. 471–479, May 2011. [CrossRef]
- K. E. Stephan, T. Baldeweg, and K. J. Friston, “Synaptic Plasticity and Dysconnection in Schizophrenia,” Biol Psychiatry, vol. 59, no. 10, pp. 929–939, May 2006. [CrossRef]
- R. M. Allen and S. J. Young, “Phencyclidine-induced psychosis,” Am J Psychiatry, vol. 135, no. 9, pp. 1081–1084, 1978. [CrossRef]
- D. C. Javitt and S. R. Zukin, “Recent advances in the phencyclidine model of schizophrenia,” Am J Psychiatry, vol. 148, no. 10, pp. 1301–1308, 1991. [CrossRef]
- S. Kapur, “Psychosis as a state of aberrant salience: a framework linking biology, phenomenology, and pharmacology in schizophrenia,” Am J Psychiatry, vol. 160, no. 1, pp. 13–23, Jan. 2003. [CrossRef]
- I. Kreitschmann-Andermahr, T. Rosburg, U. Demme, E. Gaser, H. Nowak, and H. Sauer, “Effect of ketamine on the neuromagnetic mismatch field in healthy humans,” Cognitive Brain Research, vol. 12, no. 1, pp. 109–116, Aug. 2001. [CrossRef]
- J. E. Black et al., “Pathology of Layer V Pyramidal Neurons in the Prefrontal Cortex of Patients with Schizophrenia,” American Journal of Psychiatry, vol. 161, no. 4, pp. 742–744, Apr. 2004. [CrossRef]
- S. M. Lawrie, C. Buechel, H. C. Whalley, C. D. Frith, K. J. Friston, and E. C. Johnstone, “Reduced frontotemporal functional connectivity in schizophrenia associated with auditory hallucinations,” Biol Psychiatry, vol. 51, no. 12, pp. 1008–1011, Jun. 2002. [CrossRef]
- K. H. Lee, L. M. Williams, M. Breakspear, and E. Gordon, “Synchronous Gamma activity: a review and contribution to an integrative neuroscience model of schizophrenia,” Brain Res Rev, vol. 41, no. 1, pp. 57–78, Jan. 2003. [CrossRef]
- K. M. Spencer et al., “Neural synchrony indexes disordered perception and cognition in schizophrenia,” Proc Natl Acad Sci U S A, vol. 101, no. 49, p. 17288, Dec. 2004. [CrossRef]
- Q. Yu, E. A. Allen, J. Sui, M. R. Arbabshirani, G. Pearlson, and V. D. Calhoun, “Brain connectivity networks in schizophrenia underlying resting state functional magnetic resonance imaging.,” Curr Top Med Chem, vol. 12, no. 21, pp. 2415–25, Nov. 2012. [CrossRef]
- Q. Yu et al., “Assessing dynamic brain graphs of time-varying connectivity in fMRI data: Application to healthy controls and patients with schizophrenia,” Neuroimage, vol. 107, pp. 345–355, Feb. 2015. [CrossRef]
- E. Damaraju et al., “Dynamic functional connectivity analysis reveals transient states of dysconnectivity in schizophrenia,” Neuroimage Clin, vol. 5, no. 21, pp. 298–308, Nov. 2014. [CrossRef]
- J. Kambeitz et al., “Aberrant Functional Whole-Brain Network Architecture in Patients with Schizophrenia: A Meta-analysis,” Schizophr Bull, vol. 42, no. 1, pp. S13–S21, 2016. [CrossRef]
- S. Whitfield-Gabrieli et al., “Hyperactivity and hyperconnectivity of the default network in schizophrenia and in first-degree relatives of persons with schizophrenia,” Proc Natl Acad Sci U S A, vol. 106, no. 4, pp. 1279–1284, Jan. 2009. [CrossRef]
- R. Salvador et al., “Overall brain connectivity maps show cortico-subcortical abnormalities in schizophrenia,” Hum Brain Mapp, vol. 31, no. 12, pp. 2003–2014, Dec. 2010. [CrossRef]
- J. R. B. Cabral, E. Hugues, M. L. Kringelbach, and G. Deco, “Modeling the outcome of structural disconnection on resting-state functional connectivity,” Neuroimage, vol. 62, no. 3, pp. 1342–1353, Sep. 2012. [CrossRef]
- D. Lehmann and W. Skrandies, “Spatial analysis of evoked potentials in man--a review,” Prog Neurobiol, vol. 23, no. 3, pp. 227–250, 1984. [CrossRef]
- R. D. Pascual-Marqui, C. M. Michel, and D. Lehmann, “Segmentation of Brain Electrical Activity into Microstates; Model Estimation and Validation,” IEEE Trans Biomed Eng, vol. 42, no. 7, pp. 658–665, 1995. [CrossRef]
- V. Strelets et al., “Chronic schizophrenics with positive symptomatology have shortened EEG microstate durations,” Clinical Neurophysiology, vol. 114, no. 11, pp. 2043–2051, 2003. [CrossRef]
- Ü. Sakoğlu, G. D. Pearlson, K. A. Kiehl, Y. M. Wang, A. M. Michael, and V. D. Calhoun, “A method for evaluating dynamic functional network connectivity and task-modulation: Application to schizophrenia,” Magnetic Resonance Materials in Physics, Biology and Medicine, vol. 23, no. 5–6, pp. 351–366, Dec. 2010. [CrossRef]
- C. Chang and G. H. Glover, “Time-frequency dynamics of resting-state brain connectivity measured with fMRI,” Neuroimage, vol. 50, no. 1, pp. 81–98, 2010. [CrossRef]
- R. M. Hutchison et al., “Dynamic functional connectivity: Promise, issues, and interpretations,” Neuroimage, vol. 80, pp. 360–378, 2013. [CrossRef]
- M. G. Preti, T. A. W. Bolton, and D. Van De Ville, “The dynamic functional connectome: State-of-the-art and perspectives,” Neuroimage, vol. 160, pp. 41–54, Oct. 2017. [CrossRef]
- V. D. Calhoun, T. Eichele, T. Adali, and E. A. Allen, “Decomposing the brain: Components and modes, networks and nodes,” Trends Cogn Sci, vol. 16, no. 5, pp. 255–256, 2012. [CrossRef]
- E. A. Allen, E. Damaraju, S. M. Plis, E. B. Erhardt, T. Eichele, and V. D. Calhoun, “Tracking Whole-Brain Connectivity Dynamics in the Resting State,” 2012. [CrossRef]
- D. S. Blair, C. Soriano-Mas, J. R. B. Cabral, P. Moreira, P. Morgado, and G. Deco, “Complexity changes in functional state dynamics suggest focal connectivity reductions,” Front Hum Neurosci, vol. 16, no. September, pp. 1–18, Sep. 2022. [CrossRef]
- R. L. Miller et al., “Higher dimensional meta-state analysis reveals reduced resting fMRI connectivity dynamism in schizophrenia patients,” PLoS One, vol. 11, no. 3, p. 149849, 2016. [CrossRef]
- D. B. Keator et al., “The Function Biomedical Informatics Research Network Data Repository,” Neuroimage, vol. 124, pp. 1074–1079, Jan. 2016. [CrossRef]
- Y. Du et al., “NeuroMark: An automated and adaptive ICA based pipeline to identify reproducible fMRI markers of brain disorders,” Neuroimage Clin, vol. 28, p. 102375, Jan. 2020. [CrossRef]
- Q. H. Lin, J. Liu, Y. R. Zheng, H. Liang, and V. D. Calhoun, “Semiblind spatial ICA of fMRI using spatial constraints,” Hum Brain Mapp, vol. 31, no. 7, pp. 1076–1088, Jul. 2010. [CrossRef]
- Y. Du and Y. Fan, “Group information guided ICA for fMRI data analysis,” Neuroimage, vol. 69, pp. 157–197, Apr. 2013. [CrossRef]
- S. M. Motlaghian et al., “Nonlinear functional network connectivity in resting functional magnetic resonance imaging data,” Hum Brain Mapp, no. July 2021, pp. 1–11, 2022. [CrossRef]
- S. M. Motlaghian et al., “A method for estimating and characterizing explicitly nonlinear dynamic functional network connectivity in resting-state fMRI data,” J Neurosci Methods, vol. 389, no. 1, p. 109794, Apr. 2023. [CrossRef]
- E. A. Allen, E. Damaraju, S. M. Plis, E. B. Erhardt, T. Eichele, and V. D. Calhoun, “Tracking Whole-Brain Connectivity Dynamics in the Resting State,” Cerebral Cortex, vol. 24, no. 3, pp. 663–676, Mar. 2014. [CrossRef]
- P. Fries, “A mechanism for cognitive dynamics: neuronal communication through neuronal coherence,” Trends Cogn Sci, vol. 9, no. 10, pp. 474–480, Oct. 2005. [CrossRef]
- E. Glerean, J. Salmi, J. M. Lahnakoski, I. P. Jääskeläinen, and M. Sams, “Functional Magnetic Resonance Imaging Phase Synchronization as a Measure of Dynamic Functional Connectivity,” Brain Connect, vol. 2, no. 2, pp. 91–101, Apr. 2012. [CrossRef]
- J. R. B. Cabral et al., “Cognitive performance in healthy older adults relates to spontaneous switching between states of functional connectivity during rest,” Sci Rep, vol. 7, no. 1, p. 5135, Dec. 2017. [CrossRef]
- G. Deco, J. Cruzat Grand, and M. L. Kringelbach, “Brain songs framework used for discovering the relevant timescale of the human brain,” Nat Commun, vol. 10, no. 1, pp. 1–13, 2019. [CrossRef]
- B. Rashid, E. Damaraju, G. D. Pearlson, and V. D. Calhoun, “Dynamic connectivity states estimated from resting fMRI Identify differences among Schizophrenia, bipolar disorder, and healthy control subjects,” Front Hum Neurosci, vol. 8, no. November, pp. 1–13, 2014. [CrossRef]
- A. Abrol et al., “Replicability of time-varying connectivity patterns in large resting state fMRI samples,” Neuroimage, vol. 163, no. September, pp. 160–176, 2017. [CrossRef]
- Z. Fu et al., “Characterizing dynamic amplitude of low-frequency fluctuation and its relationship with dynamic functional connectivity: An application to schizophrenia,” Neuroimage, vol. 180, no. September 2017, pp. 619–631, 2018. [CrossRef]
- Z. Fu et al., “Transient increased thalamic-sensory connectivity and decreased whole-brain dynamism in autism,” Neuroimage, vol. 190, no. November 2017, pp. 191–204, 2019. [CrossRef]
- Y. Du, Z. Fu, and V. D. Calhoun, “Classification and prediction of brain disorders using functional connectivity: Promising but challenging,” Front Neurosci, vol. 12, no. AUG, 2018. [CrossRef]
- V. D. Calhoun et al., “Independent Component Analysis for Brain fMRI Does Indeed Select for Maximal Independence,” PLoS One, vol. 8, no. 8, p. e73309, Aug. 2013. [CrossRef]
- V. Lopes-dos-Santos, S. Ribeiro, and A. B. L. Tort, “Detecting cell assemblies in large neuronal populations,” J Neurosci Methods, vol. 220, no. 2, pp. 149–166, Nov. 2013. [CrossRef]
- A. J. Bell and T. J. Sejnowski, “An Information-Maximization Approach to Blind Separation and Blind Deconvolution,” Neural Comput, vol. 7, no. 6, pp. 1129–1159, Nov. 1995. [CrossRef]
- J. P. Nadal and N. Parga, “Redundancy Reduction and Independent Component Analysis: Conditions on Cumulants and Adaptive Approaches,” Neural Comput, vol. 9, no. 7, pp. 1421–1456, Oct. 1997. [CrossRef]
- J.-P. NADAL and N. PARGA, “SENSORY CODING: INFORMATION MAXIMIZATION AND REDUNDANCY REDUCTION,” 1999, pp. 164–171. [CrossRef]
- J. Himberg and A. Hyvärinen, “ICASSO: Software for investigating the reliability of ICA estimates by clustering and visualization,” Neural Networks for Signal Processing - Proceedings of the IEEE Workshop, vol. 2003-January, pp. 259–268, 2003. [CrossRef]
- C. E. Shannon, “A Mathematical Theory of Communication,” The Mathematical Theory of Communication, no. April 1924, pp. 1–54, 1949.
- H. Singh, N. Misra, V. Hnizdo, A. Fedorowicz, and E. Demchuk, “Nearest Neighbor Estimates of Entropy,” American Journal of Mathematical and Management Sciences, vol. 23, no. 3–4, pp. 301–321, Feb. 2003. [CrossRef]
- L. F. Kozachenko and N. N. Leonenko, “SAMPLE ESTIMATE OF THE ENTROPY OF A RANDOM VECTOR.,” Problems of information transmission, 1987.
- S. Delattre and N. Fournier, “On the Kozachenko–Leonenko entropy estimator,” J Stat Plan Inference, vol. 185, pp. 69–93, Jun. 2017. [CrossRef]
- T. M. Cover and J. A. Thomas, Elements of Information Theory, Second Edi. Hoboken, New Jersey: John Wiley & Sons, Ltd, 2006. [CrossRef]
- L. R. Krol, “Permutation Test.” GitHub, Berlin, 2021. [Online]. Available: https://github.com/lrkrol/permutationTest.
- Y. Benjamini and Y. Hochberg, “Controlling the False Discovery Rate : A Practical and Powerful Approach to Multiple Testing,” Journal of the Royal Statistical Society. Series B (Methodological)., vol. 57, no. 1, pp. 289–300, 1995.
- T. G. M. van Erp et al., “Neuropsychological profile in adult schizophrenia measured with the CMINDS,” Psychiatry Res, vol. 230, no. 3, pp. 826–834, 2015. [CrossRef]
- L. F. Kozachenko and N. N. Leonenko, “SAMPLE ESTIMATE OF THE ENTROPY OF A RANDOM VECTOR.,” Problems of information transmission, 1987.
- S. Delattre and N. Fournier, “On the Kozachenko–Leonenko entropy estimator,” J Stat Plan Inference, vol. 185, pp. 69–93, Jun. 2017. [CrossRef]
- H. Singh, N. Misra, V. Hnizdo, A. Fedorowicz, and E. Demchuk, “Nearest Neighbor Estimates of Entropy,” American Journal of Mathematical and Management Sciences, vol. 23, no. 3–4, pp. 301–321, Feb. 2003. [CrossRef]
- M. N. Goria, N. N. Leonenko, V. V. Mergel, and P. L. Novi Inverardi, “A new class of random vector entropy estimators and its applications in testing statistical hypotheses,” J Nonparametr Stat, vol. 17, no. 3, pp. 277–297, Apr. 2005. [CrossRef]
- Q. Y. Yu et al., “Modular organization of functional network connectivity in healthy controls and patients with schizophrenia during the resting state,” Front Syst Neurosci, vol. 5, no. JANUARY 2012, p. 18383, Jan. 2012. [CrossRef]
- A. Fornito, A. Zalesky, C. Pantelis, and E. T. Bullmore, “Schizophrenia, neuroimaging and connectomics,” Neuroimage, vol. 62, no. 4, pp. 2296–2314, Oct. 2012. [CrossRef]
- D. S. Bassett, B. G. Nelson, B. A. Mueller, J. Camchong, and K. O. Lim, “Altered resting state complexity in schizophrenia,” Neuroimage, vol. 59, no. 3, pp. 2196–2207, 2012. [CrossRef]
- D. E. W. McCulloch et al., “Psychedelic resting-state neuroimaging: A review and perspective on balancing replication and novel analyses,” Neuroscience and Biobehavioral Reviews, vol. 138. Elsevier Ltd, Jul. 01, 2022. [CrossRef]
- J. Cruzat Grand et al., “Effects of classic psychedelic drugs on turbulent signatures in brain dynamics,” Network Neuroscience, vol. 6, no. 4, pp. 1104–1124, Oct. 2022. [CrossRef]
- S. P. Singleton et al., “Receptor-informed network control theory links LSD and psilocybin to a flattening of the brain’s control energy landscape,” Nature Communications 2022 13:1, vol. 13, no. 1, pp. 1–13, 2022. [CrossRef]
- S. Alonso Martínez, J.-B. C. Marsman, M. L. Kringelbach, G. Deco, and G. J. ter Horst, “Reduced spatiotemporal brain dynamics are associated with increased depressive symptoms after a relationship breakup,” Neuroimage Clin, vol. 27, no. May, p. 102299, 2020. [CrossRef]
- S. Alonso Martínez, G. Deco, G. J. Ter Horst, and J. R. B. Cabral, “The Dynamics of Functional Brain Networks Associated With Depressive Symptoms in a Nonclinical Sample,” Front Neural Circuits, vol. 14, Sep. 2020. [CrossRef]
- V. K. Jirsa, “Structured Flows on Manifolds as guiding concepts in brain science,” in Selbstorganisation – ein Paradigma für die Humanwissenschaften, Wiesbaden: Springer Fachmedien Wiesbaden, 2020, pp. 89–102. [CrossRef]
- V. D. Calhoun, K. A. Kiehl, and G. D. Pearlson, “Modulation of temporally coherent brain networks estimated using ICA at rest and during cognitive tasks,” Hum Brain Mapp, vol. 29, no. 7, pp. 828–838, Jul. 2008. [CrossRef]
- M. Yaesoubi, R. L. Miller, and V. D. Calhoun, “Mutually temporally independent connectivity patterns: A new framework to study the dynamics of brain connectivity at rest with application to explain group difference based on gender,” Neuroimage, vol. 107, pp. 85–94, 2015. [CrossRef]
- R. F. Betzel, S. Gu, J. D. Medaglia, F. Pasqualetti, and D. S. Bassett, “Optimally controlling the human connectome: the role of network topology,” Sci Rep, vol. 6, no. 1, p. 30770, Nov. 2016. [CrossRef]
- S. Gu et al., “Optimal trajectories of brain state transitions.,” Neuroimage, vol. 148, pp. 305–317, Mar. 2017. [CrossRef]
- S. Gu et al., “The Energy Landscape of Neurophysiological Activity Implicit in Brain Network Structure,” Sci Rep, vol. 8, no. 1, p. 2507, Feb. 2018. [CrossRef]
- C. H. Xia et al., “Linked dimensions of psychopathology and connectivity in functional brain networks.,” Nat Commun, vol. 9, no. 1, p. 3003, Aug. 2018. [CrossRef]
- A. Ashourvan et al., “Pairwise maximum entropy model explains the role of white matter structure in shaping emergent co-activation states,” Commun Biol, vol. 4, no. 1, 2021. [CrossRef]
- K. H. Brodersen, J. M. Buhmann, K. E. Stephan, and Z. Ghahramani, “Generative embedding and variational Bayesian inference for multivariate time series,” 2012. [CrossRef]
Figure 1.
procedure for identifying subject-level tFNCP and joint entropy. Procedural schematic for identifying subject-level tFNCP and joint entropy in functional magnetic resonance images (fMRI). Adaptive ICA [36] is used to map subject-level voxel time courses of length to preestablished network templates [34] . This produces subject-level time courses and spatial maps which maintain comparability. Sliding-window correlation [25] then finds the time-resolved correlation of each subject to produce connectivity arrays. The upper triangle of each connectivity matrix is vectorized to produce subject-level time-resolved connectivity records, which are concatenated to produce a single record of subject connectivities . After principal component analysis (PCA) whitens and reduces this array to spatial dimensions, ICA is used to extract temporally independent source time courses , along with the coefficient vectors which map from connectivity to source space . Each subject’s time courses are then isolated for entropy analysis.
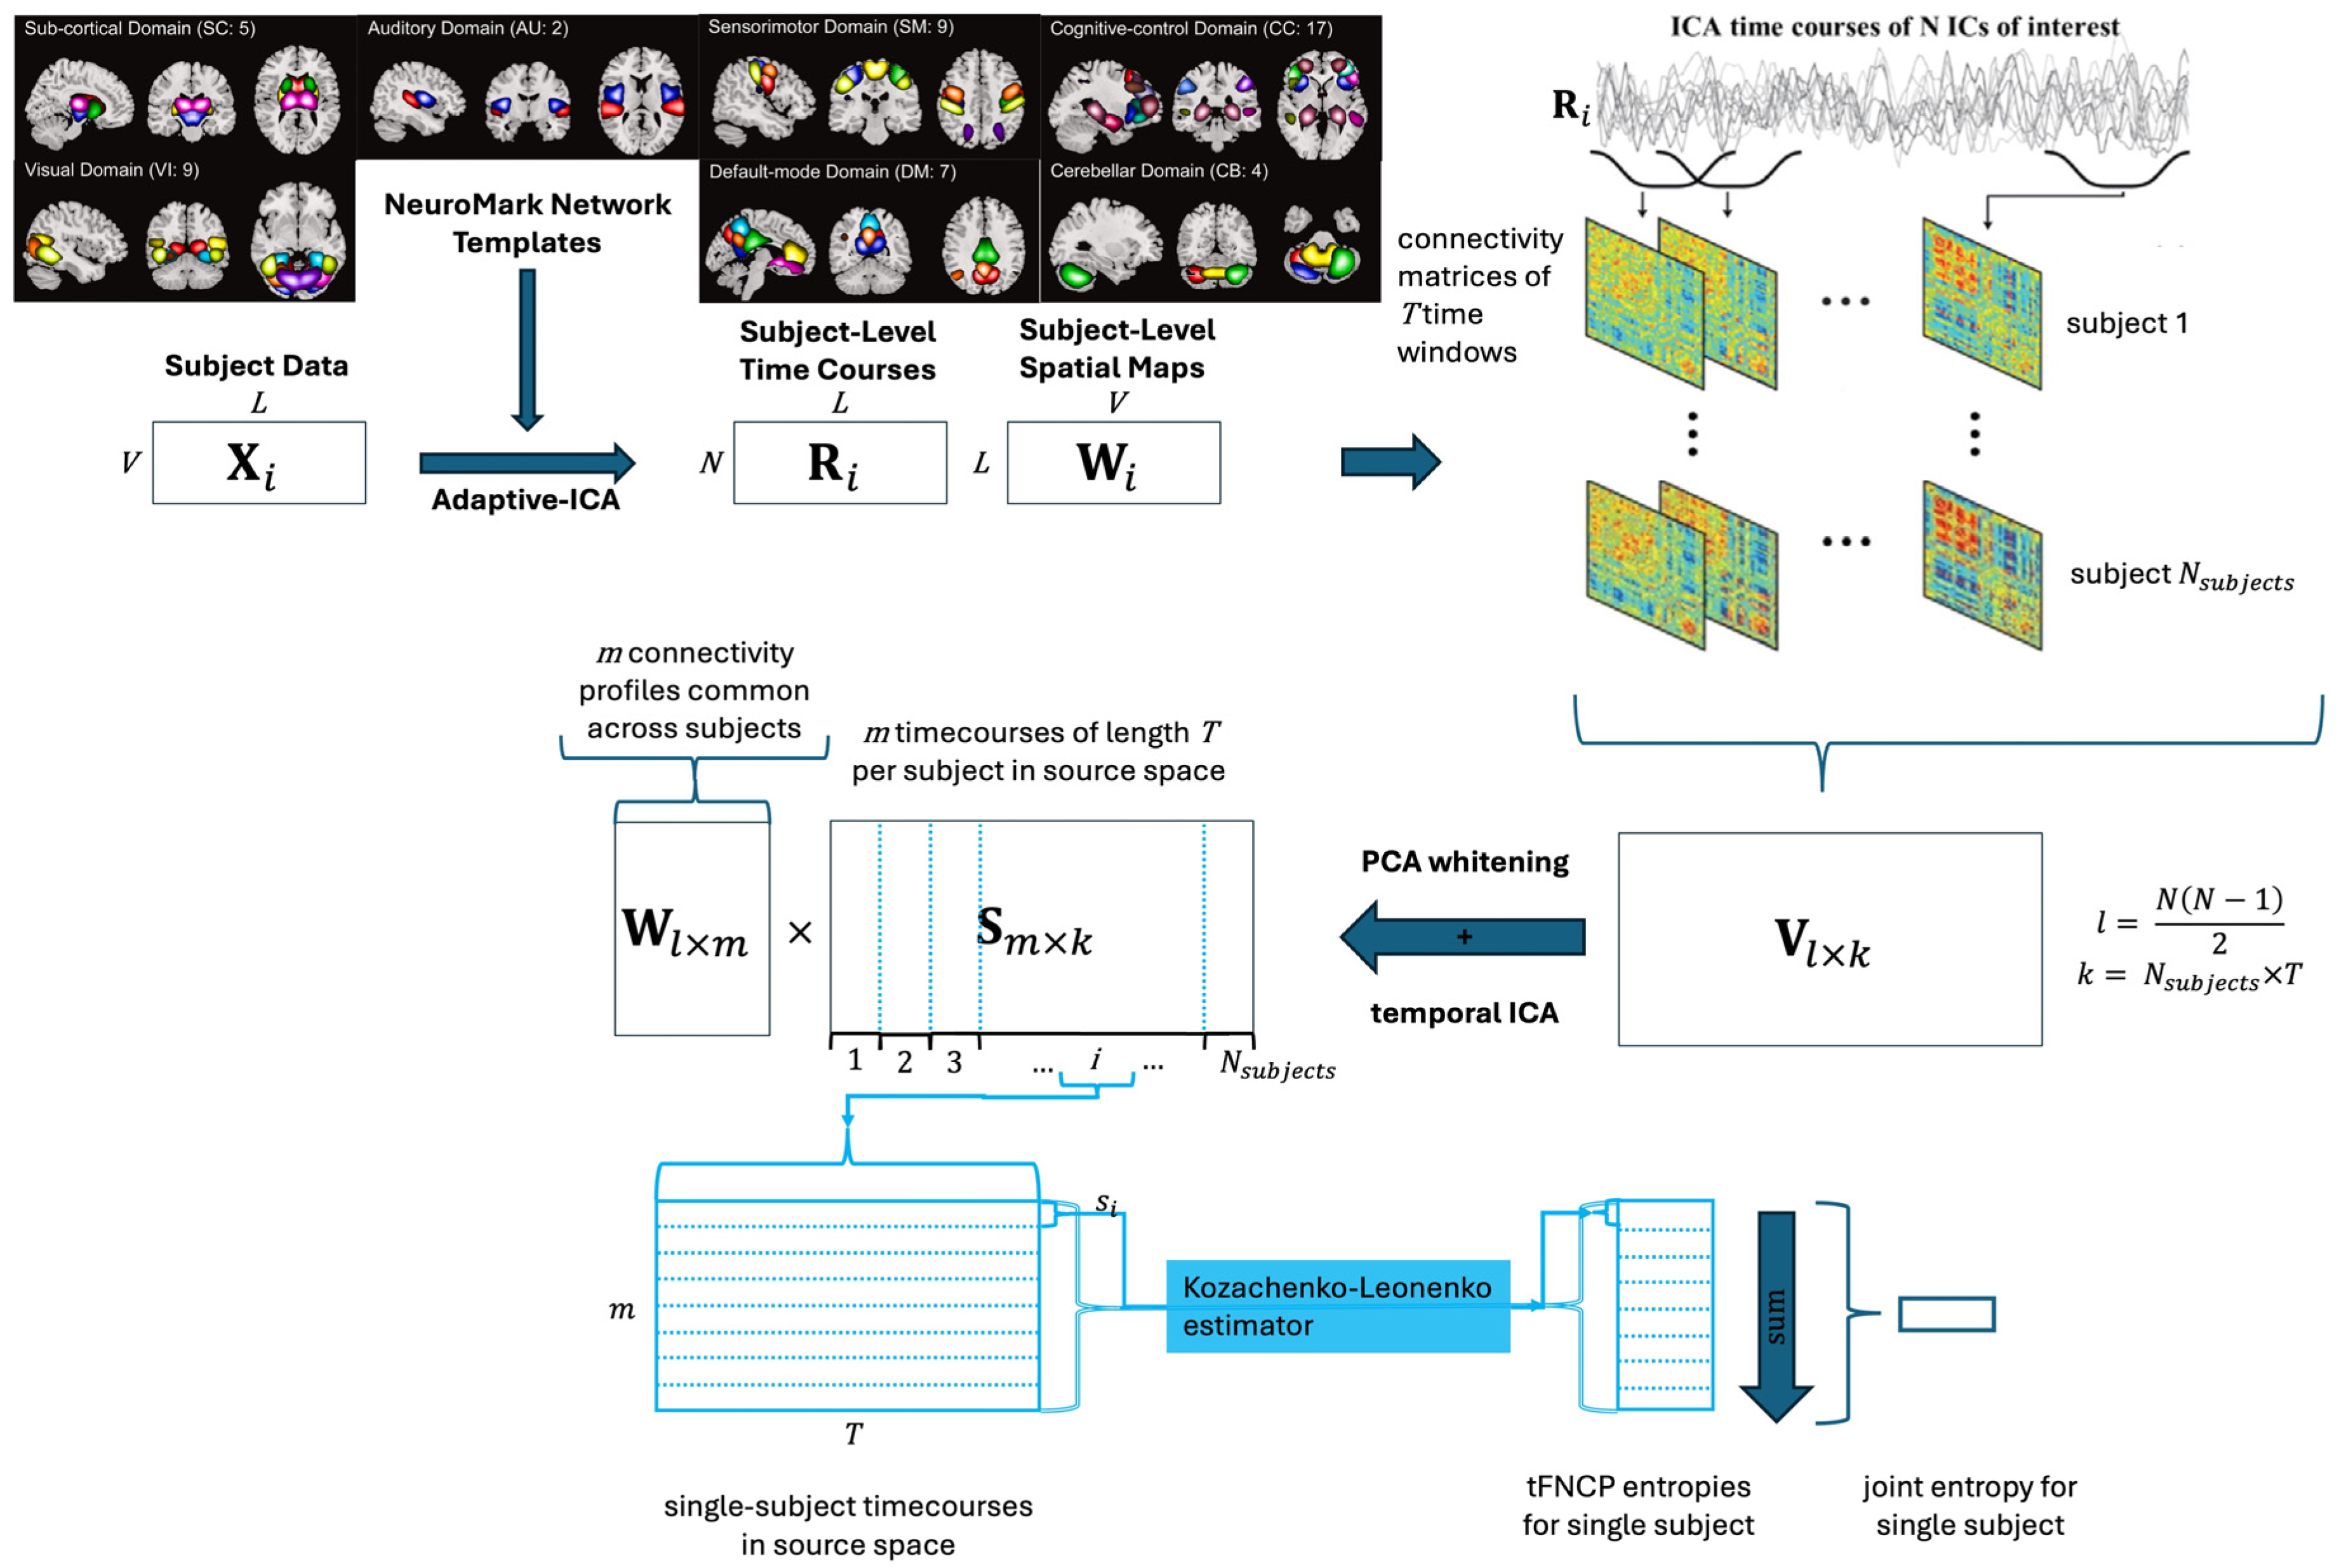
Figure 2.
Clinical and Cognitive Variable Relations. Correlation matrix of the clinical and cognitive variables assessed in the FBIRN dataset. The primary result is the consistently high correlation between cognitive scores (processing speed through CMINDS composite score). This high correlation informed the decision to only include the CMINDS score in our linear regression analysis, as including other cognitive variables would likely split the effect while providing little additional information. The low correlation between negative and positive PANSS scores is also of note, as it suggests considerable heterogeneity in subject symptom expression.
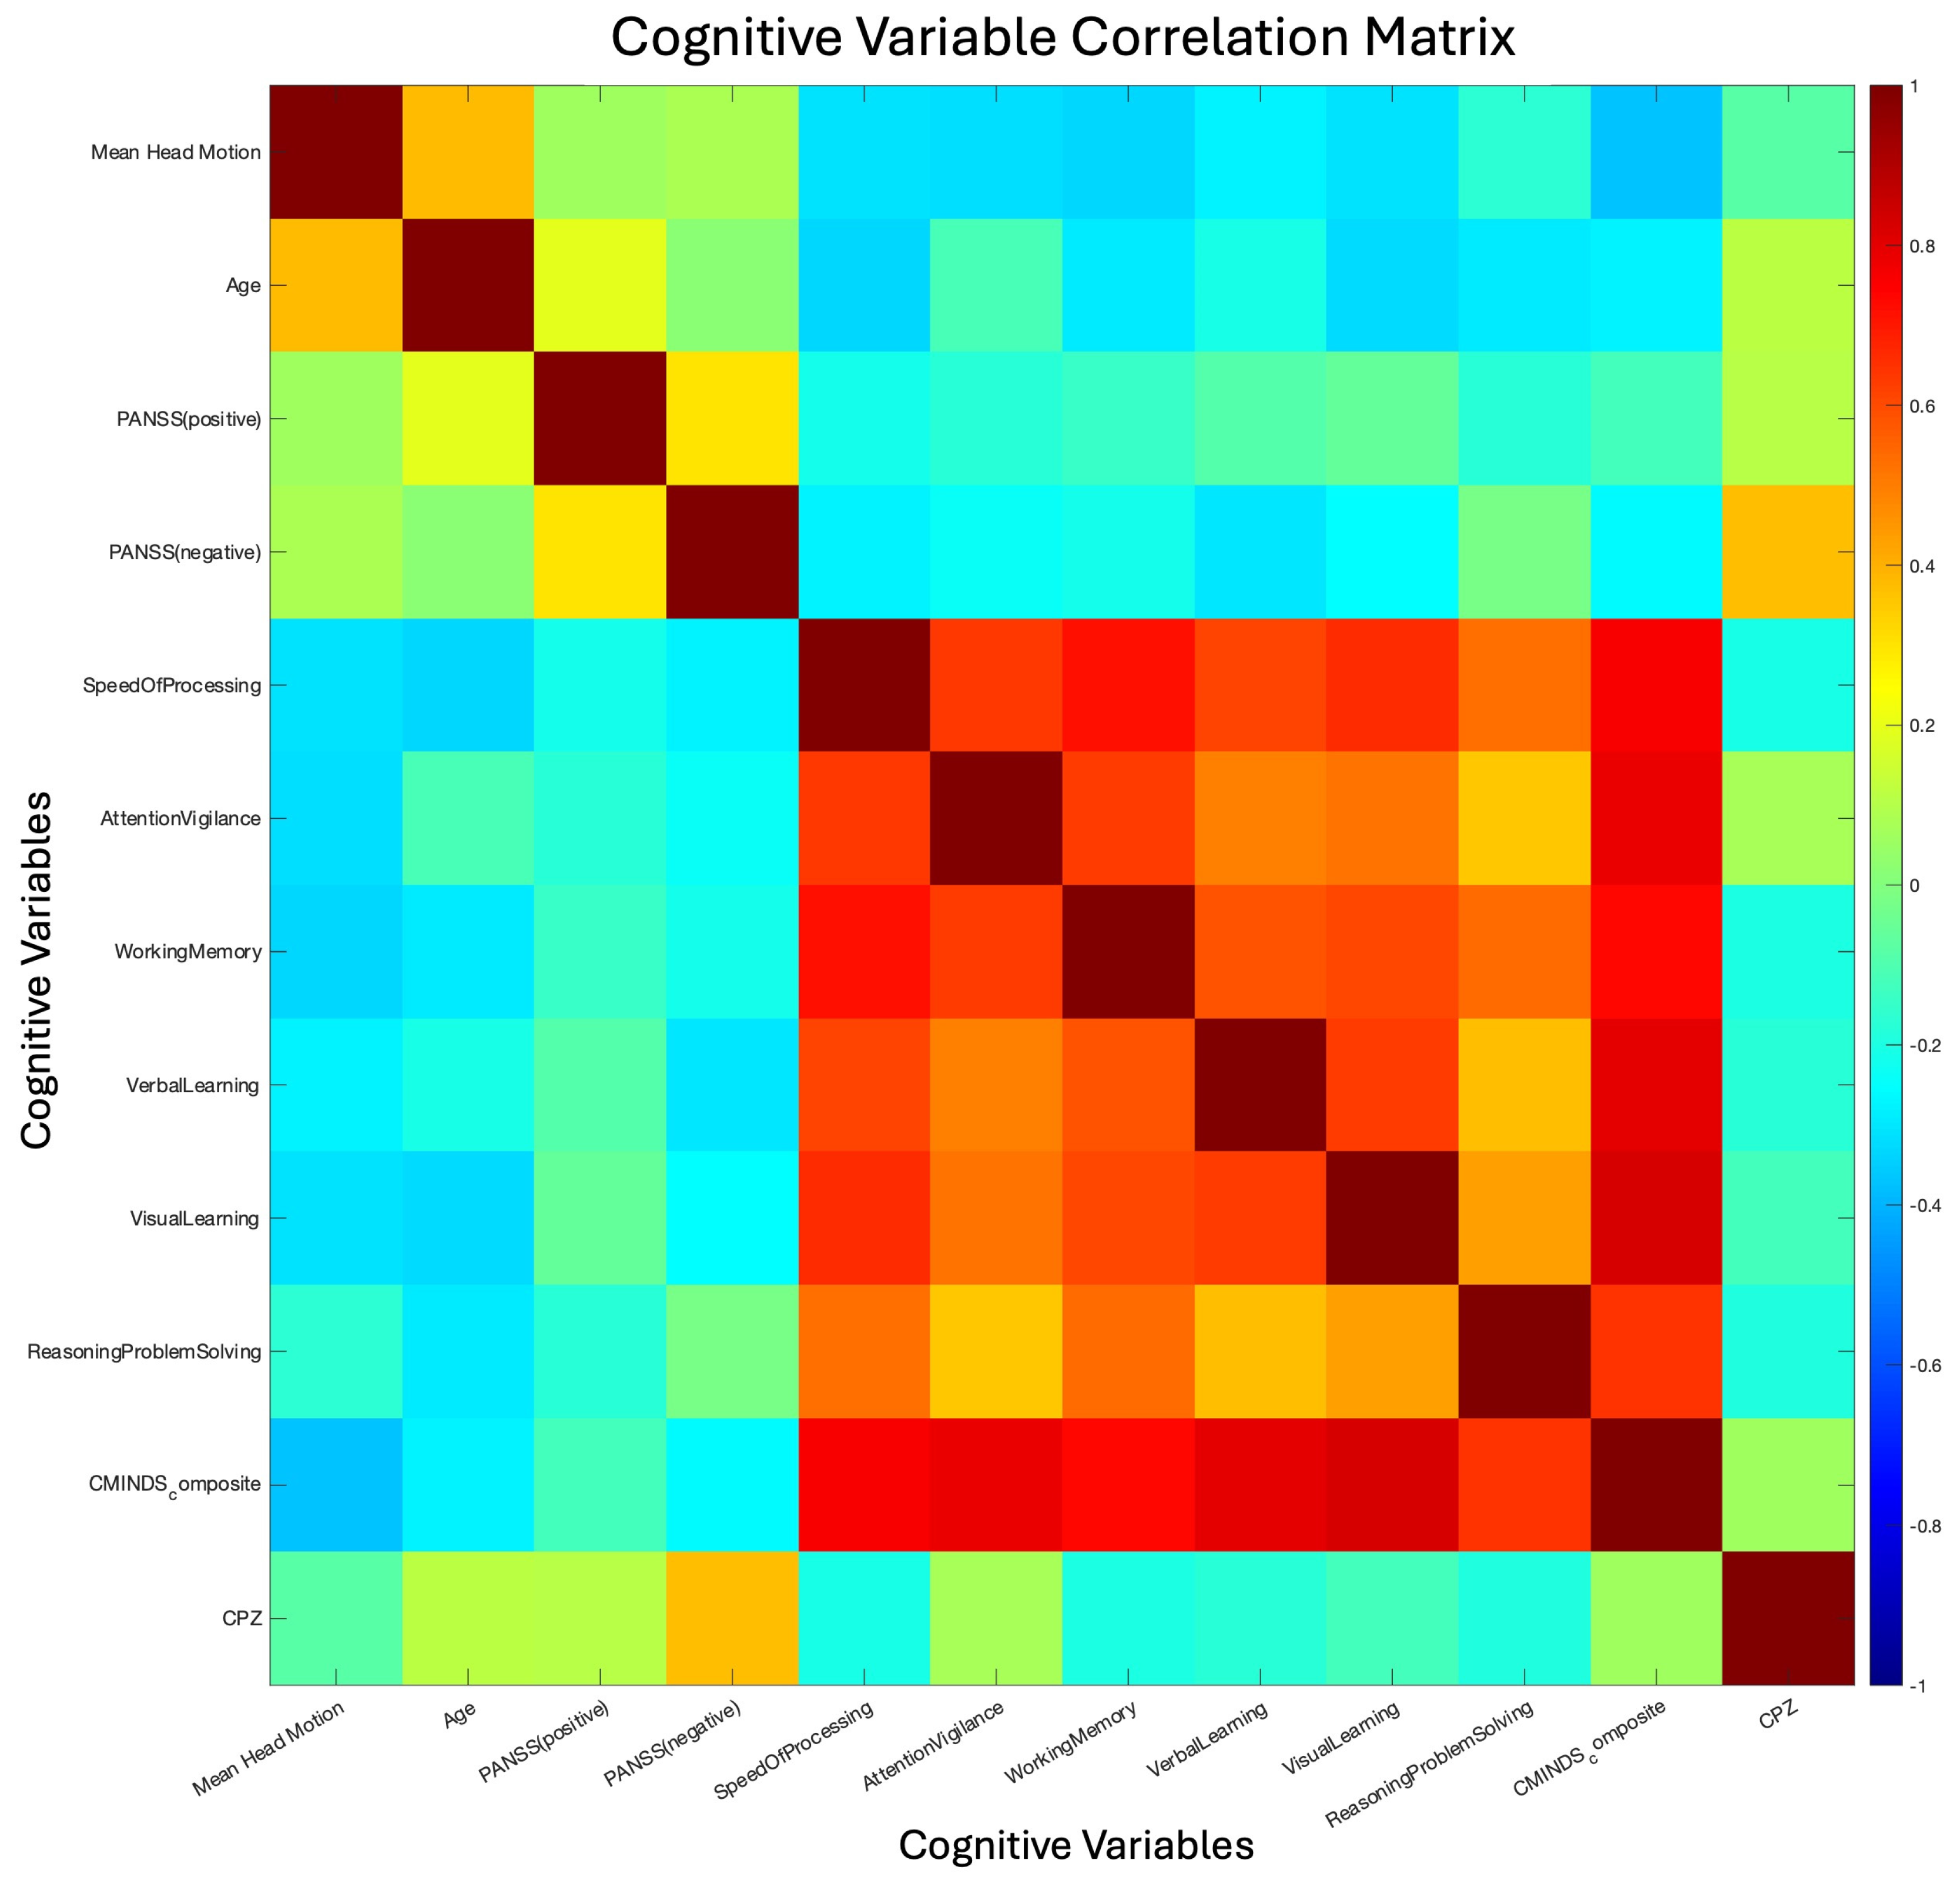
Figure 3.
Group-Level FNC and Joint Entropy. Results from group-level functional network connectivity (FNC) and joint entropy estimates. Panel A displays the connectivity matrices of the respective groups after mapping preprocessed fMRI images to the NeuroMark atlas [34]. Functional networks (FNs) are ordered and labeled according to their functional domains. Panel B displays the joint entropy distributions of each group in boxplot format. In line with previous work [32], healthy controls display substantially higher joint entropy than schizophrenia patients, suggesting reduced flexibility in patient connectivity and computation. Visual inspection suggests that schizophrenia patients’ functional connectivity is generally dampened compared to healthy controls, in line with the dysconnectivity hypothesis and its supporting work. Panels C, D, and E confirm this supposition by demonstrating increased variance in control static FNC and that controls show higher average sFNC magnitudes than patients.
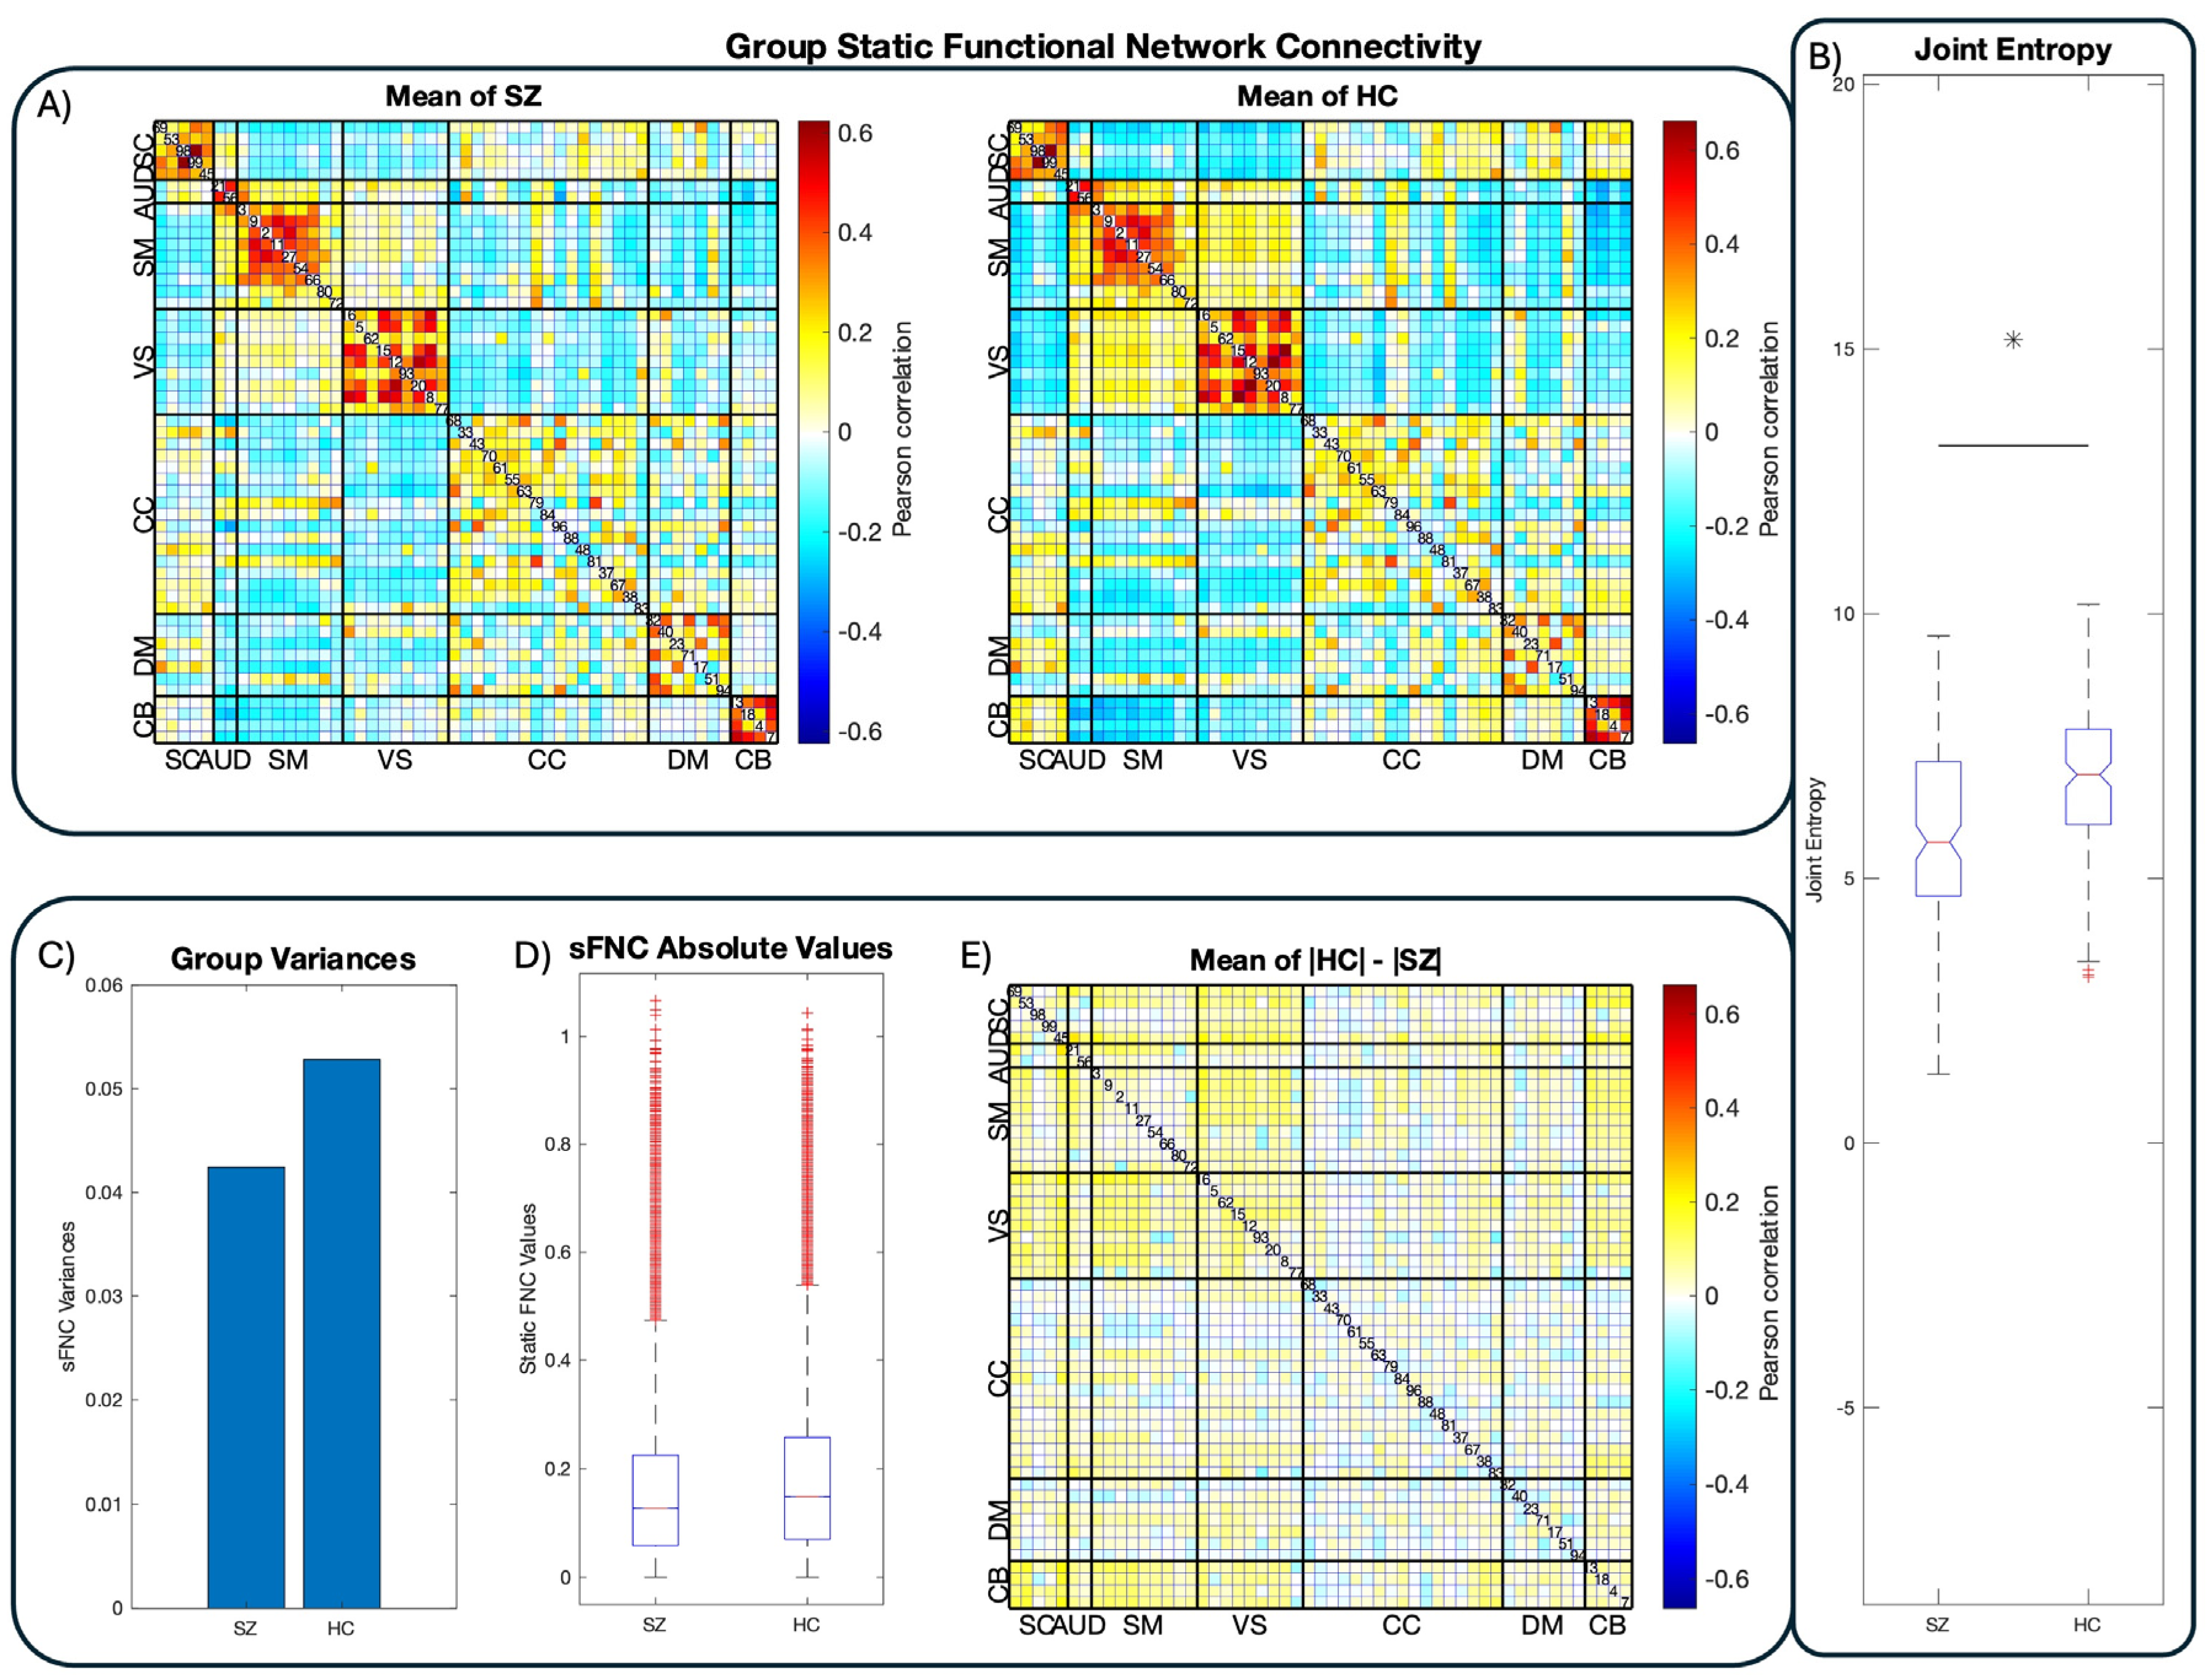
Figure 4.
tFNCP-Level maps and entropies. Our study finds eight tFNCPs shared between controls and schizophrenia patients. Five of these eight, outlined in red above, display significant group-level entropy rate changes. Entropy rate of tFNCP five, outlined in red and blue, also positively relates to the composite CMINDS cognitive score. Spatial maps of these tFNCPs are displayed in connectivity matrix format in row A and in connectogram format in row B. As shown in row C, patients exhibit significantly attenuated entropy in five tFNCPs. It is noteworthy that of these five tFNCPs, three display stable intra- and inter-domain correlation between visual, auditory, and sensorimotor domains. In all three cases, this block is strongly anticorrelated with at least one other domain: (part of) the cognitive control domain, the default-mode domain, or the cerebellar domain. The cognitive control domain also displays a distinct tendency to split into two largely separate networks, with weak autocorrelation and strong correlation or anticorrelation with other domains being present in four of five significant tFNCPs. Somewhat oddly, no tFNCP displays strong intra-domain correlation. High correlation values instead concentrate between domains, as seen in the cerebellar-subcortical block of tFNCP three (3). In fact, only two tFNCPs display high intra-domain correlation: numbers 4 and 5. Even within these tFNCPs, this is the exception rather than the rule, with tFNCP 4 showing high intra-domain correlation only in sensorimotor and visual domains and tFNCP 5 only in the default-mode networks.
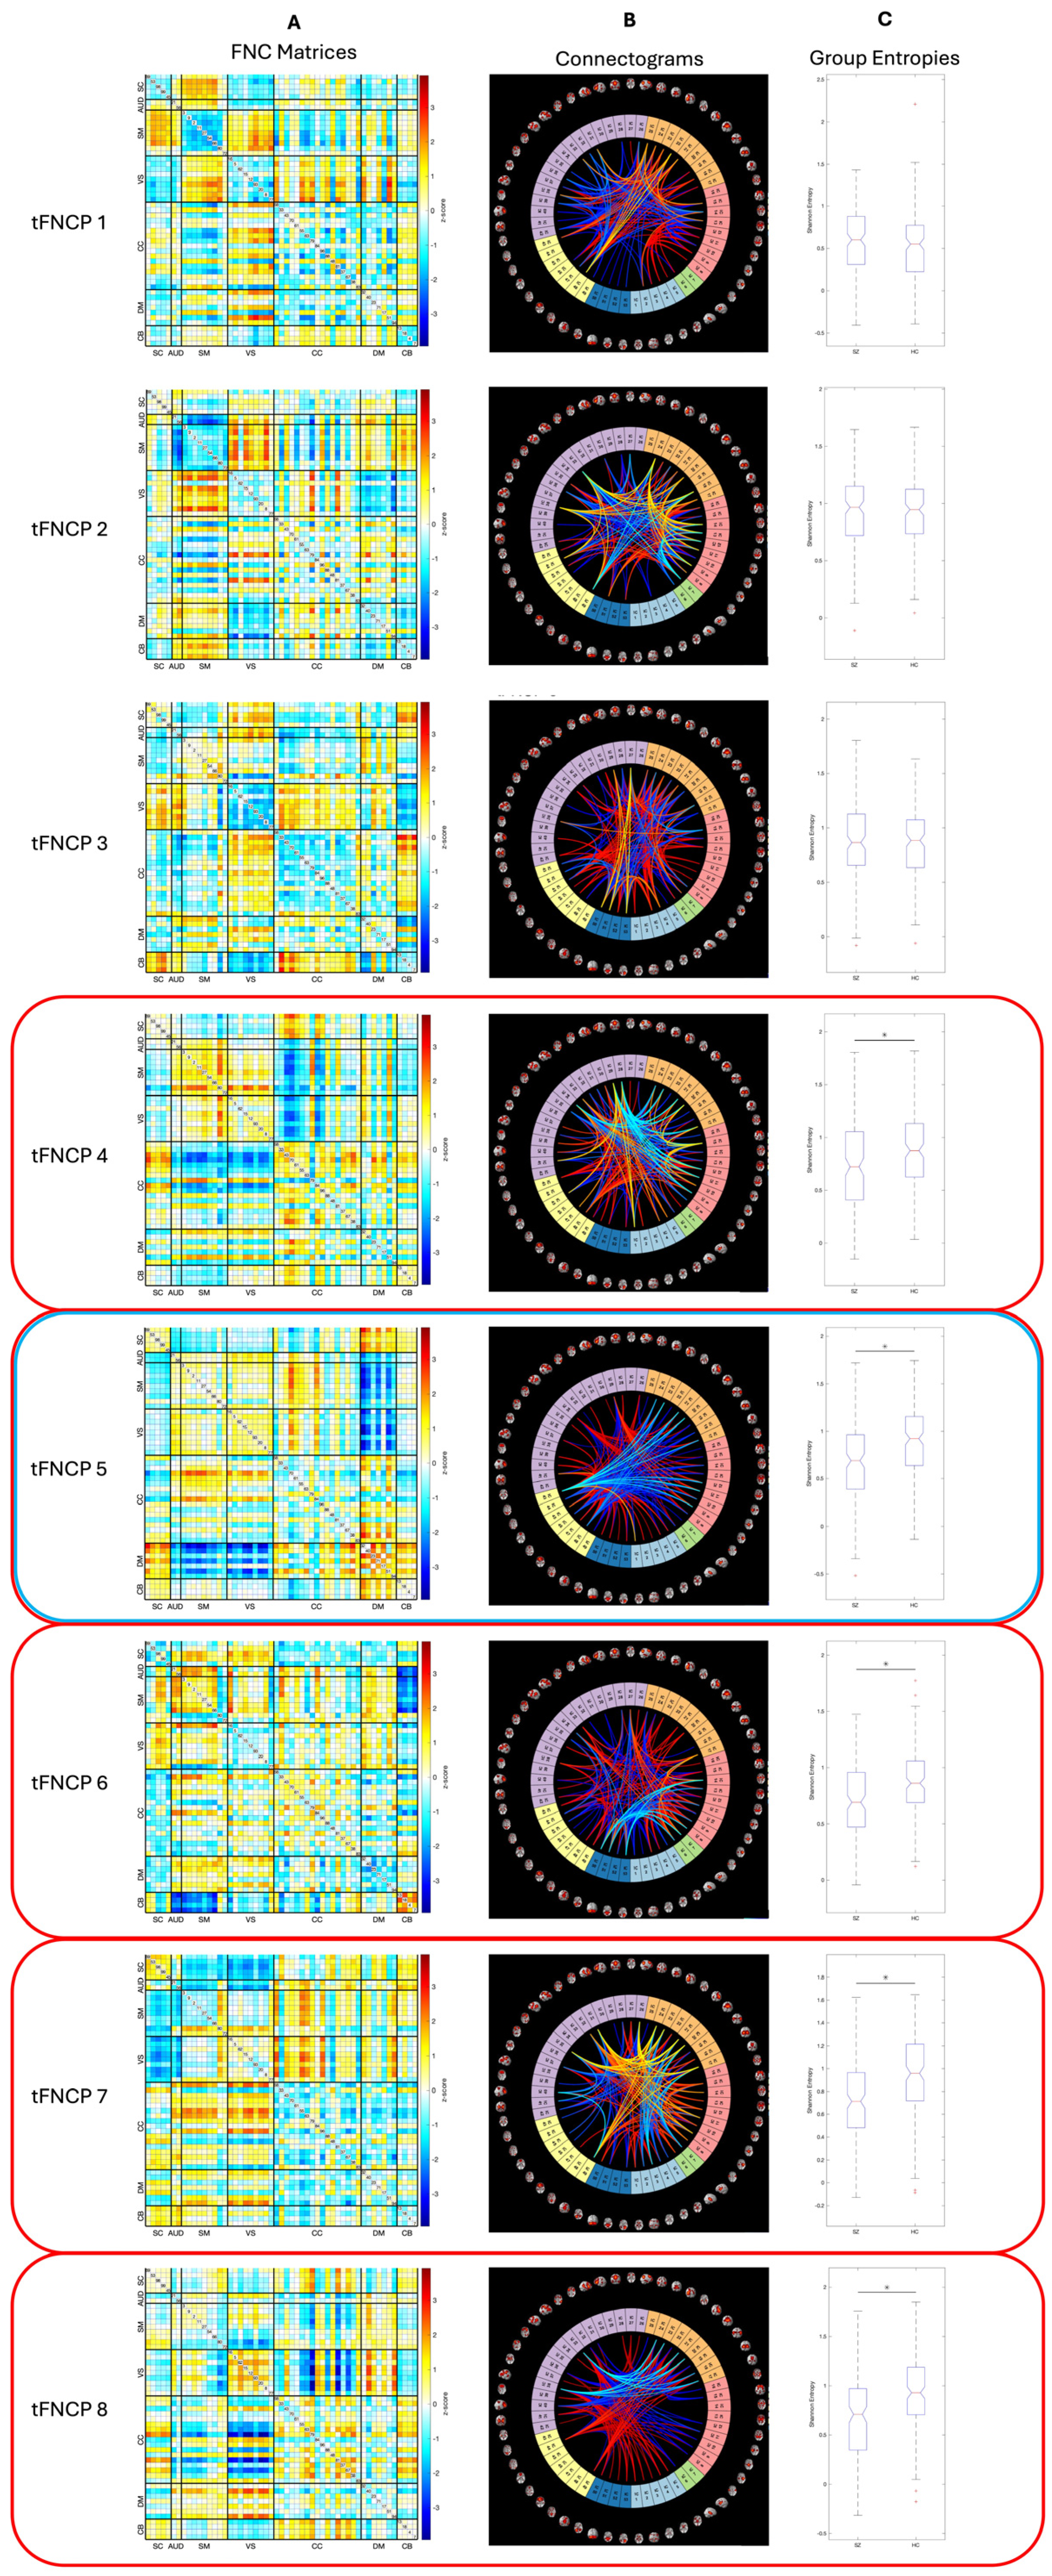

Table 1.
Group-level means, variances, and differences of tFNCP and joint entropies. Note that the difference between patient and control entropies reverses after tFNCP three (3), with control entropies becoming consistently greater than patient entropies. Note also that the magnitude of increases substantially in the last five tFNCPs.
| Mean ± Variance (Patients) | Mean ± Variance (Controls) | β ± standard error | |
|---|---|---|---|
| tFNCP 1 | 0.60064 ± 0.17609 | 0.53301 ± 0.15494 | 0.04467 ± 0.04456 |
| tFNCP 2 | 0.93204 ± 0.10030 | 0.93372 ± 0.09301 | 0.00388 ± 0.03498 |
| tFNCP 3 | 0.88852 ± 0.13293 | 0.84955 ± 0.10751 | 0.03043 ± 0.03877 |
| tFNCP 4 | 0.71817 ± 0.18799 | 0.89108 ± 0.12927 | -0.16376 ± 0.04556 |
| tFNCP 5 | 0.65917 ± 0.16392 | 0.88848 ± 0.12678 | -0.23097 ± 0.04298 |
| tFNCP 6 | 0.69955 ± 0.11751 | 0.86619 ± 0.08971 | -0.17171 ± 0.03671 |
| tFNCP 7 | 0.72430 ± 0.13709 | 0.93682 ± 0.13044 | -0.20885 ± 0.04164 |
| tFNCP 8 | 0.67983 ± 0.18125 | 0.94130 ± 0.13691 | -0.25684 ± 0.04519 |
| Joint Entropy | 5.90221 ± 2.58525 | 6.84015 ± 1.98335 | -0.95316 ± 0.17359 |
Table 2.
summary of linear regression and hypothesis test results from examining relation of entropy to subject diagnostic status. All applied tests produce similar results, namely highly significant relations between diagnostic status and the entropy rate of the last five tFNCPs. Directionality of these results is consistent with Table 1, with all tests showing higher entropy in control trajectories than those of schizophrenia patients. The consistency across multiple tests suggests high robustness of the proposed methodology.
| Regression | Student’s t-test | Kolmogorov-Smirnov test | Permutation test | |||||
|---|---|---|---|---|---|---|---|---|
| t-statistic | p | t-statistic | p | KS-statistic | p | Hodges’ G | p | |
| tFNCP 1 | 1.00243 | 0.31694 | NaN | N/A | 0.12219 | 0.18315 | 0.16623 | 0.14119 |
| tFNCP 2 | 0.11107 | 0.91164 | -0.04757 | 0.96209 | 0.04706 | 0.99435 | -0.00539 | 0.96050 |
| tFNCP 3 | 0.78467 | 0.43327 | 0.99200 | 0.32197 | 0.09868 | 0.41693 | 0.11238 | 0.32237 |
| tFNCP 4 | -3.59408 | 0.00038 | -3.83671 | 0.00015 | 0.20219 | 0.00288 | -0.43413 | 0.00030 |
| tFNCP 5 | -5.37432 | 1.55 × 10-07 | -5.31133 | 2.09 × 10-07 | 0.27111 | 1.55 × 10-05 | -0.60149 | 1.00 × 10-04 |
| tFNCP 6 | -4.67690 | 4.41 × 10-06 | -4.57202 | 7.00 × 10-06 | 0.28241 | 5.71 × 10-06 | -0.51771 | 1.00 × 10-04 |
| tFNCP 7 | -5.01616 | 9.04 × 10-07 | -5.12340 | 5.30 × 10-07 | 0.31515 | 2.49 × 10-07 | -0.58108 | 1.00 × 10-04 |
| tFNCP 8 | -5.68322 | 3.13 × 10-08 | -5.78981 | 1.73 × 10-08 | 0.29528 | 1.74 × 10-06 | -0.65556 | 1.00 × 10-04 |
| Joint Entropy | -5.49083 | 8.53 × 10-08 | -5.48028 | 8.82 × 10-08 | 0.31544 | 2.42 × 10-07 | -0.62058 | 1.00 × 10-04 |
Disclaimer/Publisher’s Note: The statements, opinions and data contained in all publications are solely those of the individual author(s) and contributor(s) and not of MDPI and/or the editor(s). MDPI and/or the editor(s) disclaim responsibility for any injury to people or property resulting from any ideas, methods, instructions or products referred to in the content. |
© 2024 by the authors. Licensee MDPI, Basel, Switzerland. This article is an open access article distributed under the terms and conditions of the Creative Commons Attribution (CC BY) license (http://creativecommons.org/licenses/by/4.0/).
Copyright: This open access article is published under a Creative Commons CC BY 4.0 license, which permit the free download, distribution, and reuse, provided that the author and preprint are cited in any reuse.


