
Submitted:
22 October 2025
Posted:
27 October 2025
You are already at the latest version
Abstract
Listeners vary in their perception of speech, falling along a continuum from categorical to continuous. We applied a Bayesian computational framework to model this individual difference in speech perception. We analyzed publicly available data (Honda et al., 2024) from 195 participants across four phonetic conditions using both two-alternative forced choice and visual analogue scale tasks. Our model characterizes each listener’s perception using two key parameters: perceptual warping (τ), the signal-to-noise ratio of phonetic encoding, and noise variance (\( \sigma_S^2 \)), a proxy to perceptual noise in experimental designs. Combining these two parameters revealed four perceptual profiles: Veridical (high τ, low \( \sigma_S^2 \)), Categorical (low τ, low \( \sigma_S^2 \)), Compensatory (low τ, high \( \sigma_S^2 \)), and Noisy (high τ, high \( \sigma_S^2 \)). These profiles predicted behavioral patterns coherently, while successfully distinguishing between listeners who would appear similar when characterized by behavioral measures alone. Critically, results revealed that profile distributions shifted dramatically based on phonetic conditions, with primary cues yielding a balanced mix of profiles and secondary cues producing distributions skewed heavily toward Veridical and Compensatory listeners (80%). Underscoring this flexibility, intraclass correlations for both τ and \( \sigma_S^2 \) were zero, with phonetic condition effects 30 times stronger for \( \sigma_S^2 \) (χ² = 803.91) than τ (χ² = 29.47). These findings challenge the traditional view of categorical perception as a fixed characteristic, demonstrating instead that it is a flexible, context-driven perceptual state.
Keywords:
speech perception
; categorical perception
; individual differences
; Bayesian modeling
; perceptual flexibility
1. Introduction
Speech perception represents one of the most remarkable achievements of human cognition, enabling listeners to extract meaningful linguistic information from a continuously varying and often noisy acoustic signal. While early theoretical frameworks emphasized the categorical nature of speech perception (Liberman et al., 1957), accumulated evidence suggests that speech perception may operate along a continuum, with listeners exhibiting varying degrees of sensitivity to fine-grained acoustic detail versus reliance on abstract categorical representations (Honda et al., 2024; Kapnoula et al., 2017, 2021; Kim et al., 2025; Kong & Edwards, 2016; Massaro & Cohen, 1983; Myers et al., 2024; Repp, 1981). Understanding individual differences along this categorical-continuous continuum has profound implications for theories of speech processing and language acquisition. Characterizing this variation is also essential for explaining perceptual patterns in clinical populations and language learners, where it has been linked to various communication and literacy challenges.
The present study develops Bayesian computational models to quantify where individual listeners fall along this perceptual continuum and to determine the stability of these individual differences across phonetic contexts. By formalizing the categorical-continuous distinction within a unified probabilistic framework, we can move beyond purely descriptive characterizations toward mechanistic accounts of individual variation. Furthermore, we investigate how these theoretically motivated Bayesian metrics relate to traditional behavioral measures including categorization slope steepness and response variability, thus providing both methodological validation and theoretical insight into the mechanisms underlying individual variation in speech perception.
1.1. Debates on categorical versus continuous perception
For over half a century, categorical perception (CP) has dominated frameworks for understanding how listeners transform gradient acoustic input into discrete phonetic categories. In its classic form, CP posits that listeners maintain sharp identification boundaries and show enhanced discrimination across category boundaries compared to within categories (Liberman et al., 1957). This view implies that fine-grained acoustic detail is largely discarded in favor of stable, abstract categorical representations. Similar categorical processing has been documented across numerous perceptual domains, including color (Davidoff et al., 1999), face (Angeli et al., 2008; Beale & Keil, 1995), shape (Gaißert et al., 2012), and emotion perception (Fujimura et al., 2012).
However, this strictly categorical view faces mounting empirical challenges (Apfelbaum et al., 2022; McMurray, 2022). The degree of CP varies substantially across speech sounds. While stop consonants provide the canonical example of strong CP, vowels, fricatives, and lexical tones tend to exhibit more continuous patterns (Abramson, 1961; Francis et al., 2003; Fry et al., 1962; Mann & Repp, 1980). Even for stop consonants, listeners remain sensitive to subphonemic acoustic detail, as evidenced by reaction time differences for within-category pairs (Pisoni & Tash, 1974), context effects (Miller, 1994), and neurophysiological responses (Toscano et al., 2010). Conversely, vowel perception, though relatively continuous, shows compression near phonetic category centers and expansion near boundaries (Iverson & Kuhl, 1995). These findings suggest that categorical and continuous perception may reflect different points along a continuum of category influence rather than representing a strict dichotomy (Kronrod et al., 2016).
Beyond documenting variation in the strength of CP, many researchers have questioned whether strict CP might be partly an artifact of task demands (Hary & Massaro, 1982; McMurray, 2022; Munson et al., 2017; Pisoni & Tash, 1974), particularly those inherent in the two-alternative forced choice (2AFC) identification task. In the task, participants classify stimuli from an acoustic continuum into one category or another. When a participant’s average response to each stimulus is plotted against actual changes in stimulus properties, the result yields an identification slope that can range from shallow to steep, indicating that responses are changing gradually or sharply with changes in stimuli. Steep identification slopes have traditionally been interpreted as reflecting CP, while shallow slopes have been linked to language impairments (Joanisse et al., 2000; Manis et al., 1997; Serniclaes et al., 2001; Werker & Tees, 1987) and illiteracy (Serniclaes et al., 2005). However, this traditional interpretation is confounded by the fact that slope steepness is highly sensitive to experimental variables beyond perception, including the continuum’s step size (Rosen, 1979), the response format (McMurray et al., 2008), and task context (Munson et al., 2017).
More critically, one fundamental limitation of the 2AFC task is that its output conflates two distinct aspects of perception: the mean of the listener’s perceptual judgment and its trial-to-trial variance. As McMurray (2022) and Apfelbaum et al. (2022) argue, a shallow slope can arise from two fundamentally different processes. On one hand, listeners may have categorical but noisy perception, where discrete internal category boundaries are corrupted by noise, causing inconsistent responses near the boundary. On the other hand, listeners may have gradient perception with probability matching, where they represent stimuli continuously but respond probabilistically to convey this gradient percept through binary responses. Both scenarios produce identical shallow slopes despite reflecting fundamentally different perceptual systems. Empirical research suggests that shallow 2AFC slopes may reflect inconsistent perception rather than the degree of categoricalness per se (Honda et al., 2024; Kapnoula et al., 2017).
To overcome these limitations, researchers have increasingly adopted the Visual Analogue Scales (VAS; Massaro & Cohen, 1983), which allow participants to indicate their percept by clicking on a continuous line anchored by two category endpoints rather than making discrete choices (Apfelbaum et al., 2022; Munson et al., 2012). The VAS task allows independent measurement of two distinct aspects of categorization behavior. The first is gradiency, captured by the mean slope of the VAS rating function, calculated by averaging ratings at each continuum step and fitting a psychometric function. A shallow VAS slope more clearly indicates true gradiency, as it reflects systematic differences in how stimuli within a category are judged. The second measure is response variability around the mean function, which captures the consistency of a listener’s responses (Kim et al., 2025; Myers et al., 2024). This is typically calculated as the mean squared residuals after fitting a function to a participant’s average responses.
This separation allows for the identification of listener profiles that would be confounded in 2AFC tasks. For example, a gradient-consistent listener exhibits a shallow mean VAS slope with low response variability, indicating high sensitivity to fine-grained acoustic detail and a precise, stable perceptual system. In contrast, a categorical-inconsistent listener also exhibits a shallow mean slope, but this average arises from high response variability, reflecting inconsistency in responding to ambiguous stimuli and potentially indicating a more categorical but noisy perceptual process.
While this shift in focus toward separate measurement of gradiency and response variability represents important progress, these descriptive metrics, though valuable, lack direct theoretical connection to the underlying mechanisms of speech perception. A single measure of response variability or consistency cannot independently characterize the categorical versus continuous nature of speech processing. Instead, both metrics must be considered jointly within a theoretical framework that specifies how categorical and continuous representations generate observable response patterns. Moreover, recent evidence suggests that these two metrics may have different properties as indices of individual differences (Kim et al., 2025; Myers et al., 2024). Specifically, Kim et al. (2025) tested listeners on eight different phonetic continua and found that individual response variability correlated far more strongly across continua (average r = .67) than mean slope did (average r = .36), suggesting that response variability may represent a more stable trait while gradiency adapts flexibly to specific phonetic contrasts.
This divergence between the stability of response variability and gradiency raises fundamental questions about the nature of individual differences in speech perception. If these two metrics reflect different levels of stability, it remains unclear whether categorical versus continuous perception represents a stable, domain-general trait or a context-dependent perceptual strategy that varies with the specific phonetic material being processed. Resolving this question requires moving beyond descriptive metrics toward computational models that can formalize how stable perceptual mechanisms give rise to both consistent and variable patterns of behavior across different phonetic contexts. The Bayesian framework for speech perception provides precisely this formalization.
1.2. Bayesian framework for quantifying perceptual warping
The Bayesian framework offers a mechanistically grounded approach that moves beyond describing behavioral patterns to explaining their origins. Modern theories have increasingly adopted Bayesian frameworks because they provide a principled account of how listeners should optimally integrate noisy sensory input with prior knowledge (N. H. Feldman et al., 2009; Kleinschmidt & Jaeger, 2015; Kronrod et al., 2016; Norris & Mcqueen, 2008). Within this framework, speech perception is an inference problem: recovering the speaker’s intended target production (T) from a noisy acoustic observation (S). Listeners combine the sensory evidence (likelihood) with their knowledge of speech sound distributions (prior) to arrive at an optimal percept (N. H. Feldman et al., 2009). The likelihood function p(S|T) represents how probable the observed signal is given different targets, while the prior p(T) captures accumulated knowledge about the probability distribution of target productions within categories.
Without categorical priors, listeners would assume perceived signals equal intended targets, since Gaussian noise is equally likely to shift signals in any direction. However, experienced listeners know that productions tend to cluster near category centers rather than being uniformly distributed across acoustic space. This knowledge leads to systematic bias of perceptual estimates toward category centers to achieve optimal inference, particularly for ambiguous or noisy signals. This principled bias produces perceptual warping, where acoustic changes near category centers are perceptually compressed while changes near boundaries may be enhanced. This warping effect, also known as the perceptual magnet effect (PME) in the vowel literature (Kuhl, 1991), provides a principled computational explanation for categorical phenomena without requiring a strictly discrete perceptual mechanism (N. H. Feldman et al., 2009).
The strength of this perceptual warping can be quantified by a single dimensionless parameter, tau (τ), defined as the ratio of meaningful category variance () to noise variance (). The meaningful variance represents within-category acoustic variability that conveys useful information to listeners, such as indexical cues about speaker identity, emotional state, and coarticulatory context, while the noise variance represents articulatory, acoustic, and perceptual noise that obscures the intended signal. The ratio τ = / determines the degree to which a listener should rely on their prior knowledge versus the incoming acoustic signal. Low τ values indicate that noise dominates meaningful signal variation, encouraging listeners to rely heavily on categorical priors and producing strong perceptual warping toward category centers. In contrast, high τ values indicate rich, reliable acoustic variation that warrants close attention to fine-grained signal details, resulting in weak perceptual warping and more veridical acoustic processing. Because τ is dimensionless, it enables direct quantitative comparisons of perceptual warping across different speech sounds and acoustic dimensions (Kronrod et al., 2016).
The constituent parts of τ are also mechanistically informative. The noise variance () represents articulatory, acoustic, and perceptual noise. When stimulus noise is held constant, individual differences in fitted values can be interpreted as a proxy for a listener’s internal perceptual noise, which may directly contribute to response variability. This framework can thus distinguish between listeners who exhibit similar behaviors for different underlying reasons. For example, two listeners can have identical shallow mean slopes, yet one may arrive at this mean through consistent, gradient ratings while the other arrives at it by inconsistently choosing extreme endpoints. The Bayesian model can mechanistically distinguish between these cases. The first listener might have high τ and low , indicating faithful acoustic tracking with reasonable perceptual precision, while the second might have low τ and high , indicating reliance on categorical priors combined with high perceptual noise. This distinction may be essential for accurately characterizing perceptual differences observed in clinical populations, developing language learners, and second-language speakers.
Despite its explanatory power, foundational work has primarily focused on modeling the modal listener by aggregating across participants (Feldman et al., 2009; Kronrod et al., 2016). This approach has been valuable for establishing general principles, but it may obscure systematic and stable variations in how individual listeners process the acoustic signal (Hazan & Rosen, 1991; Surprenant & Watson, 2001). With the advent of sensitive continuous measures like VAS tasks, researchers have explicitly documented a spectrum of performance, with some listeners showing highly gradient categorization and others showing more discrete, categorical behavior (Honda et al., 2024; Kapnoula et al., 2017, 2021; Kim et al., 2025; Kong & Edwards, 2016; Massaro & Cohen, 1983; Myers et al., 2024; Repp, 1981). These findings suggest that the degree of perceptual warping may not be a fixed property of the speech signal (Kronrod et al., 2016), but rather a characteristic that varies across individual listeners. While the potential of this approach is clear, there has been no systematic effort to use Bayesian parameters to directly characterize the landscape of individual differences in speech perception. For instance, Honda et al. (2024) provided a large-scale demonstration of these individual differences, showing that shallow 2AFC slopes often reflect inconsistent perception. However, while studies like Honda et al. (2024) have masterfully described the behavioral landscape of individual differences, they have not yet offered a unifying computational mechanism to explain why listeners occupy different points on this landscape. The descriptive metrics of gradiency and variability, though valuable, lack direct theoretical connection to the underlying inference processes.
1.3. The present study
The present study addresses this gap by applying the Bayesian framework to directly characterize individual differences in categorical-continuous perception. We used the theoretically grounded parameters from a Bayesian computational model to define listener profiles and then investigate their behavioral consequences and stability across phonetic contexts.
Specifically, we characterized each listener within a two-dimensional space defined by perceptual warping (τ) and perceptual noise (). Using a nonparametric quadrant analysis based on condition-specific medians, we identified four distinct perceptual profiles. First, Veridical listeners (high τ, low ) relied on a precise acoustic signal with minimal warping. Second, Categorical listener (low τ, low ) showed precise sensory input but nevertheless relied heavily on categorical priors. Third, Compensatory listener (low τ, high ) used priors to compensate for noisy sensory input. Fourth, Noisy listeners (high τ, high ) attempted to rely on an acoustic signal that was corrupted by perceptual noise.
This framework allows us to address three central research questions. First, what is the distribution of these four mechanism-based profiles, and does this distribution vary by phonetic context (vowels vs. consonants; primary vs. secondary cues)? Second, do these mechanistically defined profiles exhibit distinct and predictable behavioral patterns in terms of categorization slope and response variability? Third, are these model-based metrics stable individual traits, or do they represent flexible states that adapt to the phonetic context?
To address these questions, we analyzed a comprehensive dataset from Honda et al. (2024), who tested 195 participants across four conditions using both 2AFC and VAS tasks. The stimulus materials consisted of minimal pairs that were systematically manipulated along two acoustic dimensions relevant to each phonetic contrast: formant frequency (F1 and F2) and vowel duration for the /ɛ/-/æ/ (bet-bat) contrast, and voice onset time (VOT) and onset fundamental frequency (F0) for the /d/-/t/ (dear-tear) contrast (Clayards, 2018). We fitted a two-category Bayesian model to the trial-level data from each participant in each of the four conditions (2 speech contrasts × 2 acoustic cue types), yielding a unique set of τ and parameters. We then examined the stability of these profiles by quantifying the frequency of profile switching across conditions. Furthermore, we assessed the stability of both the τ and parameters themselves by calculating their intra-class correlation coefficients (ICC) and using likelihood ratio tests to determine if each parameter was better explained as a stable individual trait or a context-dependent state.
We predicted that listeners would cluster into distinct, interpretable perceptual profiles (Veridical, Categorical, Compensatory, Noisy) based on their combination of τ and . We hypothesized that the distribution of these profiles would not be fixed but would shift systematically across phonetic conditions. Specifically, we expected conditions relying on secondary cues (e.g., F0 for voicing) to skew toward profiles that rely heavily on priors (Compensatory) due to the noisier and less reliable nature of these cues. Given the recent evidence that gradiency is less stable than variability (Kim et al., 2025), we predicted that our model parameters would reflect a primarily context-dependent state rather than a stable individual trait. We expected low intraclass correlations for both τ and across conditions, with phonetic context accounting for significantly more variance than individual differences.
This study makes two primary contributions. Methodologically, it establishes a framework for studying individual differences in speech perception using theoretically grounded computational parameters rather than purely descriptive behavioral metrics. Theoretically, it provides the first large-scale characterization of how individual listeners vary in their categorical perception based on underlying mechanisms, advancing our understanding of the cognitive architecture that supports human speech perception and providing insights into the sources of individual variation in this fundamental ability.
2. Method
2.1. Data source and participants
We conducted secondary analysis of publicly available data from Honda et al. (2024). The original dataset included responses from 195 participants across two experiments (Experiment 1: n = 56; Experiment 2: n = 139) conducted between September 2020 and July 2021. All participants are right-handed, monolingual English speakers aged 18-35, born and living in the United States or Canada, with no history of head injury or literacy, language, cognitive, or hearing impairments. Participants were recruited through Prolific.co and completed the study online using their own headphones after passing a standardized headphone screening test.
We fitted individual Bayesian models to each participant’s data under each phonetic condition. To ensure model reliability, we excluded fits that failed to converge. Two participants had non-converging models across all four phonetic conditions and were excluded entirely, resulting in 193 participants. Our analyses used only converged model fits, yielding a final sample of 650 observations (model fits) from these 193 participants. A subset analysis restricted to participants with converged models in multiple conditions included 192 participants contributing 599 observations.
2.2. Stimuli and apparatus
The stimulus materials consisted of two minimal pairs: /ɛ/-/æ/ (bet-bat) and /d/-/t/ (dear-tear), with stimuli from Clayards (2018) publicly available at https://osf.io/369my/. Each minimal pair was manipulated along two relevant acoustic cues. For the vowel contrast (bet-bat), stimuli varied in formant frequency (F1: 625-740 Hz; F2: 1677-1556 Hz across 5 steps) and vowel duration (100-260 ms across 5 steps) (Table 1). For the consonant contrast (dear-tear), stimuli varied in voice onset time (10-50 ms across 5 steps) and onset fundamental frequency (185-225 Hz across 5 steps). Each acoustic cue was implemented in 5 discrete steps, and each level of the first cue was paired with each level of the second cue, resulting in a 5×5 factorial design with 25 unique stimuli per minimal pair.
2.3. Tasks and procedure
Participants completed two perceptual tasks using identical stimulus sets. In the 2AFC task, participants indicated via mouse click which of two words they heard on each trial (e.g., bet or bat), with response options counterbalanced across participants. In the VAS task, participants used a continuous slider scale with the two-word options positioned at opposite ends. Participants indicated their perceptual judgment by positioning the slider along the continuous scale, with responses coded from 0 to 100, though numeric values were not visible to participants during the task.
Each of the 25 stimuli from each minimal pair was presented 5 times in each task, resulting in 250 trials per task (125 trials per minimal pair). Stimuli were presented in blocks such that all 25 stimuli from both minimal pairs appeared in random order before any stimulus was repeated. All participants completed the VAS task before the 2AFC task to avoid potential categorical bias from the forced-choice format.
2.4. Data preprocessing
To isolate the effect of formant structure while maintaining sufficient statistical power, the two-dimensional acoustic space (F1, F2) for the vowel contrast was projected onto a single, continuous dimension (formant distance d) by calculating the cumulative Euclidean distance from the acoustic coordinates of formant step 1:
where F1₁ and F2₁ represent the F1 and F2 values of the first formant step. Acoustic stimuli were standardized within each condition to a common scale (typically 20-180) to improve numerical stability.
For the primary analysis focused on one acoustic dimension (e.g., formant distance for vowels, VOT for consonants), data were collapsed across the five levels of the secondary dimension (e.g., vowel duration for vowels, onset F0 for consonants) to maximize statistical power. This aggregation provided 25 trials per participant for each of the five primary acoustic steps, ensuring sufficient data for robust individual-level modeling while maintaining the critical acoustic contrast along the primary dimension.
2.5. Bayesian model of individual perceptual warping
Individual perceptual warping was quantified using a joint two-category Bayesian model that estimated parameters governing perceptual warping for each participant, based on the theoretical framework of Kronrod et al. (2016). The Bayesian framework implements optimal integration of sensory evidence with prior categorical knowledge, where listeners maintain uncertainty about both category locations () and stimulus identity (), leading to optimal Bayesian integration.
For the 2AFC identification task, we applied Bayes’ rule with equal prior probabilities to compute the posterior probability of Category 2 (i.e., bat and tear) given Stimulus S:
where and . Binary responses from the 2AFC task were modeled using a Bernoulli distribution with this probability as the linking function. For the VAS task, we computed the expected value of the target production given the stimulus:
VAS responses (bounded 0-100) were modeled using a normal distribution with mean equal to a linear transformation of E[T|S] and standard deviation :
where the linear transformation parameters (scale and intercept) account for individual differences in slider usage.
The Stan model simultaneously fit both 2AFC and VAS data for each participant, under each phonetic condition (2 speech contrasts × 2 acoustic cue types = 4 conditions per participant). Table 2 lists all estimated parameters and their prior distributions.
Prior distributions were weakly informative and tailored to each acoustic dimension. Table 3 lists all condition-specific prior distributions. All VAS parameters used: scale ~ N(0.5, 0.25-0.5), intercept ~ N(50, 20-30), ~ N(15, 5-10)T[1,], with wider priors for duration and F0 conditions.
The crucial τ parameter was derived as τ = /. Higher τ values indicate that meaningful category variability dominates over noise, leading to more continuous perception with weaker categorical warping. Lower τ values reflect greater influence from noise, causing stronger reliance on categorical priors and more pronounced warping effects. For each participant under each condition, we computed the final τ as the arithmetic mean of category-specific τ values: τavg = (τc1 + τc2)/2.
Models were fit using MCMC sampling via the rstan R package (Stan Development Team, 2025). We used 4 chains with chain-specific random initialization based on data characteristics. Initial settings employed 6,000 iterations (50% warmup) with strict convergence criteria (R̂ < 1.1, effective sample size > 100).
For models failing initial convergence, we implemented an adaptive fitting strategy with up to three attempts per participant, progressively increasing iterations (up to 20,000), warmup periods, adapt_delta (0.95 → 0.995), and max_treedepth (15 → 25). Initialization values were drawn from distributions centered on data-informed estimates with added random variation across attempts.
Participants were excluded from final analyses if their models failed to meet convergence criteria after all attempts. Pre-specified exclusion criteria included: (1) R̂ > 1.1 for any parameter; (2) effective sample size < 100 for any parameter; (3) insufficient data (< 10 observations per task); (4) Lack of response variability (single response value or near-zero variance); (5) Extreme parameter estimates defined as: category means beyond 3 standard deviations from the scaled stimulus range, or variance parameters (, ) exceeding 10 times the interquartile range of converged estimates within each condition. These criteria were established before model fitting to ensure only reliable parameter estimates were included.
2.6. Psychometric function analysis
We also extracted traditional psychometric measures (categorization slope and response variability) for comparison with Bayesian parameters. Following prior research (Fuhrmeister et al., 2023; Myers et al., 2024), four-parameter logistic functions were fit to VAS responses:
We employed Bayesian hierarchical models (brms package; Bürkner, 2017) allowing random effects for all four parameters across participants, with weakly informative priors: min, max ~ N(50, 25); boundary (xmid) ~ N(3, 2); slope ~ N(1, 0.5). Models used 4 chains, 2,000 iterations (50% warmup). Response variability was quantified as the mean squared residuals from the fitted models.
2.7. Statistical analysis
To identify individual differences in perceptual profiles, we conducted a quadrant-based analysis using two key parameters derived from the Bayesian model: perceptual warping (τ) and perceptual noise (). Rather than imposing predetermined cutoffs across all conditions, we adopted a data-driven approach that accounts for condition-specific differences in parameter distributions.
For each of the four experimental conditions (consonant primary cue, consonant secondary cue, vowel primary cue, vowel secondary cue), we calculated condition-specific medians for both τ and . These medians served as orthogonal boundaries to partition the parameter space into four quadrants, each representing a distinct theoretical listener profile: Veridical (high τ, low ), characterized by a strong reliance on precise acoustic signals; Categorical (low τ, low ), defined by a heavy reliance on categorical priors despite precise sensory input; Compensatory (low τ, high ), reflecting the use of priors to offset noisy sensory input; and Noisy (high τ, high ), describing an attempt to rely on acoustic signals that are corrupted by sensory noise. This condition-specific approach acknowledges that the same absolute parameter values may reflect different perceptual strategies depending on the acoustic properties and inherent difficulty of each listening condition.
To help interpret the behavioral consequences of these computational profiles, we analyzed two dependent variables: categorization slope and response variability. We used linear mixed-effects models implemented in the lmerTest package (Kuznetsova et al., 2017) in R (R Development Core Team, 2024), with listener profile as a four-level fixed factor and a random intercept for each participant to account for repeated measures. The model for slope showed a singular fit, indicating that random participant variance was negligible relative to residual variance. Tukey-corrected post-hoc comparisons were conducted using the emmeans package (Lenth, 2021) with Kenward-Roger degrees of freedom approximation.
To assess whether perceptual profile represents a stable individual trait or a flexible state, we analyzed profile membership for the participants whose Bayesian models converged on multiple conditions (N = 599 total observations). We calculated the proportion of participants who maintained the same profile across all their completed conditions versus those who switched profiles.
Additionally, we quantified the stability of the τ and parameters by calculating their Intra-class Correlation Coefficient (ICC) using variance components from null random-intercepts models. The ICC quantifies the proportion of total variance in a measure that is attributable to systematic, stable differences between individuals (Koo & Li, 2016). An ICC of 1 indicates that all variance is due to stable between-participant differences (a perfect trait), whereas an ICC of 0 indicates that none of the variance can be explained by such differences. We then used likelihood ratio tests to compare the null model against the model including condition as a fixed effect, testing whether condition-level variance in τ and significantly exceeded individual-level variance.
3. Results
3.1. Distribution of perceptual profiles across conditions
Using condition-specific median splits on τ (perceptual warping) and (perceptual noise), we identified four distinct perceptual profiles in each condition. The median τ values varied substantially across conditions, ranging from 0.22 for consonant secondary cues to 1.66 for vowel secondary cues, suggesting that the degree of perceptual warping is highly context-dependent. Similarly, median values ranged from 355.31 to 1934.53, indicating substantial variation in perceptual noise across phonetic contexts. Across all conditions pooled, the dataset included 240 Veridical observations (40.1%), 240 Compensatory observations (40.1%), 61 Categorical observations (10.2%), and 58 Noisy observations (9.7%). Notably, the distribution of these four profiles also varied substantially across phonetic contexts (Figure 1).
For the condition of consonant primary cue (VOT; median τ = 0.64, median = 355.31), the profiles were evenly distributed, with Veridical (n = 43) and Compensatory (n = 43) listeners being most common, followed by equal numbers of Categorical (n = 27) and Noisy (n = 27) listeners. A similar balanced pattern emerged for the vowel primary cue condition (formants; median τ = 1.37, median = 920.93), where Veridical (n = 53) and Compensatory (n = 53) listeners again dominated, with fewer Categorical (n = 17) and Noisy (n = 16) listeners.
In contrast, secondary cue conditions showed markedly skewed distributions. For the consonant secondary cue condition (onset F0; median τ = 0.22, median = 551.63), the vast majority of listeners were classified as either Veridical (n = 89) or Compensatory (n = 89), with very few Categorical (n = 7) or Noisy (n = 6) listeners. This pattern was somewhat less extreme but still pronounced for the vowel secondary cue condition (vowel duration; median τ = 1.66, median = 1934.53), with Veridical (n = 55) and Compensatory (n = 55) listeners predominating over Categorical (n = 10) and Noisy (n = 9) listeners. These distributional patterns suggest that when cues are more challenging to process (secondary cues), listeners gravitate toward the two most adaptive strategies: either capitalizing on a clear signal when available (Veridical) or relying on prior knowledge when sensory input is degraded (Compensatory).
We also investigated whether an individual’s perceptual profile constitutes a stable trait or a flexible adaptation to task demands. The results provide compelling evidence for strategic flexibility. Among the 176 participants whose individual modeling has converged on multiple conditions, only 20 (11.4%) maintained the same profile classification across all conditions, while 156 (88.6%) switched profiles at least once. The dynamics of these strategic shifts are visualized in Figure 2. The Sankey plot clearly shows that listeners frequently transitioned between all profile types rather than remaining in a single preferred state. Notably, there was no dominant transition pattern; listeners moved fluidly among all four profiles depending on the phonetic contexts. This high rate of profile switching suggests that perceptual profiles, as defined by condition-specific median splits, do not represent stable individual traits but rather reflect flexible, context-dependent strategies.
3.2. Linking computational profiles to behavioral measures
To understand how the four computationally-defined perceptual profiles manifest in traditional measures, we examined their corresponding categorization slopes and response variability derived from the VAS data (Figure 3).
For categorization slope, a linear mixed-effects model revealed a significant main effect of profile, F(3, 595) = 18.18, p < .001. Post-hoc comparisons showed that Categorical listeners exhibited the steepest slopes (M = 1.78, SE = 0.16), significantly steeper than Compensatory (M = 0.85, SE = 0.08, p < .001) and Veridical listeners (M = 0.63, SE = 0.08, p < .001). Noisy listeners showed intermediate slopes (M = 1.45, SE = 0.16) that also differed significantly from Compensatory (p = .006) and Veridical listeners (p < .001), but not from Categorical listeners (p = .470). Compensatory and Veridical listeners showed indistinguishable slopes (p = .189).
For response variability, a significant main effect of profile emerged, F(3, 569) = 12.21, p < .001. Specifically, Compensatory (M = 0.101, SE = 0.004) and Veridical (M = 0.100, SE = 0.004) listeners showed the highest variability, which did not differ significantly from each other (p = .999). In contrast, Categorical listeners showed the lowest variability (M = 0.057, SE = 0.008), significantly lower than both Compensatory (p < .001) and Veridical listeners (p < .001). Noisy listeners exhibited intermediate variability (M = 0.074, SE = 0.008) that differed significantly from Compensatory (p = .012) and Veridical listeners (p = .014), but not from Categorical listeners (p = .386).
These results reveal a dissociation between slope and response variability patterns across profiles. Categorical listeners showed steep slopes with low variability, consistent with precise categorical perception. While Veridical and Compensatory listeners were behaviorally indistinguishable (i.e., both showing shallow slopes and high variability), the model assigned them to distinct quadrants based on their underlying parameters. This demonstrates that the Bayesian framework can disentangle the mechanistic origins of similar behavioral patterns: shallow slopes and high variability can arise either from a precise, detail-oriented strategy (Veridical: high τ, low or from a strategy that relies on categorical priors to compensate for a noisy signal (Compensatory: low τ, high ).
3.3. Stability of Bayesian parameters across conditions
To assess whether the underlying Bayesian parameters themselves showed individual stability beyond profile classifications, we calculated intraclass correlation coefficients (ICC) and conducted likelihood ratio tests comparing null models with random intercepts for participants against models that additionally included fixed effects of condition.
For τ (perceptual warping), the ICC was 0.000, indicating that 0% of the variance in τ was attributable to stable between-participant differences. The likelihood ratio test strongly favored the condition model over the null model, χ²(3) = 29.47, p < .001, demonstrating that phonetic context was a highly significant predictor of τ. Both models showed singular fit warnings, suggesting that the random effect variance for participants was estimated at or near zero, further confirming the absence of stable individual differences in τ.
Similarly, for (perceptual noise), the ICC was also 0.000, with no variance attributable to stable individual differences. The likelihood ratio test again strongly favored the condition model, χ²(3) = 803.91, p < .001, indicating that phonetic context was an even stronger predictor of than of τ. Singular fit warnings for both models reinforced that participant-level random effects were negligible.
The comparative stability analysis revealed that both parameters showed comparable (essentially zero) stability across contexts. Neither τ nor functioned as stable individual traits in this dataset. Instead, both parameters varied substantially as a function of phonetic context, with condition explaining the vast majority of variance in both cases. The substantially larger chi-square value for (803.91 vs. 29.47) suggests that perceptual noise may be even more context-dependent than perceptual warping.
4. Discussion
The present study applied a Bayesian computational framework to characterize individual differences in speech perception along the categorical-continuous continuum. We analyzed data from 195 participants across four phonetic conditions, fitting a two-category Bayesian model to both two-alternative forced choice (2AFC) identification and Visual Analogue Scale (VAS) rating data. This approach yielded two theoretically grounded parameters for each participant in each condition: τ (perceptual warping, representing the ratio of meaningful category variance to noise variance) and (perceptual noise). By positioning listeners within a two-dimensional space defined by these two parameters, we identified four distinct perceptual profiles: Veridical listeners (high τ, low ), Categorical listeners (low τ, low ), Compensatory listeners (low τ, high ), and Noisy listeners (high τ, high ).
We have three key findings. First, these mechanistically defined profiles exhibited theoretically coherent behavioral patterns that validated their interpretation, successfully distinguishing between listeners who would appear similar when characterized by behavioral measures alone. Second, the distribution of profiles varied dramatically across phonetic contexts, with primary cues producing relatively balanced distributions while secondary cues showed extreme skewing toward Veridical and Compensatory profiles. Third, and perhaps most surprisingly, neither the profiles themselves nor the underlying Bayesian parameters (τ and ) showed meaningful stability across conditions. Both parameters exhibited zero intraclass correlation coefficients (ICC) and were strongly influenced by phonetic context, suggesting that perceptual profile in speech perception are highly flexible and context-dependent. These findings challenge the notion that categorical versus continuous perception reflects a fixed property of individual listeners and instead suggest that listeners dynamically adjust their perceptual strategies based on the specific demands of different phonetic contrasts.
4.1. Bayesian perceptual profiles dissociate what behavior conflates
A central contribution of our approach is demonstrating that Bayesian parameters provide mechanistic insight beyond what can be gleaned from purely behavioral measures. The behavioral validation results confirmed that our four profiles exhibited distinct and theoretically predictable patterns in both categorization slope and response variability, revealing how the computational framework adds explanatory value.
The most striking finding concerns the dissociation between profiles that share similar behavioral patterns but differ in underlying mechanisms. Consider first the comparison between Compensatory and Veridical listeners. Both profiles showed statistically indistinguishable slopes (0.85 vs. 0.63) and the highest response variability among all profiles (approximately 0.10), yet they differed dramatically in their underlying mechanisms. The critical insight here is that both profiles show shallow slopes, but for opposite reasons. This directly addresses a longstanding challenge in the speech perception literature. As suggested by McMurray (2022) and Apfelbaum et al. (2022), shallow slopes can arise from two fundamentally different processes. Our Bayesian framework provides a principled solution to this ambiguity by explicitly modeling both aspects within a unified probabilistic framework and separating their contributions. Veridical listeners show shallow slopes because they are tracking fine-grained acoustic variation (high τ), with their high response variability reflecting genuine sensitivity to acoustic differences across the continuum. This corresponds to the gradient perception scenario described by McMurray (2022) and Apfelbaum et al. (2022). Compensatory listeners show similarly shallow slopes, but their high response variability reflects perceptual noise (high ) rather than acoustic sensitivity. This corresponds to the categorical-but-noisy perception scenario. The model successfully captures this mechanistic distinction that would be invisible in purely behavioral analyses, resolving a theoretical ambiguity that has persisted in the literature for decades.
Now consider the comparison between Categorical and Noisy listeners, which demonstrates how similar behavioral patterns can also emerge from different mechanisms at the opposite end of the slope continuum. Categorical listeners (low τ, low ) showed the steepest slopes (1.78) with the lowest variability (0.057), consistent with precise categorical perception where discrete category boundaries drive consistent responses. Noisy listeners (high τ, high ) also showed relatively steep slopes (1.45), with intermediate variability (0.074) that did not differ significantly from Categorical listeners (p = .386).
At first glance, this similarity seems paradoxical: how can listeners with high τ (gradient perception) produce steep slopes similar to those with low τ (categorical perception)? The answer may lie in understanding how perceptual noise affects the translation from internal representations to behavioral responses. Noisy listeners attempt to track acoustic detail (high τ), but their substantial perceptual noise (high ) introduces random variation that obscures the gradient acoustic information. When averaged across trials, this noise-corrupted gradient perception can produce relatively steep mean slopes because the noise randomly pushes ambiguous stimuli toward one category or the other, creating an apparent boundary. However, the underlying mechanism is fundamentally different: Categorical listeners have a true internal boundary that consistently guides responses, while Noisy listeners have gradient representations that are intermittently disrupted by noise. The similar response variability between these profiles suggests that low perceptual noise combined with categorical representations (Categorical) and high perceptual noise obscuring gradient representations (Noisy) can produce comparable response variability patterns, despite reflecting entirely different perceptual architectures. This distinction would be impossible to make based on behavioral measures alone, as both steep slopes and moderate variability could arise from either precise categorical perception or noisy gradient perception.
These distinctions have important implications for understanding individual differences in clinical and developmental populations, where atypical slope patterns have often been interpreted as evidence of impaired CP (Joanisse et al., 2000; Manis et al., 1997; Serniclaes et al., 2001; Werker & Tees, 1987). Our findings suggest that researchers should be cautious about inferring perceptual mechanisms from slopes or response variability alone, as similar behavioral patterns can reflect either noisy categorical perception, gradient perception with varying degrees of sensory precision, or compensatory use of priors. The Bayesian framework provides a principled way to distinguish these mechanistically different sources of atypical performance, which may be critical for developing targeted interventions in clinical populations or for understanding the challenges faced by second-language learners who must acquire new phonetic categories.
It is important to note that our profile classification focused on the two-dimensional space defined by τ and , but the meaningful category variance () also varies across listeners and conditions and contributes to the overall pattern of results. The Bayesian model estimates all three parameters jointly, and τ itself is defined as the ratio /. Thus, two listeners with identical τ values might arrive at that ratio through different absolute values of and . For instance, one listener might have = 400 and = 400 (yielding τ = 1), while another has = 1600 and = 1600 (also yielding τ = 1). Both would be classified identically in terms of τ, but they differ in the absolute magnitudes of both signal and noise. The first listener perceives relatively tight category distributions with modest perceptual noise, while the second perceives broader category distributions with greater perceptual noise. These differences in absolute variance could influence response variability and other behavioral measures in ways not fully captured by τ alone. Future research might profitably examine whether systematic individual differences emerge in the absolute values of and independent of their ratio, and whether such differences predict additional variance in behavioral measures or relate to other cognitive or perceptual abilities. For the present study, focusing on τ and provided a theoretically motivated decomposition that successfully distinguished mechanistically distinct profiles while maintaining interpretive clarity.
4.2. Context-dependent and asymmetric distribution of perceptual profiles
The distribution of perceptual profiles varied dramatically across phonetic contexts, revealing that the categorical-continuous continuum is not uniformly populated across different speech contrasts. Primary cues (formants for vowels, VOT for consonants) produced relatively balanced distributions across all four profiles, while secondary cues (duration for vowels, onset F0 for consonants) showed extreme skewing, with the vast majority of listeners classified as either Veridical or Compensatory.
This pattern suggests that secondary cues elicit fundamentally different perceptual strategies than primary cues. The near-absence of Categorical listeners in secondary cue conditions (only 7 for consonant secondary, 10 for vowel secondary) indicates that few listeners exhibit strong categorical priors for these cues. Instead, most listeners either track the acoustic signal faithfully (Veridical) or use weak priors to compensate for noisy input (Compensatory). This makes theoretical sense given that secondary cues, while informative, are typically less reliable and more variable in natural speech than primary cues. Listeners may have learned through experience that secondary cues exhibit greater within-category variability(Holt & Lotto, 2006; Lisker & Abramson, 1964; Toscano & McMurray, 2010), leading to higher τ values (weaker categorical influence) and more veridical acoustic tracking.
The median τ values across conditions provide direct evidence for this interpretation. For consonant secondary cue, median τ was only 0.22, while for vowel secondary cue it reached 1.66. These values bracket the primary cue conditions (0.64 for consonant primary, 1.37 for vowel primary), suggesting substantial variation in the strength of categorical influence across contexts. Notably, these secondary cues appear to serve different functional roles and carry different informational value in their respective phonetic contexts. For consonants, onset F0 can cue voicing categories but is considerably less weighted than VOT. Research has consistently shown that listeners rely predominantly on VOT when both cues are available, with onset F0 serving more as a secondary or redundant cue that may be recruited primarily when VOT information is ambiguous or degraded (Abramson & Lisker, 1985). For vowels, duration serves as a secondary cue that is less weighted than formant frequencies but nevertheless carries substantial phonetic information and can be reliably used by listeners to support vowel identification, particularly for tense-lax vowel contrasts (Hillenbrand et al., 2000). The extremely high median τ for vowel duration (1.66) suggests that listeners process this cue in a highly gradient manner, likely because duration exhibits considerable within-category variability influenced by speaking rate, stress patterns, and phonetic context, making categorical priors less informative than faithful acoustic tracking.
Beyond the context-dependency, the distribution of profiles was highly asymmetric, with Veridical (40.1%) and Compensatory (40.1%) profiles accounting for over 80% of all observations. The relative rarity of the Categorical (10.2%) and Noisy (9.7%) profiles is theoretically illuminating. The Categorical profile (low τ, low ) represents a listener who relies heavily on prior knowledge despite having access to a high-fidelity acoustic signal. This may be a suboptimal strategy in most communicative contexts where fine-grained acoustic detail is informative for recognizing words, talkers, and emotional states (McMurray, 2022). This finding presents a challenge to classic theories of CP, which implicitly framed categorical processing as an idealized endpoint of speech processing, a mechanism to achieve perceptual constancy (Liberman et al., 1957; Repp, 1984). However, decades of research have shown that listeners are sensitive to and make use of fine-grained, within-category acoustic detail, refuting the strongest claims of CP (Goldinger, 1998; McMurray, 2022). Our data provide empirical support for this modern critique: the rarity of the Categorical profile suggests that ignoring a clear signal is not an optimal or default mode of perception but a specific, and relatively uncommon, strategic choice.
The Noisy profile (high τ, high ), which represents an attempt to rely on a degraded signal, is arguably the least adaptive strategy and was correspondingly rare. This pattern may reflect a failure in metacognitive monitoring, where a listener does not accurately assess the unreliability of their sensory input (Xue et al., 2024). Notably, both of these suboptimal profiles became even rarer when listeners processed secondary, less reliable acoustic cues (Categorical: 3.7–7.8%; Noisy: 3.1–7.0%), suggesting that listeners engage in more deliberate strategy selection when tasks become more challenging. Listeners appeared to gravitate toward the two most effective strategies: leveraging a clear signal when possible (Veridical) or falling back on prior knowledge when the signal is degraded (Compensatory).
4.3. Categorical perception is a flexible state, not a stable trait
Perhaps the most striking finding of our study is that neither τ nor showed meaningful stability across phonetic contexts. Both parameters exhibited zero intraclass correlation coefficients (ICC = 0), indicating that essentially all variance was due to condition differences rather than stable individual differences. This conclusion is further supported by the singular fits observed in our mixed-effects models: the negligible between-participant variance suggests that individual tendencies are dwarfed by condition-specific adaptations. If perceptual profiles were a stable trait, we would expect substantial and reliable variance between individuals.
This finding stands in sharp contrast to recent evidence suggesting that response variability (conceptually related to ) represents a stable individual trait (Kim et al., 2025). Several factors may contribute to this discrepancy. First, Kim et al. (2025) found that response variability, measured as mean squared residuals from fitted psychometric functions, correlated across eight different phonetic continua with an average correlation of 0.67. However, their measure of variability was purely behavioral and did not decompose the sources of response variability. In contrast, our parameter represents the perceptual noise component within a generative Bayesian model that also estimates category variance () and perceptual warping (τ). It is possible that what appears as stable response variability at the behavioral level actually reflects context-dependent combinations of these underlying parameters. For instance, a listener might show consistent low variability across contexts by employing precise categorical perception (low τ, low ) in some conditions and precise acoustic tracking (high τ, low ) in others. The behavioral response variability would be stable, but the underlying mechanism (and thus the fitted value) would vary.
Second, the dramatic differences in median values across conditions (ranging from 355 for consonant primary to 1935 for vowel secondary) suggest that different phonetic contrasts may elicit genuinely different levels of perceptual noise. This could reflect differences in inherent signal quality, task difficulty, or the acoustic dimensions being processed. Vowel secondary cues, for instance, involve duration variation that may be more difficult to process reliably than the spectral changes that characterize vowel primary cues (formants). Duration is inherently a temporal property that requires integration across time and is highly susceptible to contextual influences such as speaking rate, stress, and phonetic environment (Crystal & House, 1988; Port, 1981), potentially leading to greater perceptual uncertainty compared to the relatively more stable spectral information carried by formants. If perceptual noise is partly determined by the properties of the acoustic signal and the perceptual systems engaged to process it, we should expect to vary substantially across contexts even for the same listener.
Third, our analysis used condition-specific median splits to define profiles, which may have obscured individual consistency in relative positioning. A listener who consistently falls in the upper half of the τ distribution across all conditions would be classified as having high τ in all contexts, but the absolute τ values (and thus the ICC calculated across those values) could still vary substantially. Future research might profitably examine whether listeners maintain consistent relative rankings on these parameters even when absolute values change, perhaps through rank-based analyses or by standardizing parameters within conditions before assessing cross-context correlations.
The strong effects of condition on both parameters (evidenced by highly significant likelihood ratio tests) underscore that phonetic context is a primary determinant of perceptual strategies. The chi-square value for (803.91) was nearly 30 times larger than for τ (29.47), suggesting that perceptual noise is even more context-dependent than perceptual warping. This is particularly surprising given theoretical expectations that internal noise should be a relatively stable property of an individual’s perceptual system, while the strength of categorical priors (reflected in τ) might vary depending on experience with specific phonetic contrasts. Our findings suggest the opposite pattern: listeners may maintain relatively stable categorical knowledge structures while their perceptual precision varies dramatically depending on the specific acoustic dimensions being processed.
However, an important caveat is that in the Bayesian framework, the noise variance () theoretically encompasses articulatory, acoustic, and perceptual noise that obscures the intended signal. In our analysis, we used as a proxy for internal perceptual noise, but when stimulus properties are held constant within a condition, the large condition differences in fitted values (ranging more than fivefold across conditions) likely reflect genuine differences in the difficulty of reliably extracting information from different acoustic dimensions rather than purely stable individual differences in perceptual precision. Thus, the extreme context-dependency of may partly reflect our modeling choice to absorb all sources of uncertainty into a single noise parameter. Future work might benefit from models that explicitly separate stimulus-inherent noise (which would be condition-specific) from listener-specific perceptual noise (which might show greater individual stability), potentially through hierarchical Bayesian approaches that estimate both sources of variance simultaneously.
4.4. Implications for theories of speech perception
Our findings have important implications for ongoing debates about the nature of categorical versus continuous perception. The traditional view treats categoricalness as a property of specific phonetic contrasts, with stop consonants showing strong categorical perception and vowels showing more continuous perception (Fry et al., 1962; Liberman et al., 1957). Our results suggest a more nuanced picture: individual listeners vary substantially in their degree of categorical processing even for the same phonetic contrast, but these individual differences are not stable traits. Instead, listeners appear to dynamically adjust their perceptual strategies based on contextual demands.
This flexibility is consistent with recent theoretical frameworks emphasizing the adaptive nature of speech perception (Kleinschmidt & Jaeger, 2015). If listeners continually update their perceptual strategies based on the statistics of the input they encounter, we should expect parameters like τ and to vary across contexts in theoretically meaningful ways. The Bayesian framework predicts that τ should be high (weak categorical influence) when within-category variation is informative and reliable, and low (strong categorical influence) when variation is largely due to noise. Our finding that secondary cues elicit different patterns of τ values than primary cues aligns with this prediction, as secondary cues may be less consistently informative across different listening contexts.
This strategic flexibility is not random but appears to be a principled adaptation to the demands of the listening environment. For instance, when processing less reliable secondary cues, listeners overwhelmingly polarized toward either the Veridical or Compensatory profiles, largely abandoning the suboptimal Categorical and Noisy strategies. This suggests a metacognitive process wherein listeners assess the reliability of the available acoustic information and select a strategy that optimizes performance under those conditions (Clayards et al., 2008; Toscano & McMurray, 2010). This dynamic adaptation may provide a mechanism for the well-documented phenomenon of flexible cue weighting, where listeners adjust their reliance on different acoustic cues based on context, talker characteristics, and attentional load (Holt et al., 2018; Holt & Lotto, 2006). Our findings suggest that shifts in cue weights may be a behavioral outcome of a more fundamental shift in perceptual strategy, that is, a change in the global reliance on sensory evidence versus prior knowledge, as captured by τ.
The absence of stable individual differences in τ also bears on the interpretation of perceptual learning and plasticity. If categorical perception reflects learned statistical knowledge about speech sound distributions, and if listeners can acquire different statistical knowledge for different phonetic contrasts, then τ values should indeed be contrast-specific rather than reflecting a domain-general perceptual style. Our findings support this contrast-specific learning account over theories positing that some individuals are inherently more categorical or gradient in their perceptual processing across the board (Myers et al., 2024).
Our findings propose instead that perceptual variability is better understood within a dynamic framework where listeners possess a repertoire of strategies and flexibly deploy them to meet situational demands (Kapnoula et al., 2017). This perspective aligns with modern Bayesian theories of cognition, such as predictive coding and active inference, which posit that the brain is not a passive recipient of sensory information but an active modeler of its environment (Clark, 2013; de Lange et al., 2018; Friston, 2010). In this view, the brain constantly generates predictions about incoming sensory data and uses the discrepancy (the prediction error) to update its internal model of the world. Crucially, the influence of this prediction error is not fixed; it is weighted by its precision (the inverse of its expected variance) (Feldman & Friston, 2010; Friston, 2009). A highly precise prediction error (from a reliable sensory channel) will strongly drive model updates, whereas an imprecise prediction error (from a noisy channel) will be down-weighted or ignored. Our framework maps directly onto this architecture. The selection of a perceptual strategy, a specific combination of τ and , can be seen as a form of metacognitive inference about the precision of the sensory channel. When the brain infers that the sensory channel is reliable (low ), it assigns high precision to the resulting sensory prediction errors, leading to a strategy of high signal reliance (high τ), as seen in the Veridical profile. Conversely, when the brain infers that the sensory channel is unreliable (high ), it assigns low precision to the prediction errors and relies more heavily on its top-down generative model (the prior), resulting in a low-τ strategy, as seen in the Compensatory profile.
4.5. Limitations and future directions
We acknowledge several limitations that should inform interpretation of our findings. First, estimates of Bayesian parameters from a single experimental condition can be noisy, particularly given that each synthetic stimulus was repeated only 25 times. While this is within the range of recent studies, it meant that Bayesian models did not converge for all participants in all conditions, resulting in the final sample of 599 observations from 192 participants (only 176 for more than one condition). However, the systematic patterns of profile switching and the robust behavioral differences observed between profiles argue against an interpretation based solely on measurement error.
Second, while the final sample size is relatively large for speech perception research, it remains possible that a larger sample could detect a small but reliable trait-like component of signal reliance. Nevertheless, our data firmly establish that the vast majority of variance in perceptual strategy is situational rather than individual. The convergence of our categorical profile analysis with continuous statistical tests (ICC and likelihood ratio tests) lends strong support to our central conclusion.
Third, our conclusions are based on using the identification tasks of 2AFC and Visual Analog Scale, which may encourage strategic adaptation more than other paradigms. Future research should explore whether this same degree of flexibility is observed in discrimination tasks or paradigms that tap more implicit, automatic processing. Additionally, the stimuli were carefully controlled synthetic speech, which may differ from natural speech in ways that affect strategic deployment.
Finally, our use of condition-specific median splits to define profiles ensures equal cell sizes within each condition but may obscure meaningful individual differences in absolute parameter values. Alternative approaches, such as model-based clustering or mixture modeling, might identify profiles based on the joint distribution of parameters across all conditions simultaneously, potentially revealing more stable individual differences. We would predict that even model-based approaches would reveal the same core finding of profound context-dependence, though they might identify a small subset of individuals with more stable tendencies.
This work opens several avenues for future research. A primary goal should be to identify the specific factors that trigger strategy switches through systematic manipulations of signal-to-noise ratio, stimulus predictability, and task demands. The flexibility we observed may represent the upper bounds of strategic control. Future work should use more implicit measures (e.g., eye-tracking, EEG) to test whether this flexibility is also present in early, automatic stages of perception, or if it is primarily a feature of conscious decision-making. Neuroimaging studies could explore the neural correlates of these strategic shifts, potentially identifying distinct networks associated with each of the four profiles and revealing whether individual differences exist in the neural efficiency of switching between them. From a developmental perspective, a crucial question is whether strategic flexibility is an innate capacity or a skill that develops with linguistic experience and the maturation of executive functions (Zelazo, 2015). Longitudinal studies could track how children learn not only to build perceptual categories but also to select the appropriate strategy for using them. Finally, this framework has promising clinical applications. Characterizing communication disorders in terms of strategic flexibility could lead to novel diagnostic tools that assess not only sensory precision but also the ability to adaptively deploy perceptual strategies.
5. Conclusions
This study demonstrates the value of applying Bayesian computational models to characterize individual differences in speech perception. The resulting profiles exhibited theoretically coherent behavioral patterns that validated their mechanistic interpretation, successfully distinguishing listeners who would appear similar based on behavioral measures alone. However, both the profiles themselves and the underlying parameters showed negligible stability across phonetic contexts, suggesting that perceptual strategies are highly flexible and context-dependent rather than representing stable individual traits. These findings challenge simplistic dichotomies between categorical and continuous perception, revealing instead a complex landscape in which listeners dynamically adjust their processing strategies based on the specific acoustic and phonetic demands of the listening situation. Our findings suggest that the real hallmark of the speech perception system is not categorical rigidity, but this very capacity for strategic adaptation. Understanding this flexibility is essential for developing comprehensive theories of speech perception that can account for both the remarkable consistency with which listeners perceive speech across varied contexts and the adaptive plasticity that allows them to adjust to new talkers, dialects, and listening environments.
References
- Abramson, A. S. (1961). Identification and discrimination of phonemic tones. The Journal of the Acoustical Society of America, 33(6_Supplement), 842–842. [CrossRef]
- Abramson, A. S. , & Lisker, L. (1985). Relative power of cues: F0 shift versus voice timing. In V. Fromkin (Ed.), Phonetic linguistics: Essays in honor of Peter Ladefoged (pp. 25–33). Academic Press.
- Angeli, A., Davidoff, J., & Valentine, T. (2008). Face familiarity, distinctiveness, and categorical perception. Quarterly Journal of Experimental Psychology, 61(5), 690–707. [CrossRef]
- Apfelbaum, K. S., Kutlu, E., McMurray, B., & Kapnoula, E. C. (2022). Don’t force it! Gradient speech categorization calls for continuous categorization tasks. The Journal of the Acoustical Society of America, 152(6), 3728–3745. [CrossRef]
- Beale, J. M., & Keil, F. C. (1995). Categorical effects in the perception of faces. Cognition, 57(3), 217–239. [CrossRef]
- Bürkner, P.-C. (2017). brms: An R Package for Bayesian Multilevel Models Using Stan. Journal of Statistical Software, 80(1). [CrossRef]
- Clark, A. (2013). Whatever next? Predictive brains, situated agents, and the future of cognitive science. Behavioral and Brain Sciences, 36(3), 181–204. [CrossRef]
- Clayards, M. (2018). Differences in cue weights for speech perception are correlated for individuals within and across contrasts. The Journal of the Acoustical Society of America, 144(3), Article 3. [CrossRef]
- Clayards, M., Tanenhaus, M. K., Aslin, R. N., & Jacobs, R. A. (2008). Perception of speech reflects optimal use of probabilistic speech cues. Cognition, 108(3), Article 3. [CrossRef]
- Crystal, T. H., & House, A. S. (1988). The duration of American-English vowels: An overview. Journal of Phonetics, 16(3), 263–284. [CrossRef]
- Davidoff, J., Davies, I., & Roberson, D. (1999). Colour categories in a stone-age tribe. Nature, 398(6724), 203–204. [CrossRef]
- de Lange, F. P., Heilbron, M., & Kok, P. (2018). How do expectations shape perception? Trends in Cognitive Sciences, 22(9), 764–779. [CrossRef]
- Feldman, H. , & Friston, K. J. (2010). Attention, uncertainty, and free-energy. Frontiers in Human Neuroscience, 4. [CrossRef]
- Feldman, N. H., Griffiths, T. L., & Morgan, J. L. (2009). The influence of categories on perception: Explaining the perceptual magnet effect as optimal statistical inference. Psychological Review, 116(4), Article 4. PubMed. [CrossRef]
- Francis, A. L., Ciocca, V., & Chit Ng, B. K. (2003). On the (non)categorical perception of lexical tones. Perception & Psychophysics, 65(7), 1029–1044. [CrossRef]
- Friston, K. (2009). The free-energy principle: A rough guide to the brain? Trends in Cognitive Sciences, 13(7), 293–301. [CrossRef]
- Friston, K. (2010). The free-energy principle: A unified brain theory? Nature Reviews Neuroscience, 11(2), 127–138. [CrossRef]
- Fry, D. B., Abramson, A. S., Eimas, P. D., & Liberman, A. M. (1962). The identification and discrimination of synthetic vowels. Language and Speech, 5(4), 171–189. [CrossRef]
- Fuhrmeister, P., Phillips, M. C., McCoach, D. B., & Myers, E. B. (2023). Relationships between native and non-native speech perception. Journal of Experimental Psychology: Learning, Memory, and Cognition, 49(7), 1161–1175. [CrossRef]
- Fujimura, T., Matsuda, Y.-T., Katahira, K., Okada, M., & Okanoya, K. (2012). Categorical and dimensional perceptions in decoding emotional facial expressions. Cognition & Emotion, 26(4), 587–601. [CrossRef]
- Gaißert, N., Waterkamp, S., Fleming, R. W., & Bülthoff, I. (2012). Haptic categorical perception of shape. PLoS ONE, 7(8), e43062. [CrossRef]
- Goldinger, S. (1998). Echoes of echoes? An episodic theory of lexical access. Psychological Review, 105(2), 251–279. [CrossRef]
- Hary, J. M., & Massaro, D. W. (1982). Categorical results do not imply categorical perception. Perception & Psychophysics, 32(5), 409–418. [CrossRef]
- Hazan, V., & Rosen, S. (1991). Individual variability in the perception of cues to place contrasts in initial stops. Perception & Psychophysics, 49(2), 187–200. [CrossRef]
- Hillenbrand, J. M., Clark, M. J., & Houde, R. A. (2000). Some effects of duration on vowel recognition. The Journal of the Acoustical Society of America, 108(6), 3013–3022. [CrossRef]
- Holt, L. L., & Lotto, A. J. (2006). Cue weighting in auditory categorization: Implications for first and second language acquisition. The Journal of the Acoustical Society of America, 119(5), 3059–3071. [CrossRef]
- Holt, L. L., Tierney, A. T., Guerra, G., Laffere, A., & Dick, F. (2018). Dimension-selective attention as a possible driver of dynamic, context-dependent re-weighting in speech processing. Hearing Research, 366, 50–64. [CrossRef]
- Honda, C. T., Clayards, M., & Baum, S. R. (2024). Exploring individual differences in native phonetic perception and their link to nonnative phonetic perception. Journal of Experimental Psychology: Human Perception and Performance, 50(4), 370–394. [CrossRef]
- Iverson, P., & Kuhl, P. K. (1995). Mapping the perceptual magnet effect for speech using signal detection theory and multidimensional scaling. The Journal of the Acoustical Society of America, 97(1), Article 1. [CrossRef]
- Joanisse, M. F., Manis, F. R., Keating, P., & Seidenberg, M. S. (2000). Language deficits in dyslexic children: Speech perception, phonology, and morphology. Journal of Experimental Child Psychology, 77(1), 30–60. [CrossRef]
- Kapnoula, E. C., Edwards, J., & McMurray, B. (2021). Gradient activation of speech categories facilitates listeners’ recovery from lexical garden paths, but not perception of speech-in-noise. Journal of Experimental Psychology: Human Perception and Performance, 47(4), 578–595. [CrossRef]
- Kapnoula, E. C., Winn, M. B., Kong, E. J., Edwards, J., & McMurray, B. (2017). Evaluating the sources and functions of gradiency in phoneme categorization: An individual differences approach. Journal of Experimental Psychology: Human Perception and Performance, 43(9), Article 9. PubMed. [CrossRef]
- Kim, H. , McMurray, B., Sorensen, E., & Oleson, J. (2025). The consistency of categorization-consistency in speech perception. Psychonomic Bulletin & Review. [CrossRef]
- Kleinschmidt, D. F., & Jaeger, T. F. (2015). Robust speech perception: Recognize the familiar, generalize to the similar, and adapt to the novel. Psychological Review, 122(2), 148–203. [CrossRef]
- Kong, E. J., & Edwards, J. (2016). Individual differences in categorical perception of speech: Cue weighting and executive function. Journal of Phonetics, 59, 40–57. [CrossRef]
- Koo, T. K., & Li, M. Y. (2016). A Guideline of Selecting and Reporting Intraclass Correlation Coefficients for Reliability Research. Journal of Chiropractic Medicine, 15(2), 155–163. [CrossRef]
- Kronrod, Y., Coppess, E., & Feldman, N. H. (2016). A unified account of categorical effects in phonetic perception. Psychonomic Bulletin & Review, 23(6), 1681–1712. [CrossRef]
- Kuhl, P. K. (1991). Human adults and human infants show a “perceptual magnet effect” for the prototypes of speech categories, monkeys do not. Perception & Psychophysics, 50(2), 93–107. [CrossRef]
- Kuznetsova, A., Brockhoff, P. B., & Christensen, R. H. B. (2017). lmerTest package: Tests in linear mixed effects models. Journal of Statistical Software, 82(13), Article 13. [CrossRef]
- Lenth, R. V. (2021). emmeans: Estimated Marginal Means, aka Least-Squares Means (Version R package version 1.7.1-1) [En]. https://CRAN.R-project.org/package=emmeans.
- Liberman, A. M., Harris, K. S., Hoffman, H. S., & Griffith, B. C. (1957). The discrimination of speech sounds within and across phoneme boundaries. Journal of Experimental Psychology, 54(5), 358–368. [CrossRef]
- Lisker, L., & Abramson, A. S. (1964). A cross-language study of voicing in initial stops: Acoustical measurements. WORD, 20(3), Article 3. [CrossRef]
- Manis, F. R., Mcbride-Chang, C., Seidenberg, M. S., Keating, P., Doi, L. M., Munson, B., & Petersen, A. (1997). Are speech perception deficits associated with developmental dyslexia? Journal of Experimental Child Psychology, 66(2), 211–235. [CrossRef]
- Mann, V. A., & Repp, B. H. (1980). Influence of vocalic context on perception of the [∫]-[s] distinction. Perception & Psychophysics, 28(3), Article 3. [CrossRef]
- Massaro, D. W., & Cohen, M. M. (1983). Categorical or continuous speech perception: A new test. Speech Communication, 2(1), 15–35. [CrossRef]
- McMurray, B. (2022). The myth of categorical perception. The Journal of the Acoustical Society of America, 152(6), 3819–3842. [CrossRef]
- McMurray, B., Aslin, R. N., Tanenhaus, M. K., Spivey, M. J., & Subik, D. (2008). Gradient sensitivity to within-category variation in words and syllables. Journal of Experimental Psychology: Human Perception and Performance, 34(6), 1609–1631. [CrossRef]
- Miller, J. L. (1994). On the internal structure of phonetic categories: A progress report. Cognition, 50(1–3), 271–285. [CrossRef]
- Munson, B., Johnson, J. M., & Edwards, J. (2012). The role of experience in the perception of phonetic detail in children’s speech: A comparison between speech-language pathologists and clinically untrained listeners. American Journal of Speech-Language Pathology, 21(2), 124–139. [CrossRef]
- Munson, B., Schellinger, S. K., & Edwards, J. (2017). Bias in the perception of phonetic detail in children’s speech: A comparison of categorical and continuous rating scales. Clinical Linguistics & Phonetics, 31(1), 56–79. [CrossRef]
- Myers, E., Phillips, M., & Skoe, E. (2024). Individual differences in the perception of phonetic category structure predict speech-in-noise performance. The Journal of the Acoustical Society of America, 156(3), 1707–1719. [CrossRef]
- Norris, D., & Mcqueen, J. M. (2008). Shortlist B: A Bayesian model of continuous speech recognition. Psychological Review, 115(2), Article 2. [CrossRef]
- Pisoni, D. B., & Tash, J. (1974). Reaction times to comparisons within and across phonetic categories. Perception & Psychophysics, 15(2), Article 2. [CrossRef]
- Port, R. F. (1981). Linguistic timing factors in combination. The Journal of the Acoustical Society of America, 69, 262–274. [CrossRef]
- R Development Core Team. (2024). R: A Langage and Environment for statistical Computing [En]. R Foundation for Statistical Computing. http://www.R-project.org/.
- Repp, B. H. (1981). Two strategies in fricative discrimination. Perception & Psychophysics, 30(3), 217–227. [CrossRef]
- Repp, B. H. (1984). Categorical perception: Issues, methods, findings. In Speech and Language (Vol. 10, pp. 243–335). Elsevier. [CrossRef]
- Rosen, S. M. (1979). Range and frequency effects in consonant categorization. Journal of Phonetics, 7(4), 393–402. [CrossRef]
- Serniclaes, W., Sprenger-Charolles, L., Carré, R., & Demonet, J.-F. (2001). Perceptual discrimination of speech sounds in developmental dyslexia. Journal of Speech, Language, and Hearing Research, 44(2), 384–399. [CrossRef]
- Serniclaes, W., Ventura, P., Morais, J., & Kolinsky, R. (2005). Categorical perception of speech sounds in illiterate adults. Cognition, 98(2), B35–B44. [CrossRef]
- Stan Development Team. (2025). RStan: The R interface to Stan. https://mc-stan.org/.
- Surprenant, A. M., & Watson, C. S. (2001). Individual differences in the processing of speech and nonspeech sounds by normal-hearing listeners. The Journal of the Acoustical Society of America, 110(4), 2085–2095. [CrossRef]
- Toscano, J. C., & McMurray, B. (2010). Cue integration with categories: Weighting acoustic cues in speech using unsupervised learning and distributional statistics. Cognitive Science, 34(3), 434–464. [CrossRef]
- Toscano, J. C., McMurray, B., Dennhardt, J., & Luck, S. J. (2010). Continuous perception and graded categorization: Electrophysiological evidence for a linear relationship between the acoustic signal and perceptual encoding of speech. Psychological Science, 21(10), Article 10. [CrossRef]
- Werker, J. F., & Tees, R. C. (1987). Speech perception in severely disabled and average reading children. Canadian Journal of Psychology / Revue Canadienne de Psychologie, 41(1), 48–61. [CrossRef]
- Xue, K., Shekhar, M., & Rahnev, D. (2024). Challenging the Bayesian confidence hypothesis in perceptual decision-making. Proceedings of the National Academy of Sciences, 121(48), e2410487121. [CrossRef]
- Zelazo, P. D. (2015). Executive function: Reflection, iterative reprocessing, complexity, and the developing brain. Developmental Review, 38, 55–68. [CrossRef]
Figure 1.
Distribution of listeners in the perceptual warping (τ) vs. perceptual noise () parameter space for each of the four phonetic conditions. (A) Consonant primary cue condition. (B) Vowel primary cue condition. (C) Consonant secondary cue condition. (D) Vowel secondary cue condition. Each point represents one listener’s data in one condition. Quadrants are defined by the condition-specific medians (dashed lines), with points colored according to their assigned perceptual profile: Veridical (high τ, low ), Categorical (low τ, low ), Compensatory (low τ, high ), and Noisy (high τ, high ).
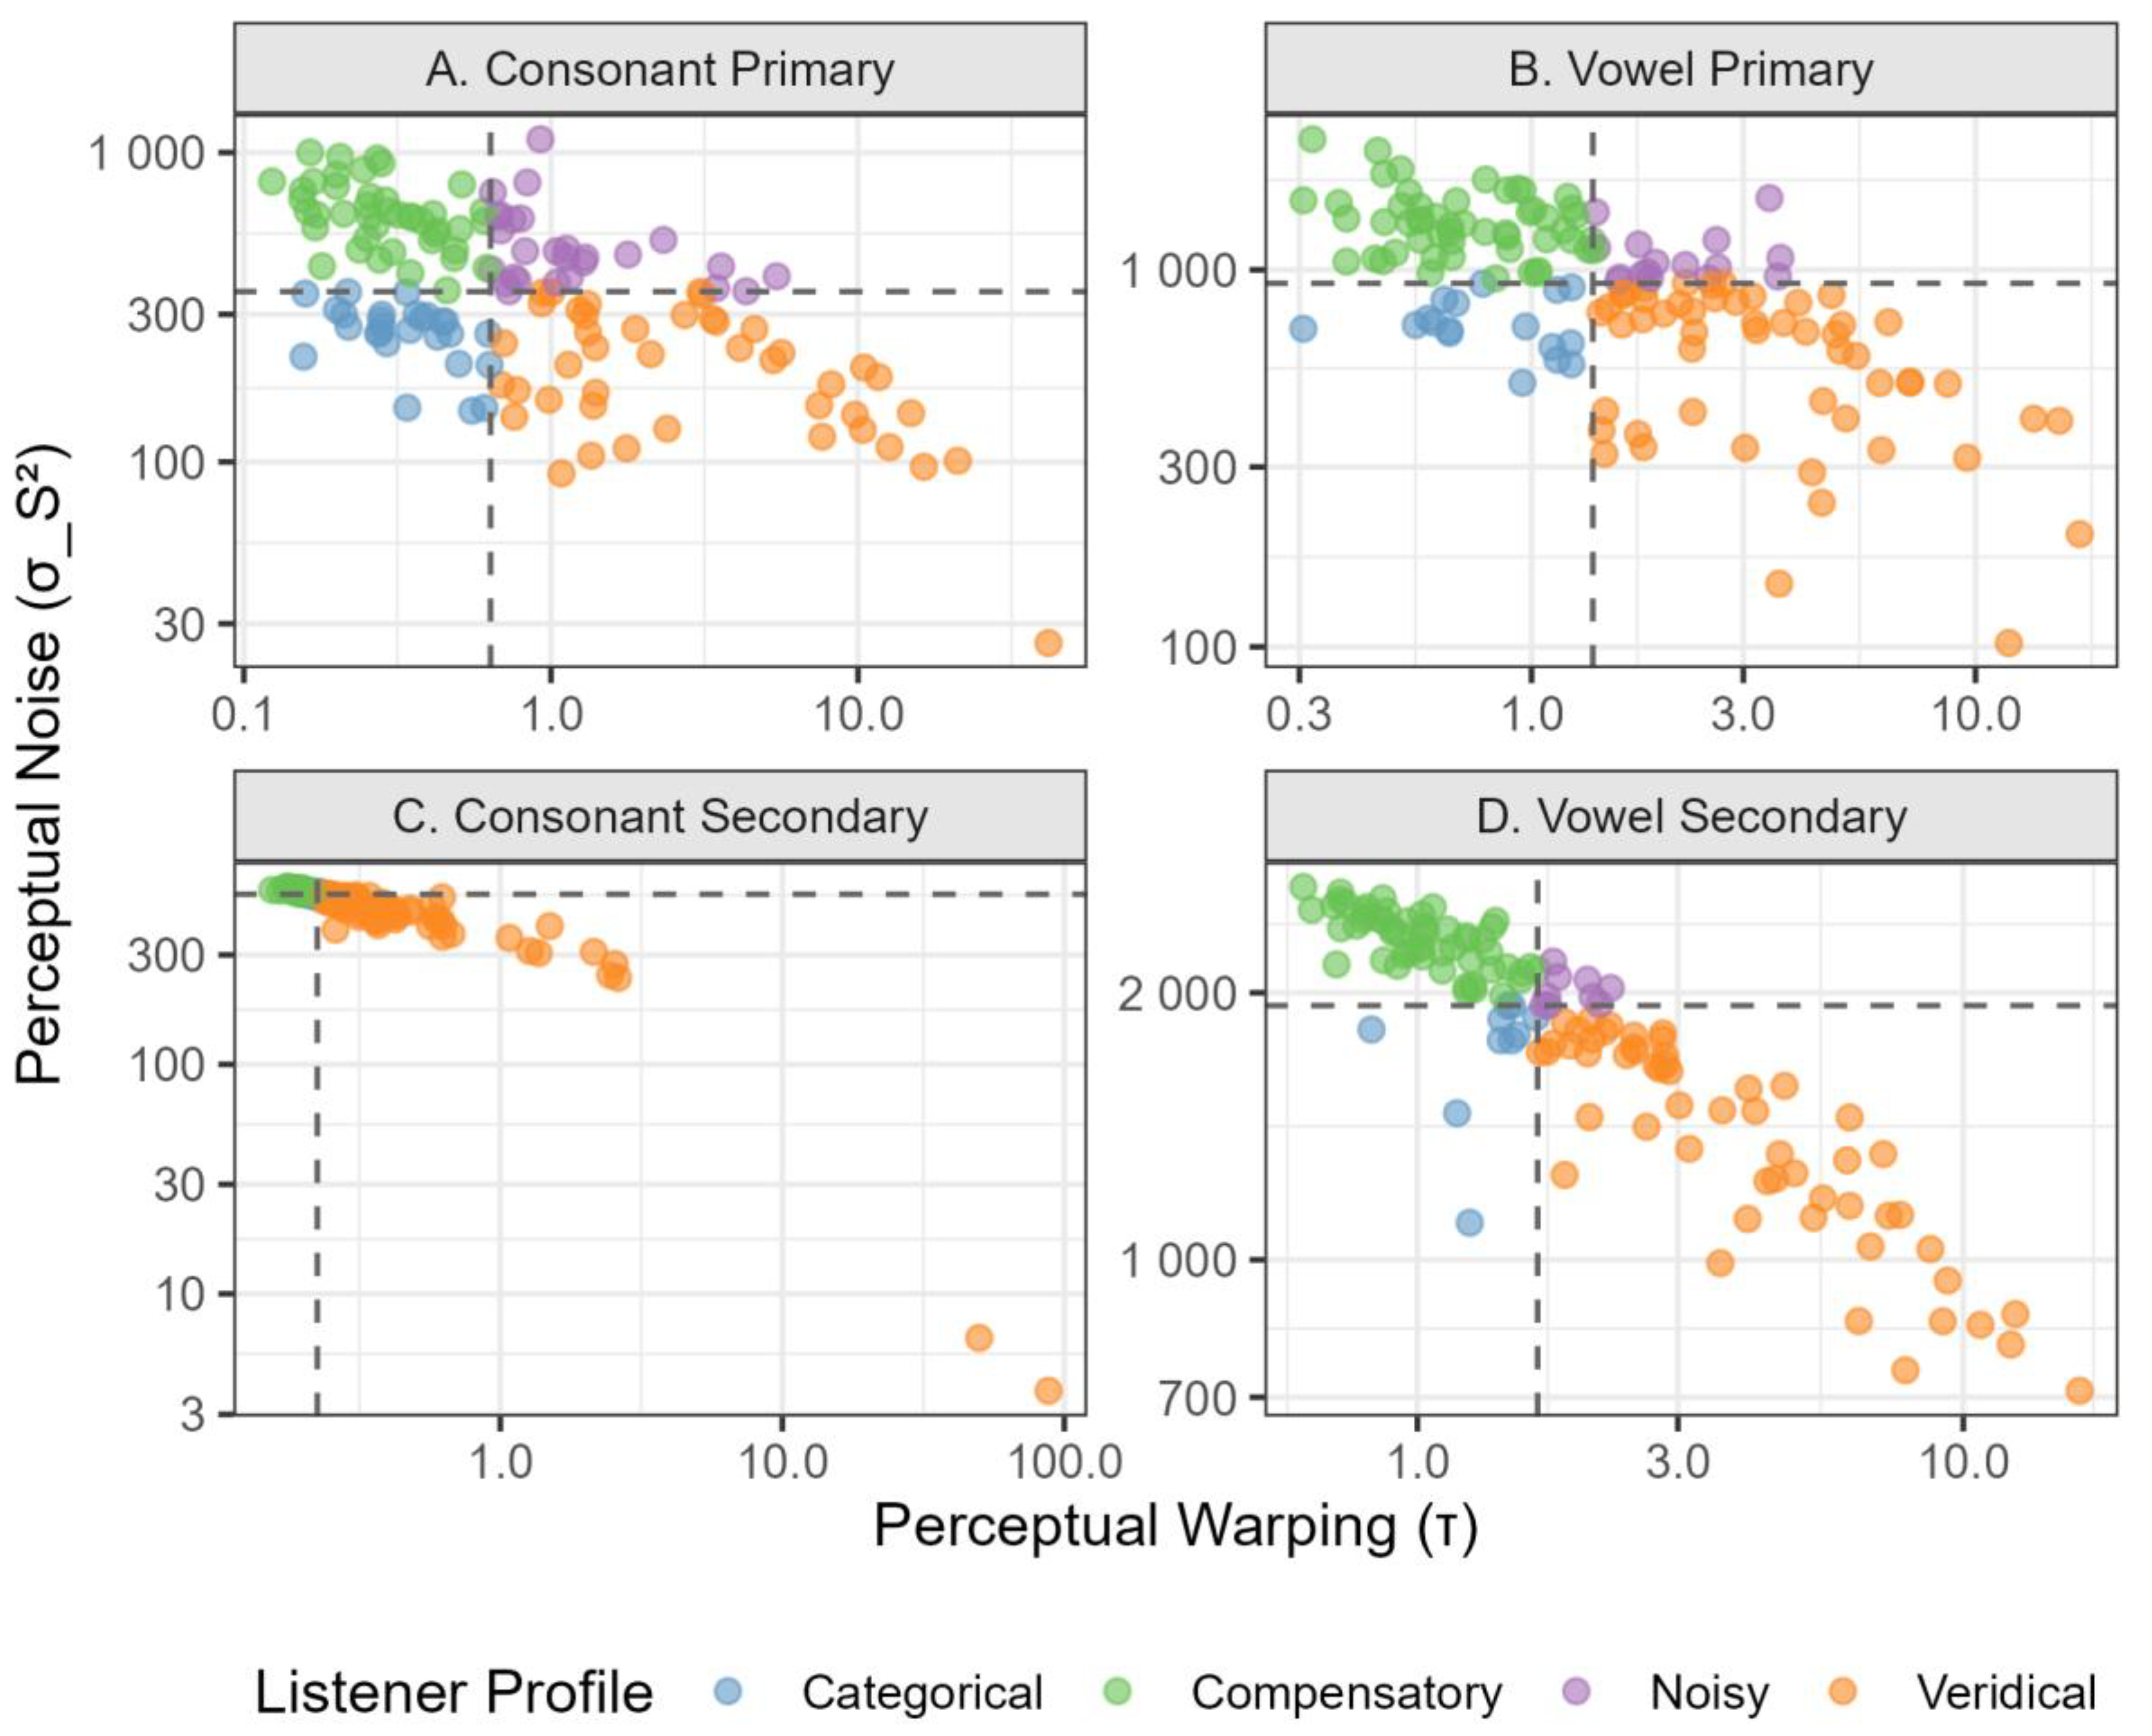
Figure 2.
Flexibility of perceptual profiles between conditions. Each line represents a single participant, tracking their change in profile from one condition (left) to another (right). The width of the flows corresponds to the number of participants. The four facets show transitions between (A) consonant primary and secondary cues, (B) vowel primary and secondary cues, (C) consonant and vowel primary cues, and (D) consonant and vowel secondary cues.
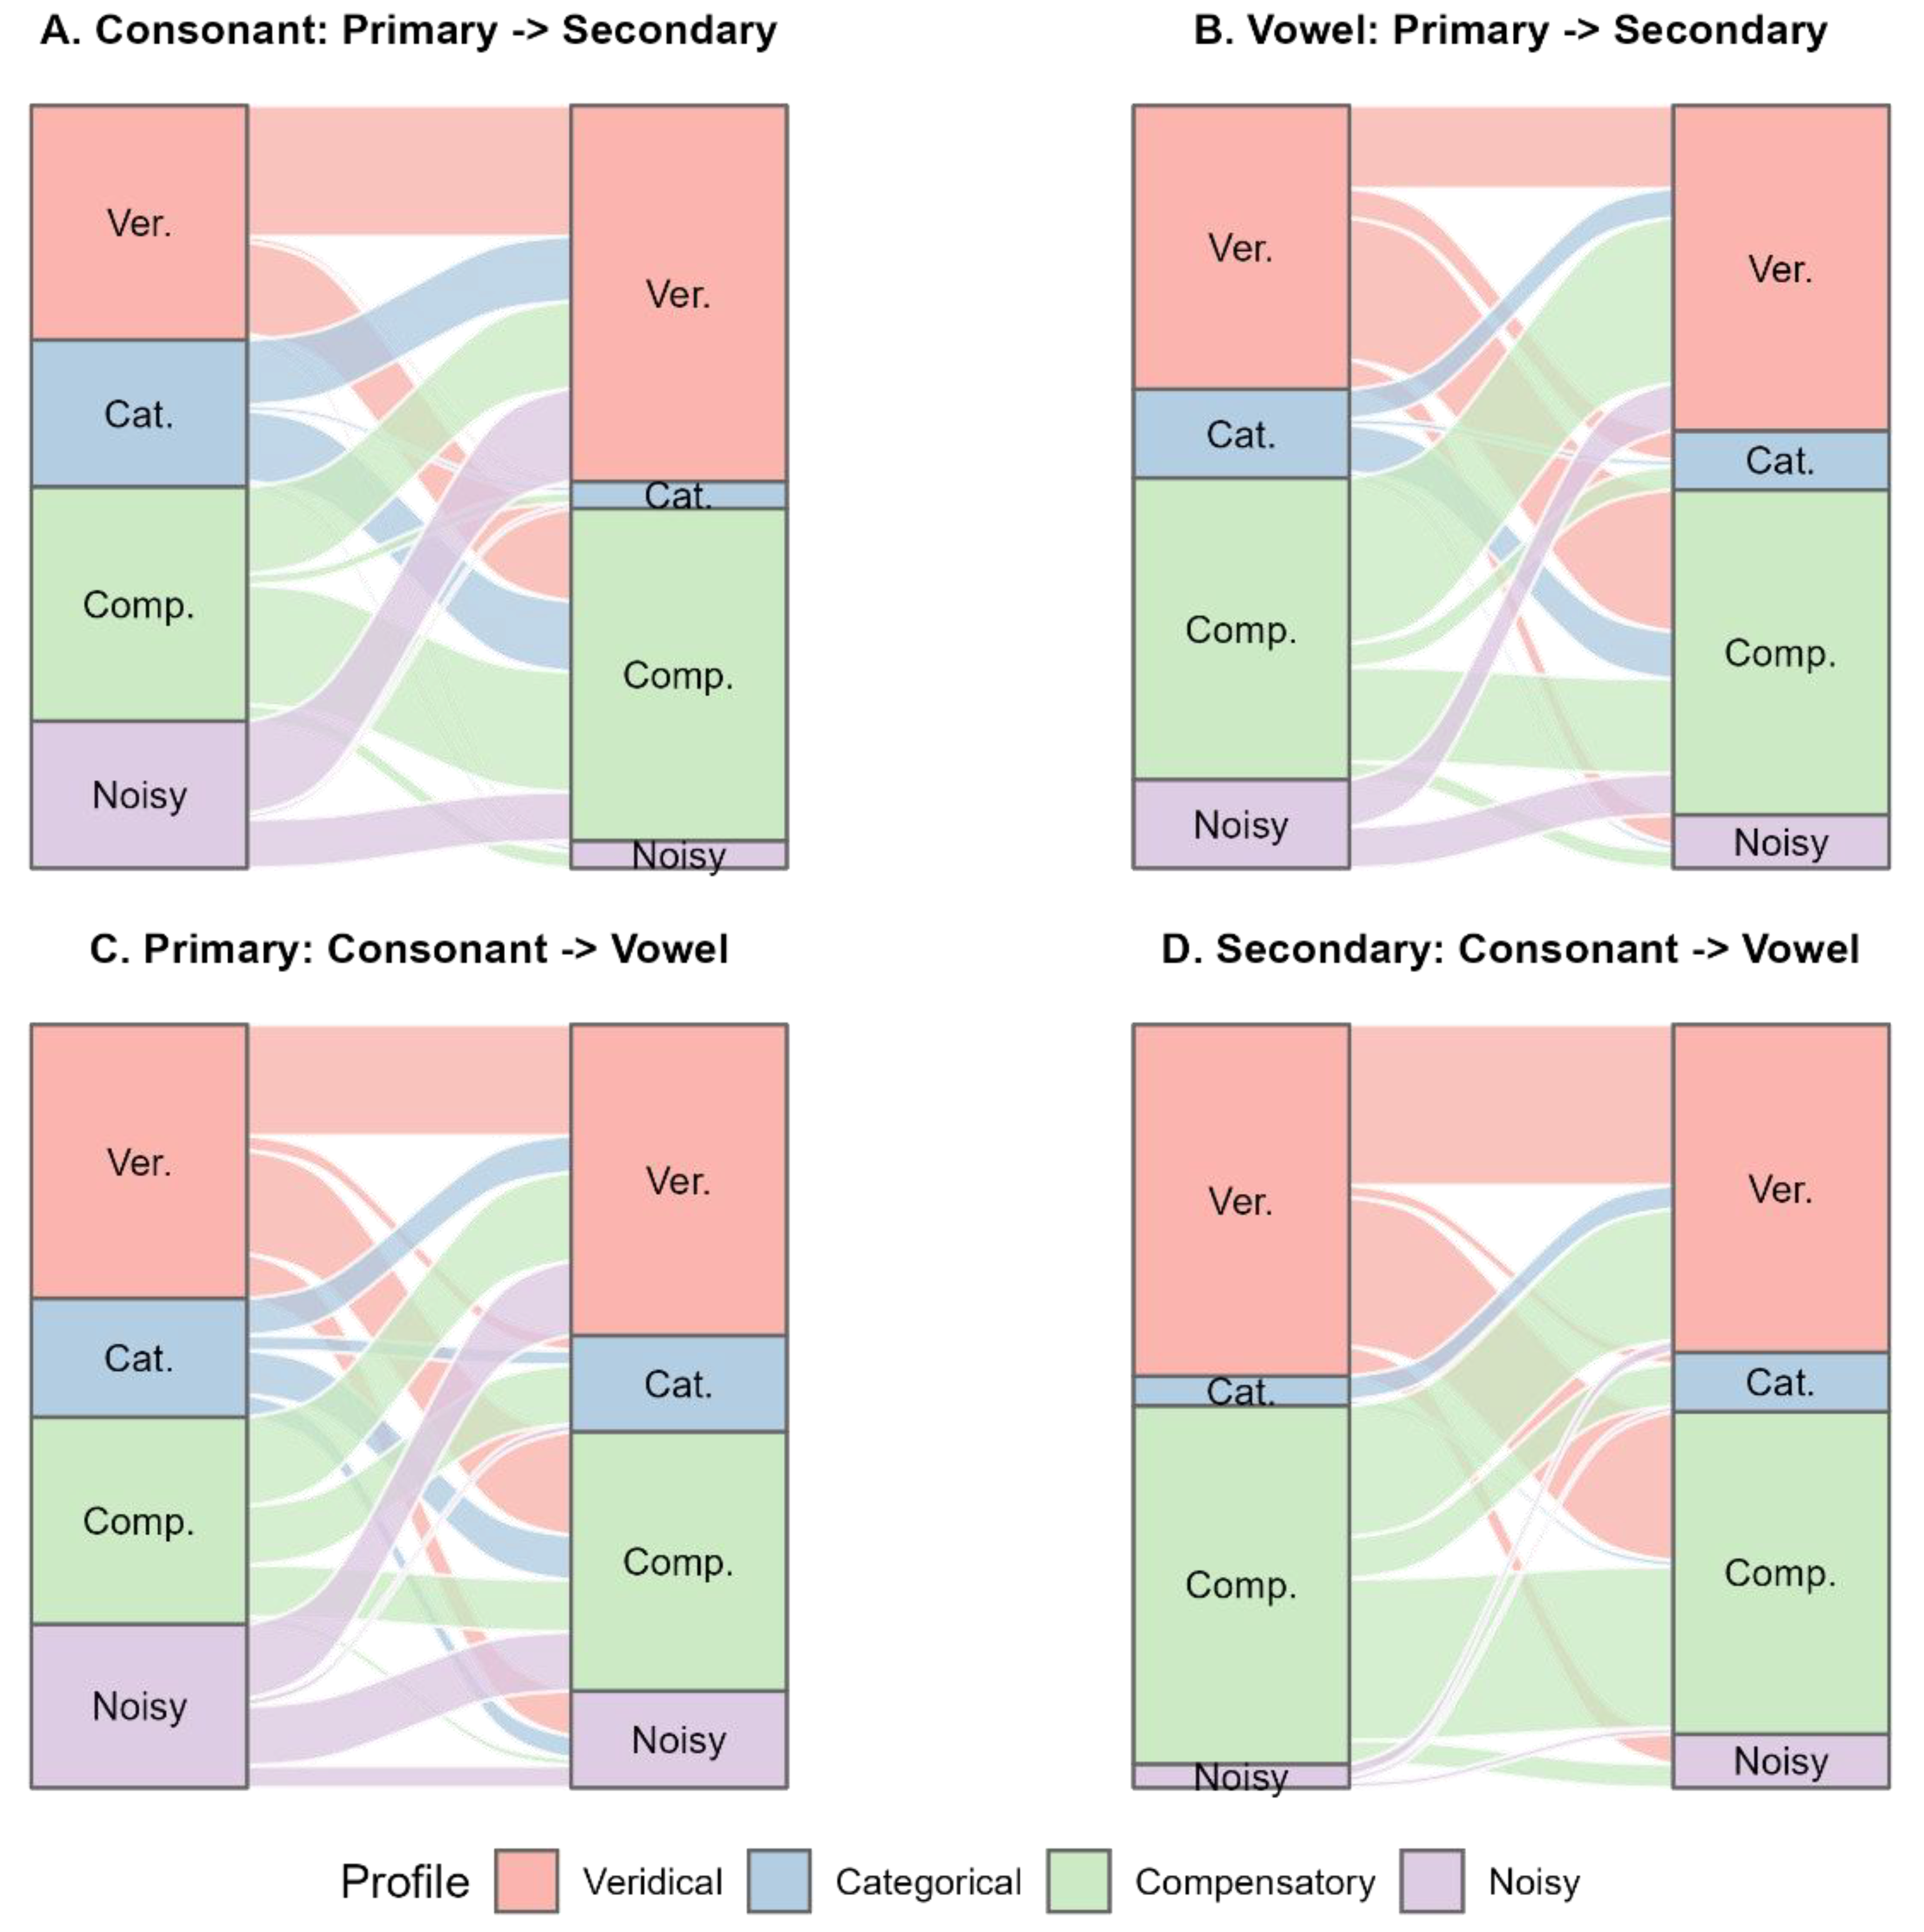
Figure 3.
Behavioral measures of the four listener profiles, pooled across conditions. (A) Mean categorization slope. (B) Mean response variability. Error bars represent standard errors of the mean.
Figure 3.
Behavioral measures of the four listener profiles, pooled across conditions. (A) Mean categorization slope. (B) Mean response variability. Error bars represent standard errors of the mean.
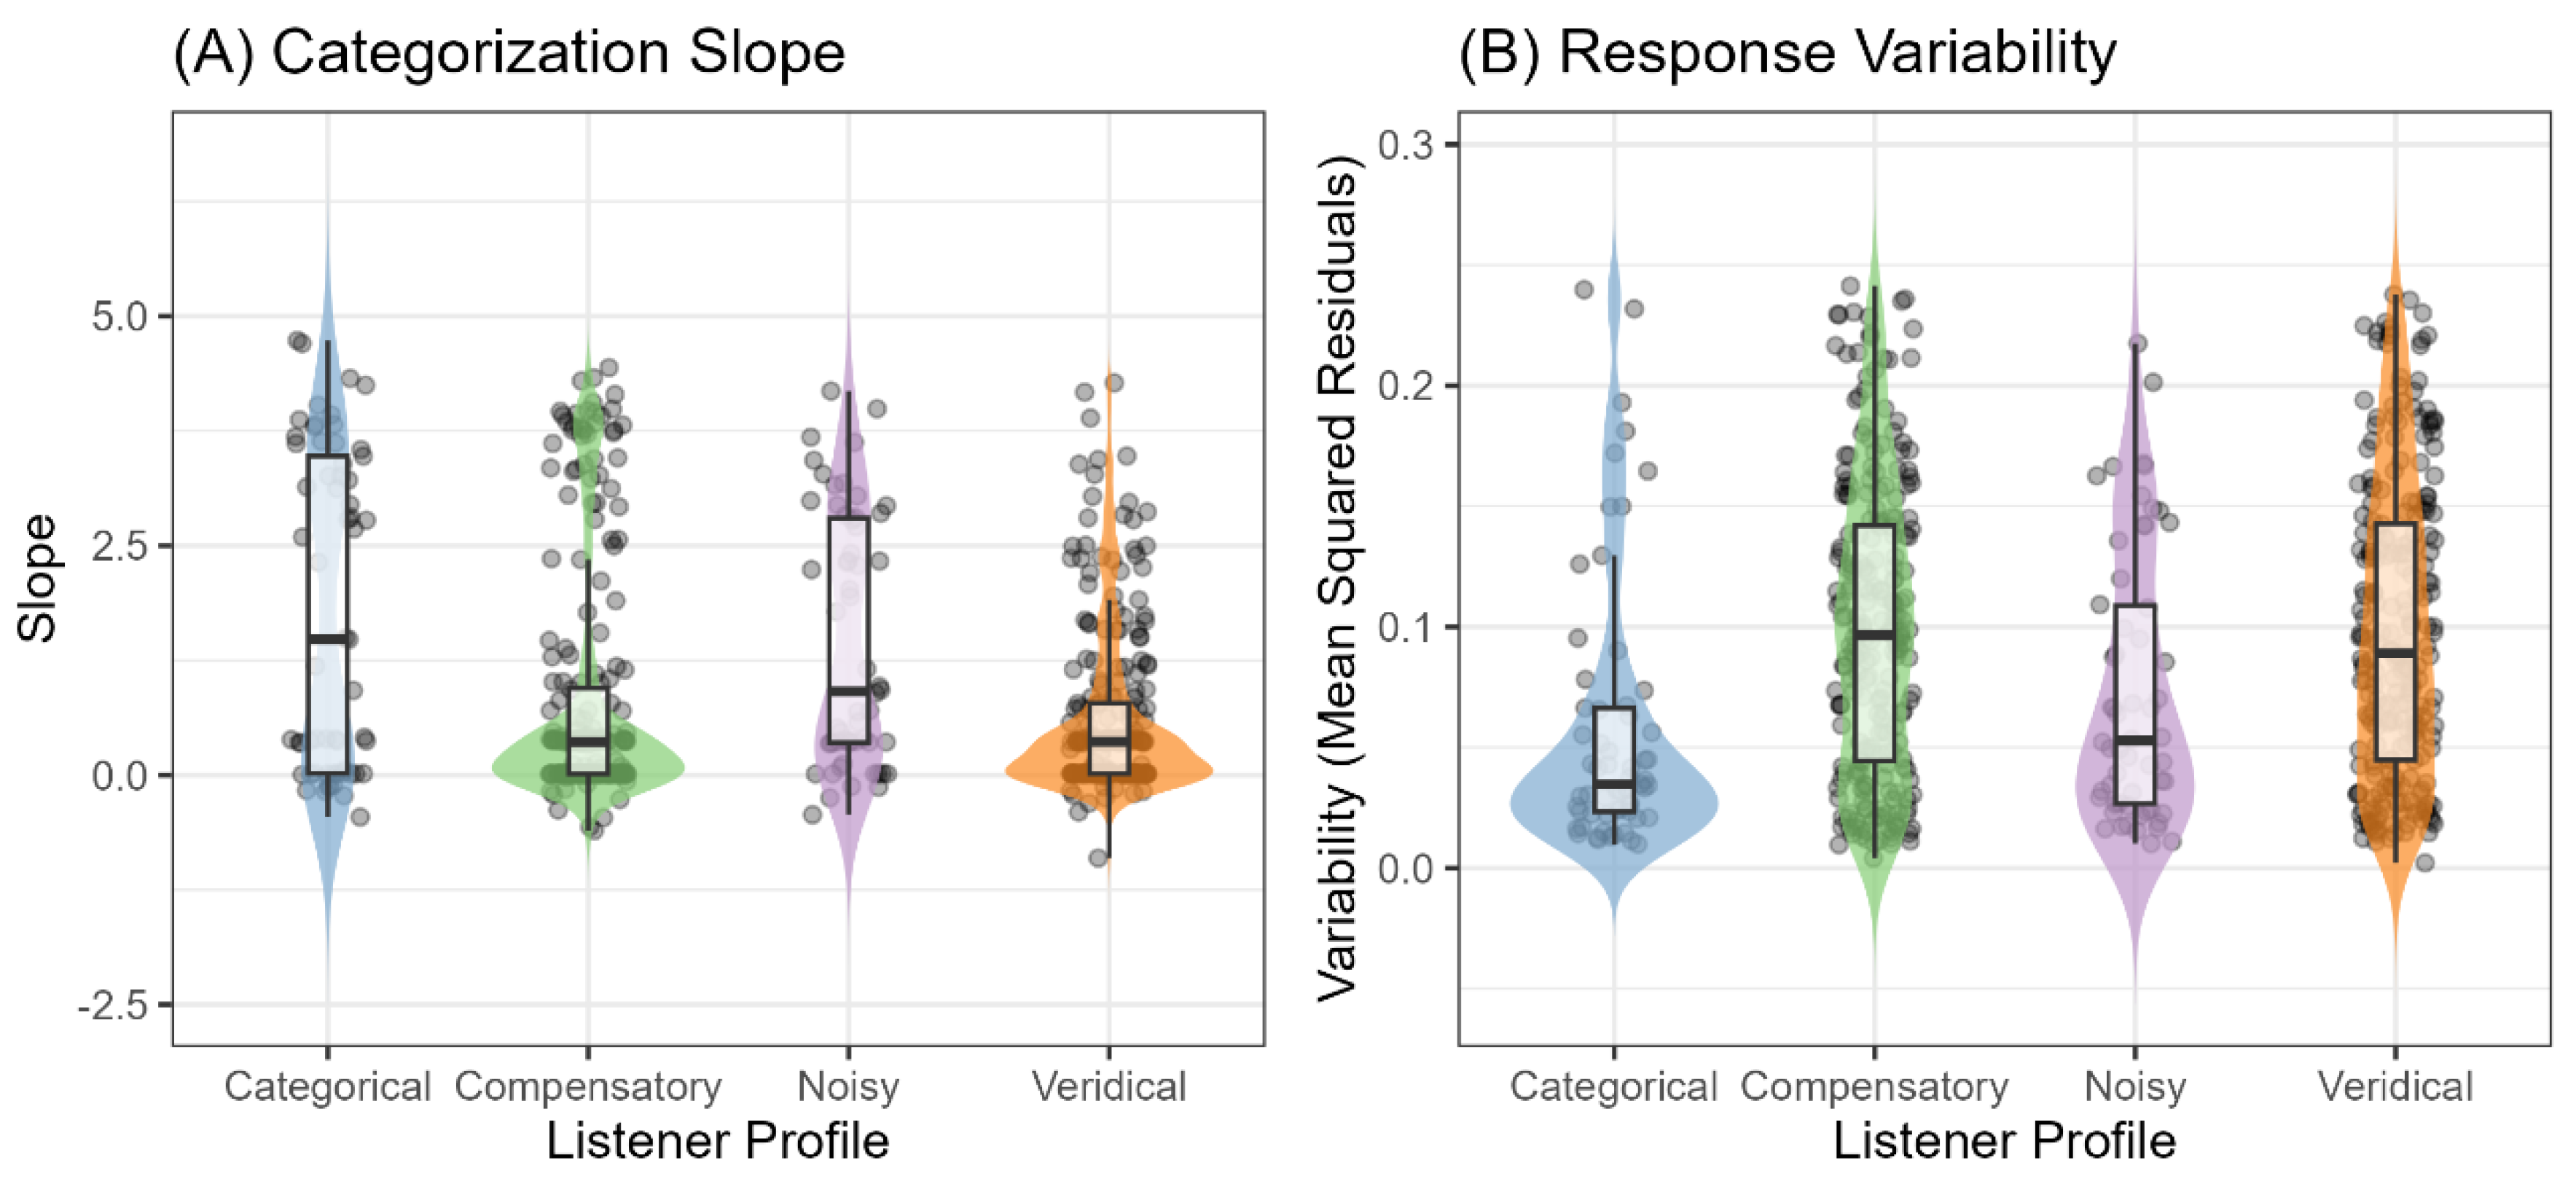

Table 1.
Stimulus properties of the bet-bat and dear-tear continua (Adapted from Honda et al., 2024).
Table 1.
Stimulus properties of the bet-bat and dear-tear continua (Adapted from Honda et al., 2024).
| The bet-bat contrast | The dear-tear contrast | |||
|---|---|---|---|---|
| Formant frequencies of spectral steps (Hz) | Duration steps (ms) | Voice onset time steps (ms) | Onset F0 steps (Hz) | |
| F1 | F2 | |||
| 625 | 1677 | 100 | 10 | 185 |
| 647 | 1610 | 140 | 20 | 195 |
| 663 | 1560 | 180 | 30 | 205 |
| 682 | 1546 | 220 | 40 | 215 |
| 740 | 1556 | 260 | 50 | 225 |
Table 2.
Model parameters, roles, and prior distributions.
| Parameter | Role | Prior Distribution |
|---|---|---|
| , | Category means | Condition-specific normals |
| , | Category standard deviations | Condition-specific truncated normals |
| Sensory noise standard deviation | Condition-specific truncated normal | |
| scale | VAS response scaling factor | N(0.5, 0.25-0.5)* |
| intercept | VAS response intercept | N(50, 20-30)* |
| VAS response noise | Truncated normal |
*Note: Prior widths varied by acoustic condition to accommodate different stimulus ranges.
Table 3.
Condition-specific prior distributions for Bayesian model parameters.
| Phonetic Condition | ||||
|---|---|---|---|---|
| Vowel formants | N(50,30) | N(150, 30) | N(20, 10)T[1,∞) | N(25, 10)T[1,∞) |
| Vowel duration | N(140, 40) | N(220, 40) | N(30, 15)T[1,∞) | N(35, 15)T[1,∞) |
| Consonant VOT | N(20, 20) | N(40, 20) | N(10, 8)T[1,∞) | N(12, 8)T[1,∞) |
| Consonant F0 | N(195, 15) | N(215, 15) | N(8, 6)T[1,∞) | N(10, 8)T[1,∞) |
Note: Priors are expressed as N(mean, SD). T[1,∞) indicates truncation to positive values with lower bound at 1.
Disclaimer/Publisher’s Note: The statements, opinions and data contained in all publications are solely those of the individual author(s) and contributor(s) and not of MDPI and/or the editor(s). MDPI and/or the editor(s) disclaim responsibility for any injury to people or property resulting from any ideas, methods, instructions or products referred to in the content. |
© 2025 by the authors. Licensee MDPI, Basel, Switzerland. This article is an open access article distributed under the terms and conditions of the Creative Commons Attribution (CC BY) license (http://creativecommons.org/licenses/by/4.0/).
Copyright: This open access article is published under a Creative Commons CC BY 4.0 license, which permit the free download, distribution, and reuse, provided that the author and preprint are cited in any reuse.


