
Submitted:
22 October 2025
Posted:
24 October 2025
You are already at the latest version
Abstract
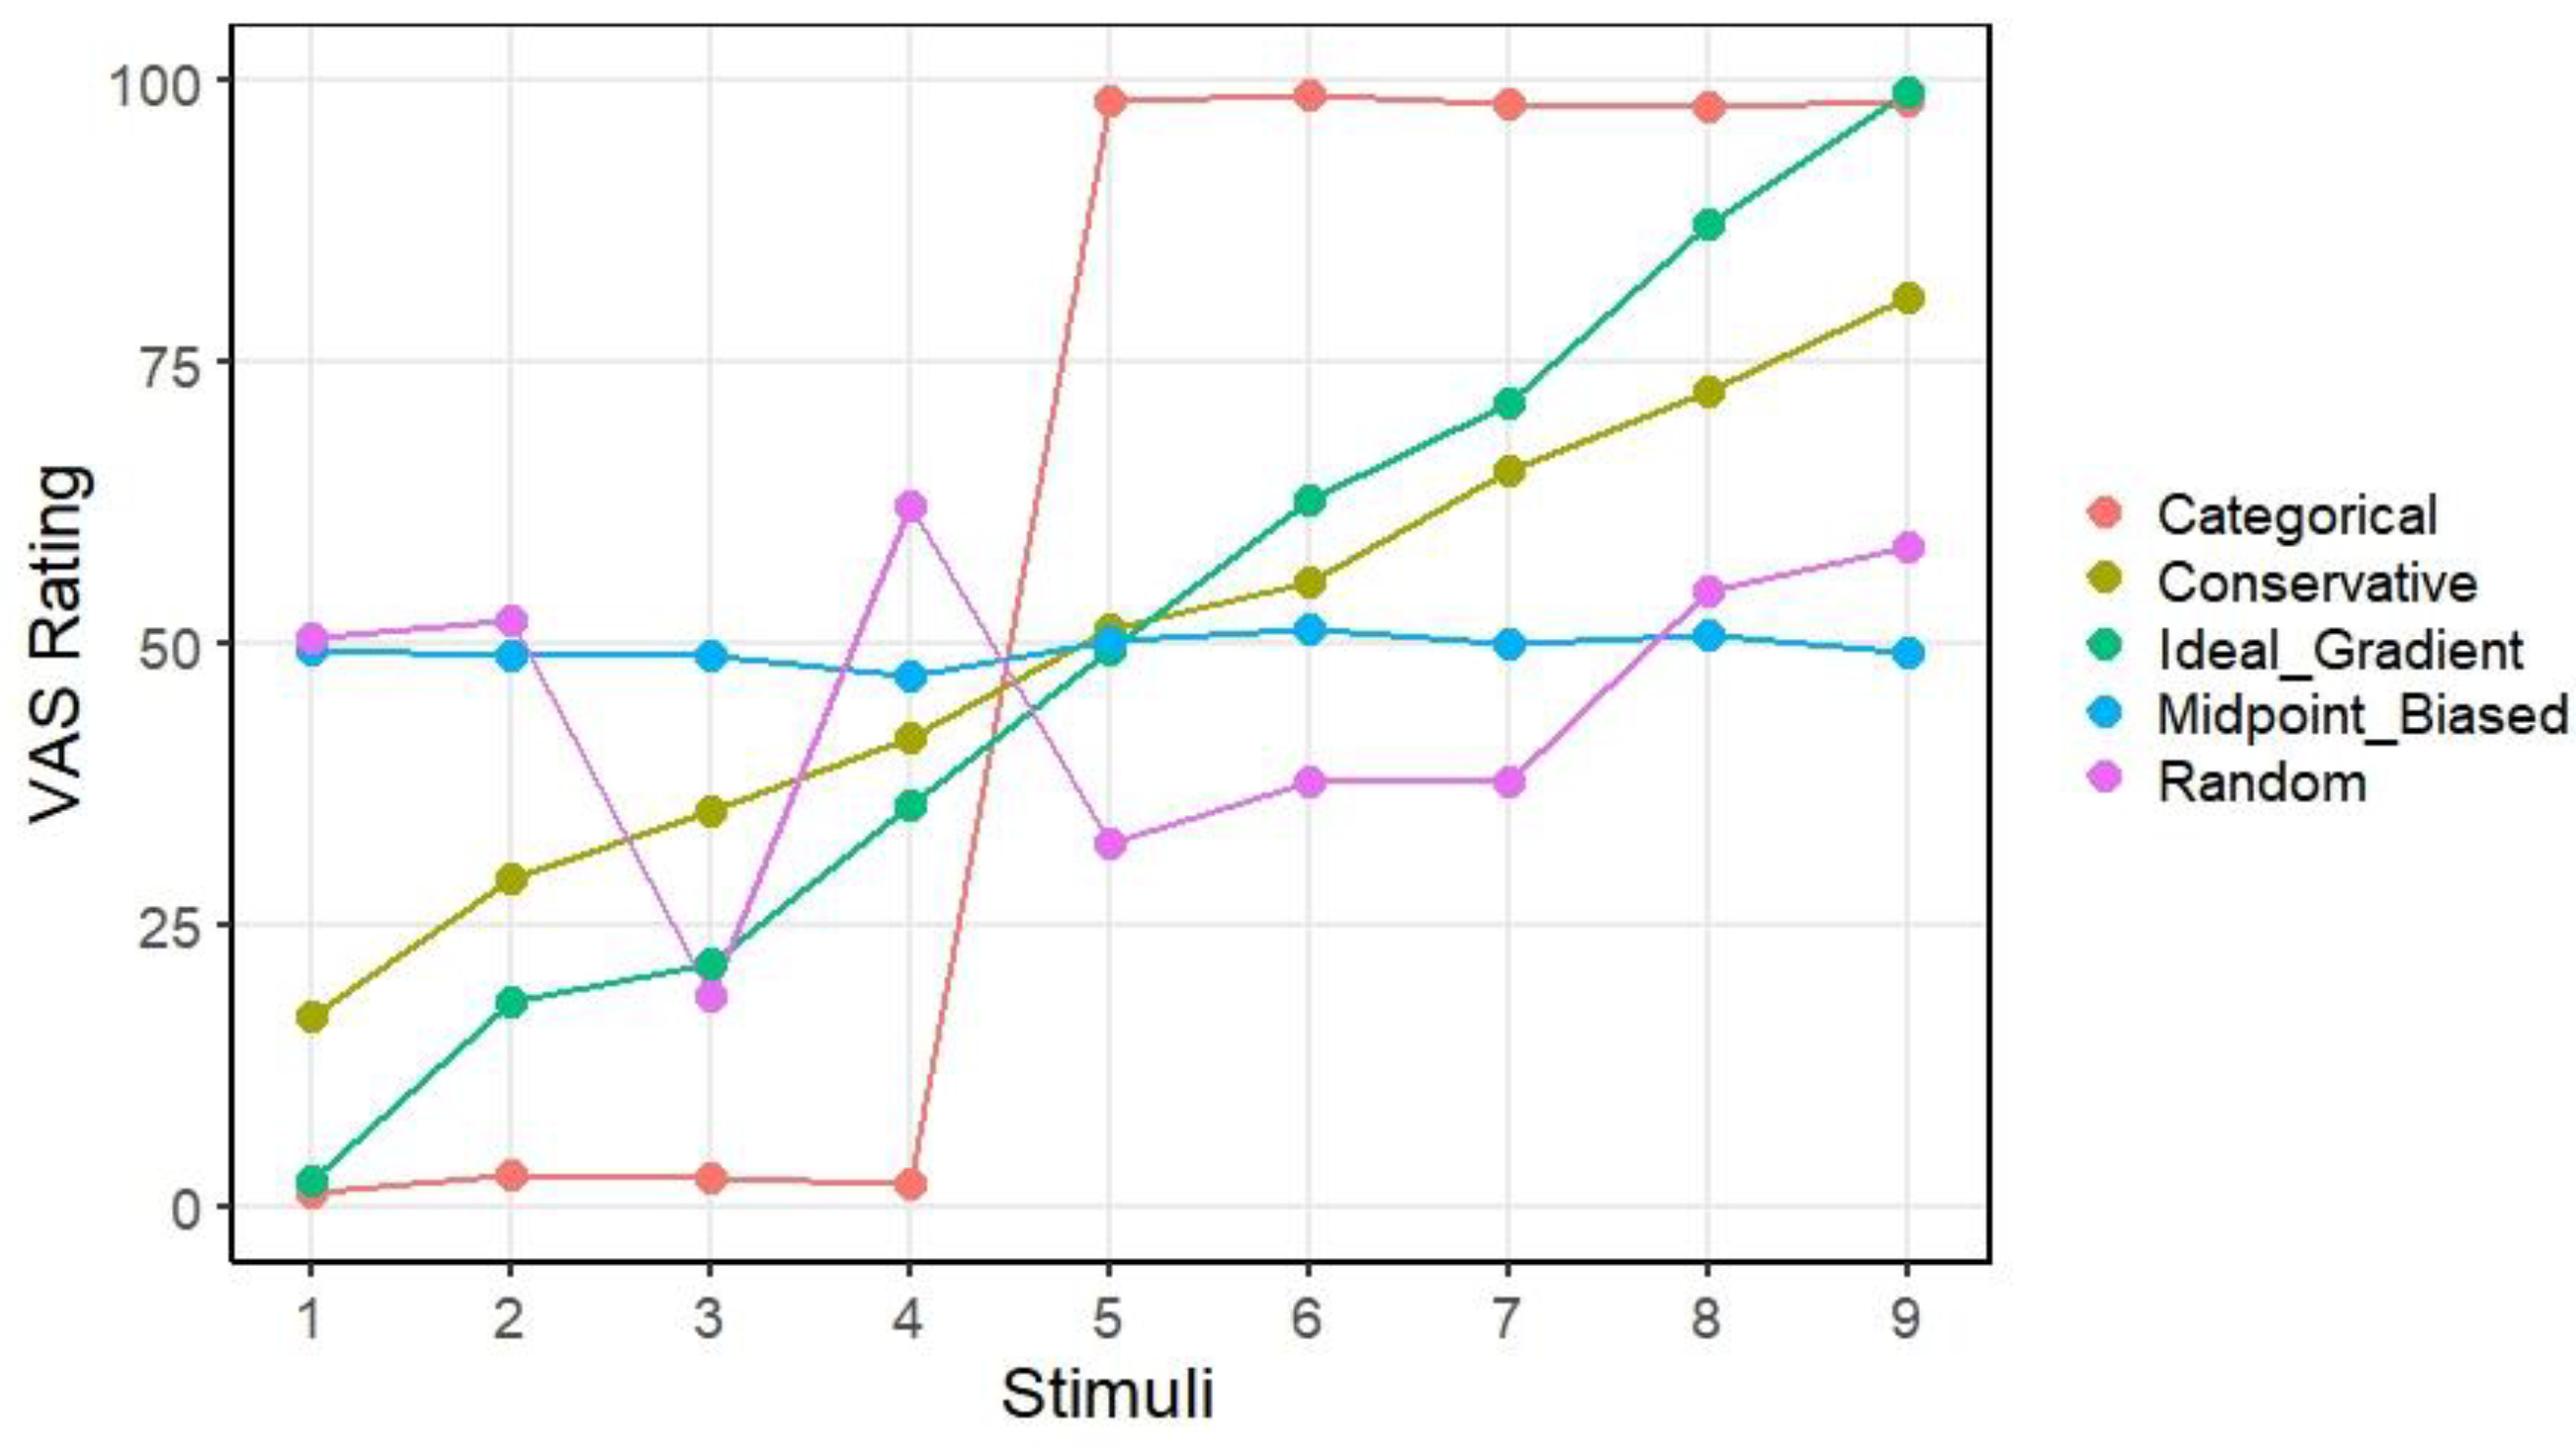
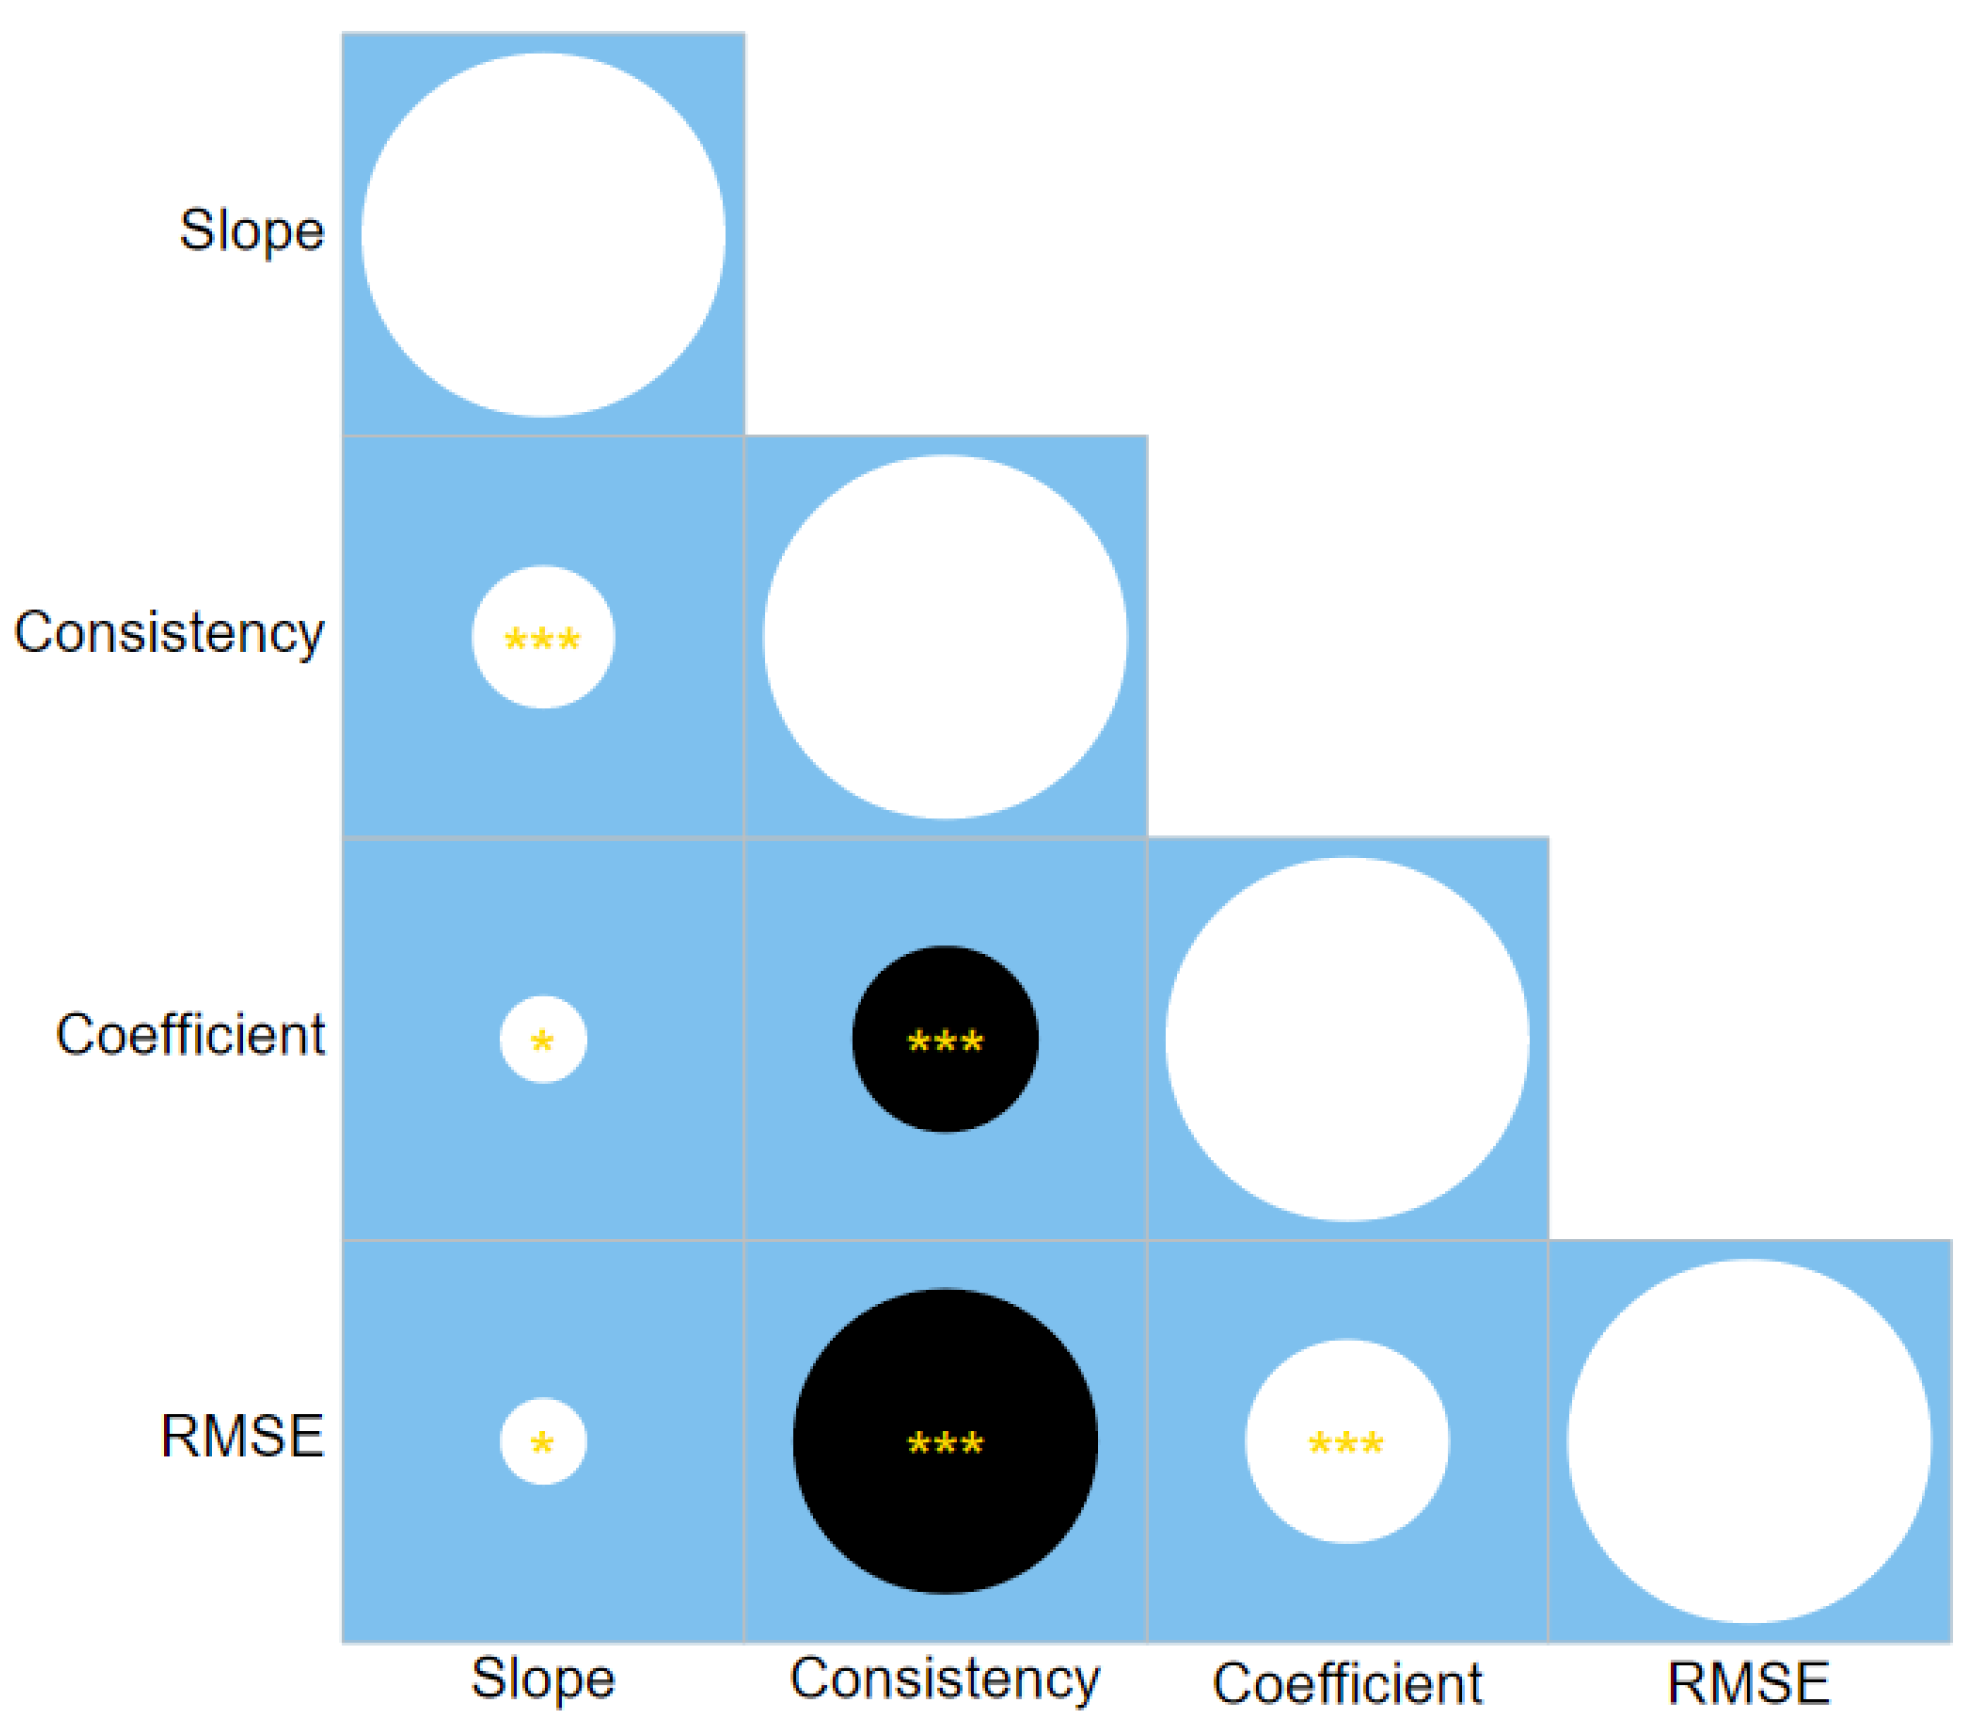
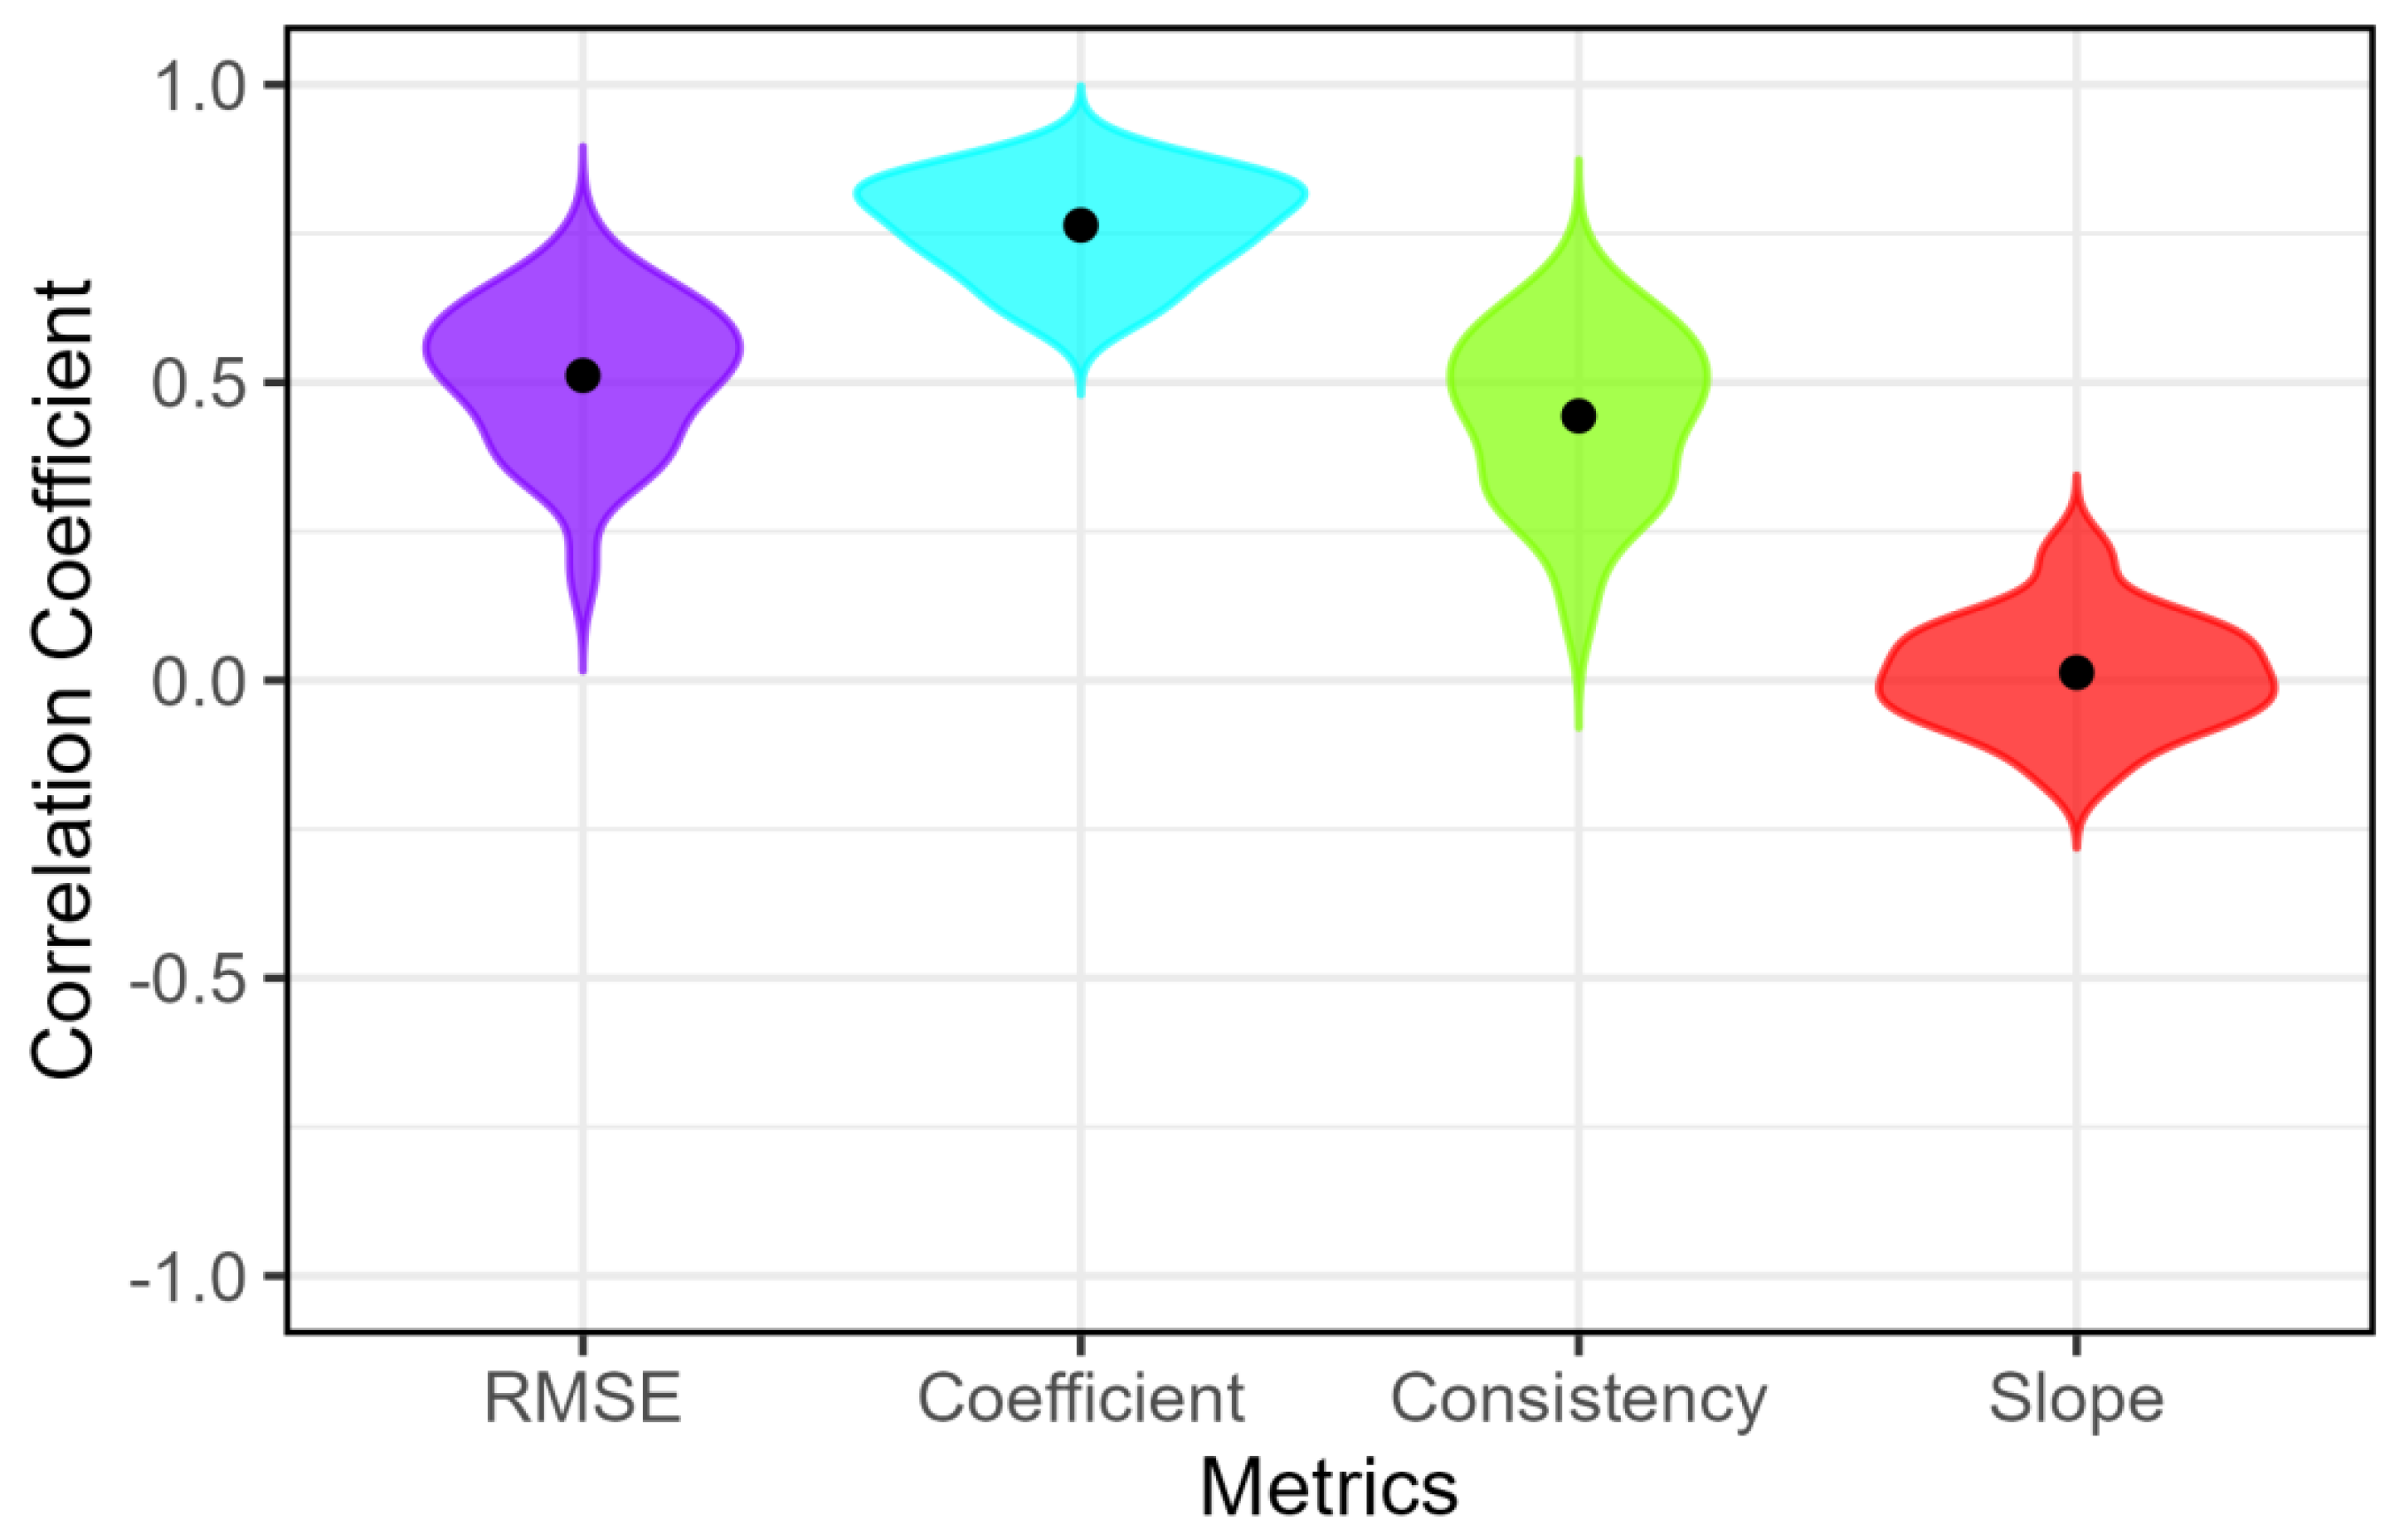
This study introduces the root mean square error (RMSE) as a new metric for quantifying gradient speech perception in visual analog scale (VAS) tasks. By measuring the deviation of individual responses from an ideal linear mapping between stimulus and percept, RMSE offers a theoretically transparent alternative to traditional metrics like slope, response consistency, and the quadratic coefficient. To validate these metrics, we first used simulated data representing five distinct perceptual response profiles: ideal gradient, categorical, random, midpoint-biased, and conservative. The results revealed that only RMSE correctly tracked the degree of true gradiency, increasing monotonically from the ideal gradient profile (RMSE = 5.48) to random responding (RMSE = 42.16). In contrast, traditional metrics failed critically; for example, slope misclassified non-gradient, midpoint-biased responding as highly gradient (slope = 0.24). When applied to published empirical VAS data, RMSE demonstrated strong convergent validity, correlating robustly with response consistency (r ranging from -0.44 to -0.89) while avoiding the ambiguities of other measures. Crucially, RMSE exhibited moderate-to-high cross-continuum stability (mean r = 0.51), indicating it captures a stable, trait-like perceptual style. By providing a more robust and interpretable measure, RMSE offers a clearer lens for investigating the continuous nature of phonetic categorization and individual differences in speech perception.
Keywords:
Introduction
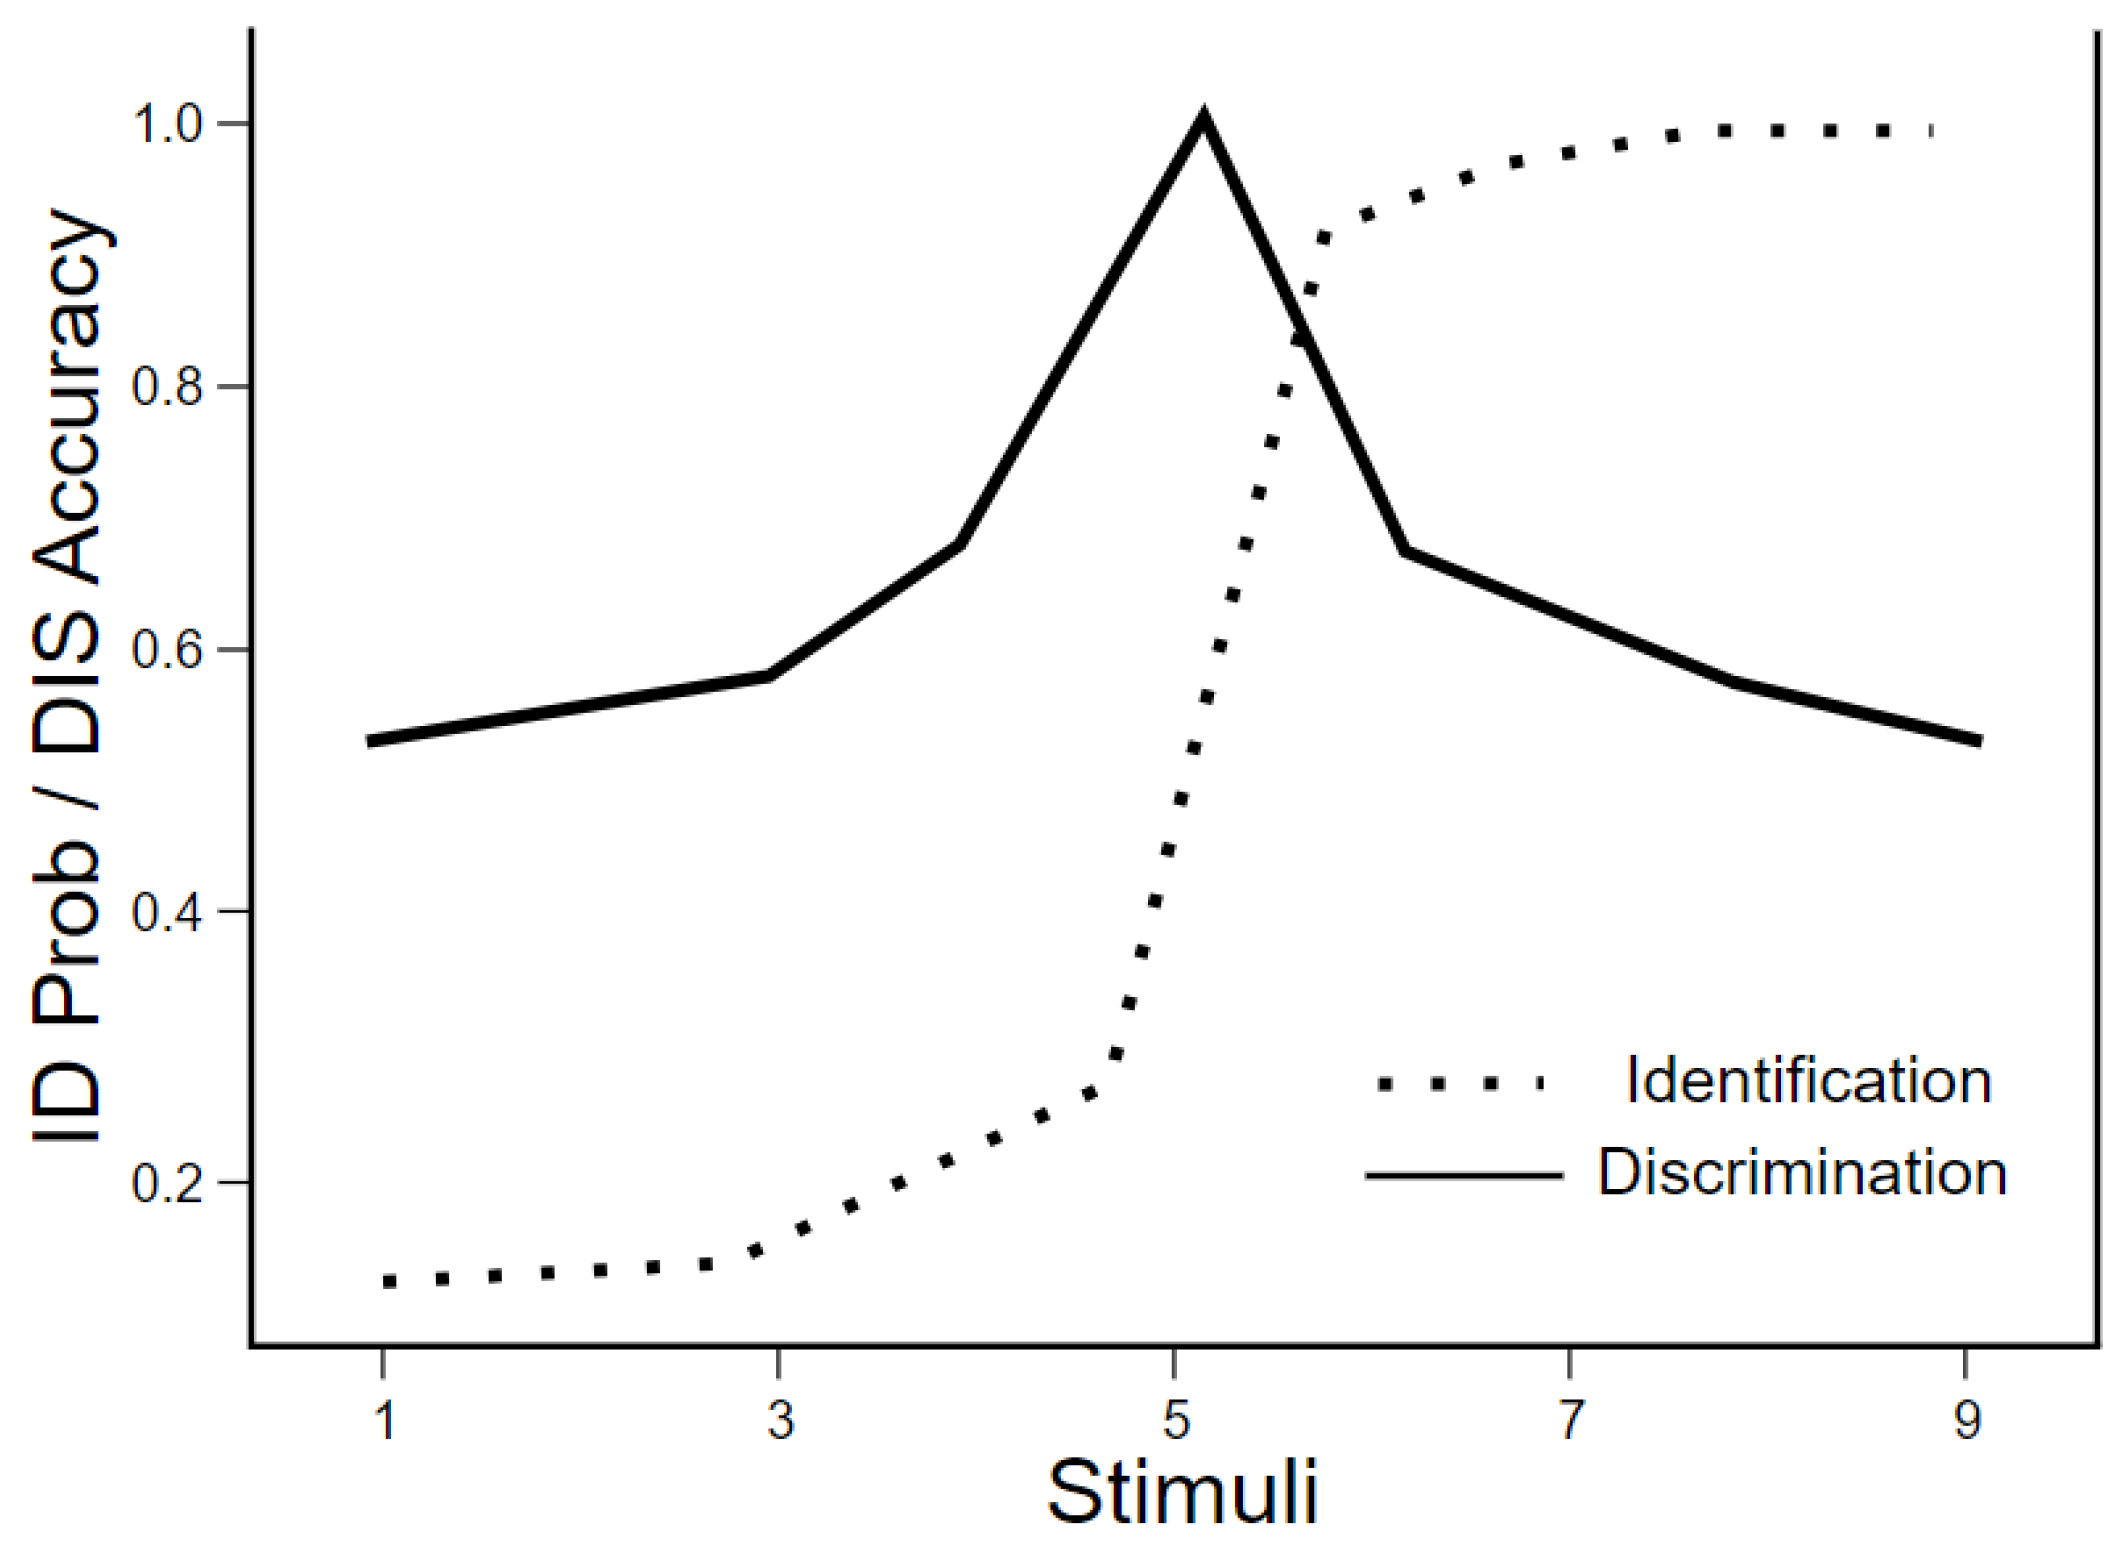
Categorical and Gradient Processing in Speech Perception
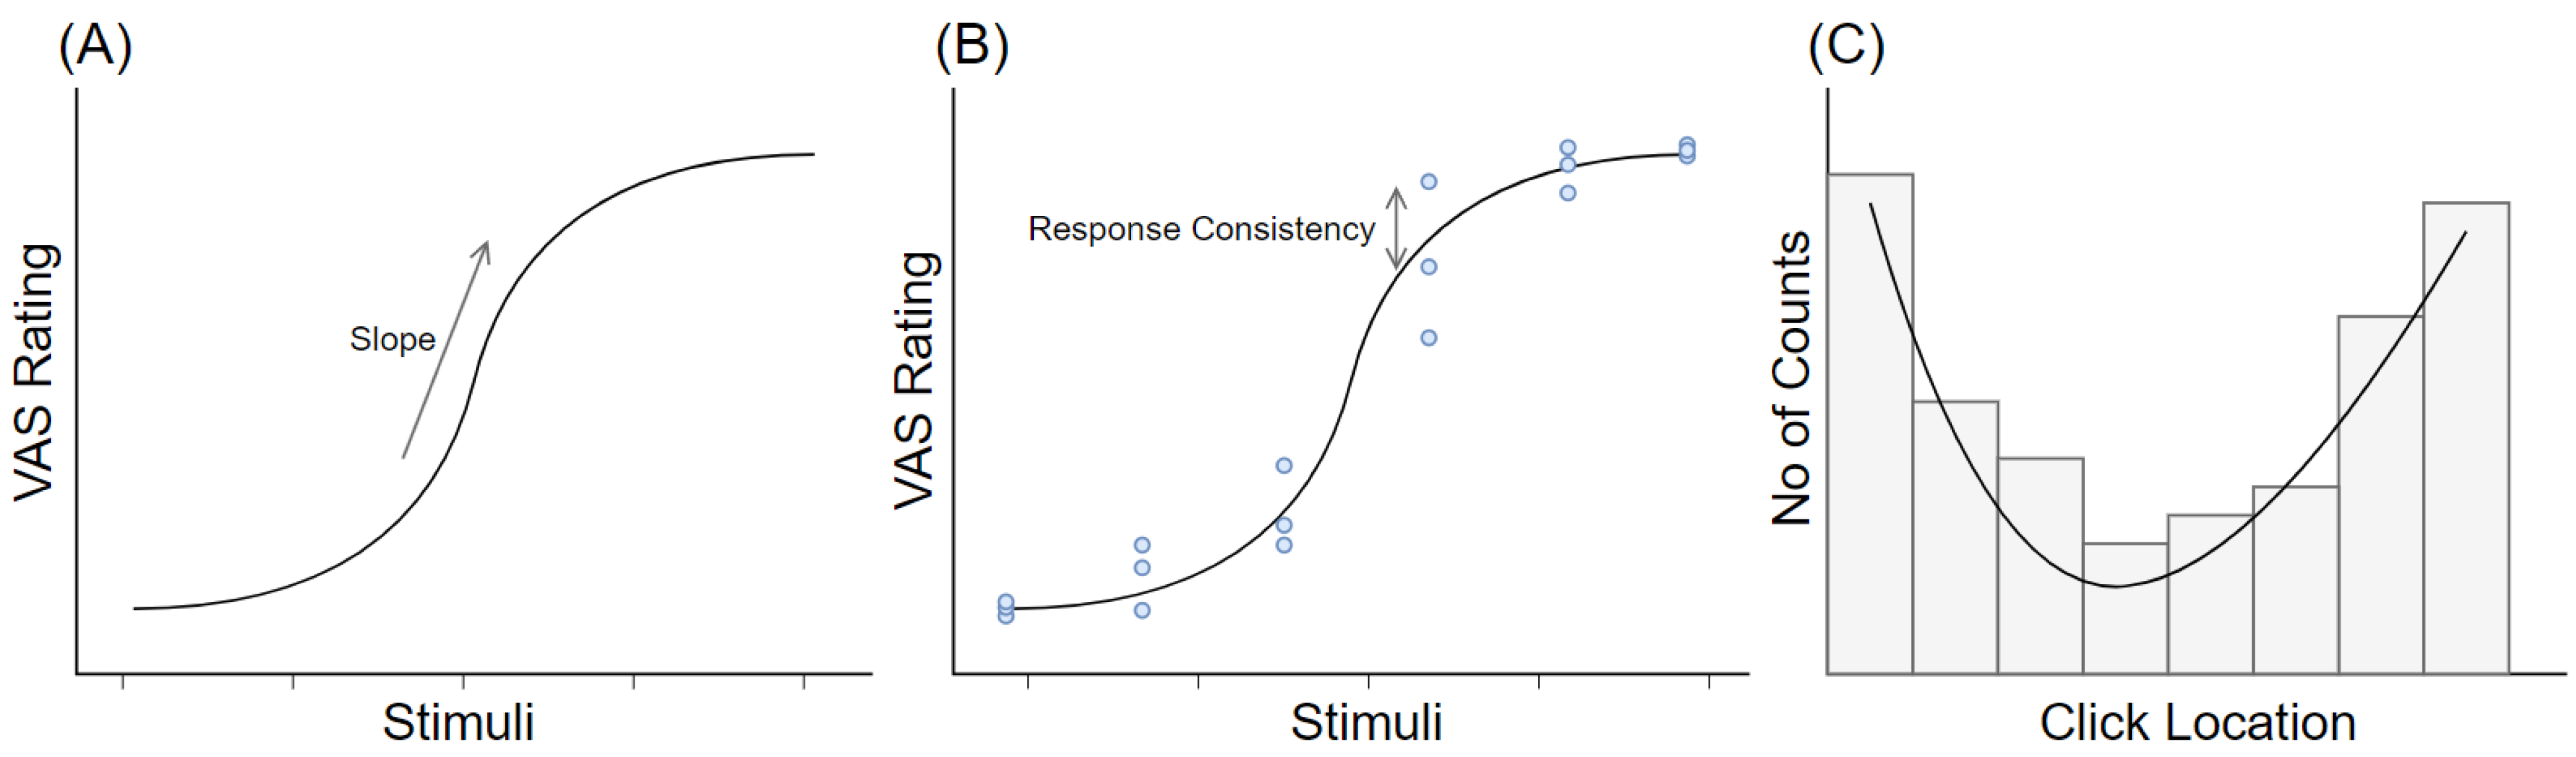
Existing Metrics and Their Limitations
The Present Study: RMSE as a Measure of Deviation from Linearity
Method
Data Source and Participants
Stimuli
Procedure
Data Analysis
Results
Simulated Data
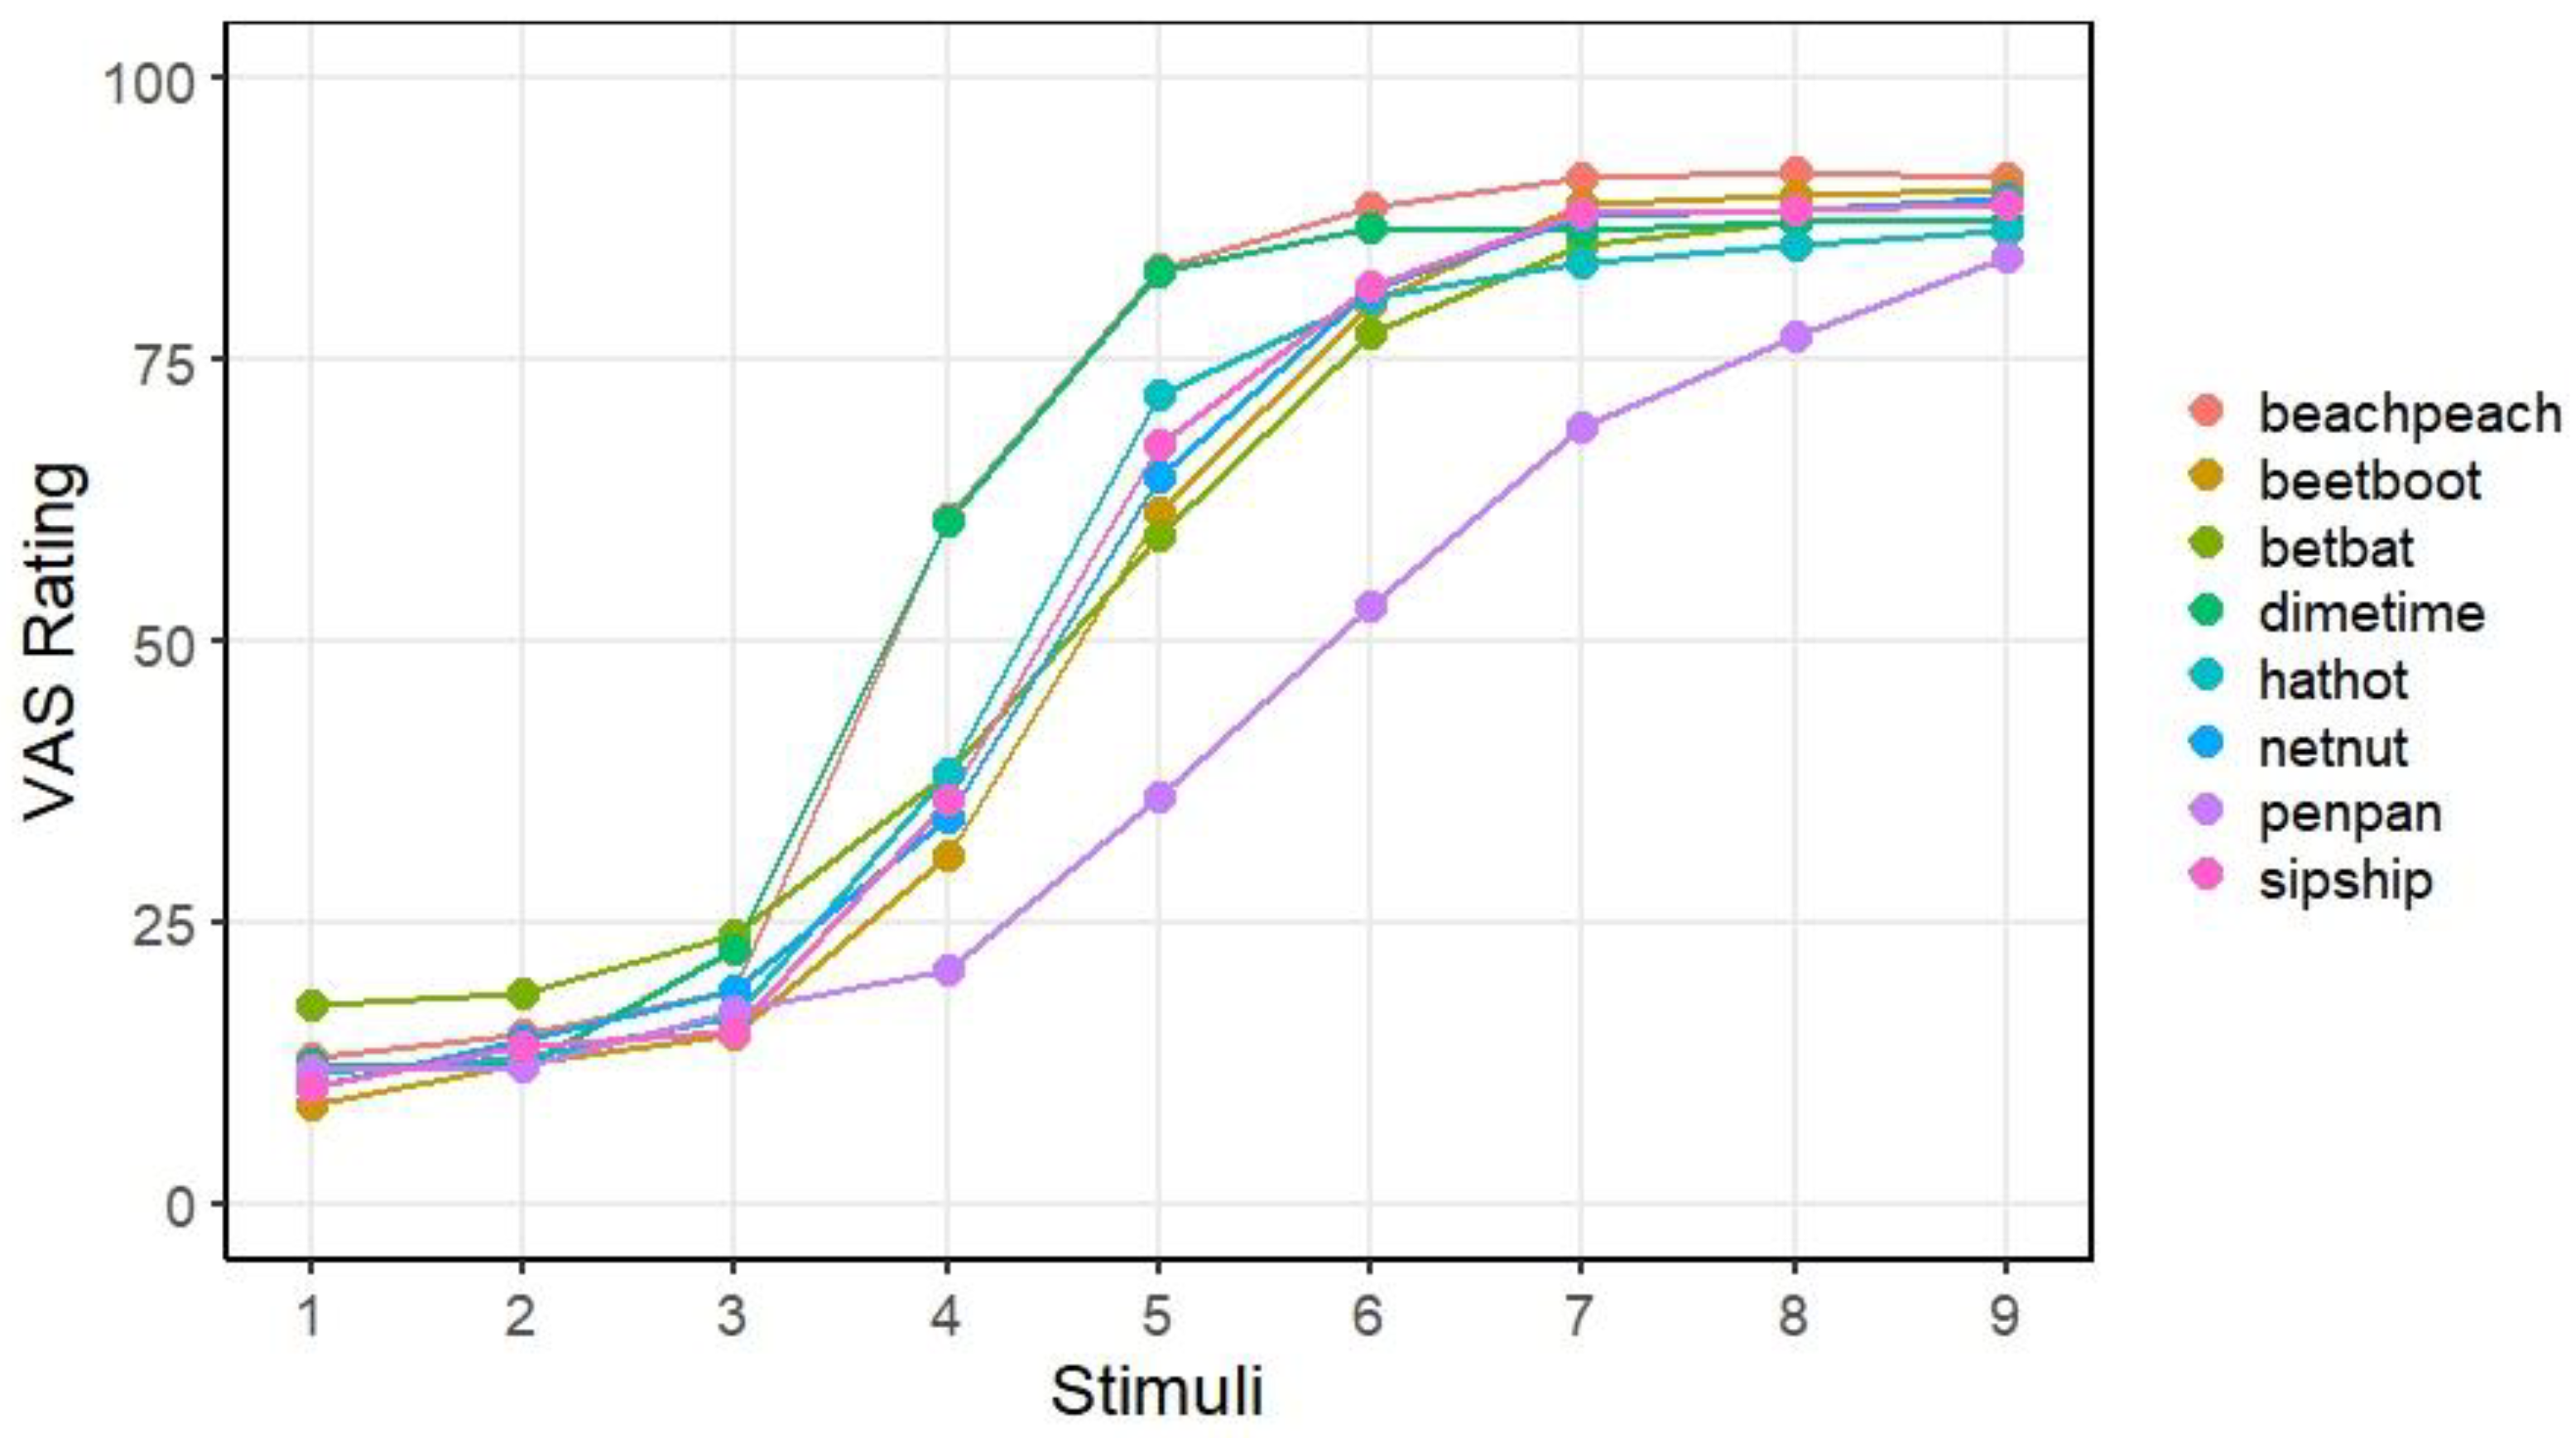
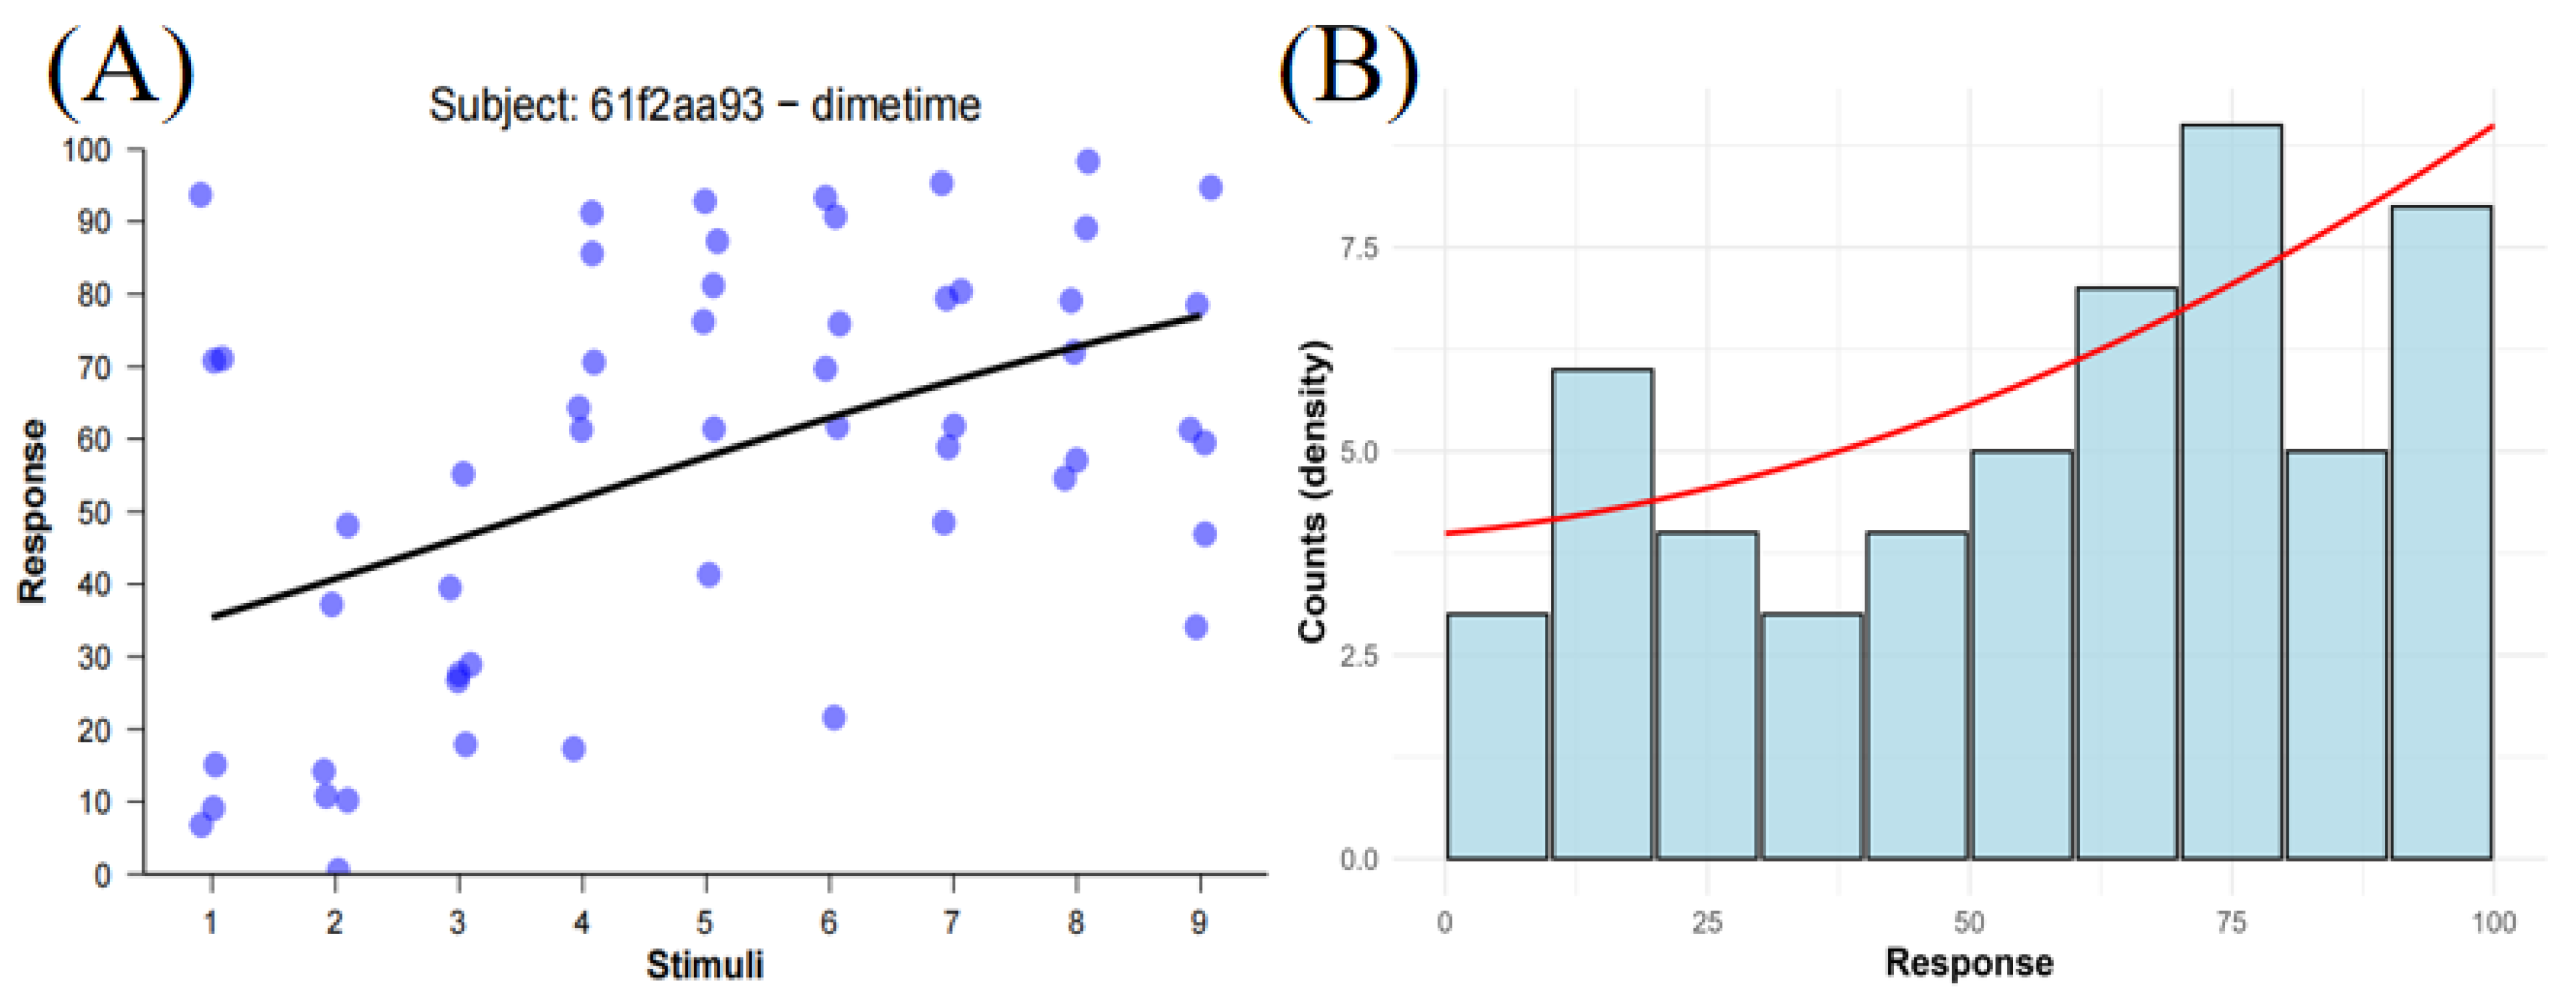
Empirical Data
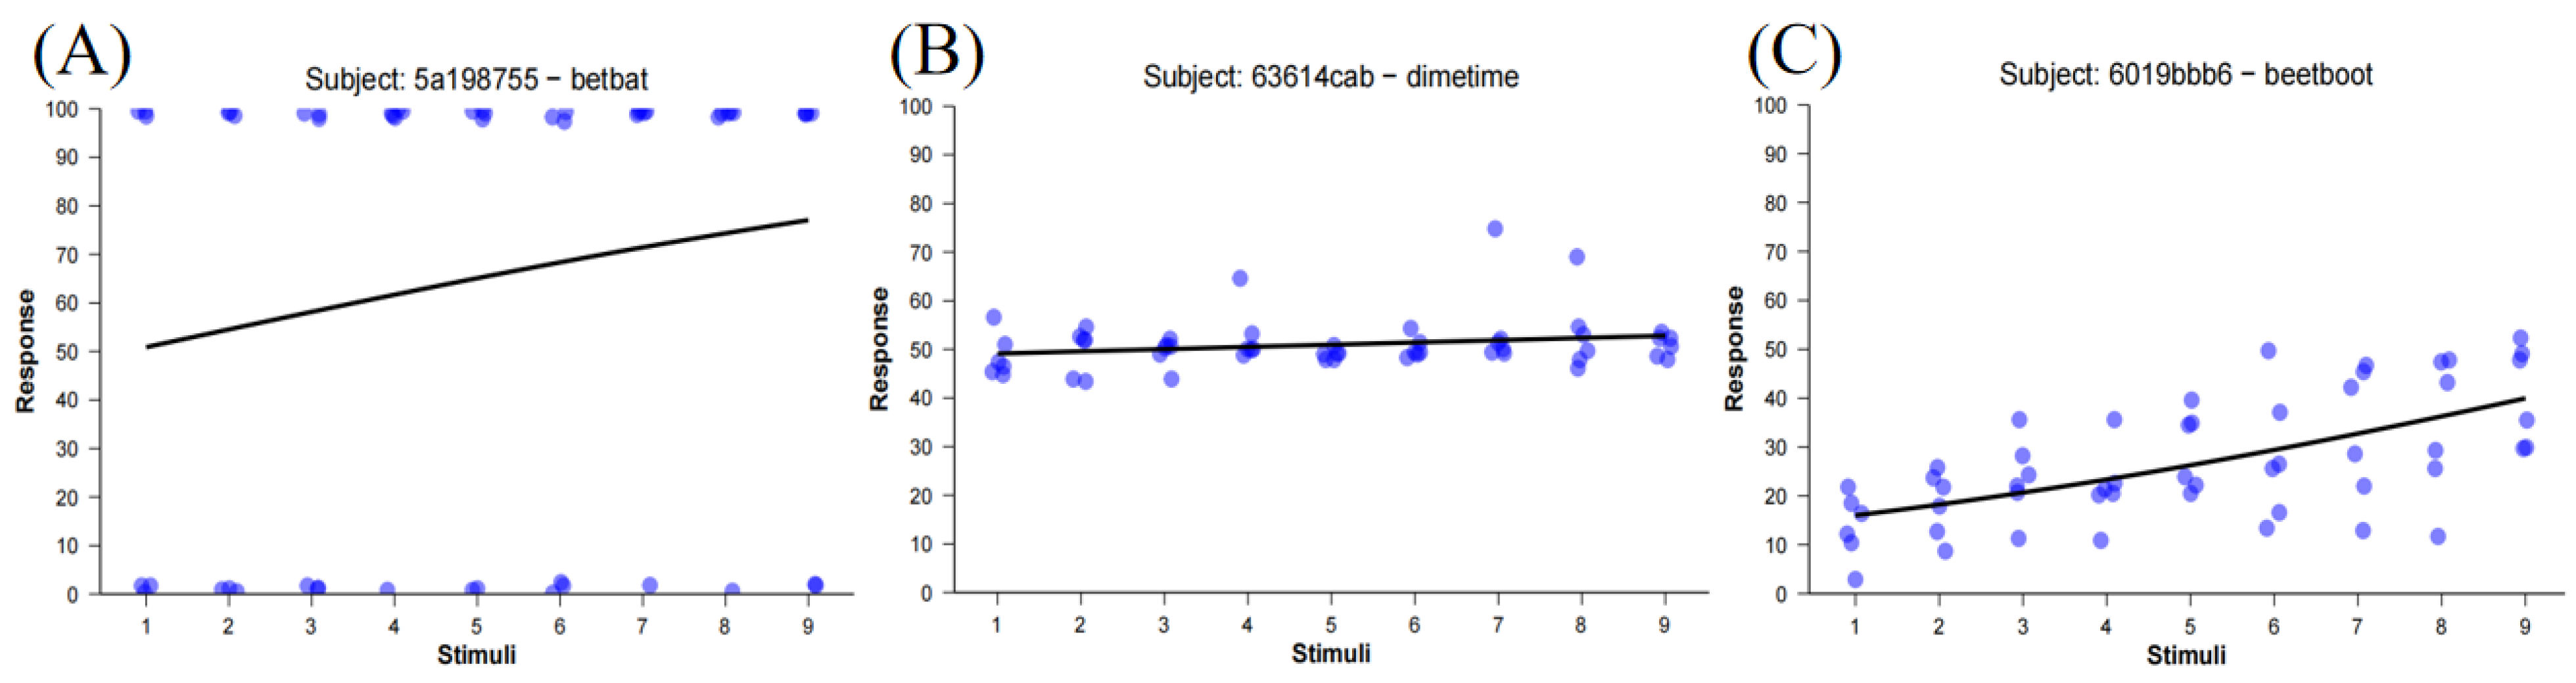
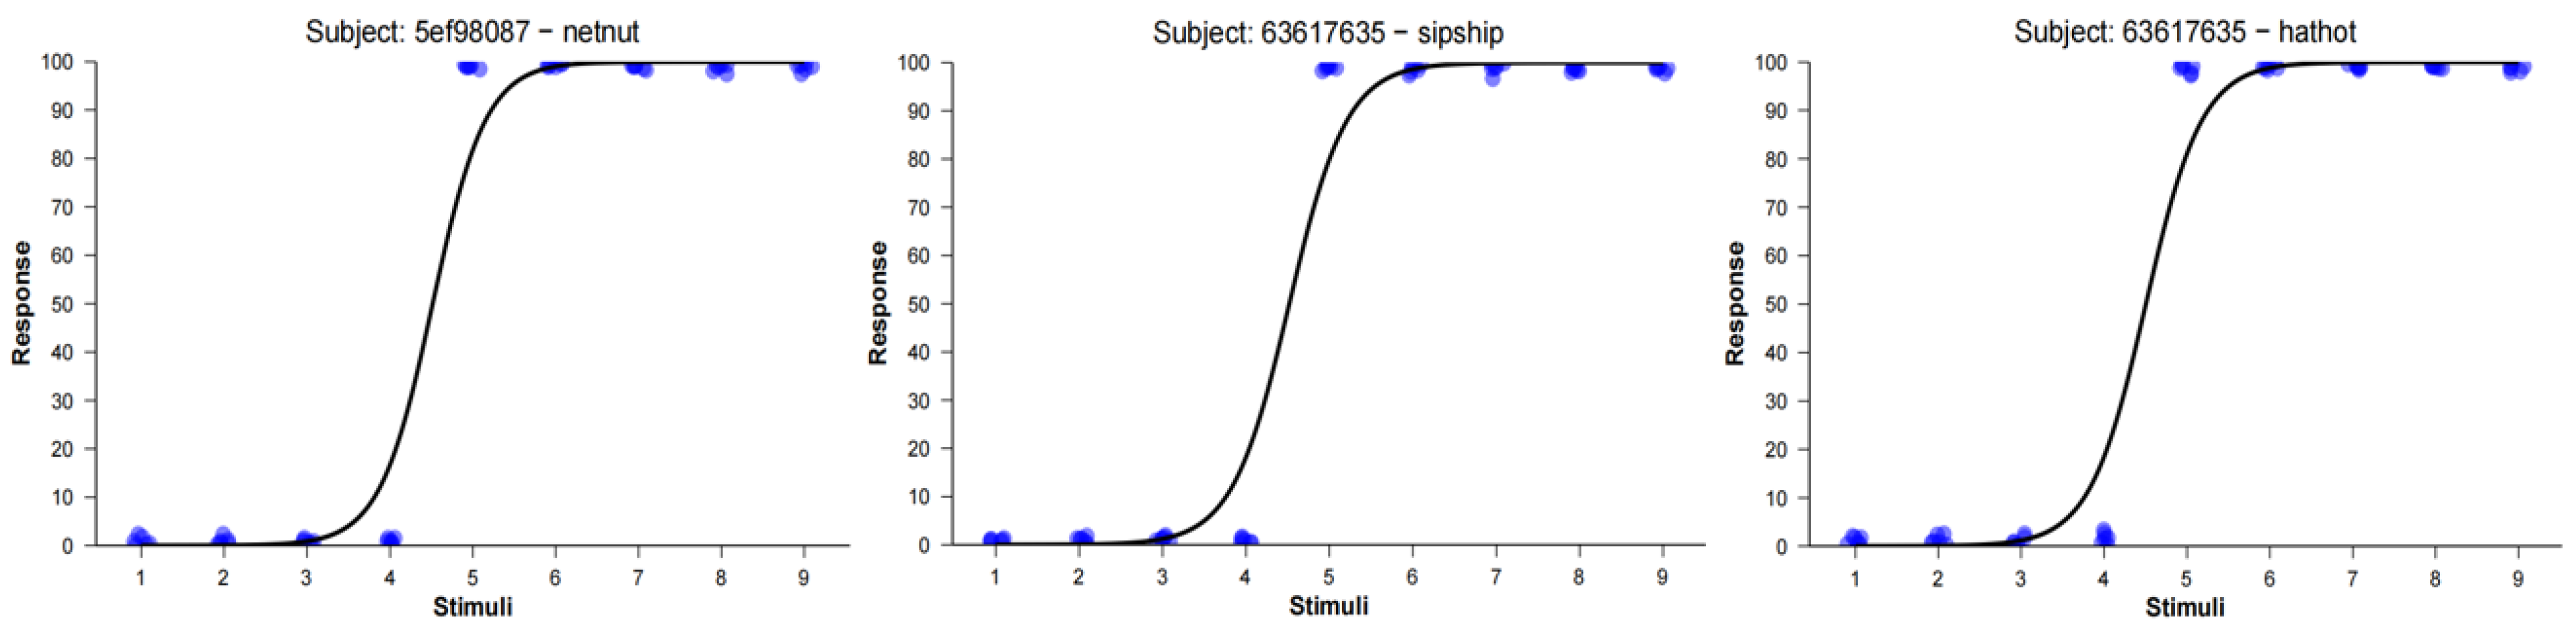
Failures of Traditional Metrics in Practice
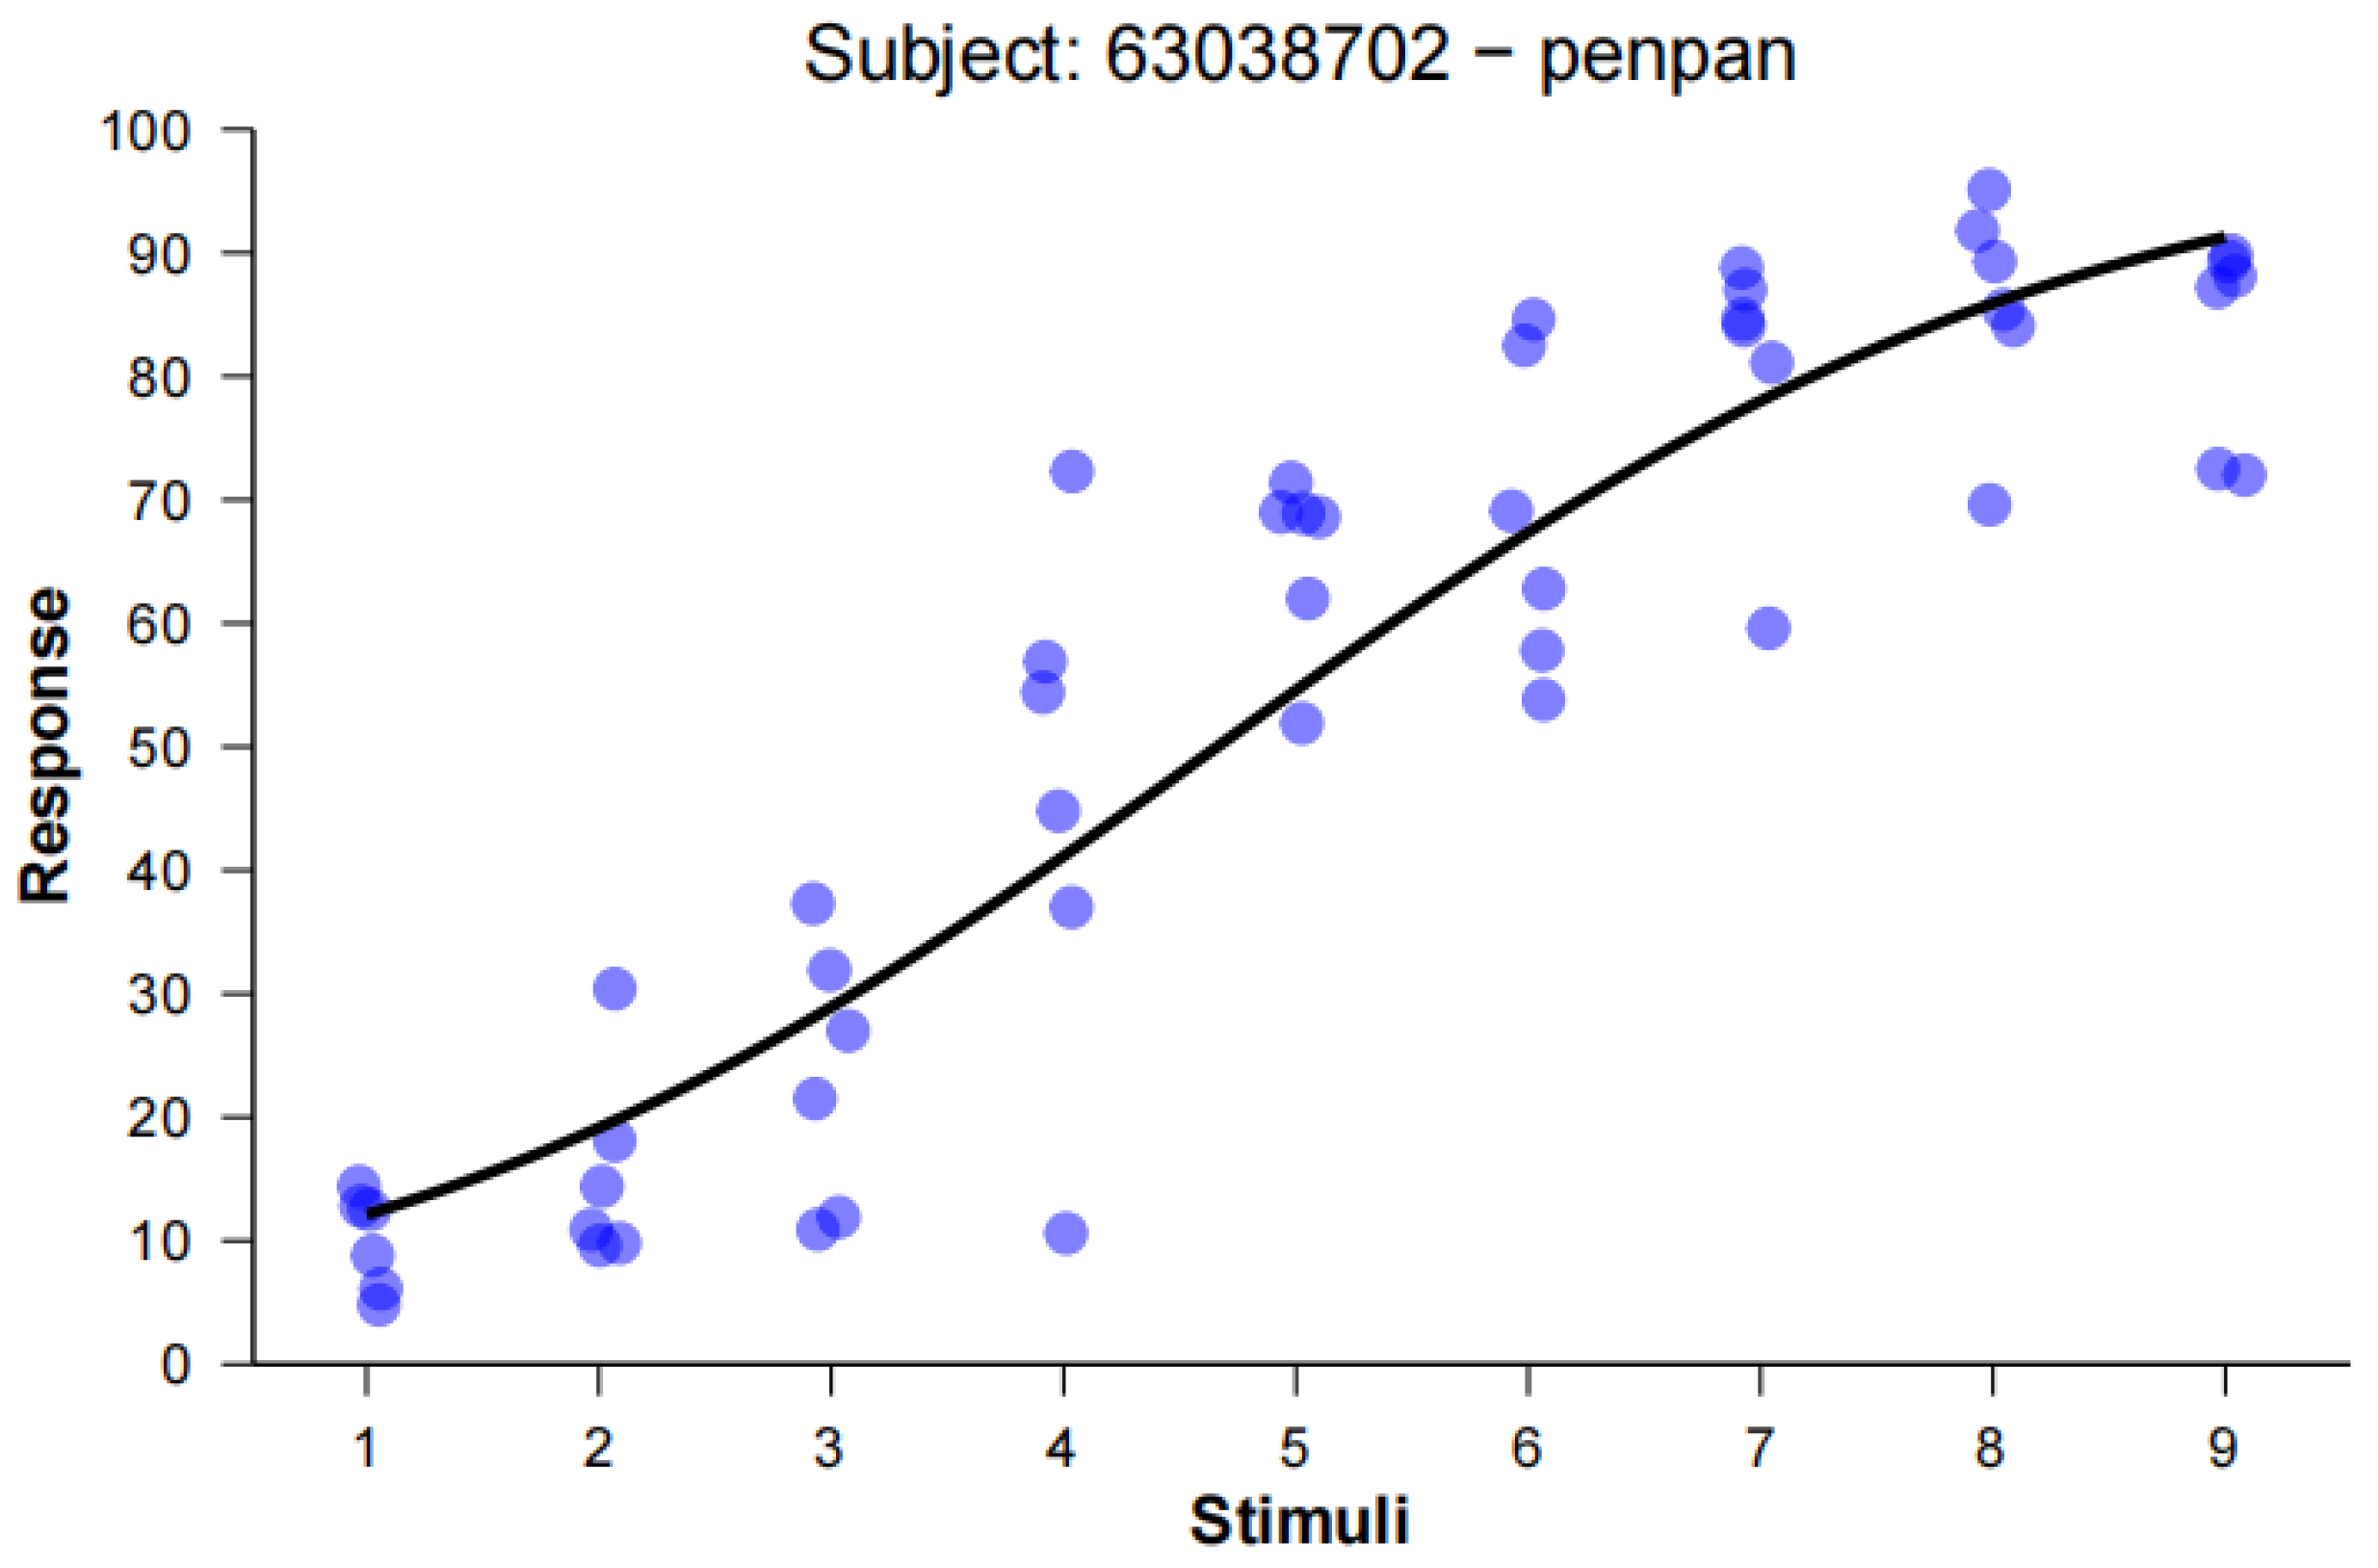
RMSE as a Valid and Stable Index of Gradiency
Discussion
Reinterpreting the Field: How RMSE Resolves Critical Flaws in Traditional Metrics
Theoretical and Practical Contributions of RMSE
Conclusion
Acknowledgments
Conflicts of Interest Statement
References
- Abramson, A. S., & Lisker, L. (1970). Discriminability along the voicing continuum: Cross-language tests. Proceedings of the sixth international congress of phonetic sciences, 196(7), 569-573. https://www.coli.uni-saarland.de/groups/FK/speech_science/icphs/ICPhS1967/p6_569.pdf.
- Anwyl-Irvine, A. L., Massonnié, J., Flitton, A., Kirkham, N., & Evershed, J. K. (2020). Gorilla in our midst: An online behavioral experiment builder. Behavior research methods, 52(1), 388-407. [CrossRef]
- Apfelbaum, K. S., Kutlu, E., McMurray, B., & Kapnoula, E. C. (2022). Don’t force it! Gradient speech categorization calls for continuous categorization tasks. Journal of the Acoustical Society of America, 152(6), 3728-3745. [CrossRef]
- Clayards, M., Tanenhaus, M. K., Aslin, R. N., & Jacobs, R. A. (2008). Perception of speech reflects optimal use of probabilistic speech cues. Cognition, 108(3), 804-809. [CrossRef]
- Flege, J. E., Bohn, O. S., & Jang, S. (1997). Effects of experience on non-native speakers’ production and perception of English vowels. Journal of phonetics, 25(4), 437-470. [CrossRef]
- Fuhrmeister, P., Phillips, M. C., McCoach, D. B., & Myers, E. B. (2023). Relationships Between Native and Non-Native Speech Perception. Journal of Experimental Psychology-Learning Memory and Cognition, 49(7), 1161-1175. [CrossRef]
- Goldinger, S. D., Pisoni, D. B., & Logan, J. S. (1991). On the Nature of Talker Variability Effects on Recall of Spoken Word Lists. Journal of Experimental Psychology-Learning Memory and Cognition, 17(1), 152-162. [CrossRef]
- Honda, C. T., Clayards, M., & Baum, S. R. (2024). Exploring Individual Differences in Native Phonetic Perception and Their Link to Nonnative Phonetic Perception. Journal of Experimental Psychology-Human Perception and Performance, 50(4), 370-394. [CrossRef]
- Kapnoula, E. C., Edwards, J., & McMurray, B. (2021). Gradient Activation of Speech Categories Facilitates Listeners’ Recovery From Lexical Garden Paths, But Not Perception of Speech-in-Noise. Journal of Experimental Psychology-Human Perception and Performance, 47(4), 578-595. [CrossRef]
- Kapnoula, E. C., & McMurray, B. (2021). Idiosyncratic use of bottom-up and top-down information leads to differences in speech perception flexibility: Converging evidence from ERPs and eye-tracking. Brain and Language, 223, 105031. [CrossRef]
- Kapnoula, E. C., & Samuel, A. G. (2024). Sensitivity to Subphonemic Differences in First Language Predicts Vocabulary Size in a Foreign Language. Language learning, 74(4), 950-984. [CrossRef]
- Kapnoula, E. C., Winn, M. B., Kong, E. J., Edwards, J., & McMurray, B. (2017). Evaluating the Sources and Functions of Gradiency in Phoneme Categorization: An Individual Differences Approach. Journal of Experimental Psychology-Human Perception and Performance, 43(9), 1594-1611. [CrossRef]
- Kim, D., Clayards, M., & Kong, E. J. (2020). Individual differences in perceptual adaptation to unfamiliar phonetic categories. Journal of phonetics, 81, 100984. [CrossRef]
- Kim, H., Mcmurray, B., Sorensen, E., & Oleson, J. (2025). The consistency of categorization-consistency in speech perception. Psychonomic Bulletin & Review. [CrossRef]
- Kong, E., & Edwards, J. (2011). Individual Differences in Speech Perception: Evidence from Visual Analogue Scaling and Eye-Tracking. ICPhS, 1126-1129. https://learningtotalk.umd.edu/wp-content/uploads/2017/03/KongEJ2011.pdf.
- Kong, E. J. (2019). Individual differences in categorical perception: L1 English learners’ L2 perception of Korean stops. Phonetics and Speech Sciences, 11(4), 63-70. [CrossRef]
- Kong, E. J., & Edwards, J. (2016). Individual differences in categorical perception of speech: Cue weighting and executive function. Journal of phonetics, 59, 40-57. [CrossRef]
- Kutlu, E., Baxelbaum, K., Sorensen, E., Oleson, J., & McMurray, B. (2024). Linguistic diversity shapes flexible speech perception in school age children. Scientific Reports, 14(1), 28825. [CrossRef]
- Lee, J. U., & Park, H. (2024). Acoustic cue sensitivity in the perception of native category and their relation to nonnative phonological contrast learning. Journal of phonetics, 104, 101327. [CrossRef]
- Liberman, A. M., Harris, K. S., Hoffman, H. S., & Griffith, B. C. (1957). The Discrimination of Speech Sounds within and across Phoneme Boundaries. Journal of Experimental Psychology, 54(5), 358-368. [CrossRef]
- Lisker, L., & Abramson, A. S. (1964). A Cross-Language Study of Voicing in Initial Stops - Acoustical Measurements. Word-Journal of the International Linguistic Association, 20(3), 384-422. [CrossRef]
- Massaro, D. W., & Cohen, M. M. (1983). Evaluation and Integration of Visual and Auditory Information in Speech-Perception. Journal of Experimental Psychology-Human Perception and Performance, 9(5), 753-771. [CrossRef]
- McMurray, B. (2022). The myth of categorical perception. Journal of the Acoustical Society of America, 152(6), 3819-3842. [CrossRef]
- McMurray, B., Samelson, V. M., Lee, S. H., & Tomblin, J. B. (2010). Individual differences in online spoken word recognition: Implications for SLI. Cognitive Psychology, 60(1), 1-39. [CrossRef]
- McMurray, B., Spivey, M. J., Aslin, R. N., Tanenhaus, M. K., & Subik, D. (2008). Gradient Sensitivity to Within-Category Variation in Words and Syllables. Journal of Experimental Psychology-Human Perception and Performance, 34(6), 1609-1631. [CrossRef]
- McMurray, B., Tanenhaus, M. K., & Aslin, R. N. (2002). Gradient effects of within-category phonetic variation on lexical access. Cognition, 86(2), B33-B42. [CrossRef]
- Munson, B., & Carlson, K. U. (2016). An Exploration of Methods for Rating Children’s Productions of Sibilant Fricatives. Speech Lang Hear, 19(1), 36-45. [CrossRef]
- Myers, E., Phillips, M., & Skoe, E. (2024). Individual differences in the perception of phonetic category structure predict speech-in-noise performance. Journal of the Acoustical Society of America, 156(3), 1707-1719. [CrossRef]
- Ohde, R. N. (1984). Fundamental-Frequency as an Acoustic Correlate of Stop Consonant Voicing. Journal of the Acoustical Society of America, 75(1), 224-230. [CrossRef]
- Ou, J. H., & Yu, A. C. L. (2022). Neural correlates of individual differences in speech categorisation: evidence from subcortical, cortical, and behavioural measures. Language Cognition and Neuroscience, 37(3), 269-284. [CrossRef]
- Ou, J. H., Yu, A. C. L., & Xiang, M. (2021). Individual Differences in Categorization Gradience As Predicted by Online Processing of Phonetic Cues During Spoken Word Recognition: Evidence From Eye Movements. Cognitive science, 45(3), e12948. [CrossRef]
- Pisoni, D. B. (1973). Auditory and phonetic memory codes in the discrimination of consonants and vowels. Percept Psychophys, 13(2), 253-260. [CrossRef]
- Sarrett, M. E., McMurray, B., & Kapnoula, E. C. (2020). Dynamic EEG analysis during language comprehension reveals interactive cascades between perceptual processing and sentential expectations. Brain and Language, 211, 104875. [CrossRef]
- Stevens, K. N., & Klatt, D. H. (1974). Role of Formant Transitions in Voiced-Voiceless Distinction for Stops. Journal of the Acoustical Society of America, 55(3), 653-659. [CrossRef]
- Theodore, R. M., Myers, E. B., & Lomibao, J. A. (2015). Talker-specific influences on phonetic category structure. Journal of the Acoustical Society of America, 138(2), 1068-1078. [CrossRef]
- Walther, B. A., & Moore, J. L. (2005). The concepts of bias, precision and accuracy, and their use in testing the performance of species richness estimators, with a literature review of estimator performance. Ecography, 28(6), 815-829. [CrossRef]
- Winn, M. B., Chatterjee, M., & Idsardi, W. J. (2013). Roles of voice onset time and F0 in stop consonant voicing perception: effects of masking noise and low-pass filtering. J Speech Lang Hear Res, 56(4), 1097-1107. [CrossRef]

| Response Pattern | Slope | Response Consistency | Quadratic Coefficient | RMSE |
|---|---|---|---|---|
| Ideal Gradient | 12.781 | -5.263 | 0.189 | 5.481 |
| Categorical | 570.263 | -2.285 | 2.273 | 26.194 |
| Random | 81.936 | -28.934 | 0.070 | 42.159 |
| Midpoint-Biased | 0.241 | -4.038 | -1.515 | 32.063 |
| Conservative | 11.129 | -4.736 | -0.765 | 13.378 |
Disclaimer/Publisher’s Note: The statements, opinions and data contained in all publications are solely those of the individual author(s) and contributor(s) and not of MDPI and/or the editor(s). MDPI and/or the editor(s) disclaim responsibility for any injury to people or property resulting from any ideas, methods, instructions or products referred to in the content. |
© 2025 by the authors. Licensee MDPI, Basel, Switzerland. This article is an open access article distributed under the terms and conditions of the Creative Commons Attribution (CC BY) license (http://creativecommons.org/licenses/by/4.0/).


