
Submitted:
22 October 2025
Posted:
23 October 2025
You are already at the latest version
Abstract
The mechanisms linking speech production and perception remain underspecified, particularly in how segmental and suprasegmental features are processed across different contextual variations. This study investigated whether perceptual cue weighting could be predicted by distributional reliability of acoustic cues in production, focusing on the Mandarin Tone 2-Tone 3 contrast across both gradient coarticulatory (T1, T2, T4) and categorical tone sandhi (T3) contexts. We quantified production distributional reliability using the Bhattacharyya coefficient and assessed perceptual cue weighting through relative weight analysis. Bayesian mixed-effects modeling showed strong evidence for context-dependent acoustic distributions in production (BF₁₀ = 9.87 × 10²⁸) and perception (BF₁₀ = 4.56 × 10153). Critically, production-perception coupling emerged selectively. In gradient contexts, higher production reliability strongly predicted perceptual weighting (BF₁₀ = 12.48), with robust negative correlations for critical cues in T2 (Cohen’s d = -2.51, 95% CI [-2.93, -2.09]) and T4 contexts (d = -1.76, 95% CI [-2.28, -1.26]), but not in T1 context (d = -0.30, 95% CI [-1.02, 0.43]). No such coupling was observed for secondary cues across contexts (|d| < 0.8). In contrast, in the categorical T3 sandhi context, production statistics did not predict perceptual weights. These findings reveal a context-sensitive production-perception relationship: tightly coupled in gradient coarticulatory contexts, but dissociated in categorical rule-governed environments. This pattern supports a dual-route model for tone processing involving a statistical-auditory stream for phonetic variations and a symbolic-phonological stream for abstract alternations.
Keywords:
distributional reliability
; perceptual cue weighting
; production-perception relationship
; tone sandhi
; dual-route processing
Introduction
A foundational principle in speech science holds that production and perception are inherently linked (Liberman & Mattingly, 1985; Liberman & Whalen, 2000), forming the theoretical basis for how listeners interpret highly variable acoustic signals to extract linguistic meaning (Farris-Trimble & McMurray, 2011). Yet, the precise mechanisms underlying this production-perception link remain underspecified, particularly in relation to diverse linguistic features. Most empirical work has focused on segmental contrasts within non-tonal languages, creating a significant gap in our understanding of suprasegmental features such as lexical tone (Xie et al., 2021). This gap is especially critical because lexical tones exhibit two qualitatively different types of contextual variation: gradient coarticulation, which yields continuous, phonetically motivated acoustic shifts, and categorical phonological rules, which generate discrete alternations governed by abstract linguistic constraints. These distinct forms of variation may recruit different processing mechanisms. Understanding how the production–perception link operates across them is essential for building comprehensive models of speech processing.
The present study addresses this gap by investigating whether listeners’ perceptual cue weighting for Mandarin lexical tones can be systematically predicted by the distributional reliability of acoustic cues in production. By directly comparing gradient coarticulatory contexts with categorical phonological rule contexts, we test whether a unified mechanism underlies the production–perception relationship or whether distinct processing pathways are engaged depending on the type of variation.
Production-Perception Links: Theoretical Debate and Mixed Evidence
The nature of the production-perception relationship has long been the subject of theoretical debate. Classic frameworks such as the motor theory (Liberman et al., 1952, 1967; Liberman & Mattingly, 1985, 1989) and direct realist theories (Best, 1995; Fowler, 1986) propose a tightly integrated system in which listeners perceive the articulatory gestures intended by speakers. In contrast, the general auditory perspective posits that production and perception converge on shared acoustic targets, emphasizing signal-based over gesture-based representation (e.g., Diehl et al., 2004). More recent perspectives conceptualize this relationship as a dynamic, information-level coupling: rather than producing single, discrete acoustic targets, speakers generate context-constrained probabilistic distributions of possible signals (Farris-Trimble & McMurray, 2011). In turn, the perceptual system is highly sensitive to these distributional properties, using them to make probabilistic inferences about sound identity. This view aligns with connectionist and Bayesian models of speech, which emphasize listeners’ ability to integrate variable and uncertain input in a rational, inference-based manner (e.g., Clayards et al., 2008; Feldman et al., 2009; McClelland & Elman, 1986).
Empirical tests of these theoretical models have produced complex and sometimes contradictory findings, contributing to an ongoing paradox. On one hand, multiple lines of evidence provide strong support for a global production-perception link. Imitation and shadowing studies, for instance, consistently demonstrate that listeners’ productions become acoustically more similar to recently heard speech, suggesting direct perceptual influence on motor output (Goldinger, 1998; Goldinger & Azuma, 2004; Shockley et al., 2004). Training studies also show bidirectional transfer effects: training in one modality (either perception or production) leads to measurable changes in the other (Bradlow et al., 1997; Leather, 1990; Wang et al., 1999; Zhang et al., 2023). Together, these findings support the view that speech production and perception are fundamentally interconnected systems.
However, a more complex and sometimes contradictory picture emerges when examining acoustic cue use at a fine-grained level. Phonetic categories are inherently multidimensional, defined by constellations of acoustic cues rather than single features. A consistent finding across studies is the lack of straightforward correlations between how individuals weight specific cues in their own production and how they weight those same cues in perceiving others’ speech. This dissociation has been documented across various speech contrasts, including English stop voicing (Schertz et al., 2015; Shultz et al., 2012), the English /r/−/l/ distinction (Idemaru & Holt, 2013), and duration cues in Japanese stop consonants (Idemaru et al., 2012). However, some studies have reported significant group-level correlations (Coetzee et al., 2018; Flege et al., 1997). These mixed findings challenge static, one-to-one mapping models and instead point to a more dynamic system where listeners flexibly adjust perceptual strategies based on contextual and signal-level variability (Clayards, 2008; Idemaru & Holt, 2011; Zhang & Yan, 2018). As such, fully understanding the production-perception relationship requires theoretical frameworks that account for listeners’ versatile sensitivity to the statistical properties of acoustic variation for target speech sounds in the two domains.
Distributional Approaches to Speech Variability
The complexity of production-perception relationships becomes particularly evident when considering the extensive variability inherent in speech production. Multiple sources contribute to this variability, including vocal physiology (Peterson & Barney, 1952), speaking rate (Miller et al., 1986; Theodore et al., 2009), coarticulatory effects (Ladefoged, 1980), and lexical factors (Goldinger & Van Summers, 1989). Among these, phonetic context represents a key variability source (Kajarekar et al., 1999; Sun & Deng, 1995). Such pervasive production variability creates a core perceptual challenges, as listeners must extract stable linguistic categories from highly variable acoustic input.
Rather than searching for direct, cue-by-cue correlations between production and perception, a more productive approach focuses on the distributional properties of acoustic cues and how they shape perceptual strategies. Specifically, different acoustic dimensions contribute unequally to phonetic categorization, a phenomenon known as perceptual cue weighting (Holt & Lotto, 2006). A central hypothesis in modern speech perception research is that these weights are learned from the statistical properties of the linguistic input. According to the “weighting-by-reliability” hypothesis, listeners assign greater perceptual weight to acoustic cues that are most reliable in distinguishing phonetic categories in their native language (e.g., Toscano & McMurray, 2010).
Cue reliability is defined in terms of distributional distinctiveness; a cue is considered highly reliable if its probability distributions for two different phonetic categories show minimal overlap. For instance, voice onset time (VOT) is a highly reliable cue for voicing contrasts in English because sounds like /b/ and /p/ show well-separated VOT distributions. In contrast, vowel length is a less reliable cue its greater within-category variability and overlap across categories. This distributional distinction explains why English listeners rely more heavily on VOT than vowel length in voicing decisions (Clayards et al., 2008; Clayards, 2008). Further support for the weighting-by-reliability hypothesis comes from perceptual learning and training studies, which show that listeners downweight highly variable cues and upweight more consistent ones (Atkins et al., 2001; Ernst & Banks, 2002; Zhang et al., 2021, 2023).
The present study is designed to provide a rigorous test of this hypothesis in the suprasegmental domain by directly linking cue reliability in production to cue weighting in perception. We operationalized distributional reliability using the Bhattacharyya coefficient (BC; Bhattacharyya, 1946), which directly measures overlap between two statistical distributions. Lower BC values indicate better separation between phonetic categories in production space, suggesting higher reliability, while higher BC values indicate greater category overlap and lower reliability. This BC metric offers several advantages over parametric measures, including robustness to non-Gaussian distributions and symmetric properties across comparisons, ensuring consistent distributional distance measures regardless of category order (Bhattacharyya, 1946; Kailath, 1967). By examining how BC values for individual acoustic cues in production relate to perceptual cue weighting, this study aims to provide a more precise account of how distributional regularities mediate the production–perception link, particularly in the domain of suprasegmental variation.
Lexical Tones as a Critical Test Case
Lexical tones provide an ideal test case for examining how listeners extract linguistically relevant information from complex acoustically variable input, as they pose challenges that go beyond those found in segmental contrasts. In Mandarin, four primary lexical tones are distinghuished by their characteristic fundamental frequency (F0) contours: Tone 1 (high-level, 55), Tone 2 (high-rising, 35), Tone 3 (low-dipping, 214), and Tone 4 (high-falling, 51) (Chao, 1930). Because tonal identity is conveyed primarily along the continuous acoustic dimension of F0, lexical tones are especially susceptible to contextual variation. Crucially, this variation is not monolithic but arises from two distinct linguistic sources: gradient, low-level phonetic coarticulation and discrete, high-level phonological rules. This duality in tonal variation makes the Mandarin system well-suited for investigating how the production-perception link operates under qualitatively different types of variation.
For the current investigation, we focused specifically on the particularly challenging contrast between Mandarin Tone 2 (T2) and Tone 3 (T3). This pair has been consistently shown to be difficult for both perception and acquisition (Chen et al., 2015; Chuang & Hiki, 1972; Shen & Lin, 1991; Whalen & Xu, 1992), largely due to their similar concave F0 contours (Gandour, 1978; Kiriloff, 1969) and shared rising final portions (Blicher et al., 1990), which create considerable acoustic ambiguity. This ambiguity requires listeners to rely on subtle distributional cues to correctly categorize these two tones.
To investigate this contrast, we selected seven F0-based dimensions, encompassing both primary and secondary cues identified in previous perceptual research. The primary cues, critical to tonal identity, included measures of contour shape and temporal dynamics: F0 slope (Gandour, 1983), F0 curvature (Shih & Lu, 2015; Tupper et al., 2020), temporal location of the F0 turning point (TP), F0 decrease from onset to TP (Moore & Jongman, 1997), and F0 height at tone offset (Shen et al., 2013; Zou et al., 2012). Secondary cues, reflecting overall pitch height rather than contour dynamics, included mean F0 (Jongman et al., 2017) and F0 at onset (Massaro et al., 1985). This cue set allows us to test whether production-perception coupling is stronger for cues with higher phonological relevance, as previous studies have demonstrated significant perception-production correlations specifically for critical cues when examining relationships between acoustic measures of perceptual prototypes and average productions of category members (Leung & Wang, 2020; Newman, 2003).
We examined T2-T3 contrasts embedded in disyllabic sequences where the first syllable bore T2 or T3 and the second syllable carried one of four context tones (T1, T2, T3, or T4). This design enables analysis of both gradient and categorical tonal variation. In gradient contexts (T1, T2, T4), adjacent tones induce continuous, coarticulatory shifts in F0 contours (e.g., Xu, 1997), representing exactly the type of variation that the weighting-by-reliability hypothesis is designed to accommodate. In contrast,. the T3 context triggers a categorical phonological rule: the T3 sandhi rule. When a T3 is followed by another T3, the first dipping T3 (T3(214)) undergoes a tonal alternation, surfacing as a mid-rising tone (T3(35), sandhi T3), which is phonologically identical to T2. When followed by other tones, the first T3 surfaces as a low-falling “half T3” (T3(21)) (Figure 1).
Although acoustic analyses have documented measurable differences between sandhi T3 and the T2 (Chen et al., 2019; Cheng et al., 2013; Tu & Chien, 2022; Zhang & Lai, 2010), perceptual studies consistently find that native listeners cannot reliably distinguish /T3-T3/ sandhi sequences from /T2-T3/ sequences (Chen et al., 2015; Peng, 2000; Wang & Li, 1967). This categorical, rule-governed ambiguity challenges purely statistical models of perception. It raises a fundamental question: can listeners extract reliable distributional cues in contexts where surface forms are shaped by abstract phonological rules, or does the production–perception link break down in such cases?
The Present Study
This study investigates the relationship between speech production and perception in Mandarin lexical tones, focusing on how listeners’ perceptual cue weighting corresponds to the distributional reliability of acoustic cues in their own productions. By using participants’ speech productions as a proxy for their long-term exposure to tonal distributions, we gain a direct windows into the statistical input that has shaped their perceptual system over time. This approach offers two key advantages. First, individual production patterns reflect the same statistical regularities in the ambient language that guide perceptual learning throughout development (Grenon et al., 2007; Murphy et al., 2024; Saffran et al., 1999). Second, this approach captures both community-wide norms and individual-specific adaptations.
We examine the Mandarin Tone 2–Tone 3 (T2–T3) contrast across two types of tonal variation: gradient coarticulatory contexts (T1, T2, T4) and the categorical Tone 3 sandhi context (T3). This design allows us to test two core hypotheses. First, we hypothesize that both acoustic distributions in production and perceptual cue weighting will be sensitive to tonal context, reflecting systematic adjustments in response to gradient or categorical variation. Second, we hypothesize that the coupling between production and perception will itself be context-dependent. Specifically, in gradient coarticulatory contexts, we predict a negative correlation between cue distributional reliability and perceptual weight, consistent with the weighting-by-reliability hypothesis. That is, more reliable cues (with better distributional separation) will receive greater perceptual weight.
The Tone 3 sandhi context serves as a critical test case for the limits of this model. Here, a categorical phonological rule alters the surface form of T3, creating a perceptually ambiguous overlap with T2. We ask whether the production–perception link observed in gradient contexts extends to this rule-governed environment. If coupling persists, it would suggest that listeners are sensitive to even subtle residual statistical cues in sandhi contexts. However, if no coupling is found, this would indicate that listeners engage non-statistical, rule-based processing strategies to resolve phonological ambiguity, suggesting clear boundary conditions for distributional models of speech perception.
Methods
Participants
Seventy native speakers of Mandarin Chinese (37 females and 33 males) aged 18-26 years (M = 21.26, SD = 1.98) participated with the informed consent, following the ethical research approval of the Research Ethics Committee at Xi’an Jiaotong University. All participants are right-handed, and reported no history of speech, language, or hearing problems or disorders. All participants were born and raised in mainland China and speak standard Mandarin without regional dialectal accent, as confirmed through self-reported language background questionnaires and verified by native Mandarin-speaking research assistants during experimental sessions. None had spent more than one month in foreign countries or communities. Participants were compensated for their time.
Materials and Procedure
Production Prompts
We selected disyllabic stimuli from the Modern Chinese Frequency Dictionary (Beijing Language Instruction Institute, 1986), initially identifying 80 word pairs matched for frequency and stroke count. Each pair contained contrasted T2 and T3 in one syllable position while maintaining identical consonants and vowels. Stimuli were organized by context tone (T1, T2, T3, or T4) and target position (first vs. second syllable; 40 pairs each).
To ensure matched familiarity, 25 native speakers (11 males, 14 females; age 18-26 years, M = 22.6, SD = 2.0) completed a word recognition test on 200 items (160 real words including our 80 candidate pairs, plus 40 nonwords). Stimuli were recorded by a female native speaker, normalized to 1000 ms duration and 70 dB intensity using PRAAT, and presented randomly through headphones at approximately 70 dB SPL. Final selection required: (1) > 85% recognition accuracy for both words in each pair, (2) < 5% accuracy difference between paired words, and (3) < 200 ms reaction time difference. Focusing on initial-position targets involving T3 sandhi, our final set comprised eight disyllabic words (4 pairs) balanced across 4 tonal contexts (Table 1).
Production Task
The eight disyllabic words were used as prompts to record the 70 participants’ productions. Recordings took place in a soundproof room, where participants were instructed to speak the words at a natural pace. Each word was repeated 30 times by every participant. Recordings were made using PRAAT (Boersma & van Heuven, 2001) at a sampling rate of 44.1 kHz with 16-bit quantization. A SHURE SM58 microphone was positioned approximately 20 cm in front and at a 45-degree angle to the right of the participants’ lips. The printed words were presented to participants in Chinese characters with corresponding phonetic transcriptions. Prior to recording, participants practiced reading the words aloud to ensure familiarity with the stimuli. Each participant produced a total of 240 tokens (8 words x 30 repetitions). The order of prompts was consistent across all participants within a single block. Overall, the recording session yielded 16,800 words (8 target words × 70 participants × 30 repetitions). Audacity (Audacity Team, 2021) was used to extract the target syllables from the recorded disyllables.
Perceptual Stimuli
The perception experiment used the same eight Mandarin disyllabic words, recorded by a professional female Mandarin broadcaster using PRAAT at 44.1 kHz with a SHURE SM58 microphone. Target monosyllables (T2 or T3) were isolated from 24 productions, yielding 8 target syllables (4 pairs) normalized to 400 ms duration and 70 dB intensity. We generated synthetic stimuli by creating T2-T3 continua. Within each pair, the T3 syllable’s F0 contour was replaced with the corresponding T2 contour, ensuring stimuli differed only in F0. Natural T2 and T3 recordings served as acoustic endpoints (Appendix A). F0 values were converted to semitones using Equation (1),
where F0a is the measured F0 and F0b is the averaged F0 of the talker’s recordings (Shih & Lu, 2015).
Our stimulus continuum design was grounded in theoretical and empirical accounts of Tone 3 (T3) realization in connected speech. Prior work has suggested that T3 often undergoes truncation in natural discourse, reducing its full (214) contour to a simplified (21) form ((Chen, 2000). In contexts where T3 preceded T1, T2, or T4, we implemented this truncation (T3(214) → T3(21)) by treating the T3 turning point as its offset, aligned temporally with the T2 offset. This allowed us to construct a four-dimensional acoustic space defined by F0 onset (5 steps), F0 turning point (5 steps), F0 offset (5 steps), and turning point timing (4 steps), resulting in 500 synthetic stimuli per context (Figure 2A).
For sequences where T2 or T3 preceded another T3 (i.e., in the sandhi context), we manipulated three acoustic dimensions based on the native speaker's productions: F0 onset, F0 fall to the turning point (as T3 tokens exhibited a monotonic rise without concave curvature, unlike T2), and F0 offset. Each parameter varied across 5 steps, generating a three-dimensional stimulus space with 125 stimuli (Figure 2B).
In total, we created 1,625 synthetic stimuli (500 × 3 gradient contexts + 125 sandhi context), all RMS-normalized, combined with their original context syllables, and resynthesized to a uniform duration of 800 ms with 20 ms fade-in and fade-out.
Perceptual Task
Disyllabic stimuli were presented in randomized order using E-Prime 2.0 on a DELL desktop computer, with audio delivered through Sennheiser CX1 headphones at 70 dB SPL. On each trial, participants heard an auditory stimulus and simultaneously viewed two response options displayed as Chinese character word pairs. Prior to testing, experimenters confirmed that participants could accurately recognize all target words.
Due to the large stimulus set (1,625 trials), each item was presented only once. Participants were allowed to take breaks as needed. During each self-paced trial, a 200 ms fixation cross appeared at the start, followed by the stimulus and response options. Participants indicated their response by clicking on the word they perceived, with instructions to prioritize accuracy over speed. The left–right positioning of response options was counterbalanced across participants. The full task lasted approximately one hour on average.
Acoustic Measures
We measured F0 using the BaNa algorithm (Ba et al., 2012) in MATLAB (MathWorks Corporation, United States), selected for its low Gross Pitch Error rates under noisy conditions, outperforming both YIN and PRAAT (Yang et al., 2014). F0 values within the range of 50-450 Hz were extracted with 5-ms steps and converted to semitone units using Equation (1). Preprocessing of F0 contours was conducted in R s (R Development Core Team, 2022) to reduce measurement artifacts. Specifically, segmented regression was used to trim post-breakpoint values at syllable-final boundaries, and sudden F0 jumps exceeding 15 Hz at the beginning of contours were removed. However, mid-contour irregularities, particularly in T3, were retained to preserve natural creaky voice effects (Shih & Lu, 2015).
We analyzed seven F0-based acoustic features known to distinguish T2 and T3: linear slope (F0slope), curvature (F0curve), turning point (TP), onglide (Onglide), offset F0 (OffsetF0), onset F0 (OnsetF0), and mean F0 (MeanF0). The TP was identified using a two-segment broken-line model, which fitted straight lines to the contour via least-squares optimization over all possible breakpoint locations (see Appendix B for illustration; Tupper et al., 2020). For broader contour analysis, linear F0 slope and F0 curves were derived by fitting a second-degree polynomials using Equation (2):
where t is scaled to the interval (0),1. Coefficients a (mean F0), b (slope), and c (curvature) were computed via least-squares fitting using Legendre polynomials adapted for discrete time series data (Komzsik, 2017). Coefficient b served as the F0slope and c as the F0curve. Positive values of b indicate rising trends, while c captures contour bending shape: positive values of c indicate U-shaped curves (F0 minimum), negative values indicate inverted U-shaped curves (F0 maximum), and the magnitude of |c| indexes curvature strength.
Statistical Analysis
We quantified distributional overlap between T2 and T3 productions using the Bhattacharyya Coefficient (BC), which measures overlap between two probability distributions. Lower BC values indicate greater category separation, while higher values indicate greater distributional overlap. BC calculation involved four steps: (1) extracting cue values for T2 and T3, (2) computing sample means and variances for each tone category, (3) calculating Bhattacharyya distance using the closed-form expression for normal distributions, and (4) deriving BC by exponentiating the negative distance (). The distance formula used was:
where , and , represent the means and variances of the T2 and T3 categories, respectively. We calculated BC values for the seven acoustic cues across four tonal contexts per participant.
To analyze how context and cue type influenced distributional overlap, we employed Bayesian mixed-effects modeling using the brms package in R (Bürkner, 2017). with context tone and acoustic cues as fixed effects plus their interaction, and random intercepts for subject. Bayesian modeling was selected for its robustness with smaller samples and its ability to provide interpretable probabilistic estimates of effect sizes (Kruschke, 2014). We used Bayes factors to compare the full interaction model with a reduced main-effects-only model, interpreting values according to standard thresholds: BF > 3 (substantial evidence), BF > 10 (strong evidence), BF > 30 (very strong evidence) (Jeffreys, 1961).
Perceptual cue weighting was assessed using Relative Weight Analysis (RWA), which complements logistic regression by addressing multicollinearity through variable orthogonalization. RWA provides cue importance scores ranging from 0 to 1, reflecting the unique contribution of each acoustic cue to the perceptual categorization decision (Tonidandel & LeBreton, 2015). The same Bayesian modeling structure was applied to examine the effects of context and cue type on perceptual weights.
To assess the relationship between distributional overlap and perceptual cue weighting, we fitted separate Bayesian mixed models for gradient coarticulatory contexts (T1, T2, T4) and the categorical sandhi context (T3), reflecting their distinct linguistic properties. For gradient contexts, the model included BC, context tone, cue importance (critical vs. secondary), and their three-way interaction. "Critical" cues were defined as the top three most heavily weighted dimensions, typically accounting for over 75% of total perceptual variance (see Appendix C); remaining cues were classified as "secondary." Cue importance was calculated per participant and could vary by context tone.
For the sandhi (T3) context, we modeled BC × cue type interactions, with random intercepts for participants and cues. All models were run using four MCMC chains with 4,000 iterations each (2,000 warm-up), applying weakly informative priors. Model convergence was assessed using R-hat statistics and effective sample sizes; additional iterations were added as needed to ensure stability. We reported 95% credible intervals (CI) or 95% highest posterior density (HPD) intervals where specified, probability of direction (pd) values, and standardized effect sizes approximating Cohen’s d.
Results
Distributional Overlap
Figure 3 illustrates the group-level distributions of seven acoustic cues—MeanF0, OnsetF0, Turning Point (TP), Onglide, OffsetF0, F0slope, and F0curve—for the target tone categories (T2 and T3) across four context tones (T1, T2, T3, T4). Four key patterns emerge:
- 1)
- Substantial overlap between T2 and T3 across all dimensions;
- 2)
- Minimal variation in cue distributions across contexts at the group level;
- 3)
- Notable separation in OffsetF0 within T2 and T4 contexts;
- 4)
- Greater variability in F0curve, characterized by wider variances and flatter density curves.
However, this aggregated pattern masks individual-level variation in cue realizations. Some participants demonstrated clearer category separation along specific acoustic dimensions and more pronounced context effects (see Appendix D for an example). These findings highlight notable between-talker variability in both category means and distributional shapes.
To formally quantify acoustic category separation, we computed Bhattacharyya Coefficients (BC) for each cue. Higher BC values indicate greater overlap (lower reliability), while lower values reflect clearer categorical separation. Figure 4 presents BC values across contexts and cues, revealing context-specific distinctiveness patterns. In T2 and T4, OffsetF0 and MeanF0 provided relatively good separation, while other cues exhibited high overlap. In contrast, the T1 context showed a more distributed acoustic strategy, with several cues contributing moderately to separation. The T3 context, however, demonstrated uniformly high overlap across cues, indicating minimal acoustic differentiation between T2 and T3 in this environment.
We then fitted two Bayesian mixed-effects models to examine the interaction effect of context tone and acoustic cues on distributional overlap. Bayes factor provided decisive evidence favoring the interaction model (BF₁₀ = 9.87 × 10²⁸), indicating that distributional overlap of the acoustic cues varied dramatically across tonal contexts. For the interaction model, the subject random effect confirmed moderate between-participant variation in overall distributional patterns (SD = 0.05, 95% CI [0.04, 0.06]; see Appendix F for full model summaries).
Given the decisive evidence for context-cue interactions, we analyzed the estimated marginal means to characterize context-specific patterns of acoustic separation. The analysis revealed four distinct distributional profiles, each representing a unique acoustic landscape for tone realizations (Figure 5).
- T1 Context: Moderate overall separation, with MeanF0 offering the most distinct category differentiation (BC = 0.77, 95% HPD [0.73, 0.80]); F0slope showed the least separation (BC = 0.91, 95% HPD [0.87, 0.95]).
- T2 Context: Greatest category separation, driven by OffsetF0 (BC = 0.44, 95% HPD [0.40, 0.48]). However, this cue optimization came with trade-offs, as cues like OnsetF0 (BC = 0.98) and F0slope (BC = 0.94) showed very high overlap.
- T3 Context (Sandhi): Highest overall overlap, with nearly all cues showing BCs above 0.90. Even robust cues such as TP (BC = 0.91) and Onglide (BC = 0.92) failed to differentiate categories effectively. This suggests a highly confusable acoustic space, likely reflecting categorical neutralization.
- T4 Context: Showed dual cue optimization, with both OffsetF0 (BC = 0.73, 95% HPD [0.70, 0.78]) and MeanF0 (BC = 0.78, 95% HPD [0.74, 0.82]) contributing to improved separation. While not as distinctive as T2, this pattern still showed stronger category separation than T1 or T3.
Perceptual Cue Weighting
To investigate how listeners weight different acoustic cues during perceptual categorization across tonal contexts, we employed Relative Weight Analysis (RWA), which quantifies each cue’s relative contribution to categorization decisions. Higher RWA values indicate greater perceptual influence. Figure 6 displays clear context-sensitive variation in cue weighting, revealing two distinct perceptual strategies: (1) In T1, T2, and T4 contexts, listeners exhibited concentrated cue weighting, relying heavily on a small subset of cues—primarily OffsetF0 and F0slope, and (2) In contrast, the T3 (sandhi) context showed a distributed weighting strategy, with listeners drawing on a wider range of acoustic cues to resolve ambiguity.
To formally test the effects of context tone and acoustic cue on perceptual weighting, we fitted Bayesian mixed-effects models. The model including the interaction between context and cue was decisively preferred over the main-effects model (BF₁₀ = 4.56 × 10153), confirming that perceptual cue weighting patterns differ substantially across tonal contexts (see Appendix F for model summaries).
Estimated marginal means revealed dramatically different perceptual weighting patterns across the four tonal contexts (Figure 7). Context T1 was characterized by a primary reliance on dynamic and offset cues. F0slope received the highest perceptual weight (RWA = 0.39, 95% HPD [0.35, 0.42]), followed by OffsetF0 (RWA = 0.26, 95% HPD [0.22, 0.29]) and F0curve (RWA = 0.15, 95% HPD [0.12, 0.19]). Other cues received substantially less weight. A highly specialized pattern emerged in Context T2, where OffsetF0 was the overwhelmingly dominant perceptual cue (RWA = 0.57, 95% HPD [0.53, 0.60]). The importance of all other cues was substantially reduced in comparison, with F0slope being the second important cue (RWA = 0.19, 95% HPD [0.16, 0.23]). In Context T3, listeners adopted a more distributed perceptual strategy. TP was the most influential cue (RWA = 0.21, 95% HPD [0.17, 0.24]), but several other cues also made meaningful contributions, including MeanF0 (RWA = 0.18, 95% HPD [0.15, 0.22]), Onglide (RWA = 0.16, 95% HPD [0.12, 0.19]), and F0slope (RWA = 0.14, 95% HPD [0.10, 0.18]). The pattern in Context T4 was the most specialized, showing an even stronger reliance on OffsetF0 (RWA = 0.60, 95% HPD [0.57, 0.64]) than was observed in Context T2. All other cues were of minor perceptual importance, with F0slope being the most prominent secondary cue (RWA = 0.15, 95% HPD [0.11, 0.18]).
Production-Perception Coupling
To evaluate the relationship between distributional overlap in production and perceptual cue weighting, we fitted separate Bayesian mixed-effects models for the gradient coarticulation contexts (T1, T2, T4) and the phonologically conditioned sandhi context (T3), reflecting their distinct linguistic profiles. For each context × participant combination, acoustic cues were categorized as either “critical” or “secondary”, based on perceptual salience. Cues ranked among the top three in perceptual importance (accounting for ~75% of total variance; see Appendix C) were classified as critical, while the remaining four were labeled secondary. This classification accounted for individual variability in cue weighting across tonal contexts.
Gradient Contexts (T1, T2, T4)
Bayesian model comparison for the gradient contexts provided strong support for the three-way interaction among context, Bhattacharyya Coefficient (BC), and cue importance (BF₁₀ = 12.48; see Appendix F for model summaries). This interaction reveals that production–perception coupling varies systematically across contexts and cue types.
For critical cues, distributional overlap in production negatively predicted perceptual weighting. In context T2, critical cues showed the strongest coupling (β = -0.36, 95% HPD [-0.42, -0.30], pd = 100%), while context T4 showed moderate coupling (β = -0.25, 95% HPD [-0.33, -0.18], pd = 100%). In context T1, the coupling effect was negligible (β = -0.04, 95% HPD [-0.15, 0.06], pd = 78%). In contrast, secondary cues showed minimal production-perception coupling across all standard contexts. The effects were consistently small and uncertain: context T1 (β = -0.06, 95% HPD [-0.17, 0.06], pd = 83%), context T2 (β = -0.03, 95% HPD [-0.16, 0.09], pd = 70%), and context T4 (β = -0.10, 95% HPD [-0.24, 0.04], pd = 93%).
Standardized effect sizes confirmed the practical significance of these findings. For critical cues, context T2 showed a large standardized effect (d = -2.51, 95% CI [-2.93, -2.09]), context T4 showed a moderate-to-large effect (d = -1.76, 95% CI [-2.28, -1.26]), while context T1 showed a negligible effect (d = -0.30, 95% CI [-1.02, 0.43]). Secondary cues consistently showed negligible standardized effects across all contexts (|d| < 0.8).
Figure 8.
Predicted relationship between production-based distributional overlap (Bhattacharyya Coefficient) and perceptual cue weighting (RWA), modeled by cue importance (critical vs. secondary) and gradient contexts (T1, T2, T4).
Figure 8.
Predicted relationship between production-based distributional overlap (Bhattacharyya Coefficient) and perceptual cue weighting (RWA), modeled by cue importance (critical vs. secondary) and gradient contexts (T1, T2, T4).
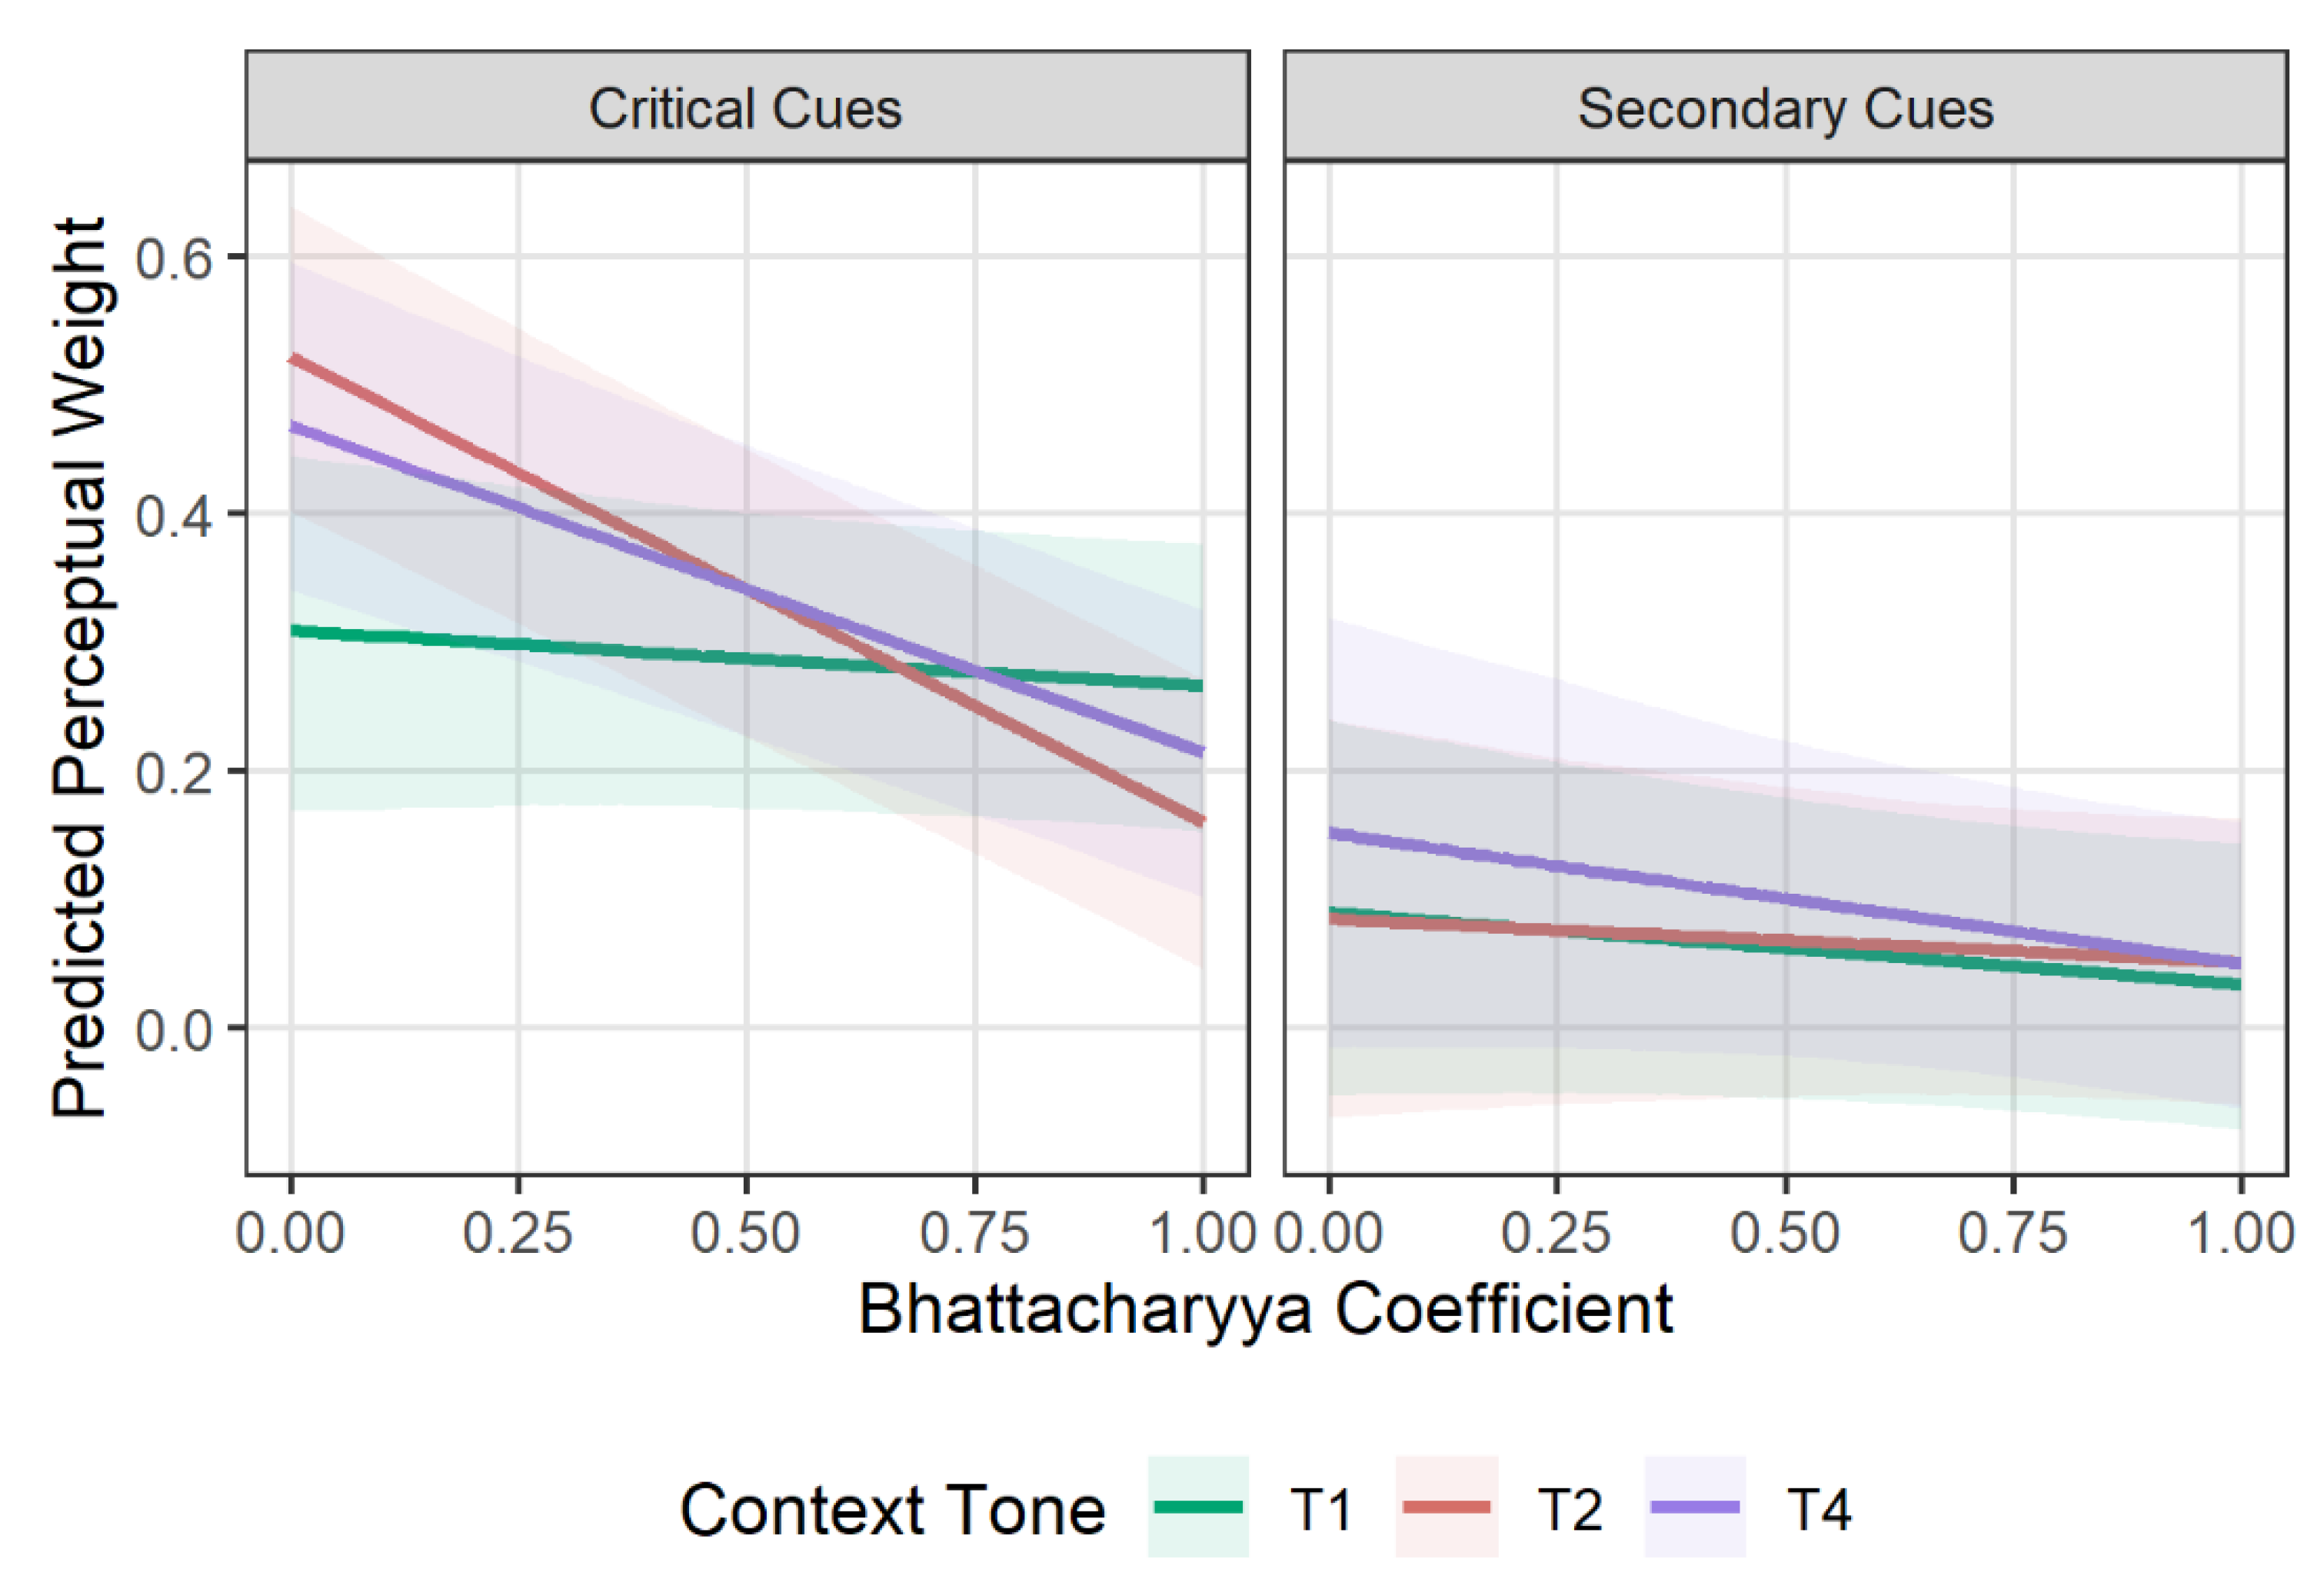
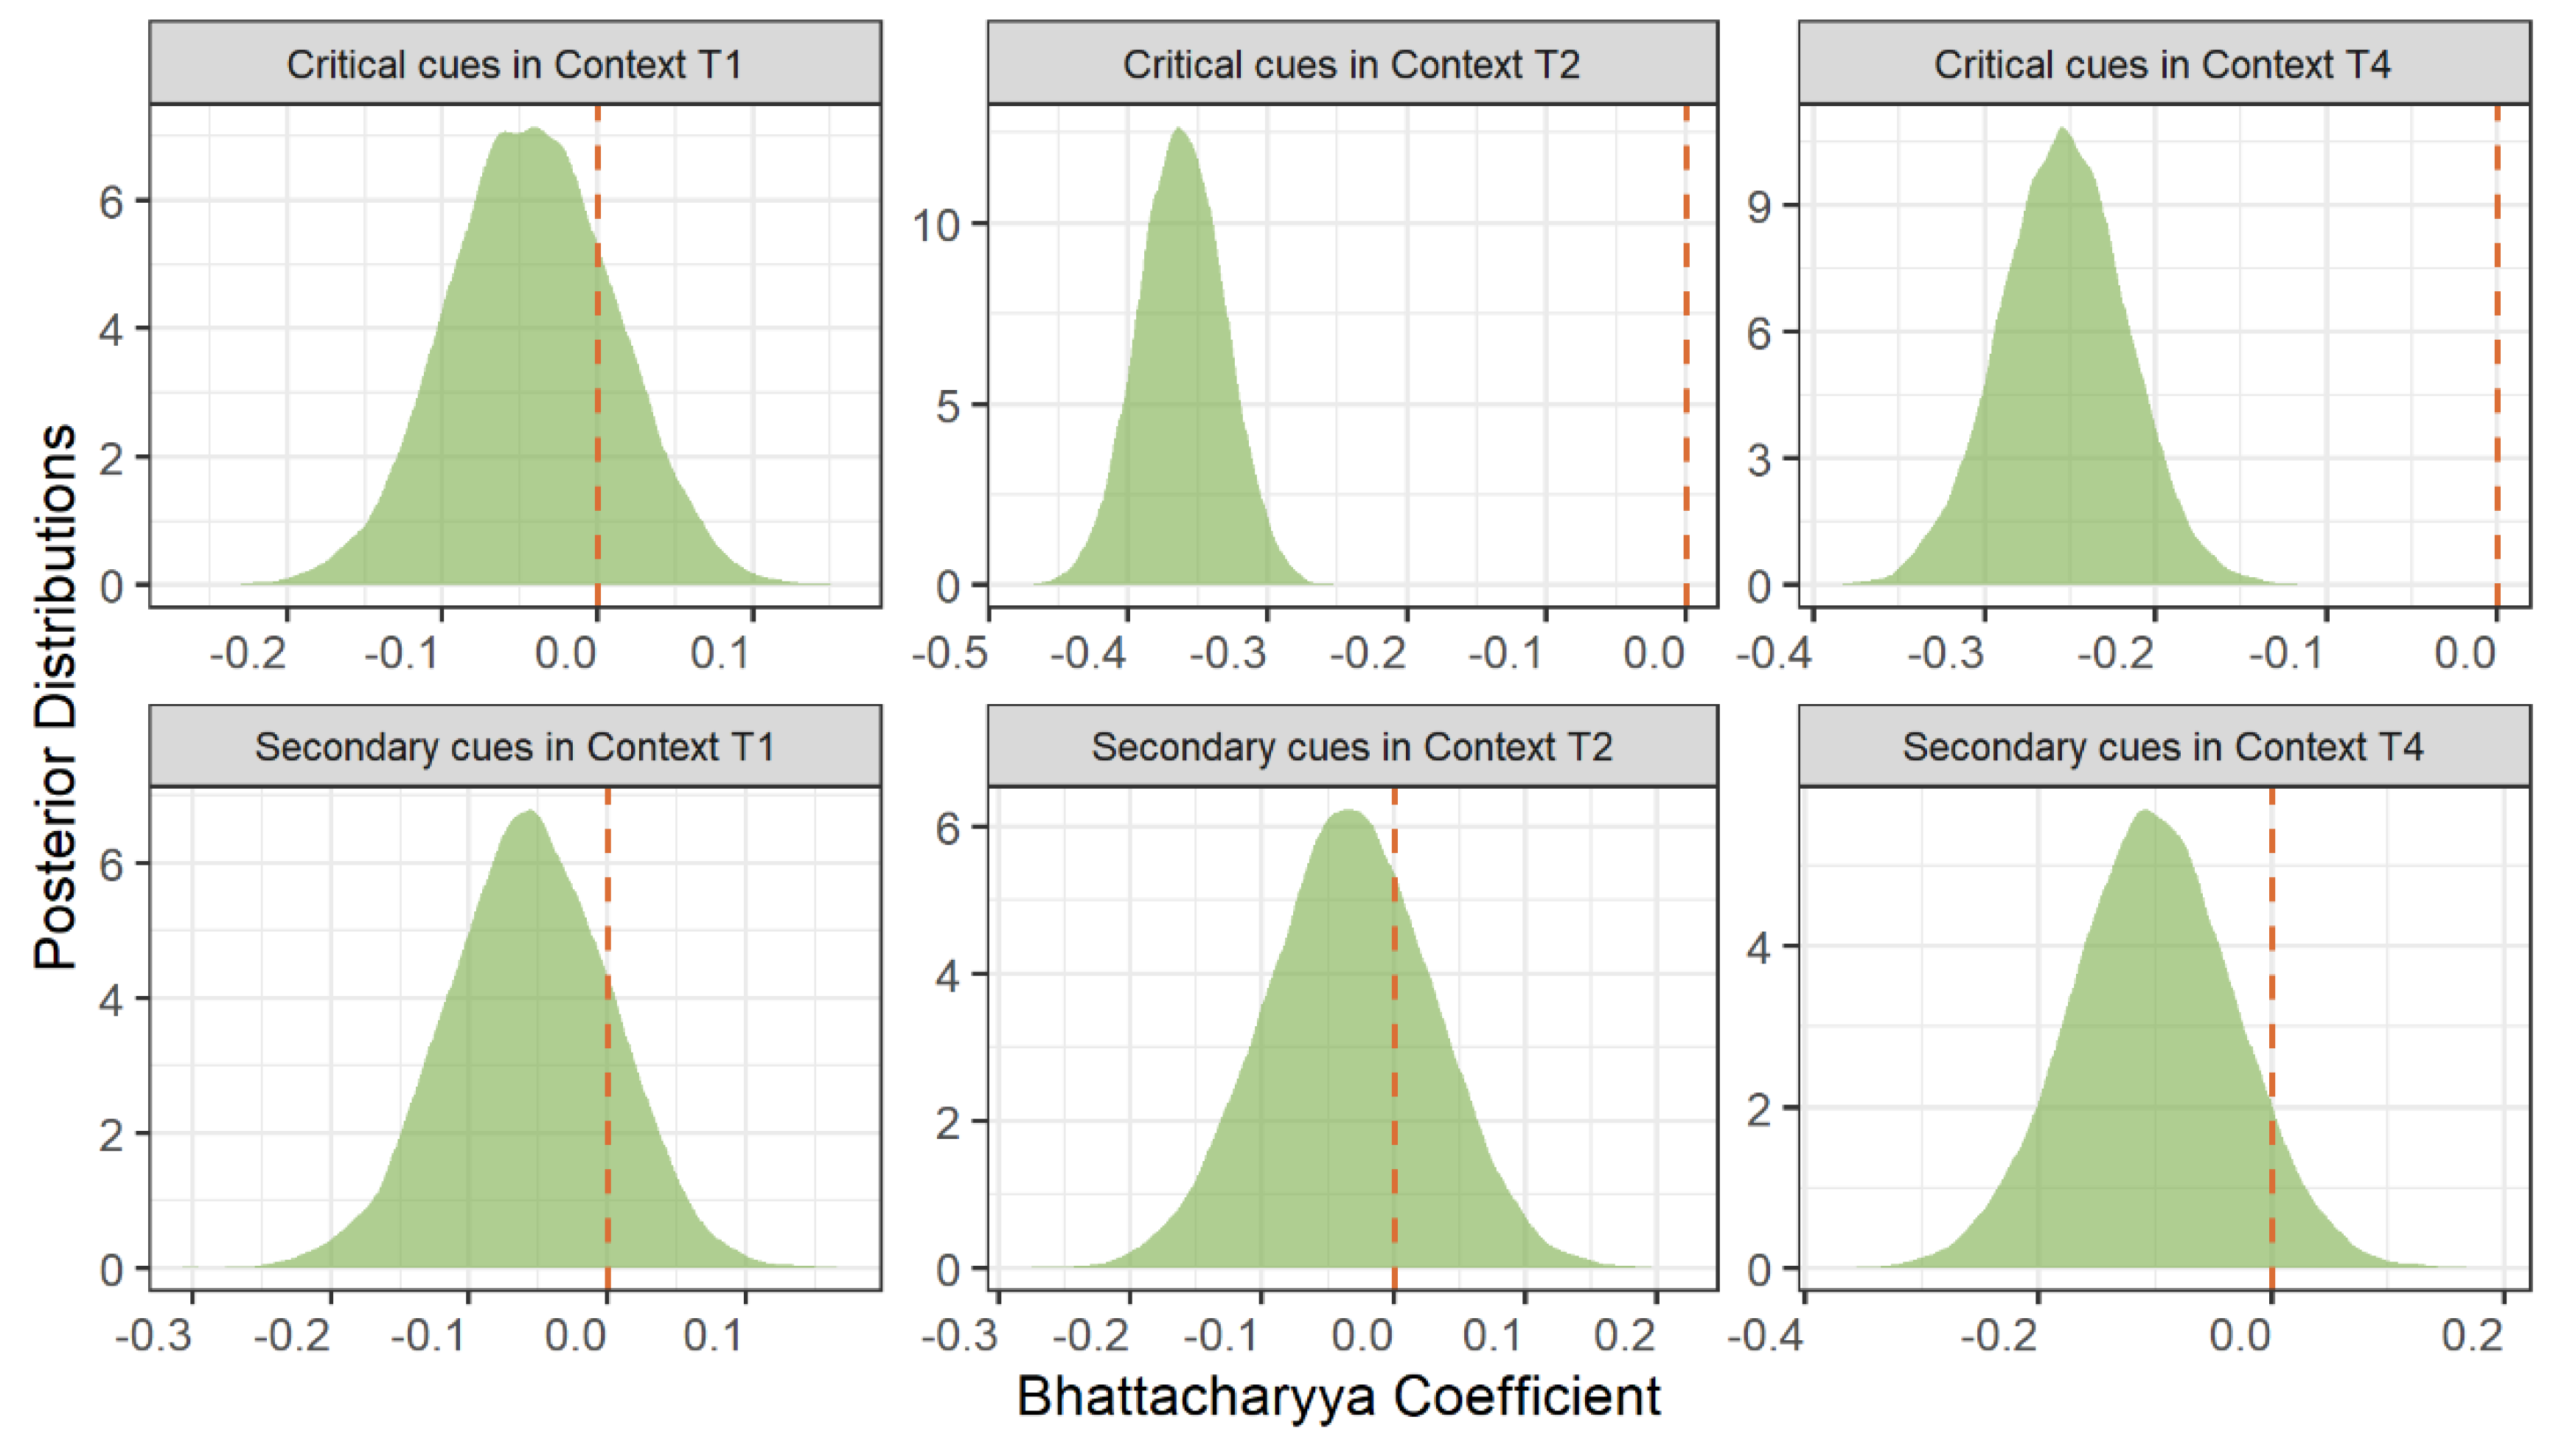
Figure 9.
Posterior distributions of the BC effect on perceptual weighting, separated by cue type and tonal context. Vertical dashed line indicates the null effect (β = 0); non-overlap with zero reflects credible evidence for BC influence.
Figure 9.
Posterior distributions of the BC effect on perceptual weighting, separated by cue type and tonal context. Vertical dashed line indicates the null effect (β = 0); non-overlap with zero reflects credible evidence for BC influence.
Sandhi Context (T3)
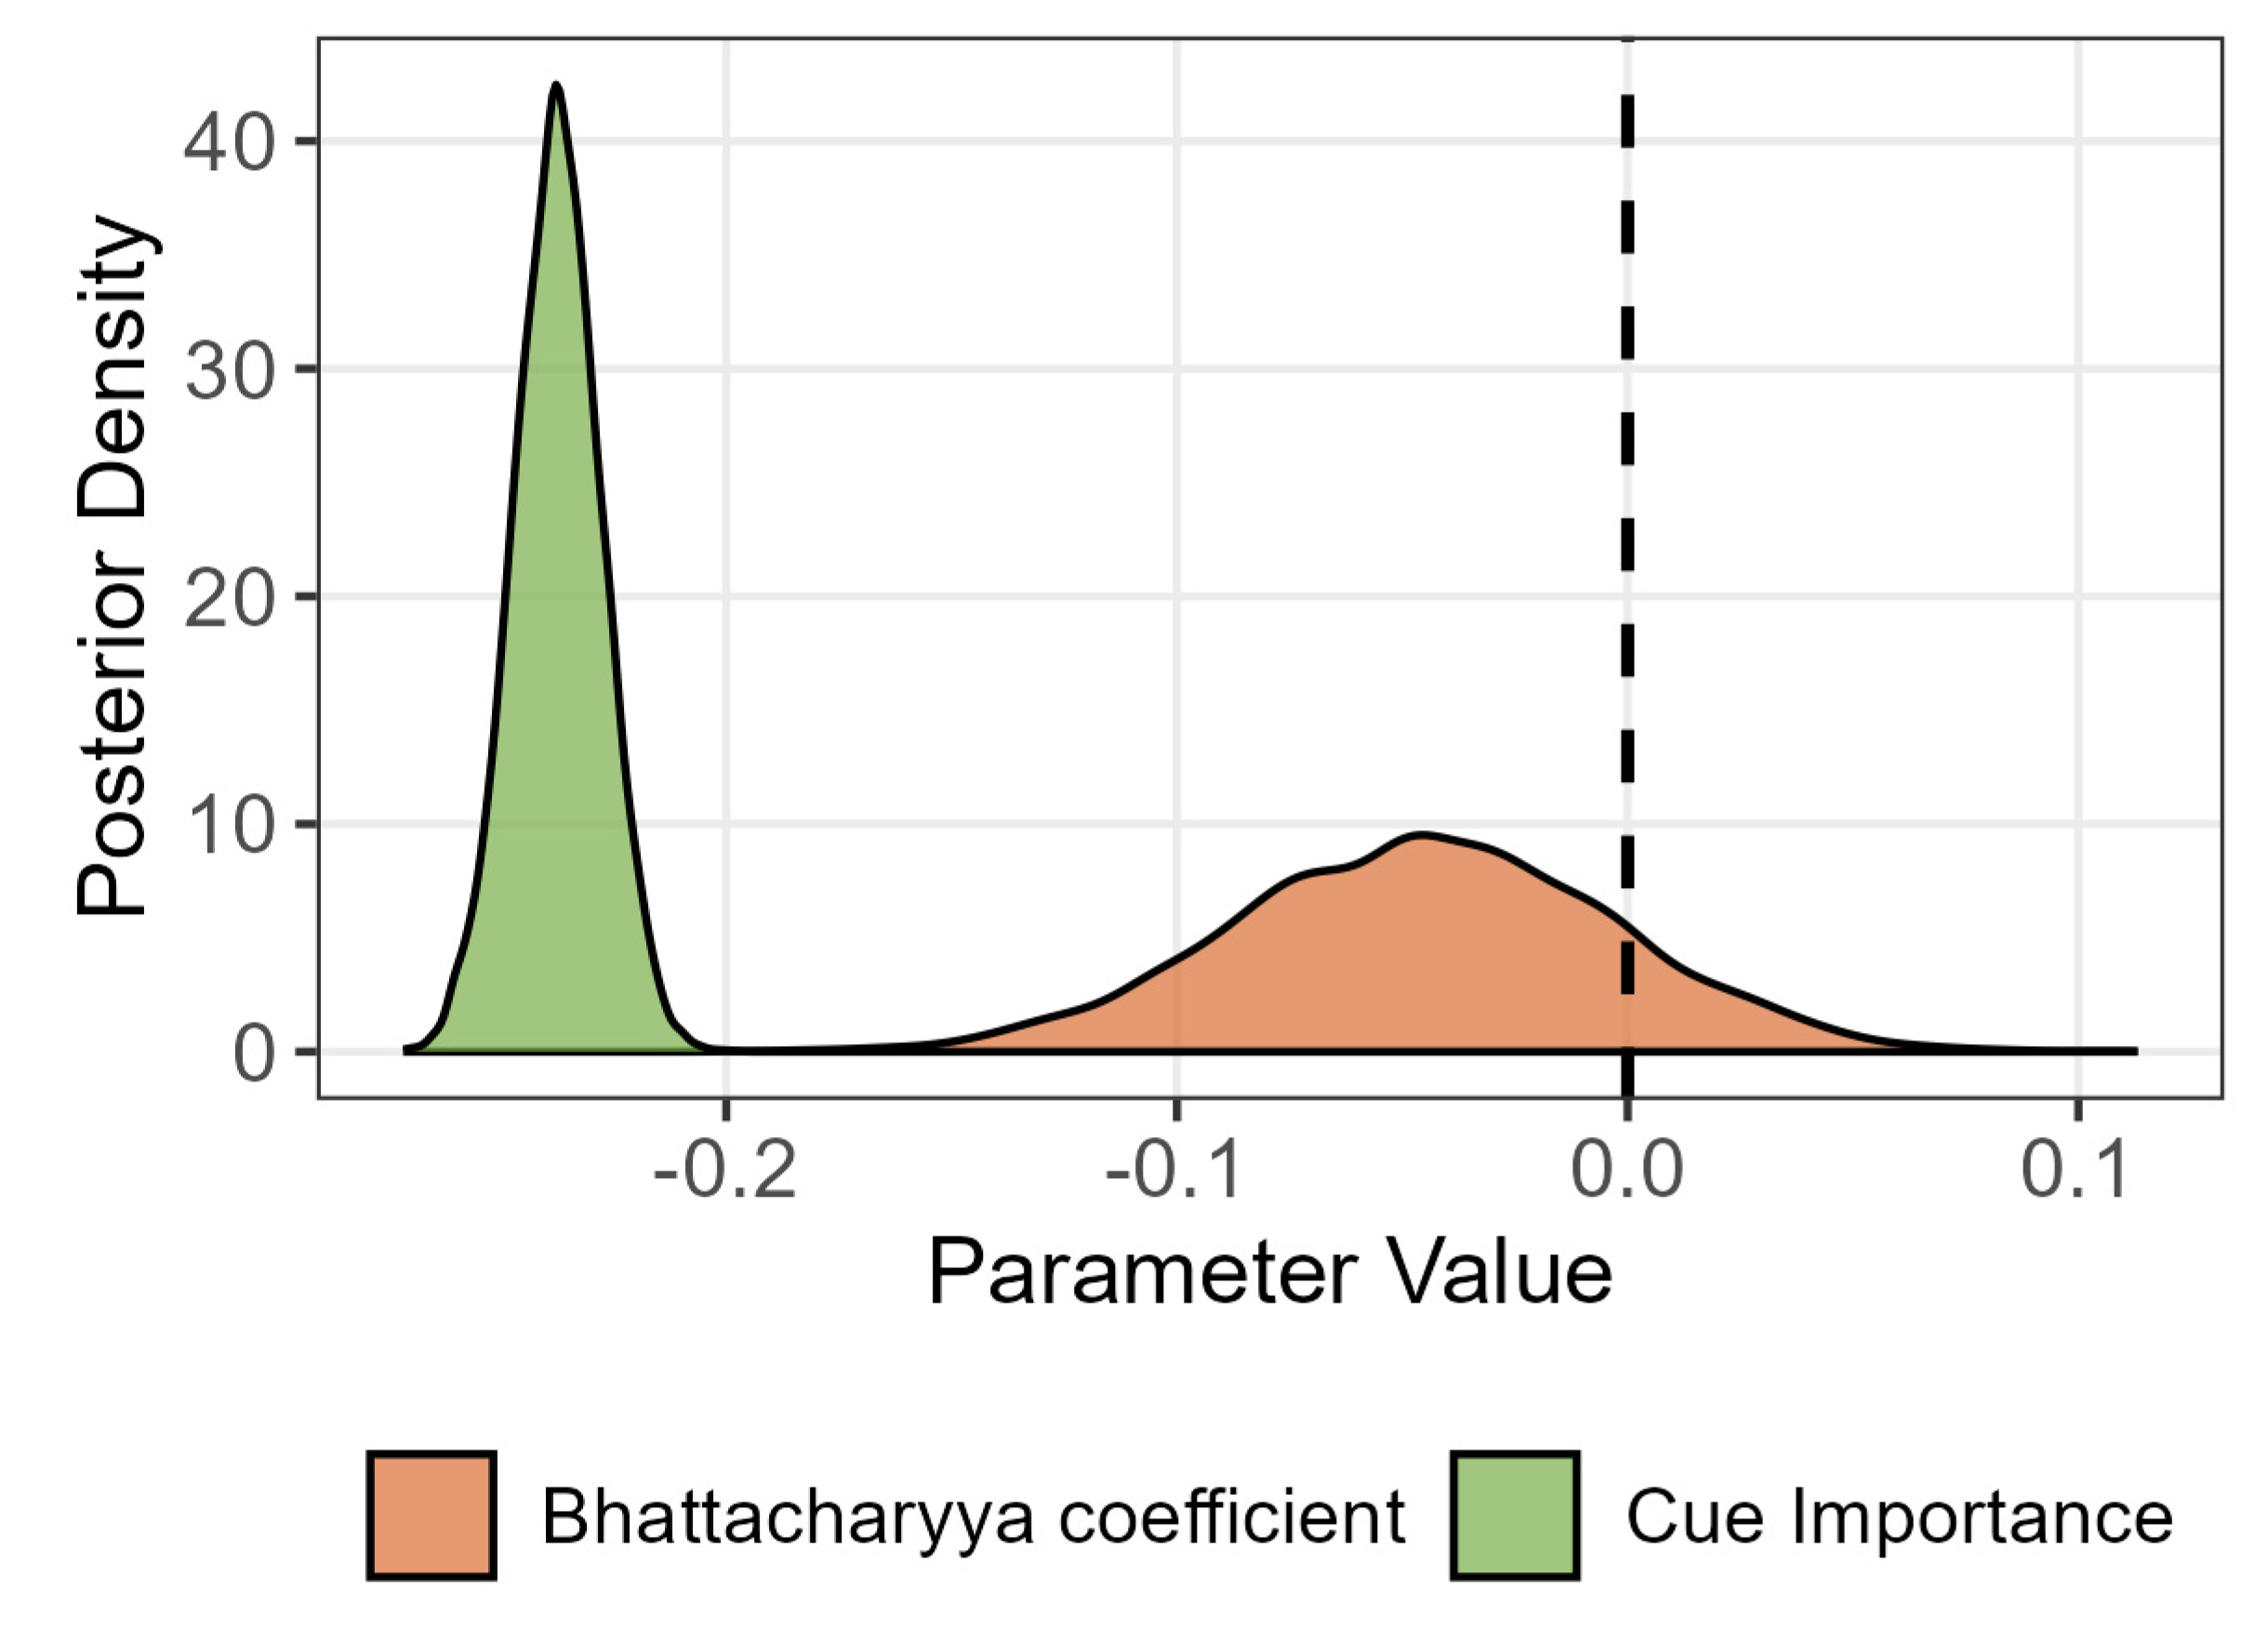
In contrast to gradient contexts, Bayesian model comparison for the sandhi context favored the reduced model, indicating no interaction between BC and cue importance (BF₁₀ = 0.29; see Appendix F for model summaries). The reduced model revealed that BC had virtually no effect on perceptual weights (β = -0.05, 95% CI [-0.13, 0.04]), indicating that distributional overlap in production did not predict perceptual cue weighting in this phonologically conditioned context. The primary determinant of perceptual weights in T3 was cue importance (β = -0.24, 95% CI [-0.26, -0.22]). This result indicates that in T3, perception is governed primarily by internal cue importance, not by statistical properties of acoustic distributions. The absence of coupling highlights a potential boundary condition for statistical learning models in phonological contexts involving rule-based restructuring.
Figure 10.
Posterior distributions of the main effects of Bhattacharyya Coefficient (BC) and cue importance in the Context T3 model. Vertical dashed line marks the null effect. The cue importance effect is clearly non-zero; the BC effect is indistinguishable from chance.
Figure 10.
Posterior distributions of the main effects of Bhattacharyya Coefficient (BC) and cue importance in the Context T3 model. Vertical dashed line marks the null effect. The cue importance effect is clearly non-zero; the BC effect is indistinguishable from chance.
Discussion
This study examined the relationship between speech production and perception by testing whether the distributional reliability (i.e., the degree of categorical separation) of acoustic cues in Mandarin tone production predicts listeners’ perceptual cue-weighting strategies. Focusing on the perceptually confusable T2–T3 contrast across four tonal contexts, we identified a selective and context-sensitive coupling mechanism that is modulated by phonological context and cue importance.
Our results show that production–perception coupling is not uniform but context-dependent, governed by distinct processing strategies. In gradient coarticulatory contexts (T2 and T4), greater cue separability in production predicted stronger perceptual weighting—but only for phonologically critical cues, not secondary ones. This coupling disappeared in the T1 context and broke down entirely in the T3 tone sandhi context, where perceptual strategies diverged from production statistics. These patterns suggest that bottom-up statistical and top-down symbolic routes are selectively engaged depending on phonological structure.
This work contributes to speech science in two key ways. First, it offers a quantitative, information-theoretic account of how perceptual systems adapt to acoustic variability, advancing beyond correlational models (e.g., Clayards, 2008; Kleinschmidt & Jaeger, 2015), to offer a potential resolution to the “perception-production paradox.” Second the dissociation in the sandhi context provides behavioral evidence for dual-route processing in suprasegmental perception, supporting the idea that phonetic gradience and phonological alternations rely on distinct cognitive mechanisms (cf. Hickok & Poeppel, 2007).
Selective Coupling in Gradient Coarticulatory Contexts
A central finding is that listeners’ perceptual systems appear finely attuned to cue reliability in gradient contexts. In both T2 and T4, cue separability in production was a strong predictor of perceptual importance. For example, OffsetF0 was both clearly separated in production (BC = 0.44 in T2, 0.73 in T4) and received dominant perceptual weight (RWA = 0.57 and 0.60, respectively). This pattern supports the weighting-by-reliability principle, whereby perceptual systems assign greater weight to acoustically informative dimensions (Toscano & McMurray, 2010), consistent with Bayesian cue integration models in perception (Ernst & Banks, 2002; Jacobs, 1999). In these models, listeners integrate cues by weighting them according to their reliability—a principle central to probabilistic models of speech perception (e.g., Kleinschmidt & Jaeger, 2015).
However, the T1 context deviated from this pattern. While OffsetF0 was appropriately down-weighted due to its low reliability (BC = 0.81, RWA = 0.26), listeners did not shift weight to the most statistically reliable cues (e.g., MeanF0, BC = 0.77). Instead, they increased reliance on F0slope (RWA = 0.39, BC = 0.91) and F0curve (RWA = 0.15, BC = 0.86), despite their poor separability. This apparent violation of the reliability principle can be attributed to the acoustic properties of our stimuli. Specifically, T2 tokens in T1 contexts had systematically lower F0 values, likely due to anticipatory coarticulation (Shen, 1990), leading to neutralization of critical local contrast cues. Given this degradation, listeners appear to have shifted to global contour-based cues such as F0slope and F0curve that better captured the underlying phonological gesture (Gandour, 1983).
When local cues become unreliable due to coarticulatory neutralization, listeners adaptively up-weight F0slope and F0curve because these cues capture the abstract gestural patterns that define the phonological contrast, even when their surface-level distributional reliability is poor.
This behavior illustrates the flexibility of the perceptual system in adapting to talker-specific acoustic patterns. Rather than rigidly tracking cue statistics, listeners appeared to engage in strategic compensation, focusing on cues that preserve abstract phonological contrasts, even when their distributional reliability is low. This supports prior evidence for adaptive cue re-weighting in response to degraded or atypical input (Clayards, 2008; Idemaru & Holt, 2011; Zhang & Yan, 2018). However, our single-talker design limits generalizability. The extent to which such adaptation reflects general perceptual mechanisms or talker-specific tuning remains an open question, necessitating multi-talker studies to differentiate universal from idiosyncratic effects.
Absence of Coupling for Secondary Cues
Equally informative is the lack of coupling for secondary cues across all contexts. These cues, including OnsetF0, were both distributionally unreliable and perceptually down-weighted, consistent with previous findings (Leung & Wang, 2020; Newman, 2003). From an information-theoretic perspective, this reflects a rational filtering mechanism. Processing all available cues would be computationally inefficient, especially in noisy or variable environments (Wang & Brown, 2006). Instead, listeners appear to prioritize high-informational-value cues and ignore uninformative dimensions (Hazan & Rosen, 1991; Heald & Nusbaum, 2014; Holt & Lotto, 2006). In all gradient contexts, secondary cues like OnsetF0 were both distributionally unreliable and perceptually down-weighted. This selective attention illustrates how production-perception coupling functions as a precision tool, attuned not just to cue reliability, but also to phonological relevance within context.
Dissociation in the Sandhi Context
Another important finding of our study is that the T3 sandhi context revealed a complete breakdown of production–perception coupling. Despite high cue overlap in production (BC = 0.86–0.98), listeners adopted a distributed perceptual strategy, assigning moderate weights across multiple cues (RWA: TP 0.21, MeanF0 0.18, Onglide 0.16, F0slope 0.14, F0curve 0.11, offsetF0 0.11). This pattern represents a fundamental contradiction of the reliability-weighting principle that systematically governed perception in T2, T4, contexts and holistic processing in T1 context.
The key to understanding this dissociation lies in the categorical nature of T3 sandhi itself. Unlike gradient coarticulation effects, T3 sandhi is a rule-governed phonological process that nearly neutralizes the surface acoustic contrast between underlying T2 and sandhi T3 (Chen, 2000). This neutralization poses a qualitatively different perceptual challenge: when encountering a surface [T2-T3] sequence, listeners cannot easily rely on straightforward acoustic discrimination but must instead solve a phonological ambiguity, i.e., determining whether the sequence derives from underlying /T2-T3/ or /T3-T3/ structure. Perceptual studies have repeatedly shown that listeners struggle to distinguish these sequences based solely on the surface acoustic signal (Chen et al., 2015; Wang & Li, 1967). Faced with this categorical ambiguity, the perceptual system appears to shift from bottom-up statistical processing to a top-down, knowledge-driven search for subtle residual acoustic traces that might differentiate true T2 from sandhi T3. While previous research has identified TP and the initial F0 fall (onglide) as potential distinguishing features (e.g., Moore & Jongman, 1997), our findings indicate that listeners do not rely on a single feature. Instead, the distributed cue-weighting pattern suggests a comprehensive search strategy over multiple dimensions when no dominant acoustic cue is available.
A Dual-Stream Model of Tone Perception
We propose that these findings reflect a dual-stream architecture in tone perception, aligned with the dual-route model of speech processing (Hickok & Poeppel, 2007). Under this framework, tone perception may recruit two distinct but complementary processing routes depending on the nature of the perceptual challenge. The Statistical-Auditory Stream operates as a bottom-up, data-driven pathway specialized for processing gradient acoustic-phonetic variations. This ventral stream pathway performs the reliability-weighting computations we observed in standard T2 and T4 contexts, as well as the holistic gestural analysis evident in T1 perception. This stream handles the fundamental task of mapping variable acoustic input to phonological categories through statistical evaluation of cue reliability (Hickok & Poeppel, 2007). The Symbolic-Phonological Stream represents a top-down, knowledge-driven pathway that operates on abstract phonological representations and rules (Hickok & Poeppel, 2007). This dorsal stream pathway becomes selectively engaged when categorical phonological processes create surface ambiguity that cannot be resolved through acoustic statistics alone. In sandhi contexts, this stream may direct attention to theoretically motivated acoustic features that could potentially preserve traces of underlying phonological structure, leading to the distributed cue weighting we observed.
Our interpretation of the behavioral dissociation finds support in neurocognitive studies of tone processing. Research using event-related potentials and neuroimaging reveals a clear neural division of labor: fine-grained acoustic variations typically elicit right-hemisphere auditory-cortical activity, while categorical phonological distinctions recruit additional left-hemisphere networks (Xi et al., 2010; Zhang et al., 2011). Most directly relevant to our findings, fMRI studies of T3 sandhi production reveal unique activation in the right inferior frontal gyrus (IFG) and anterior insula compared to non-sandhi sequences (Chang & Kuo, 2016; Chang et al., 2014). Crucially, this activation occurs for rule-triggering disyllabic sequences but not monosyllables, and emerges regardless of whether articulation is overt or covert, indicating its association with pre-articulatory phonological rule application rather than motor execution. The right IFG’s established role in pitch-based rule processing and its connectivity with right-hemisphere auditory areas specialized for pitch analysis provides a potential neural substrate for the proposed symbolic-phonological stream. These dissociable neural pathways may underlie the contextual switching between perceptual strategies observed in our data.
Broader Implications
Our findings have important implications for theories of speech perception. The proposed dual-stream framework explains why production–perception coupling appears in some contexts but not others. When acoustic cues reliably distinguish phonological categories, the statistical-auditory stream engages bottom-up weighting based on distributional reliability. However, when categorical processes like tone sandhi introduce surface ambiguity, the symbolic-phonological stream overrides statistical inference, guiding perception through top-down, rule-based strategies that prioritize theoretically relevant cues, even if acoustically weak.
This context-dependent flexibility reflects a core adaptive feature of speech perception: the system dynamically selects processing strategies based on the demands of the acoustic–phonological mapping task, enabling robust comprehension amid variability and structural complexity. Our findings also offer a potential resolution to the long-standing “perception–production paradox”—the observation that global links exist between perception and production, yet cue-specific correlations often fail to appear (see Schertz & Clare, 2020, for a review). Many studies reporting such dissociations, particularly for segmental contrasts, have used analytic approaches that may obscure context-specific or cue-specific coupling. For example, analyses that aggregate data across phonetic environments or fail to distinguish phonologically critical from secondary cues (e.g., Idemaru et al., 2012; Schertz et al., 2015; Shultz et al., 2012) risk masking fine-grained relationships.
Our findings suggest that this paradox is partly methodological: the production–perception link does not function as a universal or uniform principle but instead as a precision mechanism, sensitive to the cue properties within specific phonological contexts. Coupling is most likely to emerge for informative cues in environments where acoustic statistics can meaningfully constrain interpretation. Future work should adopt finer-grained, context-sensitive analyses to uncover these subtle relationships and better characterize the flexible architecture supporting speech perception.
Methodological Limitations
Several methodological constraints limit the generalizability of our findings. Most notably, the use of synthetic stimuli based on a single talker’s productions, while necessary for the experimental control required by Relative Weight Analysis, reduces ecological validity. Although the talker’s productions aligned with established Mandarin tone profiles (Chao, 1948), individual features, such as the observed T1-induced neutralization, may have influenced the specific production–perception relationships we observed.
Paradoxically, this limitation strengthens a key conclusion of our study. The fact that listeners appeared to adapt their cue-weighting strategies to accommodate talker-specific acoustic patterns highlights the flexibility of the perceptual system. Given that real-world speech perception involves navigating a wide range of vocal idiosyncrasies (e.g., Nygaard & Pisoni, 1998), our results suggest that the system may be even more adaptive than previously recognized.
Additional design choices complicate interpretation. We used different carrier syllables across tonal contexts to control segmental effects, which introduced potential cross-context confounds. We also time-normalized stimuli to exclude duration as a perceptual cue while allowing natural durational variation in production. Although duration alone is not a reliable cue in connected speech (Shih, 2007; Xu, 1997), it interacts with F0 contour in ways that affect tonal target realization (Xu & Wang, 2001) and perception (Lai & Li, 2022), potentially reducing the comparability of production and perception data.
Using participants’ own productions as proxies for their linguistic experience also presents inherent challenges. Individual anatomical and physiological differences can constrain the range of acoustic variation, particularly for cues like F0 range or temporal dynamics, which may in turn influence observed production–perception coupling patterns.
Finally, our classification of cues as “primary/critical” or “secondary” was based on perceptual relevance, which may not reflect production-based importance. Future work should explore whether the production and perception systems prioritize the same dimensions, using objective measures such as cue stability, covariation, or articulatory control.
Future Research Directions
Future research should aim to simulate more naturalistic listening conditions, incorporating variability across talker identity, phonetic context, and speaking rate. Multi-talker paradigms would test whether the proposed dual-route architecture generalizes across diverse voices and whether route-selection mechanisms remain stable when listeners encounter unfamiliar talkers or dialects. Cross-linguistic studies could further clarify whether production–perception alignment reflects a universal bias or language-specific learning.
The dual-route model also invites broader behavioral testing across a range of phonological alternations. Extending this framework to other suprasegmental (e.g., additional tone sandhi rules, stress alternations) and segmental processes (e.g., assimilation, deletion, epenthesis) could determine whether the dissociation between statistical and symbolic processing reflects a general principle of phonological perception.
Neurocognitively, the model yields testable predictions. Neuroimaging studies could contrast perception in gradient contexts (e.g., T2 vs. T4) with categorical alternations (e.g., T2T3 vs. T3T3), potentially revealing distinct neural substrates. We hypothesize that sandhi processing may uniquely recruit left-lateralized dorsal stream regions and their right-hemisphere homologues, areas associated with abstract phonological computation, beyond the bilateral ventral stream typically engaged in general speech perception (Chang & Kuo, 2016; Chang et al., 2014; Hickok & Poeppel, 2007; Zhang et al., 2011).
Developmentally, a central question is whether children begin as statistical learners who later acquire rule-based processing, or whether both modes develop in parallel from early stage (e.g., Saffran et al., 1999). Longitudinal and cross-sectional studies could clarify how children learn to flexibly switch between data-driven and knowledge-driven strategies, revealing key milestones or sensitive periods in the development of phonological processing.
Conclusions
This study challenges the notion of a uniform, monolithic relationship between speech production and perception, revealing instead a context-sensitive system shaped by cue importance and phonological structure. In gradient coarticulatory contexts, perceptual weighting aligned with the statistical reliability of acoustic cues, supporting a selective, data-driven coupling. However, in categorical contexts like tone sandhi, perception diverged from production statistics, suggesting the engagement of top-down, rule-based processing. These findings support a dual-route model of tone perception, in which listeners flexibly switch between auditory-statistical and symbolic-phonological strategies depending on the perceptual demands. This adaptability highlights the sophistication of the human perceptual system and refines our understanding of when and how production-perception coupling emerges in speech processing.
Ethics declarations:
This study was reviewed and approved by Xi’an Jiaotong University Research Ethics Committee. All participants provided written informed consent prior to participation and received monetary compensation for their time.
Disclosure statement:
We declared that there exist no potential interest conflicts in the current research.
Conflict of Interest Statement:
The authors declare no conflicts of interest.
Data availability statement
All raw data files and analysis codes in this study are publicly available via Open Science Framework at https://osf.io/qs42n/.
Acknowledgments
The research was supported by grants from the National Social Science Fund of China (22BYY160, 24CYY096) and the China Postdoctoral Science Foundation (2023M742804, 2025T180911). Y.Z. was additionally supported by University of Minnesota’s Grant-in-aid and Brain Imaging Grants.
References
- Atkins, J. E.; Fiser, J.; Jacobs, R. A. Experience-dependent visual cue integration based on consistencies between visual and haptic percepts. Vision Research 2001, 41(4), 449–461. [Google Scholar] [CrossRef]
- Audacity Team. Audacity(R): Free Audio Editor and Recorder (Version Version 3.0.0); Audacity Team, 2021; Available online: https://audacityteam.org.
- Ba, H.; Yang, N.; Demirkol, I.; Heinzelman, W. BaNa: A hybrid approach for noise resilient pitch detection. In 2012 IEEE Statistical Signal Processing Workshop (SSP); 2012; pp. 369–372. [Google Scholar] [CrossRef]
- Beijing Language Instruction Institute. Modern Chinese Frequency Dictionary; Beijing Language College Press, 1986. [Google Scholar]
- Best, C. T. A direct realist view of cross-language speech perception. In Speech perception and linguistic experience: Issues in cross-language research; Strange, W., Ed.; York Press, 1995; pp. 171–204. [Google Scholar]
- Bhattacharyya, A. On a measure of divergence between two multinomial populations; The Indian Journal of Statistics (1933-1960): Sankhyā, 1946; Volume 7, 4, pp. 401–406. [Google Scholar]
- Blicher, D. L.; Diehl, R. L.; Cohen, L. B. Effects of syllable duration on the perception of the Mandarin Tone 2/Tone 3 distinction: Evidence of auditory enhancement. Journal of Phonetics 1990, 18(1), Article 1. [Google Scholar] [CrossRef]
- Boersma, P.; van Heuven, V. Praat, a system for doing phonetics by computer. Glot International 2001, 5, 9/10. [Google Scholar]
- Bradlow, A. R.; Pisoni, D. B.; Akahane-Yamada, R.; Tohkura, Y. Training Japanese listeners to identify English /r/ and /l/: IV. Some effects of perceptual learning on speech production. The Journal of the Acoustical Society of America 1997, 101(4), 2299–2310. [Google Scholar] [CrossRef]
- Bürkner, P.-C. brms: An R Package for Bayesian Multilevel Models Using Stan. Journal of Statistical Software 2017, 80(1). [Google Scholar] [CrossRef]
- Chang, C. H. C.; Kuo, W.-J. The neural substrates underlying the implementation of phonological rule in lexical tone production: An fMRI study of the tone 3 sandhi phenomenon in mandarin chinese. PLOS ONE 2016, 11(7), e0159835. [Google Scholar] [CrossRef] [PubMed]
- Chang, H.-C.; Lee, H.-J.; Tzeng, O. J. L.; Kuo, W.-J. Implicit target substitution and sequencing for lexical tone production in chinese: An fMRI study. PLoS ONE 2014, 9(1), e83126. [Google Scholar] [CrossRef] [PubMed]
- Chao, Y. R. A system of tone letters. Le Maitre Phonetique 1930, 30, 30. [Google Scholar]
- Chao, Y. R. Mandarin Primer: An Intensive Course in Spoken Chinese; Harvard University Press, 1948. [Google Scholar]
- Chen, A.; Liu, L.; Kager, R. Cross-linguistic perception of Mandarin tone sandhi. Language Sciences 2015, 48, 62–69. [Google Scholar] [CrossRef]
- Chen, M. Y. Tone Sandhi: Patterns across Chinese Dialects; Cambridge University Press, 2000. [Google Scholar]
- Chen, N. F.; Tong, R.; Wee, D.; Lee, P.; Ma, B.; Li, H. iCALL corpus: Mandarin Chinese spoken by non-native speakers of European descent. Interspeech 2015 2015, 324–328. [Google Scholar] [CrossRef]
- Chen, S.; He, Y.; Wayland, R.; Yang, Y.; Li, B.; Yuen, C. W. Mechanisms of tone sandhi rule application by tonal and non-tonal non-native speakers. Speech Communication 2019, 115, 67–77. [Google Scholar] [CrossRef]
- Chuang, C. -K.; Hiki, S. Acoustical features and perceptual cues of the four tones of standard colloquial Chinese. The Journal of the Acoustical Society of America 1972, 52(1A), 1A. [Google Scholar] [CrossRef]
- Clayards, M. A. The ideal listener: Making optimal use of acoustic-phonetic cues for word recognition . PhD Dissertation, University of Rochester, 2008. [Google Scholar]
- Clayards, M.; Tanenhaus, M. K.; Aslin, R. N.; Jacobs, R. A. Perception of speech reflects optimal use of probabilistic speech cues. Cognition 2008, 108(3), Article 3. [Google Scholar] [CrossRef] [PubMed]
- Coetzee, A. W.; Beddor, P. S.; Shedden, K.; Styler, W.; Wissing, D. Plosive voicing in Afrikaans: Differential cue weighting and tonogenesis. Journal of Phonetics 2018, 66, 185–216. [Google Scholar] [CrossRef]
- Diehl, R. L.; Lotto, A. J.; Holt, L. L. Speech Perception. Annual Review of Psychology 2004, 55(1), 149–179. [Google Scholar] [CrossRef] [PubMed]
- Ernst, M. O.; Banks, M. S. Humans integrate visual and haptic information in a statistically optimal fashion. Nature 2002, 415(6870), Article 6870. [Google Scholar] [CrossRef]
- Farris-Trimble, A.; McMurray, B. Emergent information-level coupling between perception and production. In The Oxford Handbook of Laboratory Phonology; Cohn, A. C., Fougeron, C., Huffman, M. K., Eds.; Oxford University Press, 2011; pp. 1–26. [Google Scholar]
- Feldman, N. H.; Griffiths, T. L.; Morgan, J. L. The influence of categories on perception: Explaining the perceptual magnet effect as optimal statistical inference. In Psychological Review; PubMed, 2009; Volume 116, 4, p. Article 4. [Google Scholar] [CrossRef]
- Flege, J. E.; Bohn, O.-S.; Jang, S. Effects of experience on non-native speakers’ production and perception of English vowels. Journal of Phonetics 1997, 25(4), 437–470. [Google Scholar] [CrossRef]
- Fowler, C. A. An event approach to the study of speech perception from a direct–realist perspective. Journal of Phonetics 1986, 14(1), 3–28. [Google Scholar] [CrossRef]
- Gandour, J. Tone perception in Far Eastern languages. Journal of Phonetics 1983, 11(2), 2. [Google Scholar] [CrossRef]
- Gandour, J. T. Perceived dimensions of 13 tones: A multidimensional scaling investigation. Phonetica 1978, 35(3), 3. [Google Scholar] [CrossRef]
- Goldinger, S. Echoes of echoes? An episodic theory of lexical access. Psychological Review 1998, 105(2), 251–279. [Google Scholar] [CrossRef] [PubMed]
- Goldinger, S. D.; Azuma, T. Episodic memory reflected in printed word naming. Psychonomic Bulletin & Review 2004, 11(4), 716–722. [Google Scholar] [CrossRef] [PubMed]
- Goldinger, S. D.; Van Summers, W. Lexical neighborhoods in speech production: A first report. The Journal of the Acoustical Society of America 1989, 85(S1), S97–S97. [Google Scholar] [CrossRef]
- Grenon, I.; Benner, A.; Esling, J. H. Language-specific phonetic production patterns in the f irst year of life. Proceedings of the 16th International Congress of Phonetic Sciences 2007, 3, 1561–1564. [Google Scholar]
- Hazan, V.; Rosen, S. Individual variability in the perception of cues to place contrasts in initial stops. Perception & Psychophysics 1991, 49(2), 187–200. [Google Scholar] [CrossRef]
- Heald, S.; Nusbaum, H. Speech perception as an active cognitive process. Frontiers in Systems Neuroscience 2014, 8. [Google Scholar] [CrossRef]
- Hickok, G.; Poeppel, D. The cortical organization of speech processing. Nature Reviews Neuroscience 2007, 8(5), 393–402. [Google Scholar] [CrossRef]
- Holt, L. L.; Lotto, A. J. Cue weighting in auditory categorization: Implications for first and second language acquisition. The Journal of the Acoustical Society of America 2006, 119(5), 3059–3071. [Google Scholar] [CrossRef]
- Idemaru, K.; Holt, L. L. Word recognition reflects dimension-based statistical learning. In Journal of Experimental Psychology: Human Perception and Performance; PubMed, 2011; Volume 37, 6, p. Article 6. [Google Scholar] [CrossRef]
- Idemaru, K.; Holt, L. L. The developmental trajectory of children’s perception and production of English /r/-/l/. The Journal of the Acoustical Society of America 2013, 133(6), Article 6. [Google Scholar] [CrossRef]
- Idemaru, K.; Holt, L. L.; Seltman, H. Individual differences in cue weights are stable across time: The case of Japanese stop lengths. The Journal of the Acoustical Society of America 2012, 132(6), Article 6. [Google Scholar] [CrossRef]
- Jacobs, R. A. Optimal integration of texture and motion cues to depth. Vision Research 1999, 39(21), 3621–3629. [Google Scholar] [CrossRef]
- Jeffreys, H. Theory of Probability, 3rd ed.; Oxford University Press, 1961. [Google Scholar]
- Jongman, A.; Qin, Z.; Zhang, J.; Sereno, J. A. Just noticeable differences for pitch direction, height, and slope for Mandarin and English listeners. The Journal of the Acoustical Society of America 2017, 142(2), 2. [Google Scholar] [CrossRef] [PubMed]
- Kailath, T. The divergence and Bhattacharyya distance measures in signal selection. IEEE Transactions on Communications 1967, 15(1), 52–60. [Google Scholar] [CrossRef]
- Kajarekar, S.; Malayath, N.; Hermansky, H. Analysis of sources of variability in speech. 6th European Conference on Speech Communication and Technology; 1999; pp. 343–346. [Google Scholar] [CrossRef]
- Kiriloff, C. On the auditory perception of tones in Mandarin. Phonetica 1969, 20(2–4), Article 2–4. [Google Scholar] [CrossRef]
- Kleinschmidt, D. F.; Jaeger, T. F. Robust speech perception: Recognize the familiar, generalize to the similar, and adapt to the novel. Psychological Review 2015, 122(2), 148–203. [Google Scholar] [CrossRef]
- Komzsik, L. Approximation Techniques for Engineers; CRC Press, 2017. [Google Scholar]
- Kruschke, J. Doing bayesian data analysis: A tutorial with R, JAGS, and stan; Academic Press, 2014. [Google Scholar]
- Ladefoged, P. What are linguistic sounds made of? Language 1980, 56(3), 3. [Google Scholar] [CrossRef]
- Lai, W.; Li, A. Integrating phonological and phonetic aspects of Mandarin Tone 3 sandhi in auditory sentence disambiguation. Laboratory Phonology 2022, 13(1). [Google Scholar] [CrossRef]
- Leather, J. Perceptual and productive learning of Chinese lexical tone by Dutch and English speakers. In New Sounds 90: Proceedings of the Amsterdam Symposium on the Acquisition of Second Language Speech; Leather, J., James, A., Eds.; University of Amsterdam, 1990; pp. 305–341. [Google Scholar]
- Leung, K. K. W.; Wang, Y. Production-perception relationship of Mandarin tones as revealed by critical perceptual cues. The Journal of the Acoustical Society of America 2020, 147(4), Article 4. [Google Scholar] [CrossRef]
- Liberman, A. M.; Cooper, F. S.; Shankweiler, D. P.; Studdert-Kennedy, M. Perception of the speech code. Psychological Review 1967, 74(6), 431–461. [Google Scholar] [CrossRef]
- Liberman, A. M.; Delattre, P.; Cooper, F. S. The role of selected stimulus-variables in the perception of the unvoiced stop consonants. The American Journal of Psychology 1952, 65, 497–516. [Google Scholar] [CrossRef]
- Liberman, A. M.; Mattingly, I. G. The motor theory of speech perception revised. Cognition 1985, 21(1), 1–36. [Google Scholar] [CrossRef] [PubMed]
- Liberman, A. M.; Mattingly, I. G. A specialization for speech perception. Science 1989, 243(4890), 489–494. [Google Scholar] [CrossRef] [PubMed]
- Liberman, A. M.; Whalen, D. H. On the relation of speech to language. Trends in Cognitive Sciences 2000, 4(5), 5. [Google Scholar] [CrossRef]
- Massaro, D. W.; Cohen, M. M.; Tseng, C. Y. The evaluation and integration of pitch height and pitch contour in lexical tone perception in Mandarin Chinese. Journal of Chinese Linguistics 1985, 13(2), 2. [Google Scholar]
- McClelland, J. L.; Elman, J. L. The TRACE model of speech perception. Cognitive Psychology 1986, 18(1), Article 1. [Google Scholar] [CrossRef]
- Miller, J. L.; Green, K. P.; Reeves, A. Speaking rate and segments: A look at the relation between speech production and speech perception for the voicing contrast. Phonetica 1986, 43(1–3), 106–115. [Google Scholar] [CrossRef]
- Moore, C.; Jongman, A. Speaker normalization in the perception of Mandarin Chinese tones. The Journal of the Acoustical Society of America 1997, 102(3), 3. [Google Scholar] [CrossRef]
- Murphy, T. K.; Nozari, N.; Holt, L. L. Transfer of statistical learning from passive speech perception to speech production. Psychonomic Bulletin & Review 2024, 31(3), 1193–1205. [Google Scholar] [CrossRef]
- Newman, R. S. Using links between speech perception and speech production to evaluate different acoustic metrics: A preliminary report. In The Journal of the Acoustical Society of America; PubMed, 2003; Volume 113, 5, pp. 2850–2860. [Google Scholar] [CrossRef]
- Nygaard, L. C.; Pisoni, D. B. Talker-specific learning in speech perception. Perception & Psychophysics 1998, 60(3), 355–376. [Google Scholar] [CrossRef]
- Peng, S. Lexical versus “phonological” representations of Mandarin Sandhi tones. In Papers in Laboratory Phonology V: Acquisition and the Lexicon; Broe, M. B., Pierrehumbert, J. B., Eds.; Cambridge University Press, 2000; pp. 152–167. [Google Scholar]
- Peterson, G. E.; Barney, H. L. Control methods used in a study of the vowels. The Journal of the Acoustical Society of America 1952, 24(2), Article 2. [Google Scholar] [CrossRef]
- R Development Core Team. R: A Langage and Environment for statistical Computing . R Foundation for Statistical Computing. 2022. Available online: http://www.R-project.org/.
- Saffran, J. R.; Johnson, E. K.; Aslin, R. N.; Newport, E. L. Statistical learning of tone sequences by human infants and adults. Cognition 1999, 70(1), 27–52. [Google Scholar] [CrossRef] [PubMed]
- Schertz, J.; Cho, T.; Lotto, A.; Warner, N. Individual differences in phonetic cue use in production and perception of a non-native sound contrast. Journal of Phonetics 2015, 52, 183–204. [Google Scholar] [CrossRef] [PubMed]
- Schertz, J.; Clare, E. J. Phonetic cue weighting in perception and production. WIREs Cognitive Science 2020, 11(2), e1521. [Google Scholar] [CrossRef] [PubMed]
- Shen, J.; Deutsch, D.; Rayner, K. On-line perception of Mandarin Tones 2 and 3: Evidence from eye movements. The Journal of the Acoustical Society of America 2013, 133(5), 3016–3029. [Google Scholar] [CrossRef]
- Shen, X. S. Tonal coarticulation in Mandarin. Linguistic Approaches to Phonetics Papers Presented in Honor of J.C. Catford 1990, 18(2), Article 2. [Google Scholar] [CrossRef]
- Shen, X. S.; Lin, M. A perceptual study of Mandarin tones 2 and 3. Language and Speech 1991, 34(2), 145–156. [Google Scholar] [CrossRef]
- Shih, C. Prosody Learning and Generation; Springer, 2007. [Google Scholar]
- Shih, C.; Lu, H.-Y. D. Effects of talker-to-listener distance on tone. Journal of Phonetics 2015, 51, 6–35. [Google Scholar] [CrossRef]
- Shockley, K.; Sabadini, L.; Fowler, C. A. Imitation in shadowing words. In Percept Psychophys; PubMed, 2004; Volume 66, 3, pp. 422–429. [Google Scholar] [CrossRef]
- Shultz, A. A.; Francis, A. L.; Llanos, F. Differential cue weighting in perception and production of consonant voicing. In J Acoust Soc Am; PubMed, 2012; Volume 132, 2, pp. EL95–101. [Google Scholar] [CrossRef]
- Sun, D. X.; Deng, L. Analysis of acoustic-phonetic variations in fluent speech using TIMIT. 1995 International Conference on Acoustics, Speech, and Signal Processing 1995, 1, 201–204. [Google Scholar] [CrossRef]
- Theodore, R. M.; Miller, J. L.; DeSteno, D. Individual talker differences in voice-onset-time: Contextual influences. The Journal of the Acoustical Society of America 2009, 125(6), Article 6. [Google Scholar] [CrossRef]
- Tonidandel, S.; LeBreton, J. M. RWA web: A free, comprehensive, web-based, and user-friendly tool for relative weight analyses. Journal of Business and Psychology 2015, 30(2), 207–216. [Google Scholar] [CrossRef]
- Toscano, J. C.; McMurray, B. Cue integration with categories: Weighting acoustic cues in speech using unsupervised learning and distributional statistics. Cognitive Science 2010, 34(3), 434–464. [Google Scholar] [CrossRef]
- Tupper, P.; Leung, K.; Wang, Y.; Jongman, A.; Sereno, J. A. Characterizing the distinctive acoustic cues of Mandarin tones. The Journal of the Acoustical Society of America 2020, 147(4), 4. [Google Scholar] [CrossRef] [PubMed]
- Wang, D.; Brown, G. J. Computational auditory scene analysis: Principles, algorithms, and applications; Wiley-IEEE press, 2006. [Google Scholar]
- Wang, W. S.; Li, K.-P. Tone 3 in pekinese. Journal of Speech and Hearing Research 1967, 10(3), Article 3. [Google Scholar] [CrossRef] [PubMed]
- Wang, Y.; Spence, M. M.; Jongman, A.; Sereno, J. A. Training American listeners to perceive Mandarin tones. The Journal of the Acoustical Society of America 1999, 106(6), 3649–3658. [Google Scholar] [CrossRef] [PubMed]
- Whalen, D. H.; Xu, Y. Information for Mandarin tones in the amplitude contour and in brief segments. Phonetica 1992, 49(1), Article 1. [Google Scholar] [CrossRef]
- Xi, J.; Zhang, L.; Shu, H.; Zhang, Y.; Li, P. Categorical perception of lexical tones in Chinese revealed by mismatch negativity. Neuroscience 2010, 170(1), 223–231. [Google Scholar] [CrossRef]
- Xie, X.; Buxó-Lugo, A.; Kurumada, C. Encoding and decoding of meaning through structured variability in intonational speech prosody. Cognition 2021, 211, 104619. [Google Scholar] [CrossRef]
- Xu, Y. Contextual tonal variations in Mandarin. Journal of Phonetics 1997, 25(1), Article 1. [Google Scholar] [CrossRef]
- Xu, Y.; Wang, Q. Pitch targets and their realization: Evidence from Mandarin Chinese. Speech Communication 2001, 33(4), Article 4. [Google Scholar] [CrossRef]
- Yang, N.; Ba, H.; Cai, W.; Demirkol, I.; Heinzelman, W. BaNa: A noise resilient fundamental frequency detection algorithm for speech and music. IEEE/ACM Transactions on Audio, Speech, and Language Processing 2014, 22(12), 12. [Google Scholar] [CrossRef]
- Zhang, J.; Lai, Y. Testing the role of phonetic knowledge in Mandarin tone sandhi. In Phonology; Cambridge Core, 2010; Volume 27, 1, p. Article 1. [Google Scholar] [CrossRef]
- Zhang, J.; Yan, H. Contextually dependent cue realization and cue weighting for a laryngeal contrast in Shanghai Wu. The Journal of the Acoustical Society of America 2018, 144(3), Article 3. [Google Scholar] [CrossRef]
- Zhang, L.; Xi, J.; Xu, G.; Shu, H.; Wang, X.; Li, P. Cortical dynamics of acoustic and phonological processing in speech perception. PloS One 2011, 6(6), 6. [Google Scholar] [CrossRef]
- Zhang, X.; Cheng, B.; Qin, D.; Zhang, Y. Is talker variability a critical component of effective phonetic training for nonnative speech? Journal of Phonetics 2021, 87, 101071. [Google Scholar] [CrossRef]
- Zhang, X.; Cheng, B.; Zou, Y.; Li, X.; Zhang, Y. Cognitive factors in nonnative phonetic learning: Impacts of inhibitory control and working memory on the benefits and costs of talker variability. Journal of Phonetics 2023, 100, 101266. [Google Scholar] [CrossRef]
- Zou, T.; Zhang, J.; Cao, W. A comparative study of perception of tone 2 and tone 3 in Mandarin by native speakers and Japanese learners. In The 8th International Symposium on Chinese Spoken Language Processing; 2012; pp. 431–435. [Google Scholar] [CrossRef]
Figure 1.
Schematic plot illustrating the two allophones of Mandarin Tone 3 resulting from the tone sandhi rule. (A) When followed by another Tone 3, it is realized as a rising tone (35), becoming similar to an underlying Tone 2. (B) When followed by Tone 1, Tone 2, or Tone 4, the underlying dipping Tone 3 (214) is realized as a low-falling tone (21).
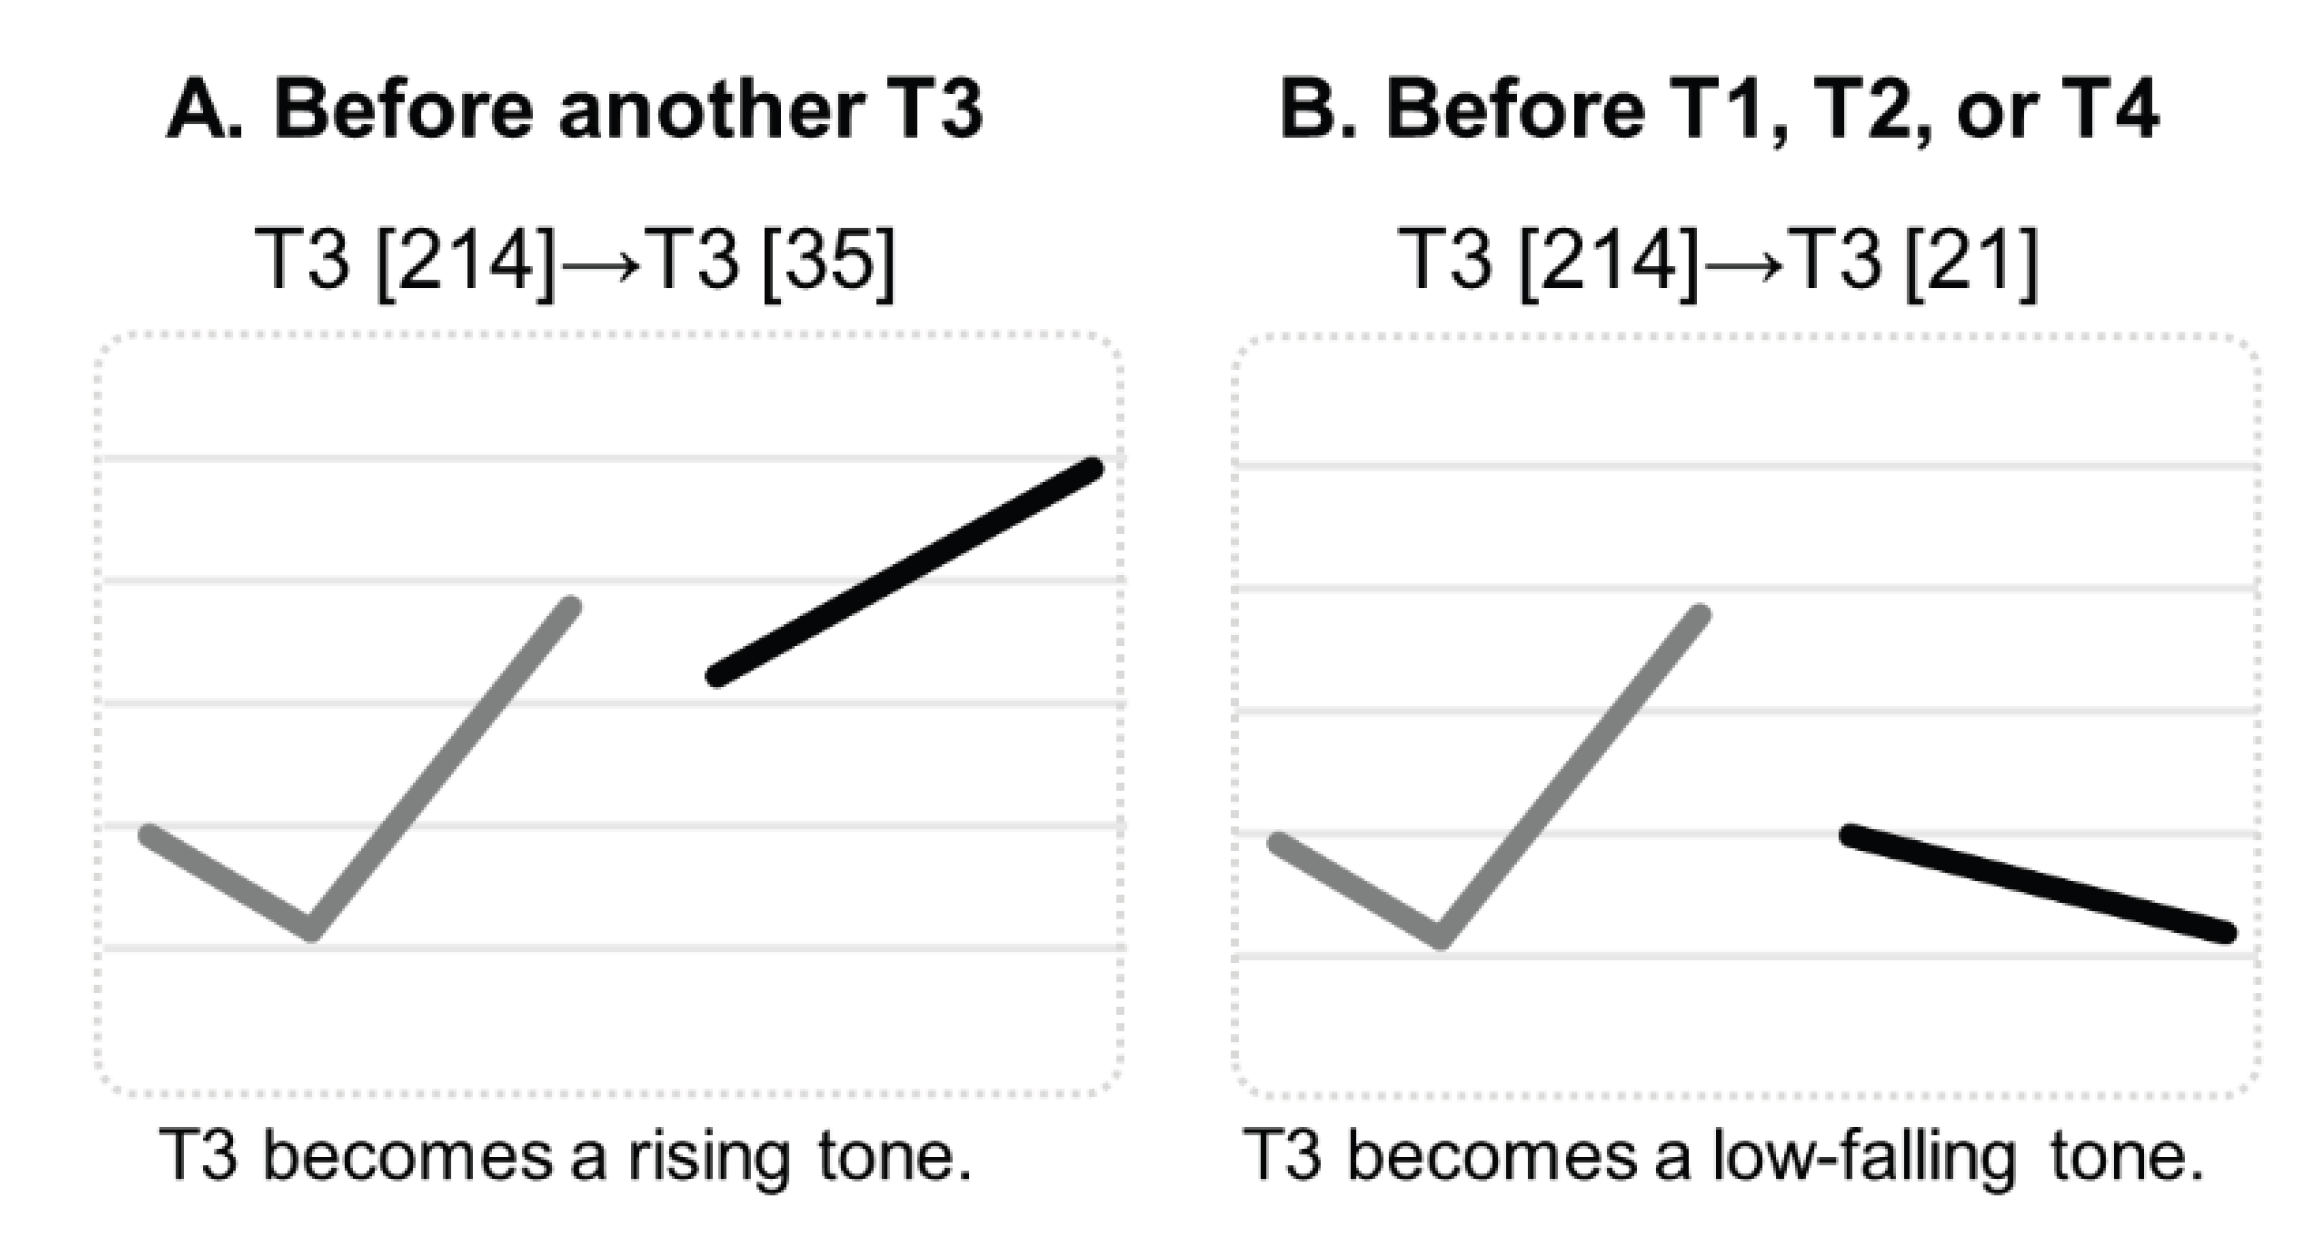
Figure 2.
F0 (semitone) contours of the synthetic stimulus continua used in the tone identification task across four tonal contexts. Each panel displays the stimulus continua for specific contexts: (A) followed context Tone 1, Tone 2, and Tone 4; (B) followed context Tone 3. For each context, the endpoints of the continuum were derived from the natural productions of Tone 2 and Tone 3.
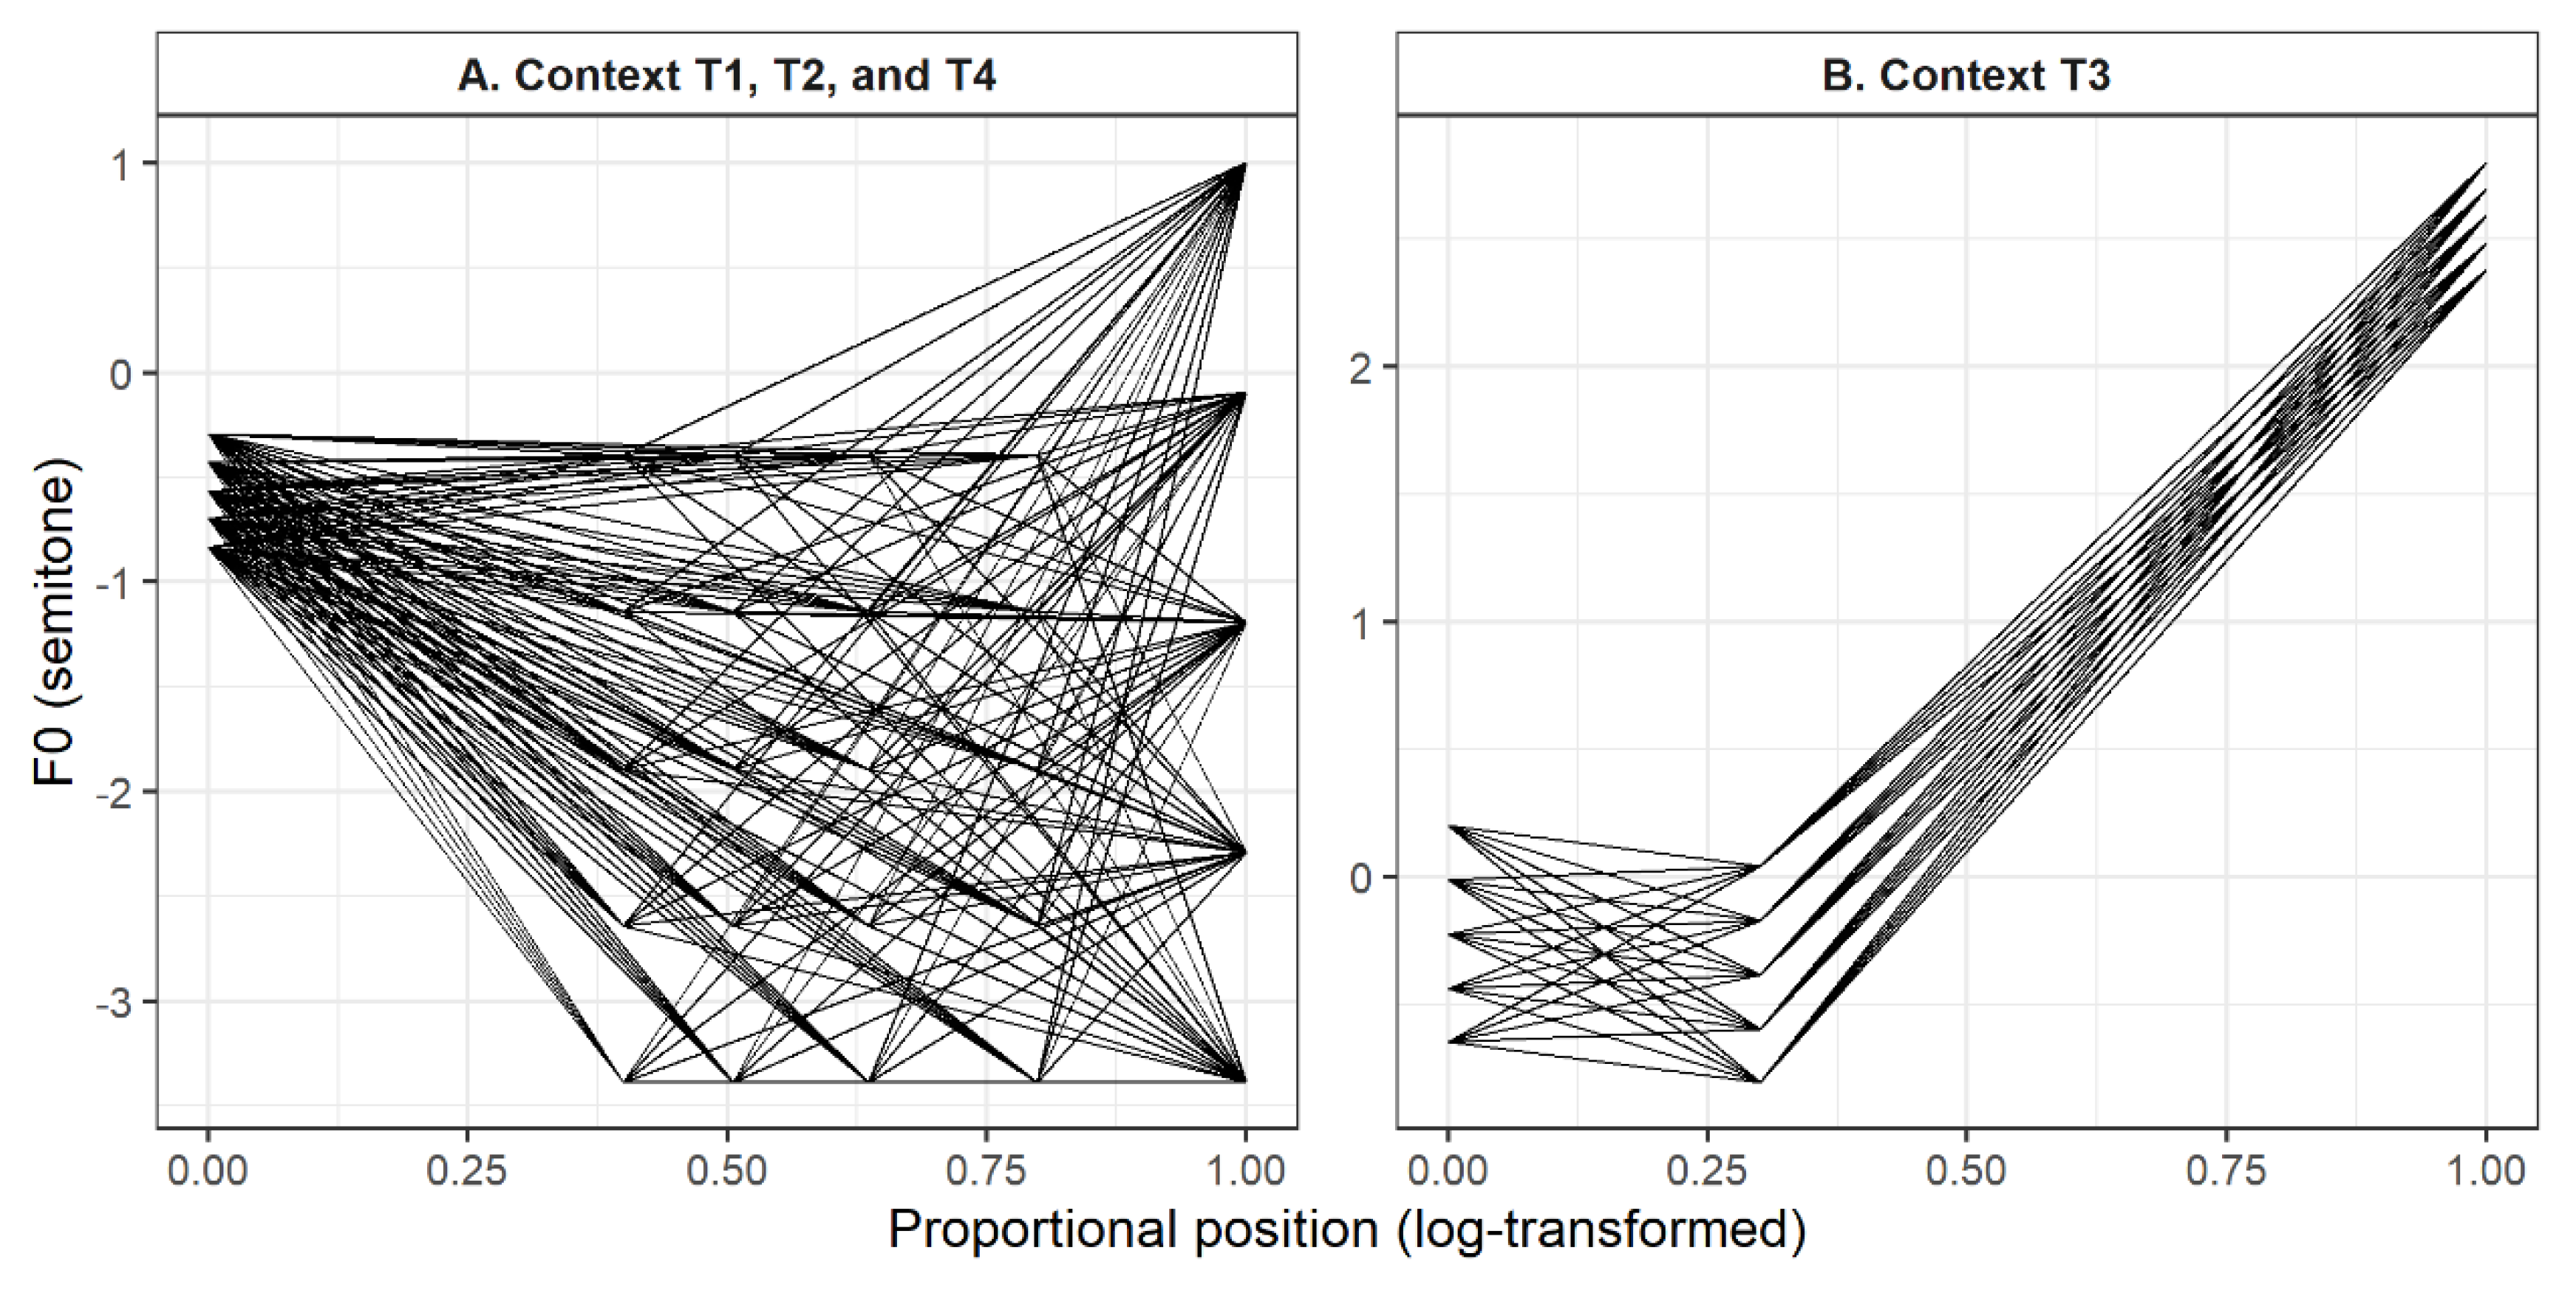
Figure 3.
Group-level distributions of seven acoustic cues for T2 and T3 across four tonal contexts (T1, T2, T3, T4). Data are averaged across participants.
Figure 3.
Group-level distributions of seven acoustic cues for T2 and T3 across four tonal contexts (T1, T2, T3, T4). Data are averaged across participants.
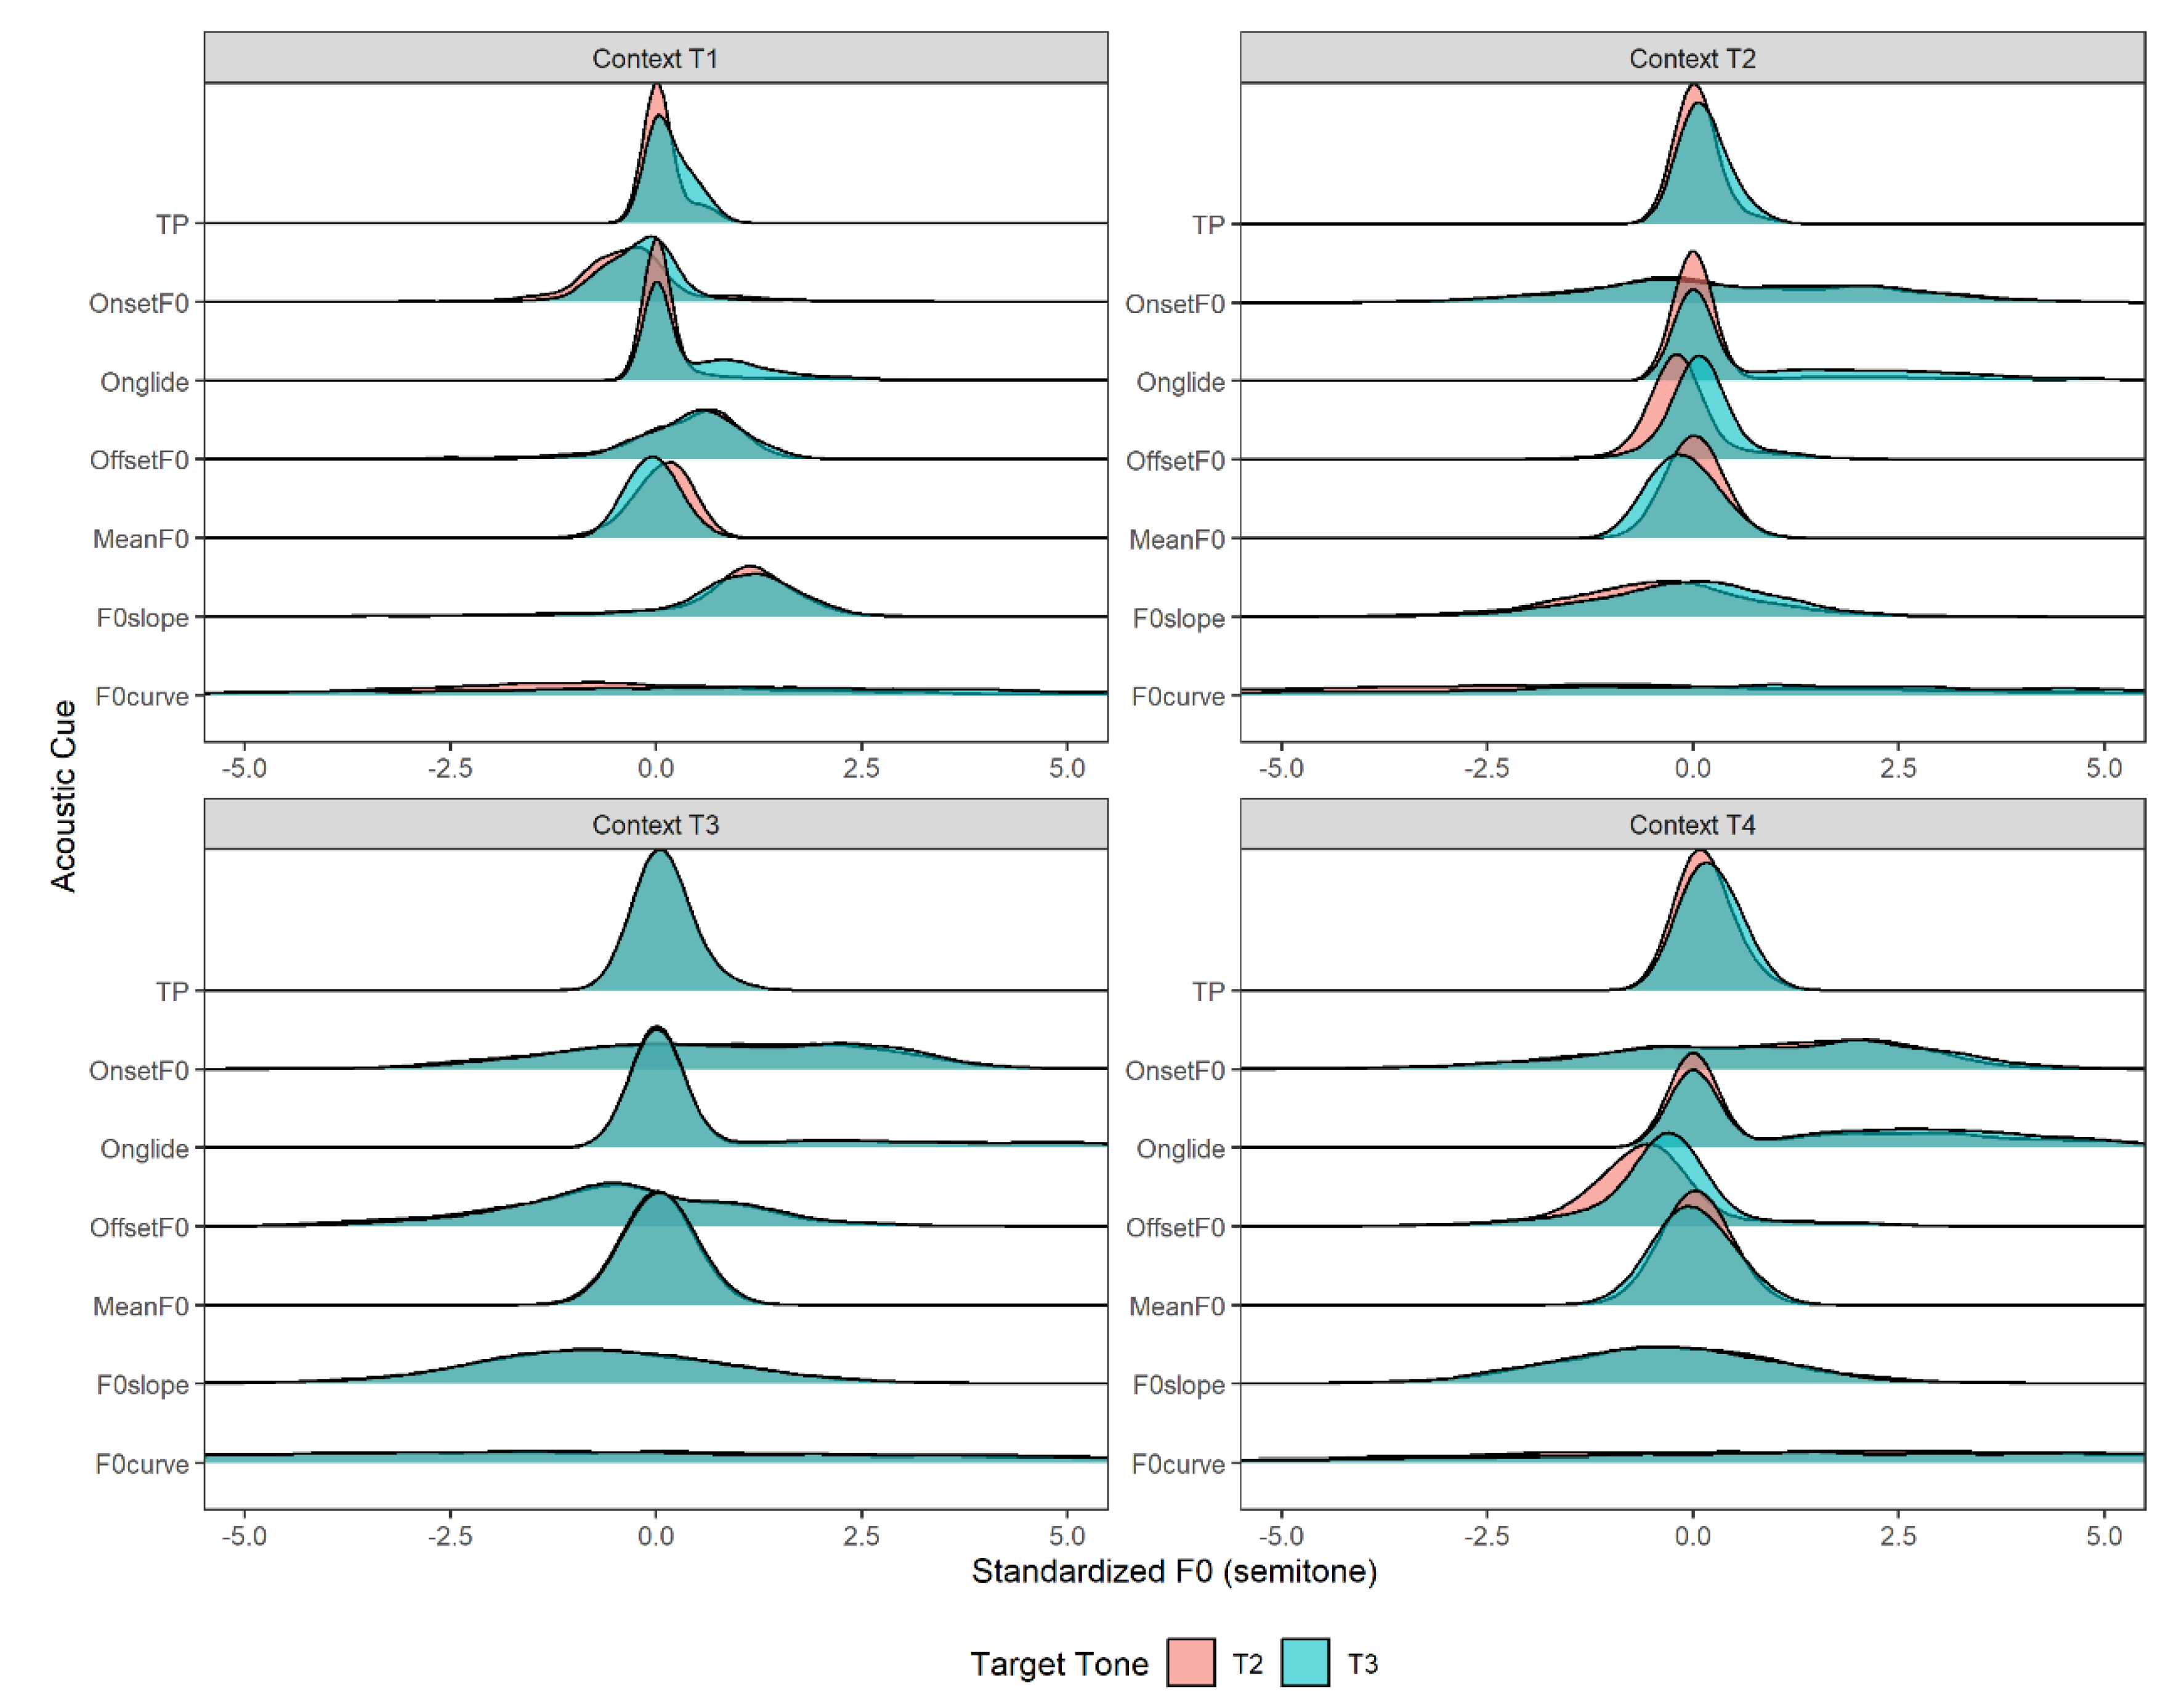
Figure 4.
Boxplot of Bhattacharyya Coefficients (BC) for seven acoustic cues across tonal contexts. Higher values indicate greater overlap between T2 and T3 distributions.
Figure 4.
Boxplot of Bhattacharyya Coefficients (BC) for seven acoustic cues across tonal contexts. Higher values indicate greater overlap between T2 and T3 distributions.
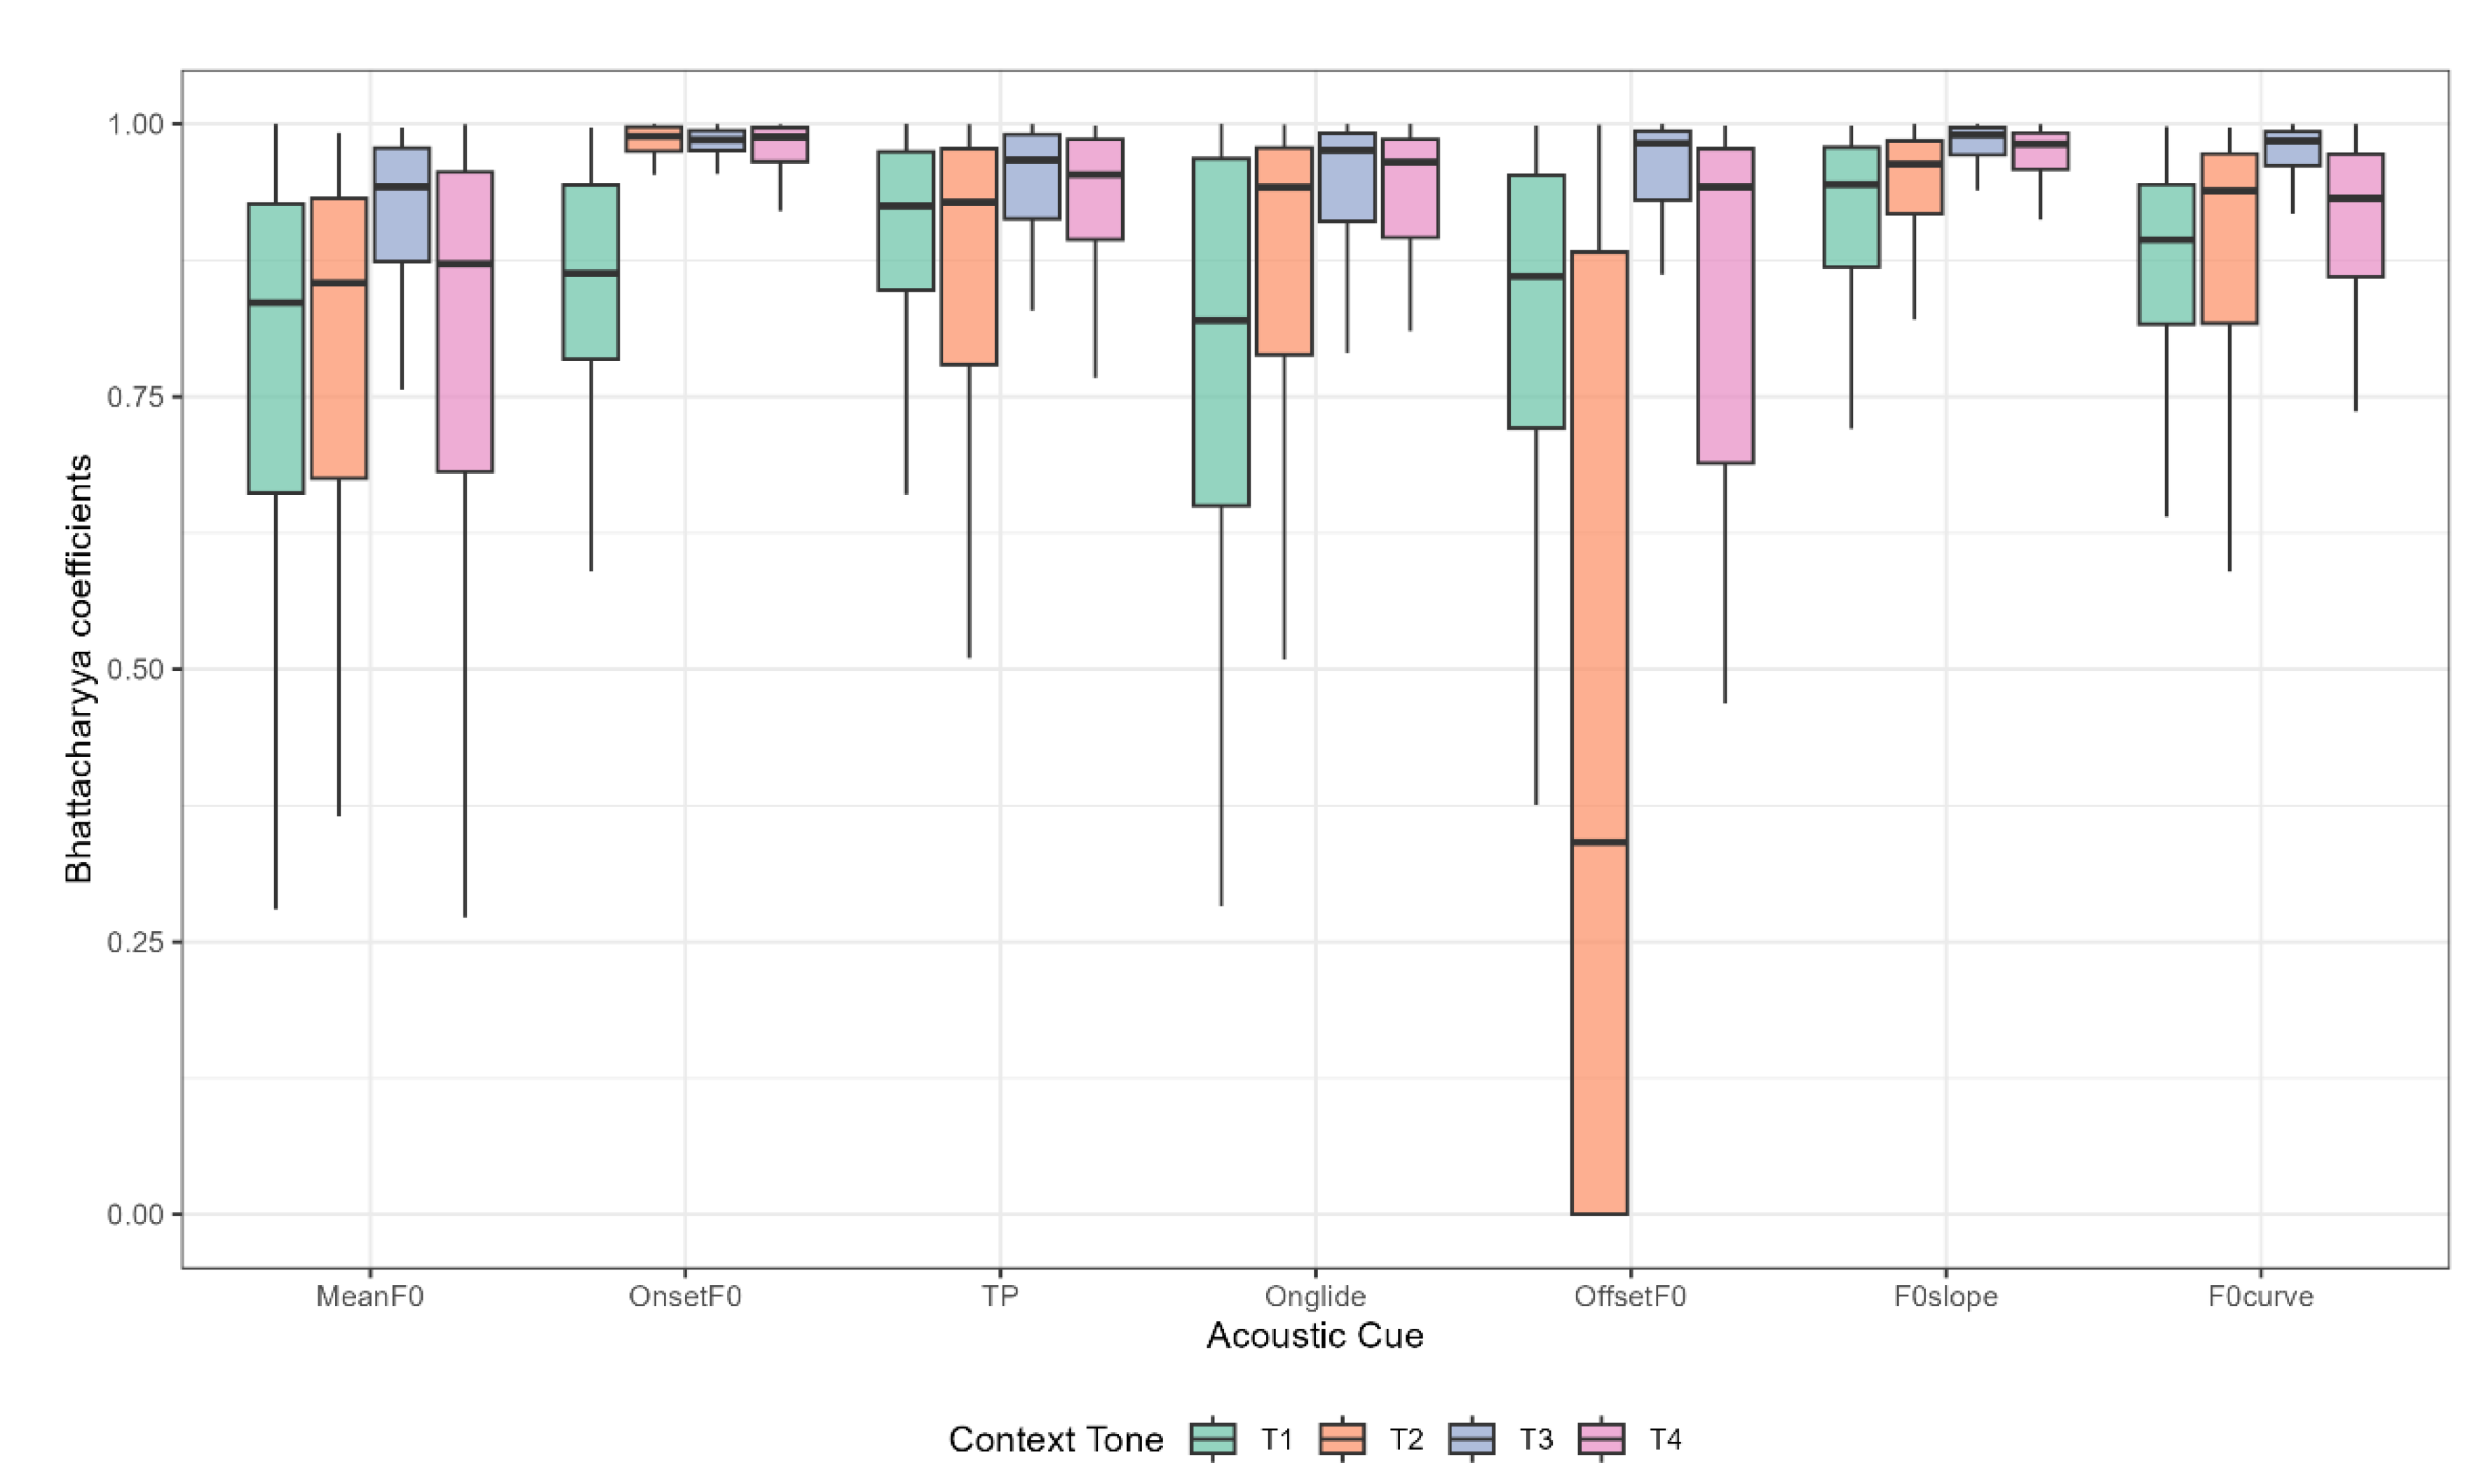
Figure 5.
Heatmap of estimated marginal means of Bhattacharyya Coefficients (BC) for seven acoustic cues across tonal contexts. Lighter cells indicate lower distributional overlap (higher cue reliability); darker cells indicate higher overlap.
Figure 5.
Heatmap of estimated marginal means of Bhattacharyya Coefficients (BC) for seven acoustic cues across tonal contexts. Lighter cells indicate lower distributional overlap (higher cue reliability); darker cells indicate higher overlap.
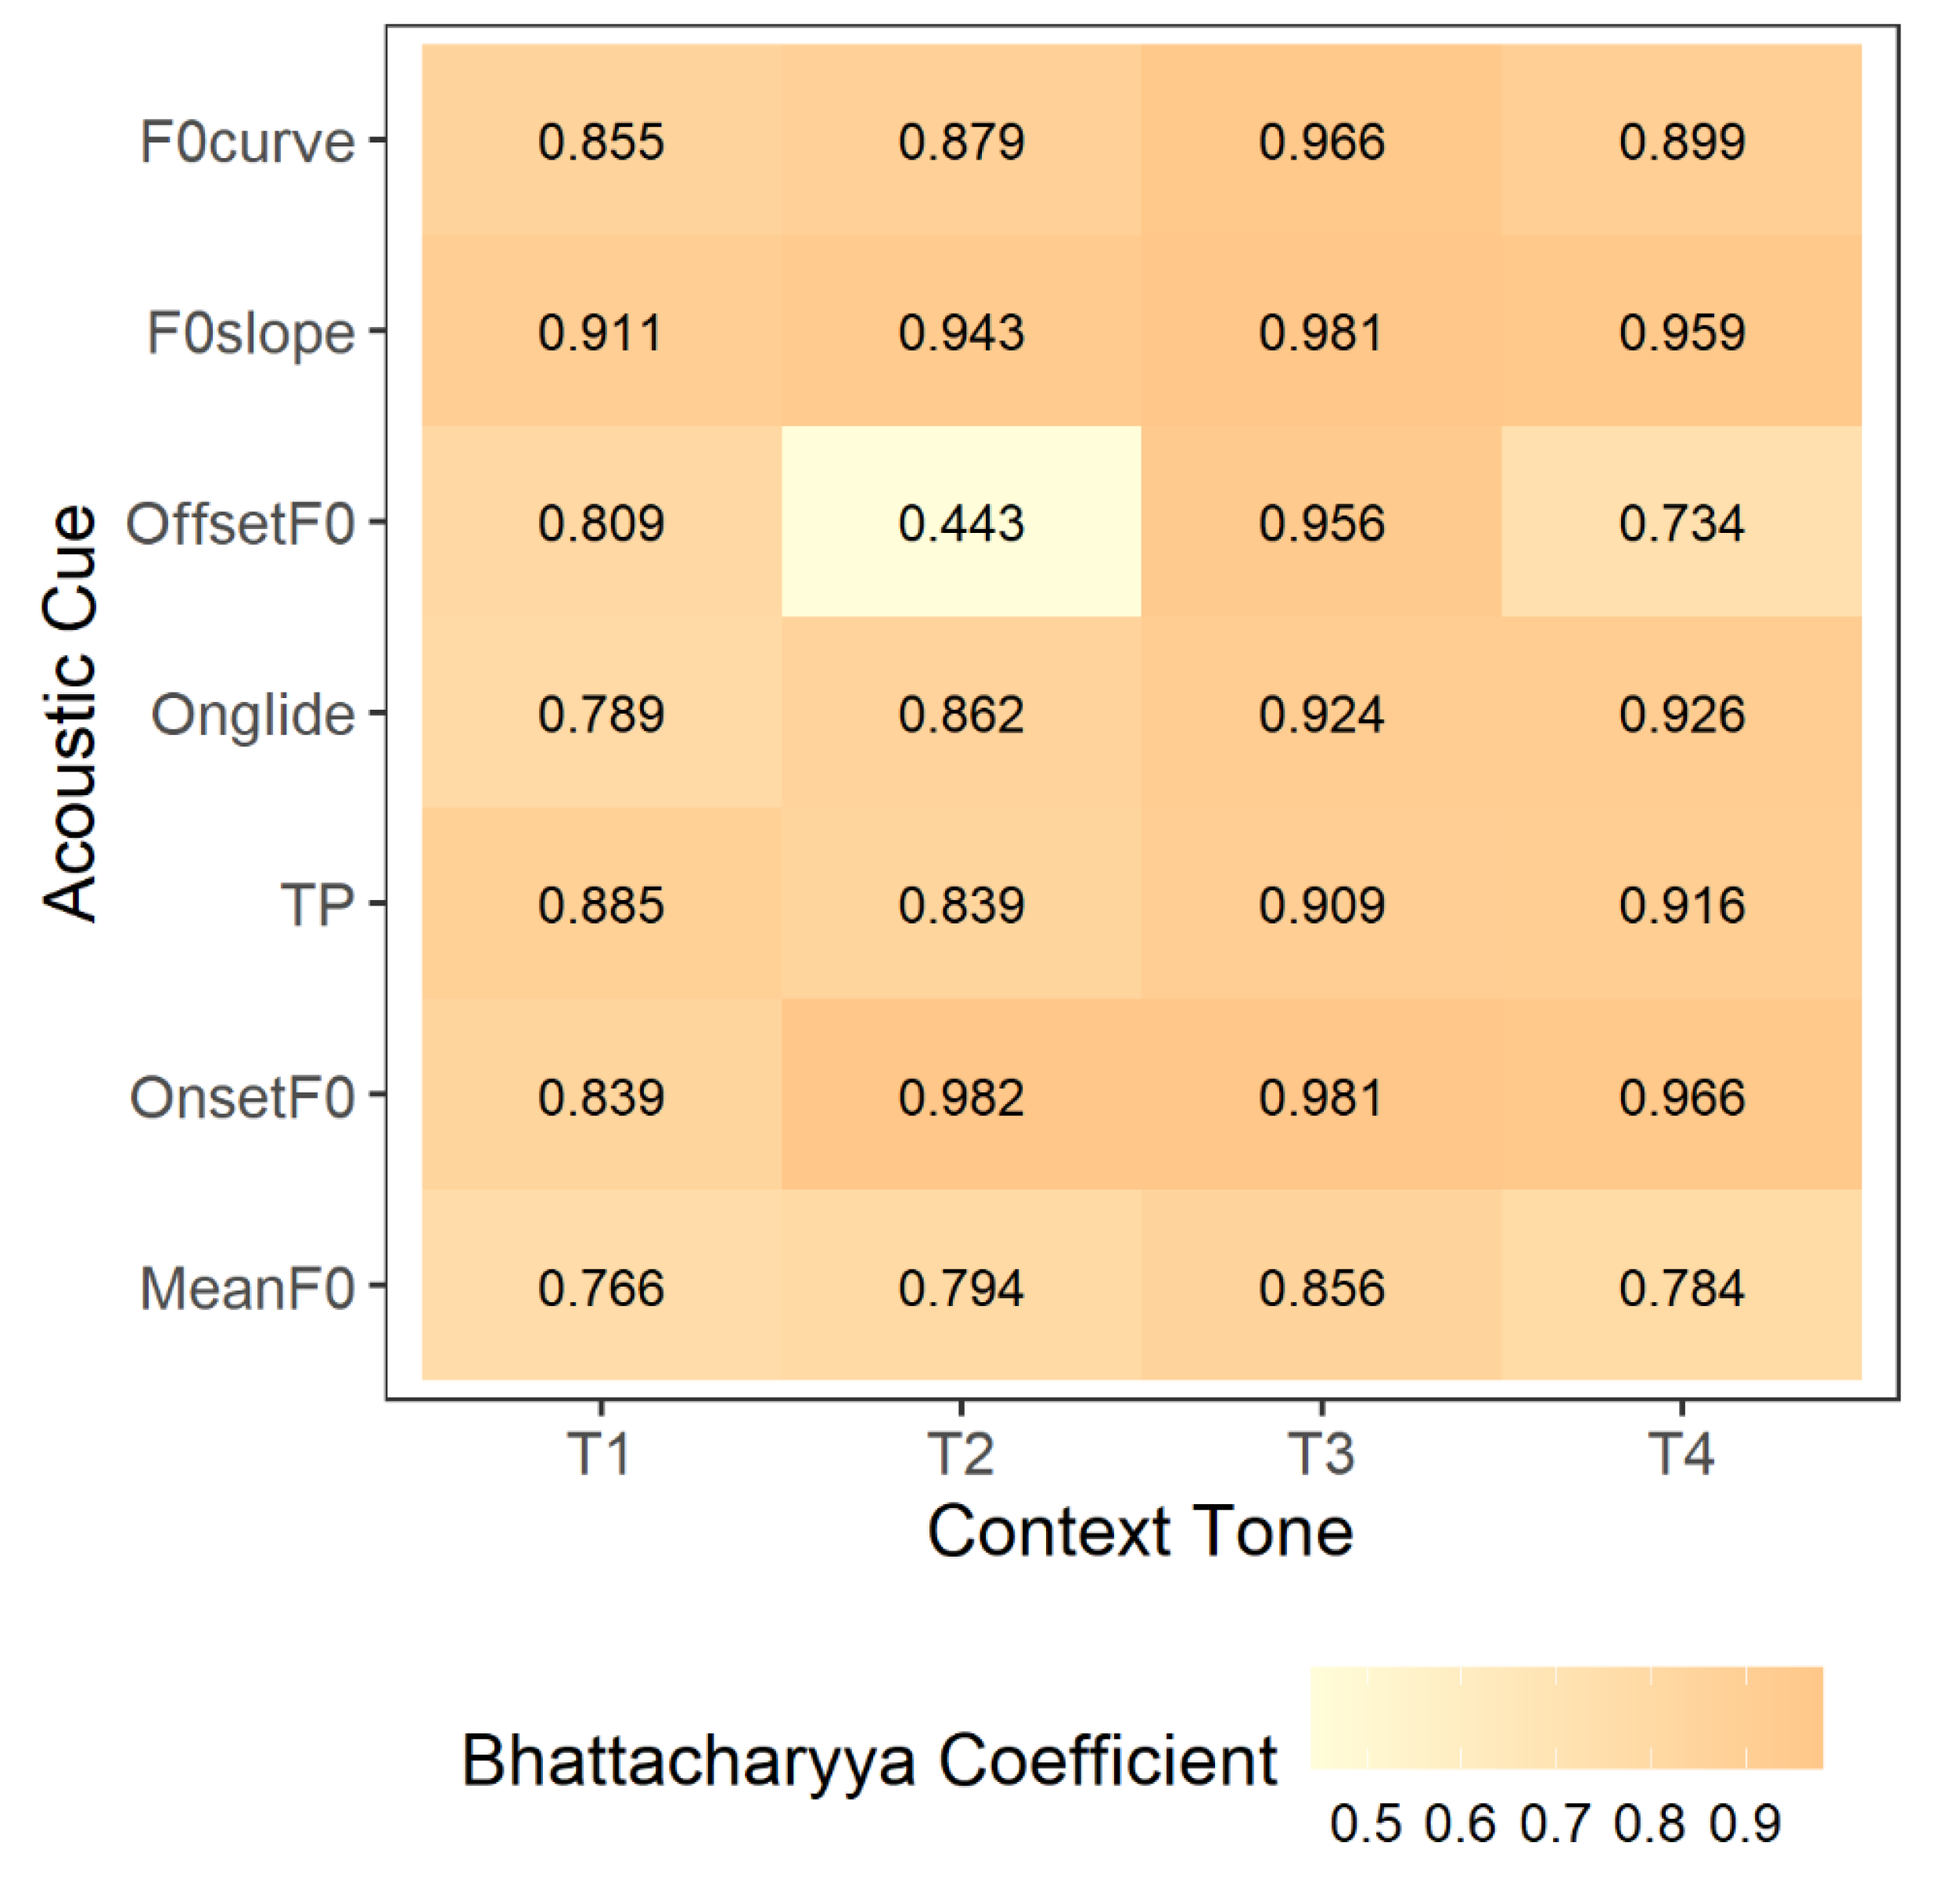
Figure 6.
Boxplot of perceptual cue weights (RWA values) for each acoustic cue across tonal contexts. Higher values indicate stronger perceptual reliance.
Figure 6.
Boxplot of perceptual cue weights (RWA values) for each acoustic cue across tonal contexts. Higher values indicate stronger perceptual reliance.

Figure 7.
Heatmap of estimated marginal means for perceptual cue weights (RWA values) across seven acoustic cues and four tonal contexts. Darker shades represent greater perceptual weight.
Figure 7.
Heatmap of estimated marginal means for perceptual cue weights (RWA values) across seven acoustic cues and four tonal contexts. Darker shades represent greater perceptual weight.
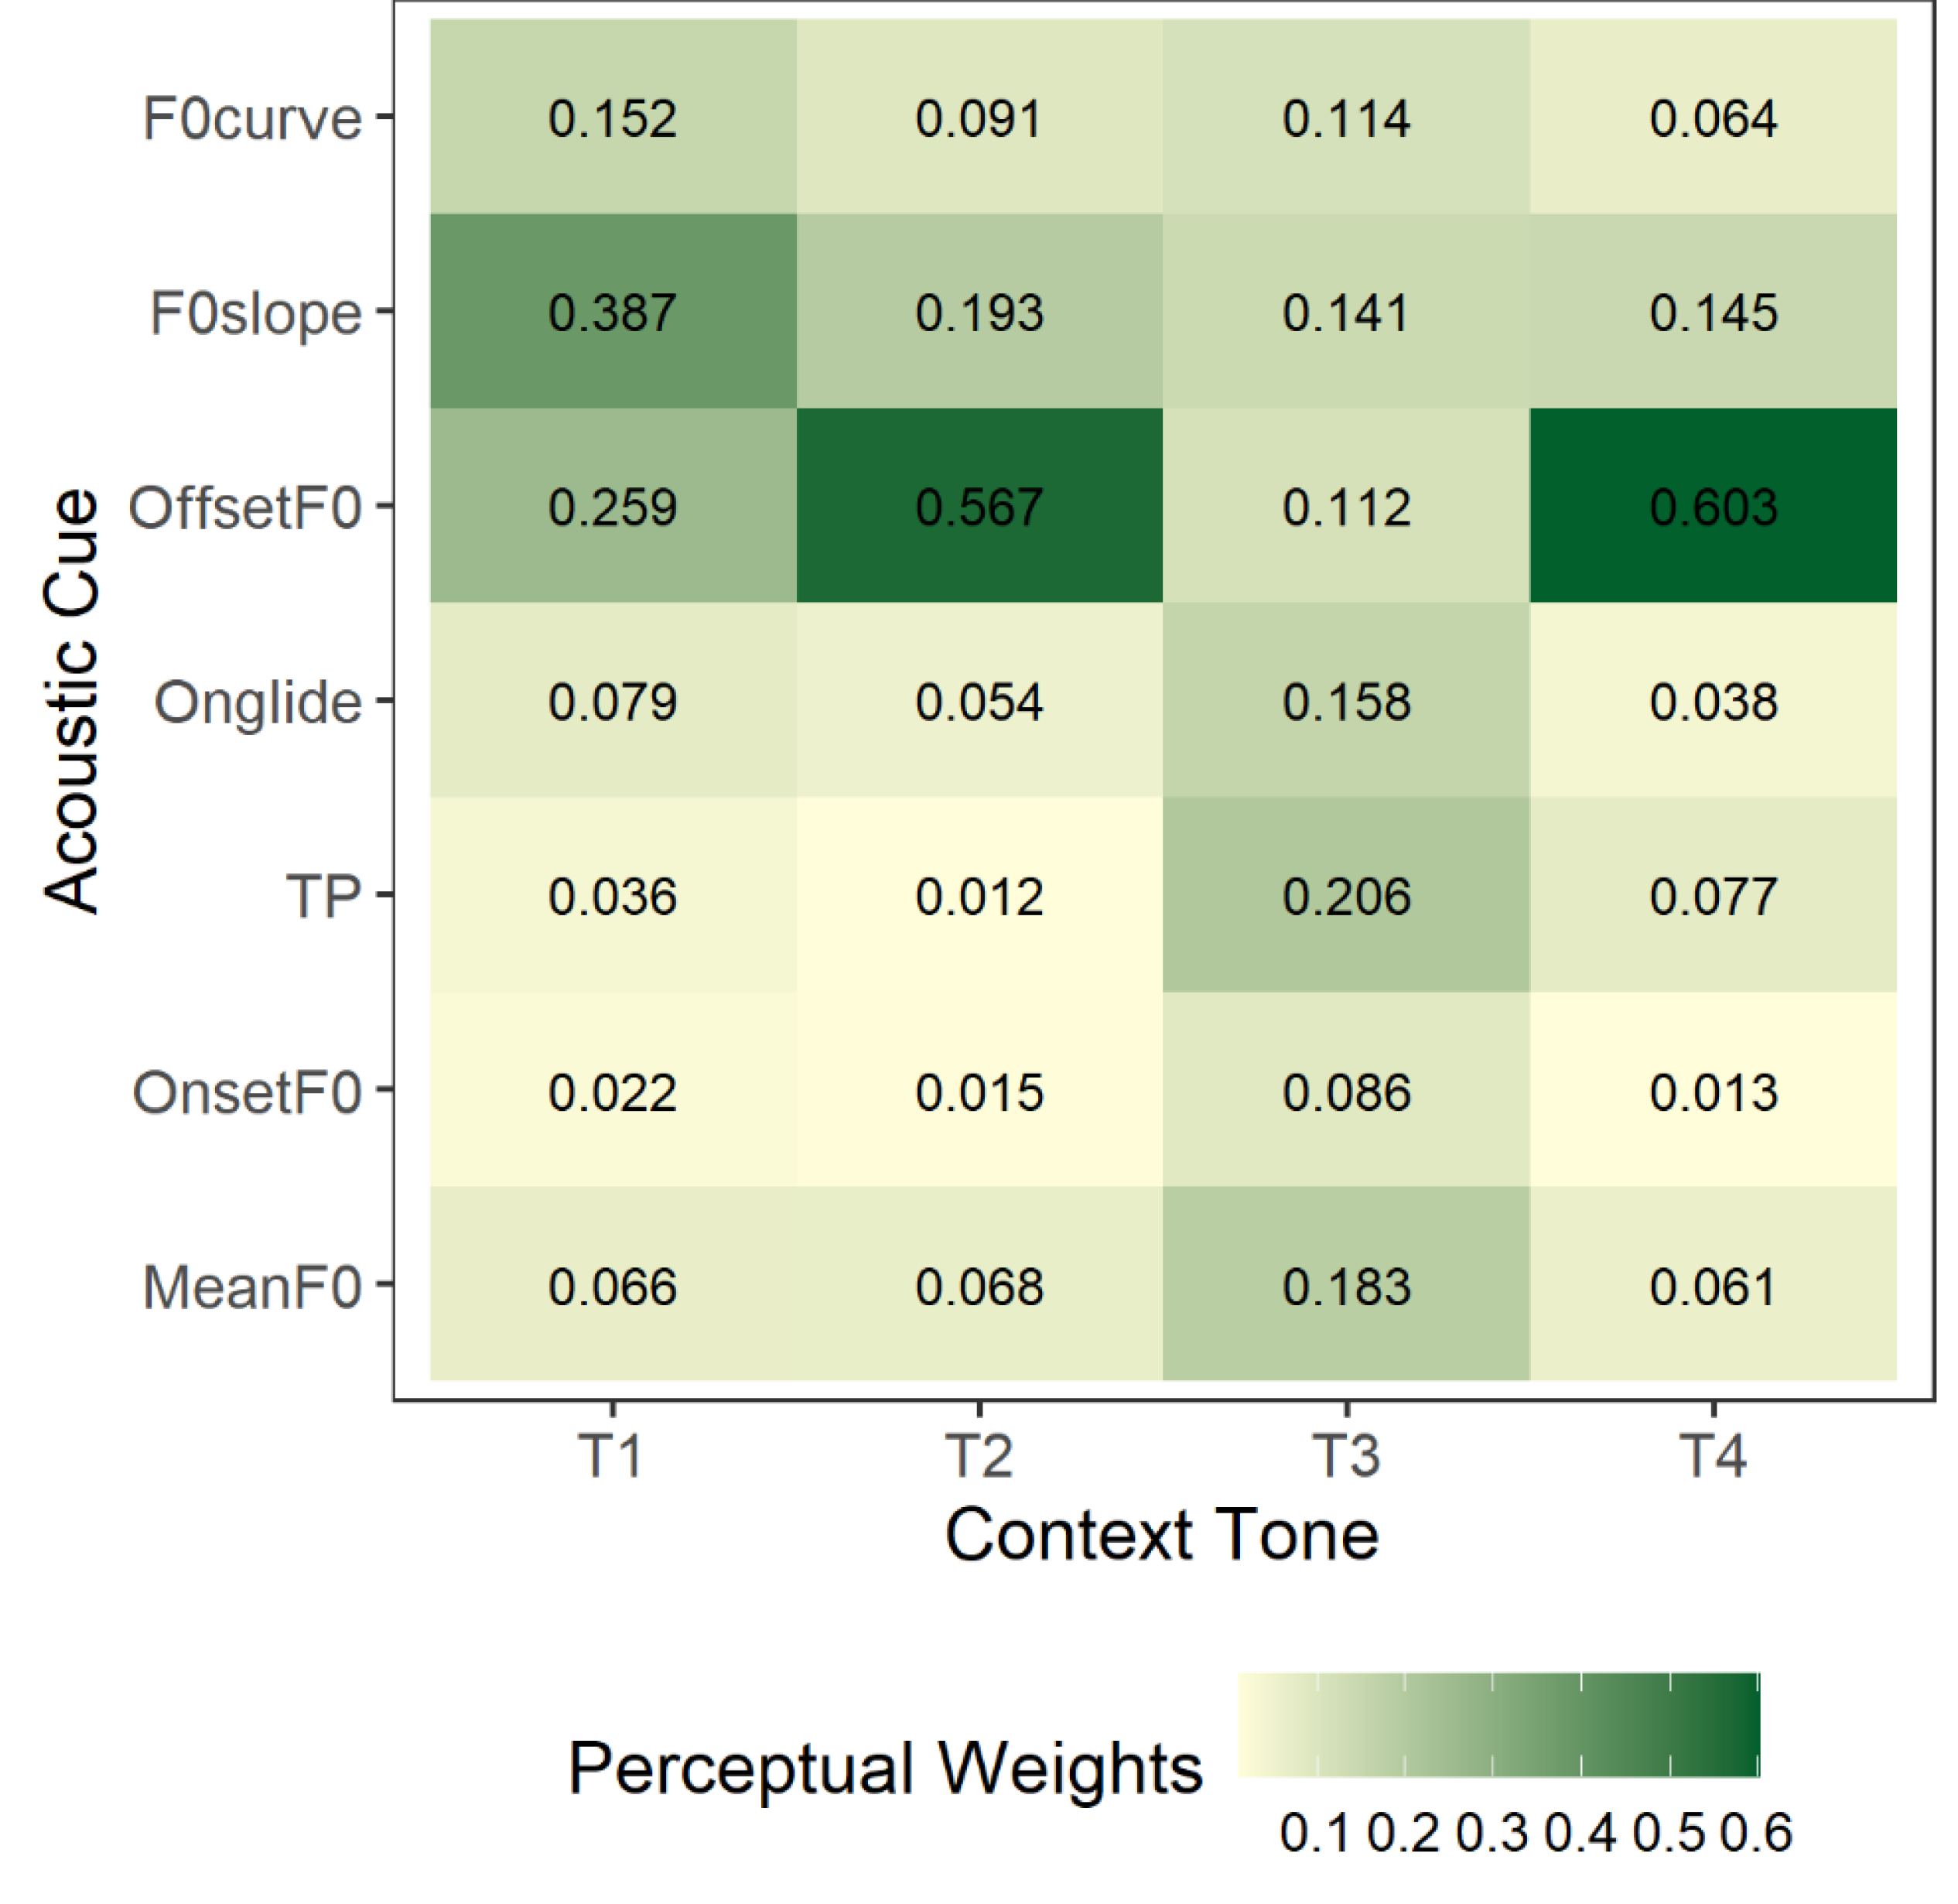

Table 1.
The experimental stimuli used in the recording task. The target monosyllable carrying the target tone is highlighted in bold. Target T2 and T3 are represented by the numbers 2 and 3.
Table 1.
The experimental stimuli used in the recording task. The target monosyllable carrying the target tone is highlighted in bold. Target T2 and T3 are represented by the numbers 2 and 3.
| Context T1 | Context T2 | Context T3 | Context T4 |
|---|---|---|---|
|
yan2ke1严苛 yan3ke1眼科 |
ti2cai2题材 ti3cai2体裁 |
xie2shou3携手 xie3shou3写手 |
qi2shi4歧视 qi3shi4启示 |
Disclaimer/Publisher’s Note: The statements, opinions and data contained in all publications are solely those of the individual author(s) and contributor(s) and not of MDPI and/or the editor(s). MDPI and/or the editor(s) disclaim responsibility for any injury to people or property resulting from any ideas, methods, instructions or products referred to in the content. |
© 2025 by the authors. Licensee MDPI, Basel, Switzerland. This article is an open access article distributed under the terms and conditions of the Creative Commons Attribution (CC BY) license (http://creativecommons.org/licenses/by/4.0/).
Copyright: This open access article is published under a Creative Commons CC BY 4.0 license, which permit the free download, distribution, and reuse, provided that the author and preprint are cited in any reuse.


