
Submitted:
23 October 2025
Posted:
24 October 2025
You are already at the latest version
Abstract
This study presents a comprehensive Raman spectroscopic and mechanical investigation of Gd3Ga5O12 (GGG) single crystals irradiated with 231 MeV Xe ions at fluences ranging from 1×10¹¹ to 3.3×10¹³ ions/cm2. Raman analysis reveals that all fundamental vibrational modes of the garnet structure remain observable up to the highest fluence, confirming the structural stability of the lattice without formation of secondary crystalline phases. However, significant line broadening (FWHM increase by 20–100%) and low-frequency shifts indicate progressive lattice disorder and phonon-defect scattering. High-frequency Ga–O stretching modes (A1g, T2g ~740 cm-1) remain the most resistant to irradiation, while low-energy translational modes involving Gd3+ ions exhibit pronounced degradation and partial disappearance at high fluence. Complementary nanoindentation measurements show radiation-induced softening: hardness decreases by up to ≈ 60% at 3.3×10¹³ ions/cm2, consistent with amorphization and overlapping ion tracks (~10–12 μm deep). These results demonstrate that GGG maintains crystalline integrity below the track-overlap threshold (~6 keV/nm) but undergoes strong structural relaxation and mechanical weakening once this limit is exceeded. A new analytical methodology has been developed to quantify radiation-induced structural degradation. The method integrates Raman spectroscopic diagnostics with mechanical nanoindentation data through a unified normalization and logarithmic-slope formalism, enabling precise correlation between vibrational and mechanical responses.
Keywords:
Gd3Ga5O12 single crystals
; Raman spectra
; optical absorbance
; nanoindentation
; radiation-induced defects
; scintillation materials
1. Introduction
Gadolinium gallium garnet (GGG, Gd3Ga5O12) is a versatile platform for photonics. Upon doping with rare-earth ions (Ce3+, Er3+, Dy3+, Sm3+, Nd3+, Eu3+) it operates as a phosphor, laser, and scintillation material [1,2,3,4,5,6,7,8,9,10]. In particular, Ce:GGG exhibits intense 4f–5d transitions suitable for phosphor and scintillation applications [1,2,3], Bi³⁺/Eu³⁺ co-modifications function as UV→VIS converters [9], and Er3+/Pr3+, Dy3+, Sm3+, and Nd3+ provide laser-active transitions spanning from the orange–red to the near-IR spectral regions [4,5,6,8,9,10]. Transition-metal doping (e.g., Cr3+) enables tuning of the crystal field and energy-transfer pathways, broadening the spectral engineerability of active media and phosphors [11]. For substrate applications, GGG is grown as an epitaxial wafer from “pure” polycrystalline feedstock [12]; mechanical-technological protocols (nanoscratch testing, crack-free grinding, nanoindentation) deliver optically smooth surfaces and low loss [13,14,15].
GGG crystallizes in the cubic garnet structure (Ia-3d) with a GaO₄/GaO₆ framework and dodecahedrally coordinated Gd3+. Isomorphic substitutions by Ca2+/Mg2+/Zr4+ finely tune the lattice parameter, defectiveness, and dislocation density; Rietveld refinements correlate with shifts/broadening of Raman modes (A1g/Eg/T2g), making Raman spectroscopy a convenient rapid indicator of microstructural changes [16]. In YIG/GGG heterosystems, Raman signatures are sensitive to interfacial stresses and reaction–diffusion processes at LPE interfaces [17], while remote epitaxy through graphene confirms the suitability of GGG as a platform for transferable thin films [18]. Brillouin spectroscopy in multilayer YIG/GGG structures highlights the linkage between magnoacoustics and mechanically induced stress governed by substrate quality [19]. Hydrostatic pressure induces polyhedral distortions and frequency shifts/broadening (FWHM) of Raman lines [20]; similar trends reported for related garnets (Lu3Ga5O12) aid calibration of deformation-induced effects in GGG [21]. Impurity diffusion (e.g., Co) underscores the role of thermal treatment and defect chemistry in forming traps/color centers [22]. Cation substitutions (e.g., Al) illustrate the controllability of GGG crystal chemistry and associated structure–property couplings in garnets [23].
Two limiting radiation-damage scenarios are observed in GGG. (i) Neutron irradiation predominantly generates Frenkel point defects and their clusters, leading to a moderate increase in induced absorption and Raman-diagnosable microimperfections (mode shifts, FWHM growth, elevated background scattering) without loss of long-range order [24]. (ii) Swift heavy ions (U, Kr, etc.) with high electronic stopping (Sₑ) produce latent tracks with local amorphization and elastic-stress fields, thereby enhancing optical losses and yielding a pronounced Raman signature of disorder [25,26,27,28,29]. The measured track cross-sections and their scale are well described by the inelastic thermal spike model (ITSM), defining thresholds for track formation and conditions for subsequent recrystallization [28,29,30,31,32,33]; at the macroscopic level, out-of-plane swelling is recorded as an integral marker of bulk defect accumulation [29]. At large Sₑ, electronic sputtering is also observed, with yields and stoichiometric shifts correlating with track physics and local lattice degradation [30].
From an optical standpoint, radiation-induced absorption arises from contributions of color centers and Urbach-tail broadening. Under neutron exposure, optical absorption increases persistently in the UV/visible range, in concert with Raman line broadening and background growth [24]. In the case of 84Kr ion irradiation, correlated changes in optical, structural, and mechanical metrics indicate a transition from defect-modulated quasi-crystalline states to local amorphization within tracks as Se and/or fluence increase [27]. Comparative studies across garnets (including YIG as a model) reveal a common set of spectral damage signatures and amorphization → recrystallization pathways upon annealing [31,32]; consistency of mechanisms is further supported by XRD/AFM data for YAG under swift ions [34] and cross-publication verification for YIG [35]. Notably, even without ion bombardment, color centers can emerge in doped GGG/YAG, establishing a “background” of defect chemistry for radiation testing [36].
Raman metrics of dose accumulation include: (i) Δω—frequency shifts of GaO₄/GaO₆ framework modes; (ii) ΔFWHM—line broadening as an indicator of microimperfections and phonon–defect scattering; (iii) Idisorder/Iref—mode-to-background intensity ratios sensitive to local amorphization [24,28,32]. A useful “calibration” is provided by pressure analogies, where directed shifts/broadening reflect polyhedral distortions [20,21]. In multilayer YIG/GGG, dose-dependent Raman changes are compounded by interfacial effects (stress, reaction–diffusion), which are critical for the stability of spin-wave and magnoacoustic regimes; here Raman naturally complements Brillouin spectroscopy as a stress- and defect-sensitive technique [19,31].
A radiation-hardness strategy for the GGG platform follows: control of oxygen stoichiometry and defect chemistry during growth, minimization of dislocations and subsurface damage, optimization of isomorphic substitutions (Ca/Mg/Zr) for stress relaxation, management of extrinsic-ion diffusion (Co), and interfacial quality; a defined post-irradiation annealing protocol—under continuous monitoring by optical (band-edge/induced absorption) and Raman metrics (Δω, ΔFWHM, background) [16,19,24,27,28,29,30,31,32,33,34,35,36].
Recent studies on radiation effects in oxides and fluorides have provided a broader framework for understanding defect formation in complex garnets. In ZrO2 and MgO ceramics, nanostructuring and irradiation temperature were shown to control polymorphic stability, defect clustering, and resistance to amorphization [37,38,39]. For BeO, diffusion of vacancy-type defects and relaxation of residual stress were identified as key factors governing swelling and microstructural expansion [40]. Investigations of LiF crystals under electron and heavy-ion irradiation revealed correlations between color-center stability and thermal annealing behavior [41,42,43]. Swift heavy ion studies on Y3A5O12 and Y3Fe5O12 garnets demonstrated track formation, amorphization–recrystallization transitions, and stress-induced softening [44,45,46,47,48]. Complementary diffraction modeling of Nd:YAG ceramics confirmed defect-assisted strain relaxation [49]. Together, these findings emphasize the relevance of comparing radiation-induced disorder and lattice relaxation in Gd3Ga5O12 with that in structurally related oxides and halides.
In the present study, we analyze changes in the Raman spectra of GGG induced by 131Xe heavy ions with an energy of 231 MeV at fluences of 1011, 1012, 1013, and 3.3×10¹³ ions/cm2. Particular attention is paid to frequency shifts and linewidth broadening (without considering intensity changes), assessing the resilience of different vibrational modes to radiation exposure, and correlating the observed modes with specific structural fragment vibrations (Ga–O bonds in tetrahedral and octahedral units, vibrations involving Gd3+). Additionally, changes in the microhardness of irradiated crystals are examined, enabling a correlation between lattice defect accumulation and degradation of mechanical properties.
2. Materials and Methods
Single crystals of GGG were grown using the Czochralski technique from an iridium crucible under a mildly oxidizing atmosphere at the Scientific Research Company “Electron-Carat” (Lviv, Ukraine). The growth environment comprised a controlled mixture of 98% argon and 2% oxygen. High-purity Gd2O3 and Ga2O3 powders (99.99 wt%) were employed as starting materials. Since tetravalent impurity ions such as Si4+ and Zr4+ in the raw oxides can induce cation vacancies and promote spiral growth in rare-earth gallium garnets, a small amount of CaO (10−2–10−3 wt%) was added to the melt to mitigate these undesirable effects.
Optical absorption spectra were recorded at room temperature using an PERSEE T8DCS spectrophotometer (Beijing, China) in the wavelength range of 200–800 nm with a spectral resolution of 1.0 nm.
The micro- and nanomechanical properties of the samples were investigated using an Agilent Nano G200 nanoindenter (USA), enabling continuous stiffness measurements (CSM) through simultaneous recording of applied load and corresponding indenter displacement. Measurements were performed both on the irradiated surface and along cross-sectional profiles obtained by cleaving the irradiated samples along the ion beam direction. Surface profile measurements provided more informative data, allowing evaluation of structural and mechanical property variations along the entire ion penetration path and their dependence on depth, defined as the distance from the irradiated surface.
In CSM mode, hardness and Young’s modulus were determined as functions of penetration depth. Calibration was performed using certified reference samples following the procedures recommended by the manufacturer. For each measurement point, ten indentations were performed, and the mean values were calculated to ensure accuracy and reproducibility.
Raman spectra were acquired using a TriVista CRS Raman spectrometer (Princeton Instruments) equipped with a triple monochromator and a cooled CCD detector, providing a spectral resolution better than 0.1 cm−1. Excitation was achieved with a 532 nm solid-state laser, selected for its high stability and strong resonance with characteristic vibrational modes of the studied material. The scattered radiation was collected in a backscattering geometry using a confocal optical microscope with submicron spatial resolution, allowing precise localization of the probed area on the sample surface. The laser power at the sample was carefully adjusted to avoid local heating or damage. The spectrometer was calibrated using the 520.7 cm−1 line of a crystalline silicon standard. All measurements were conducted at room temperature, and the acquired spectra were corrected for background and instrument response.
3. Results and Discussion
3.1. Optical Absorption Spectra
Figure 1a presents the optical absorption spectra of GGG single crystals irradiated with 231 MeV Xe ions at various fluences. The pristine crystal exhibits a sharp fundamental absorption edge in the ultraviolet (UV) region, followed by transparency in the visible range. With increasing irradiation fluence, the absorption edge gradually shifts to longer wavelengths, reflecting radiation-induced modifications in the electronic structure of the crystal. At low fluences (1011–1012 ions/cm2), this effect is weak, whereas at 1013 and especially 3.3×10¹³ ions/cm2, significant edge broadening and visible transparency reduction are observed, indicating defect accumulation and the formation of additional absorption centers related to point defects and ion tracks.
The visible absorption bands at 254, 275, and 313 nm are attributed to the electronic transitions 8S7/2 → 6Dj, 8S7/2 → 6Ij, and 8S7/2 → 6Pj, respectively. Impurity dopants may introduce additional energy levels; for instance, the presence of small amounts of Ca2+ creates oxygen vacancies, which manifest as an additional absorption band near 350 nm [17].
Figure 1b shows differential spectra obtained by subtracting the spectrum of the unirradiated sample from those of the irradiated crystals. This approach allows a clear observation of the absorption edge shift at a fixed optical density (approximately 2). The graph indicates that the magnitude of the shift increases from 0.17 eV at low fluences to 0.76 eV at the maximum irradiation dose. This effect is attributed to ion-induced absorption arising from defect states formed near the band edge. Xe ion irradiation leads to additional absorption and a significant redshift of the absorption edge. A pronounced dependence of the edge shift on fluence is observed: higher doses result in stronger ion-induced absorption.
3.2. Raman Spectroscopy
3.2.1. Raman Spectra
Pristine GGG exhibits sharp Raman lines in the ~100–800 cm−1 range, corresponding to first-order garnet lattice vibrations. Figure 2 shows representative Raman spectra (λexc = 532 nm) before and after Xe irradiation. After irradiation, all lines decrease in intensity, broaden, and partially overlap on an elevated background. Up to the maximum fluence of 3.3×10¹³ ions/cm2, all characteristic garnet modes remain present, although resolution decreases. No new sharp lines appear, indicating the absence of secondary crystalline phases—the garnet structure undergoes only radiation-induced disorder. This is consistent with X-ray diffraction data: even at high fluences, GGG shows only lattice deformation and reduced coherence length without secondary phase formation [24].
Overall, with increasing fluence, the Raman spectra show progressive degradation of the coherent vibrational structure: at 1011 ions/cm2, changes are minimal, whereas at 10¹³–3.3×10¹³ ions/cm2, peaks broaden and merge, and their contrast against the background decreases. At the highest fluences, the vibrational spectrum approaches that of an amorphous state, with broad smoothed bands reflecting the phonon density of states of a disordered lattice [26].
Table 1 summarizes the measured positions of the main Raman peaks (band maxima) for pristine and irradiated GGG crystals, along with the corresponding full widths at half maximum (FWHM) for the same modes. Data are provided for all prominent first-order modes with Eg, T2g, and A1g symmetries within the sensitivity range of the spectrometer (~800 cm−1). The uncertainty in peak position is approximately ±1 cm−1, and for FWHM it is ±1–2 cm−1. The frequency shifts of most modes do not exceed a few cm−1, even at the maximum fluence. For instance, the Eg mode at ~260 cm−1 shifts by less than 1 cm⁻¹ (from ~259.7 cm−1 in the pristine sample to ~259.5 cm⁻¹ at 3.3×10¹³ ions/cm²), while the T₂g line at 274 cm⁻¹ slightly increases in frequency (from ~272.6 cm−1 to ~274.0 cm−1, within the experimental uncertainty). The high-frequency mode at ~740 cm−1 (T2g) remains practically unchanged (<1 cm−1). These observations indicate that no large-scale weakening of lattice bonds occurs—even with defect accumulation, the frequencies of internal vibrations remain close to their initial values.
As seen from Table 1, most mode frequencies remain nearly unchanged up to the maximum irradiation dose, indicating the preservation of local force constants for vibrations within structural units (particularly for the strong Ga–O bonds). Notably, the high-frequency T2g mode (~740 cm−1), corresponding to valence vibrations of the stiffest Ga–O bonds, exhibited the least sensitivity to irradiation—its frequency remains within the experimental uncertainty, and its linewidth increased only slightly (discussed in detail below). In contrast, low-energy modes (<200 cm⁻¹), mainly associated with translations of the heavy Gd3+ sublattice and collective bending vibrations of the framework, are considerably “softer”: their frequencies decrease under irradiation, and the modes degrade and damp more rapidly. For example, the T2g mode at ~169 cm−1, as previously noted, disappears at the maximum fluence. Thus, the most radiation-resistant modes are the high-frequency internal vibrations of structural polyhedra (particularly GaO₄ tetrahedra), whereas the least resistant are low-frequency modes related to vibrations of the entire crystal framework and heavy nodes (Gd). This conclusion aligns with general knowledge on garnet lattice dynamics and previous experiments: neutron irradiation of GGG resulted in the disappearance of fine high-frequency second-order structures (1350–1550 cm−1) and the appearance of diffuse bands in the 100–850 cm−1 range, indicating dominance of defect-induced vibrations and long-range mode disorder [30,31,32,33,34].
The primary effect of irradiation on GGG Raman spectra is pronounced broadening of all first-order scattering lines. As shown in Figure 2bc, at fluences of 1012–1013 ions/cm2, initially narrow peaks become significantly broader and lower in intensity, and at the maximum dose, some peaks almost merge. The presented Figure 2b illustrate two distinct behaviors of Raman line broadening in GGG single crystals irradiated with 231 MeV Xe ions. In the first case, the linewidths increase monotonically Figure 2b with rising ion fluence, reflecting a progressive growth of radiation-induced disorder. The most pronounced broadening occurs for the high-frequency A1g (354 cm), T2g (411 cm−1), and T₂g (740 cm−1) modes, which correspond to internal vibrations of GaO4 and GaO4 polyhedra. Because these bonds are the strongest within the garnet lattice, their broadening is primarily caused by enhanced inelastic phonon–defect scattering rather than bond rupture. The systematic FWHM increase in these modes thus indicates the accumulation of microdefects while preserving the overall crystalline order, representing radiation-induced lattice disorder without complete amorphization.
3.2.2. FWHM of Raman Spectra
In contrast, other modes display non-monotonic variations in linewidth with fluence (Figure 2c). For low-energy vibrations in the 93–179 cm−1 range, associated with Gd3+ translations and framework deformations, an initial broadening is followed by partial narrowing or even disappearance of the peaks at fluences above 1013 ions/cm2. This behavior arises from a competition between amorphization and local recrystallization: at low doses, lattice distortions dominate, increasing FWHM, while at high doses, overlapping ion tracks and vibrational averaging within a defect-rich matrix may lead to an apparent narrowing of the bands. Several intermediate-frequency modes (238, 260, 274, 550, 590 cm−1) exhibit complex trends due to overlapping neighboring lines and decreasing spectral resolution, further emphasizing the intricate interplay between defect formation, phonon scattering, and partial structural recovery in irradiated GGG.
Table 1 demonstrates the increase in FWHM for several key modes. On average, linewidths increase by 20–50% from the pristine crystal to fluences of ~1013 ions/cm2. For certain modes, broadening is more pronounced: for example, the T₂g mode at ~411 cm−1 initially had FWHM ~8.3 cm−1, but broadened to ~17–18 cm−1 at 1012–1013 ions/cm² and almost vanished at 3.3×10¹³ ions/cm2. Similarly, the low-frequency mode at ~169 cm−1 (initially ~13.7 cm−1) becomes undetectable at the highest fluence. These observations reflect reduced phonon lifetimes due to inelastic scattering on numerous radiation defects and local lattice distortions. As defect concentration increases, the probability of phonon scattering rises, leading to rapid damping of coherent vibrations (increased gamma width). At high fluences, phonons lose quasi-particle definition, and the spectrum approaches that of an amorphous material [24,32].
Several characteristic trends are apparent from Table 1. First, the linewidth broadening is not strictly monotonic with fluence for each mode: for instance, the FWHM of the 238 cm−1 (T₂g) mode slightly decreases at 1013 ions/cm2 (from ~9.8 to 8.5 cm−1) and further decreases to ~7.2 cm−1 at 3.3×10¹³ ions/cm². This may be explained by overlapping effects: at moderate damage levels, closely spaced lines can merge, forming an apparently narrow “peak” representing a broad band with two maxima. For the 238 cm−1 mode, overlap with a neighboring mode at 241 cm−1 [15] or second-order scattering contributions may occur. A similar effect is observed for the pair of modes ~260 cm−1 (Eg) and ~274 cm−1 (T₂g), which merge into a single broadened band (~265–270 cm−1) at high fluences, complicating individual analysis.
Second, the absolute linewidth increase (FWHM in cm−1) is more pronounced for low- and mid-frequency lines. For example, the FWHM of the Eg mode (~110 cm−1) increased by ~6 cm−1 (from ~11 to ~17 cm−1, ~+55%), whereas the A₁g mode at 354 cm−1 increased only by ~1–2 cm−1 (~+10%). The high-frequency T₂g mode at ~740 cm−1 broadened by only ~1–2 cm−1 (~+10%). Thus, relative broadening is largest for narrow modes with small initial linewidths (i.e., low-energy and well-resolved modes). Overall, FWHM increases of 10–20% at 1013 ions/cm2 and ~50–100% at 3.3×10¹³ ions/cm2 correlate with increased lattice disorder and a higher fraction of amorphized material. Similar effects were reported for neutron-irradiated GGG, with notable linewidth broadening at ϕ ≈ 1018 n/cm2 [24]. At even higher damage levels, complete disappearance of individual vibrational modes and transformation into a two-peak continuum can be expected, as observed in Y3Fe5O12 at fluences ≥1014 ions/cm2 [32].
3.2.3. Model of Radiation-Induced Structural Degradation
To compare the “dose → structural response” metric for each mode across series and to remove the influence of laser power, focus, thickness, collection coefficient, and other instrumental factors, a special Raman spectral processing technique was developed.
For each spectrum S(ν,Φ), the following were performed: (i) baseline correction (linear background in band-free regions), (ii) frequency referencing using a fixed high-frequency reference, and (iii) band approximation by a sum of narrow functions (Lorenz–Vogt) with equal instrumental contributions. From these approximations, the positions νpk(Φ), half-widths Γpk(Φ), and integrated intensities Ipk were obtained. To exclude instrumental and geometric factors (power/focus/thickness), we introduce internal normalization based on the strong support band of the lattice at about 355 cm− (breathing of the GaO4/GaO6 framework):
where is the integral intensity of the reference band (~355 cm−1). The first metric is shown in Figure 3a–b (for low- and high-frequency modes separately). To compare the dose series, a normalized stability metric was introduced for each mode is in Figure 3c (curve “Per-peak normalized response vs. fluence (includes pristine)”). To assess the local kinetics of defect accumulation, the piecewise logarithmic slope between adjacent doses was calculated:
The kinetics of damage accumulation between adjacent doses was estimated using a piecewise logarithmic slope:
The line width as a marker of defective scattering was analyzed according to the dependence:
Swift Xe ions generate amorphous cylinders (latent tracks) of radius R∼5 −10 nm via the inelastic thermal spike. The disordered volume fraction is Assuming the crystalline contribution to a mode scale as :
and the corresponding log–log rate
Equations (5)–(6) reproduce the three regimes visible in Figure 3cd: (i) small slopes at low Φ (isolated tracks), (ii) a sharp increase in near track overlap, (iii) saturation at the highest dose.
The normalized curves in Figure 3c exhibit a near-universal “S-shaped” response: incubation at low doses, a sharp collapse within the track-overlap window, and saturation at the maximum dose. Quantitatively, the softest low-frequency mode at 97.4 cm⁻¹ loses coherent amplitude almost immediately: already at 1011 ions/cm2, falls to 0.05 and remains near zero with further dose increase. The next most sensitive mode, 111.1 cm−1, shows a stepwise decay approx 0.6 → 0.45 → 0.25 across 1011 →1012 →1013 ions/cm2, corresponding to an aggregate loss of 60-75% relative to pristine. For mid-frequency modes at 176.4, 238.6, 259.5, and 274.0 cm−1 the degradation is moderate: within 1012-1013 ions/cm2, remains in the 0.7-1.0 corridor, with a small “shelf” or slight recovery for 238.6/274.0 cm−1, indicating competition between track accumulation and local rearrangement of GaOx polyhedra. The stiff high-frequency Ga–O stretching modes (549.2, 590.3, 740.4 cm−1) are the most resilient: at 1011-1012 ions/cm2, , and by 1013 ions/cm2 they decline only to 0.8-1.0; the 740.4 cm−1 mode remains close to unity across the entire dose range, quantitatively establishing its radiation hardness relative to the reference band.
The kinetics of this behavior is quantified in Figure 3d via the piecewise logarithmic slope. In the low-dose regime, slopes for all modes are near zero, consistent with isolated tracks and dominant elastic relaxation. Within the overlap window 1012-1013 ions/cm2, low- and mid-frequency lines attain their most negative values: for 97.4 cm−1 the slope reaches approximately - 0.6-0.8), for 111.1 cm−1 - 0.3-0.5), and for 238.6/259.5 cm−1 about -0.2-0.3. This is the signature of amorphous-fraction percolation: the rate of coherent-amplitude loss is maximal precisely where track overlap dominates and the probability of traversing regions with disrupted long-range order rises sharply. At the highest dose of 3.3x10¹³ ions/cm2, the absolute slope decreases; for the high-frequency modes 549.2–740.4 cm−1 the slopes become near-zero or even slightly positive (+0.1). This does not imply structural recovery; it reflects dynamic saturation—once a large fraction of the volume is disordered, the relative degradation rates of the reference and target bands equalize, and the normalized metric stabilizes. The preservation of quasi-crystalline “islands” in stiff Ga–O environments makes these modes relatively more inertial, thereby yielding near-zero or weakly positive slopes.
The quantitative intensity trends are consistent with the evolution of FWHM. According to the provided table, the 97.4 cm−1 band exhibits a strong profile restructuring: decreases from 58.9 to 4.33 cm−1 as the fluence increases from 0 to 3.3x10¹³ ions/cm2; such “narrowing” against an almost vanishing is a spectral artifact of strong disorder, caused by band coalescence and the wash-out of tails into the background. For 111.1 cm−1, the FWHM grows from 20.4 to 22 cm−1 at intermediate doses and then decreases to 4.48 cm−1 at the highest dose, again indicating relabeling of components when background scattering dominates. In the mid-frequency region, a characteristic non-monotonicity appears: for 259.5 cm⁻¹, increases from 18.08 to 22.94 cm−1 by 1012 ions/cm2 and then decreases to 16.99 cm−1 at 3.3x10¹³ ions/cm2, coinciding with the fluence at which is maximal and pinpointing the peak of inhomogeneous strain specifically in the overlap window. For 524.9 cm⁻¹, the width grows modestly from 6.22 to 8.09 cm⁻¹ by 1012 ions/cm2 and then stabilizes in the 7.1–7.7 cm⁻¹ corridor; 549.2 cm⁻¹ shows a stronger non-monotonicity (from 5.27 to 10.50 cm−1 at 1012 ions/cm2 with a subsequent decrease to 4.42 cm−1), whereas 590.3 and 740.4 cm⁻¹ remain narrow throughout (1.27–2.31 and 1.65–1.90 cm⁻¹, respectively), confirming their structural robustness. These quantitative facts align with the overall picture: the largest values in panel (d) occur precisely where FWHM records the greatest inhomogeneous strain; as the system enters saturation, both and stabilize.
3.3. Microhardness and Radiation-Induced Softening
Radiation-induced defects influence not only the vibrational spectra but also the macroscopic properties of GGG, particularly its mechanical hardness. Nanoindentation, as a structure-sensitive method, was employed to investigate the depth distribution of the amorphized zone in GGG single crystals irradiated with 231 MeV Xe ions at various fluences. The microhardness (nanohardness) measurements of irradiated crystals reveal pronounced softening under Xe ion irradiation. The relative softening effect was quantified as (H0−H)/H0, where H0 - is the hardness of the pristine crystal.
Measurements along cleaved cross-sections in the ion beam direction indicate that samples irradiated at 1011 Xe ions/cm² exhibit hardness values comparable to pristine GGG. Significant hardness reduction occurs at fluences of 10¹², 10¹³, and 3.3×10¹³ ions/cm2 (Figure 4, Figure 5 and Figure 6). Pristine GGG has a hardness of ~11 GPa. At saturation, softening for 1012 ions/cm2 irradiation exceeds 20%, while for 1013 and 3.3×10¹³ ions/cm2 fluences, it reaches up to 59% (Figures 5), suggesting an upper limit of softening corresponding to full amorphization of GGG
The hardness profile along the surface provides insight into the depth distribution of the amorphized layer. The zone of maximum softening extends to ~8.9 µm for F = 1013 ions/cm2 and ~11.3 µm for F = 3.3×10¹³ ions/cm2. The corresponding threshold energy loss for maximum softening is 10.9 and 5.2 keV/nm, respectively (Figure 5).
It should be noted that the calculated electronic stopping thresholds (dE/dx) for GGG are ~6–7 keV/nm. Xe ions at 231 MeV possess specific energy losses of 20–30 keV/nm near the surface, far exceeding the track formation threshold. Consequently, each ion creates a cylindrical amorphous track along its trajectory. At fluences of ~10¹³ ions/cm², these tracks begin to overlap, forming a continuous damaged network, which accounts for the sharp decrease in hardness. Depth profiles show that the maximum softening occurs near the surface and extends to ~8–12 µm (for fluences 10¹³–3.3×10¹³ ions/cm²), corresponding to the Xe ion range in GGG (~10–15 µm, estimated via SRIM). It should be noted that this pattern of track development and evolution is typical for many dielectrics [50,51,52,53,54,55,56,57,58,59,60,61,62]. Moreover, the application of Raman spectroscopy and the investigation of defect-induced Raman modes have, to date, been addressed to a much lesser extent [63,64,65,66,67,68,69,70,71,72].
The observed hardness reduction is consistent with previous studies. For instance, irradiation of GGG with 150 MeV Kr ions at fluences of 1013–1014 ions/cm2 also resulted in significant microhardness decrease (~65% of the pristine value) [27], attributed to ion-induced amorphization and associated reduction in material density and elastic modulus. In the present Xe experiments, the softening is even more pronounced (hardness drops to ~40%), as expected due to the higher Xe ion energy and greater track density. Thus, the radiation resistance of GGG in terms of mechanical integrity is limited to fluences of ~10¹² ions/cm²; higher doses induce structural degradation up to partial amorphization, accompanied by substantial softening. The observed microstructure on the fracture surfaces of irradiated samples is characteristic of plastic deformation in amorphous or fine-grained materials and indicates the presence of an amorphous phase. Nanoindentation measurements reveal ion-induced softening, which becomes significant at fluences above 10¹¹ Xe ions/cm² and reaches ~59% at fluences of 10¹³ and 3.3×10¹³ Xe ions/cm2, approaching saturation. At this stage, near-complete amorphization of the irradiated layer is assumed. The hardness depth profiles provide information on the distribution of the amorphized zone, and threshold values of energy loss for maximum softening and full amorphization have been determined.
The fluence dependence of micro/nanohardness (H/H0) mirrors the Raman metrics from Figure 2c–d: the normalized per-mode response and its log–log slope act as structurally sensitive damage markers that rise and fall in lockstep with mechanical degradation. In the low-dose regime (≤ 1011–1012 ions/cm2), remains near unity and the slopes are ~0, consistent with isolated tracks and rapid elastic relaxation; (H/H0) is essentially unchanged. Entering the overlap window (1012–1013 ions/cm2), collapses mode-selectively and the slopes reach their most negative values precisely where (H/H0) develops its steepest decline—both signatures of percolating amorphous tracks and a rapid rise of the disordered volume fraction. At the highest fluence (3.3×10¹³ ions/cm2), the slopes relax toward zero and (H/H0) approaches a plateau, indicating damage saturation and possible dynamic annealing.
Quantitatively, the softest lattice modes are the best early predictors of hardness loss: the 97.4 cm−1 line loses coherent amplitude almost immediately () by 1011 ions/cm2), while 111.1 cm−1 steps from ≈0.6→0.45→0.25 across 1011→1012→1013 ions/cm2. Mid-frequency modes (176.4, 238.6, 259.5, 274.0 cm⁻¹) degrade more moderately (typical overlap-window slopes ≈ –0.2 to –0.3), matching the inflection of (H/H0). In contrast, rigid Ga–O stretches (549.2, 590.3, 740.4 cm−1) retain () up to ~1013 ions/cm2 and show near-zero or slightly positive slopes at the end of the dose series; (H/H0) is simultaneously on its saturation plateau. FWHM trends corroborate this coupling: linewidths peak (or show strongest non-monotonicity) in the same overlap window where the Raman slopes are most negative and the hardness drop is fastest, evidencing maximal inhomogeneous strain and phonon–defect scattering.
Practically, these results justify using and its slope as non-destructive predictors of mechanical degradation. Low-frequency modes flag the onset of damage that triggers the hardness drop, whereas high-frequency Ga–O stretches track the residual structural integrity that governs the hardness plateau at high fluence.
4. Conclusions
After irradiation of Gd3Ga5O12 single crystals with 231 MeV Xe ions at fluences ranging from 1×10¹¹ to 3.3×10¹³ ions/cm2, the Raman spectra exhibited distinct quantitative changes reflecting the transition from an ordered to a partially amorphous lattice. At low fluences (≤10¹¹ ions/cm2), the spectra remained sharp, with typical linewidths (FWHM) of 8–12 cm⁻¹. At 10¹²–10¹³ ions/cm2, FWHM values increased by 20–50%, reaching 16–18 cm−1 for the A1g (354 cm−1) and T2g (411 cm−1) modes, indicating enhanced microdefect density and phonon–defect scattering. At the highest fluence of 3.3×10¹³ ions/cm2, the low-frequency T₂g (169 cm−1) mode disappeared entirely, whereas the high-frequency T2g (~740 cm−1) mode remained stable, with frequency shifts below 1 cm−1, confirming its radiation resilience. These results show that irradiation first disrupts the heavy Gd3+ sublattice and collective framework modes, while the internal Ga–O bonds remain structurally intact.
To quantitatively interpret these effects, a new Raman analysis methodology was developed based on internal normalization and logarithmic degradation analysis. Each spectrum S(ν, Φ) was normalized to the intensity of the stable A1g (355 cm−1) reference band, and per-mode normalized amplitudes ηₚₖ = Iₚₖ/I₃₅₅ and their logarithmic slopes dlnη/dlnΦ were calculated. This approach eliminates variations from laser power, focusing, and sample thickness, allowing direct comparison of the sensitivity of individual modes. The results show that soft modes (<200 cm−1) lose coherence rapidly (ηₚₖ dropping from 1 to 0.05 by 1011 ions/cm2), while Ga–O stretching modes (549–740 cm−1) remain nearly constant (ηₚₖ ≈ 0.8–1.0 up to 10¹³ ions/cm2). The local slopes d ln η/d ln Φ reach maximum negative values (–0.6 for 97 cm−1, –0.3 for 238–260 cm−1) in the track-overlap region (10¹²–10¹³ ions/cm2), coinciding with a pronounced hardness drop (H/H0 ≈ 0.4).
Thus, the developed methodology provides the first quantitative link between micro-mechanical softening and Raman-mode degradation, defining a critical fluence for track percolation (~1–3×10¹³ ions/cm2) and a hardness reduction limit of about 60%. This framework enables non-destructive prediction of radiation-induced damage in oxide scintillator and optoelectronic materials using the parameters ηₚₖ and d ln η/d ln Φ.
Author Contributions
Conceptualization, T.K.K., A.I.P., and A.A.; methodology, T.K.K., G.M.A., A.M.Z., S.U., and A.I.P.; software, A.B. and Y.S.; validation, G.M.A., A.M.Z., A.A., G.E.S., Y.S., and A.I.P.; formal analysis, T.K.K., A.M.Z., G.E.S., A.S., and Y.S.; investigation, G.E.S., M.K., and A.I.P.; resources, A.A., M.K., and A.S.; data curation, T.K.K., G.M.A., K.B., A.M.Z., A.B., G.E.S., and A.S.; writing—original draft preparation, T.K.K. and K.B.; writing—review and editing, T.K.K., K.B., G.M.A., and A.I.P.; visualization, A.A., A.B., and A.S.; supervision, G.M.A. and M.K.; project administration, M.K. and A.I.P.; funding acquisition, G.M.A. and M.K. All authors have read and agreed to the published version of the manuscript.
Funding
This research was funded by the Science Committee of the Ministry of Science and Higher Education of the Republic of Kazakhstan (Grant No. AP19680626). In addition, Marina Konuhova and Anatoli I. Popov were supported by Latvian research project lzp-2023/1–0453 “Prediction of long-term stability of functional materials under extreme radiation conditions”.
Data Availability Statement
The raw data supporting the conclusions of this article will be made available by the authors upon reasonable request.
Conflicts of Interest
The authors declare no conflict of interest.
References
- Mkrtchyan, M.; et al. Absorption and Emitting Properties of GGG:Ce Single Crystals in the Range of 4f↔5d Transitions of Ce³⁺ Ions. Armen. J. Phys. 2019, 12(3). [Google Scholar]
- Syvorotka, I.I.; Sugak, D.Y.; Wierzbicka, A.; Wittlin, A.; Przybylińska, H.; Barzowska, J.; Barcz, A.J.; Berkowski, M.; Domagała, J.Z.; Mahlik, S.; et al. Optical Properties of Pure and Ce³⁺-Doped Gadolinium Gallium Garnet Crystals and Epitaxial Layers. J. Lumin. 2015, 164, 31–37. [Google Scholar] [CrossRef]
- Mikhailov, M.M.; Neshchimenko, V.V.; Shavlyuk, V.V. The Effects of Binding Type on Luminescence LED Phosphor Based on GGG/Ce³⁺. Opt. Mater. 2014, 38, 33–36. [Google Scholar] [CrossRef]
- Wang, Y.; You, Z.; Li, J.; Zhu, Z.; Ma, E.; Tu, C. Spectroscopic Investigations of Highly Doped Er³⁺:GGG and Er³⁺/Pr³⁺:GGG Crystals. J. Phys. D: Appl. Phys. 2009, 42, 215406. [Google Scholar] [CrossRef]
- Wang, Y.; You, Z.; Li, J.; Zhu, Z.; Tu, C. Optical Properties of Dy³⁺ Ion in GGG Laser Crystal. J. Phys. D: Appl. Phys. 2010, 43, 075402. [Google Scholar] [CrossRef]
- Liu, W.; Zhang, Q.; Sun, D.; Luo, J.; Gu, C.; Jiang, H.; Yin, S. Crystal Growth and Spectral Properties of Sm:GGG Crystal. J. Cryst. Growth 2011, 331, 83–86. [Google Scholar] [CrossRef]
- Jia, Z.; Tao, X.; Dong, C.; Cheng, X.; Zhang, W.; Xu, F.; Jiang, M. Study on Crystal Growth of Large Size Nd³⁺:Gd₃Ga₅O₁₂ (Nd³⁺:GGG) by Czochralski Method. J. Cryst. Growth 2006, 292, 386–390. [Google Scholar] [CrossRef]
- Asadian, M.; Hajiesmaeilbaigi, F.; Mirzaei, N.; Saeedi, H.; Khodaei, Y.; Enayati, S. Composition and Dissociation Processes Analysis in Crystal Growth of Nd:GGG by the Czochralski Method. J. Cryst. Growth 2010, 312, 1645–1650. [Google Scholar] [CrossRef]
- Tsiumra, V.; Krasnikov, A.; Zazubovich, S.; Zhydachevskyy, Y.; Vasylechko, L.; Baran, M.; Wachnicki, Ł.; Lipińska, L.; Nikl, M.; Suchocki, A. Crystal Structure and Luminescence Studies of Microcrystalline GGG:Bi³⁺ and GGG:Bi³⁺,Eu³⁺ as a UV-to-VIS Converting Phosphor for White LEDs. J. Lumin. 2019, 213, 278–289. [Google Scholar] [CrossRef]
- Zhou, W.; Zhang, Q.; Xiao, J.; Luo, J.; Liu, W.; Jiang, H.; Yin, S. Sm³⁺-Doped (Ca, Mg, Zr)GGG Crystal: A Potential Reddish-Orange Laser Crystal. J. Alloys Compd. 2010, 491, 618–622. [Google Scholar] [CrossRef]
- Gluchowski, P.; Chaika, M. Crystal-Field Strength Variations and Energy Transfer in Cr³⁺-Doped GGG Transparent Nanoceramics. J. Phys. Chem. C 2024, 128(23), 9641–9651. [Google Scholar] [CrossRef]
- Zhao, G.; Li, T.; Xu, J. Growth of Epitaxial Substrate Gd₃Ga₅O₁₂ (GGG) Single Crystal through Pure GGG Phase Polycrystalline Material. J. Cryst. Growth 2002, 237, 720–724. [Google Scholar] [CrossRef]
- Li, C.; Zhang, F.; Meng, B.; Rao, X.; Zhou, Y. Research of Material Removal and Deformation Mechanism for Single Crystal GGG (Gd₃Ga₅O₁₂) Based on Varied-Depth Nanoscratch Testing. Mater. Des. 2017, 125, 180–188. [Google Scholar] [CrossRef]
- Li, C.; Wu, Y.; Li, X.; Ma, L.; Zhang, F.; Huang, H. Deformation Characteristics and Surface Generation Modelling of Crack-Free Grinding of GGG Single Crystals. J. Mater. Process. Technol. 2020, 279, 116577. [Google Scholar] [CrossRef]
- Li, C.; Zhang, F.; Wang, X.; Rao, X. Investigation on Surface/Subsurface Deformation Mechanism and Mechanical Properties of GGG Single Crystal Induced by Nanoindentation. Appl. Opt. 2018, 57, 3661–3668. [Google Scholar] [CrossRef]
- Li, H.; Sun, D.; Zhang, H.; Luo, J.; Quan, C.; Qiao, Y.; Dong, K.; Chen, Y.; Wang, Z.; Cheng, M.; Chen, G.; Hang, Y. Growth, Rietveld Refinement, Raman Spectrum and Dislocation of Ca/Mg/Zr-Substituted GGG: A Potential Substrate and Laser Host Material. J. Mater. Sci. Mater. Electron. 2024, 35, 12777. [Google Scholar] [CrossRef]
- Syvorotka, I.I.; Sugak, D.; Yakhnevych, U.; Buryy, O.; Włodarczyk, D.; Pieniążek, A.; …; Suchocki, A. Investigation of the Interface of Y₃Fe₅O₁₂/Gd₃Ga₅O₁₂ Structure Obtained by the Liquid Phase Epitaxy. Cryst. Res. Technol. 2022, 57(5), 2100180. [Google Scholar] [CrossRef]
- Leontsev, S.; Shah, P.J.; Kum, H.S.; McChesney, J.L.; Rodolakis, F.M.; van Veenendaal, M.; Velez, M.; Rao, R.; Haskel, D.; Kim, J.; Reed, A.N.; Page, M.R. Functional Properties of Yttrium Iron Garnet Thin Films on Graphene-Coated Gd₃Ga₅O₁₂ for Remote Epitaxial Transfer. J. Magn. Magn. Mater. 2022, 556, 169440. [Google Scholar] [CrossRef]
- Tikhonov, V.V.; Litvinenko, A.N.; Sadovnikov, A.V.; Nikitov, S.A. Brillouin Spectroscopy of Nonlinear Magnetoacoustic Resonances in a Layered YIG/GGG Structure. Bull. Russ. Acad. Sci. Phys. 2016, 80(10), 1242–1247. [Google Scholar] [CrossRef]
- Papagelis, K.; et al. Pressure-Induced Structural Distortions in GGG: Raman Study. J. Appl. Phys. 2010, 107, 113504. [Google Scholar] [CrossRef]
- Monteseguro, V.; Rodríguez-Hernández, P.; Ortiz, H.M.; Venkatramu, V.; Manjón, F.J.; Jayasankar, C.K.; Lavín, V.; Muñoz, A. Structural, Elastic and Vibrational Properties of Nanocrystalline Lu₃Ga₅O₁₂ under High Pressure. Phys. Chem. Chem. Phys. 2015, 17, 9454–9464. [Google Scholar] [CrossRef]
- Sugak, D.; Syvorotka, I.I.; Yakhnevych, U.; Buryy, O.; Vakiv, M.; Ubizskii, S.; Włodarczyk, D.; Зhydachevskyy, Ya.; Pieniążek, A.; Jakiela, R.; Suchocki, A. Investigation of Co Ions Diffusion in Gd₃Ga₅O₁₂ Single Crystals. Acta Phys. Pol. A 2018, 133(4), 959–964. [Google Scholar] [CrossRef]
- Hamilton, A.S.; Lampronti, G.I.; Rowley, S.E.; Dutton, S.E. Enhancement of the Magnetocaloric Effect Driven by Changes in the Crystal Structure of Al-Doped GGG, Gd₃Ga₅−xAlxO₁₂ (0 ≤ x ≤ 5). J. Phys.: Condens. Matter 2014, 26, 116001. [Google Scholar]
- Mironova-Ulmane, N.; Sildos, I.; Vasil’chenko, E.; Chikvaidze, G.; Skvortsova, V.; Kareiva, A.; Muñoz-Santiuste, J.E.; Pareja, R.; Elsts, E.; Popov, A.I. Optical Absorption and Raman Studies of Neutron-Irradiated Gd₃Ga₅O₁₂ Single Crystals. Nucl. Instrum. Methods Phys. Res. B 2018, 435, 306–312. [Google Scholar] [CrossRef]
- Potera, P.; Matkovskii, A.; Sugak, D.; Grigorjeva, L.; Millers, D.; Pankratov, V. Transient Color Centers in GGG Crystals. Radiat. Eff. Defects Solids 2002, 157(6–12), 709–713. [Google Scholar] [CrossRef]
- Potera, P.; Ubizskii, S.; Sugak, D.; Schwartz, K. Induced Absorption in Gadolinium Gallium Garnet Irradiated by High-Energy ²³⁵U Ions. Acta Phys. Pol. A 2010, 117, 181–183. [Google Scholar] [CrossRef]
- Karipbayev, Z.T.; Kumarbekov, K.; Manika, I.; Dauletbekova, A.; Kozлoвskiy, A.L.; Sugak, D.; Ubizskii, S.B.; Akilbekov, A.; Suchikova, Y.; Popov, A.I. Optical, Structural, and Mechanical Properties of Gd₃Ga₅O₁₂ Single Crystals Irradiated with 84Kr⁺ Ions. Phys. Status Solidi B 2022, 259(8), 2100415. [Google Scholar] [CrossRef]
- Meftah, A.; Costantini, J.M.; Khalfaoui, N.; Boudjadar, S.; Stoquert, J.P.; Studer, F.; Toulemonde, M. Experimental Determination of Track Cross-Section in Gd₃Ga₅O₁₂ and Comparison to the Inelastic Thermal Spike Model Applied to Several Materials. Nucl. Instrum. Methods Phys. Res. B 2005, 237(3–4), 563–574. [Google Scholar] [CrossRef]
- Toulemonde, M.; Meftah, A.; Costantini, J.M.; Schwartz, K.; Trautmann, C. Out-of-Plane Swelling of Gadolinium Gallium Garnet Induced by Swift Heavy Ions. Nucl. Instrum. Methods Phys. Res. B 1998, 146(1–4), 426–430. [Google Scholar] [CrossRef]
- Meftah, A.; Assmann, W.; Khalfaoui, N.; Stoquert, J.P.; Studer, F.; Toulemonde, M.; Trautmann, C.; Voss, K.-O. Electronic Sputtering of Gd₃Ga₅O₁₂ and Y₃Fe₅O₁₂ Garnets: Yield, Stoichiometry and Comparison to Track Formation. Nucl. Instrum. Methods Phys. Res. B 2011, 269(9), 955–958. [Google Scholar] [CrossRef]
- Costantini, J.-M.; et al. Swift Heavy Ion-Beam Induced Amorphization and Recrystallization of Yttrium Iron Garnet. J. Phys.: Condens. Matter 2015, 27, 496001. [Google Scholar] [CrossRef]
- Costantini, J.-M.; Miro, S.; Lelong, G.; Guillaumet, M.; Toulemonde, M. Damage Induced in Garnets by Heavy-Ion Irradiations: A Study by Optical Spectroscopies. Philos. Mag. 2018, 98(4), 312–328. [Google Scholar] [CrossRef]
- Thomé, L. Swift Heavy Ion Irradiation of Crystalline Insulators and Metals. In Ion Beam Modification of Solids; Springer Series in Surface Sciences, Vol. 61; Springer: Cham, Switzerland, 2016; pp. 321–363. [Google Scholar] [CrossRef]
- Izerrouken, M.; Bucher, R.; Meftah, A.; Maaza, M. XRD and AFM Study of Radiation Damage Induced by Swift Heavy Ions in Y₃Al₅O₁₂ Single Crystals. Radiat. Eff. Defects Solids 2011, 166(7), 513–521. [Google Scholar] [CrossRef]
- Meftah, A.; Benhacine, H.; Benyagoub, A.; Grob, J.J.; Izerrouken, M.; Kadid, S.; Khalfaoui, N.; Stoquert, J.P.; Toulemonde, M.; Trautmann, C. Data Consistencies of Swift Heavy Ion Induced Damage Creation in Y₃Fe₅O₁₂. Nucl. Instrum. Methods Phys. Res. B 2016, 366, 155–160. [Google Scholar] [CrossRef]
- Matkovskii, A.; Sugak, D.; Melnyk, S.; Potera, P.; Suchocki, A.; Frukacz, Z. Colour Centers in Doped Gd₃Ga₅O₁₂ and Y₃Al₅O₁₂ Laser Crystals. J. Alloys Compd. 2000, 300–301, 395–397. [Google Scholar] [CrossRef]
- Kozlovskiy, A.L.; Konuhova, M.; Shlimas, D.I.; Borgekov, D.B.; Zdorovets, M.V.; Shakirziyanov, R.I.; Popov, A.I. Study of the Effect of Nanostructured Grains on the Radiation Resistance of Zirconium Dioxide Ceramics During Gas Swelling under High-Dose Irradiation with Helium Ions. ES Mater. Manuf. 2024, 24, 1165. [Google Scholar] [CrossRef]
- Kozlovskiy, A.L.; Konuhova, M.; Borgekov, D.B.; Popov, A.I. Study of Irradiation Temperature Effect on Radiation-Induced Polymorphic Transformation Mechanisms in ZrO₂ Ceramics. Opt. Mater. 2024, 156, 115994. [Google Scholar] [CrossRef]
- Zdorovets, M.V.; Kozlovskiy, A.A.; Moldabayeva, G.Zh.; Ivanov, I.A.; Konuhova, M. Radiation-Induced Degradation Effects of Optical Properties of MgO Ceramics Caused by Heavy Ion Irradiation. Opt. Mater. X 2025, 26, 100406. [Google Scholar] [CrossRef]
- Ryskulov, A.E.; Ivanov, I.A.; Kozlovskiy, A.L.; Konuhova, M. The Effect of Residual Mechanical Stresses and Vacancy Defects on the Diffusion Expansion of the Damaged Layer During Irradiation of BeO Ceramics. Opt. Mater. X 2024, 24, 100375. [Google Scholar] [CrossRef]
- Malikova, Z.; Karipbayev, Z.T.; Akilbekov, A.; Dauletbekova, A.; Popov, A.I.; Kuzovkov, V.N.; Abdrakhmetova, A.; Russakova, A.; Baizhumanov, M. Thermal Stability of Color Centers in Lithium Fluoride Crystals Irradiated with Electrons and N, O, Kr, U Ions. Materials 2025, 18, 4441. [Google Scholar] [CrossRef]
- Manika, I.; Krasta, T.; Maniks, J.; Bikse, L.; Susinska, J.; Leimane, M.; Trausa, A.; Grants, R.; Popov, A.I. Effect of Ion Irradiation on Structure Modification and Radiolysis in LiF Crystals Irradiated by 410 MeV ³⁶S Ions. Opt. Mater. 2023, 138, 113686. [Google Scholar] [CrossRef]
- Popov, A.I.; Elsts, E.; Kotomin, E.A.; Moskina, A.; Karipbayev, Z.T.; Makarenko, I.; Pazylbek, S.; Kuzovkov, V.K. Thermal Annealing of Radiation Defects in MgF₂ Single Crystals Induced by Neutrons at Low Temperatures. Nucl. Instrum. Methods Phys. Res. Sect. B 2020, 480, 16–21. [Google Scholar] [CrossRef]
- Bhandari, K.; Grover, V.; Kalita, P.; Sudarshan, K.; Modak, B.; Sharma, S.K.; Kulriya, P.K. Radiation Response of Y₃Al₅O₁₂ and Nd³⁺–Y₃Al₅O₁₂ to Swift Heavy Ions: Insight into Structural Damage and Defect Dynamics. Phys. Chem. Chem. Phys. 2023, 25, 20495–20509. [Google Scholar] [CrossRef]
- Costantini, J.M.; Desvignes, J.M.; Toulemonde, M. Amorphization and Recrystallization of Yttrium Iron Garnet under Swift Heavy Ion Beams. J. Appl. Phys. 2000, 87, 4164–4174. [Google Scholar] [CrossRef]
- Costantini, J.M.; Desvignes, J.M.; Pérez, A.; Studer, F. Local Order and Magnetic Behavior of Amorphous and Nanocrystalline Yttrium Iron Garnet Produced by Swift Heavy Ion Irradiations. J. Appl. Phys. 2000, 87, 1899–1907. [Google Scholar] [CrossRef]
- Izerrouken, M.; Khereddine, A.; Sari, A.; Meftah, A. Mechanical Properties of Swift Heavy Ion Irradiated Y₃Al₅O₁₂ Single Crystal. Nucl. Instrum. Methods Phys. Res. Sect. B 2018, 435, 137–141. [Google Scholar] [CrossRef]
- Meftah, A.; Assmann, W.; Khalfaoui, N.; Stoquert, J.P.; Studer, F.; Toulemonde, M.; Trautmann, C.; Voss, K.-O. Electronic Sputtering of Gd₃Ga₅O₁₂ and Y₃Fe₅O₁₂ Garnets: Yield, Stoichiometry and Comparison to Track Formation. Nucl. Instrum. Methods Phys. Res. Sect. B 2011, 269, 955–958. [Google Scholar] [CrossRef]
- Nazarov, A.A.; Yunin, P.A.; Alekseeva, L.S.; Nokhrin, A.V. X-ray Diffraction Study and Modeling of Damaged Layers in Y₂.₅Nd₀.₅Al₅O₁₂ Ceramics after Swift Heavy Xe Ion Irradiation. Phys. Part. Nucl. Lett. 2025, 22, 1094–1098. [Google Scholar] [CrossRef]
- Szenes, G.; Pászti, F.; Péter, Á.; Popov, A.I. Tracks Induced in TeO₂ by Heavy Ions at Low Velocities. Nucl. Instrum. Methods Phys. Res. B 2000, 166, 949–953. [Google Scholar] [CrossRef]
- Szenes, G. Uniform Behavior of Insulators Irradiated by Swift Heavy Ions. Nucl. Instrum. Methods Phys. Res. B 2015, 354, 47–50. [Google Scholar] [CrossRef]
- Karlušić, M.; Ghica, C.; Negrea, R.F.; Siketić, Z.; Jakšić, M.; Schleberger, M.; Fazinić, S. On the threshold for ion track formation in CaF2. New J. Phys. 2017, 19, 023023. [Google Scholar] [CrossRef]
- Karlušić, M.; Jakšić, M.; Lebius, H.; Ban-d’Etat, B.; Wilhelm, R.A.; Heller, R.; Schleberger, M. Swift heavy ion track formation in SrTiO3 and TiO2 under randon, channeling and near-channeling conditions. J. Phys. D Appl. Phys. 2017, 50, 205302. [Google Scholar] [CrossRef]
- Fodchuk, I.; Kotsyubynsky, A.; Velychkovych, A.; Hutsuliak, I.; Boychuk, V.; Kotsyubynsky, V.; Ropyak, L. The Effect of Ne+ Ion Implantation on the Crystal, Magnetic, and Domain Structures of Yttrium Iron Garnet Films. Crystals 2022, 12, 1485. [Google Scholar] [CrossRef]
- Giniyatova, S.G.; Kozlovskiy, A.L.; Rspayev, R.M.; Borgekov, D.B.; Zdorovets, M.V. Study of the Kinetics of Radiation Damage in CeO2 Ceramics upon Irradiation with Heavy Ions. Materials 2023, 16, 4653. [Google Scholar] [CrossRef]
- Kotomin, E.A.; Kashcheyevs, V.; Kuzovkov, V.N.; Schwartz, K.; Trautmann, C. Modeling of Primary Defect Aggregation in Tracks of Swift Heavy Ions in LiF. Phys. Rev. B 2001, 64, 144108. [Google Scholar] [CrossRef]
- Davidson, A.T.; Schwartz, K.; Comins, J.D.; Kozakiewicz, A.G.; Toulemonde, M.; Trautmann, C. Vacuum Ultraviolet Absorption and Ion Track Effects in LiF Crystals Irradiated with Swift Ions. Phys. Rev. B 2002, 66, 214102. [Google Scholar] [CrossRef]
- Aumayr, F.; Facsko, S.; El-Said, A.S.; Trautmann, C.; Schleberger, M. Single Ion Induced Surface Nanostructures: A Comparison between Slow Highly Charged and Swift Heavy Ions. J. Phys. Condens. Matter 2011, 23, 393001. [Google Scholar] [CrossRef]
- Amekura, H.; Ishikawa, N.; Okubo, N.; Chen, F.; Narumi, K.; Chiba, A.; Hirano, Y.; Yamada, K.; Yamamoto, S.; Saitoh, Y. Metallic Ca Aggregates Formed Along Ion Tracks and Optical Anisotropy in CaF2 Crystals Irradiated with Swift Heavy Ions. Quantum Beam Sci. 2024, 8, 29. [Google Scholar] [CrossRef]
- Itoh, N.; Duffy, D.M.; Khakshouri, S.; Stoneham, A.M. Making tracks: Electronic excitation roles in forming swift heavy ion tracks. J. Phys. Condens. Matter 2009, 21, 474205. [Google Scholar] [CrossRef]
- Takaki, S.; Yasuda, K.; Yamamoto, T.; Matsumura, S.; Ishikawa, N. Structure of Ion Tracks in Ceria Irradiated with High Energy Xenon Ions. Prog. Nucl. Energy 2016, 92, 306–312. [Google Scholar] [CrossRef]
- Ishikawa, N.; Fukuda, S.; Nakajima, T.; Ogawa, H.; Fujimura, Y.; Taguchi, T. Ion Tracks and Nanohillocks Created in Natural Zirconia Irradiated with Swift Heavy Ions. Materials 2024, 17, 547. [Google Scholar] [CrossRef] [PubMed]
- Hu, P.P.; Liu, J.; Zhang, S.X.; Maaz, K.; Zeng, J.; Guo, H.; Hou, M.D. Raman Investigation of Lattice Defects and Stress Induced in InP and GaN Films by Swift Heavy Ion Irradiation. Nucl. Instrum. Methods Phys. Res. B 2016, 372, 29–37. [Google Scholar] [CrossRef]
- Costantini, J.M.; Gutierrez, G.; Lelong, G.; Guillaumet, M.; Rahman, M.M.; Yasuda, K. Raman Spectroscopy Study of Damage in Swift Heavy Ion-Irradiated Ceramics. J. Raman Spectrosc. 2022, 53, 1614–1624. [Google Scholar] [CrossRef]
- Tunhuma, S.M.; Diale, M.; Nel, J.M.; Madito, M.J.; Hlatshwayo, T.T.; Auret, F.D. Defects in Swift Heavy Ion Irradiated n-4H-SiC. Nucl. Instrum. Methods Phys. Res. B 2019, 460, 119–124. [Google Scholar] [CrossRef]
- Song, Y.; Zhang, S.; Zhang, C.; Yang, Y.; Lv, K. Raman Spectra and Microstructure of Zinc Oxide Irradiated with Swift Heavy Ions. Crystals 2019, 9, 395. [Google Scholar] [CrossRef]
- Guo, H.; Sun, Y.; Zhai, P.; Zeng, J.; Zhang, S.; Hu, P.; Yao, H.; Duan, J.; Hou, M.; Liu, J. Resonant Raman Spectroscopy Study of Swift Heavy Ion Irradiated MoS₂. Nucl. Instrum. Methods Phys. Res. B 2016, 381, 1–5. [Google Scholar] [CrossRef]
- Costantini, J.M.; Miro, S.; Gutierrez, G.; Yasuda, K.; Takaki, S.; Ishikawa, N.; Toulemonde, M. Raman Spectroscopy Study of Damage Induced in Cerium Dioxide by Swift Heavy Ion Irradiations. J. Appl. Phys. 2017, 122, 203104. [Google Scholar] [CrossRef]
- Khatter, J.; Panchal, S.; Chauhan, R.P. Swift Heavy Ion Irradiation Induced Modifications in Electron Beam Deposited CdS Thin Films. J. Alloys Compd. 2022, 924, 166641. [Google Scholar] [CrossRef]
- Platonenko, A.; Gryaznov, D.; Popov, A.I.; Dovesi, R.; Kotomin, E.A. First principles calculations of the vibrational properties of single and dimer F-type centers in corundum crystals. J. Chem. Phys. 2020, 153, 134107. [Google Scholar] [CrossRef]
- Akilbekov, A.; Kenbayev, D.; Dauletbekova, A.; Polisadova, E.; Yakovlev, V.; Karipbayev, Z.; Shalaev, A.; Elsts, E.; Popov, A.I. The Effect of Fast Kr Ion Irradiation on the Optical Absorption, Luminescence, and Raman Spectra of BaFBr Crystals. Crystals 2023, 13, 1260. [Google Scholar] [CrossRef]
- Khomich, A.A.; Khmelnitsky, R.A.; Khomich, A.V. Probing the nanostructure of neutron-irradiated diamond using Raman spectroscopy. Nanomaterials 2020, 10, 1166. [Google Scholar] [CrossRef]
Figure 1.
Figure 1. Absorption spectra of GGG single crystals: Pristine and Xe ion-irradiated with E=231 MeV by various fluence (a) and difference spectra (b).
Figure 1.
Figure 1. Absorption spectra of GGG single crystals: Pristine and Xe ion-irradiated with E=231 MeV by various fluence (a) and difference spectra (b).
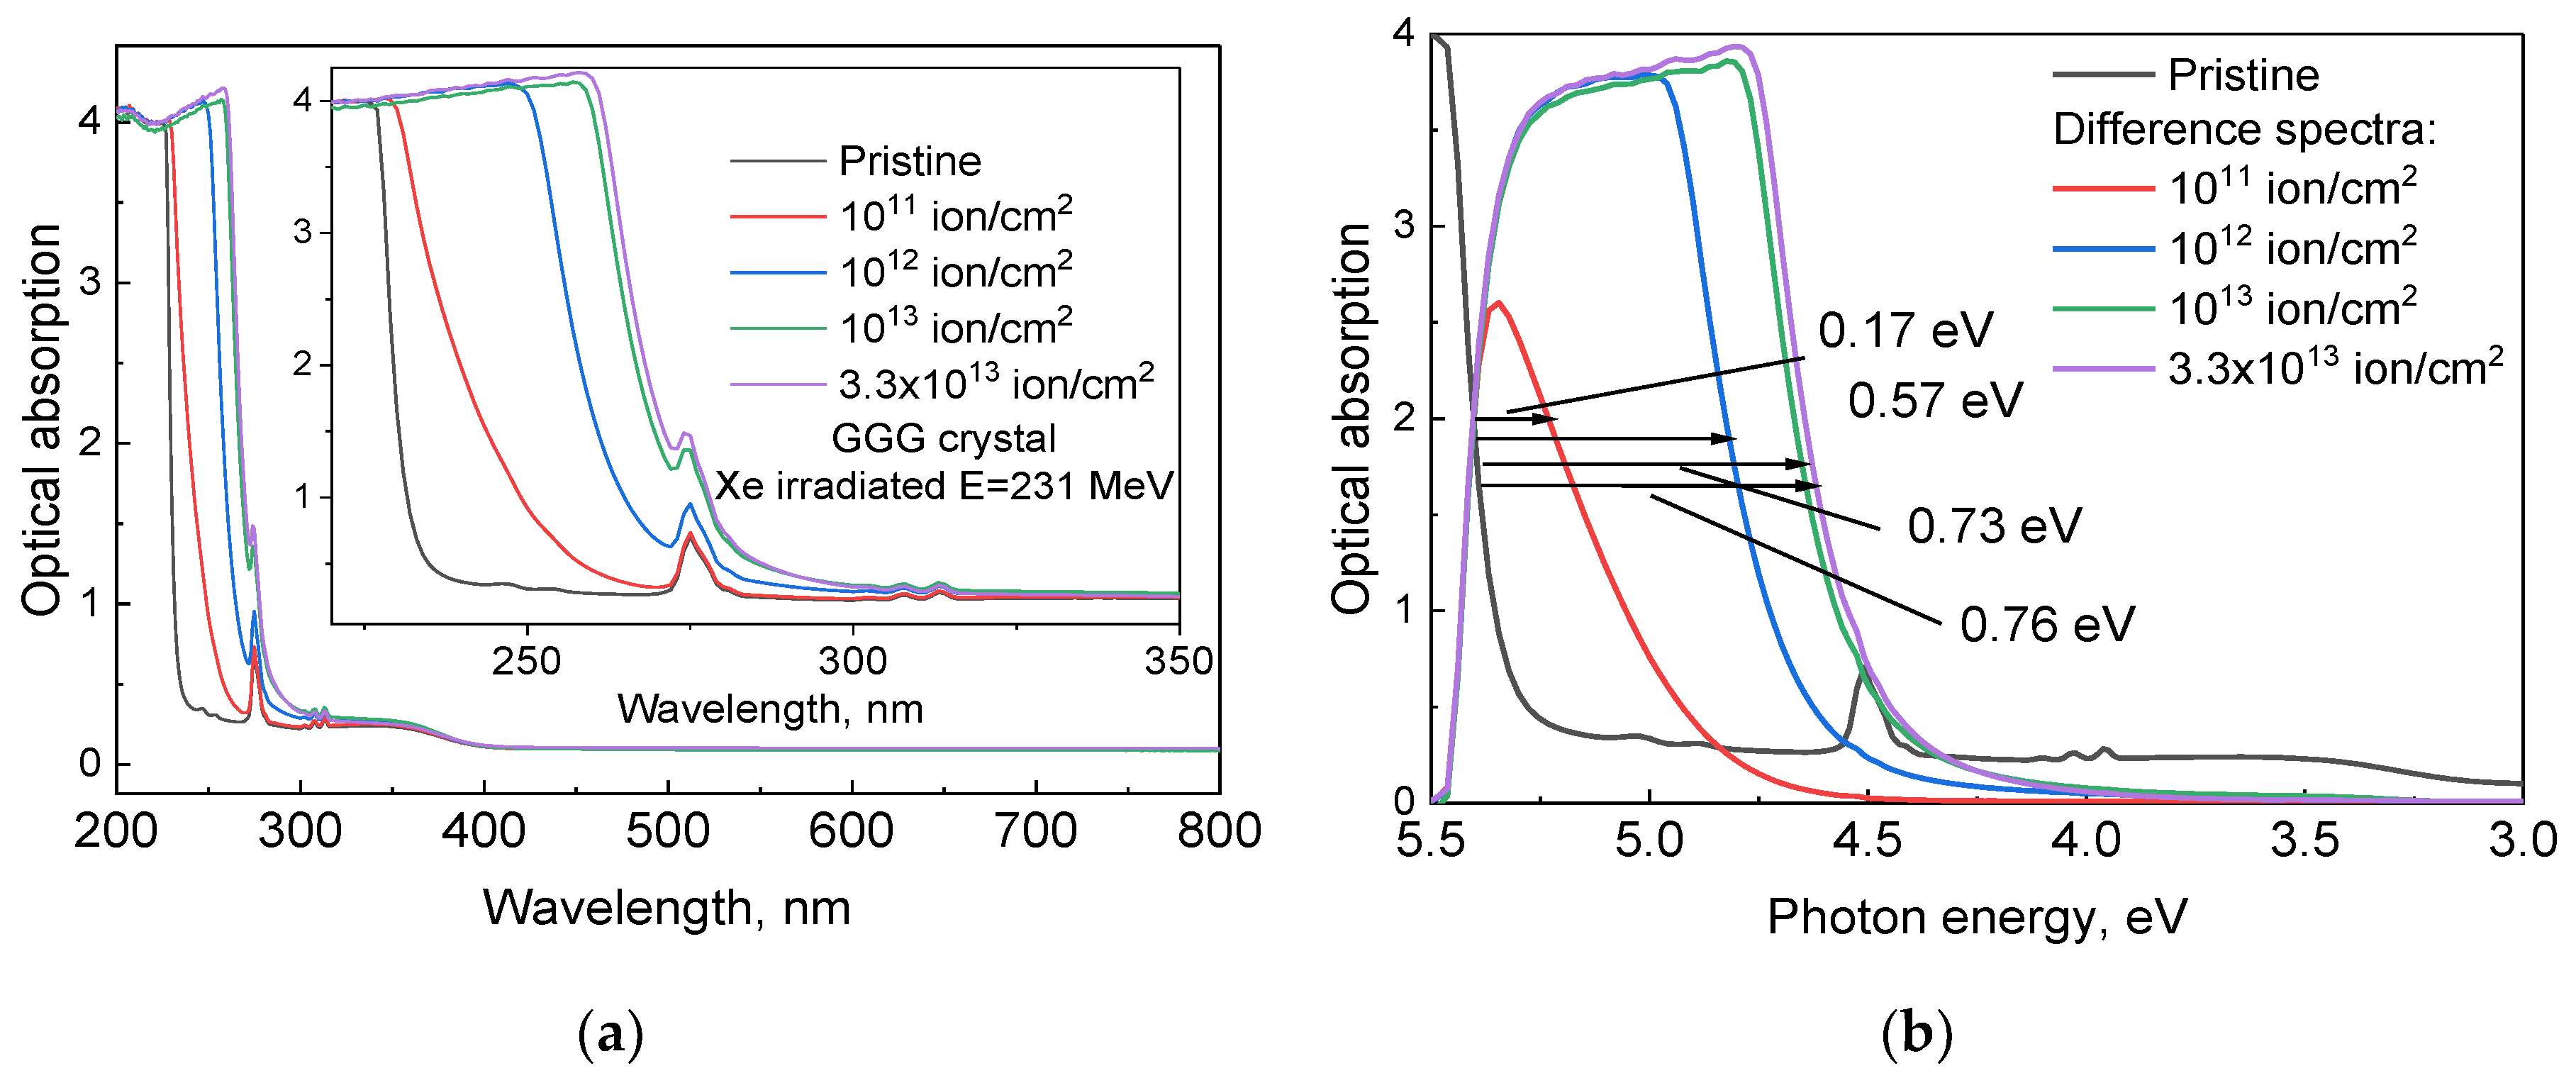
Figure 2.
Figure 2. Raman spectra of GGG single crystals: Pristine and Xe ion-irradiated with E=231 MeV by various fluences (a); increase in the Raman line width (FWHM) with increasing Xe fluence for stable high-frequency modes (b-c).
Figure 2.
Figure 2. Raman spectra of GGG single crystals: Pristine and Xe ion-irradiated with E=231 MeV by various fluences (a); increase in the Raman line width (FWHM) with increasing Xe fluence for stable high-frequency modes (b-c).
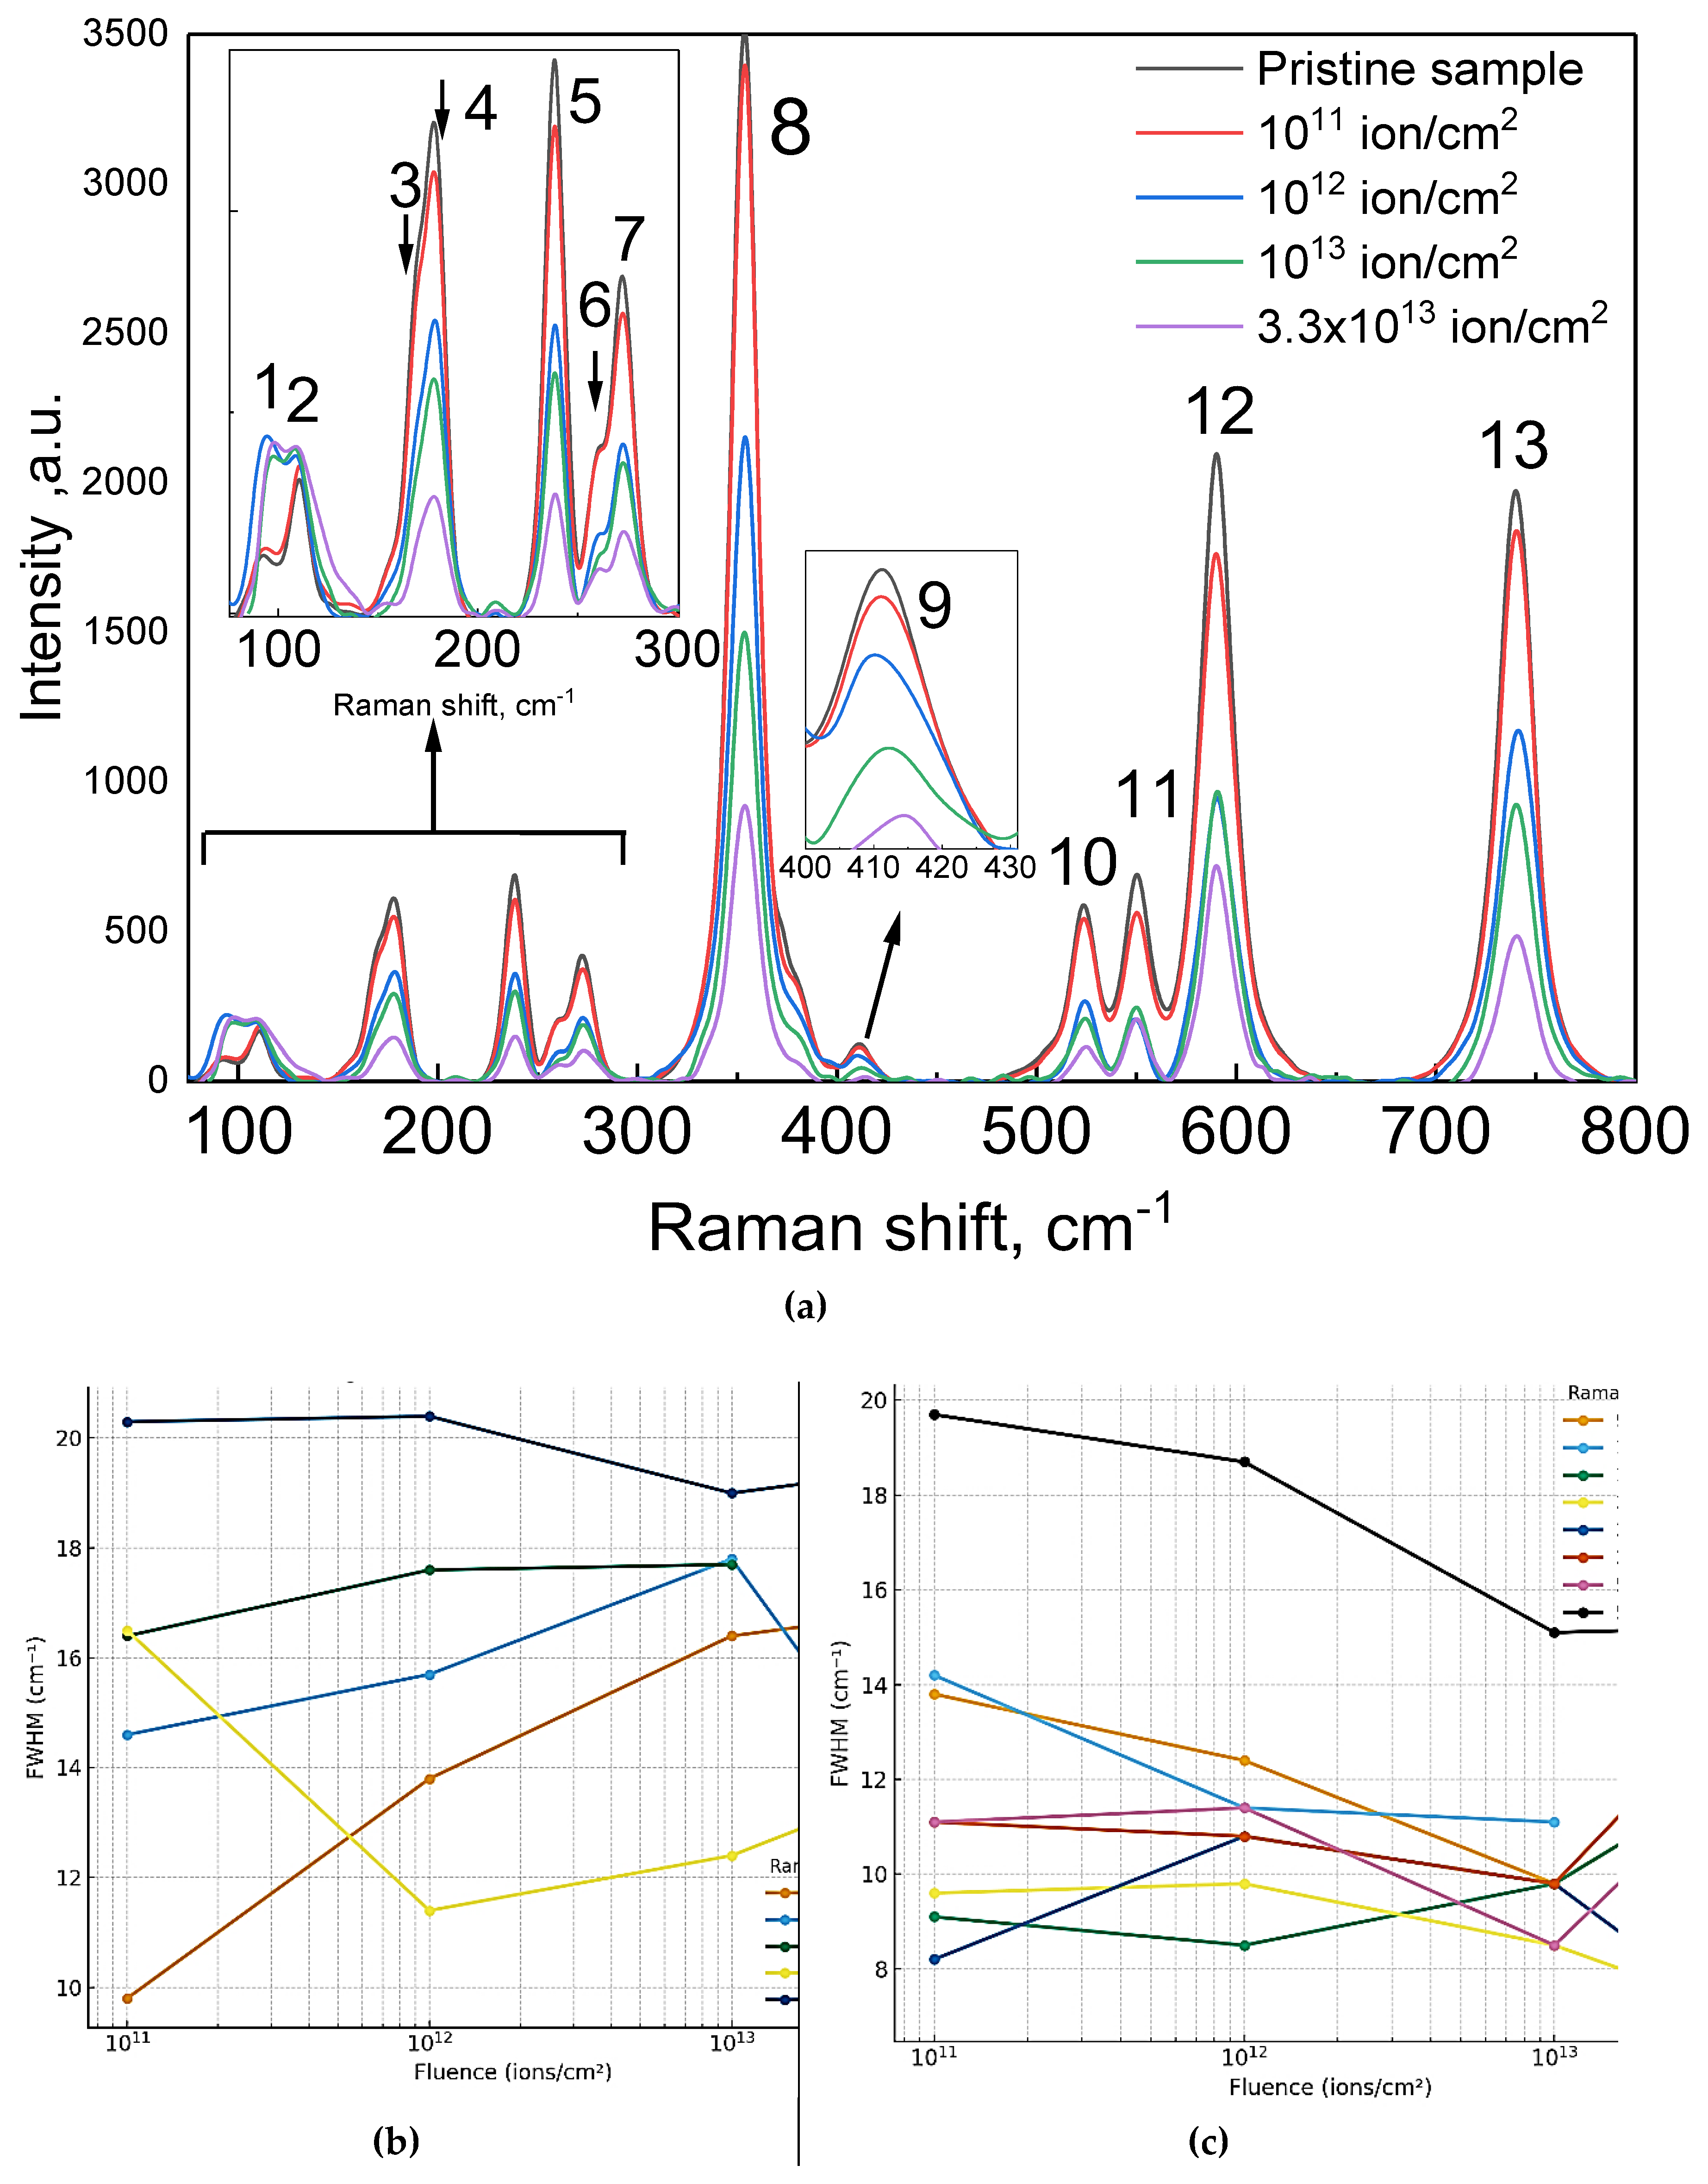
Figure 3.
Imain/Ipeak (a) and (b); Per-peak normalized response vs. fluence (includes pristine), Degradation rate vs. fluence(c).
Figure 3.
Imain/Ipeak (a) and (b); Per-peak normalized response vs. fluence (includes pristine), Degradation rate vs. fluence(c).
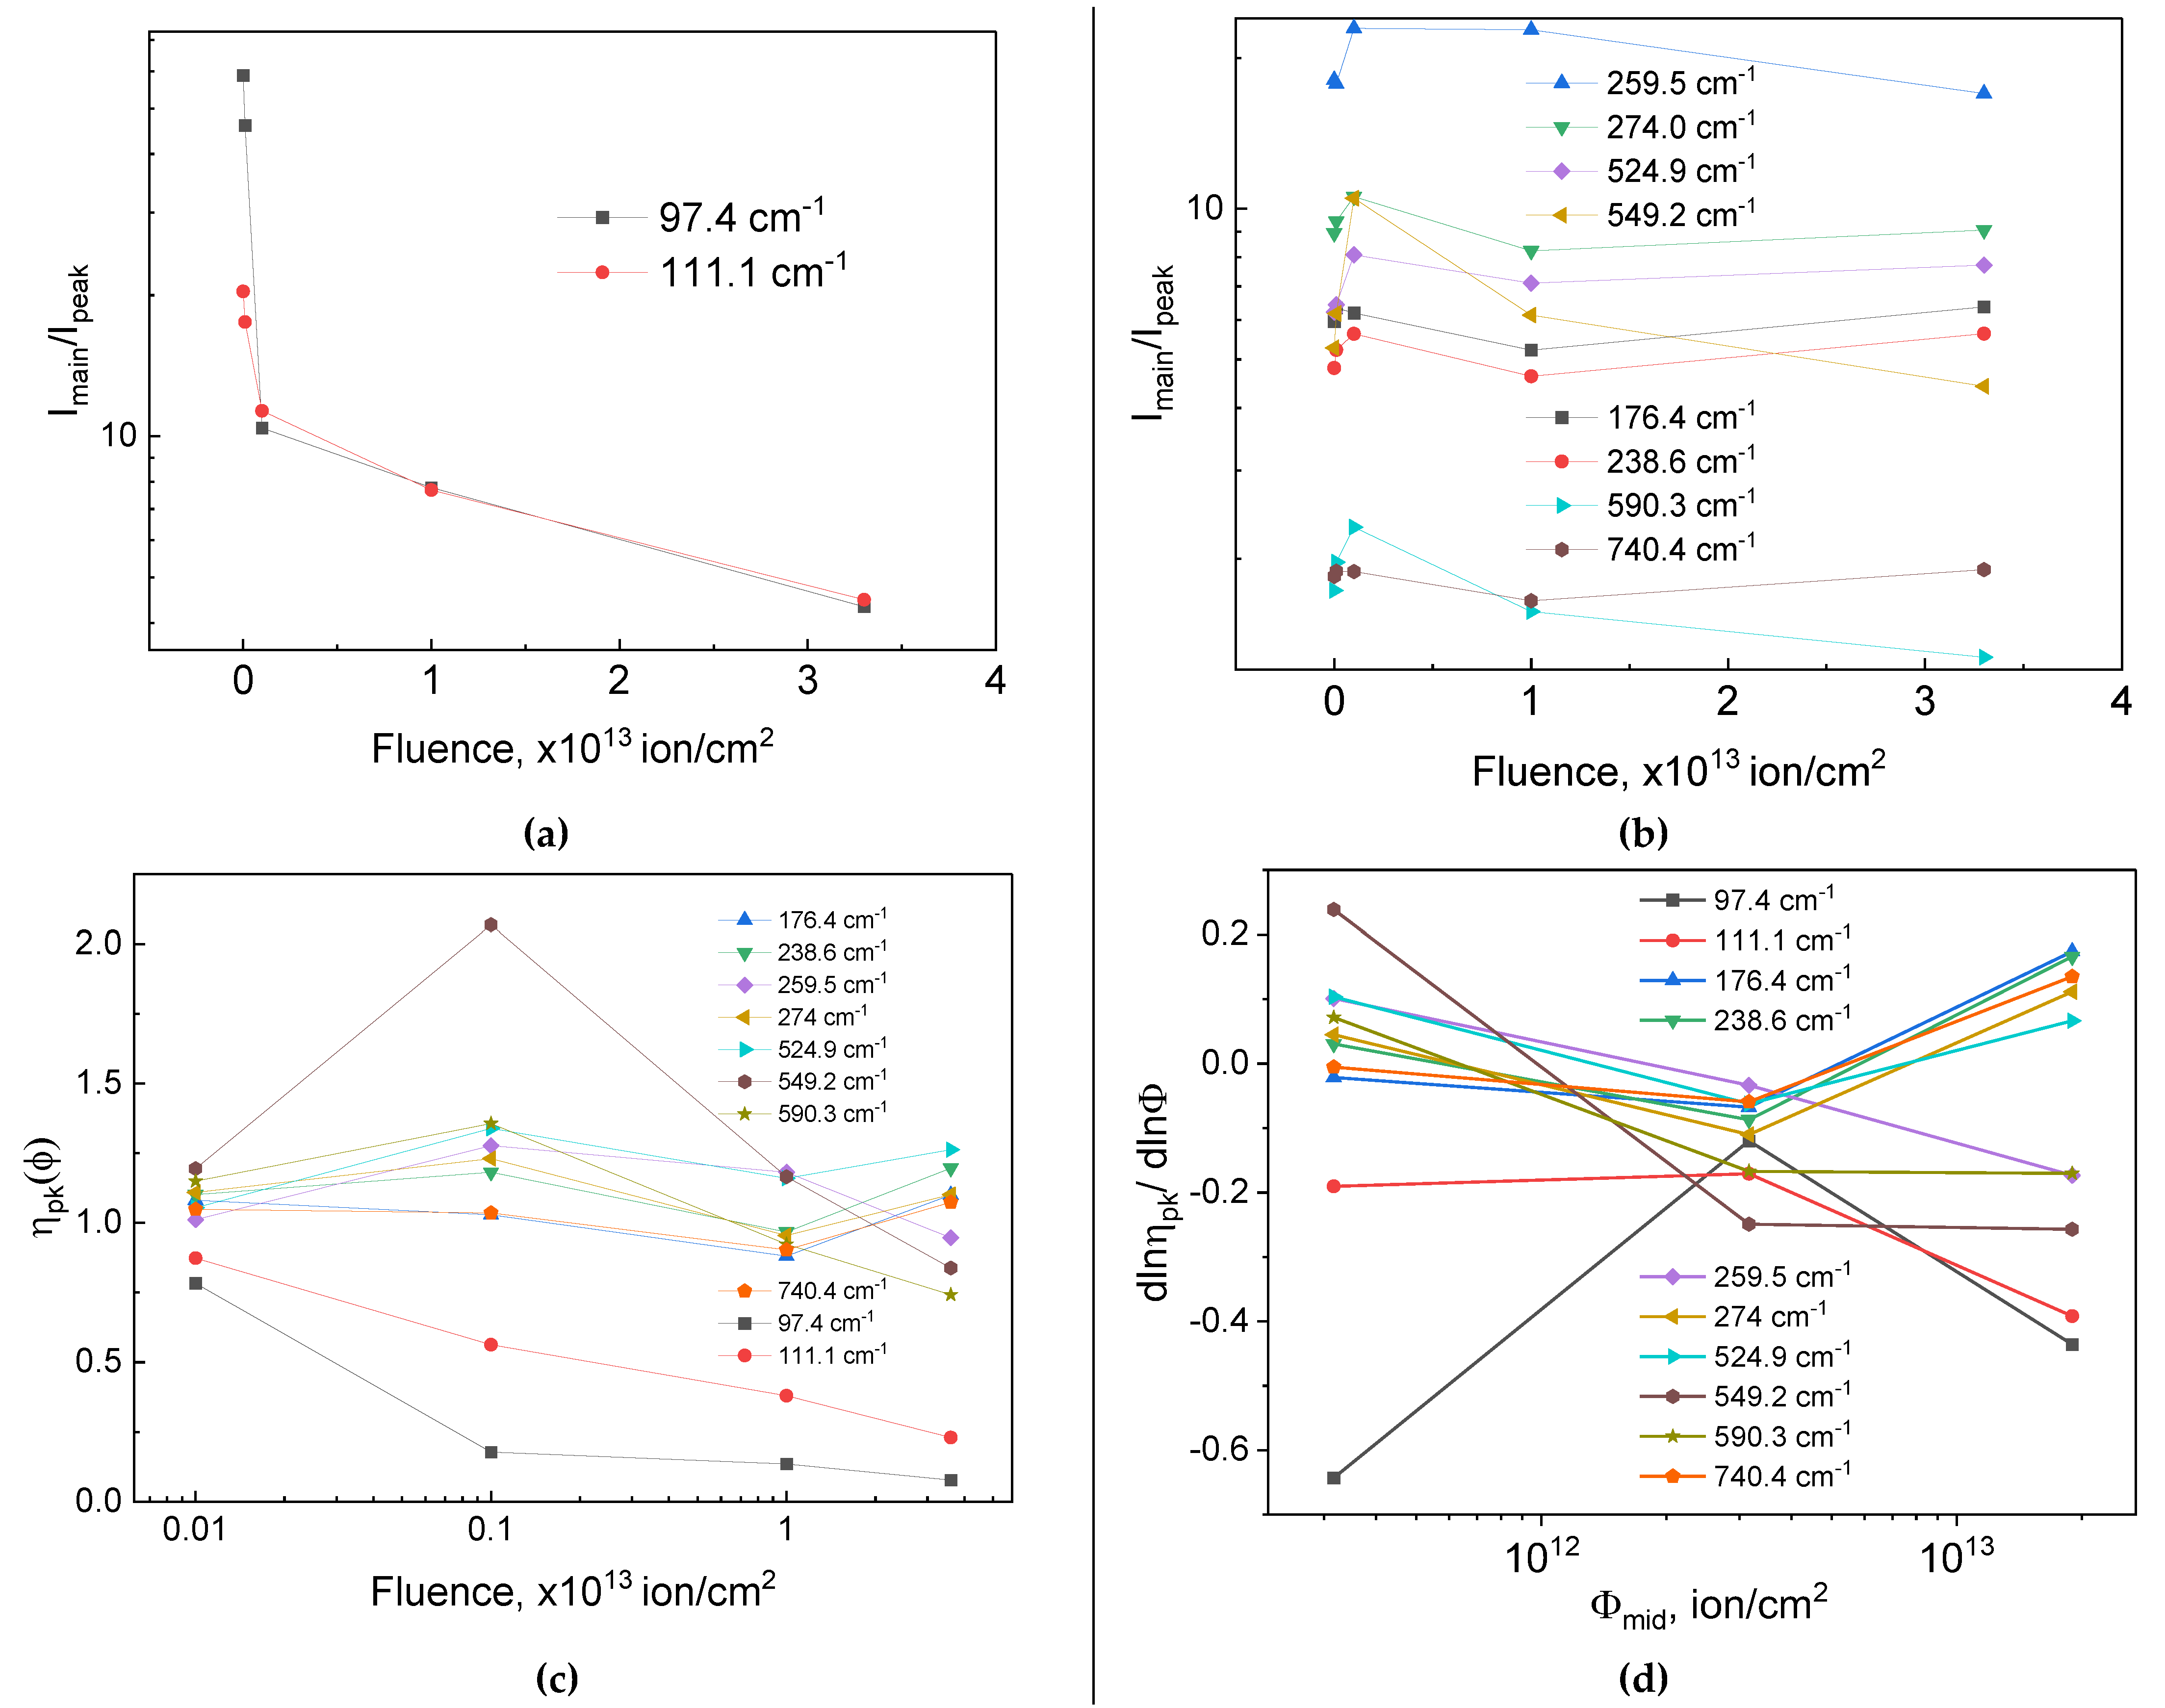
Figure 4.
Depth profiles of nanohardness for GGG single crystals irradiated with 231 MeV Xe ions at various fluences, and the corresponding electron energy loss density calculated using SRIM. H0- indicates the hardness of pristine GGG.
Figure 4.
Depth profiles of nanohardness for GGG single crystals irradiated with 231 MeV Xe ions at various fluences, and the corresponding electron energy loss density calculated using SRIM. H0- indicates the hardness of pristine GGG.
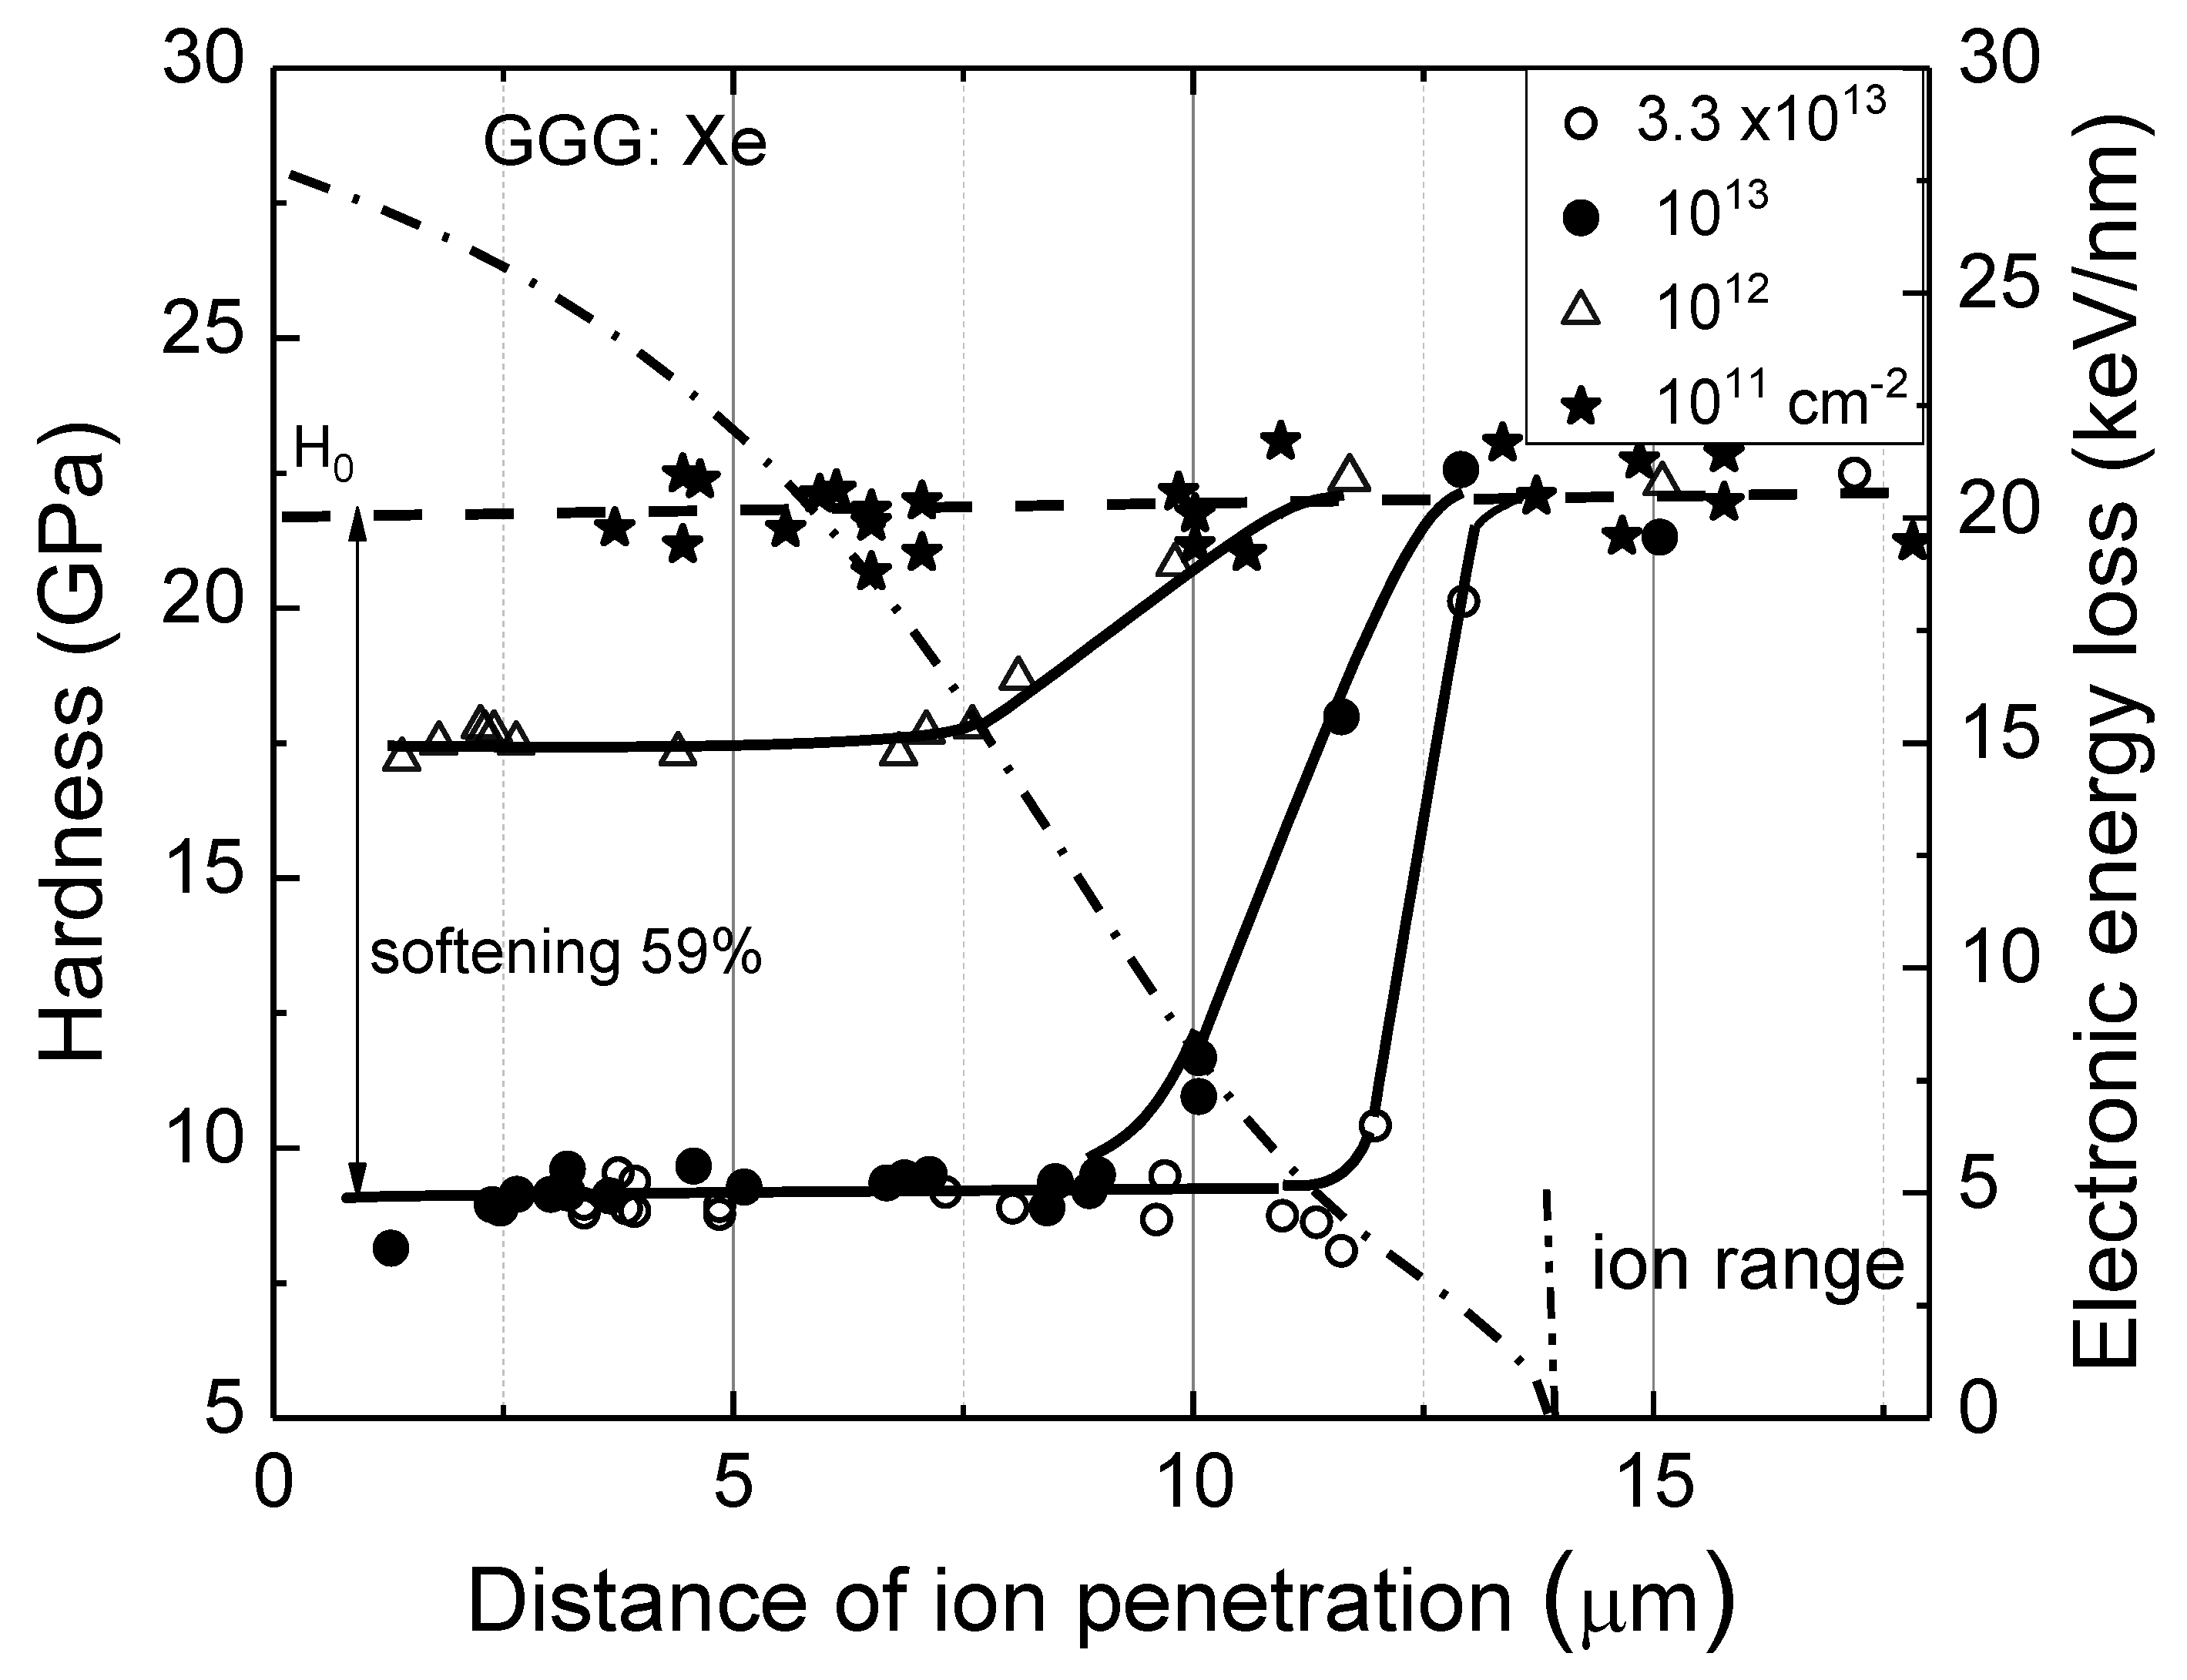
Figure 5.
Figure 5. Ion-induced softening of GGG single crystals as a function of electronic energy flux density. Data were derived from Figure 1 using the hardness values at the saturation stage.
Figure 5.
Figure 5. Ion-induced softening of GGG single crystals as a function of electronic energy flux density. Data were derived from Figure 1 using the hardness values at the saturation stage.
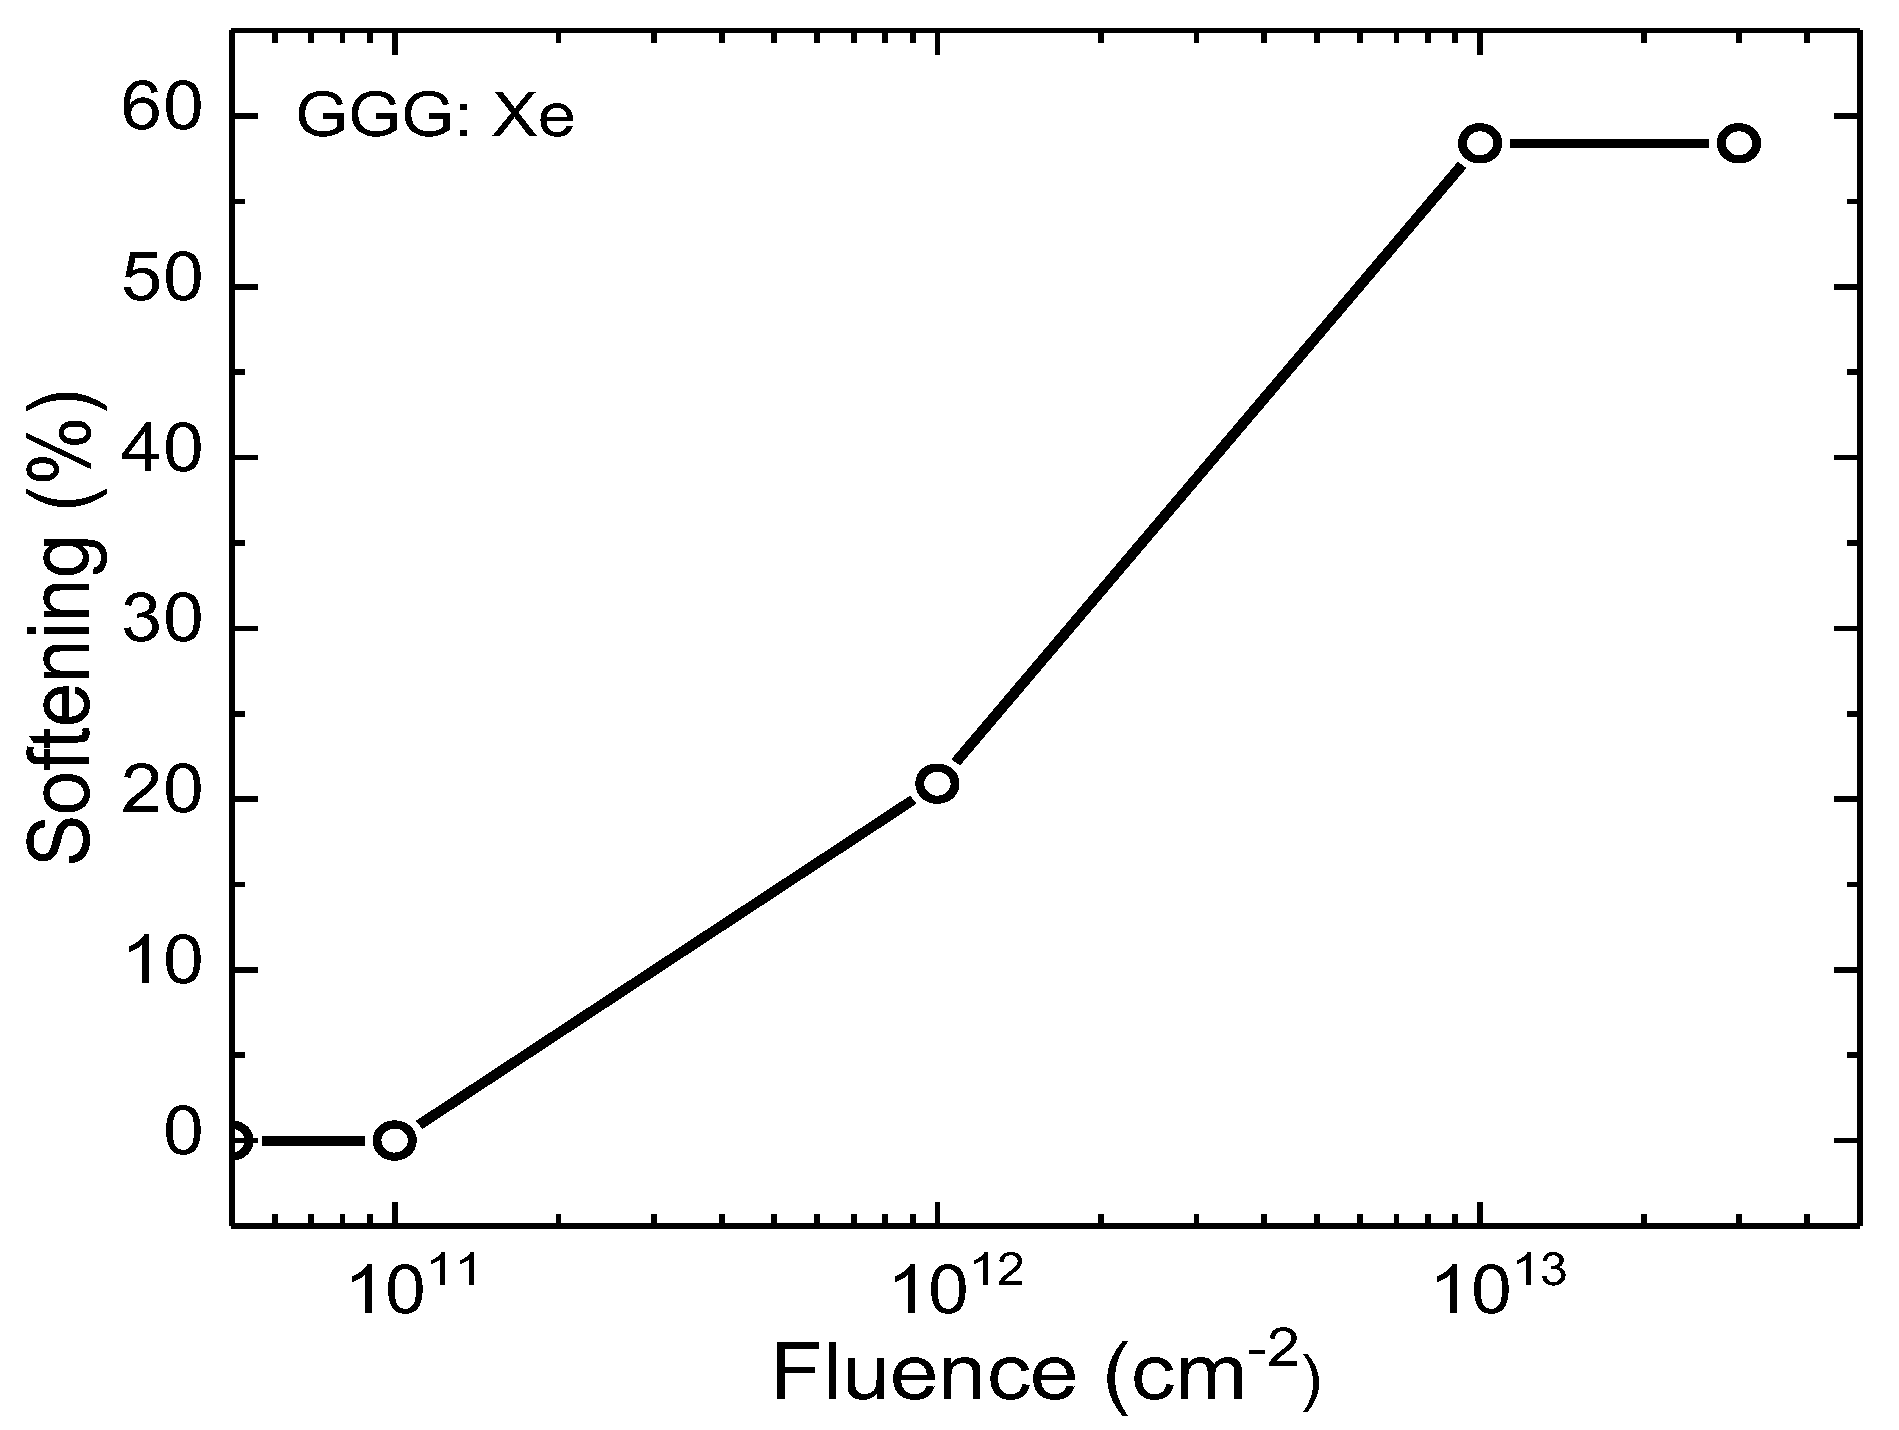
Figure 6.
AFM images of the cleaved surface of GGG irradiated with 231 MeV Xe ions (fluence 1013 ions/cm2). Image areas are 5×5 µm² (a) and 8×8 µm² (b). The arrow indicates the ion beam direction.
Figure 6.
AFM images of the cleaved surface of GGG irradiated with 231 MeV Xe ions (fluence 1013 ions/cm2). Image areas are 5×5 µm² (a) and 8×8 µm² (b). The arrow indicates the ion beam direction.
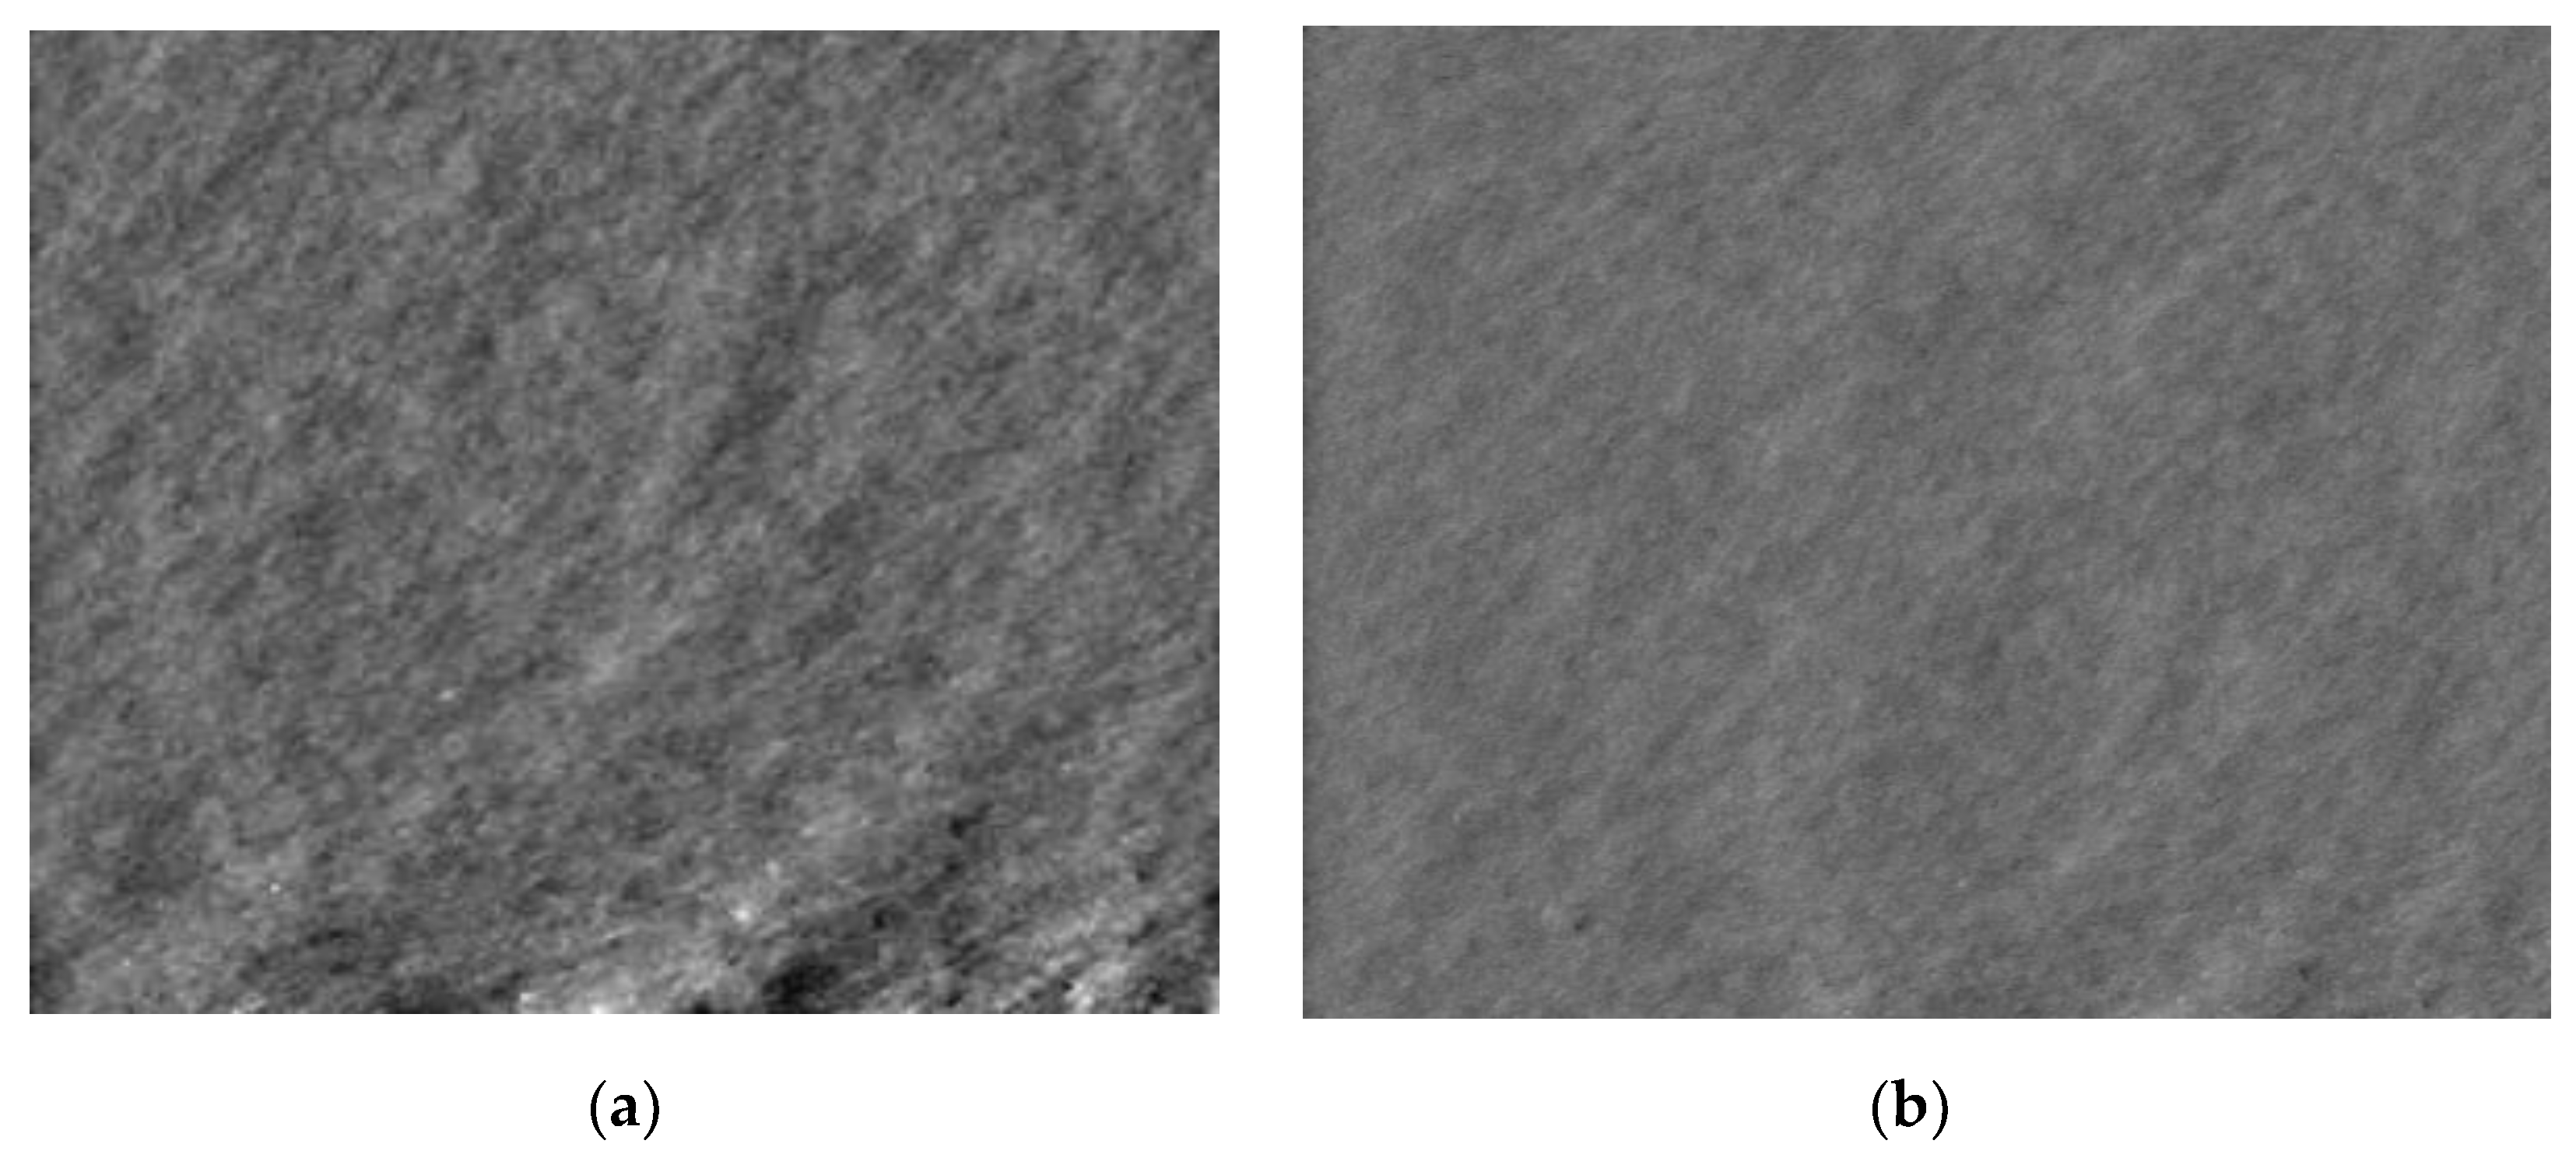

Table 1.
Positions of Raman peak maxima and full widths at half maximum (FWHM, cm−1) of the main vibrational modes of GGG before and after irradiation with 131Xe ions (231 MeV) at various fluences.
Table 1.
Positions of Raman peak maxima and full widths at half maximum (FWHM, cm−1) of the main vibrational modes of GGG before and after irradiation with 131Xe ions (231 MeV) at various fluences.
| Mode (sym.) | Pristine | Pristine | F=1011 ion/cm2 |
F=1012 ion/cm2 |
F=1013 ion/cm2 |
F=3.3x10¹³ ion/cm2 |
||||
|---|---|---|---|---|---|---|---|---|---|---|
| Position (cm−1) | FWHM (cm−1) | Position (cm−1) | FWHM (cm−1) | Position (cm−1) | FWHM (cm−1) | Position (cm−1) | FWHM (cm−1) | Position (cm−1) | FWHM (cm−1) | |
| ~93 (T2g) | 92.9 | 11.0 | 92.9 | 13.8 | 93.5 | 12.4 | 95.5 | 9.8 | 97.4 | 12.0 |
| 110 (Eg) | 110.0 | 11.0 | 110.0 | 9.8 | 109.4 | 13.8 | 108.0 | 16.4 | 111.1 | 16.8 |
| 169 (T2g) | 169.7 | 13.7 | 170.1 | 14.2 | 170.1 | 11.4 | 167.5 | 11.1 | - | - |
| 179 (T2g) | 179.0 | 9.1 | 179.1 | 9.1 | 178.7 | 8.5 | 177.3 | 9.8 | 176.4 | 12.0 |
| 238 (T2g) | 238.3 | 9.8 | 238.3 | 9.6 | 238.5 | 9.8 | 238.1 | 8.5 | 238.6 | 7.2 |
| 260 (Eg) | 259.7 | 6.9 | 260.2 | 8.2 | 260.5 | 10.8 | 260.5 | 9.8 | 259.5 | 7.1 |
| 274 (T₂g) | 272.6 | 11.1 | 272.8 | 11.1 | 273.1 | 10.8 | 272.4 | 9.8 | 274.0 | 13.6 |
| 354 (A₁g) | 354.0 | 12.2 | 353.7 | 14.6 | 353.7 | 15.7 | 353.6 | 17.8 | 353.1 | 13.6 |
| 411 (T2g) | 411.2 | 8.3 | 411.0 | 16.4 | 410.4 | 17.6 | 410.4 | 17.7 | 415 | - |
| 523 (A1g) | 523.0 | 16.4 | 523.3 | 16.5 | 523.9 | 11.4 | 524.6 | 12.4 | 524.9 | 13.6 |
| 550 (T2g)** | 550.1 | 11.5 | 550.0 | 11.1 | 549.0 | 11.4 | 550.0 | 8.5 | 549.2 | 12.0 |
| ~590 (T2g)** | 590.2 | 18.5 | 590.1 | 19.7 | 590.6 | 18.7 | 590.6 | 15.1 | 590.3 | 15.2 |
| 740 (T2g) | 740.4 | 18.0 | 740.2 | 20.3 | 741.1 | 20.4 | 739.9 | 19.0 | 740.4 | 19.4 |
Disclaimer/Publisher’s Note: The statements, opinions and data contained in all publications are solely those of the individual author(s) and contributor(s) and not of MDPI and/or the editor(s). MDPI and/or the editor(s) disclaim responsibility for any injury to people or property resulting from any ideas, methods, instructions or products referred to in the content. |
© 2025 by the authors. Licensee MDPI, Basel, Switzerland. This article is an open access article distributed under the terms and conditions of the Creative Commons Attribution (CC BY) license (https://creativecommons.org/licenses/by/4.0/).
Copyright: This open access article is published under a Creative Commons CC BY 4.0 license, which permit the free download, distribution, and reuse, provided that the author and preprint are cited in any reuse.


