
Submitted:
22 October 2025
Posted:
23 October 2025
You are already at the latest version
Abstract
Bifacial photovoltaic (PV) panels represent one of the technological advancements in the photovoltaic solar power technology compared to the monofacial panels. This study aims to demonstrate the electricity gains due to switching from monofacial systems to bifacial systems in Oman, which is a performance metric we introduce and call “approximated bifacial gain” or (ABG). These approximated bifacial gains (ABG) are assessed for two albedo values (0.30 and 0.65). Seven geographically-dispersed Omani cities are considered in this study; namely: Duqm, Ibri, Khasab, Muscat, Salalah, and Sohar. Both annual specific electricity yields (expressed in kWh/kWp/year) and monthly specific electricity yields (expressed in kWh/kWp/month) are compared for these cities under three representative situations: (1) monofacial PV system, (2) bifacial PV system with albedo 0.30, and (3) bifacial PV system with albedo 0.65. Our results suggest that with the low albedo of 0.30, the monthly bifacial gain in Oman is highest in June (9.5%), while it is lowest in the winter (near 6%). With a high albedo of 0.65, the monthly bifacial gain in Oman is still highest in June (about 19%) and still lowest in the winter (near 13%). The obtained average daily specific electricity yield in Oman with monofacial PV systems is about 5 kWh/kWp/day, which corresponds to 1,825 kWh/kWp/year. The study is based on the “Aladdin” cloud-based free tool for PV simulation and computer-aided engineering (CAE).
Keywords:
electricity
; PV
; modules
; computer-aided engineering
1. Nomenclature (in Alphabetical Order, Greek Symbols First)
| Albedo (or reflectivity or reflectance) | |
| ABG | Approximated bifacial gain. It is the ratio of excess electricity generated from a bifacial photovoltaic module (panel) or array beyond the electricity generated from a monofacial module or array having the same capacity (same kilowatts peak; given that for the bifacial module, this capacity is for the front face only). |
| AC | Alternating current |
| AM | Air mass |
| ASTM | American Society for Testing and Materials [1] |
| BF | Bifaciality factor. It is the ratio of electricity generated (or power capacity) from the rear side of a bifacial photovoltaic module (panel) to the electricity generated (or power capacity) from its front side, when both sides are irradiated at standard test conditions (STC). A representative value for bifaciality factor (BF) is 70%. The bifaciality factor is also called “module bifaciality” or (MB). |
| BG | Bifacial gain. It is the ratio of additional (secondary) electricity generated (or additional power capacity) from the rear side of a bifacial photovoltaic module (panel) to the primary electricity generated (or primary power capacity) from its front side, when the front side is irradiated at standard test conditions (STC) [2,3], while the rear side is subject to indirect reflected irradiance. The bifacial gain depends on both the local ground albedo and the bifaciality factor. A representative value for the bifacial gain is 10%. |
| CAE | Computer-aided engineering |
| CAGR | Compound annual growth rate |
| DC | Direct current |
| DC-to-AC ratio | Ratio of the nominal output photovoltaic direct current power (at standard test conditions) to the nominal output alternating current power after the inverter stage [4]. This parameter is also called “inverter loading ratio” or (ILR) [5,6]. |
| DNI | Direct normal irradiance |
| DOF | Degree of freedom |
| GHG | Greenhouse gas |
| GPS | Global positioning system |
| IBC | Interdigitated back contact |
| IFI | Institute for Future Intelligence (Massachusetts, USA) |
| kWac | Kilowatt of alternating current electricity (after inverting the direct current electricity produced by the photovoltaic modules using an inverter stage) |
| kWh | Kilowatt-hour of alternating current electric energy from the overall photovoltaic system (net energy, after the inverter stage and any system losses) |
| kWp | Kilowatt peak, a unit of the direct current electric power for photovoltaic modules (panels). It is used to express the nameplate electricity generation capacity at standard test conditions (STC). |
| IEA | International Energy Agency (Paris, France) |
| ILR | Inverter loading ratio (same as the “DC-to-AC ratio”) [7] |
| IRR | Internal rate of return |
| HC | Half cut |
| LCOE | Levelized cost of electricity |
| MB | Module bifaciality (same as the “bifaciality factor”, BF) |
| MBB | Multi-busbar |
| NASA | United States National Aeronautics and Space Administration |
| NPV | Net present value |
| NZE | Net Zero Emissions by 2050 scenario by the International Energy Agency (IEA) |
| PERC | Passivated emitter and rear contact |
| PPA | Power purchase agreement |
| PV | Photovoltaic |
| PVGIS | Photovoltaic Geographical Information System |
| SAF | Sustainable aviation fuel |
| SC | Short circuit |
| SMBB | Super multi-busbar |
| SPP | Simple payback period |
| STC | Standard test conditions of a photovoltaic panel (module): 1000 W/m2 hemispherical terrestrial irradiance, with a standardized irradiance spectrum (G173-03, by ASTM: American Society for Testing and Materials) [8], cell temperature 25 °C (298.15 K), and air mass AM 1.5 [9,10] |
| STEM | Science, technology, engineering, and mathematics |
| TES | Total energy supply |
2. Introduction
2.1. Background
Photovoltaic (PV) solar power technology is the fastest-growing renewable energy type [11,12,13]. Although the PV solar technology had a small share of the global electricity generation (5.4%) at the end of 2023, the share of electricity generation by all renewable energy sources was also not high (30.3%), making the PV solar technology one of the three main contributors to clean electricity, coming in the third place after the hydropower (hydroelectricity) technology (14.3% share) and the wind technology (7.8% share; counting both onshore and offshore wind systems) [14]. Other renewable energy technologies (such as concentrated solar power “CSP”, geothermal power, and ocean wave power) contributed a small share of only 2.8% of the electricity generation in 2023 globally (this is half of the contribution made by PV solar alone). The global PV installations are growing rapidly enough to predict that this renewable energy technology may exceed the wind power technology in 2027, and then exceed the hydropower technology in 2029.
Photovoltaic (PV) solar electricity generation has increased by 25% in 2023 (relative to the 2022 value of 1,280 TWh), which is an increase of 320 TWh, causing the global generation using this renewable energy technology to reach 1,600 TWh. This increase of 320 TWh of renewable electricity in 2023 is the largest among all renewable energy technologies in 2023. The global capacity of the PV power technology reached 1.411139 TW in 2023, marking a large capacity addition of 0.346864 TW compared to the power capacity of 2022 (1.064275 TW), and this capacity addition was 32.59% of the 2022 global PV capacity [15,16,17].
Photovoltaic (PV) solar power technology is on track for achieving the Net Zero Emissions by 2050 (NZE) Scenario of the International Energy Agency (IEA) [18]. On the other hand, the wind power technology and the hydroelectricity power technology are not growing at a satisfactory rate [19]. PV solar power is a potentially successful way for achieving a global energy transition, which is important for mitigating greenhouse gas (GHG) emissions from combustion processes in conventional fossil-fuel-fired power plants, thereby combating climate change [20].
Photovoltaic (PV) solar power technology has advanced in the past years through
introducing adaptations that increase the energy conversion efficiencies of the
individual PV modules (panels). Such upgrades in the PV technology include the half
cut (HC) cells or half-cells [21,22], the passivated emitter and rear
contact (PERC) topology [23,24,25], the multi-busbar (MBB) and super
multi-busbar (SMBB) connectivity [26,27,28], the N-type design [29,30], and the interdigitated back contact (IBC) layout [31,32,33].
The bifaciality concept is another technology improvement for PV modules, where not only the front face of the module is able to convert solar radiation into direct current (DC) electricity, but also the rear face [34,35,36]. Bifacial PV modules had a global market share of about 5% in 2016, which increased to 15% in 2019, then increased to 20% in 2020, and reached 33% in 2023 [37,38,39]. The global market share of bifacial PV modules is expected to reach 50% in 2026, 60% in 2029, and 70% in 2033 [40] (or even as early as 2030 [41]). The global market of bifacial photovoltaic modules was predicted to grow at a CAGR (compound annual growth rate) of 15.1% between 2024 and 2030 [42], and at a CAGR of 18.17% between 2024 and 2032 [42,43].
A key factor in the feasibility of a bifacial PV module is the ground albedo (or ground reflectivity) for the constructed foundation or the plain land beneath the installed bifacial PV modules. The ground albedo is a radiative property that describes the ability of the ground (the foundation or land) under the PV modules to reflect incident solar radiation, and this reflected part forms a source of irradiance to the rear faces of the bifacial PV modules [44,45]. Like other radiative properties, such as the emissivity and absorptivity, the albedo can be a spectral function of the wavelength of the incoming radiation [46,47,48]. However, it is common to treat the ground albedo as a scalar quantity, which means a spectrally-integrated value [49,50]. It is useful to add here that the electromagnetic spectral wavelength portion of interest for crystalline silicon PV modules is approximately 0.4–1.1 μm (400–1,100 nm) [51,52]. Therefore, strictly speaking, the albedo for PV solar power applications should be an integrated value of the spectral reflectivity over this range [53,54]. However, in the current study, these spectral characteristics were overlooked for simplification [55,56]. Likewise, the directional characteristics [57,58] and seasonal characteristics [59,60,61] of the albedo are not considered here.
A large number of ground albedo values are mentioned in the literature, depending on the type of the ground. The albedo can be determined naturally based on the original type of the ground, or controlled through adding an artificial cover layer that improves sunlight reflection [62,63]. In Table 1, we list examples of these estimated albedo values at different conditions. In our study, we consider two values of albedo that are of special interest; which are 0.30 (a low value, representative of plain sandy or dusty land without specialized land coverage) and 0.65 (a high value, representative of ground covered with white pebbles or white tiles).
Bifacial PV modules are rated by their front-face-only peak power capacity at standard test conditions (STC) [73]. The electricity generation from the rear face of the bifacial PV module is typically estimated as a percentage of the front-face-only performance, and such a percentage is called bifacial gain (BG) [74]. The bifacial gains (BG) describe the expected gain in the total (considering the contribution of both the front face and the rear face) DC power output as compared to the contribution from the front face only [75]. It should be noted that the rear face of the bifacial PV module is not simply a duplicate layer of the front face that is affixed to its rear side. This apparently simple design/manufacture approach may double the cost of the module while only a small gain can actually be achieved (because in any case, the rear face is known to receive much less irradiance than the front face, and this “indirect” irradiance has a different nature than the “direct” irradiance received by the front face). Therefore, the rear face should be customized such that it does not lead to a large cost increase through admitting less efficiency and operational quality than that of the front face. The rear face of a bifacial PV module is less efficient in converting incident radiation into DC power output than the front face. The ratio of these energy conversion efficiencies (the rear efficiency to the front efficiency) at the standard test conditions (STC) is denoted by the bifaciality factor (BF) or the module bifaciality (MB) [76,77,78].
A number of studies were performed recently, in which the impact of albedo on bifacial photovoltaic (PV) cells or modules was investigated, and the performance of bifacial PV cells or modules was compared to that of monofacial ones.
For example, simulations were conducted using the online calculator (SunSolve™) [79] to analyze the characteristics of a monofacial PV cell and a bifacial PV cell under standard test conditions (STC) with different albedos [80]. The simulation results showed that the bifacial solar cell produces more short circuit (SC) current density and more DC output power relative to the monofacial cell. Also, the results of that study concluded that higher output power is delivered at higher albedos.
In another study [67], the performance of a bifacial photovoltaic system (consisting of a single PV module) at different albedo conditions was compared experimentally to that of a monofacial photovoltaic system (consisting also of a single PV module) at Heriot-Watt University, Edinburgh campus, UK. The researchers augmented their study through numerical simulations using the commercial solar modeling tool “PVsyst” [81,82,83], and they used it to estimate the bifacial gain at different albedo values. They reported a high bifacial gain of 19.6% when white tiles were used as a ground cover. They reported an intermediate bifacial gain of 12.4% when white pebbles were used as a ground cover. They reported a low bifacial gain of 10.5% when concrete was used as a ground cover. Their study showed consistency with the output of the PVsyst simulations.
Another study [84] evaluated the annual performance of a bifacial photovoltaic system in Beijing (China) by considering dynamic variations of environmental/outer conditions, and found that a bifacial gain between 12.37% and 15.50% can be reached. In that study, the bifacial PV modules had a bifaciality factor (BF) of 80%, and a front-side efficiency of 21.23%.
Our study extends the research work conducted in the areas of bifacial photovoltaic power generation, its gain compared to monofacial units, and general photovoltaic system simulations. We explain this further in the next subsection.
2.2. Goal of the Study
The main goal of this study is to quantify the technical advantage of bifacial photovoltaic (PV) modules in comparison with monofacial PV modules for Oman (the Sultanate of Oman). Oman has recently paid a lot of attention to solar energy and other alternatives [85,86] to the traditional gas-fired combined cycle and gas turbine power plants [87,88,89] (natural gas accounted for 88% of the country's total energy supply “TES” in 2022 and it accounted for over 95% of Oman’s electricity generation in 2023 [90]), economic diversification [91,92], education and scientific research [93,94,95], sustainable cities [96,97], urbanization and transformed transportation [98,99,100,101], and novel solutions for a low-carbon environment [102,103,104]. The country adopted an ambitious green hydrogen national program with the aim of becoming a global producer and exporter of green hydrogen by 2030 [105,106]. This large-scale investment in green hydrogen requires also large-scale investment in photovoltaic power systems, which are expected to supply roughly half of the renewable electricity needed to operate the water electrolyzers that produce the green hydrogen from water (with the remaining renewable electricity to be produced using wind farms) [107,108]. Green hydrogen (or e-hydrogen or electric hydrogen) is a clean alternative energy carrier that can be used as a fuel [109,110] (either via combustion or via fuel cells), or as a feedstock for sustainable fuels (such as SAF “sustainable aviation fuel” [111,112], also called e-kerosene [113]), renewable feedstock chemicals (such as green methanol [114] and green syngas [115]), and synthetic industrial products (such as green ammonia [116]).
We selected seven cities in Oman to perform the simulation-based assessment of the bifacial PV modules gain over monofacial PV modules. These cities form good geographic and climatic diversity for the country. Ordered alphabetically, the selected Omani cities in the current study are
- Buraimi or Al Buraimi [117] (an inland city bordering the United Arab Emirates, about 270 km “straight-line distance” west-northwest of Muscat)
- Duqm or Al Duqm [118] (a coastal city in the east of Oman, facing the Arabian Sea)
- Ibri [119] (an inland city, about 200 km “straight-line distance” west-southwest of Muscat)
- Muscat [122] (the capital of Oman, a coastal city facing the Gulf of Oman)
- Salalah [123] (a coastal city in the south of Oman)
- Sohar [124] (a coastal city in the northern mainland of Oman, facing the Gulf of Oman)
A justification for selecting these seven cities can be made as follows: Khasab is a representation of the northern part of Oman. Salalah is a representation of the southern part of Oman. Duqm is a representation of the east part of Oman. Buraimi is a representation of the western part of Oman. Ibri is a representation of the middle part of Oman. In addition, the capital “Muscat” is included due to its political importance. Similarly, the port city “Sohar” (or “Suhar”) is also added as being an important economic center and industrial hub in Oman [125,126]. Sohar was the capital of Oman during an ancient era [127]. Sohar has the second established university “Sohar University (SU)” in Oman; coming into operation after the first established university “Sultan Qaboos University (SQU)” in Muscat was established [128].
Our study is focused on technical performance, expressed in terms of the annual and monthly estimated electricity generation, and how bifacial PV modules outperform monofacial PV modules at different geographic locations in Oman at two important albedos. The economic aspect of the comparison between monofacial and bifacial PV modules in Oman is not covered here. Such economic analysis is largely volatile compared to the energy analysis performed here, where costs not only change over time, but also change from one location to another depending on several factors like shipping expenses, scale of the installation, pre-existing infrastructure, possibility of power purchase agreement (PPA) or solar lease [129], subsidies or external financial aids, aimed project lifetime, load profile and variations over time [130,131,132], energy storage options, constraints on the available land, ground coverage ratio (GCR) [133], structural design [134,135], terrain profile, wind loads, and hydrodynamic variations [136,137]. Therefore, our scope is limited to the energy performance of the simulated photovoltaic systems, and we leave further economic investigation to the interested installers or investors; and such an additional economic feasibility study can be performed using conventional economic metrics, such as the levelized cost of electricity (LCOE) [138,139], simple payback period (SPP) [140,141], internal rate of return (IRR) [142,143], and net present value (NPV) [144,145].
2.3. Article Structure
In the next section, the research method is described. Then, test cases for inspecting the broad suitability of our simulation results are presented, where comparisons with external independent simulation methods are provided; for both bifacial PV modules and monofacial PV modules. After this, our results start with more details about the seven locations selected for the analysis in Oman. This is followed by demonstrating the virtual PV system used in the simulations. The gain in the annual electricity generation at two special albedos is displayed. Then, more details about the monthly electricity generation profiles are visualized. Finally, concluding remarks are provided.
3. Research Method
3.1. Research Type and Research Questions
The present study falls under the category of quantitative applied research, where we use a combination of solar energy principles and numerical modeling software to address five queries, namely:
(1) What are the monthly and yearly expectations of monofacial photovoltaic electricity generation in various places in Oman, as well as in the country as a whole?
(2) How advantageous are bifacial photovoltaic modules (relative to monofacial modules) in Oman when operated over natural grounds?
(3) How advantageous are bifacial photovoltaic modules (relative to monofacial modules) in Oman when operated over whitened grounds?
(4) Are there large variations in the performance of bifacial photovoltaic modules from one geographic location to another in Oman?
(5) Is Aladdin software capable of modeling monofacial and bifacial PV modules on par with other software tools?
As discussed in the previous section, literature data suggest that the albedo value representative of bare sandy ground is reasonably 0.30, while the albedo value representative of artificially whitened ground is reasonably 0.65. Therefore, these two albedo values (0.30 and 0.65) are adopted in the current study; respectively; as a low-albedo configuration corresponding to untreated natural ground foundations over which the PV modules are mounted, and a high-albedo configuration corresponding to a treated ground foundation covered by a white artificial cover to boost the light reflection to mounted bifacial PV modules.
Despite the availability of previous studies related to some of these research questions, the current study contributes to the field of solar photovoltaic utilization in Oman and computational modeling of photovoltaic systems in general through addressing all five research questions together. Therefore, the current study can be of interest to those seeking a top-level overview of the expected gain in electric generation due to either installing a new bifacial photovoltaic power system or upgrading an old existing monofacial photovoltaic system to a bifacial version. The current study can also be of interest to those seeking a free yet powerful alternative tool for modeling photovoltaic systems (both monofacial and bifacial), as an alternative to commercial tools or limited-functionality free tools [146,147], with artificial intelligence capabilities and evolutionary computation concepts [148]. This can be particularly valuable in educational settings, by including such tools in teaching STEM (science, technology, engineering, and mathematics) and artificial intelligence subjects [149,150] related to sustainability, photovoltaic solar systems, concentrated solar power, wind energy, green building design, and energy storage. Aladdin is capable of handling all these topics in a convenient interactive cloud environment for computer-aided engineering (CAE).
3.2. Photovoltaic Modeling Tool
The main simulation tool we used is “Aladdin” [151], which is a free cloud-based simulation tool by the Institute for Future Intelligence (IFI) [152]. Aladdin is designed to model and predict the performance of different types of renewable energy systems (not just photovoltaic systems), such as wind farms, building envelopes, and solar towers.
For inspecting the accuracy of our results derived from the Aladdin tool, we performed comparisons with results that we obtained using two other software tools (also free) through benchmarking. One of the benchmarking photovoltaic simulation tools we used is “Energy3D”, which is a desktop application capable of modeling photovoltaic (PV) systems and concentrated solar power (CSP) systems [153]. The other photovoltaic (PV) simulation tool we used for inspecting the accuracy of our main results is the cloud-based software “PVGIS” (Photovoltaic Geographical Information System), managed by the European Commission’s Joint Research Centre (EC-JRC) [154,155,156]. The Energy3D and the PVGIS external benchmarking case is for monofacial photovoltaic (PV) systems, and the comparison with our data derived from Aladdin is in terms of the monthly AC electricity yield per unit peak power in Muscat (the capital of Oman). As of the time of preparing this study, neither Energy3D nor PVGIS has the capability of modeling bifacial PV systems.
In addition, we used published data in the literature that were generated using a fourth modeling tool (commercial desktop software) for simulating photovoltaic power systems (including bifacial modules), which is “PVsyst”. PVsyst is a popular tool that has been used in several studies [157,158,159]. The PVsyst external benchmarking case is for a bifacial photovoltaic (PV) system, with a rated AC power of 30 kWac in Salihli, Turkey [160,161,162].
3.3. Approximated Bifacial Gain (ABG)
Bifacial photovoltaic (PV) modules are commonly characterized by their expected bifacial gain (BG) values, which refer to the additional electric capacity or additional (secondary) electric energy from the bifacial module due to the contribution of its rear face; and this addition is expressed as a percentage of the base (primary) value corresponding to the front face. Therefore,
The bifacial gain (BG) is a good way to describe a particular bifacial PV module. However, it is computed for the same PV module. In a situation where a monofacial PV module is compared to another bifacial PV module with the same power capacity, the BG values become quite irrelevant and not very useful. For example, this aforementioned described scenario can be faced when an individual or an organization wants to make a decision and choose whether to purchase a 10 kWp monofacial system or 10 kWp bifacial system. The decision is not about either purchasing a 10 kWp bifacial PV system with BG 5% or purchasing the same 10 kWp bifacial PV system with BG 10%. The information about the bifacial gain (BG) for a given bifacial PV module does not aid in the decision-making in this example.
Therefore, we introduce here another metric for assessing the performance of bifacial PV modules relative to monofacial modules, which is the approximated bifacial gain (ABG). We define the ABG quantity as the ratio of the additional electricity generated from a bifacial photovoltaic module or array relative to the electricity generated from another monofacial module or array having the same power capacity (same kilowatts-peak). It should be noted that for the bifacial module, the equivalent power capacity refers to the capacity of the front face only. Therefore, the following expression mathematically defines our proposed ABG metric:
Although the ABG and BG values have similar purposes, ABG is established when comparing a bifacial module with another reference monofacial module. On the other hand, BG compared a bifacial module under a certain operational condition with itself but under another operational condition (namely, when the rear-face electricity generation is disabled). The ABG and BG values can be close to each other. Therefore, the reader may treat our ABG values as good indicators of the BG values.
3.4. General Simulation Parameters for the 4.5 kWp Monofacial and Bifacial Systems
For estimating the electric gain and the albedo effect when using bifacial photovoltaic (PV) modules compared to a monofacial module, we modeled in Aladdin a small PV bifacial system consisting of 10 ground-mounted modules (belonging to the JinkoSolar or “Jinko Solar” brand, which is a leading Chinese manufacturer of PV modules [163,164]) with a capacity of 450 Wp (0.45 kWp) each. Their layout is simply a single row, with a portrait orientation.
The tilt angle of the PV array is fixed at a year-round optimum value. The azimuth angle is 180° (if measured from the geographic north) or 0° (if measured from the geographic south). This azimuth angle means that the array modules are facing the geographic south, which is an optimized setting for fixed PV arrays installed in the northern hemisphere [165,166].
By modeling a single row of PV modules (rather than multiple rows) here, we achieve the advantage of reducing the influence of self-shading [167,168] caused by neighbor PV rows. The elimination of this self-shading effect makes the results of our study more general and less affected by the pitch (spacing) design parameter of PV rows, which arises in a multi-row PV array. This focuses our study on the influence of the bifaciality feature of the PV modules.
Similarly, being a fixed PV array, not equipped with a sun tracking mechanism, either with one degree of freedom (1 DOF or single-axis) or two degrees of freedom (2 DOF or two-axis) [169] helps in eliminating additional details with regard to these optional features, and thus removes the interference of these design options on our results. Our study aims to focus on the bifaciality feature of the PV module, and the albedo feature of the ground. The simplifications made in the modeled PV system are thus important and purposefully useful.
The reference monofacial PV system we analyze in Aladdin has the same rated power capacity of 4.5 kWp, but it consists of 15 PV monofacial modules (also belonging to the JinkoSolar brand), with an individual module capacity of 300 Wp (0.3 kWp). The monofacial array also has a single row.
Table 2 lists modeling parameters for the 4.5 kWp bifacial PV system and its reference 4.5 kWp monofacial PV system in Aladdin. In this table, the (pole height) parameter refers to the structural element supporting the PV modules, and the (pole spacing) parameter refers to the pitch (the uniform spacing) of these structural elements.
Figure 1 shows a three-dimensional view of the single-row 4.5 kWp bifacial system and the single-row 4.5 kWp monofacial system as modeled in Aladdin. The heliodon (the locus of the sun position) is also illustrated [170,171]. This figure corresponds to the geographical location of Muscat, and to the solar noon [172,173] (when the sun is at its highest elevation in the sky) of 21 June, as an extreme summer day occurring during the summer solstice (estival solstice) in the northern hemisphere with the sunshine hours being maximum during the year [174,175]. Figure 2 provides a similar three-dimensional view for the two single-row PV systems, but in an extreme winter day (21 December) belonging to the winter solstice (hibernal solstice) with the sunshine hours being minimum during the year [176,177] in the northern hemisphere, at 9 am solar morning (thus, three hours before the solar noon). Figure 3 is another three-dimensional view for the two single-row 4.5 kWp PV systems together (the monofacial and the bifacial), focusing on the layout of the PV modules within each PV system. These views show how well optical effects are captured in Aladdin, such as the dynamic changes in the shadows, and the natural illumination by the sunlight and its visual reflection.
4. Benchmarking Simulation Cases
In this section, we provide comparisons of selected data, between those we computed based on Aladdin, and those published in an independent external study using a different simulation tool.
The benchmarking cases are divided into two categories, (1) monofacial PV system in Muscat (Oman), and (2) bifacial PV system in Manisa (Turkey).
4.1. Monofacial Benchmarking Simulation Parameters
The monofacial benchmarking case corresponds to the estimated electricity from a normalized capacity of 1 kWp per month, in Muscat. Thus, the metric being compared is the kWh/kWp/month for the 12 months of a typical year. In addition, the year-average AC monthly specific electric yield (in kWh/kWp/month) is also compared. When this year-average monthly quantity is multiplied by 12, it gives the annual kWh/kWp/year (thus, gives the estimated annual performance). The PV modules are tilted at a year-round optimized angle of 25°.
The external results are obtained using the PVGIS web simulation software, and the Energy3D desktop simulation software.
4.2. Monofacial Benchmarking Simulation Assessment
The comparison results for the normalized monthly electric yields are displayed in Figure 4. Although the monthly trends are not identical for the three software tools, the deviations are not large and thus are considered acceptable. Such deviations exist not only between our results and either the PVGIS results or the Energy3D results, but also between the PVGIS results and the Energy3D results. This is an inevitable characteristic in computational models [178,179], where differences in specific modeling assumptions, algorithms, and weather data lead to modeling results that are not identical.
The annual normalized electric yield (expressed in kWh/kWp/year) is compared in Figure 5, the deviations appear small, and the three sources of results favorably provide comparable values. This is considered successful validation for our predictions of monofacial photovoltaic performance using Aladdin.
4.3. Bifacial Benchmarking Simulation Parameters
The bifacial test case corresponds to a published simulation case for a bifacial photovoltaic (PV) system in Caferbey, Salihli, Manisa (Turkey) [180]. The external simulation was performed using the PVsyst modeling tool. The system had an AC-rated power of 30 kWac, and a peak DC power of 34 kWp. The PV modules had an optimum fixed tilt of 30°. The PV modules were disturbed in four rows.
Table 3 lists various characteristics of this benchmarking bifacial PV system. The peak power in our simulation is 34.2 kWp, which is close to the extremal value of 34.0 kWp, because we were not able to exactly achieve the published 34.0 kWp capacity. However, we were able to match the AC power rating (the rated inverter power) through slightly adjusting the DC-to-AC ratio.
Figure 6 is a two-dimensional view (top view) of the bifacial benchmarking system as we modeled it in Aladdin.
4.4. Bifacial Benchmarking Simulation Assessment
Table 4 compares our predicated annual electricity generation with the independent published results, for two albedo values. These albedo values are the same as the ones we adopt later for our 4.5 kWp bifacial PV system in the seven Omani cities (we refer to these subsequent cases as the “main simulations” to distinguish them from the present temporary “benchmarking simulations”). These selected albedo values are 0.30 (low albedo) and 0.65 (high albedo).
If our value is denoted by , and the external value is denoted by , then we compute the relative deviation between the two values as
This deviation is the signed difference between the two values (our value minus the external value) expressed as a percentage of the arithmetic mean of the two compared values.
It can be seen in the table that for either albedo, the magnitude of the relative deviation is small, below 0.5%, which supports the matching between our results and the external results.
Figure 7 visualizes a similar comparison between our results and the external results for the 30 kWac test bifacial PV system of Manisa, Turkey. However, instead of comparing the total annual electricity generated, we compare the normalized version of this (annual electricity normalized by the peak DC capacity), and this counterbalances the small difference between our peak DC capacity (34.2 kWp) and the external one (34.0 kWp). It can be seen that our normalized annual specific electric yields (in kWh/kWp/year) are also in good agreement with those belonging to the external independent simulations, with the magnitude of the percentage deviation limited below 1% for either albedo.
5. Main Results
After the validation analysis of our results through comparisons with independent sources for both monofacial photovoltaic (PV) modeling and bifacial PV modeling, we present in the current section the main results of this study. All these main simulations are related to comparing a 4.5 kWp monofacial PV system and a 4.5 kWp bifacial PV system in seven locations (seven cities) in Oman at two archetypal albedo values, with the purpose of quantifying the expected gain in electricity generation, thus the technical feasibility of using bifacial modules in lieu of monofacial ones. For monofacial modules, the effect of albedo is neglected. Whereas for bifacial modules, the albedo has a direct weakly nonlinear (thus, can be approximately as linear) influence on the electricity generation [181,182].
5.1. Selected Seven Omani Locations and Their Optimum PV Tilt Angles
In this subsection, we provide useful information about the seven Omani locations we selected for analysis. This information familiarizes the reader about these sites, and also helps in making the results reproducible. This information includes the geographic GPS (global positioning system) coordinates (displayed in two common formats for convenience) [183,184], and the optimum tilt angle as estimated by the PVGIS (Photovoltaic Geographical Information System) modeling tool [185].
The information about the seven selected Omani cities is listed in Table 5.
5.2. Gain in Annual Electric Yield with Bifacial Modules (Low and High Albedos)
In this subsection, we contrast our estimated annual specific electricity yields (in kWh/kWp/year) for the seven Omani locations under three conditions; namely:
(1) monofacial PV modules
(2) bifacial PV modules with a low ground albedo of 0.30
(3) bifacial PV modules with a high ground albedo of 0.65
The contrasted specific yields are visualized in Figure 8. With the exception of Khasab, the remaining six Omani locations have similar estimates. The city of Khasab in the northern tip of Oman has a slightly lower annual yield. This attribute of Khasab can be attributed to the relatively important horizon height there, affected by its terrain; where the Hajar Mountains fall steeply from heights near 2,000 m into the coast [186,187]; and this reduces the duration of available sunshine reaching the PV modules.
For the monofacial PV system, the annual specific electricity yield ranges from 1,633.1 kWh/kWp/year in Khasab to 1,868.8 kWh/kWp/year in Duqm. If the average of these seven diverse locations is taken as an approximate national average for Oman, then we get a national value of 1,821.6 kWh/kWp/year (or 4.99 kWh/kWp/day for a 365-day year).
For the bifacial PV system with the low albedo of 0.30, the annual specific electricity yield ranges from 1,747.4 kWh/kWp/year in Khasab to 1,999.6 kWh/kWp/year in Duqm. If the average of these seven diverse locations is taken as an approximate national average for Oman, then we get a national value of 1,949.1 kWh/kWp/year (or 5.34 kWh/kWp/day for a 365-day year).
Considering the increase from a national (Omani) average of 1,821.6 kWh/kWp/year to 1,949.1 kWh/kWp/year, the estimated national average approximated bifacial gain (ABG) in Oman at albedo 0.30 is 7.0%.
For the bifacial PV system with the high albedo of 0.65, the annual specific electricity yield ranges from 1,878.1 kWh/kWp/year in Khasab to 2,149.1 kWh/kWp/year in Duqm. If the average of these seven diverse locations is taken as an approximate national average for Oman, then we get a national value of 2,094.9 kWh/kWp/year (or 5.74 kWh/kWp/day for a 365-day year).
Considering the increase from a national (Omani) average of 1,821.6 kWh/kWp/year to 2,094.9 kWh/kWp/year, the estimated national average approximated bifacial gain (ABG) in Oman at albedo 0.65 is 15.0%.
Considering the increase from a national (Omani) average of 1,949.1 kWh/kWp/year to 2,094.9 kWh/kWp/year, the estimated increase in the electric generation from a bifacial PV system in Oman when the ground coverage is artificially whitened (causing an increase in ground albedo from 0.30 to 0.65) is 7.5%.
5.3. Monthly Electricity Generation with Monofacial PV Modules
In this subsection, we demonstrate the monthly specific electric yield (in kWh/kWp/month) for the seven Omani locations selected in our study with monofacial PV modules. The contrasted profiles of the monthly specific electric yields for these seven Omani locations are visualized in Figure 9.
If the average of the seven Omani cities selected here is taken as a representative national average for Oman, then these approximate national monthly (per-month) specific electric yields (with monofacial PV systems) are demonstrated in Table 6, with an overall average (averaged over the 12 months of the year) of 151.8 kWh/kWp/month. The month with the highest electricity generation is May, while the month with the lowest electricity generation is December. The observation that the month of highest photovoltaic electricity generation in Oman is May (rather than June or July, which are closer to the summer solstice) can be explained by a higher degree of particles (dust) in the atmosphere in the period of June-August, which tend to diffuse and disperse the incoming direct normal irradiance (DNI) [188,189]. Animated and historical aerosol data from NASA (United States National Aeronautics and Space Administration) supports the presence of this phenomenon in Oman in general [190,191,192].
For the southern city of Salalah, a noticeable decline in the electricity generation can be observed in the summer. This can be explained by the summer monsoon (locally in Oman called “Khareef” or “Al-Khareef” season) [193,194], where the rains obstruct the photovoltaic electricity generation. On the other hand, the rainy season in Khasab is in the winter, and this is consistent with the observed decline in the monthly electric yield during that period. The ability of Aladdin to capture these seasonal phenomena reflects the good meteorological data incorporated within it.
5.4. Monthly Electricity Generation with Bifacial Modules at Low Albedo 0.30
In this subsection, we demonstrate the monthly specific electric yield (in kWh/kWp/month) for the seven Omani locations selected in this study with bifacial PV modules and a low ground albedo of 0.30. The contrasted profiles of the monthly specific electric yield (for the seven Omani locations) are visualized in Figure 10.
If the average of the seven Omani cities selected here is taken as a representative national average for Oman, then this approximate national monthly (per-month) specific electric yield (with low-albedo bifacial PV systems; = 0.30) is demonstrated in Table 7, with an overall average (after the city-averaged monthly values are further averaged over the 12 months of the year) of 162.4 kWh/kWp/month. This is 7.0% above the monofacial overall average value of 151.8 kWh/kWp/month that we mentioned earlier.
Figure 11 shows the monthly variations of the approximated bifacial gain (ABG) for the seven selected cities in Oman. There is noticeable agreement among the seven locations, where the monthly ABG exhibits an increase in the summer, with a peak of about 9.5% observed in the month of June. In the winter, the ABG is nearly constant near a value of 6%.
5.5. Monthly Electricity Generation with Bifacial Modules at High Albedo 0.65
In this subsection, we demonstrate the monthly specific electric yield (in kWh/kWp/month) for the seven Omani locations selected in this study with bifacial PV modules and a high ground albedo of 0.65. The contrasted profiles of the monthly specific electric yield (for the seven Omani locations) are visualized in Figure 12.
If the average of the seven Omani cities selected here is taken as a representative national average for Oman, then this approximate national monthly (per-month) specific electric yield (with high-albedo bifacial PV systems; = 0.65) is demonstrated in Table 8, with an overall average (after the city-averaged monthly values are further averaged over the 12 months of the year) of 174.6 kWh/kWp/month. This is 15.0% above the monofacial overall average value of 151.8 kWh/kWp/month that we mentioned earlier, and 7.5% above the low-albedo ( = 0.30) bifacial PV systems overall average value of 162.4 kWh/kWp/month that we also mentioned earlier.
Figure 13 shows the monthly variations of the approximated bifacial gain (ABG) for the seven selected cities in Oman. Similar to the previously discussed case with a lower albedo of 0.30, there is still noticeable agreement among the seven Omani locations under the higher albedo of 0.65; where the monthly ABG exhibits an increase in the summer, with a peak of about 19% observed in the month of June. In the winter, the ABG is nearly constant near a value of 13%.
6. Conclusions
In the current study, we attempted to provide a data-driven systematic analysis of prospective gains in electricity generation in the Sultanate of Oman in general, and in seven selected Omani cities in particular, when the newer bifacial photovoltaic (PV) photovoltaic modules are compared with the older monofacial PV modules. This topic can be important for the Sultanate of Oman as it progresses through its ambitious energy transitioning plans from conventional fossil-based sources to renewable sources, especially solar energy which is abundant in the country. The study can benefit also institutions and individuals who aim to adopt solar photovoltaic power systems, at any scale. The study can benefit researchers, educators, and students seeking a free powerful computer-aided engineering (CAE) tool for sustainable buildings and renewable energy systems.
The following findings can be stated:
- Various simulation tools for photovoltaic (PV) systems may differ in their estimations based on internal assumptions and modeling algorithm, but we found general agreement among Aladdin, PVGIS, Energy3D, and PVsyst. However, the user’s customized parameters still can affect the estimations.
- The approximated bifacial gain (ABG) is proposed here as a new supplementary performance metric in addition to the conventional bifacial gain (BG).
- Bifacial photovoltaic modules are promising if the ground albedo is at least 0.30, where the electricity gain can reach 7%.
- Applying special ground covering or foundation coating for bifacial photovoltaic modules such that the ground albedo is artificially boosted to 0.65 can double the electricity generation gain compared to plain sandy lands, reaching about 15%.
- The solar power utilization in Oman is generally promising, even in regions with seasonal rains, such as the coastal city of Khasab in the north and the coastal city of Salalah in the south.
- The average daily alternating current (AC) electricity generation in Oman per unit kWp of DC peak capacity is about 5 kWh (monofacial PV systems), 5.3 kWh (bifacial PV systems with albedo 0.30), and 5.7 kWh (bifacial PV systems with albedo 0.65).
- The bifaciality gain in all the analyzed Omani cities here has a seasonal pattern, peaking in the summer (June), while dropping and nearly following a flat level in the winter months.
- We recommend installing bifacial PV modules if the additional expenses compared to monofacial modules are below 10%, where the extra cost can be justified with the anticipated electricity gain during the lifetime of the PV system, with little maintenance efforts and expenses to maintain a high ground albedo. Whereas if the cost differential exceeds 10%, then special care should be paid by installers and investors to the running cost of maintaining an artificially high ground albedo.
Funding
Not applicable (this research received no funding).
Data Availability Statement
The data supporting the findings of this study are available within the article.
Conflicts of Interest
Not applicable (this research was conducted in the absence of any commercial or financial relationships that cause a conflict of interest).
References
- ASTM International. ASTM │ Frequently Asked Questions. https://www.astm.org/faq (accessed 2025-04-24).
- Zhang, Z.; Crossland, A. F.; MacKenzie, R. C. I.; Groves, C. From Lab to Reality: How Non-AM1.5 Conditions Shape the Future of Perovskite and Organic Solar Cells. EES Sol. 2025, 1 (5), 748–761. [CrossRef]
- Badran, R.; Ismail, Y. Methodology to Validate Measured Performance and Warranty Conditions of PV Modules. Solar Energy 2025, 295, 113552. [CrossRef]
- Choi, U.-M. Study on Effect of Installation Location on Lifetime of PV Inverter and DC-to-AC Ratio. IEEE Access 2020, 8, 86003–86011. [CrossRef]
- Good, J.; Johnson, J. X. Impact of Inverter Loading Ratio on Solar Photovoltaic System Performance. Applied Energy 2016, 177, 475–486. [CrossRef]
- Nath, A.; Pal, A.; Ilango, G. S. Impact of Inverter DC to AC Ratio on Soiling Losses and Cleaning Intervals in Large Solar PV Plants. Solar Energy 2025, 300, 113825. [CrossRef]
- Martins Deschamps, E.; Rüther, R. Optimization of Inverter Loading Ratio for Grid Connected Photovoltaic Systems. Solar Energy 2019, 179, 106–118. [CrossRef]
- ASTM. ASTM G173-03(2020) │ Standard Tables for Reference Solar Spectral Irradiances: Direct Normal and Hemispherical on 37° Tilted Surface. https://www.astm.org/g0173-03r20.html (accessed 2025-03-03).
- Bücher, K. Site Dependence of the Energy Collection of PV Modules. Solar Energy Materials and Solar Cells 1997, 47 (1), 85–94. [CrossRef]
- Marzouk, O. A. A Flight-Mechanics Solver for Aircraft Inverse Simulations and Application to 3D Mirage-III Maneuver. Global Journal of Control Engineering and Technology 2015, 1, 14–26.
- Parida, B.; Iniyan, S.; Goic, R. A Review of Solar Photovoltaic Technologies. Renewable and Sustainable Energy Reviews 2011, 15 (3), 1625–1636. [CrossRef]
- Louwen, A.; van Sark, W. Chapter 5 - Photovoltaic Solar Energy. In Technological Learning in the Transition to a Low-Carbon Energy System; Junginger, M., Louwen, A., Eds.; Academic Press, 2020; pp 65–86. [CrossRef]
- Gharehpetian, G. B.; Agah, S. M. M. Distributed Generation Systems: Design, Operation and Grid Integration; Butterworth-Heinemann: Oxford, U.K., 2017.
- IEA, [International Energy Agency]. IEA │ Share of renewable electricity generation by technology, 2000-2030. IEA. https://www.iea.org/data-and-statistics/charts/share-of-renewable-electricity-generation-by-technology-2000-2030 (accessed 2025-07-01).
- IRENA, [International Renewable Energy Agency]. IRENA │ Electricity Capacity Trends. https://public.tableau.com/shared/YZDZRWHB4?:display_count=n&:showVizHome=no# (accessed 2025-02-23).
- Renew Economy. Solar is now being installed faster than any technology in history. https://reneweconomy.com.au/web-stories/solar-is-now-being-installed-faster-than-any-technology-in-history/ (accessed 2025-02-23).
- ANU, [Australian National University]. The fastest energy change in history still underway. ANU RE100 Group. https://re100.eng.anu.edu.au/2024/04/24/fastest-energy-change-article/ (accessed 2025-02-23).
- Becken, S.; Miller, G.; Lee, D. S.; Mackey, B. The Scientific Basis of ‘Net Zero Emissions’ and Its Diverging Sociopolitical Representation. Science of The Total Environment 2024, 918, 170725. [CrossRef]
- IEA, [International Energy Agency]. Tracking Clean Energy Progress 2023 (TCEP 2023). https://www.iea.org/reports/tracking-clean-energy-progress-2023 (accessed 2024-07-23).
- Breyer, C.; Bogdanov, D.; Gulagi, A.; Aghahosseini, A.; Barbosa, L. S. N. S.; Koskinen, O.; Barasa, M.; Caldera, U.; Afanasyeva, S.; Child, M.; Farfan, J.; Vainikka, P. On the Role of Solar Photovoltaics in Global Energy Transition Scenarios. Progress in Photovoltaics: Research and Applications 2017, 25 (8), 727–745. [CrossRef]
- Bosco, N. Turn Your Half-Cut Cells for a Stronger Module. IEEE Journal of Photovoltaics 2022, 12 (5), 1149–1153. [CrossRef]
- Waqar Akram, M.; Li, G.; Jin, Y.; Zhu, C.; Javaid, A.; Zuhaib Akram, M.; Usman Khan, M. Study of Manufacturing and Hotspot Formation in Cut Cell and Full Cell PV Modules. Solar Energy 2020, 203, 247–259. [CrossRef]
- Blakers, A. Development of the PERC Solar Cell. IEEE Journal of Photovoltaics 2019, 9 (3), 629–635. [CrossRef]
- Green, M. A. The Passivated Emitter and Rear Cell (PERC): From Conception to Mass Production. Solar Energy Materials and Solar Cells 2015, 143, 190–197. [CrossRef]
- Min, B.; Müller, M.; Wagner, H.; Fischer, G.; Brendel, R.; Altermatt, P. P.; Neuhaus, H. A Roadmap Toward 24% Efficient PERC Solar Cells in Industrial Mass Production. IEEE Journal of Photovoltaics 2017, 7 (6), 1541–1550. [CrossRef]
- Du, Y.; Dai, J.; Xin, S.; Ma, K.; Zhang, M.; Li, T.; Wang, L.; Jin, H.; Tao, W. Thermo-Mechanical Stress Modelling and Fracture Analysis on Ultra-Thin Silicon Solar Cell Based on Super Multi-Busbar PV Modules. Engineering Failure Analysis 2025, 169, 109153. [CrossRef]
- Walter, J.; Tranitz, M.; Volk, M.; Ebert, C.; Eitner, U. Multi-Wire Interconnection of Busbar-Free Solar Cells. Energy Procedia 2014, 55, 380–388. [CrossRef]
- Rendler, L. C.; Kraft, A.; Ebert, C.; Eitner, U.; Wiese, S. Mechanical Stress in Solar Cells with Multi Busbar Interconnection — Parameter Study by FEM Simulation. In 2016 17th International Conference on Thermal, Mechanical and Multi-Physics Simulation and Experiments in Microelectronics and Microsystems (EuroSimE); 2016; pp 1–5. [CrossRef]
- Yue, Q.; Liu, W.; Zhu, X. N-Type Molecular Photovoltaic Materials: Design Strategies and Device Applications. J. Am. Chem. Soc. 2020, 142 (27), 11613–11628. [CrossRef]
- Yu, B.; Song, D.; Sun, Z.; Liu, K.; Zhang, Y.; Rong, D.; Liu, L. A Study on Electrical Performance of N-Type Bifacial PV Modules. Solar Energy 2016, 137, 129–133. [CrossRef]
- Savin, H.; Repo, P.; von Gastrow, G.; Ortega, P.; Calle, E.; Garín, M.; Alcubilla, R. Black Silicon Solar Cells with Interdigitated Back-Contacts Achieve 22.1% Efficiency. Nature Nanotech 2015, 10 (7), 624–628. [CrossRef]
- Franklin, E.; Fong, K.; McIntosh, K.; Fell, A.; Blakers, A.; Kho, T.; Walter, D.; Wang, D.; Zin, N.; Stocks, M.; Wang, E.-C.; Grant, N.; Wan, Y.; Yang, Y.; Zhang, X.; Feng, Z.; Verlinden, P. J. Design, Fabrication and Characterisation of a 24.4% Efficient Interdigitated Back Contact Solar Cell. Progress in Photovoltaics: Research and Applications 2016, 24 (4), 411–427. [CrossRef]
- Yoshikawa, K.; Kawasaki, H.; Yoshida, W.; Irie, T.; Konishi, K.; Nakano, K.; Uto, T.; Adachi, D.; Kanematsu, M.; Uzu, H.; Yamamoto, K. Silicon Heterojunction Solar Cell with Interdigitated Back Contacts for a Photoconversion Efficiency over 26%. Nat Energy 2017, 2 (5), 1–8. [CrossRef]
- Kopecek, R.; Libal, J. Bifacial Photovoltaics 2021: Status, Opportunities and Challenges. Energies 2021, 14 (8), 2076. [CrossRef]
- Shen Liang, T.; Pravettoni, M.; Deline, C.; S. Stein, J.; Kopecek, R.; Prakash Singh, J.; Luo, W.; Wang, Y.; G. Aberle, A.; Sheng Khoo, Y. A Review of Crystalline Silicon Bifacial Photovoltaic Performance Characterisation and Simulation. Energy & Environmental Science 2019, 12 (1), 116–148. [CrossRef]
- Lorenzo, E. On the Historical Origins of Bifacial PV Modelling. Solar Energy 2021, 218, 587–595. [CrossRef]
- Alternergy. Bifacial Solar Panels: What are They and Are They Worth It? https://www.alternergy.co.uk/blog/post/bifacial-solar-panels-what-are-they (accessed 2025-02-23).
- Hwang, S.; Lee, H.; Kang, Y. Energy Yield Comparison between Monofacial Photovoltaic Modules with Monofacial and Bifacial Cells in a Carport. Energy Reports 2023, 9, 3148–3153. [CrossRef]
- Khan, M. R.; Hanna, A.; Sun, X.; Alam, M. A. Vertical Bifacial Solar Farms: Physics, Design, and Global Optimization. Applied Energy 2017, 206, 240–248. [CrossRef]
- Daliento, S.; De Riso, M.; Guerriero, P.; Matacena, I.; Dhimish, M.; d’Alessandro, V. On the Optimal Orientation of Bifacial Solar Modules. In 2024 International Symposium on Power Electronics, Electrical Drives, Automation and Motion (SPEEDAM); 2024; pp 396–400. [CrossRef]
- Stein, J.; Reise, C.; Castro, J. B.; Friesen, G.; Maugeri, G.; Urrejola, E.; Ranta, S. Bifacial Photovoltaic Modules and Systems: Experience and Results from International Research and Pilot Applications; SAND-2021-4835R; IEA-PVPS T13-14:2021; Sandia National Lab. (SNL-NM), Albuquerque, NM (United States); Fraunhofer ISE, Freiburg (Germany); Univ. of Applied Sciences and Arts of Southern Switzerland (SUPSI) (Switzerland); TUV Rheinland, Cologne (Germany); Ricerca sul Sistema Energetico (Italy); ATAMOSTEC (Chile); Turku University of Applied Sciences (Finland), 2021. [CrossRef]
- GVR, [Grand View Research, Inc. ]. Bifacial Solar Market Size, Share and Growth Report, 2030. https://www.grandviewresearch.com/industry-analysis/bifacial-solar-market-report (accessed 2025-02-23).
- MDF, [Market Data Forecast]. Bifacial Solar Market Size, Share, Trends & Growth, 2032. https://www.marketdataforecast.com/market-reports/bifacial-solar-market (accessed 2025-02-23).
- Ineichen, P.; Guisan, O.; Perez, R. Ground-Reflected Radiation and Albedo. Solar Energy 1990, 44 (4), 207–214. [CrossRef]
- Ångström, A. The Albedo of Various Surfaces of Ground. Geografiska Annaler 1925, 7 (4), 323–342. [CrossRef]
- Riedel-Lyngskær, N.; Ribaconka, M.; Pó, M.; Thorseth, A.; Thorsteinsson, S.; Dam-Hansen, C.; Jakobsen, M. L. The Effect of Spectral Albedo in Bifacial Photovoltaic Performance. Solar Energy 2022, 231, 921–935. [CrossRef]
- Russell, T. C. R.; Saive, R.; Augusto, A.; Bowden, S. G.; Atwater, H. A. The Influence of Spectral Albedo on Bifacial Solar Cells: A Theoretical and Experimental Study. IEEE Journal of Photovoltaics 2017, 7 (6), 1611–1618. [CrossRef]
- Marzouk, O. A.; Huckaby, E. D. New Weighted Sum of Gray Gases (WSGG) Models for Radiation Calculation in Carbon Capture Simulations: Evaluation and Different Implementation Techniques. In 7th U.S. National Technical Meeting of the Combustion Institute; Atlanta, Georgia, USA, 2011; Vol. 4, pp 2483–2496.
- Psiloglou, B. E.; Kambezidis, H. D. Estimation of the Ground Albedo for the Athens Area, Greece. Journal of Atmospheric and Solar-Terrestrial Physics 2009, 71 (8), 943–954. [CrossRef]
- Fritz, S. The Albedo of the Ground and Atmosphere. 1948. [CrossRef]
- Atak, E. E.; Elcioglu, E. B.; Ozyurt, T. O. Nanopatterned Silicon Photovoltaic Cells Optimized for Narrowband Selective Reflectivity; Begel House Inc., 2023. [CrossRef]
- Jiang, S.; Wang, G.; Hu, P.; Chen, Z.; Jia, L. The Design of Beam Splitter for Two-Stage Reflective Spectral Beam Splitting Concentrating PV/Thermal System. In 2011 Asia-Pacific Power and Energy Engineering Conference; 2011; pp 1–4. [CrossRef]
- Modest, M. F. Radiative Heat Transfer, 2nd ed.; Academic Press: Amsterdam Boston, 2003.
- Wall, T. F.; Becker, H. B. Total Absorptivities and Emissivities of Particulate Coal Ash From Spectral Band Emissivity Measurements. Journal of Engineering for Gas Turbines and Power 1984, 106 (4), 771–776. [CrossRef]
- Boyden, S. B.; Zhang, Y. Temperature and Wavelength-Dependent Spectral Absorptivities of Metallic Materials in the Infrared. Journal of Thermophysics and Heat Transfer 2006, 20 (1), 9–15. [CrossRef]
- Shayegan, K. J.; Hwang, J. S.; Zhao, B.; Raman, A. P.; Atwater, H. A. Broadband Nonreciprocal Thermal Emissivity and Absorptivity. Light Sci Appl 2024, 13 (1), 176. [CrossRef]
- Howell, J. R.; Mengüc, M. P.; Daun, K.; Siegel, R. Thermal Radiation Heat Transfer, 7th ed.; CRC Press: Boca Raton, 2020. [CrossRef]
- Howell, J. R.; Perlmutter, M. Directional Behavior of Emitted and Reflected Radiant Energy from a Specular, Gray, Asymmetric Groove; Technical Note NASA TN D-1874; NASA [United States National Aeronautics and Space Administration]: Cleveland, Ohio, 1963. https://books.google.com.om/books?id=e8x3rqdSt3QC.
- Zhou, L.; Dickinson, R. E.; Tian, Y.; Zeng, X.; Dai, Y.; Yang, Z.-L.; Schaaf, C. B.; Gao, F.; Jin, Y.; Strahler, A.; Myneni, R. B.; Yu, H.; Wu, W.; Shaikh, M. Comparison of Seasonal and Spatial Variations of Albedos from Moderate-Resolution Imaging Spectroradiometer (MODIS) and Common Land Model. Journal of Geophysical Research: Atmospheres 2003, 108 (D15). [CrossRef]
- Brest, C. L. Seasonal Albedo of an Urban/Rural Landscape from Satellite Observations. 1987, 26 (9), 1169–1187. [CrossRef]
- Wang, S.; Davidson, A. Impact of Climate Variations on Surface Albedo of a Temperate Grassland. Agricultural and Forest Meteorology 2007, 142 (2), 133–142. [CrossRef]
- Maxwell, T. M.; Germino, M. J.; Romero, S.; Porensky, L. M.; Blumenthal, D. M.; Brown, C. S.; Adler, P. B. Experimental Manipulation of Soil-Surface Albedo Alters Phenology and Growth of Bromus Tectorum (Cheatgrass). Plant Soil 2023, 487 (1), 325–339. [CrossRef]
- Song, B.; Park, K. Contribution of Greening and High-Albedo Coatings to Improvements in the Thermal Environment in Complex Urban Areas. Advances in Meteorology 2015, 2015 (1), 792172. [CrossRef]
- Gul, M.; Kotak, Y.; Muneer, T.; Ivanova, S. Enhancement of Albedo for Solar Energy Gain with Particular Emphasis on Overcast Skies. Energies 2018, 11 (11), 2881. [CrossRef]
- Sellers, W. D. Physical Climatology; University of Chicago Press: Chicago, Illinois, USA, 1965.
- Xiao, B.; Bowker, M. A. Moss-Biocrusts Strongly Decrease Soil Surface Albedo, Altering Land-Surface Energy Balance in a Dryland Ecosystem. Science of The Total Environment 2020, 741, 140425. [CrossRef]
- Alam, M.; Gul, M. S.; Muneer, T. Performance Analysis and Comparison between Bifacial and Monofacial Solar Photovoltaic at Various Ground Albedo Conditions. Renewable Energy Focus 2023, 44, 295–316. [CrossRef]
- Dickinson, R. E.; Hanson, B. Vegetation-Albedo Feedbacks. In Climate Processes and Climate Sensitivity; American Geophysical Union (AGU), 1984; pp 180–186. [CrossRef]
- Schwaiger, H. P.; Bird, D. N. Integration of Albedo Effects Caused by Land Use Change into the Climate Balance: Should We Still Account in Greenhouse Gas Units? Forest Ecology and Management 2010, 260 (3), 278–286. [CrossRef]
- Shoukry, I.; Libal, J.; Kopecek, R.; Wefringhaus, E.; Werner, J. Modelling of Bifacial Gain for Stand-Alone and in-Field Installed Bifacial PV Modules. Energy Procedia 2016, 92, 600–608. [CrossRef]
- Johnson, J.; Manikandan, S. Experimental Study and Model Development of Bifacial Photovoltaic Power Plants for Indian Climatic Zones. Energy 2023, 284, 128693. [CrossRef]
- Sen, S.; Roesler, J.; King, D. Albedo Estimation of Finite-Sized Concrete Specimens. Journal of Testing and Evaluation 2019, 47 (2), 738–757. [CrossRef]
- Trina Solar. Vertex Bifacial Dual Glass Monocrystalline Module; Datasheet TSM_EN_2022_A; LG Electronics Inc.: Changzhou, Jiangsu Province, China, 2022. https://static.trinasolar.com/sites/default/files/Datasheet_Vertex_DEG21C.20_EN_2022_A_0.pdf (accessed 2025-02-23).
- Adani Solar. Adani Solar ELAN PRIDE Series MBB P-Type PERC Half-Cut Bifacial PV Modules; Datasheet; India, 2025; pp 1–2. https://www.adanisolar.com/-/media/Project/AdaniSolar/Downloads/pdf/newdatasheet1/Pride-G2G-modules.pdf (accessed 2025-02-23).
- Abe, C. F.; Batista Dias, J.; Notton, G.; Faggianelli, G.-A.; Pigelet, G.; Ouvrard, D. Estimation of the Effective Irradiance and Bifacial Gain for PV Arrays Using the Maximum Power Current. IEEE Journal of Photovoltaics 2023, 13 (3), 432–441. [CrossRef]
- Kreinin, L.; Karsenty, A.; Grobgeld, D.; Eisenberg, N. PV Systems Based on Bifacial Modules: Performance Simulation vs. Design Factors. In 2016 IEEE 43rd Photovoltaic Specialists Conference (PVSC); 2016; pp 2688–2691. [CrossRef]
- Sahu, P. K.; Batzelis, E. I.; Roy, J. N.; Chakraborty, C. Irradiance Effect on the Bifaciality Factors of Bifacial PV Modules. In 2022 IEEE 1st Industrial Electronics Society Annual On-Line Conference (ONCON); 2022; pp 1–6. [CrossRef]
- Hwang, S.; Lee, H.; Kang, Y. Bifacial Module Characterization Analysis with Current Mismatched PERC Cells. J. Korean Phys. Soc. 2024, 84 (2), 145–150. [CrossRef]
- SunSolve. SunSolveTM - When Accuracy Matters. https://sunsolve.info (accessed 2025-02-24).
- Raina, G.; Sinha, S. A Simulation Study to Evaluate and Compare Monofacial Vs Bifacial PERC PV Cells and the Effect of Albedo on Bifacial Performance. Materials Today: Proceedings 2021, 46, 5242–5247. [CrossRef]
- PVsyst. PVsyst documentation - References. https://www.pvsyst.com/help/references.html (accessed 2025-02-23).
- PVsyst. PVsyst documentation - Overview. https://www.pvsyst.com/help/ (accessed 2025-02-23).
- PVsyst. PVsyst │ Shop. https://www.pvsyst.com/shop-prices (accessed 2025-02-23).
- Su, X.; Luo, C.; Chen, X.; Ji, J.; Yu, Y.; Wu, Y.; Zou, W. Numerical Modeling of All-Day Albedo Variation for Bifacial PV Systems on Rooftops and Annual Yield Prediction in Beijing. Build. Simul. 2024, 17 (6), 955–964. [CrossRef]
- Malik, A. S. Sustainable and Efficient Electricity Tariffs – A Case Study of Oman. Saudi J. Eng. Technol. 2022, 7 (3), 118–127. [CrossRef]
- Marzouk, O. A. Multi-Physics Mathematical Model of Weakly-Ionized Plasma Flows. American Journal of Modern Physics 2018, 7 (2), 87–102. [CrossRef]
- OPWP, [Oman Power and Water Procurement Company]. OPWP’s 7-YEAR STATEMENT (2021 – 2027) (Issue 15); OPWP [Oman Power and Water Procurement Company]: Muscat, Sultanate of Oman, 2022. https://omanpwp.om/PDFAR/7%20Year%20Statement%20Issue%2015%202021%20-%202027.pdf (accessed 2022-09-12).
- Marzouk, O. A. Combined Oxy-Fuel Magnetohydrodynamic Power Cycle. In Conference on Energy Challenges in Oman (ECO’2015); DU [Dhofar University]: Salalah, Dhofar, Oman, 2015.
- Marzouk, O. A. Cantera-Based Python Computer Program for Solving Steam Power Cycles with Superheating. International Journal of Emerging Technology and Advanced Engineering 2023, 13 (3), 63–73.
- IEA, [International Energy Agency]. Oman’s fossil fuel expertise could help drive clean energy transitions, new report shows - News. https://www.iea.org/news/oman-s-fossil-fuel-expertise-could-help-drive-clean-energy-transitions-new-report-shows (accessed 2025-03-06).
- Om2040U, [Oman Vision 2040 Implementation Follow-up Unit]. Oman 2040 Vision Document; Om2040U [Oman Vision 2040 Implementation Follow-up Unit]: Muscat, Sultanate of Oman, 2020. https://www.oman2040.om/VisionDocument?lang=en (accessed 2023-10-06).
- Marzouk, O. A. In the Aftermath of Oil Prices Fall of 2014/2015–Socioeconomic Facts and Changes in the Public Policies in the Sultanate of Oman. International Journal of Management and Economics Invention 2017, 3 (11), 1463–1479. [CrossRef]
- Birks, J. S.; Sinclair, C. A. Successful Education and Human Resource Development - The Key to Sustained Economic Growth*. In Oman: Economic, Social and Strategic Developments; Pridham, B. R., Ed.; Routledge: London, UK, 1987.
- Marzouk, O. A. Utilizing Co-Curricular Programs to Develop Student Civic Engagement and Leadership. The Journal of the World Universities Forum 2008, 1 (5), 87–100. [CrossRef]
- Marzouk, O. A. English Programs for Non-English Speaking College Students. In 1st Knowledge Globalization Conference 2008 (KGLOBAL 2008); Sawyer Business School, Suffolk University: Boston, Massachusetts, USA, 2008; pp 1–8.
- Yahia, H. A. M.; Al-Shukaili, A. M.; Manchiryal, R. K.; Eissa, T.; Mohammed, A. A. Strategic Planning for the Development of Smart Cities in Oman. In The Emerald Handbook of Smart Cities in the Gulf Region: Innovation, Development, Transformation, and Prosperity for Vision 2040; Lytras, M. D., Alkhaldi, A., Malik, S., Eds.; Emerald Publishing Limited: Leeds, England, UK, 2024; pp 289–304. [CrossRef]
- Om2040U, [Oman Vision 2040 Implementation Follow-up Unit]. Oman Vision 2040 │ Follow-up System. https://www.oman2040.om/organization?lang=en (accessed 2024-07-30).
- Al Farsi, W. A.; Achuthan, G. Analysis of Effectiveness of Smart City Implementation in Transportation Sector in Oman. In 2018 Majan International Conference (MIC); 2018; pp 1–6. [CrossRef]
- Marzouk, O. A. Recommended LEED-Compliant Cars, SUVs, Vans, Pickup Trucks, Station Wagons, and Two Seaters for Smart Cities Based on the Environmental Damage Index (EDX) and Green Score. In Innovations in Smart Cities Applications Volume 7; Ben Ahmed, M., Boudhir, A. A., El Meouche, R., Karaș, İ. R., Eds.; Lecture Notes in Networks and Systems; Springer Nature Switzerland: Cham, Switzerland, 2024; Vol. 906, pp 123–135. [CrossRef]
- Brebbia, C. A.; Longhurst, J.; Marco, E.; Booth, C. Sustainable Development and Planning IX; WIT Press: Southampton, UK, 2017.
- Scholz, W.; Langer, S. Spatial Development of Muscat/Oman and Challenges of Public Transport. In Gulf Research Meeting 2016; Future Cities Laboratory Singapore; ETH Zurich: Cambridge, UK, 2019; pp 40–67. [CrossRef]
- Al-Kalbani, M. S.; Price, M. F.; O’Higgins, T.; Ahmed, M.; Abahussain, A. Integrated Environmental Assessment to Explore Water Resources Management in Al Jabal Al Akhdar, Sultanate of Oman. Reg Environ Change 2016, 16 (5), 1345–1361. [CrossRef]
- Al-Ismaily, H. A.; Probert, D. Photovoltaic Electricity Prospects in Oman. Applied Energy 1998, 59 (2), 97–124. [CrossRef]
- Marzouk, O. A. Benchmarking the Trends of Urbanization in the Gulf Cooperation Council: Outlook to 2050. In 1st National Symposium on Emerging Trends in Engineering and Management (NSETEM’2017); WCAS [Waljat College of Applied Sciences], Muscat, Oman, 2017; pp 1–9.
- MEM, [Ministry of Energy and Minerals in the Sultanate of Oman]. MEM │ Green Hydrogen in Oman; Public Announcement; MEM [Ministry of Energy and Minerals in the Sultanate of Oman]: Muscat, Sultanate of Oman, 2022; pp 1–15. https://hydrom.om/events/hydromlaunch/221023_MEM_En.pdf (accessed 2023-10-06).
- Hydrom, [Hydrogen Oman]. About Us (Hydrom : Hydrogen Oman). https://hydrom.om/Hydrom.aspx?cms=iQRpheuphYtJ6pyXUGiNqiQQw2RhEtKe#about (accessed 2024-07-30).
- Zghaibeh, M.; Barhoumi, E. M.; Okonkwo, P. C.; Ben Belgacem, I.; Beitelmal, W. H.; Mansir, I. B. Analytical Model for a Techno-Economic Assessment of Green Hydrogen Production in Photovoltaic Power Station Case Study Salalah City-Oman. International Journal of Hydrogen Energy 2022, 47 (31), 14171–14179. [CrossRef]
- Wang, J.; Wen, J.; Wang, J.; Yang, B.; Jiang, L. Water Electrolyzer Operation Scheduling for Green Hydrogen Production: A Review. Renewable and Sustainable Energy Reviews 2024, 203, 114779. [CrossRef]
- Zhou, H.; Xue, J.; Gao, H.; Ma, N. Hydrogen-Fueled Gas Turbines in Future Energy System. International Journal of Hydrogen Energy 2024, 64, 569–582. [CrossRef]
- Marzouk, O. A. Validating a Model for Bluff-Body Burners Using the HM1 Turbulent Nonpremixed Flame. Journal of Advanced Thermal Science Research 2016, 3 (1), 12–23. [CrossRef]
- Mariyam, S.; Alherbawi, M.; McKay, G.; Al-Ansari, T. Converting Waste into Sustainable Aviation Fuel (SAF): A Systematic Literature Review. Renewable and Sustainable Energy Reviews 2026, 226, 116380. [CrossRef]
- Zhang, W.; Zhao, Z.; Li, C.; Yang, J.; Qin, Q. Evaluation of Sustainable Aviation Fuel Based on Life Cycle Prediction Model. Resources, Conservation and Recycling 2026, 224, 108565. [CrossRef]
- Lau, J. I. C.; Wang, Y. S.; Ang, T.; Seo, J. C. F.; Khadaroo, S. N. B. A.; Chew, J. J.; Ng Kay Lup, A.; Sunarso, J. Emerging Technologies, Policies and Challenges toward Implementing Sustainable Aviation Fuel (SAF). Biomass and Bioenergy 2024, 186, 107277. [CrossRef]
- Fasihi, M.; Breyer, C. Global Production Potential of Green Methanol Based on Variable Renewable Electricity. Energy & Environmental Science 2024, 17 (10), 3503–3522. [CrossRef]
- Kang, S.; Pan, Z.; Guo, J.; Zhou, Y.; Wang, J.; Fan, L.; Zheng, C.; Cha, S. W.; Zhong, Z. Scientometric Analysis of Research Trends on Solid Oxide Electrolysis Cells for Green Hydrogen and Syngas Production. Front. Energy 2024, 18 (5), 583–611. [CrossRef]
- Bora, N.; Kumar Singh, A.; Pal, P.; Kumar Sahoo, U.; Seth, D.; Rathore, D.; Bhadra, S.; Sevda, S.; Venkatramanan, V.; Prasad, S.; Singh, A.; Kataki, R.; Kumar Sarangi, P. Green Ammonia Production: Process Technologies and Challenges. Fuel 2024, 369, 131808. [CrossRef]
- Salman, H. Buraimi Dispute. In Global Encyclopedia of Territorial Rights; Gray, K. W., Ed.; Springer International Publishing: Cham, 2020; pp 1–11. [CrossRef]
- OQ8, [Duqm Refinery and Petrochemical Industries Company]. About Duqm. https://www.oq8.om/about-oq8/about-duqm (accessed 2024-08-06).
- Al Farsi, A.; Dhanalekshmi, U. M.; Alam, T.; Althani, G. S.; Al-Ruqaishi, H. K.; Khan, S. A. Chemical Profiling and In Vitro Biological Evaluation of the Essential Oil of Caralluma Arabica from IBRI, Oman. Chem Nat Compd 2023, 59 (3), 594–596. [CrossRef]
- Accessibility To The Historic Defence Sites Of Oman For People With Mobility Impairment: The Cases Of The Nakhal, Al Hazm And Khasab Fortifications.
- Benz, M. Musandam and Its Trade with Iran. Regional Linkages Across the Strait of Hormuz. In Regionalizing Oman: Political, Economic and Social Dynamics; Wippel, S., Ed.; Springer Netherlands: Dordrecht, 2013; pp 205–216. [CrossRef]
- Nebel, S.; Richthofen, A. von. Urban Oman: Trends and Perspectives of Urbanisation in Muscat Capital Area; LIT Verlag Münster, 2016.
- Prathapar, S. A.; Khan, M.; Mbaga, M. D. The Potential of Transforming Salalah into Oman’s Vegetables Basket. In Environmental Cost and Face of Agriculture in the Gulf Cooperation Council Countries; Shahid, S. A., Ahmed, M., Eds.; Springer International Publishing: Cham, 2014; pp 83–94. [CrossRef]
- Kazem, H. A.; Khatib, T. Techno-Economical Assessment of Grid Connected Photovoltaic Power Systems Productivity in Sohar, Oman. Sustainable Energy Technologies and Assessments 2013, 3, 61–65. [CrossRef]
- Madayn. Suhar Industrial City. https://www.madayn.om/EN/Pages/Sohar.aspx (accessed 2025-02-26).
- Freezone, S. P. and. Sohar Port and Freezone. http://www.soharportandfreezone.com (accessed 2025-02-26).
- Suhar Airport. Tourism Guide Clone - Suhar Airport. https://www.suharairport.co.om/content/tourism-guide-clone (accessed 2025-02-26).
- Al Fazari, H. Higher Education in the Arab World: Research and Development from the Perspective of Oman and Sohar University. In Higher Education in the Arab World: Research and Development; Badran, A., Baydoun, E., Hillman, J. R., Eds.; Springer International Publishing: Cham, 2022; pp 259–274. [CrossRef]
- Mesa-Jiménez, J. J.; Tzianoumis, A. L.; Stokes, L.; Yang, Q.; Livina, V. N. Long-Term Wind and Solar Energy Generation Forecasts, and Optimisation of Power Purchase Agreements. Energy Reports 2023, 9, 292–302. [CrossRef]
- Marzouk, O. A. Changes in Fluctuation Waves in Coherent Airflow Structures with Input Perturbation. WSEAS Transactions on Signal Processing 2008, 4 (10), 604–614.
- Marzouk, O. A. Directivity and Noise Propagation for Supersonic Free Jets. In 46th AIAA Aerospace Sciences Meeting and Exhibit; AIAA [American Institute of Aeronautics and Astronautics]: Reno, Nevada, USA, 2008; p AIAA 2008-23. [CrossRef]
- Marzouk, O. A. Accurate Prediction of Noise Generation and Propagation. In 18th Engineering Mechanics Division Conference of the American Society of Civil Engineers (ASCE-EMD); Zenodo: Blacksburg, Virginia, USA, 2007; pp 1–6.
- Dupraz, C. Assessment of the Ground Coverage Ratio of Agrivoltaic Systems as a Proxy for Potential Crop Productivity. Agroforest Syst 2024, 98 (8), 2679–2696. [CrossRef]
- Marzouk, O. A.; Nayfeh, A. H. Detailed Characteristics of the Resonating and Non-Resonating Flows Past a Moving Cylinder. In 49th AIAA/ASME/ASCE/AHS/ASC Structures, Structural Dynamics, and Materials Conference; AIAA [American Institute of Aeronautics and Astronautics]: Schaumburg, Illinois, USA, 2008; p AIAA 2008-2311. [CrossRef]
- Marzouk, O. A.; Nayfeh, A. H. Simulation, Analysis, and Explanation of the Lift Suppression and Break of 2:1 Force Coupling Due to in-Line Structural Vibration. In 49th AIAA/ASME/ASCE/AHS/ASC Structures, Structural Dynamics, and Materials Conference; AIAA [American Institute of Aeronautics and Astronautics]: Schaumburg, Illinois, USA, 2008; p AIAA 2008-2309. [CrossRef]
- Marzouk, O. A. Investigation of Strouhal Number Effect on Acoustic Fields. In 22nd National Conference on Noise Control Engineering (NOISE-CON 2007); INCE [Institute of Noise Control Engineering]: Reno, Nevada, USA, 2007; pp 1056–1067.
- Marzouk, O. A. Noise Emissions from Excited Jets. In 22nd National Conference on Noise Control Engineering (NOISE-CON 2007); INCE [Institute of Noise Control Engineering]: Reno, Nevada, USA, 2007; pp 1034–1045.
- Shen, W.; Chen, X.; Qiu, J.; Hayward, J. A.; Sayeef, S.; Osman, P.; Meng, K.; Dong, Z. Y. A Comprehensive Review of Variable Renewable Energy Levelized Cost of Electricity. Renewable and Sustainable Energy Reviews 2020, 133, 110301. [CrossRef]
- Rana, G. S.; Jindal, R. Factors Affecting Solar Levelized Cost of Electricity in India & Policy Recommendations. Energy and Climate Change 2025, 6, 100207. [CrossRef]
- Kessler, W. Comparing Energy Payback and Simple Payback Period for Solar Photovoltaic Systems. E3S Web Conf. 2017, 22, 00080. [CrossRef]
- Czipf, C. The Impact of Changing Energy Prices, Interest Rates, and Investment Costs on the Net Present Value and Internal Rate of Return for Alternative Energy Projects. Discov Sustain 2025, 6 (1), 161. [CrossRef]
- Hartman, J. C.; Schafrick, I. C. The Relevant Internal Rate of Return. The Engineering Economist 2004, 49 (2), 139–158. [CrossRef]
- Bae, G.; Yoon, A.; Kim, S. Incentive Determination for Demand Response Considering Internal Rate of Return. Energies 2024, 17 (22), 5660. [CrossRef]
- Gallo, A. A Refresher on Net Present Value. Harvard Business Review. November 19, 2014, pp 1–3.
- Rostami, S.; Creemers, S.; Leus, R. Maximizing the Net Present Value of a Project under Uncertainty: Activity Delays and Dynamic Policies. European Journal of Operational Research 2024, 317 (1), 16–24. [CrossRef]
- Alsadi, S.; Khatib, T. Photovoltaic Power Systems Optimization Research Status: A Review of Criteria, Constrains, Models, Techniques, and Software Tools. Applied Sciences 2018, 8 (10), 1761. [CrossRef]
- Marzouk, O. A. Thermo Physical Chemical Properties of Fluids Using the Free NIST Chemistry WebBook Database. Fluid Mechanics Research International Journal 2017, 1 (1). [CrossRef]
- Marzouk, O. A. Airfoil Design Using Genetic Algorithms. In The 2007 International Conference on Scientific Computing (CSC’07), The 2007 World Congress in Computer Science, Computer Engineering, and Applied Computing (WORLDCOMP’07); CSREA Press: Las Vegas, Nevada, USA, 2007; pp 127–132.
- Valko, N. V.; Kushnir, N. O.; Osadchyi, V. V. Cloud Technologies for STEM Education; [б. в.], 2020. [CrossRef]
- Chu, W. W.; Hafiz, N. R. M.; Mohamad, U. A.; Ashamuddin, H.; Tho, S. W. A Review of STEM Education with the Support of Visualizing Its Structure through the CiteSpace Software. Int J Technol Des Educ 2023, 33 (1), 39–61. [CrossRef]
- Xie, C.; Ding, X.; Jiang, R. Using Computer Graphics to Make Science Visible in Engineering Education. IEEE Computer Graphics and Applications 2023, 43 (5), 99–106. [CrossRef]
- IFI, [Institute for Future Intelligence, Inc. ]. Institute for Future Intelligence │ Journal Papers. https://www.intofuture.org/journals.html (accessed 2025-03-01).
- Xie, C.; Schimpf, C.; Chao, J.; Nourian, S.; Massicotte, J. Learning and Teaching Engineering Design through Modeling and Simulation on a CAD Platform. Comp Applic In Engineering 2018, 26 (4), 824–840. [CrossRef]
- Ukoima, K. N.; Efughu, D.; Azubuike, O. C.; Akpiri, B. F. Investigating the Optimal Photovoltaic (PV) Tilt Angle Using the Photovoltaic Geographic Information System (PVGIS). Nigerian Journal of Technology 2024, 43 (1), 101–114. [CrossRef]
- EC, [European Commission]. PVGIS │ User Manual. https://joint-research-centre.ec.europa.eu/photovoltaic-geographical-information-system-pvgis/getting-started-pvgis/pvgis-user-manual_en (accessed 2025-03-01).
- Psomopoulos, C. S.; Ioannidis, G. Ch.; Kaminaris, S. D.; Mardikis, K. D.; Katsikas, N. G. A Comparative Evaluation of Photovoltaic Electricity Production Assessment Software (PVGIS, PVWatts and RETScreen). Environ. Process. 2015, 2 (1), 175–189. [CrossRef]
- Sauer, K. J.; Roessler, T.; Hansen, C. W. Modeling the Irradiance and Temperature Dependence of Photovoltaic Modules in PVsyst. IEEE Journal of Photovoltaics 2015, 5 (1), 152–158. [CrossRef]
- Yadav, P.; Kumar, N.; Chandel, S. S. Simulation and Performance Analysis of a 1kWp Photovoltaic System Using PVsyst. In 2015 International Conference on Computation of Power, Energy, Information and Communication (ICCPEIC); 2015; pp 0358–0363. [CrossRef]
- Kandasamy, C. P.; Prabu, P.; Niruba, K. Solar Potential Assessment Using PVSYST Software. In 2013 International Conference on Green Computing, Communication and Conservation of Energy (ICGCE); 2013; pp 667–672. [CrossRef]
- Deniz, M. Analysis of Accessibility to Public Schools with GIS: A Case Study of Salihli City (Turkey). Children’s Geographies 2024, 22 (1), 30–51. [CrossRef]
- Özen, T.; Bülbül, A.; Tarcan, G. Reservoir and Hydrogeochemical Characterizations of Geothermal Fields in Salihli, Turkey. Journal of Asian Earth Sciences 2012, 60, 1–17. [CrossRef]
- Ozgener, L.; Hepbasli, A.; Dincer, I. Energy and Exergy Analysis of Salihli Geothermal District Heating System in Manisa, Turkey. International Journal of Energy Research 2005, 29 (5), 393–408. [CrossRef]
- JinkoSolar. Case Study │ Witznitz Energy Park 650 MW, Germany. https://jinkosolar.eu/case-study/witznitz-energy-park-650-mw-germany (accessed 2025-03-04).
- Smith, B.; Woodhouse, M.; Feldman, D.; Margolis, R. Solar Photovoltaic (PV) Manufacturing Expansions in the United States, 2017-2019: Motives, Challenges, Opportunities, and Policy Context; Technical Report NREL/TP-6A20-74807; NREL [United States National Renewable Energy Laboratory]: Golden, Colorado, USA, 2021. [CrossRef]
- Rowlands, I. H.; Kemery, B. P.; Beausoleil-Morrison, I. Optimal Solar-PV Tilt Angle and Azimuth: An Ontario (Canada) Case-Study. Energy Policy 2011, 39 (3), 1397–1409. [CrossRef]
- Etukudor, C.; Orovwode, H.; Wara, S.; Agbetuyi, F.; Adozhe, A.; Obieje, B. O.; Oparaocha, C. N. Optimum Tilt and Azimuth Angles for Solar Photovoltaic Systems in South-West Nigeria. In 2018 IEEE PES/IAS PowerAfrica; 2018; pp 348–353. [CrossRef]
- Brecl, K.; Topič, M. Self-Shading Losses of Fixed Free-Standing PV Arrays. Renewable Energy 2011, 36 (11), 3211–3216. [CrossRef]
- Nicolás-Martín, C.; Eleftheriadis, P.; Santos-Martín, D. Validation and Self-Shading Enhancement for SoL: A Photovoltaic Estimation Model. Solar Energy 2020, 202, 386–408. [CrossRef]
- Flores-Hernández, D. A.; Palomino-Resendiz, S.; Lozada-Castillo, N.; Luviano-Juárez, A.; Chairez, I. Mechatronic Design and Implementation of a Two Axes Sun Tracking Photovoltaic System Driven by a Robotic Sensor. Mechatronics 2017, 47, 148–159. [CrossRef]
- Salgado-Conrado, L.; Lopez-Montelongo, A.; Alvarez-Macias, C.; Hernadez-Jaquez, J. Review of Heliodon Developments and Computational Tools for Building Shadow Analysis. Buildings 2022, 12 (5), 627. [CrossRef]
- Mikhael, M. G.; Metwaly, M. A Simple Heliodon System for Horizontal Placed Models. Journal of Contemporary Urban Affairs 2017, 1 (3), 54–61. [CrossRef]
- Pinker, R. T.; Militana, L. M. The Asymmetry of Global Solar Radiation Around Solar Noon. 1988.
- Pereira, A. B.; Villa Nova, N. A.; Galvani, E. Estimation of Global Solar Radiation Flux Density in Brazil from a Single Measurement at Solar Noon. Biosystems Engineering 2003, 86 (1), 27–34. [CrossRef]
- Chippindale, C. Stoned Henge: Events and Issues at the Summer Solstice, 1985. World Archaeology 1986, 18 (1), 38–58. [CrossRef]
- Sojka, J. J.; Schunk, R. W. A Theoretical Study of the Global F Region for June Solstice, Solar Maximum, and Low Magnetic Activity. Journal of Geophysical Research: Space Physics 1985, 90 (A6), 5285–5298. [CrossRef]
- Myrabø, H. K. Temperature Variation at Mesopause Levels during Winter Solstice at 78°N. Planetary and Space Science 1984, 32 (2), 249–255. [CrossRef]
- Trolle, A. K. Winter Solstice Celebrations in Denmark: A Growing Non-Religious Ritualisation. Religions 2021, 12 (2), 74. [CrossRef]
- Borfecchia, F.; Caiaffa, E.; Pollino, M.; De Cecco, L.; Martini, S.; La Porta, L.; Marucci, A. Remote Sensing and GIS in Planning Photovoltaic Potential of Urban Areas. European Journal of Remote Sensing 2014, 47 (1), 195–216. [CrossRef]
- Gawley, D.; McKenzie, P. Investigating the Suitability of GIS and Remotely-Sensed Datasets for Photovoltaic Modelling on Building Rooftops. Energy and Buildings 2022, 265, 112083. [CrossRef]
- Türkdoğru, E.; Kutay, M. Analysis of Albedo Effect in a 30-kW Bifacial PV System with Different Ground Surfaces Using PVsyst Software. Journal of Energy Systems 2022, 6 (4), 543–559. [CrossRef]
- Ganesan, K.; Winston, D. P.; Sugumar, S.; Jegan, S. Performance Analysis of N-Type PERT Bifacial Solar PV Module under Diverse Albedo Conditions. Solar Energy 2023, 252, 81–90. [CrossRef]
- Ghenai, C.; Ahmad, F. F.; Rejeb, O.; Bettayeb, M. Artificial Neural Networks for Power Output Forecasting from Bifacial Solar PV System with Enhanced Building Roof Surface Albedo. Journal of Building Engineering 2022, 56, 104799. [CrossRef]
- Unxos GmbH. GeoNames - geographical database. https://www.geonames.org/advanced-search.html (accessed 2021-09-22).
- Öçal, M. F.; Şimşek, M.; Kapucu, S. Measuring the Height of a Flag Pole Using Smartphone GPS and Orientation Sensors. PRIMUS 2021, 31 (9), 1007–1019. [CrossRef]
- EC, [European Commission]. PVGIS │ Data sources and calculation methods. https://joint-research-centre.ec.europa.eu/photovoltaic-geographical-information-system-pvgis/getting-started-pvgis/pvgis-data-sources-calculation-methods_en (accessed 2025-03-03).
- OPG, [Oman Pocket Guide]. Khasab, Musandam. https://omanpocketguide.com/khasab-musandam (accessed 2025-03-03).
- Searle, M. Musandam Peninsula and Straits of Hormuz. In Geology of the Oman Mountains, Eastern Arabia; Searle, M., Ed.; Springer International Publishing: Cham, 2019; pp 129–146. [CrossRef]
- OPWP, [Oman Power and Water Procurement Company]. Solar Data - Weather Impact Analysis; OPWP [Oman Power and Water Procurement Company]: Muscat, Oman, 2013. https://omanpwp.om/PDF/Solar%20Data%20-%20Weather%20Impact%20Analysis.pdf (accessed 2021-11-03).
- Bierman, B.; Treynor, C.; O’Donnell, J.; Lawrence, M.; Chandra, M.; Farver, A.; Von Behrens, P.; Lindsay, W. Performance of an Enclosed Trough EOR System in South Oman. Energy Procedia 2014, 49, 1269–1278. [CrossRef]
- NASA, [United States National Aeronautics and Space Administration]. Earth Observatory │ Aerosol Optical Depth. https://earthobservatory.nasa.gov/global-maps/MODAL2_M_AER_OD (accessed 2025-04-25).
- NASA, [United States National Aeronautics and Space Administration]. Earth Observatory │ Aerosol Size & Aerosol Optical Depth. https://earthobservatory.nasa.gov/global-maps/MODAL2_M_AER_RA/MODAL2_M_AER_OD (accessed 2025-04-25).
- NASA, [United States National Aeronautics and Space Administration]. Ozone, Aerosol, Trace Gases │ Ozone & Atmospheric Composition. https://ozoneaq.gsfc.nasa.gov/map/#d:2024-05-02..2024-05-31,2024-05-02;l:country-outline,aura_aerosol,earth;@55.8,21.7,6.0z (accessed 2025-04-25).
- Okonkwo, P. C.; Barhoumi, E. M.; Murugan, S.; Zghaibeh, M.; Otor, C.; Abo-Khalil, A. G.; Amer Mohamed, A. M. Economic Analysis of Cross-Breed Power Arrangement for Salalah Region in the Al-Khareef Season. International Journal of Sustainable Energy 2021, 40 (2), 188–206. [CrossRef]
- Carr, C. M.; Yavary, M.; Yavary, M. Wave Agitation Studies for Port Expansion - Salalah, Oman. 2012, 1–10. [CrossRef]
Figure 1.
Illustration of the bifacial and monofacial PV single-row 4.5 kWp systems of our study. This particular view corresponds to the location of Muscat in Oman, on June 21st, at the solar noon (when the sun is at its highest elevation above the horizon).
Figure 1.
Illustration of the bifacial and monofacial PV single-row 4.5 kWp systems of our study. This particular view corresponds to the location of Muscat in Oman, on June 21st, at the solar noon (when the sun is at its highest elevation above the horizon).
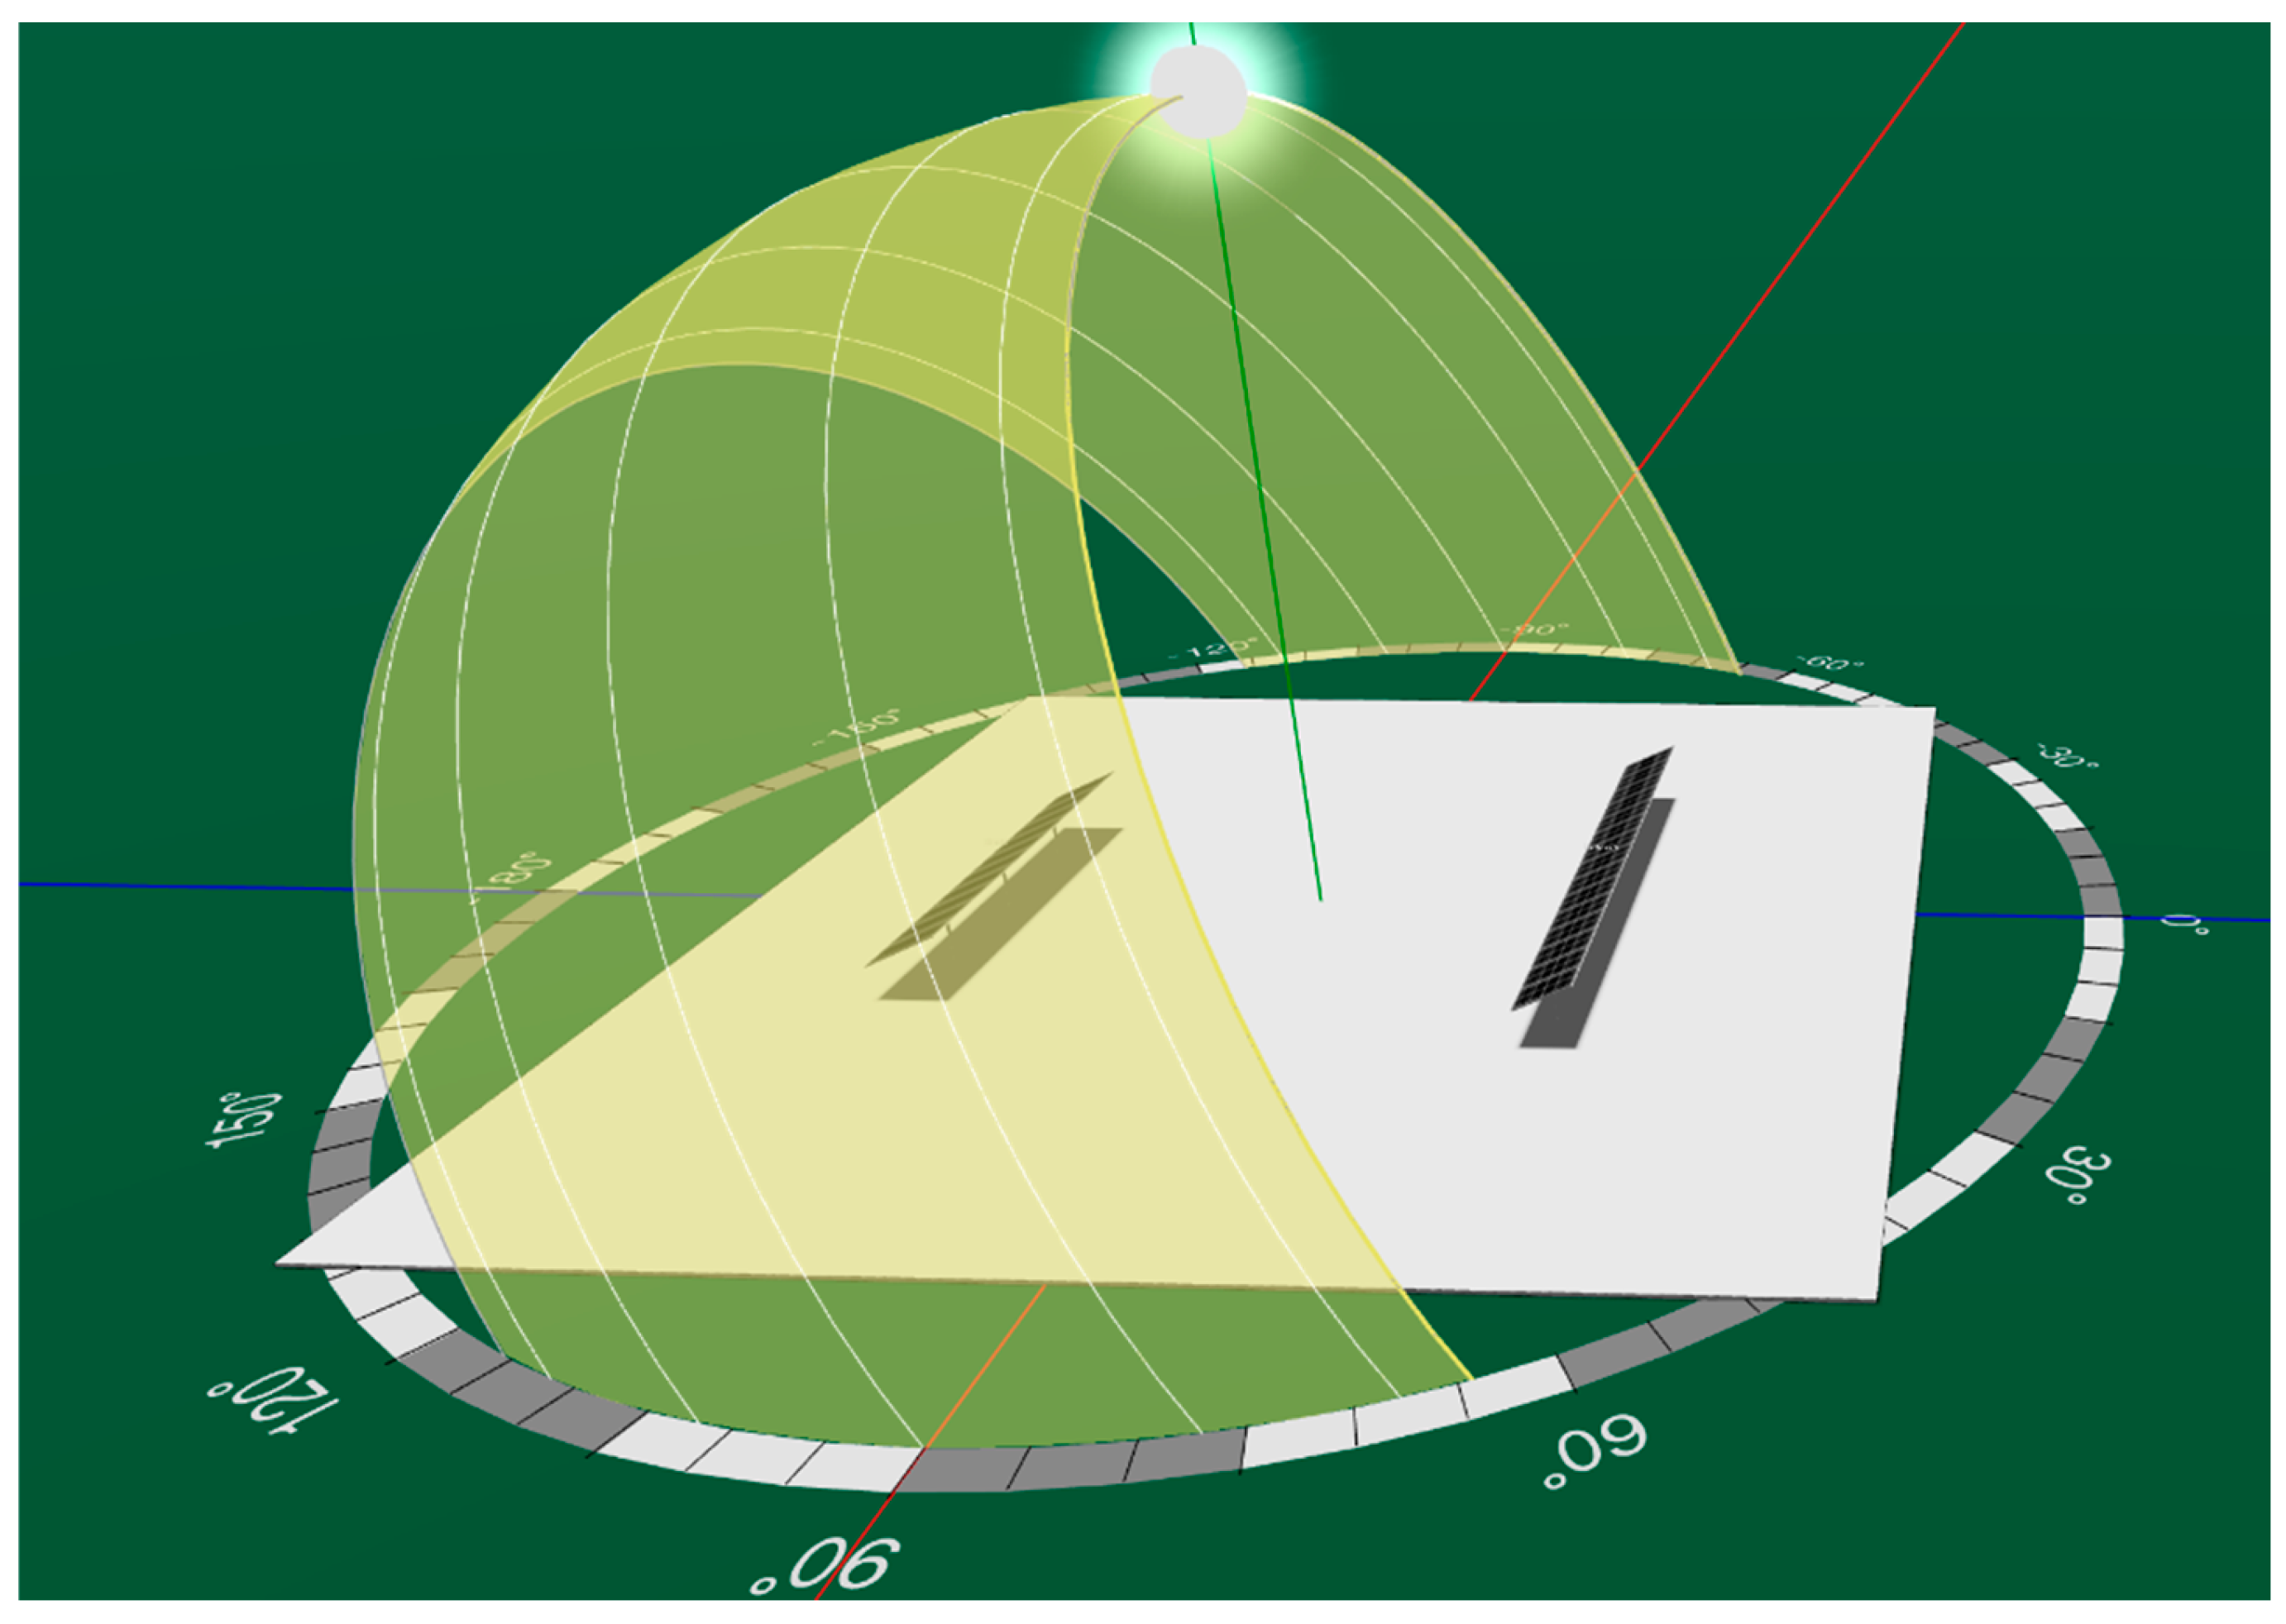
Figure 2.
Illustration of the bifacial and monofacial PV single-row 4.5 kWp systems of our study. This particular view corresponds to the location of Muscat in Oman, on December 21st, at 9 am solar time (three hours before the sun is at its highest elevation above the horizon).
Figure 2.
Illustration of the bifacial and monofacial PV single-row 4.5 kWp systems of our study. This particular view corresponds to the location of Muscat in Oman, on December 21st, at 9 am solar time (three hours before the sun is at its highest elevation above the horizon).
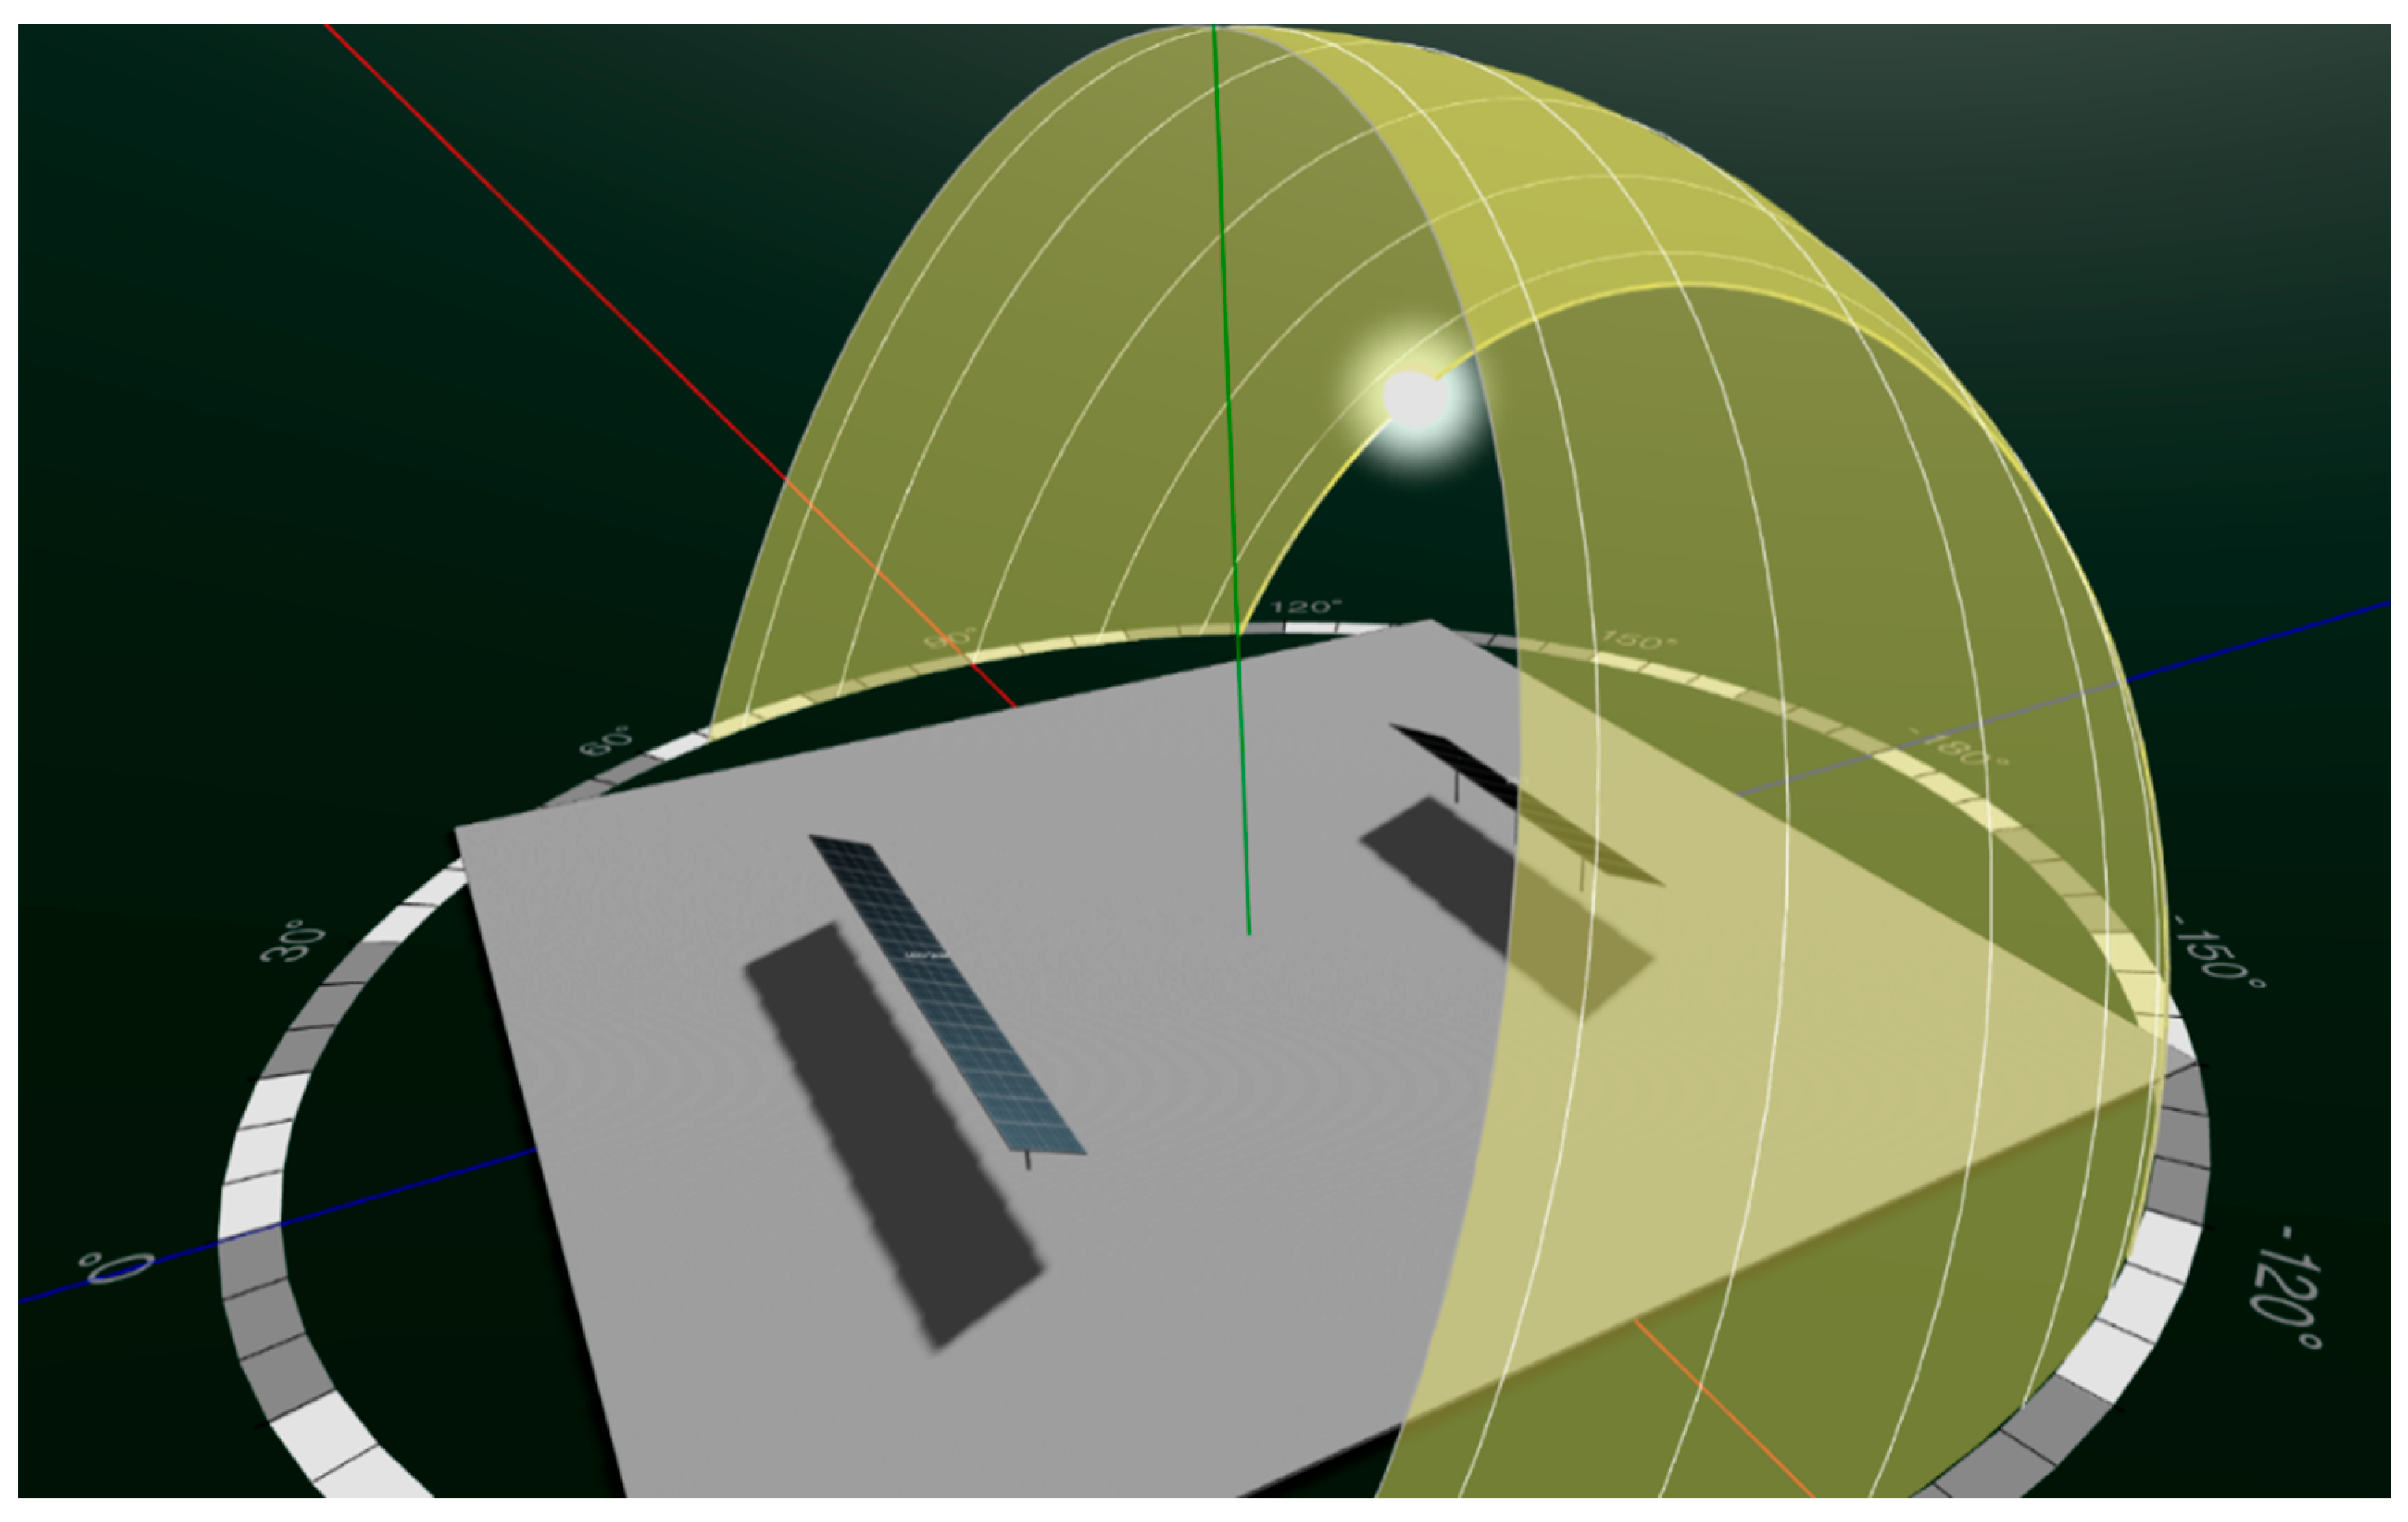
Figure 3.
Illustration of the bifacial and monofacial PV single-row 4.5 kWp systems of our study. The bifacial row (having 10 PV modules) is near the lower edge of the figure, while the monofacial row (having 15 PV modules) is near the upper edge of the figure. Illumination effects due to incident sunlight are clearly visible.
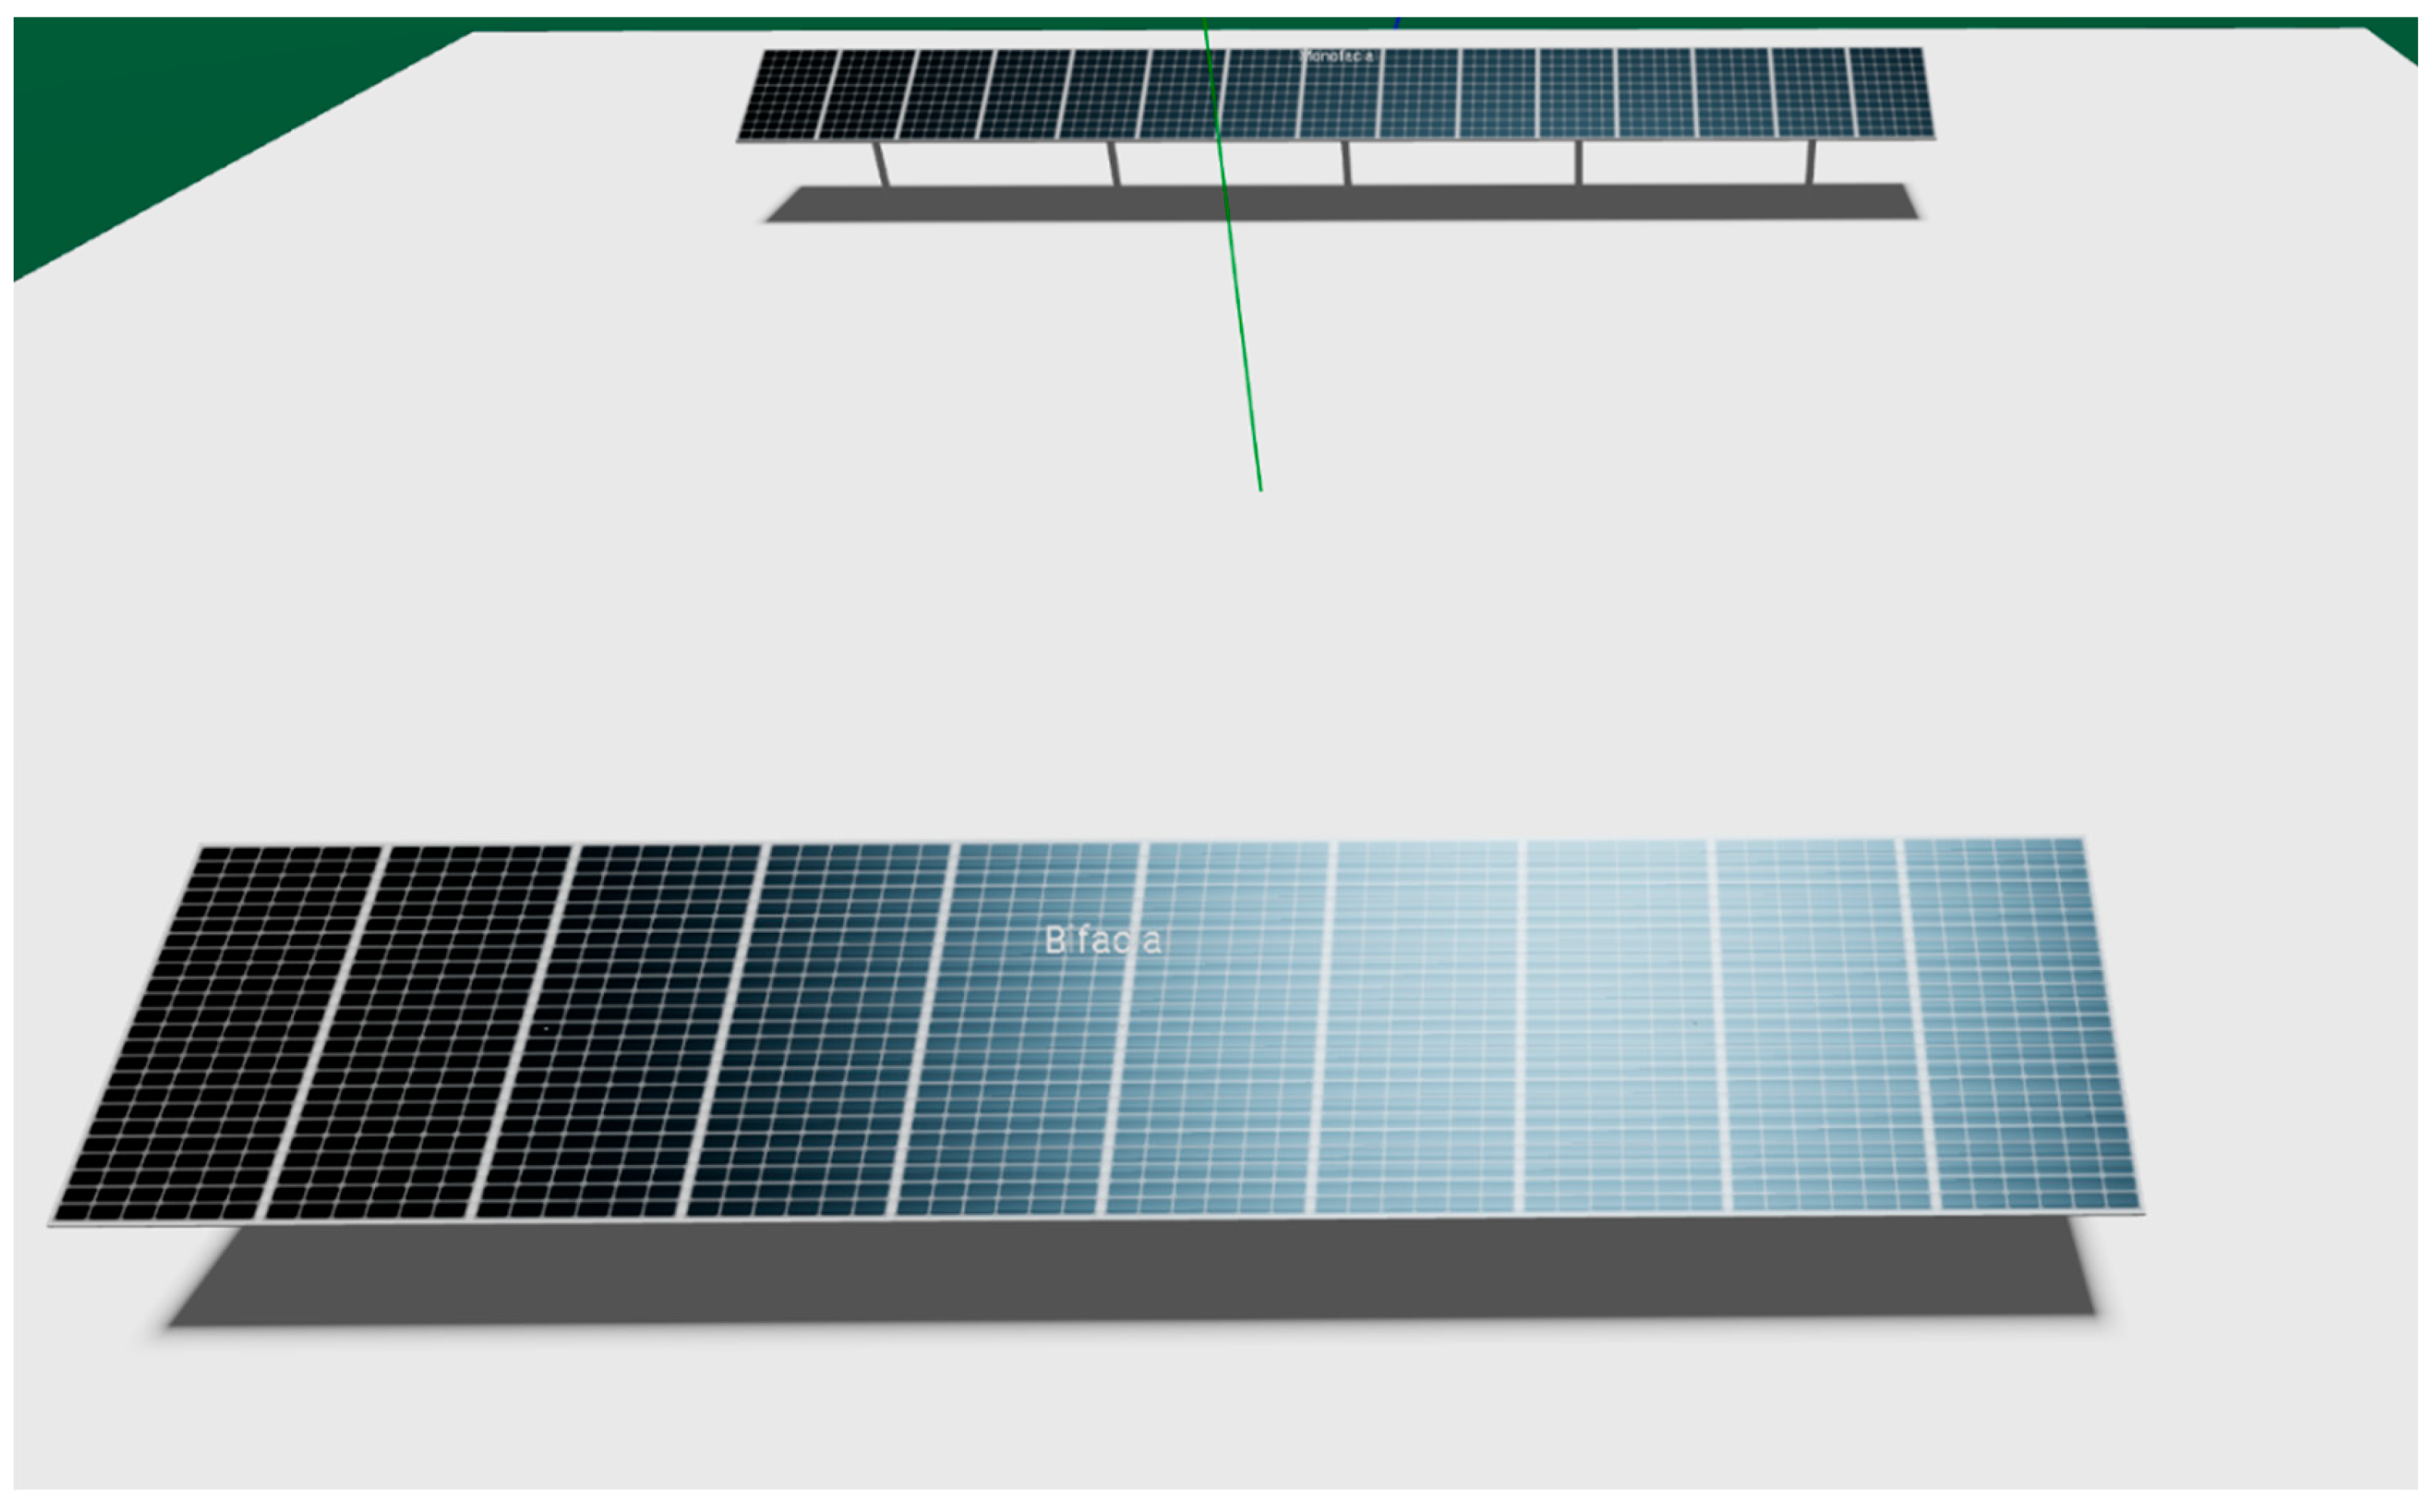
Figure 4.
Monofacial benchmarking results in terms of the monthly specific yield of electric energy (kWh/kWp/month). This benchmarking corresponds to Muscat in Oman.
Figure 4.
Monofacial benchmarking results in terms of the monthly specific yield of electric energy (kWh/kWp/month). This benchmarking corresponds to Muscat in Oman.
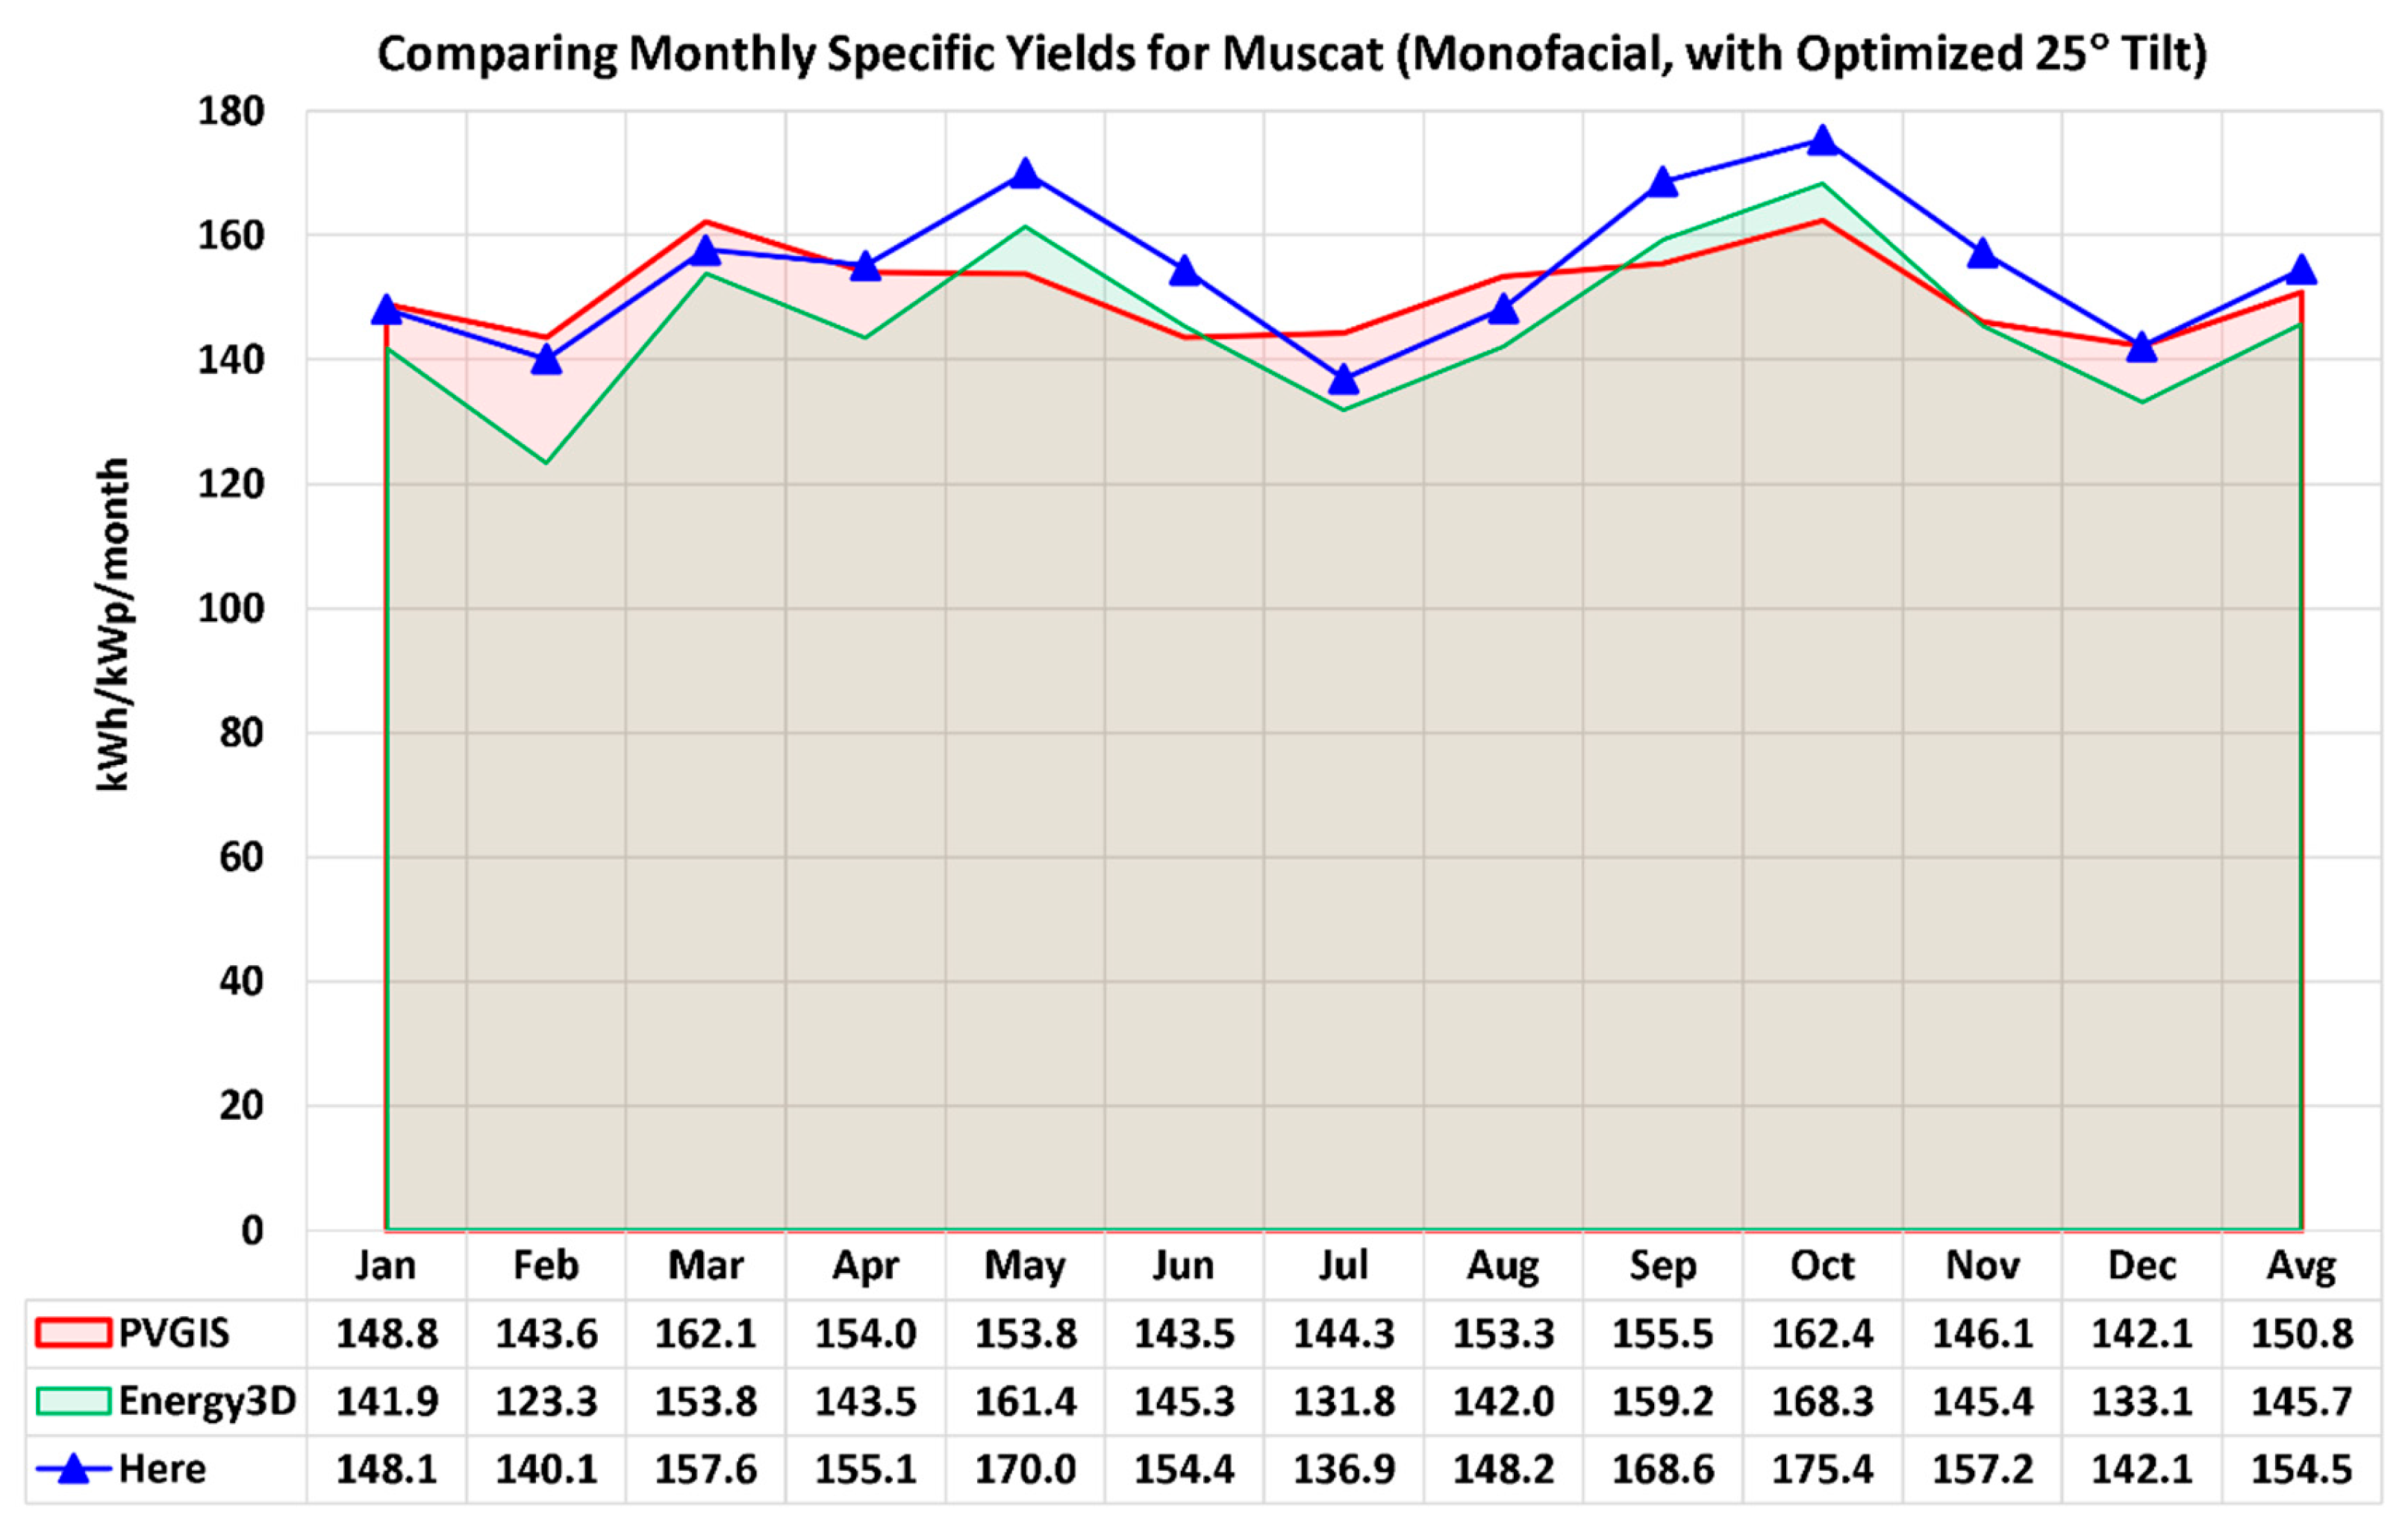
Figure 5.
Monofacial benchmarking results in terms of the annual specific yield of electric energy (kWh/kWp/year). This benchmarking corresponds to Muscat in Oman.
Figure 5.
Monofacial benchmarking results in terms of the annual specific yield of electric energy (kWh/kWp/year). This benchmarking corresponds to Muscat in Oman.
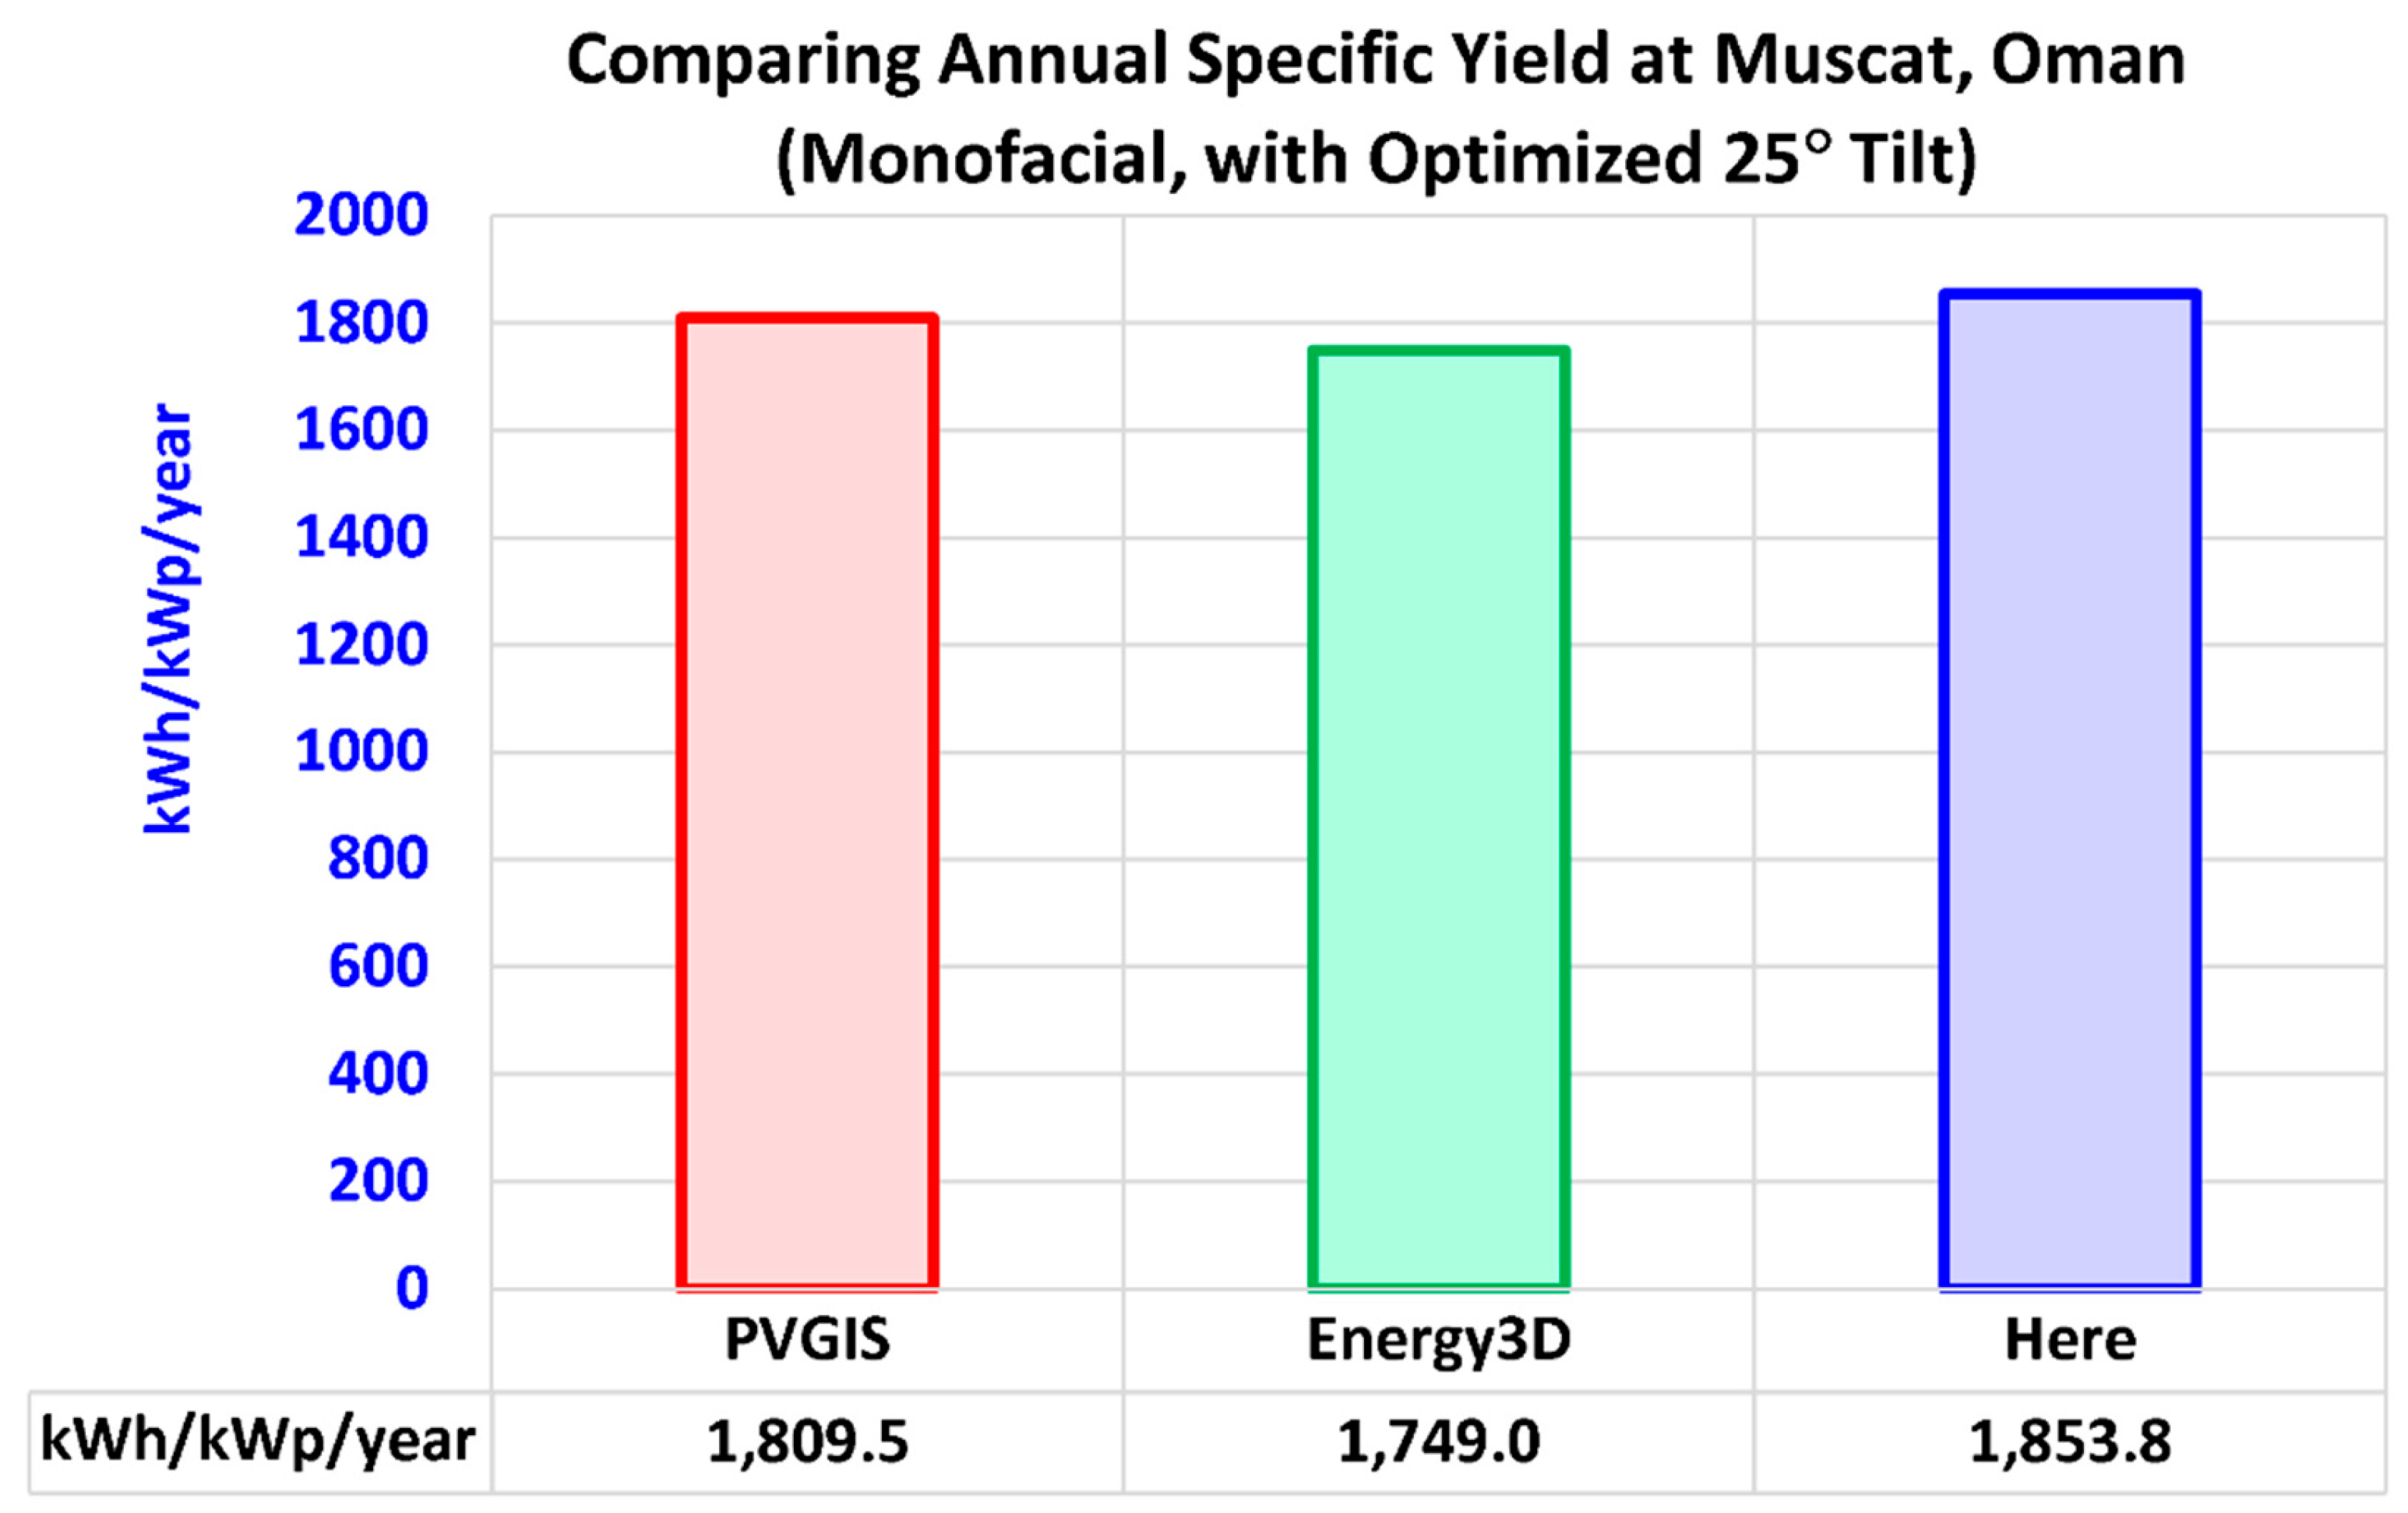
Figure 6.
Layout of the bifacial PV array used here in the bifacial benchmarking simulation that corresponds to Caferbey in Turkey. This particular view corresponds to 3 pm solar time (three hours after the sun is at its highest elevation above the horizon).
Figure 6.
Layout of the bifacial PV array used here in the bifacial benchmarking simulation that corresponds to Caferbey in Turkey. This particular view corresponds to 3 pm solar time (three hours after the sun is at its highest elevation above the horizon).
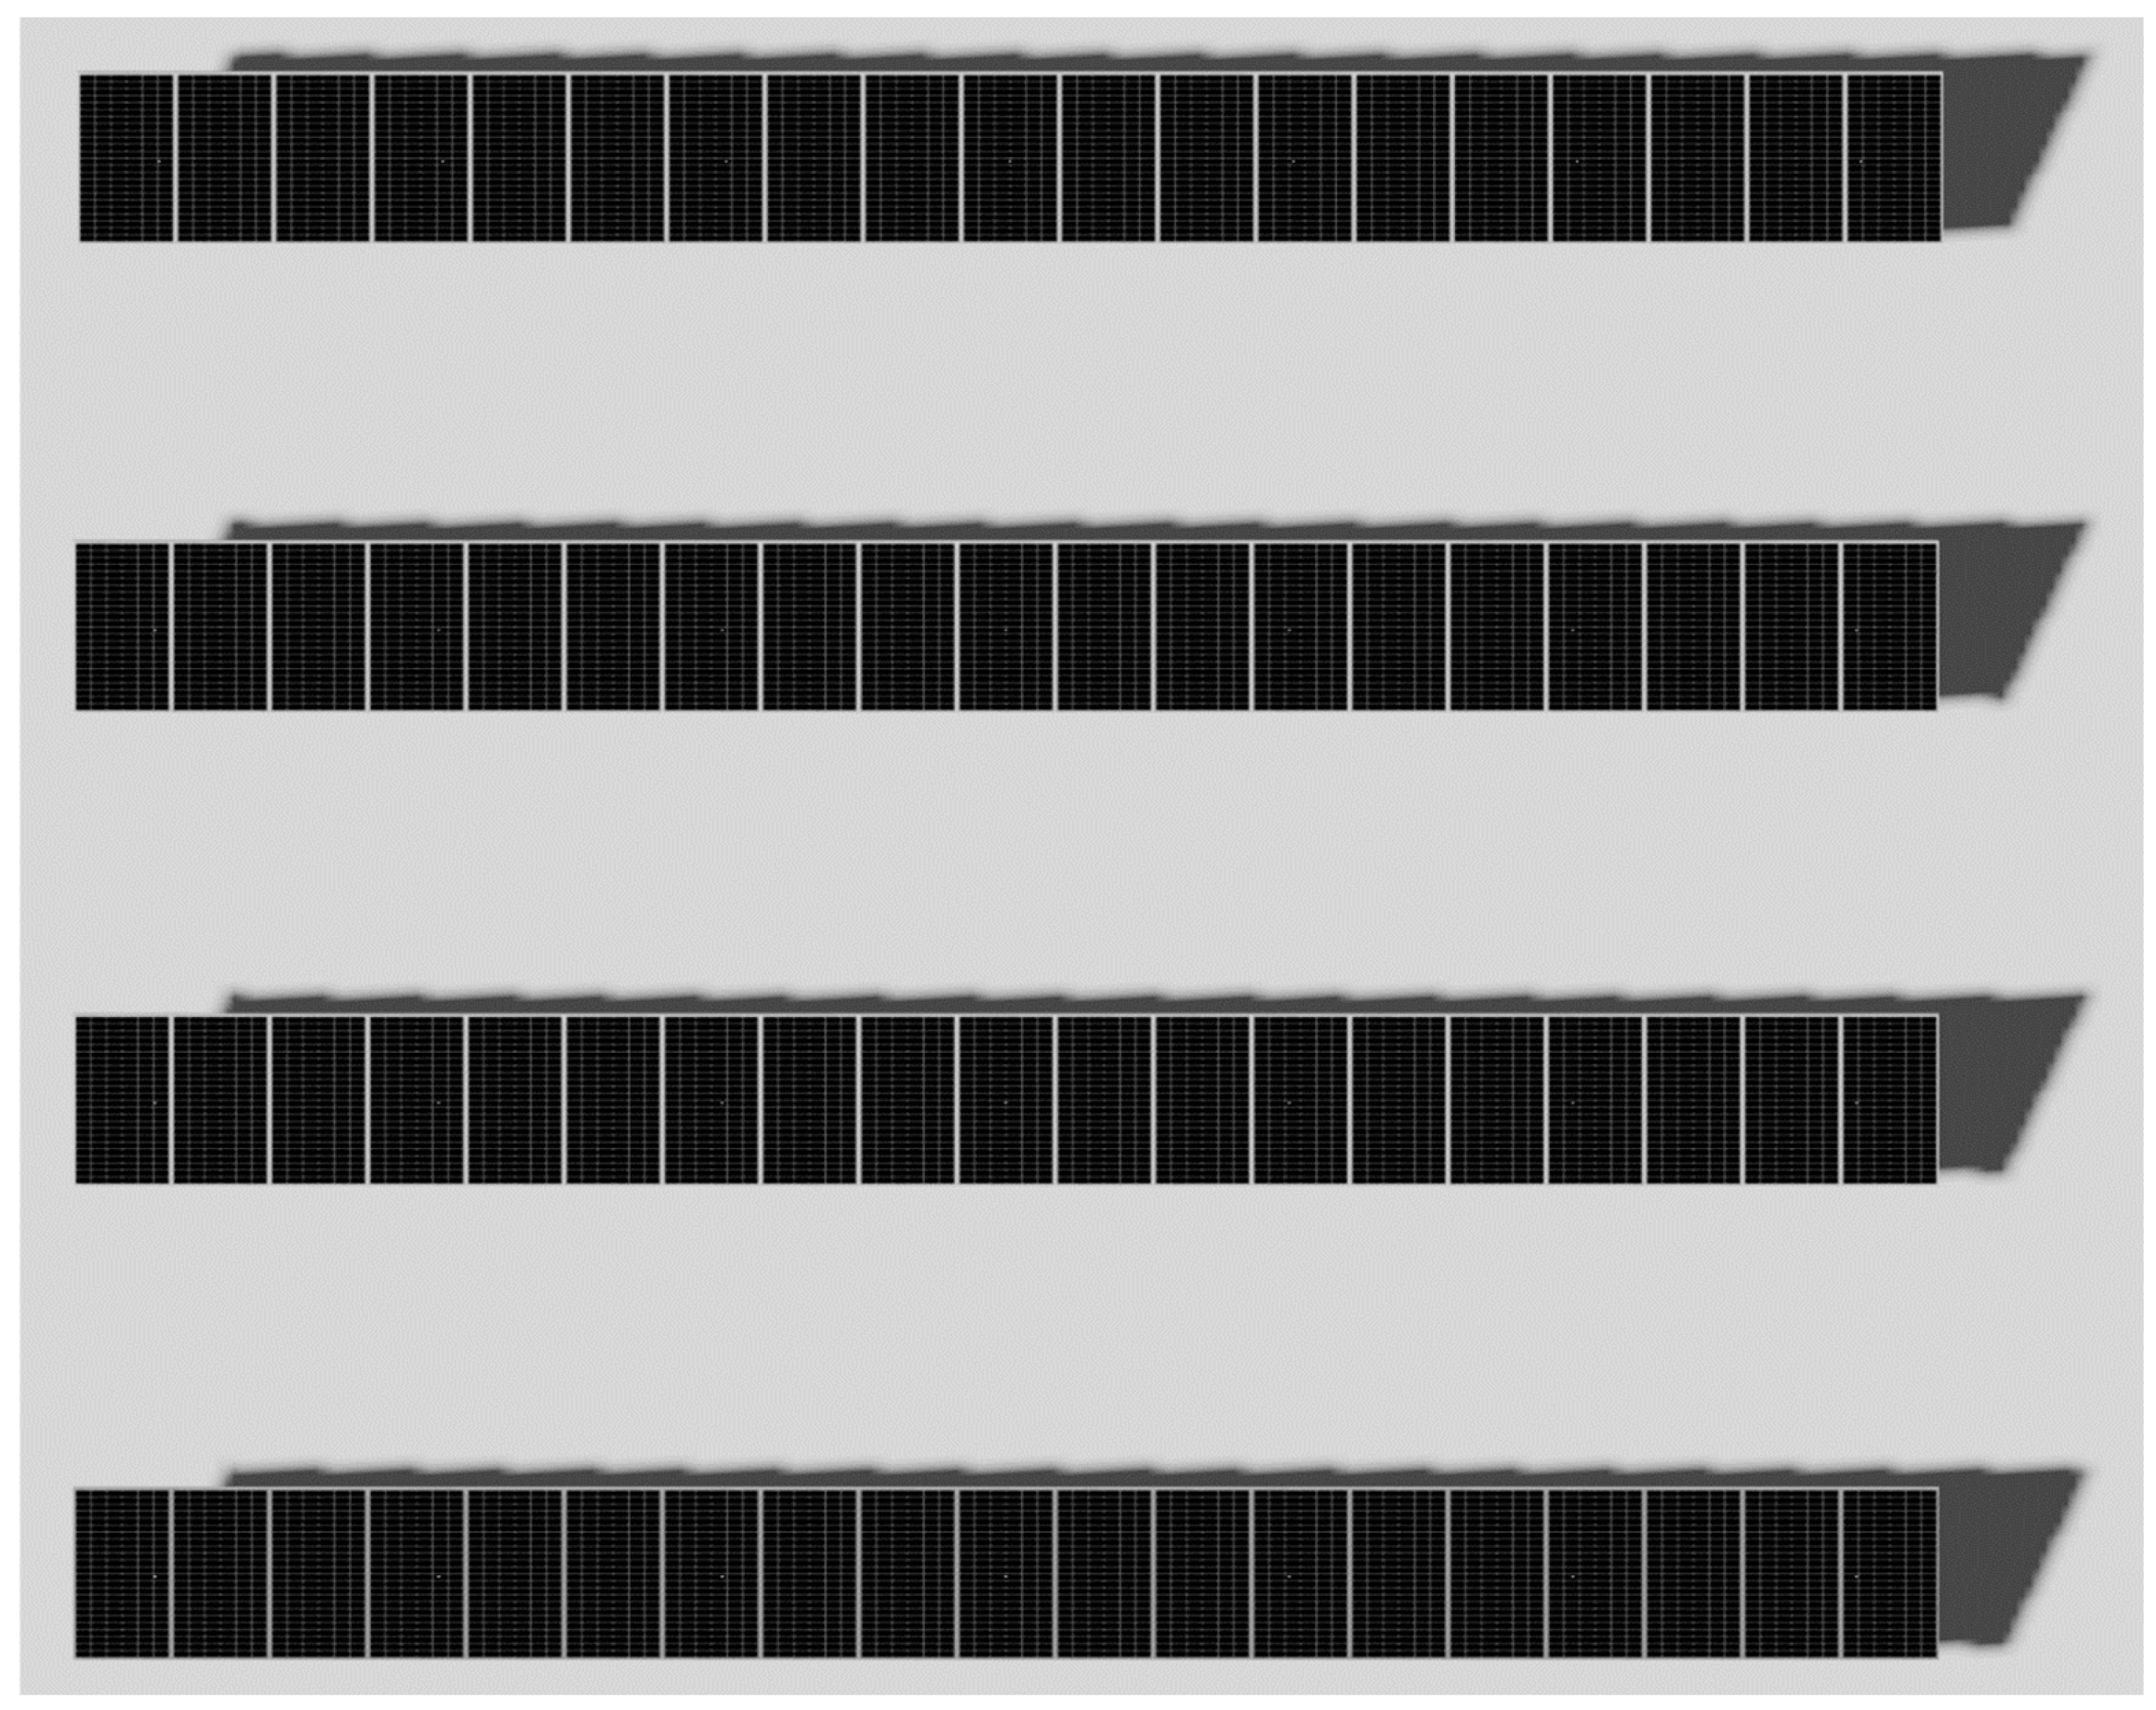
Figure 7.
Bifacial benchmarking results in terms of the annual specific yield of electric energy (kWh/kWp/year). This benchmarking corresponds to Caferbey, Manisa in Turkey.
Figure 7.
Bifacial benchmarking results in terms of the annual specific yield of electric energy (kWh/kWp/year). This benchmarking corresponds to Caferbey, Manisa in Turkey.
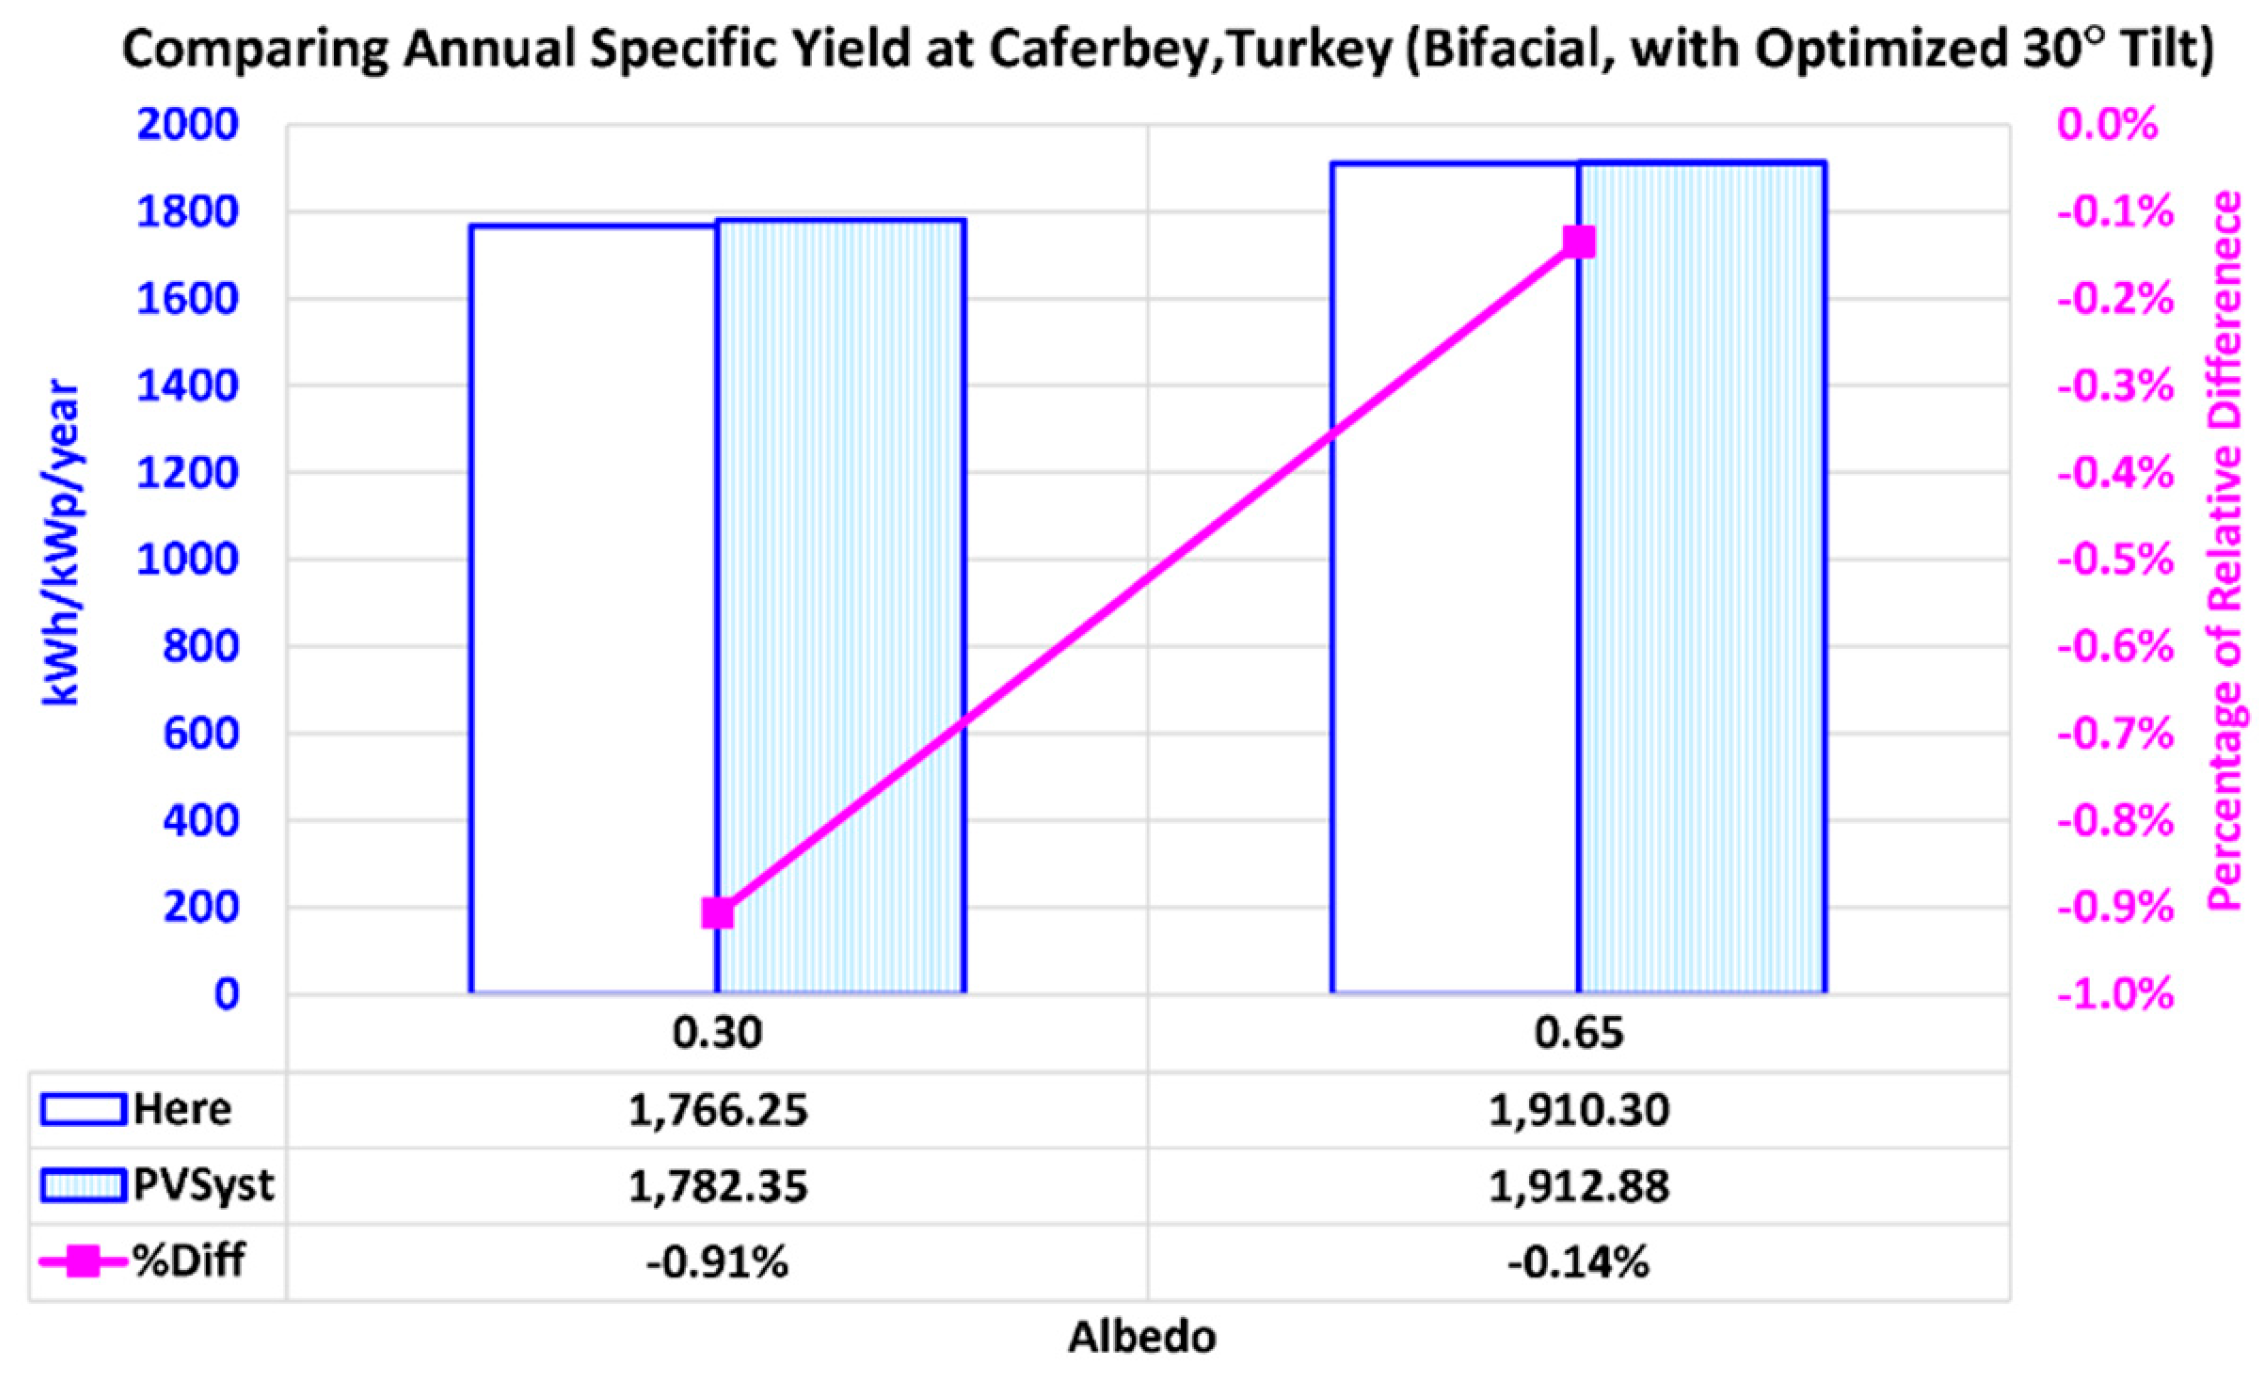
Figure 8.
Our estimated annual specific electricity yield in seven Omani cities, with monofacial PV modules, bifacial PV modules with a low albedo value of 0.30, and bifacial PV modules with a high albedo value of 0.65.
Figure 8.
Our estimated annual specific electricity yield in seven Omani cities, with monofacial PV modules, bifacial PV modules with a low albedo value of 0.30, and bifacial PV modules with a high albedo value of 0.65.
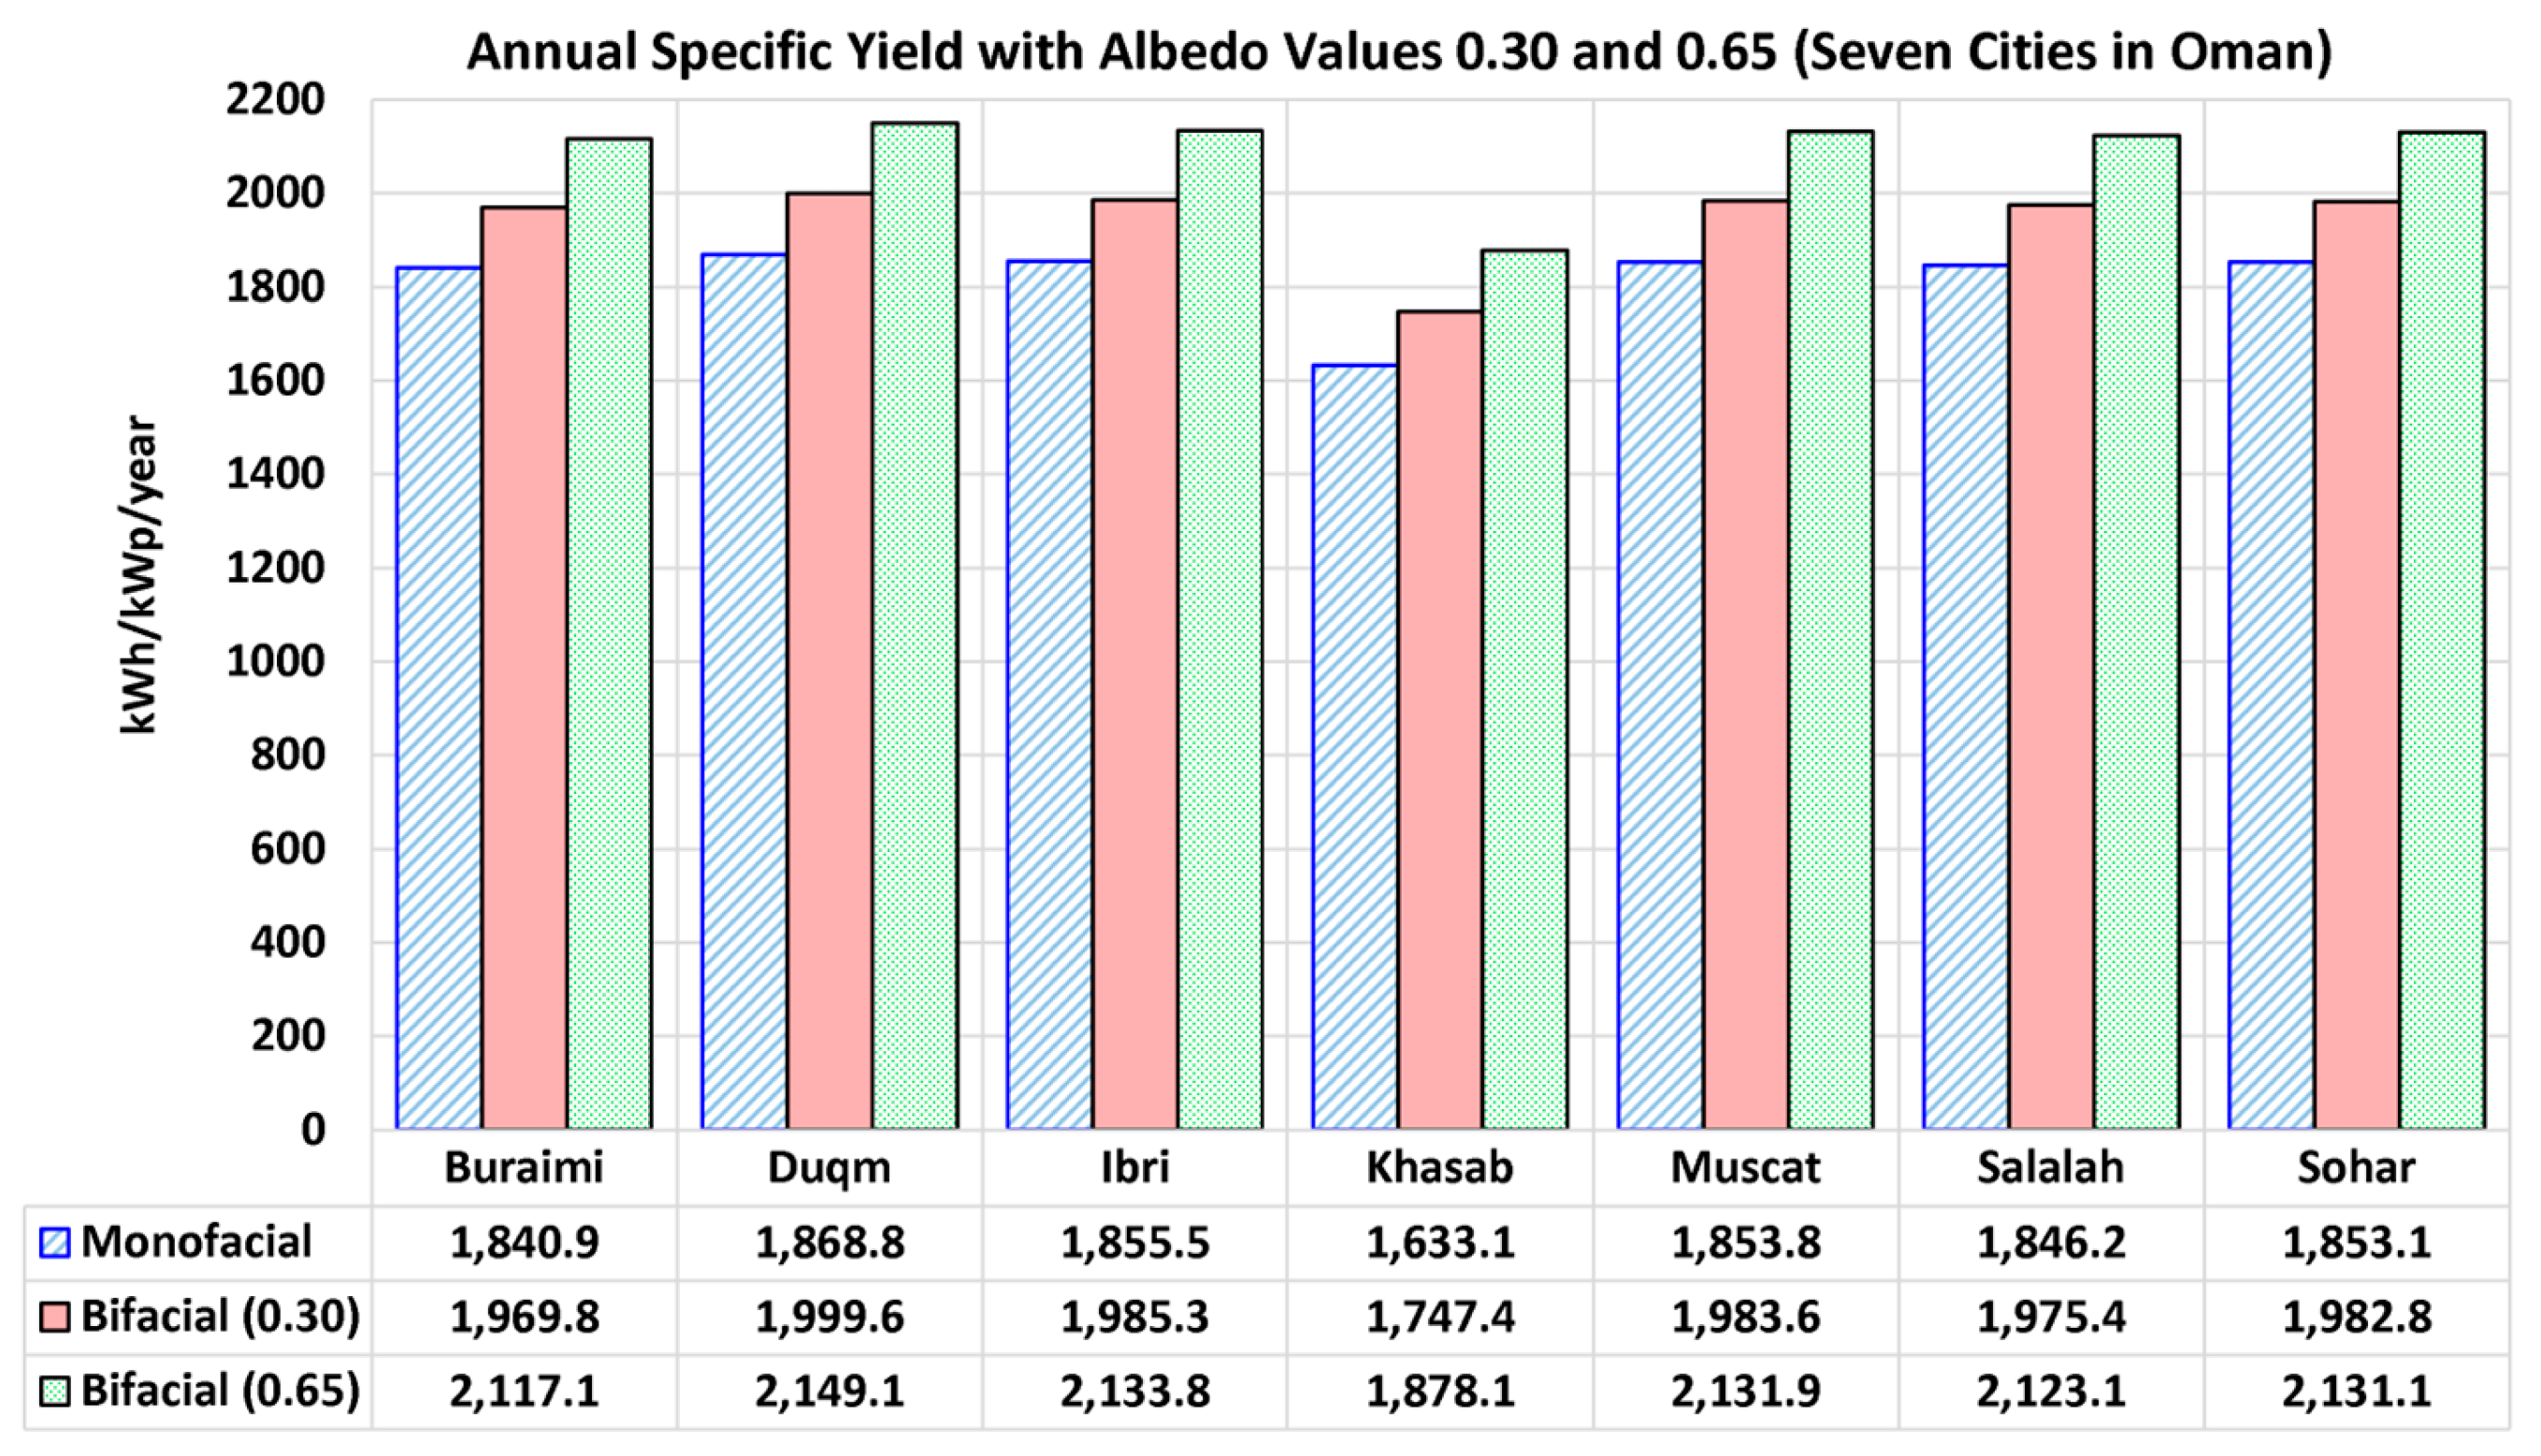
Figure 9.
Profiles of the monthly (per-month) specific yield of electricity for the seven Omani locations studied here, with monofacial PV modules.
Figure 9.
Profiles of the monthly (per-month) specific yield of electricity for the seven Omani locations studied here, with monofacial PV modules.
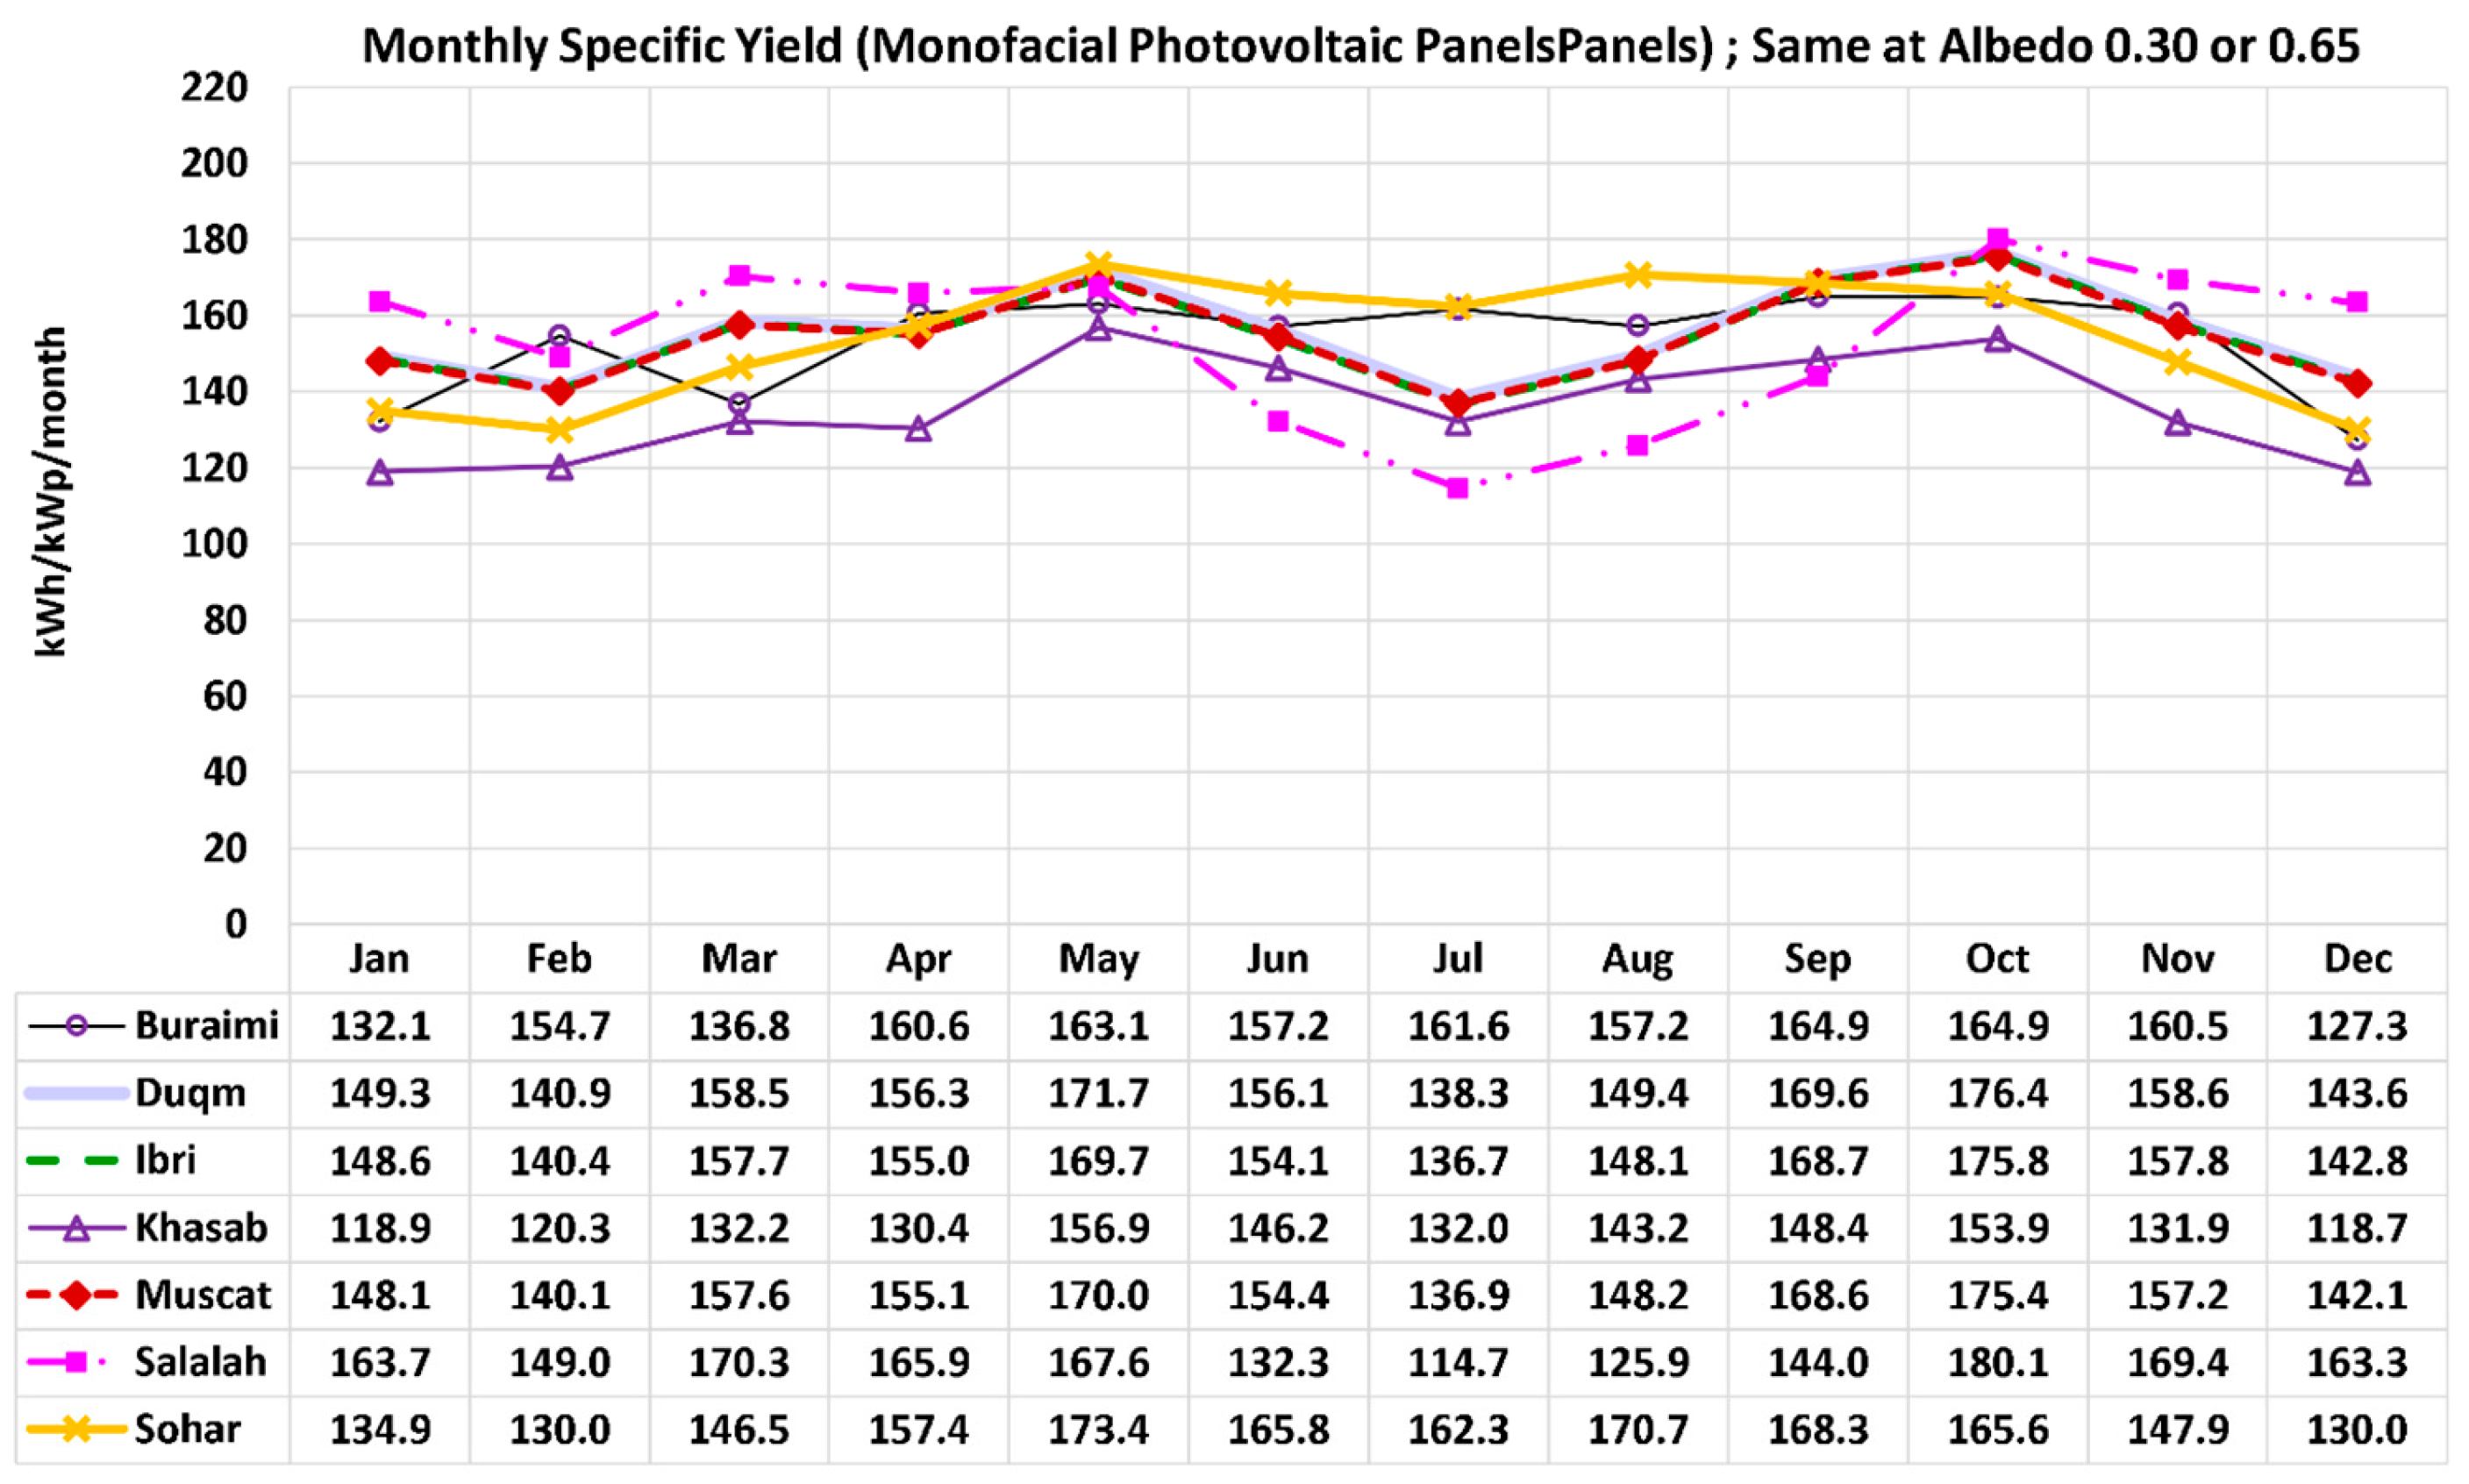
Figure 10.
Profiles of the monthly (per-month) specific yield of electricity for the seven Omani locations studied here, with bifacial PV modules and ground albedo 0.30 (low).
Figure 10.
Profiles of the monthly (per-month) specific yield of electricity for the seven Omani locations studied here, with bifacial PV modules and ground albedo 0.30 (low).
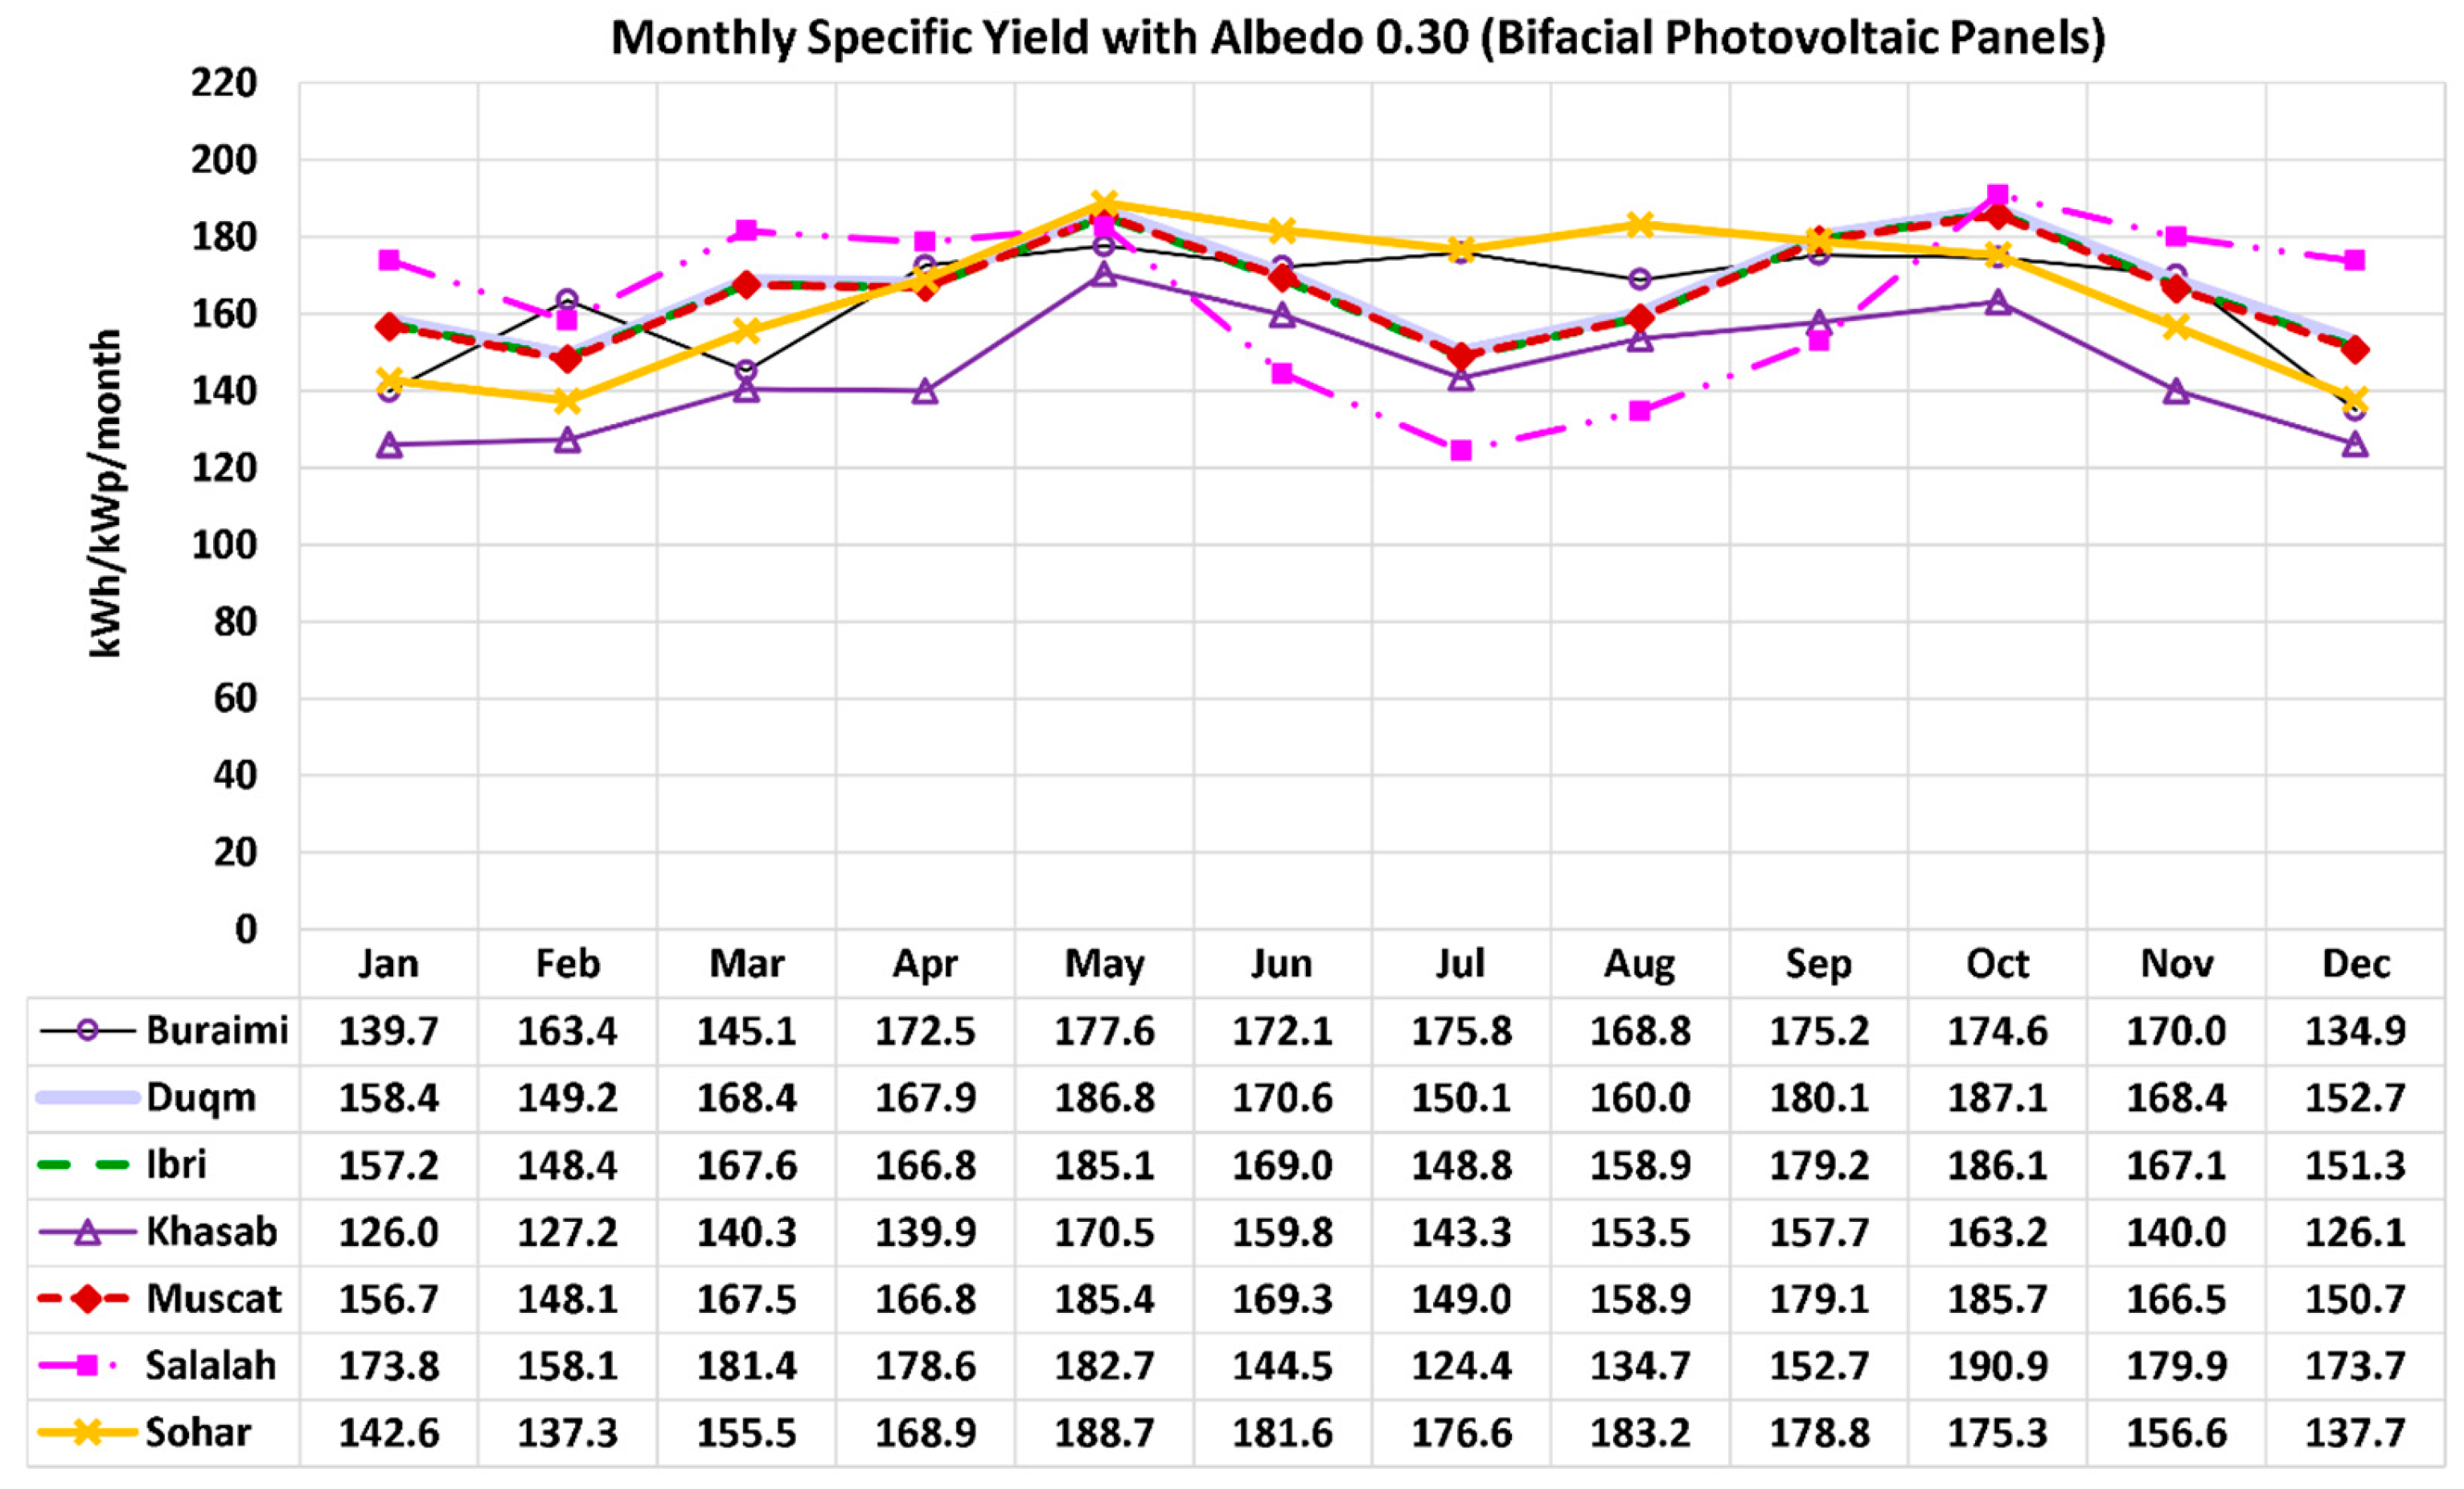
Figure 11.
Profiles of the monthly approximated bifacial gain (ABG) in electricity generation for the seven Omani locations studied here, with ground albedo 0.30 (low).
Figure 11.
Profiles of the monthly approximated bifacial gain (ABG) in electricity generation for the seven Omani locations studied here, with ground albedo 0.30 (low).
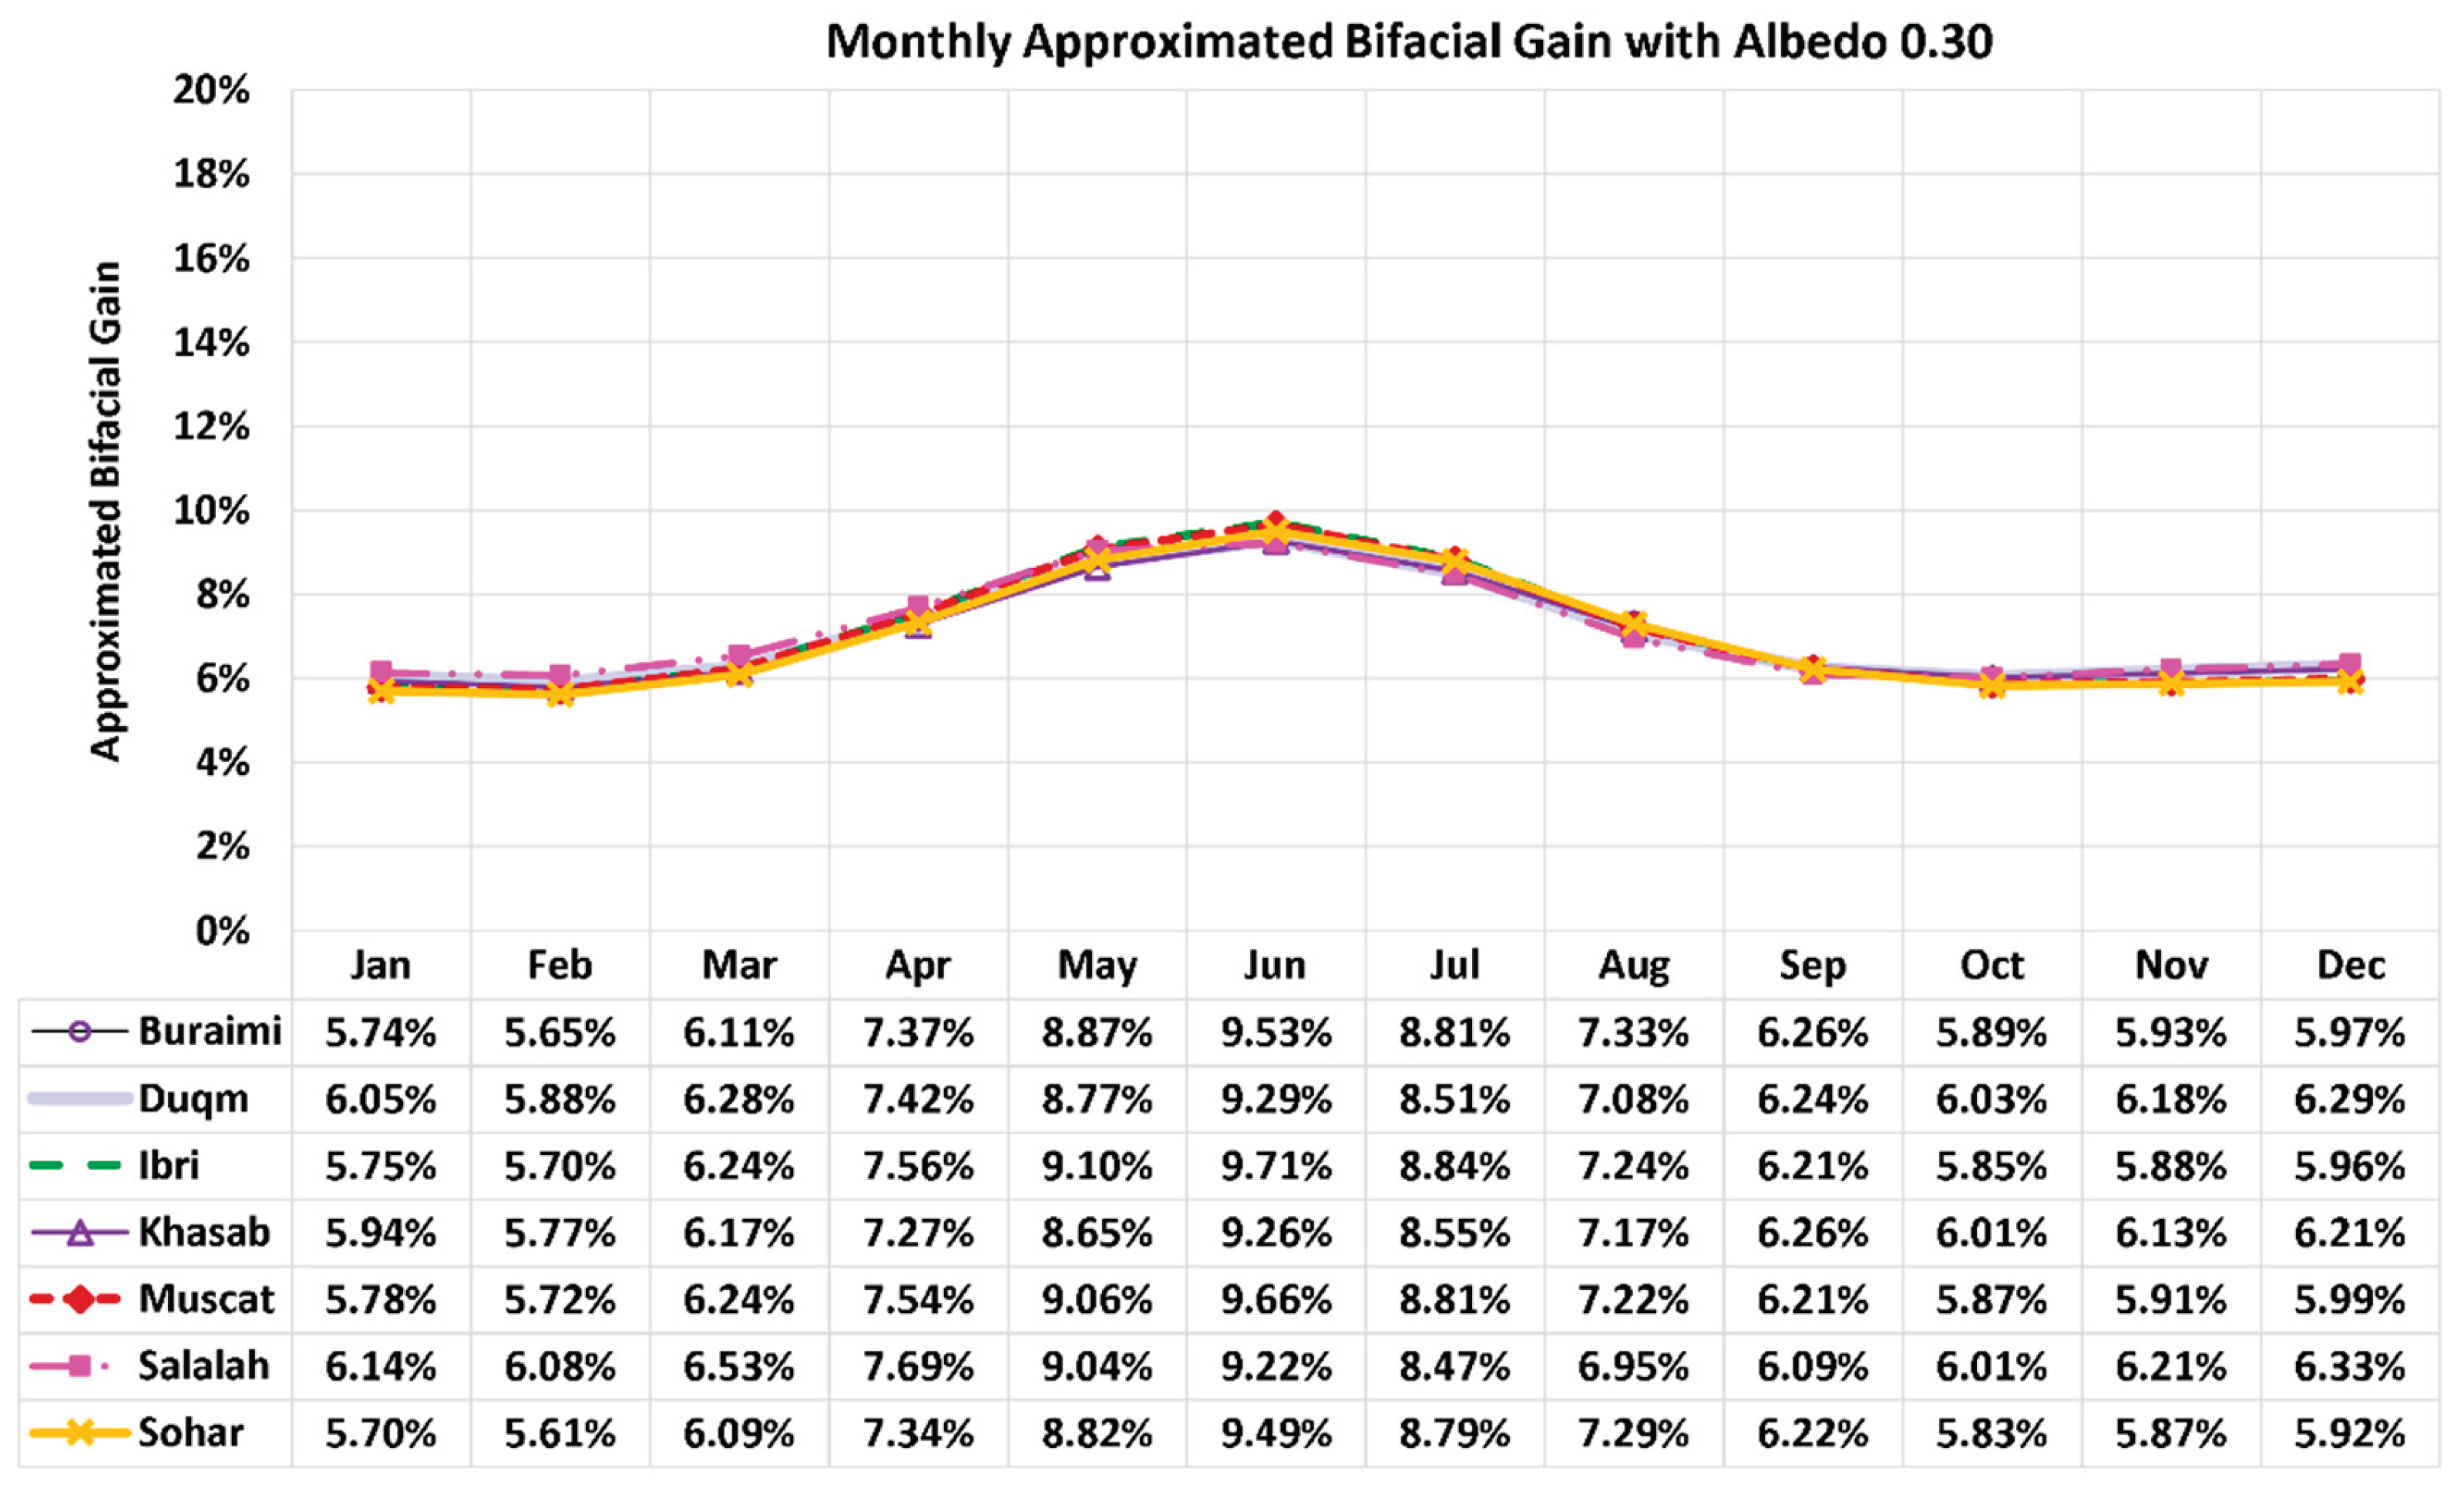
Figure 12.
Profiles of the monthly (per-month) specific yield of electricity for the seven Omani locations studied here, with bifacial PV modules and high ground albedo 0.65 (high).
Figure 12.
Profiles of the monthly (per-month) specific yield of electricity for the seven Omani locations studied here, with bifacial PV modules and high ground albedo 0.65 (high).
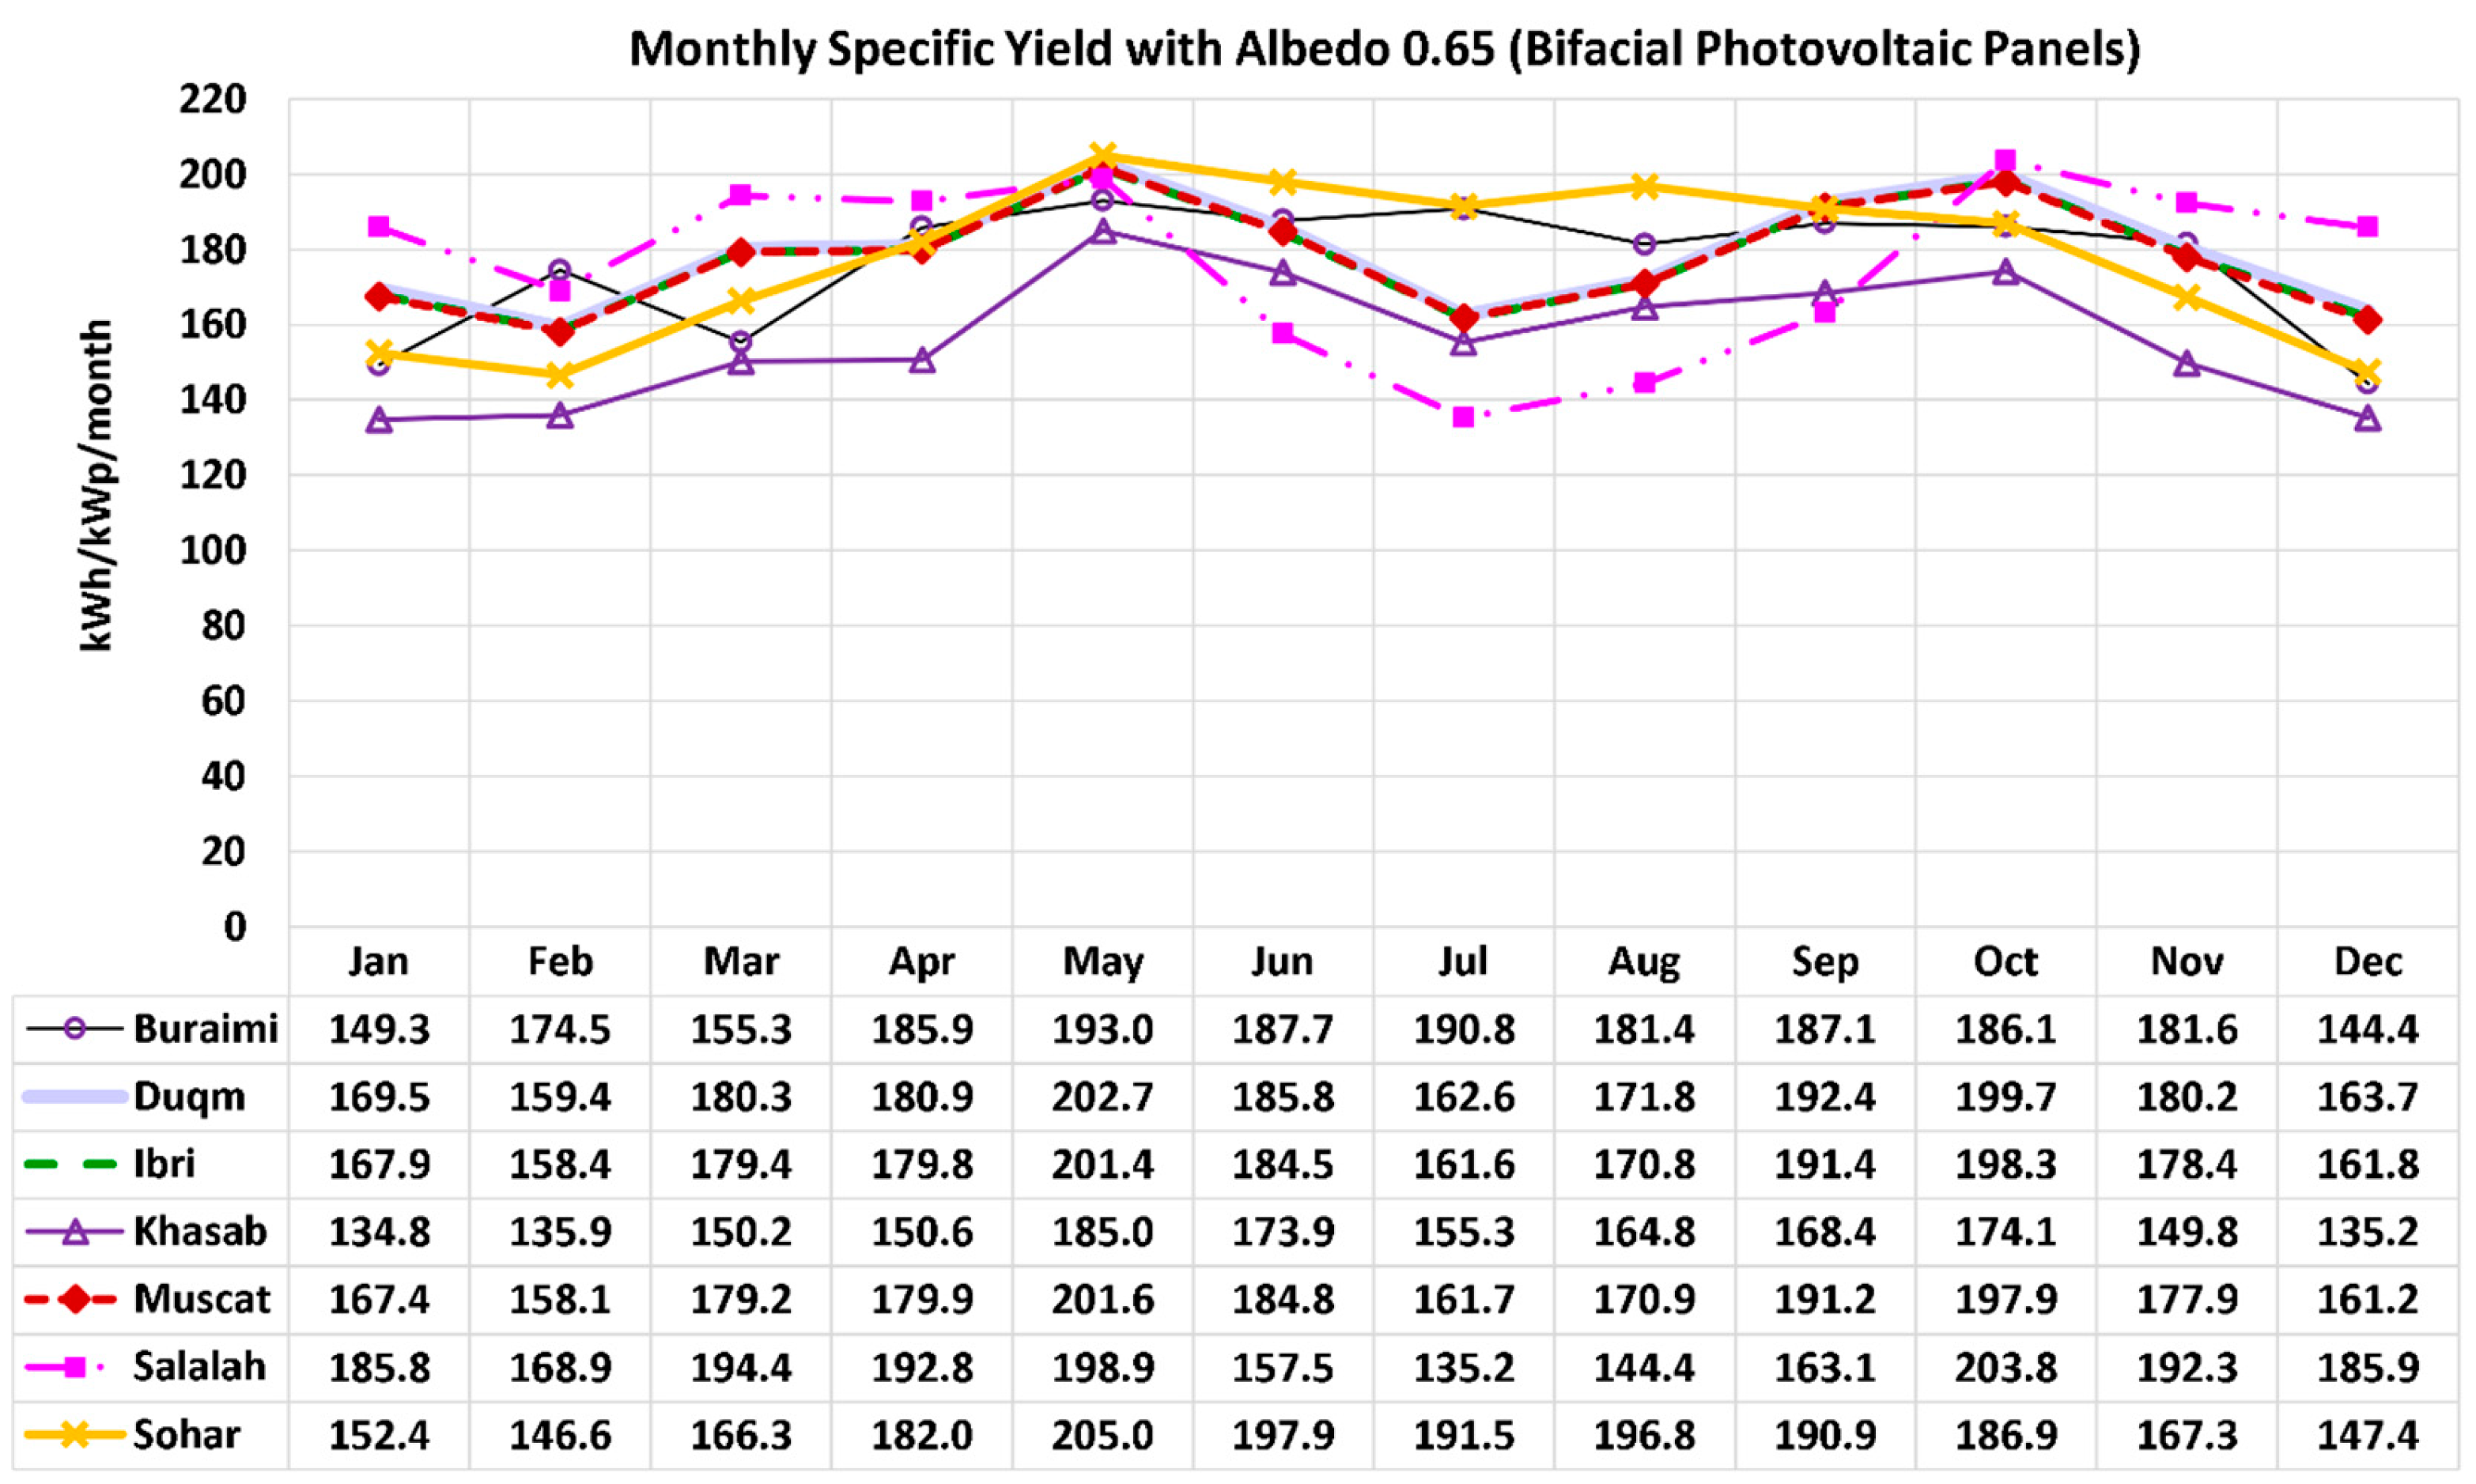
Figure 13.
Profiles of the monthly approximated bifacial gain (ABG) in electricity generation for the seven Omani locations studied here, with ground albedo 0.65 (high).
Figure 13.
Profiles of the monthly approximated bifacial gain (ABG) in electricity generation for the seven Omani locations studied here, with ground albedo 0.65 (high).
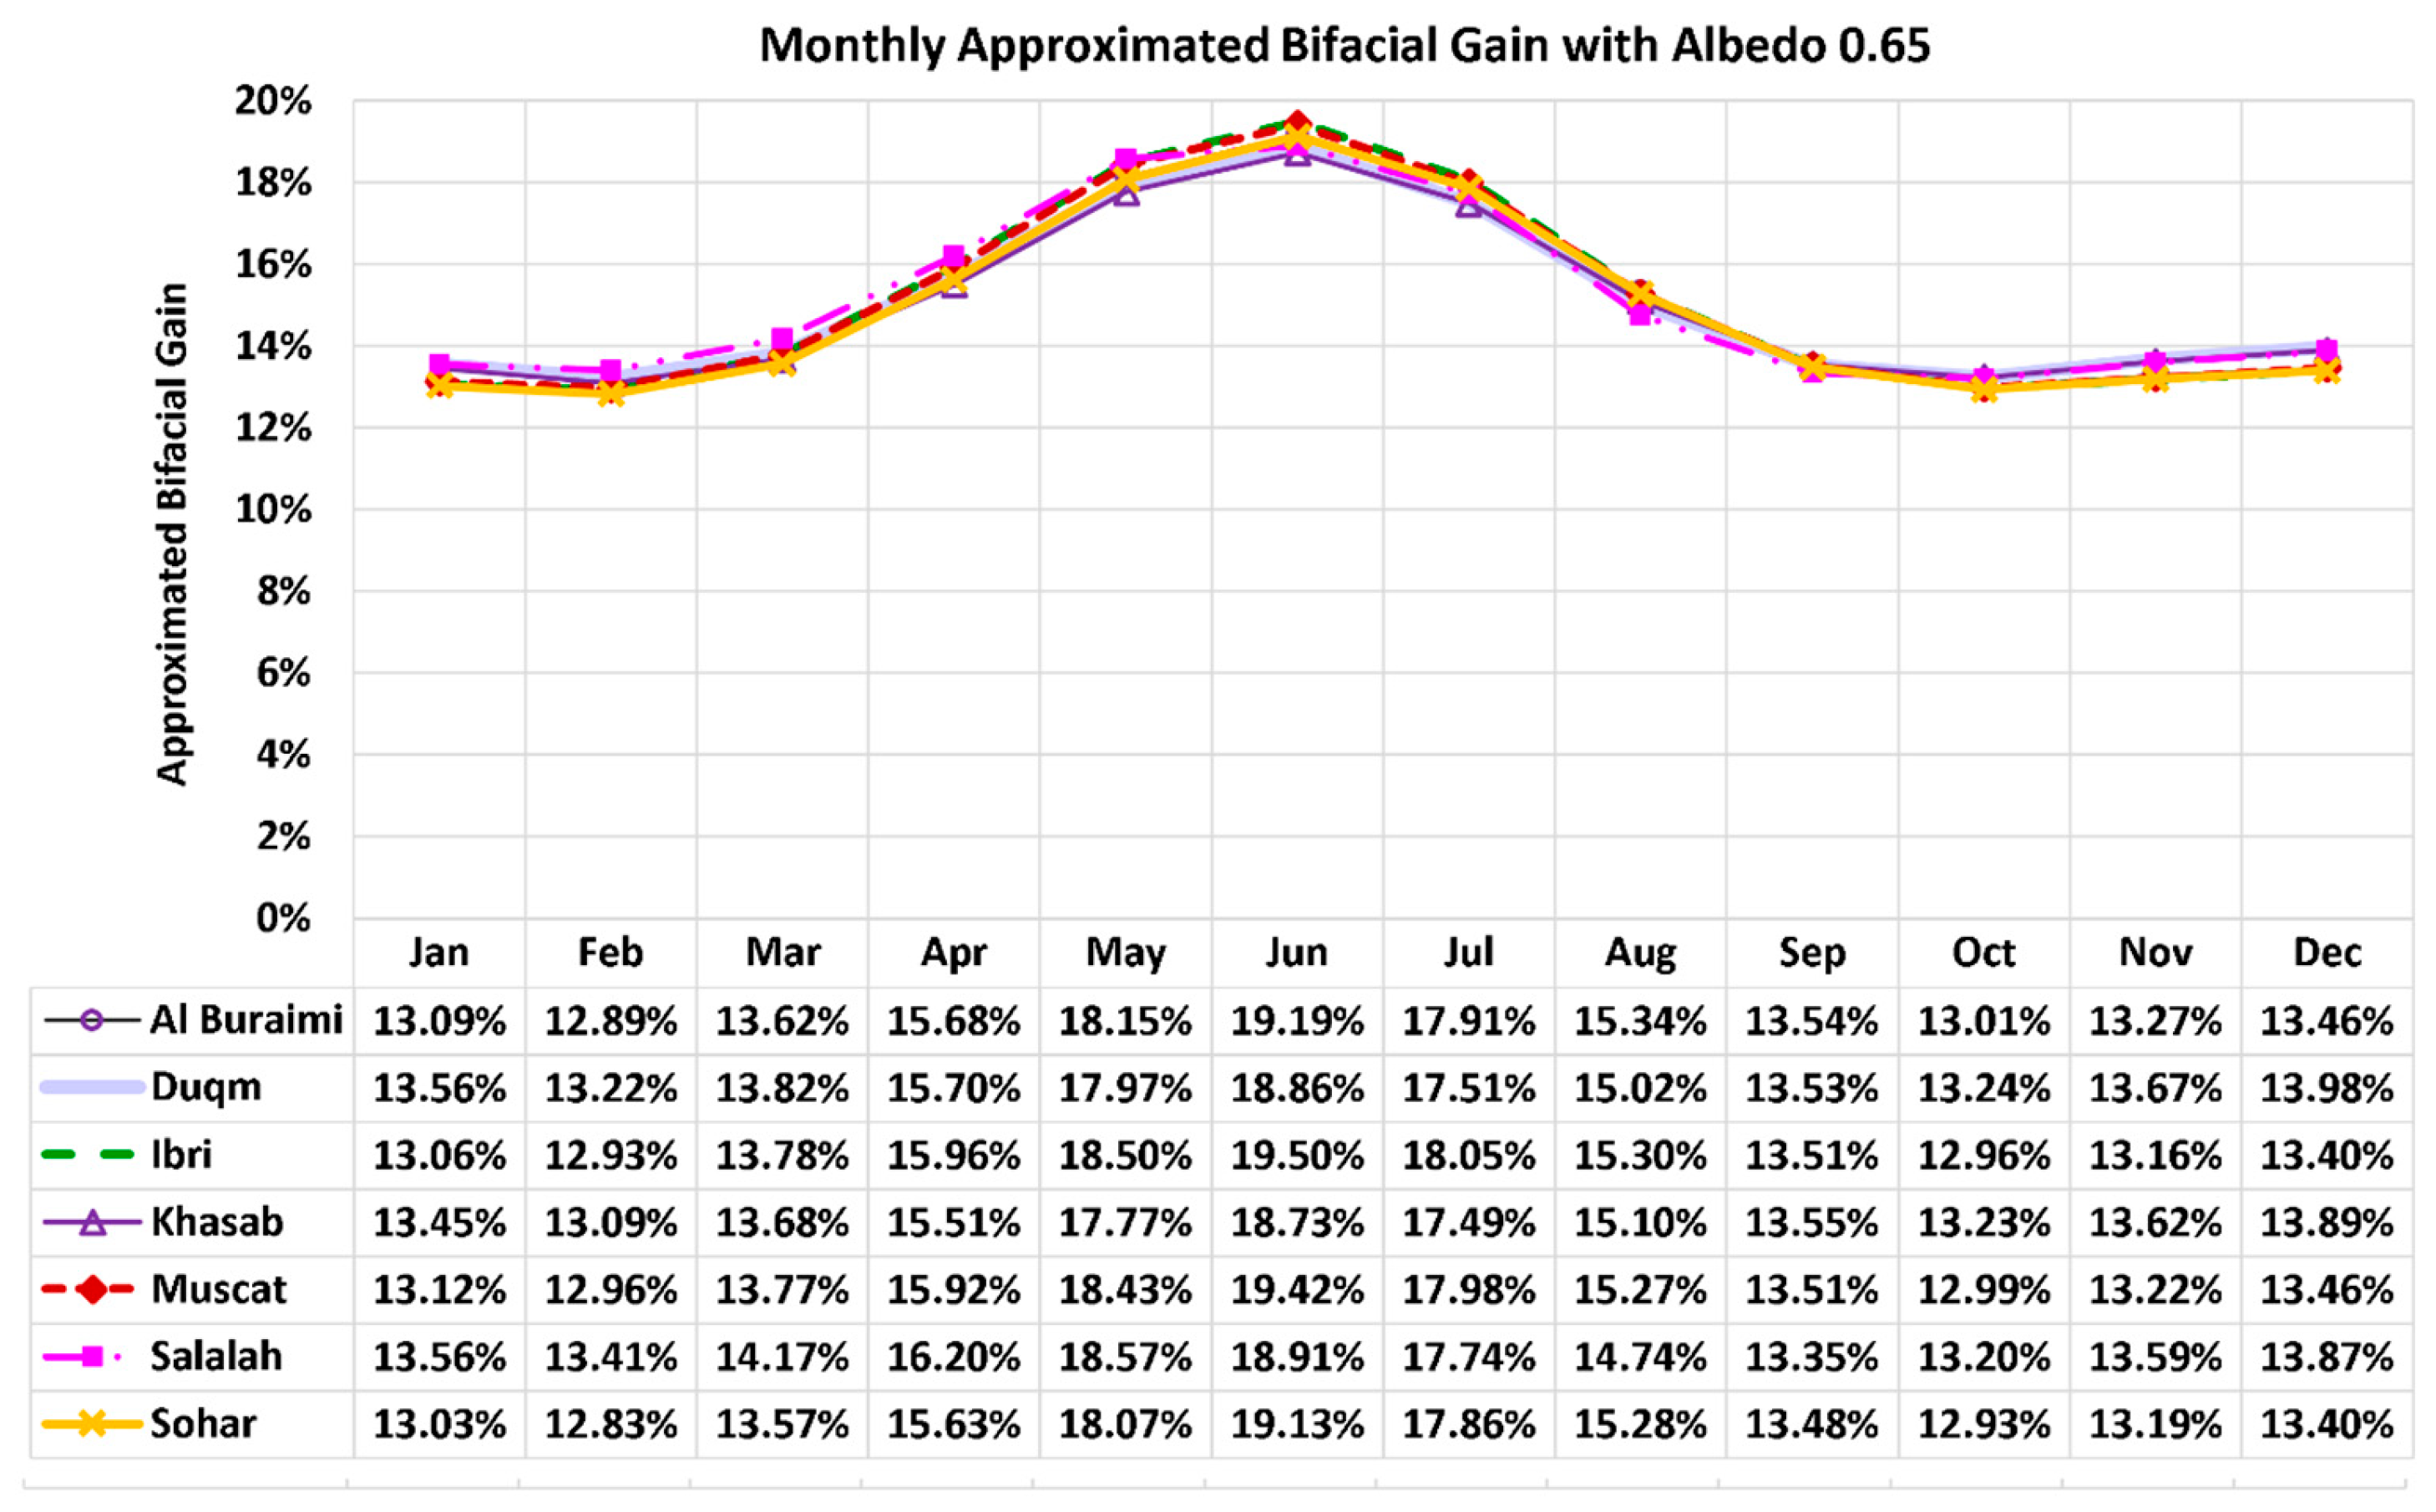

Table 1.
Different albedo values in the literature (ascendingly ordered by value).
| Ground / Foundation characteristics | Albedo value | Reference |
| perfectly black surface | 0 | [64] |
| back road pavement | 0.05-0.10 | [65] |
| dark soil | 0.05-0.15 | [65] |
| green meadows | 0.10-0.20 | [65] |
| grassland | 0.1 | [66] |
| dark-colored soil surfaces | 0.1-0.2 | [66] |
| soil surface | 0.10–0.15 | [67] |
| crops | 0.15-0.25 | [65] |
| concrete | 0.17-0.27 | [65] |
| savanna and grassland | Below 0.18 | [68] |
| grassland | 0.2 | [69] |
| bare ground | 0.2 | [64] |
| desert | 0.25-0.30 | [65] |
| cement foundation surrounded by sand | 0.3 | [70] |
| average ground albedo | 0.3 | [71] |
| concrete | 0.30–0.35 | [67] |
| dune sand | 0.35-0.45 | [65] |
| sand | 0.4 | [64] |
| white pebbles | 0.5-0.6 | [64,67] |
| concrete | 0.50-0.55 | [72] |
| white tiles | 0.7–0.8, | [67] |
| fresh snow | 0.75-0.95 | [65] |
| highly reflective material (mirror or white surface, capable of total reflection) | 1 | [64] |
Table 2.
General modeling settings for the 4.5 kWp systems (bifacial and monofacial).
| Characteristics | Used value |
| Total nominal (peak) power capacity | 4.5 kWp |
| DC-to-AC ratio | 1.14* |
| Pole height | 1.35 m |
| Pole spacing | 3.00 m |
| Mounting type | Ground mounting |
| Solar tracking | None (fixed orientation) |
| Aladdin energy analysis option: sampling frequency | 30 samples per hour (the highest available value) |
| Inverter efficiency | 98%** |
| Bifacial PV module | Jinko Solar Tiger LM 72HC-BDVP*** (Monocrystalline cells, 72 cells as 144 half-cut cells per module) |
| Bifacial PV module type and nameplate DC power | JKM450M-72HLM-BDVP (450 Wp) |
| Number of bifacial PV modules | 10 |
| Monofacial PV module | Jinko Solar Eagle PERC 60M (Monocrystalline cells, 60 cells per module) |
| Monofacial PV module type and nameplate DC power | JKM300M-60 (300 Wp)**** |
| Number of bifacial PV modules | 15 |
| * In the external study used here for bifacial benchmarking cases, the reported DC-to-AC ratio was 1.13 (computed as 34.00 kWp ÷ 30.00 kWac = 1.1333). Here, the DC-to-AC ratio is slightly increased to 1.14 to have the same inverter’s nominal AC power of 30.00 kWac of the external benchmarking cases despite the PV nominal peak power here being 34.20 kWp (rather than 34.00 kWp). Thus, the entered DC-to-AC ratio in our Aladdin simulation is computed as 34.20 kWac ÷ 30.00 kWp = 1.1400). This value (1.14) is then retained in all other main simulations (the simulations dedicated to obtaining data for the seven Omani cities, not for benchmarking in the Turkish site of Salihli). ** This inverter efficiency was estimated from the external study for the bifacial benchmarking cases, as the quotient of dividing 65,038 kWh (AC output energy from the inverter stage, available for addition into the grid) by 66,229 kWh (DC output energy from PV array). This quotient is 0.9820. In Aladdin, the resolution that could be recognized as a user’s input value for this parameter was 0.01 (two digits after the decimal point). Thus, the value of 0.98 (rather than 0.9820) was used after rounding to two decimal places. *** In the external study for the bifacial benchmarking cases, the bifacial module was GG1H-425 Bifacial PERC-72 by the Turkish PV manufacturer GTC. This exact type was not available in the online energy modeling software “Aladdin” at the time of conducting this study. Thus, an alternative model was used with proper adjustments in the number of PV panels and DC-to-AC ratio to make the modeled bifacial PV system equivalent to the one in the external study. **** This choice of the PV module type (JKM300M-60) allows us to construct a reference monofacial PV system with the exact DC power capacity of the bifacial system (given that: 10 modules × 450 Wp “bifacial” = 15 modules × 300 Wp “monofacial”). Also, the use of the same manufacturer (Jinko Solar) as the bifacial PV system we model is encouraged for more consistency. | |
Table 3.
Additional specific modeling settings for the benchmarking case.
| Characteristics | Used value |
| Location | Caferbey (community/village), Salihli (municipality/district), Manisa (province), Turkey |
| Latitude (degree, minute, second – DMS) | N 38°28'38" |
| Longitude (degree, minute, second – DMS) | E 28°5'50" |
| Latitude (decimal degree – DD) | 38.4772° N |
| Longitude (decimal degree – DD) | 28.0972° E |
| Tilt | 30° (year-round optimum) |
| Azimuth angle | 180° from north (0° from south) |
| Row-to-row spacing (inter-row spacing, or array pitch) | 5 m |
| PV nameplate power capacity | 34.2 kWp (in the external study, 80 bifacial modules “GG1H-425 Bifacial PERC-72” by the Turkish PV manufacturer GTC were modeled in PVsyst, thus the nominal PV power was 34.00 kWp; here the modeled nominal PV power in Aladdin is 34.20 kWp, as 76 modules with 0.450 kWp each) |
| Inverter nameplate power capacity | 30 kWac (in the external study, this is obtained as: 34.00 kWp ÷ 1.1333; here, it is obtained as: 34.20 kWp ÷ 1.1400) |
| Number of rows of PV array | 4 (in the external study, 20 PV modules are stacked horizontally in each row; here, 19 PV modules are stacked horizontally in each row) |
| Albedo | 0.30 (for the low-albedo simulation) 0.65 (for the high-albedo simulation) |
Table 4.
Assessed deviation between the predicted annual electric yield from a 30 kWac bifacial system in the bifacial benchmarking case.
Table 4.
Assessed deviation between the predicted annual electric yield from a 30 kWac bifacial system in the bifacial benchmarking case.
| Albedo | Total annual electric yield (our study) | Total annual electric yield (external study) | Difference in total electric yield (our value – external value) | Averaged total electric yield | Relative deviation (difference÷average)×100% |
| 0.30 | 60,405.78 kWh/year | 60,600 kWh/year | –194.22 kWh/year | 60,502.89 kWh/year | –0.32% |
| 0.65 | 65,332.24 kWh/year | 65,038 kWh/year | 294.24 kWh/year | 65,185.12 kWh/year | 0.45% |
Table 5.
Additional specific modeling settings for the main simulation cases.
| Omani location | GPS coordinates (degree, minute, second – DMS) | GPS coordinates (decimal degree – DD) | Fixed optimum tilt |
| Buraimi | N 24°15'3'', E 55°47'35'' | 24.250833° N, 55.793056° E | 25° |
| Duqm | N 19°39'43'', E 57°42'13'' | 19.661944° N, 57.703611° E | 21° |
| Ibri | N 23°13'32'', E 56°30'56'' | 23.225556° N, 56.515556° E | 25° |
| Khasab | N 26°10'47'', E 56°14'51'' | 26.179722° N, 56.247500° E | 25° |
| Muscat | N 23°35'2'', E 58°24'28'' | 23.583889° N, 58.407778° E | 25° |
| Salalah | N 17°0'54'', E 54°5'32'' | 17.015000° N, 54.092222° E | 21° |
| Sohar | N 24°20'50'', E 56°42'33'' | 24.347222° N, 56.709167° E | 25° |
Table 6.
Approximate national (Oman) monthly (per-month) specific yield with monofacial PV modules (expressed in kWh/kWp/month).
Table 6.
Approximate national (Oman) monthly (per-month) specific yield with monofacial PV modules (expressed in kWh/kWp/month).
| Jan | Feb | Mar | Apr | May | Jun | Jul | Aug | Sep | Oct | Nov | Dec | Average |
| 142.3 | 139.3 | 151.4 | 154.4 | 167.5 | 152.3 | 140.4 | 149.0 | 161.8 | 170.3 | 154.8 | 138.3 | 151.8 |
Table 7.
Approximate national (Oman) monthly specific yield with bifacial PV modules and a low albedo of 0.30 (kWh/kWp/month).
Table 7.
Approximate national (Oman) monthly specific yield with bifacial PV modules and a low albedo of 0.30 (kWh/kWp/month).
| Jan | Feb | Mar | Apr | May | Jun | Jul | Aug | Sep | Oct | Nov | Dec | Average |
| 150.6 | 147.4 | 160.8 | 165.9 | 182.4 | 166.7 | 152.6 | 159.7 | 171.8 | 180.4 | 164.1 | 146.7 | 162.4 |
Table 8.
Approximate national (Oman) monthly (per-month) specific yield with bifacial PV modules and a high albedo of 0.65 (kWh/kWp/month).
Table 8.
Approximate national (Oman) monthly (per-month) specific yield with bifacial PV modules and a high albedo of 0.65 (kWh/kWp/month).
| Jan | Feb | Mar | Apr | May | Jun | Jul | Aug | Sep | Oct | Nov | Dec | Average |
| 161.0 | 157.4 | 172.2 | 178.9 | 198.3 | 181.7 | 165.5 | 171.6 | 183.5 | 192.4 | 175.4 | 157.1 | 174.6 |
Disclaimer/Publisher’s Note: The statements, opinions and data contained in all publications are solely those of the individual author(s) and contributor(s) and not of MDPI and/or the editor(s). MDPI and/or the editor(s) disclaim responsibility for any injury to people or property resulting from any ideas, methods, instructions or products referred to in the content. |
© 2025 by the authors. Licensee MDPI, Basel, Switzerland. This article is an open access article distributed under the terms and conditions of the Creative Commons Attribution (CC BY) license (http://creativecommons.org/licenses/by/4.0/).
Copyright: This open access article is published under a Creative Commons CC BY 4.0 license, which permit the free download, distribution, and reuse, provided that the author and preprint are cited in any reuse.


