
Submitted:
25 October 2025
Posted:
27 October 2025
You are already at the latest version
Abstract
In the current study, the simulation software (Aladdin) is assessed and demonstrated in detail with regard to its ability to numerically modeling monofacial and bifacial photovoltaic power systems. The electricity generation from monofacial photovoltaic systems, from bifacial photovoltaic systems at a low albedo, and from bifacial photovoltaic systems at a high albedo in seven cities of Oman is analyzed. Both annual outputs and monthly variations are compared, and national-level estimates are derived. The study asserts the huge potential of solar energy in Oman, as demonstrated by an attractive electric yield that can exceed 2 MWh/kWp/year (5.5 kWh/kWp/day). The current study does not recommend using bifacial photovoltaic modules in dark soil lands (having a very low albedo near 0.1) due to the insignificant gain that is combined with a cost penalty, extra handling challenges due to having the rear side covered with optically sensitive photovoltaic cells, and added restrictions against utilizing the rear side as a heat source in case the bifacial photovoltaic system is upgraded to a hybrid photovoltaic-thermal system. The current study is useful to both a local audience having a particular interest in the Omani energy mix and the prospective transitioning to renewable energy, and a global audience having an interest in computer-aided engineering (CAE) of photovoltaic power systems.
Keywords:
computer-aided engineering
; renewable
; photovoltaic
; albedos
; Aladdin
1. Introduction
1.1. Background
The United Nations adopted 17 broad Sustainable Development Goals (SDGs) or “Global Goals” in 2015 as a universal initiative that shapes a multi-faceted 2030 vision toward ending poverty, protecting the Earth, and reaching a global state of prosperity and peace [1,2]. The seventh Sustainable Development Goal (SDG 7 Affordable and Clean Energy) is particularly important because it penetrates into almost all other SDGs [3]. SDG 7 recognizes that increasing demand for energy that is derived from burning fossil fuels (coal, crude oil, and natural gas) poses an environmental threat due to the byproduct of greenhouse gas (GHG) emissions and consequently climate change [4]. Therefore, phasing out fossil fuels in favor of renewable energy resources (such as solar energy, wind energy, and hydropower) is vital for achieving SDG 7 by 2030 [5].
SDG 7 has five targets, which are:
- Target 7.1: By 2030, ensure universal access to affordable, reliable and modern energy services.
- Target 7.2: By 2030, increase substantially the share of renewable energy in the global energy mix.
- Target 7.3: By 2030, double the global rate of improvement in energy efficiency.
- Target 7.a: By 2030, enhance international cooperation to facilitate access to clean energy research and technology, including renewable energy, energy efficiency and advanced and cleaner fossil-fuel technology, and promote investment in energy infrastructure and clean energy technology.
- Target 7.b: By 2030, expand infrastructure and upgrade technology for supplying modern and sustainable energy services for all in developing countries, in particular least developed countries, small island developing states, and land-locked developing countries, in accordance with their respective programmes of support.
Target 7.2 of SDG 7 has one indicator [6], which is
- Indicator 7.2.1: Renewable energy share in the total final energy consumption.
There has been considerable progress in that target. For example, the share of renewables in the total final energy consumption (TFEC) reached 17.9% in 2022. In the electricity sector alone, the share of renewable energy in the total final electricity consumption (TFELC) was 30% in 2022.
Target 7.b also has one indicator, which is
- Indicator 7.b.1: Installed renewable energy-generating capacity in developing and developed countries (in watts per capita)
There has been considerable progress in that target as well. In 2023, the global renewable energy capacity per capita reached a record 478 W/capita. This means a 13% increase from the 2022 value. Developed countries reached 1,162 W/capita, and developing countries reached 341 W/capita.
More deployment of solar energy systems is an important way to achieve the 7th Sustainable Development Goal (SDG 7). The strong connection between SDG 7 and solar energy is depictable in the iconic symbol of that SDG, which is the sun. Because the solar energy market is dominated by photovoltaic (PV) power systems [7], and because the other branch of solar energy (concentrated solar power, CSP) cannot compete with PV systems in terms of the cost of produced electricity over the lifetime of the system [8] (the levelized cost of electricity, LCOEL [9]); then speaking about photovoltaic energy is de facto equivalent to speaking about solar energy. More deployment of such PV systems is necessary to meet the expectations of SDG 7.
Photovoltaic (PV) solar power technology is the fastest-growing renewable energy type [10,11,12]. Although the PV solar technology had a small share of the global electricity generation (5.4%) at the end of 2023, the share of electricity generation by all renewable energy sources was also not high (30.3%), making the PV solar technology one of the three main contributors to clean electricity, coming in the third place after the hydropower (hydroelectricity) technology (14.3% share) and the wind technology (7.8% share; counting both onshore and offshore wind systems) [13]. Other renewable energy technologies; such as concentrated solar power (CSP), geothermal power, and ocean wave power; contributed a small share of only 2.8% of the electricity generation in 2023 globally (this is half of the contribution made by PV solar alone). The global PV installations are growing rapidly enough to predict that this renewable energy technology may exceed the wind power technology in 2027, and then exceed the hydropower technology in 2029.
Photovoltaic (PV) solar electricity generation has increased by 25% in 2023 (relative to the 2022 value of 1,280 TWh), which is an increase of 320 TWh, causing the global generation using this renewable energy technology to reach 1,600 TWh. This increase of 320 TWh of renewable electricity in 2023 was the largest among all renewable energy technologies in 2023. The global capacity of the PV power technology reached 1.411139 TW in 2023, marking a large capacity addition of 0.346864 TW compared to the power capacity of 2022 (1.064275 TW), and this capacity addition was 32.59% of the 2022 global PV capacity [14,15,16].
Photovoltaic (PV) solar power technology is on track for achieving the Net Zero Emissions by 2050 (NZE) Scenario of the International Energy Agency (IEA) [17]. PV solar power has several advantages when compared to other renewable energy technologies (such as renewable biofuels, thermoelectric generators [18], geothermal power [19], concentrated solar power [20], and wave energy [21]) that help in the rapid deployment of these renewable energy systems, such as modularity, maturity [22,23], predictability [24], attractive lifetime [25], simple infrastructure, flexibility in terms of the installation scale, immediate output generation, and the lack of moving parts [26]. On the other hand, the wind power technology and the hydroelectricity power technology are not growing at a satisfactory rate [27]. Similarly, electrification (which is a promising route for decarbonization [28]) is not progressing globally at a satisfactory pace [29,30], but needs more accelerated efforts [31,32]. Likewise, sustainable transitioning in the areas of building envelopes [33,34] and space-cooling technologies [35,36] is in need of corrective actions.
Photovoltaic (PV) solar power is a potentially successful way for achieving a global energy transition, which is important for mitigating greenhouse gas (GHG) emissions from combustion processes [37] in conventional fossil-fuel-fired power plants or industrial processes in chemical plants [38,39,40], thereby combating climate change [41].
Photovoltaic (PV) solar power technology has advanced in the past years through introducing adaptations that increase the energy conversion efficiencies of the individual PV modules (panels). Such upgrades in the PV technology include the half cut (HC) cells or half-cells [42,43], the passivated emitter and rear contact (PERC) topology [44,45,46], the multi-busbar (MBB) and super multi-busbar (SMBB) connectivity [47,48,49], the N-type design [50,51], and the interdigitated back contact (IBC) layout [52,53,54].
The bifaciality concept is another technology improvement for PV modules, where not only the front face of the module is able to convert solar radiation into direct current (DC) electricity, but also the rear face [55,56,57]. Bifacial PV modules had a global market share of about 5% in 2016, which increased to 15% in 2019, then increased to 20% in 2020, and reached 33% in 2023 [58,59,60]. The global market share of bifacial PV modules is expected to reach 50% in 2026, 60% in 2029, and 70% in 2033 [61] (or even as early as 2030 [62]). The global market of bifacial photovoltaic modules was predicted to grow at a CAGR (compound annual growth rate) of 15.1% between 2024 and 2030 [63], and at a CAGR of 18.17% between 2024 and 2032 [63,64].
A key factor in the feasibility of a bifacial PV module is the ground albedo (or ground reflectivity) for the constructed foundation or the plain land beneath the installed bifacial PV modules. The ground albedo is a radiative property that describes the ability of the ground (the foundation or land) under the PV modules to reflect incident solar radiation, and this reflected part forms a source of irradiance to the rear faces of the bifacial PV modules [65,66]. Like other radiative properties, such as the emissivity and absorptivity, the albedo can be a spectral function of the wavelength of the incoming radiation [67,68]. However, it is common to treat the ground albedo as a scalar quantity, which means a spectrally-integrated value [69,70]. It is useful to add here that the electromagnetic spectral wavelength portion of interest for crystalline silicon PV modules is approximately 0.4–1.1 μm (400–1,100 nm) [71,72]. Therefore, strictly speaking, the albedo for PV solar power applications should be an integrated value of the spectral reflectivity over this range [73,74]. However, in the current study, these spectral characteristics were overlooked for simplification [75,76]. Likewise, the directional [77,78,79]characteristics [80,81] and seasonal characteristics [82,83,84] of the albedo are not considered here.
Bifacial PV modules are rated by their front-face-only peak power capacity at standard test conditions (STC) [85]. The electricity generation from the rear face of the bifacial PV module is typically estimated as a percentage of the front-face-only performance, and such a percentage is called bifacial gain (BG) [86]. The bifacial gains (BG) describe the expected gain in the total (considering the contribution of both the front face and the rear face) DC power output as compared to the contribution from the front face only [87]. It should be noted that the rear face of the bifacial PV module is not simply a duplicate layer of the front face that is affixed to its rear side. This apparently simple design/manufacture approach may double the cost of the module while only a small gain can actually be achieved (because in any case, the rear face is known to receive much less irradiance than the front face, and this “indirect” irradiance has a different nature than the “direct” irradiance received by the front face). Therefore, the rear face should be customized such that it does not lead to a large cost increase through admitting less efficiency and operational quality than that of the front face. The rear face of a bifacial PV module is less efficient in converting incident radiation into DC power output than the front face. The ratio of these energy conversion efficiencies (the rear efficiency to the front efficiency) at the standard test conditions (STC) is denoted by the bifaciality factor (BF) or the module bifaciality (MB) [88,89,90].
A number of studies were performed recently, in which the impact of albedo on bifacial photovoltaic (PV) cells or modules was investigated, and the performance of bifacial PV cells or modules was compared to that of monofacial ones.
For example, simulations were conducted using the online calculator (SunSolve™) [91] to analyze the characteristics of a monofacial PV cell and a bifacial PV cell under standard test conditions (STC) with different albedos [92]. The simulation results showed that the bifacial solar cell produces more short-circuit (SC) current density and more DC output power relative to the monofacial cell. Also, the results of that study concluded that higher output power is delivered at higher albedos.
In another study [93], the performance of a bifacial photovoltaic system (consisting of a single PV module) at different albedo conditions was compared experimentally to that of a monofacial photovoltaic system (consisting also of a single PV module) at Heriot-Watt University, Edinburgh campus, UK. The researchers augmented their study through numerical simulations using the commercial solar modeling tool “PVsyst” [94,95,96], and they used it to estimate the bifacial gain at different albedo values. They reported a high bifacial gain of 19.6% when white tiles were used as a ground cover. They reported an intermediate bifacial gain of 12.4% when white pebbles were used as a ground cover. They reported a low bifacial gain of 10.5% when concrete was used as a ground cover. Their study showed consistency with the output of the PVsyst simulations.
Another study [97] evaluated the annual performance of a bifacial photovoltaic system in Beijing (China) by considering dynamic variations of environmental/outer conditions, and found that a bifacial gain between 12.37% and 15.50% can be reached. In that study, the bifacial PV modules had a bifaciality factor (BF) of 80%, and a front-side efficiency of 21.23%.
1.2. Importance of Photovoltaic Energy for Oman
Oman has recently paid a lot of attention to solar energy and other alternatives [98,99] to the traditional gas-fired combined cycle and gas turbine power plants [100,101] (natural gas accounted for 88% of the country’s total energy supply “TES” in 2022 and it accounted for over 95% of Oman’s electricity generation in 2023 [102]), economic diversification [103], education and scientific research [104], sustainable cities [105,106], mobility [107,108,109,110], globalization [111,112], novel solutions for a low-carbon environment [113,114], and urbanization [115]. The country adopted an ambitious green hydrogen national program with the aim of becoming a global producer and exporter of green hydrogen by 2030 [116,117]. This large-scale investment in green hydrogen also requires a large-scale investment in photovoltaic power systems, which are expected to supply roughly half of the renewable electricity needed to operate the water electrolyzers that produce the green hydrogen from water (with the remaining renewable electricity to be produced using wind farms) [118,119,120]. Green hydrogen (or e-hydrogen or electric hydrogen) is a clean alternative energy carrier that can be used as a fuel (either via combustion [121,122] or via fuel cells [123,124,125]). Green hydrogen can also be used as a feedstock for producing sustainable fuels (such as SAF “sustainable aviation fuel”, also called e-kerosene [126]), for producing renewable feedstock chemicals (such as green methanol [127] and green syngas [128,129]), for producing synthetic industrial products (such as green ammonia [130,131]). It can also be used in oil refineries through hydrocracking to break down heavy petroleum fractions into more valuable lighter products [132,133], and in hydrotreating (also called hydrodesulfurization) to remove sulfur and other undesirable impurities (like nitrogen) from petroleum products and from natural gas [134]. Green hydrogen can also be used in microgrids that are powered by green hydrogen, and these microgrids represent energy infrastructures that depend on green hydrogen as their primary energy carrier in a local network [135].
1.3. Goals of the Study
The current study extends the research work conducted in the areas of bifacial photovoltaic power generation, its gain compared to monofacial units, and general photovoltaic system simulations.
The current study is considered to have an educational value, where some of the contents can be used in teaching undergraduate and postgraduate courses [136] in renewable energy, computer-aided engineering, and sustainability [137,138], and clean energy generation.
The goals of the current study can be summarized as follows:
- To introduce the approximated bifacial gain (ABG) as an effective metric to compare bifacial PV modules or systems against monofacial ones
- To present how the modeling software “Aladdin” provides powerful features in modeling monofacial PV systems and bifacial PV systems
- To assess the annual and monthly electricity generation from monofacial PV systems in seven Omani cities
- To assess the annual and monthly electricity generation from monofacial PV systems in Oman as a whole
- To assess the annual and monthly electricity generation from bifacial PV systems under low albedo in seven Omani cities
- To assess the annual and monthly electricity generation from bifacial PV systems under low albedo in Oman as a whole
- To assess the annual and monthly electricity generation from bifacial PV systems under high albedo in seven Omani cities
- To assess the annual and monthly electricity generation from bifacial PV systems under high albedo in Oman as a whole
Seven cities in Oman were selected to perform simulation-based assessments of the gain of bifacial PV modules over monofacial PV modules. These cities form good geographic and climatic diversity for the country. Ordered alphabetically, the selected Omani cities in the current study are
- Buraimi or Al Buraimi [139] (an inland city bordering the United Arab Emirates, about 270 km “straight-line distance” west-northwest of Muscat)
- Duqm or Al Duqm [140] (a coastal city in the east of Oman, facing the Arabian Sea)
- Ibri [141] (an inland city, about 200 km “straight-line distance” west-southwest of Muscat)
- Muscat [144] (the capital of Oman, a coastal city facing the Gulf of Oman)
- Salalah [145] (a coastal city in the south of Oman)
- Sohar [146] (a coastal city in the northern mainland of Oman, facing the Gulf of Oman)
1.4. Contribution to Existing Literature
Despite the availability of previous studies related to some of these research questions, the current study contributes to the field of solar photovoltaic utilization in Oman and the computational modeling of photovoltaic systems in general by addressing all research questions together. Therefore, the current study can be of interest to those seeking a top-level overview of the expected gain in electric generation due to either installing a new bifacial photovoltaic power system or upgrading an existing monofacial photovoltaic system to a bifacial version. The current study can also be of interest to those seeking a free yet powerful alternative tool for modeling photovoltaic systems (both monofacial and bifacial), as an alternative to commercial tools or limited-functionality free tools [147,148], with artificial intelligence capabilities and evolutionary computation concepts [149,150]. This can be particularly valuable in educational settings [151] by including such tools in teaching undergraduate STEM (science, technology, engineering, and mathematics) subjects and artificial intelligence subjects [152,153,154] related to sustainability, photovoltaic solar systems, concentrated solar power, wind energy, green building design, and energy storage. Aladdin is capable of handling all these topics in a convenient interactive cloud environment for computer-aided engineering (CAE).
2. Research Method
2.1. Research Type
The present study falls under the category of quantitative applied research, where a combination of solar energy principles and numerical modeling software is used to answer well-defined research queries.
2.2. Rationale Behind the Technical (Non-Economic) Scope of the Study
The current study is focused on technical performance, expressed in terms of the annual and monthly estimated electricity generation, and how bifacial PV modules outperform monofacial PV modules at different geographic locations in Oman at two important albedos. The economic aspect of the comparison between monofacial and bifacial PV modules in Oman is not covered here. Such economic analysis is largely volatile compared to the energy analysis performed here, where costs not only change over time, but also change from one location to another depending on several factors like shipping expenses, scale of the installation [155], pre-existing infrastructure, possibility of power purchase agreement (PPA) or solar lease [156], subsidies or external financial aids, aimed project lifetime [157], time-dependent load profile, power demand variations, energy storage options, constraints on the available land, ground coverage ratio (GCR) [158], structural design, terrain profile, wind loads, and hydrodynamic forces [159], or aerodynamic fluctuations. Therefore, the scope of the current study is limited to the energy performance of the simulated photovoltaic systems, and further economic investigation is left to the interested installers or investors; and such an additional economic [160] feasibility study can be performed using conventional economic metrics, such as the levelized cost of electricity (LCOEL) [161], simple payback period (SPP) [162], internal rate of return (IRR) [163], and net present value (NPV) [164].
2.3. Rationale Behind the Seven Selected Omani Cities
A justification for selecting the seven Omani cities for analysis in the current study can be made here as follows:
Khasab is a representation of the northern part of Oman.
Salalah is a representation of the southern part of Oman.
Duqm is a representation of the eastern part of Oman.
Buraimi is a representation of the western part of Oman, near the country’s western borders with the United Arab Emirates (UAE) and the Kingdom of Saudi Arabia (KSA).
Ibri is a representation of the middle part of Oman.
In addition to their four geographic-edge cities, the capital, “Muscat” is included due to its political importance.
Similarly, the port city “Sohar” (or “Suhar”) is also added as an important economic center and industrial hub in Oman [165,166]. Sohar was the capital of Oman during an ancient era [167]. Sohar has the second established university, “Sohar University (SU)” in Oman; coming into operation after the first established university, “Sultan Qaboos University (SQU)” in Muscat was established [168].
In the remaining part of the current subsection, useful information about these seven Omani cities is provided. This information familiarizes the reader with these sites, and also helps in making the results reproducible. This information includes the geographic GPS (global positioning system) coordinates (displayed in two common formats for convenience) [169,170], and the optimum tilt angle as estimated by the PVGIS (Photovoltaic Geographical Information System) modeling tool [171].
The information about the seven selected Omani cities is listed in Table 1.
2.4. Rationale Behind the Two Selected Albedos
A large number of ground albedo values are mentioned in the literature, depending on the type of ground. The albedo can be determined naturally based on the original type of the ground, or controlled through adding an artificial cover layer that improves sunlight reflection [172,173,174]. In Table 2, examples of these estimated albedo values under different conditions are listed. In the current study, two values of albedo are considered of special interest; which are 0.30 (a low value, representative of plain sandy or dusty land without specialized land coverage) and 0.65 (a high value, representative of ground covered with white pebbles or white tiles).
As shown above, literature data suggest that the albedo value representative of bare sandy ground is reasonably 0.30, while the albedo value representative of artificially whitened ground is reasonably 0.65. Therefore, these two albedo values (0.30 and 0.65) are adopted in the current study; respectively; as a low-albedo configuration corresponding to untreated natural ground foundations over which the PV modules are mounted, and a high-albedo configuration corresponding to a treated ground foundation covered by a white artificial cover to boost the light reflection to mounted bifacial PV modules.
Figure 1 is a photo of a bifacial photovoltaic system, with a plain soil ground. This example can represent an albedo value of about 0.1 (very low albedo). If the ground is sandy, it becomes lighter in color and more reflective; thus, it can represent a better albedo of 0.30 (low albedo).
Figure 2 is a photo of a bifacial photovoltaic system also, but with the ground covered by white gravel to increase the albedo. This example can represent an albedo value of 0.65 (high albedo). If the ground is processed further by covering it with very white and very smooth tiles, it becomes lighter in color and more reflective; thus, it can represent a better albedo near 0.8 (very high albedo).
2.5. Rationale Behind the Fixed Albedo
In the performed Aladdin simulations, the ground albedo is treated as a fixed input parameter (either 0.30 or 0.65) during a computer simulation that results in estimating the annual yield of electricity. Therefore, this assumption of a constant albedo ignores the fact that albedo changes seasonally, and this affects the performance of the bifacial PV system. However, one justification for this is the scope of the study and its goals. When the albedo is fixed at a single value, it becomes easier to view it as an independent scalar parameter; while if it is treated as a time-varying function, its impact on the year-wise electricity performance becomes difficult to quantify. Another justification is that Oman has a hot climate where snow is not expected. In addition, precipitation (stormwater) is infrequent. Thus, seasonal variation in the albedo due to such weather influences becomes negligible. Furthermore, having the same assumption (fixed albedo) when comparing the performance of a bifacial system establishes a fair and meaningful comparison. Therefore, the fixed albedo assumption appears to be not only reasonable, but also recommended in the current study.
2.6. Rationale Behind Modeling Single-Row PV System
In the performed simulations here for Omani cities, small-capacity PV systems having a single row in an open area were intentionally modeled. Thus, shadows from nearby objects or due to self-shading from neighboring PV modules are not present. This assumption helps in focusing attention on the influence of the important variables for this study, such as the albedo and the city location, while suppressing undesirable influence from the shadows. In addition, a properly spaced and sited PV array can have a small shading loss [187,188], which makes this simplification nearly realizable. The shading loss factor is system-specific (requires information about the terrain and nearby objects around the PV system), and thus, it is better to exclude it from the analysis in the current study in order to reduce uncertainty and elevate generalizability.
By modeling a single row of PV modules (rather than multiple rows) here, the advantage of reducing the influence of self-shading [189,190] caused by neighboring PV rows is achieved.
The elimination of this self-shading effect makes the results of the current study more general and less affected by the pitch (spacing) design parameter of PV rows, which arises in a multi-row PV array. This design decision makes the current study focused successfully on the influence of the bifaciality feature of the PV modules.
2.7. Rationale Behind Modeling Fixed-Panel PV System
Similarly, being a fixed PV array, not equipped with a sun tracking mechanism, either with one degree of freedom [191] (1 DOF or single-axis) or two degrees of freedom (2 DOF or two-axis) [192] helps in eliminating additional details with regard to these optional features, and thus removes the interference of these design options with the results of the current study. The current study aims to concentrate on the bifaciality feature of the PV module, and the albedo feature of the ground. The simplifications made in the modeled PV system are thus important and purposefully useful.
2.8. Aladdin (The Primary Photovoltaic Modeling Tool Here)
The main simulation tool used in the current study is “Aladdin” [193], which is a free cloud-based simulation tool by the Institute for Future Intelligence (IFI) in Natick, Massachusetts, USA [194]. Aladdin is a project supported by the United States National Science Foundation (NSF), an independent federal agency [195,196,197,198]. Aladdin is designed to model and predict the performance of different domains of renewable energy systems and architectural designs (not just photovoltaic systems), such as wind farms, buildings (energy demands and heat map of the envelope), solar updraft towers, and battery storage [199].
The modeling process of Aladdin follows a system-level integral approach based on satisfying steady-state energy balance (energy conservation). Thus, the incoming solar radiation to a PV module should exactly be equal to the electricity produced (through predefined energy conversion efficiency that depends on the module’s temperature), and the remaining energy is dissipated as heat.
Like several other engineering and industrial modeling software programs (such as Aspen HYSYS in modeling chemical processes [200]), the system-level integral approach is realistic because it combines speed and simplicity while providing an adequate level of detail. On the other hand, point-level differential approaches require solving the nonlinear system of partial differential equations that govern the thermal and transport aspects of the modeled system to compute the spatial and/or temporal distribution of the fluids and solids within the system [201]. A computational fluid dynamics (CFD) [202] software tool, like Ansys Fluent, falls under this differential approach. It provides enormous amounts of details for the solution [203,204], and permits powerful modeling capabilities. However, the excessive demands on computational power and specialized computational skills do not justify using CFD modeling [205,206] instead of a simpler but sufficient integral approach [207].
More details about the modeling within Aladdin, the assessment of its accuracy versus independent data sources, and the quality of its built-in weather database (for more than 800 locations in the world) can be found in an earlier work and also in another reference that describes a mathematical framework followed by Aladdin [208].
2.9. Demonstration of the Aladdin Modeling Environment
To further demonstrate the online modeling program Aladdin, various views of its simulation environment are provided in the current subsection, showing how the modeling process is performed using this free simulation tool that has the ability to model photovoltaic solar systems as well as some other renewable energy technologies.
It is worth mentioning here that Aladdin uses solar time, rather than standard/local time [209]. Thus, 12 noon in Aladdin means the instant during the day at which the sun is at its peak elevation (maximum height) in the sky. This convention allows better modeling that eliminates the effects of time adjustments due to changes in longitudes [210] or daylight saving time [211,212] (daylight saving time is not practiced in Oman). This feature has the advantage that Aladdin simulation data that correspond to different geographic locations or days of the year can be compared and interpreted more meaningfully and more consistently, especially data that involve variation during the day.
Figure 3 shows the entire screen of the Aladdin program and also shows the monthly weather data available (maximum and minimum air temperature, and sunshine hours) for Muscat (the capital city of Oman) on 21 December at 12 noon solar time. The heliodon (the locus surface of the sun’s position relative to the modeled system on the ground) effectively visualizes the elevation angle of the sun at that time [213,214]. Also, the shadows of the photovoltaic modules are adequately compatible with the sun’s position.
Figure 4 is another view of the same example system in Muscat at the solar noon, but on 21 June (instead of 21 December). The elevation of the sun is nearly 90° as expected for this geographic location at this selected instant, causing the shadows to be approximately at their minimum extent.
Figure 5 shows monthly weather data as displayed for the western Omani city of Buraimi, as a selected example. Because Buraimi is not among the cities in the database of Aladdin, the nearby city of Dubai (United Arab Emirates) is used as an alternative source of climate data. The straight-line distance between the two cities is 124 km (77 mi) [215]. The sun’s position in this figure corresponds to 5 pm solar time (which means five hours after the sun was at its highest level in the sky). The day is 21 June.
Figure 6 shows hourly profiles of air and ground temperatures as displayed by Aladdin for Buraimi also. The sun’s position in that figure corresponds to 2:30 pm (solar time) on 21 June. A brighter scene is noticeable in this figure when compared to the previous one; and this indicates the realistic rendering capability of Aladdin, where solar illumination is properly visualized.
Figure 7 shows the feature of adopting a user-defined photovoltaic panel in Aladdin, outside those already pre-defined commercial photovoltaic panels within the software, by specifying general properties. These general properties include the crystallinity type (monocrystalline or polycrystalline [216,217]) and the dimensions (length and width). The sun’s position in that figure corresponds to 12 noon (solar time) on 21 June, and the location is still Buraimi. An even brighter scene can be recognized in this figure compared to the previous figure, and this increase in optical brightness is compatible with the higher elevation of the sun.
Figure 8 is a sequel to the previous figure, where the electric properties of a new user-defined photovoltaic panel can be specified for a customized panel. These electric properties include the rated voltage (Vmpp) at maximum power point (MPP) [218,219], the rated current (Impp) at maximum power point (MPP), the baseline cell efficiency at standard test conditions (STC), and the temperature coefficient of power (the negative rate at which the maximum power changes due to an increase in the cell temperature). The sun’s position in that figure corresponds to 9:30 am (solar time) on 21 June, and the location is still Buraimi. Compared to the previous figure, a slightly darker scene is possible to identify in the current figure as a result of the drop in the sun’s elevation.
Figure 9 shows how the ground albedo can be adjusted manually by the user in Aladdin, and shows that this albedo is approximated as a constant scalar parameter. The sun’s position in this figure corresponds to 7 am (solar time) on 21 June, and the location is still Buraimi. An even darker scene appears in this figure (compared to the previous figure) as a result of the lower elevation of the sun, which is here near the horizon.
Figure 10 displays characteristics of the Jinko Solar Eagle PERC photovoltaic module “JKM300M-60” (monofacial, 300 Wp, monocrystalline, 60 cells per module) [220,221] as per its pre-defined records in Aladdin. The sun’s position in this figure still corresponds to 7 am (solar time) on 21 June, and the location is still Buraimi. However, it can be observed that the scene here is darker than the scene in the previous figure although the sun position is the same. This is explained by an intentional artificial darkening by the Aladdin program to allow visual emphasis on the displayed window having the PV module’s properties. The displayed data are in good agreement with the manufacturer’s specifications. For example, the displayed standard test conditions (STC) cell efficiency of 18.33% by Aladdin is exactly equal to the one appearing in the manufacturer’s datasheet. Also, the nominal operating cell temperature (NOCT) of 45.0 °C displayed by Aladdin is compatible with the information in the manufacturer’s datasheet, which includes additional information about the uncertainty or variability, expressing this property as 45±2 °C. The nominal operating cell temperature (NOCT) refers to the temperature reached by the cell (with a no-load open-circuit operation) under more realistic outdoor test conditions than the lab-type indoor standard test conditions (STC). The NOTC conditions correspond to less irradiance of 800 W/m2, and a calm wind with an air speed of 1 m/s and a bulk ambient temperature of 20 °C [222,223]. The NOTC air mass (AM) is still 1.5 as in the case of the STC reference environment.
Figure 11 shows hourly profiles of air and ground temperatures as displayed by Aladdin for the southern Omani city of Salalah. The sun’s position in that figure corresponds to 3 pm solar time on 21 December. The projection feature of Aladdin is used in this figure to display a perfect two-dimensional top view.
Figure 12 is similar to the previous figure (same location of Salalah and same solar time of 3 pm), except that the day changed from the extreme winter day of 21 December to the extreme summer day of 21 June. This change is intentionally adopted here to accentuate the corresponding big changes in the plotted temperature profiles and the marked sun position on the heliodon. On the heliodon, the sun was shifted from the extreme most-upright path to the opposite extreme most-inclined path, as expected. These logical changes support the robust implementation of sun path modeling in Aladdin.
Figure 13 shows a modified version of the modeling case in the previous two figures (the city is still Salalah, and the day is still 21 June) by changing the solar time from 3 pm to 12 noon. The albedo value of 0.65 (high) is displayed as an adjustable parameter. The sun’s position and the resultant irradiance brightness adequately changed in response to the change in the solar time within the model, where the sun reached its peak elevation, and thus the brightness is maximized.
Figure 14 is a continuation of the previous figure, where the Omani location (Salalah), the day (21 June), the solar time (12 noon), and the ground albedo (0.65) are preserved. The main new element of the current figure is the displayed one-day simulation results plot, which shows how the electricity generation (electricity yield) changes during that selected day of 21 June, in the form of hourly data points connected by a line curve. There are two output curves, one for a monofacial PV system, and another for a bifacial one. Either PV system has an STC (standard test conditions) capacity of 4.5 kWp. Although not shown in the figure, it is important to add that these plotted curves are interactive, and the user can extract numerical values of the plotted data points as well as can change the plot’s appearance (for example, by plotting the total summed yield from both systems together, rather than comparing the yield from the individual systems). Also, it is important to add that this example simulation is a daily one (for one day, in the form of hourly data points), but Aladdin also performs annual simulations (for the entire year, in the form of monthly data points).
Figure 15 is also a continuation of the previous figure, where the Omani location (Salalah), the solar time (12 noon), and the ground albedo (0.65) are preserved. However, the day changed from 21 June to 21 December. The daily simulation results plot is also the focus of this figure (like the previous figure). By contrasting the results plot in the current figure with the results plot in the previous figure, the seasonality influence on the yield profile during the day is efficiently demonstrated, and one can recognize the remarkable drop in the selected winter day (21 December) compared to the selected summer day (21 June). The change in the sun’s position and the small reduction in the scene’s natural illumination are additional useful changes that facilitate and validate the modeling process using Aladdin.
Figure 16 is again a continuation of the previous figure, where the Omani location (Salalah), the solar time (12 noon), and the day (21 December) are preserved. The only change made in the simulation settings compared to the previous figure is reducing the ground albedo from the high value (0.65) to the low value (0.30). While this albedo change does not affect the simulated monofacial system, it causes a decline in the electricity output from the bifacial system. Attention should be given to the scale of the vertical axis (the yield axis) because the axis’s range in the current figure (from 0 to 3.4 kWh) was automatically adjusted and became much smaller than that range in the previous figure (from 0 to 8 kWh). Thus, optical inspection in isolation of the companion axis range may give a false impression about the decline that occurred in the yield due to the decline in the albedo.
2.10. Aladdin Versus Other Solar Simulation Tools
It is admitted that the energy modeling program Aladdin is not as popular as other older software programs, like SAM (System Advisor Model) [224] or PVsyst [225]; Aladdin is relatively new (released January 2023), while these more common programs are much older (the first public version of SAM dates back to August 2007 [226,227], while PVsyst was released in 1992 [228]). Therefore, this disparity in popularity is justified. Also, Aladdin still has unique features that make it attractive; such as being totally free, being able to handle multiple domains of renewable energy systems as well as buildings, having a cloud-only environment, offering an easy way to store and share design cases (both online and offline), providing a user-friendly interactive interface (with animations and three-dimensional realistic rendering), having a broad built-in weather data, featuring convenient explanations of user parameters within the parameter-entry section itself (no need to consult a separate document), and being supported with a comprehensive set of ready-to-use complete examples. While SAM is also a free simulation software covering multiple domains of renewable energy [229]; it runs in a desktop environment only [230] (no cloud version like Aladdin), and it is more oriented toward techno-economic analysis [231], lacking the interactive user experience and three-dimensional visualizations of the system being modeled (like Aladdin). PVsyst is a highly trusted simulation software program within the photovoltaic industry, particularly for feasibility testing [232]. One of its great advantages is the detailed reporting, enabling informative documents about technical and financial performance [233], and thus making a decision regarding the system’s feasibility. However; PVsyst is not free like Aladdin (but requires paying an annual subscription fee [96]), it does not accommodate multiple renewable energy technologies like Aladdin, and it is not available on the cloud like Aladdin.
Despite being a recent simulation tool, Aladdin has been used in several research studies [234,235,236,237,238,239], and this testifies to its accuracy and impact.
It is pointed out here that Aladdin’s utilization can go far beyond engineering modeling. It can be customized for classroom teaching where engineering design, social studies, and environmental modules can be integrated [240]. Aladdin can be used in a visually appealing and attractive way to demonstrate specialized concepts to students [241]; such as multi-objective optimization [242,243], the difference between passive and active control, and the use of artificial intelligence (AI) in design [244].
2.11. Soiling Modeling
In the performed Aladdin simulations, soiling is modeled through an irradiance loss factor [245,246]. Soiling depends on the frequency of cleaning the photovoltaic modules as well as the terrain surrounding these modules, and these factors can be controlled even in a dusty environment [247,248]. Thus, no specific loss factor is necessarily the best. The default value of 5% in Aladdin is comparable to those mentioned in the literature, such as a range of 4–7% [249], a range of 3–4% [250], and a value of 6.5% after two months [251].
2.12. Tilt Angle Modeling
In the performed Aladdin simulations, the tilt angle of the PV modules was fixed at its optimum or typical value; and the same was adopted for the azimuth angle. The lack of solar tracking is favorable, as this eliminates its interference with the results as an additional binary design variable. Because Oman is located within latitudes of 26.5° N and 16.5° N (low latitudes, not very far from the equator) [252], the gain in electricity production due to a solar tracking mechanism is not large [253].
2.13. Uncertainty in Aladdin Validation
In the performed Aladdin simulations, there is uncertainty in part of the validation work reported in the current study due to the difference in the geographic location between the benchmarking simulation site and the regular simulation sites. One of the benchmarking cases corresponded to a location in Turkey, while the primary portion of the results corresponded to locations in Oman (which is located at much lower latitudes than the Turkish benchmarking location, thus having a different climate). The current study does not evaluate this matter. Although this is a valid limitation, the validation is not for the particular photovoltaic system modeled in the benchmarking test case. Rather, the validation testing is for the simulation software itself. Thus, being able to produce reasonable results in one place is an indication that the software has a sound prediction process regardless of the location at which it is applied.
2.14. Sensitivity to Albedo
Performing a sensitivity analysis or a parametric study can increase the robustness of the study’s findings by examining how variations in key parameters influence the results [254,255]. Conducting such a sensitivity analysis can also help identify the most critical factors affecting the performance of either monofacial or bifacial photovoltaic modules. However, sensitivity analysis deserves a dedicated new study (or even a series of studies) given the large design space that can be explored. Also, this sensitivity analysis is not one of the main goals of the current study, which has specific, well-defined points in the design space that are aimed to be investigated. Despite this, the Aladdin modeling software was used in additional simulations outside the two selected albedo values of importance (0.30 and 0.65), and it was found that the electric yield in all seven Omani sites considered here is linearly proportional to the ground albedo. Thus, the yield at an albedo value between 0.30 and 0.65 can be deduced via linear interpolation, and this is a reasonable behavior. Although performing additional sensitivity analysis for the ambient temperature can reveal interesting outcomes, such a climatic quantity is not a simple user-defined constant parameter; instead, it is a function of time that varies from one day to another. Therefore, a sensitivity analysis for such a quantity or similar quantities is not performed here, but is recommended as a possible extension of the study in the form of a follow-up study.
2.15. Auxiliary Photovoltaic Modeling Tools (Energy3D, PVGIS, PVsyst)
For inspecting the accuracy of the results derived from the Aladdin tool, comparisons were performed with results that were obtained using two other software tools (also free) through benchmarking [256]. One of the benchmarking photovoltaic simulation tools used for the current study is “Energy3D”, which is a desktop application capable of modeling photovoltaic (PV) systems and concentrated solar power (CSP) systems [257]. The other photovoltaic (PV) simulation tool used for inspecting the accuracy of the main results is the cloud-based software “PVGIS” (Photovoltaic Geographical Information System), managed by the European Commission’s Joint Research Centre (EC-JRC) [258,259,260]. The Energy3D and the PVGIS external benchmarking case is for monofacial photovoltaic (PV) systems, and the comparison with the data derived from Aladdin is in terms of the monthly AC electricity yield per unit peak power in Muscat (the capital of Oman). As of the time of preparing this study, neither Energy3D nor PVGIS has the capability of modeling bifacial PV systems.
In addition, published data in the literature were used, and these data were generated using a fourth modeling tool (commercial desktop software) for simulating photovoltaic power systems (including bifacial modules), which is “PVsyst”. PVsyst is a popular tool that has been used in several studies [261,262,263]. The PVsyst external benchmarking case is for a bifacial photovoltaic (PV) system, with a rated power of 30 kWac (alternating current form) in Salihli, Turkey [264,265,266].
2.16. Approximated Bifacial Gain (ABG)
Bifacial photovoltaic (PV) modules are commonly characterized by their expected bifacial gain (BG) values, which refer to the additional electric capacity or additional (secondary) electric energy from the bifacial module due to the contribution of its rear face; and this addition is expressed as a percentage of the base (primary) value corresponding to the front face. Therefore,
The bifacial gain (BG) is a good way to describe a particular bifacial PV module. However, it is computed for the same PV module. In a situation where a monofacial PV module is compared to another bifacial PV module with the same power capacity, the BG values become quite irrelevant and not very useful. For example, this aforementioned scenario can be faced when an individual or an organization wants to make a decision and choose whether to purchase a 10-kWp monofacial system or a 10-kWp bifacial system. The decision is not about either purchasing a 10-kWp bifacial PV system with BG 5% or purchasing the same 10-kWp bifacial PV system with BG 10%. The information about the bifacial gain (BG) for a given bifacial PV module does not aid in the decision-making in this example.
Therefore, another metric is introduced here with the purpose of assessing the performance of bifacial PV modules relative to monofacial modules, which is the approximated bifacial gain (ABG). The introduced ABG quantity is defined as the ratio of the additional electricity generated from a bifacial photovoltaic module or array relative to the electricity generated from another monofacial module or array having the same power capacity (same kilowatts-peak). It should be noted that for the bifacial module, the equivalent power capacity refers to the capacity of the front face only. Therefore, the following expression mathematically defines the proposed ABG metric:
Although the ABG and BG values have similar purposes, ABG is established when comparing a bifacial module with another reference monofacial module. On the other hand, BG compared a bifacial module under a certain operational condition with itself but under another operational condition (namely, when the rear-face electricity generation is disabled).
2.17. Advantages of Approximated Bifacial Gain (ABG) over Bifacial Gain (BG)
The ABG and BG values can be close to each other. Therefore, the reader may treat the ABG values as good indicators of the BG values.
To further clarify the relationship between the bifacial gain (BG) and the approximated bifacial gain (ABG) and why their values are expected to be close to each other but not necessarily the same, the following rationale is provided.
As a performance metric, the bifacial gain (BG) measures an increment in power or energy generation (expressed as a percentage) due to an added PV rear face to a base monofacial PV module. On the other hand, the approximated bifacial gain (ABG) measures also an increment in power or energy generation (and also expressed as a percentage) but due to replacing that base monofacial PV module (thus, having a front face only) with a different PV module that is bifacial (thus, having a front face and a rear face) provided that they generate the same electricity when operating at the standard test conditions (STC) while also having the replacement bifacial PV module blocked from any solar radiation on its rear side. If the front face of the replacement bifacial module is exactly the front face of the base monofacial module, only in this case does the ABG value become identical to the BG value (but their meanings remain different). In other conditions (other than the STC conditions), the numerical values of the ABG and BG metrics may deviate slightly due to differences in the performance of the two front faces outside the STC conditions.
The proposed approximated bifacial gain (ABG) is considered advantageous to the conventional bifacial gain (BG), because the approximated bifacial gain allows realistic evaluative comparisons between two different physical modules (one bifacial and another monofacial), rather than a theoretical estimate of performance due to hypothetical changes in the environment. Also, the proposed approximated bifacial gain can be experimentally obtained by measuring the electric output of the two compared photovoltaic modules simultaneously, while the conventional bifacial gain (BG) requires two sequential measurements (of the same bifacial photovoltaic module) at two different times.
2.18. Example of Using ABG for Informed Decision Making
There is one more difference between the bifacial gain (BG) and the approximated bifacial gain (ABG) that stems from the way they are interpreted. While the BG metric is purely technical (it gives information about how much extra electricity can be generated from a given bifacial PV module), the ABG metric has a broader and more useful scope, because it compares two different PV modules (one monofacial and another bifacial). Therefore, the ABG metric pertains more to a decision-making scenario, where a decision is sought regarding which of the two PV modules to purchase and install, and this decision can be effectively made by comparing the ABG value to the percentage of extra cost incurred by purchasing the more expensive bifacial module. If the ABG value is larger than the cost penalty (for example, 15% ABG versus 5% cost increase), then an informed decision can be made by selecting the biracial PV modules. The BG metric does not provide the advantage of quick feasibility testing and resolving the trade-off between the financial side and the technical side of a photovoltaic power system.
2.19. General Simulation Parameters for the 4.5 kWp Monofacial and Bifacial Systems
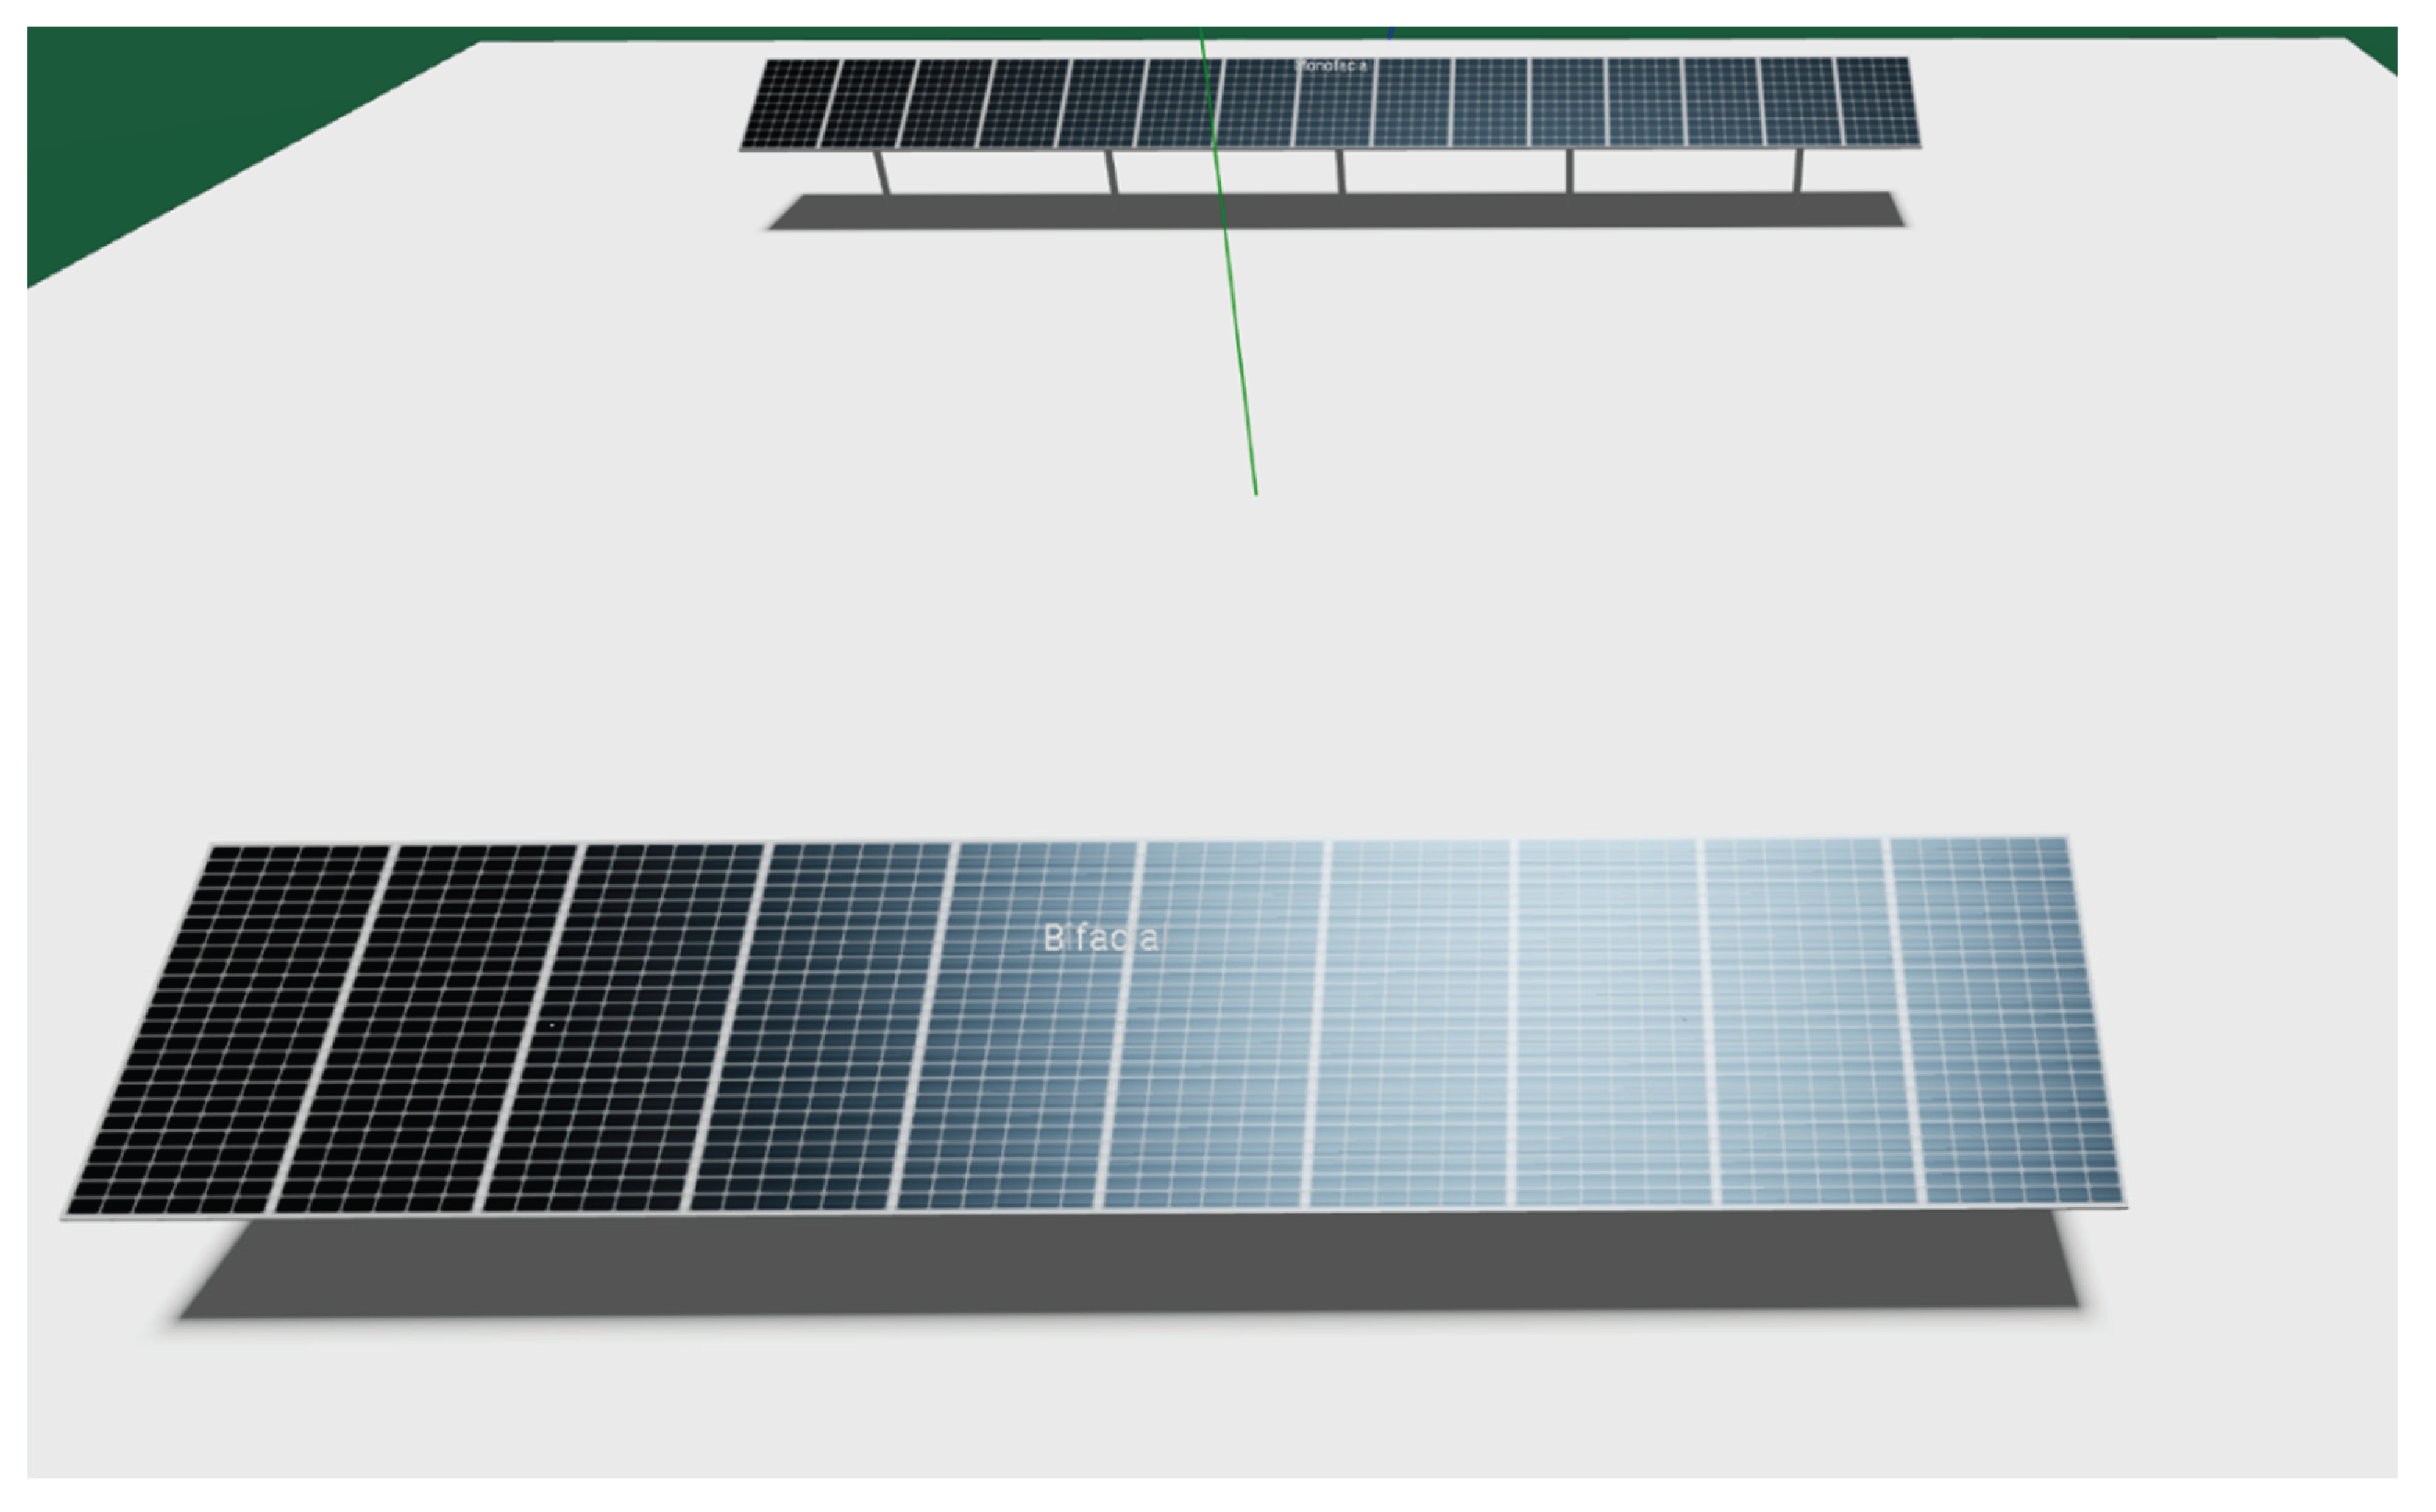
For estimating the electric gain and the albedo effect when using bifacial photovoltaic (PV) modules compared to a monofacial module, a small PV bifacial system was modeled in Aladdin, and this system consists of 10 ground-mounted modules (belonging to the JinkoSolar or “Jinko Solar” brand, which is a leading Chinese manufacturer of PV modules [267,268]) with a capacity of 450 Wp (0.45 kWp) each. Their layout is simply a single row, with a portrait orientation.
The tilt angle of the PV array is fixed at a year-round optimum value. The azimuth angle is 180° (if measured from the geographic north) or 0° (if measured from the geographic south). This azimuth angle means that the array modules are facing the geographic south, which is an optimized setting for fixed PV arrays installed in the northern hemisphere [269,270].
The reference monofacial PV system analyzed in Aladdin has the same rated power capacity of 4.5 kWp, but it consists of 15 PV monofacial modules (also belonging to the JinkoSolar brand), with an individual module’s capacity of 300 Wp (0.3 kWp). The monofacial array also has a single row.
Table 3 lists modeling parameters for the 4.5 kWp bifacial PV system and its reference 4.5 kWp monofacial PV system in Aladdin. In this table, the (pole height) parameter refers to the structural element supporting the PV modules, and the (pole spacing) parameter refers to the pitch (the uniform spacing) of these structural elements.
Figure 17.
Illustration of the bifacial and monofacial PV single-row 4.5 kWp systems of the current study. This particular view corresponds to the location of Muscat in Oman, on 21 June, at the solar noon (when the sun is at its highest elevation above the horizon).
Figure 17.
Illustration of the bifacial and monofacial PV single-row 4.5 kWp systems of the current study. This particular view corresponds to the location of Muscat in Oman, on 21 June, at the solar noon (when the sun is at its highest elevation above the horizon).
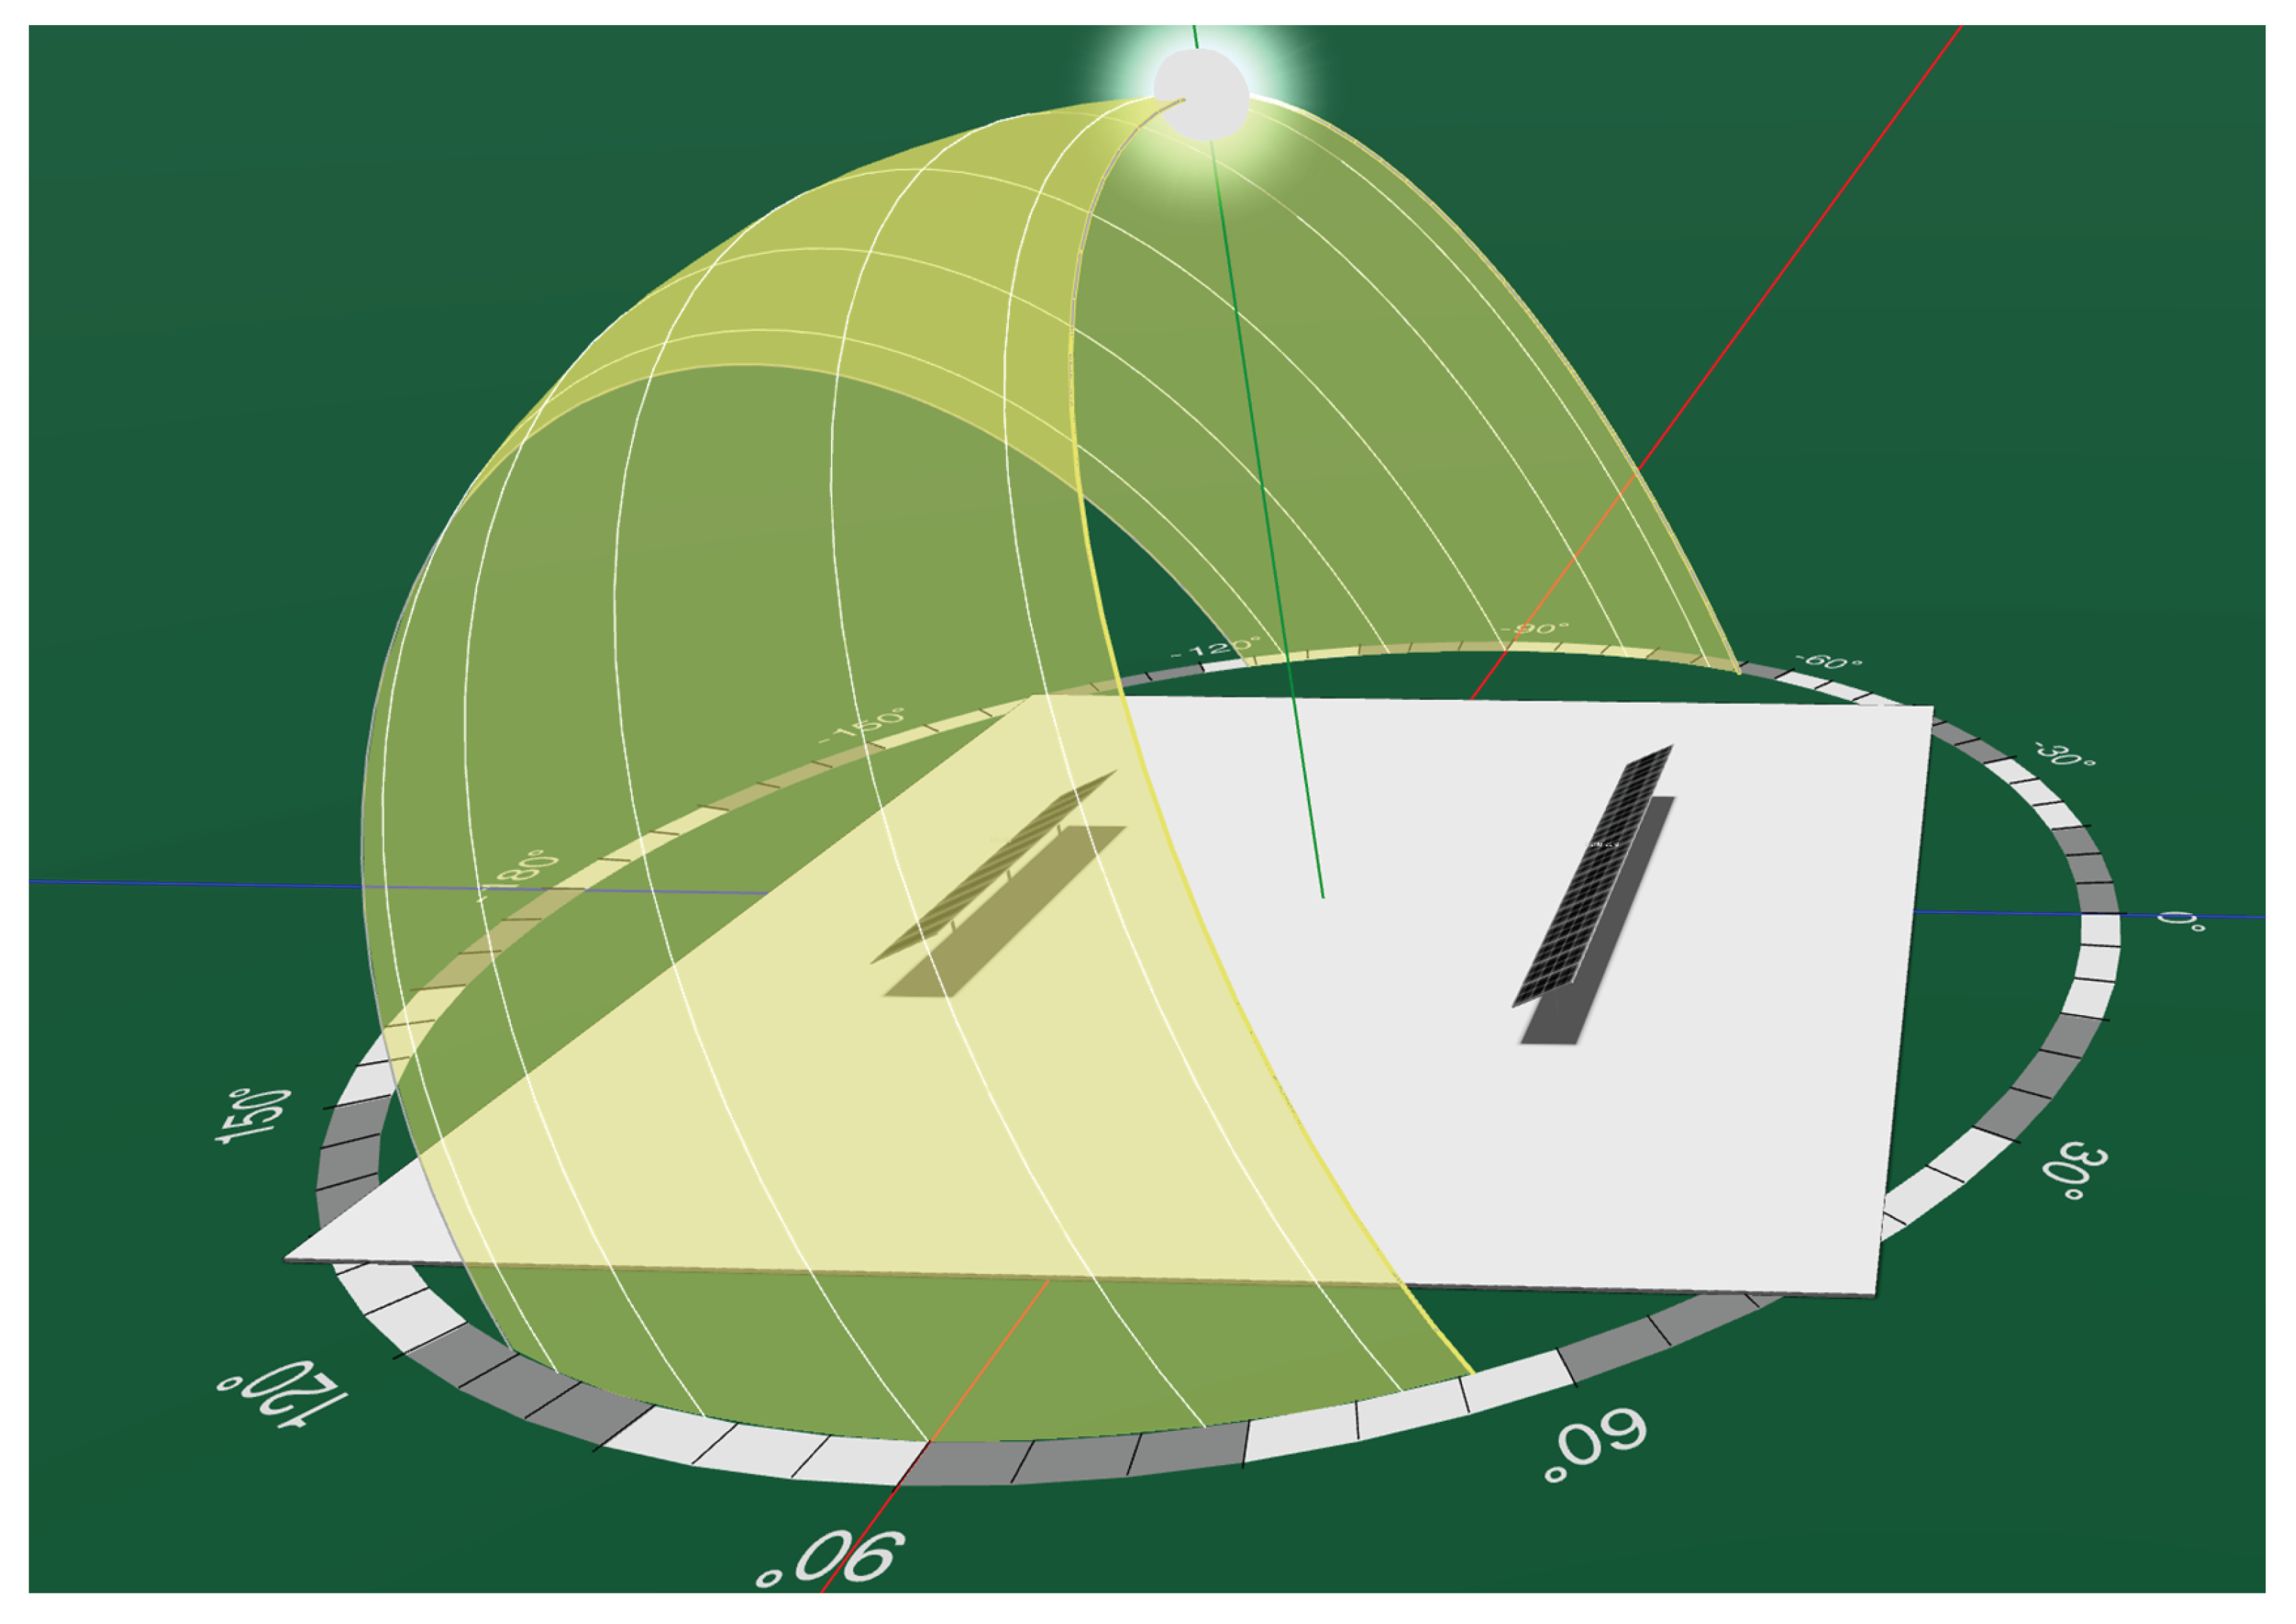
Figure 18.
Illustration of the bifacial and monofacial PV single-row 4.5 kWp systems of the current study. This particular view corresponds to the location of Muscat in Oman, on 21 December, at 9 am solar time (three hours before the sun is at its highest elevation above the horizon).
Figure 18.
Illustration of the bifacial and monofacial PV single-row 4.5 kWp systems of the current study. This particular view corresponds to the location of Muscat in Oman, on 21 December, at 9 am solar time (three hours before the sun is at its highest elevation above the horizon).
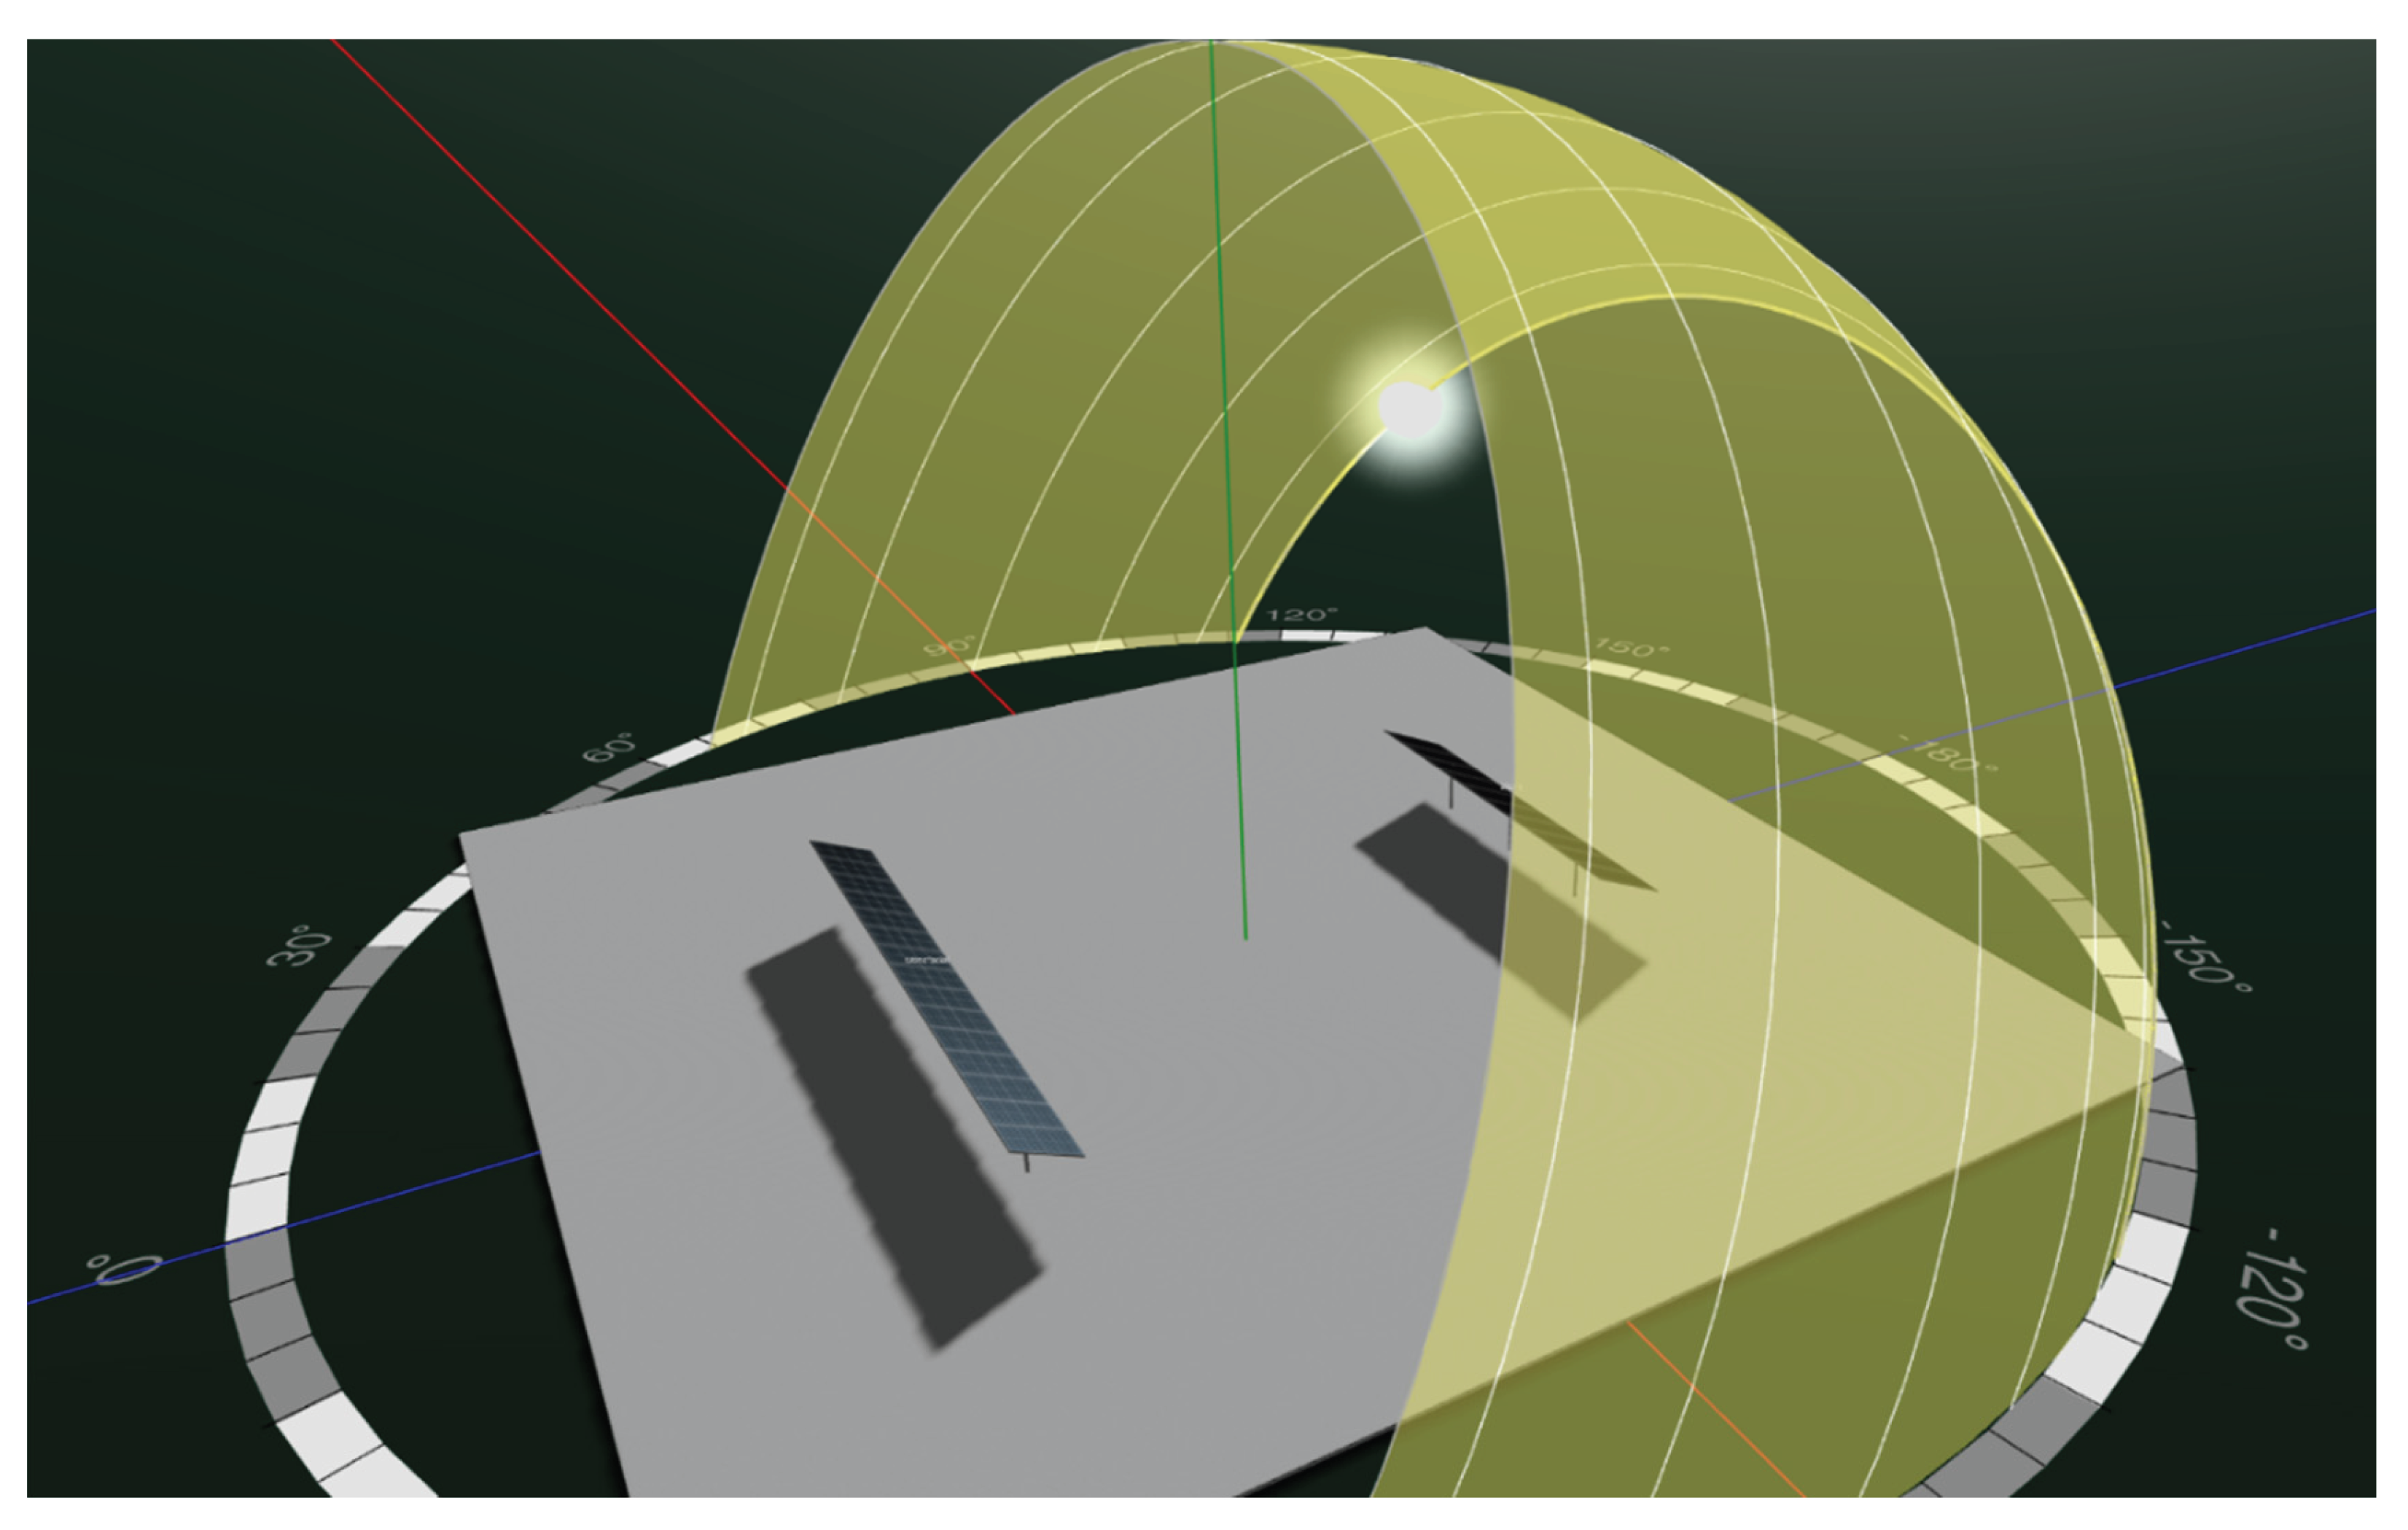
Figure 19.
Illustration of the bifacial and monofacial PV single-row 4.5 kWp systems of the current study. The bifacial row (having 10 PV modules) is near the lower edge of the figure, while the monofacial row (having 15 PV modules) is near the upper edge of the figure. Illumination effects due to incident sunlight are clearly visible.
3. Benchmarking Results
In this section, comparisons are provided between selected data computed based on the Aladdin simulation tool and those data published in an independent external study using a different simulation tool.
The benchmarking cases are divided into two categories: (1) monofacial PV system in Muscat (Oman), and (2) bifacial PV system in Manisa (Turkey).
3.1. Monofacial Benchmarking Simulation Parameters
The monofacial benchmarking case corresponds to the estimated electricity from a normalized capacity of 1 kWp per month, in Muscat. Thus, the metric being compared is the kWh/kWp/month for the 12 months of a typical year. In addition, the year-average AC monthly specific electric yield (in kWh/kWp/month) is also compared. When this year-average monthly quantity is multiplied by 12, it gives the annual kWh/kWp/year (thus, gives the estimated annual performance). The PV modules are tilted at a year-round optimized angle of 25°.
The external results are obtained using the PVGIS web simulation software and the Energy3D desktop simulation software.
3.2. Monofacial Benchmarking Simulation Assessment
The comparison results for the normalized monthly electric yields are displayed in Figure 20. Although the monthly trends are not identical for the three software tools, the deviations are not large and thus are considered acceptable. Such deviations exist not only between the Aladdin-based results and either the PVGIS results or the Energy3D results, but also between the PVGIS results and the Energy3D results. This is an inevitable characteristic in computational models [281,282,283,284], where differences in specific modeling assumptions, algorithms, and weather data lead to modeling results that are not identical.
The annual normalized electric yield (expressed in kWh/kWp/year) is compared in Figure 21; the deviations appear small, and the three sources of results favorably provide comparable values. This is considered successful validation for the predictions of monofacial photovoltaic performance using Aladdin.
3.3. Bifacial Benchmarking Simulation Parameters
The bifacial test case corresponds to a published simulation case for a bifacial photovoltaic (PV) system in Caferbey, Salihli, Manisa (Turkey) [285]. The external simulation was performed using the PVsyst modeling tool. The system had an AC-rated power of 30 kWac, and a peak DC power of 34 kWp. The PV modules had an optimum fixed tilt of 30°. The PV modules were disturbed in four rows.
Table 4 lists various characteristics of this benchmarking bifacial PV system. The peak power in the Aladdin-based simulation is 34.2 kWp, which is close to the external value of 34.0 kWp but not identical to it because it was not possible to exactly achieve the published 34.0 kWp capacity. However, it was possible to match the AC power rating (the rated inverter power) through slightly adjusting the DC-to-AC ratio.
Figure 22 is a two-dimensional view (top view) of the bifacial benchmarking system as modeled in Aladdin.
3.4. Bifacial Benchmarking Simulation Assessment
Table 5 compares the Aladdin-based predicted annual electricity generation with the independently published results for two albedo values. These albedo values are the same as the ones adopted later for a 4.5 kWp bifacial PV system in the seven Omani cities (these subsequent cases are referred to as the “main simulations” to distinguish them from the present temporary “benchmarking simulations”). These selected albedo values are 0.30 (low albedo) and 0.65 (high albedo).
If the Aladdin-based value is denoted by , and the external value is denoted by , then the relative deviation between the two values is computed as
This deviation is the signed difference between the two values (the Aladdin-based value minus the external value) expressed as a percentage of the arithmetic mean of the two compared values.
It can be seen in the table that for either albedo, the magnitude of the relative deviation is small, below 0.5%, which supports the matching between the Aladdin-based results and the external results.
Figure 23 visualizes a similar comparison between the Aladdin-based results and the external results for the 30 kWac test bifacial PV system of Manisa, Turkey. However, instead of comparing the total annual electricity generated, a normalized version of this (normalized annual electricity by the peak DC capacity) is compared, and this counterbalances the small difference between peak DC capacity (34.2 kWp) adopted in the Aladdin model, and the slightly-smaller peak DC capacity (34.0 kWp) adopted in the external one. It can be seen that the Aladdin-based normalized annual specific electric yields (in kWh/kWp/year) are also in good agreement with those belonging to the external independent simulations, with the magnitude of the percentage deviation limited below 1% for either albedo.
4. Main Results
After the validation check of the Aladdin simulation process through comparisons of results with independent sources for both monofacial photovoltaic (PV) modeling and bifacial PV modeling, the main results of this study are presented in the current section. All these main simulations are related to comparing a 4.5 kWp monofacial PV system and a 4.5 kWp bifacial PV system in seven locations (seven cities) in Oman at two archetypal albedo values, with the purpose of quantifying the expected gain in electricity generation, thus the technical feasibility of using bifacial modules in lieu of monofacial ones. For monofacial modules, the effect of albedo is neglected. Whereas for bifacial modules, the albedo has a direct weakly nonlinear (thus, can be approximated as linear) influence on the electricity generation [286,287].
4.1. Gain in Annual Electric Yield with Bifacial Modules (Low and High Albedos)
In this subsection, three sets of the estimated annual specific electricity yields (in kWh/kWp/year) for the seven selected Omani locations are contrasted under three respective conditions; namely:
(1) monofacial PV modules
(2) bifacial PV modules with a low ground albedo of 0.30
(3) bifacial PV modules with a high ground albedo of 0.65
The contrasted specific yields are visualized in Figure 24. With the exception of Khasab, the remaining six Omani locations have similar estimates. The city of Khasab at the northern tip of Oman has a slightly lower annual yield. This special feature of Khasab can be attributed to the relatively important horizon height there, affected by its terrain; where the Hajar Mountains fall steeply from heights near 2,000 m into the coast [288,289]; and this reduces the duration of available sunshine reaching the PV modules.
For the monofacial PV system, the annual specific electricity yield ranges from 1,633.1 kWh/kWp/year in Khasab to 1,868.8 kWh/kWp/year in Duqm. If the average of these seven diverse locations is taken as an approximate national average for Oman, then a national value of 1,821.6 kWh/kWp/year (or 4.99 kWh/kWp/day for a 365-day year) is obtained.
For the bifacial PV system with the low albedo of 0.30, the annual specific electricity yield ranges from 1,747.4 kWh/kWp/year in Khasab to 1,999.6 kWh/kWp/year in Duqm. If the average of these seven diverse locations is taken as an approximate national average for Oman, then a national value of 1,949.1 kWh/kWp/year (or 5.34 kWh/kWp/day for a 365-day year) is obtained.
Considering the increase from a national (Omani) average of 1,821.6 kWh/kWp/year to 1,949.1 kWh/kWp/year, the estimated national average approximated bifacial gain (ABG) in Oman at albedo 0.30 is 7.0%.
For the bifacial PV system with the high albedo of 0.65, the annual specific electricity yield ranges from 1,878.1 kWh/kWp/year in Khasab to 2,149.1 kWh/kWp/year in Duqm. If the average of these seven diverse locations is taken as an approximate national average for Oman, then a national value of 2,094.9 kWh/kWp/year (or 5.74 kWh/kWp/day for a 365-day year) is obtained.
Considering the increase from a national (Omani) average of 1,821.6 kWh/kWp/year to 2,094.9 kWh/kWp/year, the estimated national average approximated bifacial gain (ABG) in Oman at albedo 0.65 is 15.0%.
Considering the increase from a national (Omani) average of 1,949.1 kWh/kWp/year to 2,094.9 kWh/kWp/year, the estimated increase in the electric generation from a bifacial PV system in Oman when the ground coverage is artificially whitened (causing an increase in ground albedo from 0.30 to 0.65) is 7.5%.
4.2. Monthly Electricity Generation with Monofacial PV Modules
In this subsection, the monthly specific electric yield (in kWh/kWp/month) for the seven Omani locations selected in the current study with monofacial PV modules is demonstrated. The contrasted profiles of the monthly specific electric yields for these seven Omani locations are visualized in Figure 25.
For the southern city of Salalah, a noticeable decline in electricity generation can be observed in the summer. This can be explained by the summer monsoon (locally in Oman called “Khareef” or “Al-Khareef” season) [290,291], where rains obstruct the photovoltaic electricity generation. On the other hand, the rainy season in Khasab is in the winter, and this is consistent with the observed decline in the monthly electric yield during that period. The ability of Aladdin to capture these seasonal phenomena reflects the good meteorological data incorporated within it.
If the average of the seven Omani cities selected here is taken as a representative national average for Oman, then these approximate national monthly (per-month) specific electric yields (with monofacial PV systems) are demonstrated in Table 6, with an overall average (averaged over the 12 months of the year) of 151.8 kWh/kWp/month. The month with the highest electricity generation is May, while the month with the lowest electricity generation is December. The observation that the month of highest photovoltaic electricity generation in Oman is May (rather than June or July, which are closer to the summer solstice) can be explained by a higher degree of particles (dust) in the atmosphere in the period of June-August, which tend to diffuse and disperse the incoming direct normal irradiance (DNI) [292,293,294]through the two-phase air-dust medium [295,296,297]. Animated and historical aerosol data from NASA (United States National Aeronautics and Space Administration) support the presence of this phenomenon in Oman in general [298,299,300].
4.3. Monthly Electricity Generation with Bifacial Modules at Low Albedo 0.30
In this subsection, the monthly specific electric yield (in kWh/kWp/month) for the seven Omani locations selected in this study with bifacial PV modules and a low ground albedo of 0.30 is demonstrated. The contrasted profiles of the monthly specific electric yield (for the seven Omani locations) are visualized in Figure 26.
If the average of the seven Omani cities selected here is taken as a representative national average for Oman, then this approximate national monthly (per-month) specific electric yield (with low-albedo bifacial PV systems; = 0.30) is demonstrated in Table 7, with an overall average (after the city-averaged monthly values are further averaged over the 12 months of the year) of 162.4 kWh/kWp/month. This is 7.0% above the monofacial overall average value of 151.8 kWh/kWp/month that was mentioned earlier.
Figure 27 shows the monthly variations of the approximated bifacial gain (ABG) for the seven selected cities in Oman. There is noticeable agreement among the seven locations, where the monthly ABG exhibits an increase in the summer, with a peak of about 9.5% observed in the month of June. In the winter, the ABG is nearly constant near a value of 6%.
4.4. Monthly Electricity Generation with Bifacial Modules at High Albedo 0.65
In this subsection, the monthly specific electric yield (in kWh/kWp/month) for the seven Omani locations selected in this study with bifacial PV modules and a high ground albedo of 0.65 is demonstrated. The contrasted profiles of the monthly specific electric yield (for the seven Omani locations) are visualized in Figure 28.
If the average of the seven Omani cities selected here is taken as a representative national average for Oman, then this approximate national monthly (per-month) specific electric yield (with high-albedo bifacial PV systems; = 0.65) is demonstrated in Table 8, with an overall average (after the city-averaged monthly values are further averaged over the 12 months of the year) of 174.6 kWh/kWp/month. This is 15.0% above the monofacial overall average value of 151.8 kWh/kWp/month that was mentioned earlier, and 7.5% above the low-albedo ( = 0.30) bifacial PV systems overall average value of 162.4 kWh/kWp/month that was also mentioned earlier.
Figure 29 shows the monthly variations of the approximated bifacial gain (ABG) for the seven selected cities in Oman. Similar to the previously discussed case with a lower albedo of 0.30, there is still noticeable agreement among the seven Omani locations under the higher albedo of 0.65; where the monthly ABG exhibits an increase in the summer, with a peak of about 19% observed in the month of June. In the winter, the ABG is nearly constant near a value of 13%.
5. Conclusions
5.1. Summary of Achievements
The current study successfully achieved its goals. The new simulation software, Aladdin, was assessed and demonstrated in detail in terms of its ability to handle the numerical modeling of monofacial and bifacial photovoltaic power systems. The electricity generation from monofacial photovoltaic systems, from bifacial photovoltaic systems at a low albedo, and from bifacial photovoltaic systems at a high albedo in seven cities of Oman was deeply analyzed. Both annual outputs and monthly variations were compared, and national-level estimates were derived. The study asserts the huge potential of solar energy in Oman, as demonstrated by an attractive electric yield that can exceed 2 MWh/kWp/year (5.5 kWh/kWp/day).
The current study does not recommend using bifacial photovoltaic modules in dark soil lands (having a very low albedo near 0.1) due to the insignificant gain that is combined with a cost penalty, extra handling challenges due to having the rear side covered with optically sensitive photovoltaic cells, and added restrictions against utilizing the rear side as a heat source in case the bifacial photovoltaic system is upgraded to a hybrid photovoltaic-thermal system.
The current study is useful to both a local audience having a particular interest in the Omani energy mix and the prospective transitioning to renewable energy, and a global audience having an interest in computer-aided engineering (CAE) of photovoltaic power systems or having a similar environment to the Omani cities analyzed here.
The unique contributions of this work include the application cases presented using the Aladdin simulation tool, the comprehensive illustration of its modeling procedure, the benchmarking checks presented, the introduced and well-defined approximated bifacial gain metric for decision-making in photovoltaic systems, the small dataset of specific electric yields under three categories of photovoltaic systems (monofacial, bifacial with low albedo, and monofacial with high albedo) in seven important cities of Oman, the data-driven estimates of national specific yields under each of these three categories, the estimated monthly variations in the specific yields, and the corresponding approximated bifacial gains.
5.2. Areas for Improvement
Despite the listed accomplishments of the current study, it remains subject to multiple improvements or extensions that can increase its value and broaden its audience.
For example, addressing any of the limitations of the study that were mentioned earlier can strengthen this work and make it more robust. This can be through investigating the impact of dust accumulation on the output of photovoltaic or photovoltaic systems in harsh weather conditions.
Another area of improvement is exploring the performance gains of combining the photovoltaic system (for generating clean electricity) with a thermal system (for generating clean heat), and how such a gain differs between a monofacial system and a bifacial system.
In addition, examining various cleaning methods for photovoltaic panels, and possible decision-making strategies, as well as optimizing the cleaning scheduling of the photovoltaic panels, form a good topic in the field of photovoltaic solar power. Again, the solutions and frameworks for monofacial modules can be compared with those for bifacial modules, since the two module types have different optical configurations.
Conducting field experiments to validate the simulation-based findings (rather than relying totally on benchmarking against a different simulation method) can strengthen the credibility of the current work.
Earlier, the matter of sensitivity analysis was discussed. Beyond the revealed linear dependence of the electric yield on the ground albedo, a further sensitivity analysis that considers additional key parameters can lead to useful insights about optimizing photovoltaic power systems, and which parameters are more influential than the others. This approach not only improves the reliability of the results but also broadens their applicability to a wider range of systems, and makes them useful to a larger audience size beyond the Omani context.
Ethics Approval and Consent to Participate
Not applicable (this research does not involve human participants, human data, human tissue, animal subjects, or environmental hazards).
Consent for Publication
Not applicable (this manuscript does not contain data from any individual person).
Availability of Data and Materials
The data that support the findings of this study are available within the article itself.
Competing Interests
Not applicable (the author declares that they have no competing interests).
Author Contributions
Not applicable (this research has a single author). OM was in charge of the conceptualization, methodology, validation, formal analysis, investigation, visualization, and writing of the original draft.
Funding
Not applicable (this research received no funding).
Acknowledgements
Not applicable.
Nomenclature
| CAE | Computer-aided engineering |
| CFD | Computational fluid dynamics |
| CSP | Concentrated solar power |
| Impp | Rated current of a photovoltaic panel at its maximum power point |
| MPP | Maximum power point |
| NASA | United States National Aeronautics and Space Administration |
| NOCT | Nominal operating cell temperature |
| NSF | United States National Science Foundation |
| SC | Short circuit |
| SDG | Sustainable Development Goals of the United Nations (UN) |
| STEM | Science, technology, engineering, and mathematics |
| TES | Total energy supply |
| TFEC | Total final energy consumption |
| TFELC | Total final electricity consumption |
| UN | United Nations |
| Vmpp | Rated voltage of a photovoltaic panel at its maximum power point |
References
- UNDP, [United Nations Development Programme]. UNDP │ Sustainable Development Goals (SDGs). https://www.undp.org/sustainable-development-goals (accessed 2025-02-02).
- UNDESA, [United Nations Department of Economic and Social Affairs]. DSDG [Division for Sustainable Development Goals] │ SDGs - About. https://sdgs.un.org/about (accessed 2025-06-20).
- Adebayo, T. S. Overcoming Barriers to Clean Cooking Solutions: Political Risk, Financial Development, and Their Implications for Achieving SDG 7 in Nigeria. Environmental Progress & Sustainable Energy 2025, 44, e14592. [Google Scholar] [CrossRef]
- Demirkale, O.; Duran, N. I. China’s Sustainable Development under Climate, Energy and Policy Uncertainty: A Focus on SDG 7 and SDG 13. International Journal of Energy Economics and Policy 2025, 15, 532–540. [Google Scholar] [CrossRef]
- Frimpong, B. A.; Kukah, A. S. K.; Blay, A. V. K. J.; Anafo, A.; Kukah, R. M. K.; Wellington, S. N. O.; Kuutiero, D. N. Strategies to Enhance Energy Sustainability in Line with Sustainable Development Goal (SDG) 7 (Affordable and Clean Energy): Case of Ghana. International Journal of Energy Sector Management 2024, 19, 477–496. [Google Scholar] [CrossRef]
- He, J.; Yang, Y.; Liao, Z.; Xu, A.; Fang, K. Linking SDG 7 to Assess the Renewable Energy Footprint of Nations by 2030. Applied Energy 2022, 317, 119167. [Google Scholar] [CrossRef]
- Ferruzzi, G.; Delcea, C.; Barberi, A.; Di Dio, V.; Di Somma, M.; Catrini, P.; Guarino, S.; Rossi, F.; Parisi, M. L.; Sinicropi, A.; Longo, S. Concentrating Solar Power: The State of the Art, Research Gaps and Future Perspectives. Energies 2023, 16, 8082. [Google Scholar] [CrossRef]
- Khan, M. I.; Gutiérrez-Alvarez, R.; Asfand, F.; Bicer, Y.; Sgouridis, S.; Al-Ghamdi, S. G.; Jouhara, H.; Asif, M.; Kurniawan, T. A.; Abid, M.; Pesyridis, A.; Farooq, M. The Economics of Concentrating Solar Power (CSP): Assessing Cost Competitiveness and Deployment Potential. Renewable and Sustainable Energy Reviews 2024, 200, 114551. [Google Scholar] [CrossRef]
- Xi, J.; Zhang, B.; Yang, Y. Calculation and Monte Carlo Uncertainty Analysis of the Levelized Cost of Electricity for Different Energy Power Generation in the Smart Grid under Time Scales. Energy Strategy Reviews 2025, 58, 101666. [Google Scholar] [CrossRef]
- Parida, B.; Iniyan, S.; Goic, R. A Review of Solar Photovoltaic Technologies. Renewable and Sustainable Energy Reviews 2011, 15, 1625–1636. [Google Scholar] [CrossRef]
- Louwen, A.; van Sark, W. Chapter 5 - Photovoltaic Solar Energy. In Technological Learning in the Transition to a Low-Carbon Energy System; Junginger, M., Louwen, A., Eds.; Academic Press, 2020; pp 65–86. [CrossRef]
- Gharehpetian, G. B.; Agah, S. M. M. Distributed Generation Systems: Design, Operation and Grid Integration; Butterworth-Heinemann: Oxford, U.K, 2017. [Google Scholar]
- IEA, [International Energy Agency]. IEA │ Share of renewable electricity generation by technology, 2000-2030. IEA. https://www.iea.org/data-and-statistics/charts/share-of-renewable-electricity-generation-by-technology-2000-2030 (accessed 2025-07-01).
- IRENA, [International Renewable Energy Agency]. IRENA │ Electricity Capacity Trends. https://public.tableau.com/shared/YZDZRWHB4?:display_count=n&:showVizHome=no# (accessed 2025-02-23).
- Renew Economy. Solar is now being installed faster than any technology in history. https://reneweconomy.com.au/web-stories/solar-is-now-being-installed-faster-than-any-technology-in-history/ (accessed 2025-02-23).
- ANU, [Australian National University]. The fastest energy change in history still underway. ANU RE100 Group. https://re100.eng.anu.edu.au/2024/04/24/fastest-energy-change-article/ (accessed 2025-02-23).
- Becken, S.; Miller, G.; Lee, D. S.; Mackey, B. The Scientific Basis of ‘Net Zero Emissions’ and Its Diverging Sociopolitical Representation. Science of The Total Environment 2024, 918, 170725. [Google Scholar] [CrossRef]
- Congxiang, T.; Guoqing, Z.; Yong, Y. Hybrid Photovoltaic and Thermoelectric Generator Systems with Thermal Wheel Ventilation: A Sustainable Approach to Residential Heating and Cooling. Engineering Science and Technology, an International Journal 2025, 62, 101968. [Google Scholar] [CrossRef]
- Ghiasi, M.; Wang, Z.; Mehrandezh, M.; Paranjape, R. Enhancing Efficiency through Integration of Geothermal and Photovoltaic in Heating Systems of a Greenhouse for Sustainable Agriculture. Sustainable Cities and Society 2025, 118, 106040. [Google Scholar] [CrossRef]
- Khan, M. I.; Asfand, F.; Al-Ghamdi, S. G.; Bicer, Y.; Khan, M.; Farooq, M.; Pesyridis, A. Realizing the Promise of Concentrating Solar Power for Thermal Desalination: A Review of Technology Configurations and Optimizations. Renewable and Sustainable Energy Reviews 2025, 208, 115022. [Google Scholar] [CrossRef]
- Liao, Y.; Li, K.; Zhao, Y.; Tang, H.; Zhang, M.; Liu, X.; Yuan, Z.-M. Energy Optimal Path Planning of Ocean-Energy Driven Unmanned Surface Vehicles. Ocean Engineering 2025, 327, 120965. [Google Scholar] [CrossRef]
- Guerrero-Lemus, R.; Shephard, L. E. Photovoltaics. In Low-Carbon Energy in Africa and Latin America: Renewable Technologies, Natural Gas and Nuclear Energy; Guerrero-Lemus, R., Shephard, L. E., Eds.; Springer International Publishing: Cham, Switzerland, 2017. [Google Scholar] [CrossRef]
- Andrei, H.; Dogaru-Ulieru, V.; Chicco, G.; Cepisca, C.; Spertino, F. Photovoltaic Applications. Journal of Materials Processing Technology 2007, 181, 267–273. [Google Scholar] [CrossRef]
- Zweibel, K. Should Solar Photovoltaics Be Deployed Sooner Because of Long Operating Life at Low, Predictable Cost? Energy Policy 2010, 38, 7519–7530. [Google Scholar] [CrossRef]
- Kaaya, I.; Lindig, S.; Weiss, K.-A.; Virtuani, A.; Sidrach de Cardona Ortin, M.; Moser, D. Photovoltaic Lifetime Forecast Model Based on Degradation Patterns. Progress in Photovoltaics: Research and Applications 2020, 28, 979–992. [Google Scholar] [CrossRef]
- Marzouk, O. A. Detailed Derivation of the Scalar Explicit Expressions Governing the Electric Field, Current Density, and Volumetric Power Density in the Four Types of Linear Divergent MHD Channels Under a Unidirectional Applied Magnetic Field. Contemporary Mathematics 2025, 6, 4060–4100. [Google Scholar] [CrossRef]
- IEA, [International Energy Agency]. Tracking Clean Energy Progress 2023 (TCEP 2023). https://www.iea.org/reports/tracking-clean-energy-progress-2023 (accessed 2024-07-23).
- Qian, J.; Wang, G.; Yin, T.; Mao, Y.; Chen, S.; Li, Y.; Liu, J.; Zhang, Q. Policy Implications of Electrifying Land Freight Transport towards Carbon-Neutral in China. Transport Policy 2025, 160, 116–124. [Google Scholar] [CrossRef]
- Armstrong, T.; Ghoreishi-Madiseh, S. A.; Kalantari, H.; Samea, P.; Steen, J. Evaluating Operational Benefits of Fleet Electrification in Open Pit Mines Using Discrete Event Modeling; a Case Study for Implementation of Trolley Assist Trucks. International Journal of Mining, Reclamation and Environment 2025, 39, 641–664. [Google Scholar] [CrossRef]
- Slough, T.; Urpelainen, J.; Yang, J. Light for All? Evaluating Brazil’s Rural Electrification Progress, 2000–2010. Energy Policy 2015, 86, 315–327. [Google Scholar] [CrossRef]
- Mollik, S.; Rashid, M. M.; Hasanuzzaman, M.; Karim, M. E.; Hosenuzzaman, M. Prospects, Progress, Policies, and Effects of Rural Electrification in Bangladesh. Renewable and Sustainable Energy Reviews 2016, 65, 553–567. [Google Scholar] [CrossRef]
- Aklin, M.; Harish, S. P.; Urpelainen, J. A Global Analysis of Progress in Household Electrification. Energy Policy 2018, 122, 421–428. [Google Scholar] [CrossRef]
- Zheng, G.; Jing, Y.; Huang, H.; Gao, Y. Application of Improved Grey Relational Projection Method to Evaluate Sustainable Building Envelope Performance. Applied Energy 2010, 87, 710–720. [Google Scholar] [CrossRef]
- Iwaro, J.; Mwasha, A. The Impact of Sustainable Building Envelope Design on Building Sustainability Using Integrated Performance Model. International Journal of Sustainable Built Environment 2013, 2, 153–171. [Google Scholar] [CrossRef]
- Khosla, R.; Miranda, N. D.; Trotter, P. A.; Mazzone, A.; Renaldi, R.; McElroy, C.; Cohen, F.; Jani, A.; Perera-Salazar, R.; McCulloch, M. Cooling for Sustainable Development. Nat Sustain 2021, 4, 201–208. [Google Scholar] [CrossRef]
- Elnagar, E.; Pezzutto, S.; Duplessis, B.; Fontenaille, T.; Lemort, V. A Comprehensive Scouting of Space Cooling Technologies in Europe: Key Characteristics and Development Trends. Renewable and Sustainable Energy Reviews 2023, 186, 113636. [Google Scholar] [CrossRef]
- Breyer, C.; Bogdanov, D.; Gulagi, A.; Aghahosseini, A.; Barbosa, L. S. N. S.; Koskinen, O.; Barasa, M.; Caldera, U.; Afanasyeva, S.; Child, M.; Farfan, J.; Vainikka, P. On the Role of Solar Photovoltaics in Global Energy Transition Scenarios. Progress in Photovoltaics: Research and Applications 2017, 25, 727–745. [Google Scholar] [CrossRef]
- Ali, M. B.; Saidur, R.; Hossain, M. S. A Review on Emission Analysis in Cement Industries. Renewable and Sustainable Energy Reviews 2011, 15, 2252–2261. [Google Scholar] [CrossRef]
- Marzouk, O. A. Reduced-Order Modeling (ROM) of a Segmented Plug-Flow Reactor (PFR) for Hydrogen Separation in Integrated Gasification Combined Cycles (IGCC). Processes 2025, 13, 1455. [Google Scholar] [CrossRef]
- Leimkühler, H.-J. Managing CO2 Emissions in the Chemical Industry; John Wiley & Sons: Weinheim, Germany, 2010. [Google Scholar]
- Marzouk, O. A. Summary of the 2023 (1st Edition) Report of TCEP (Tracking Clean Energy Progress) by the International Energy Agency (IEA), and Proposed Process for Computing a Single Aggregate Rating. E3S Web of Conferences 2025, 601, 00048. [Google Scholar] [CrossRef]
- Bosco, N. Turn Your Half-Cut Cells for a Stronger Module. IEEE Journal of Photovoltaics 2022, 12, 1149–1153. [Google Scholar] [CrossRef]
- Waqar Akram, M.; Li, G.; Jin, Y.; Zhu, C.; Javaid, A.; Zuhaib Akram, M.; Usman Khan, M. Study of Manufacturing and Hotspot Formation in Cut Cell and Full Cell PV Modules. Solar Energy 2020, 203, 247–259. [Google Scholar] [CrossRef]
- Blakers, A. Development of the PERC Solar Cell. IEEE Journal of Photovoltaics 2019, 9, 629–635. [Google Scholar] [CrossRef]
- Green, M. A. The Passivated Emitter and Rear Cell (PERC): From Conception to Mass Production. Solar Energy Materials and Solar Cells 2015, 143, 190–197. [Google Scholar] [CrossRef]
- Min, B.; Müller, M.; Wagner, H.; Fischer, G.; Brendel, R.; Altermatt, P. P.; Neuhaus, H. A Roadmap Toward 24% Efficient PERC Solar Cells in Industrial Mass Production. IEEE Journal of Photovoltaics 2017, 7, 1541–1550. [Google Scholar] [CrossRef]
- Du, Y.; Dai, J.; Xin, S.; Ma, K.; Zhang, M.; Li, T.; Wang, L.; Jin, H.; Tao, W. Thermo-Mechanical Stress Modelling and Fracture Analysis on Ultra-Thin Silicon Solar Cell Based on Super Multi-Busbar PV Modules. Engineering Failure Analysis 2025, 169, 109153. [Google Scholar] [CrossRef]
- Walter, J.; Tranitz, M.; Volk, M.; Ebert, C.; Eitner, U. Multi-Wire Interconnection of Busbar-Free Solar Cells. Energy Procedia 2014, 55, 380–388. [Google Scholar] [CrossRef]
- Rendler, L. C.; Kraft, A.; Ebert, C.; Eitner, U.; Wiese, S. Mechanical Stress in Solar Cells with Multi Busbar Interconnection — Parameter Study by FEM Simulation. In 2016 17th International Conference on Thermal, Mechanical and Multi-Physics Simulation and Experiments in Microelectronics and Microsystems (EuroSimE); 2016; pp 1–5. [CrossRef]
- Yue, Q.; Liu, W.; Zhu, X. N-Type Molecular Photovoltaic Materials: Design Strategies and Device Applications. J. Am. Chem. Soc. 2020, 142, 11613–11628. [Google Scholar] [CrossRef] [PubMed]
- Yu, B.; Song, D.; Sun, Z.; Liu, K.; Zhang, Y.; Rong, D.; Liu, L. A Study on Electrical Performance of N-Type Bifacial PV Modules. Solar Energy 2016, 137, 129–133. [Google Scholar] [CrossRef]
- Savin, H.; Repo, P.; von Gastrow, G.; Ortega, P.; Calle, E.; Garín, M.; Alcubilla, R. Black Silicon Solar Cells with Interdigitated Back-Contacts Achieve 22.1% Efficiency. Nature Nanotech 2015, 10, 624–628. [Google Scholar] [CrossRef]
- Franklin, E.; Fong, K.; McIntosh, K.; Fell, A.; Blakers, A.; Kho, T.; Walter, D.; Wang, D.; Zin, N.; Stocks, M.; Wang, E.-C.; Grant, N.; Wan, Y.; Yang, Y.; Zhang, X.; Feng, Z.; Verlinden, P. J. Design, Fabrication and Characterisation of a 24.4% Efficient Interdigitated Back Contact Solar Cell. Progress in Photovoltaics: Research and Applications 2016, 24, 411–427. [Google Scholar] [CrossRef]
- Yoshikawa, K.; Kawasaki, H.; Yoshida, W.; Irie, T.; Konishi, K.; Nakano, K.; Uto, T.; Adachi, D.; Kanematsu, M.; Uzu, H.; Yamamoto, K. Silicon Heterojunction Solar Cell with Interdigitated Back Contacts for a Photoconversion Efficiency over 26%. Nat Energy 2017, 2, 1–8. [Google Scholar] [CrossRef]
- Kopecek, R.; Libal, J. Bifacial Photovoltaics 2021: Status, Opportunities and Challenges. Energies 2021, 14, 2076. [Google Scholar] [CrossRef]
- Shen Liang, T.; Pravettoni, M.; Deline, C.; S. Stein, J.; Kopecek, R.; Prakash Singh, J.; Luo, W.; Wang, Y.; G. Aberle, A.; Sheng Khoo, Y. A Review of Crystalline Silicon Bifacial Photovoltaic Performance Characterisation and Simulation. Energy & Environmental Science 2019, 12, 116–148. [Google Scholar] [CrossRef]
- Lorenzo, E. On the Historical Origins of Bifacial PV Modelling. Solar Energy 2021, 218, 587–595. [Google Scholar] [CrossRef]
- Alternergy. Bifacial Solar Panels: What are They and Are They Worth It? https://www.alternergy.co.uk/blog/post/bifacial-solar-panels-what-are-they (accessed 2025-02-23).
- Hwang, S.; Lee, H.; Kang, Y. Energy Yield Comparison between Monofacial Photovoltaic Modules with Monofacial and Bifacial Cells in a Carport. Energy Reports 2023, 9, 3148–3153. [Google Scholar] [CrossRef]
- Khan, M. R.; Hanna, A.; Sun, X.; Alam, M. A. Vertical Bifacial Solar Farms: Physics, Design, and Global Optimization. Applied Energy 2017, 206, 240–248. [Google Scholar] [CrossRef]
- Daliento, S.; De Riso, M.; Guerriero, P.; Matacena, I.; Dhimish, M.; d’Alessandro, V. On the Optimal Orientation of Bifacial Solar Modules. In 2024 International Symposium on Power Electronics, Electrical Drives, Automation and Motion (SPEEDAM); 2024; pp 396–400. [CrossRef]
- Stein, J.; Reise, C.; Castro, J. B.; Friesen, G.; Maugeri, G.; Urrejola, E.; Ranta, S. Bifacial Photovoltaic Modules and Systems: Experience and Results from International Research and Pilot Applications; SAND-2021-4835R; IEA-PVPS T13-14:2021; Sandia National Lab. (SNL-NM), Albuquerque, NM (United States); Fraunhofer ISE, Freiburg (Germany); Univ. of Applied Sciences and Arts of Southern Switzerland (SUPSI) (Switzerland); TUV Rheinland, Cologne (Germany); Ricerca sul Sistema Energetico (Italy); ATAMOSTEC (Chile); Turku University of Applied Sciences (Finland), 2021. [CrossRef]
- GVR, [Grand View Research, Inc. ]. Bifacial Solar Market Size, Share and Growth Report, 2030. https://www.grandviewresearch.com/industry-analysis/bifacial-solar-market-report (accessed 2025-02-23).
- MDF, [Market Data Forecast]. Bifacial Solar Market Size, Share, Trends & Growth, 2032. https://www.marketdataforecast.com/market-reports/bifacial-solar-market (accessed 2025-02-23).
- Ineichen, P.; Guisan, O.; Perez, R. Ground-Reflected Radiation and Albedo. Solar Energy 1990, 44, 207–214. [Google Scholar] [CrossRef]
- Ångström, A. The Albedo of Various Surfaces of Ground. Geografiska Annaler 1925, 7, 323–342. [Google Scholar] [CrossRef]
- Riedel-Lyngskær, N.; Ribaconka, M.; Pó, M.; Thorseth, A.; Thorsteinsson, S.; Dam-Hansen, C.; Jakobsen, M. L. The Effect of Spectral Albedo in Bifacial Photovoltaic Performance. Solar Energy 2022, 231, 921–935. [Google Scholar] [CrossRef]
- Russell, T. C. R.; Saive, R.; Augusto, A.; Bowden, S. G.; Atwater, H. A. The Influence of Spectral Albedo on Bifacial Solar Cells: A Theoretical and Experimental Study. IEEE Journal of Photovoltaics 2017, 7, 1611–1618. [Google Scholar] [CrossRef]
- Psiloglou, B. E.; Kambezidis, H. D. Estimation of the Ground Albedo for the Athens Area, Greece. Journal of Atmospheric and Solar-Terrestrial Physics 2009, 71, 943–954. [Google Scholar] [CrossRef]
- Fritz, S. The Albedo of the Ground and Atmosphere. 1948. [CrossRef]
- Atak, E. E.; Elcioglu, E. B.; Ozyurt, T. O. Nanopatterned Silicon Photovoltaic Cells Optimized for Narrowband Selective Reflectivity; Begel House Inc., 2023. [CrossRef]
- Jiang, S.; Wang, G.; Hu, P.; Chen, Z.; Jia, L. The Design of Beam Splitter for Two-Stage Reflective Spectral Beam Splitting Concentrating PV/Thermal System. In 2011 Asia-Pacific Power and Energy Engineering Conference; 2011; pp 1–4. [CrossRef]
- Modest, M. F. Radiative Heat Transfer, 2nd ed.; Academic Press: Amsterdam Boston, 2003. [Google Scholar]
- Wall, T. F.; Becker, H. B. Total Absorptivities and Emissivities of Particulate Coal Ash From Spectral Band Emissivity Measurements. Journal of Engineering for Gas Turbines and Power 1984, 106, 771–776. [Google Scholar] [CrossRef]
- Boyden, S. B.; Zhang, Y. Temperature and Wavelength-Dependent Spectral Absorptivities of Metallic Materials in the Infrared. Journal of Thermophysics and Heat Transfer 2006, 20, 9–15. [Google Scholar] [CrossRef]
- Shayegan, K. J.; Hwang, J. S.; Zhao, B.; Raman, A. P.; Atwater, H. A. Broadband Nonreciprocal Thermal Emissivity and Absorptivity. Light Sci Appl 2024, 13, 176. [Google Scholar] [CrossRef]
- Marzouk, O. A. Investigation of Strouhal Number Effect on Acoustic Fields. In 22nd National Conference on Noise Control Engineering (NOISE-CON 2007); INCE [Institute of Noise Control Engineering]: Reno, Nevada, USA, 2007, pp. 1056–1067. [Google Scholar]
- Marzouk, O. A. Noise Emissions from Excited Jets. In 22nd National Conference on Noise Control Engineering (NOISE-CON 2007); INCE [Institute of Noise Control Engineering]: Reno, Nevada, USA, 2007. pp 1034–1045. [Google Scholar]
- Marzouk, O. A. Accurate Prediction of Noise Generation and Propagation. In 18th Engineering Mechanics Division Conference of the American Society of Civil Engineers (ASCE-EMD); Zenodo: Blacksburg, Virginia, USA, 2007. pp 1–6. [Google Scholar]
- Howell, J. R.; Mengüc, M. P.; Daun, K.; Siegel, R. Thermal Radiation Heat Transfer, 7th ed.; CRC Press: Boca Raton, 2020. [Google Scholar] [CrossRef]
- Howell, J. R.; Perlmutter, M. Directional Behavior of Emitted and Reflected Radiant Energy from a Specular, Gray, Asymmetric Groove; Technical Note NASA TN D-1874; NASA [United States National Aeronautics and Space Administration]: Cleveland, Ohio, 1963. [Google Scholar]
- Zhou, L.; Dickinson, R. E.; Tian, Y.; Zeng, X.; Dai, Y.; Yang, Z.-L.; Schaaf, C. B.; Gao, F.; Jin, Y.; Strahler, A.; Myneni, R. B.; Yu, H.; Wu, W.; Shaikh, M. Comparison of Seasonal and Spatial Variations of Albedos from Moderate-Resolution Imaging Spectroradiometer (MODIS) and Common Land Model. Journal of Geophysical Research: Atmospheres 2003, 108. [Google Scholar] [CrossRef]
- Brest, C. L. Seasonal Albedo of an Urban/Rural Landscape from Satellite Observations. 1987, 26, 1169–1187.
- Wang, S.; Davidson, A. Impact of Climate Variations on Surface Albedo of a Temperate Grassland. Agricultural and Forest Meteorology 2007, 142, 133–142. [Google Scholar] [CrossRef]
- Trina Solar. Vertex Bifacial Dual Glass Monocrystalline Module; Datasheet TSM_EN_2022_A; LG Electronics Inc.: Changzhou, Jiangsu Province, China, 2022. https://static.trinasolar.com/sites/default/files/Datasheet_Vertex_DEG21C.20_EN_2022_A_0.pdf (accessed 2025-02-23).
- Adani Solar. Adani Solar ELAN PRIDE Series MBB P-Type PERC Half-Cut Bifacial PV Modules; Datasheet; India, 2025; pp 1–2. https://www.adanisolar.com/-/media/Project/AdaniSolar/Downloads/pdf/newdatasheet1/Pride-G2G-modules.pdf (accessed 2025-02-23).
- Abe, C. F.; Batista Dias, J.; Notton, G.; Faggianelli, G.-A.; Pigelet, G.; Ouvrard, D. Estimation of the Effective Irradiance and Bifacial Gain for PV Arrays Using the Maximum Power Current. IEEE Journal of Photovoltaics 2023, 13, 432–441. [Google Scholar] [CrossRef]
- Kreinin, L.; Karsenty, A.; Grobgeld, D.; Eisenberg, N. PV Systems Based on Bifacial Modules: Performance Simulation vs. Design Factors. In 2016 IEEE 43rd Photovoltaic Specialists Conference (PVSC); 2016; pp 2688–2691. [CrossRef]
- Sahu, P. K.; Batzelis, E. I.; Roy, J. N.; Chakraborty, C. Irradiance Effect on the Bifaciality Factors of Bifacial PV Modules. In 2022 IEEE 1st Industrial Electronics Society Annual On-Line Conference (ONCON); 2022; pp 1–6. [CrossRef]
- Hwang, S.; Lee, H.; Kang, Y. Bifacial Module Characterization Analysis with Current Mismatched PERC Cells. J. Korean Phys. Soc. 2024, 84, 145–150. [Google Scholar] [CrossRef]
- SunSolve. SunSolveTM - When Accuracy Matters. https://sunsolve.info (accessed 2025-02-24).
- Raina, G.; Sinha, S. A Simulation Study to Evaluate and Compare Monofacial Vs Bifacial PERC PV Cells and the Effect of Albedo on Bifacial Performance. Materials Today: Proceedings 2021, 46, 5242–5247. [Google Scholar] [CrossRef]
- Alam, M.; Gul, M. S.; Muneer, T. Performance Analysis and Comparison between Bifacial and Monofacial Solar Photovoltaic at Various Ground Albedo Conditions. Renewable Energy Focus 2023, 44, 295–316. [Google Scholar] [CrossRef]
- PVsyst. PVsyst documentation - References. https://www.pvsyst.com/help/references.html (accessed 2025-02-23).
- PVsyst. PVsyst documentation - Overview. https://www.pvsyst.com/help/ (accessed 2025-02-23).
- PVsyst. PVsyst │ Shop. https://www.pvsyst.com/shop-prices (accessed 2025-02-23).
- Su, X.; Luo, C.; Chen, X.; Ji, J.; Yu, Y.; Wu, Y.; Zou, W. Numerical Modeling of All-Day Albedo Variation for Bifacial PV Systems on Rooftops and Annual Yield Prediction in Beijing. Build. Simul. 2024, 17, 955–964. [Google Scholar] [CrossRef]
- Malik, A. S. Sustainable and Efficient Electricity Tariffs – A Case Study of Oman. Saudi J. Eng. Technol. 2022, 7, 118–127. [Google Scholar] [CrossRef]
- Marzouk, O. A. Detailed and Simplified Plasma Models in Combined-Cycle Magnetohydrodynamic Power Systems. International Journal of Advanced and Applied Sciences 2023, 10, 96–108. [Google Scholar] [CrossRef]
- OPWP, [Oman Power and Water Procurement Company]. OPWP’s 7-YEAR STATEMENT (2021 – 2027) (Issue 15); OPWP [Oman Power and Water Procurement Company]: Muscat, Sultanate of Oman, 2022. https://omanpwp.om/PDFAR/7%20Year%20Statement%20Issue%2015%202021%20-%202027.pdf (accessed 2022-09-12).
- Marzouk, O. A.; Al Kamzari, A. A.; Al-Hatmi, T. K.; Al Alawi, O. S.; Al-Zadjali, H. A.; Al Haseed, M. A.; Al Daqaq, K. H.; Al-Aliyani, A. R.; Al-Aliyani, A. N.; Al Balushi, A. A.; Al Shamsi, M. H. Energy Analyses for a Steam Power Plant Operating under the Rankine Cycle. In First International Conference on Engineering, Applied Sciences and Management (UoB-IEASMA 2021); Al Kalbani, A. S., Kanna, R., EP Rabai, L. B., Ahmad, S., Valsala, S., Eds.; IEASMA Consultants LLP: Virtual, 2021; pp. 11–22. [Google Scholar]
- IEA, [International Energy Agency]. Oman’s fossil fuel expertise could help drive clean energy transitions, new report shows - News. https://www.iea.org/news/oman-s-fossil-fuel-expertise-could-help-drive-clean-energy-transitions-new-report-shows (accessed 2025-03-06).
- Om2040U, [Oman Vision 2040 Implementation Follow-up Unit]. Oman 2040 Vision Document; Om2040U [Oman Vision 2040 Implementation Follow-up Unit]: Muscat, Sultanate of Oman, 2020. https://www.oman2040.om/VisionDocument?lang=en (accessed 2023-10-06).
- Birks, J. S.; Sinclair, C. A. Successful Education and Human Resource Development - The Key to Sustained Economic Growth*. In Oman: Economic, Social and Strategic Developments; Pridham, B. R., Ed.; Routledge: London, UK, 1987. [Google Scholar]
- Yahia, H. A. M.; Al-Shukaili, A. M.; Manchiryal, R. K.; Eissa, T.; Mohammed, A. A. Strategic Planning for the Development of Smart Cities in Oman. In The Emerald Handbook of Smart Cities in the Gulf Region: Innovation, Development, Transformation, and Prosperity for Vision 2040; Lytras, M. D., Alkhaldi, A., Malik, S., Eds.; Emerald Publishing Limited: Leeds, England, UK, 2024; pp. 289–304. [Google Scholar] [CrossRef]
- Om2040U, [Oman Vision 2040 Implementation Follow-up Unit]. Oman Vision 2040 │ Follow-up System. https://www.oman2040.om/organization?lang=en (accessed 2024-07-30).
- Al Farsi, W. A.; Achuthan, G. Analysis of Effectiveness of Smart City Implementation in Transportation Sector in Oman. In 2018 Majan International Conference (MIC); 2018; pp 1–6. [CrossRef]
- Marzouk, O. A. Urban Air Mobility and Flying Cars: Overview, Examples, Prospects, Drawbacks, and Solutions. Open Engineering 2022, 12, 662–679. [Google Scholar] [CrossRef]
- Brebbia, C. A.; Longhurst, J.; Marco, E.; Booth, C. Sustainable Development and Planning IX; WIT Press: Southampton, UK, 2017. [Google Scholar]
- Scholz, W.; Langer, S. Spatial Development of Muscat/Oman and Challenges of Public Transport. In Gulf Research Meeting 2016; Future Cities Laboratory Singapore; ETH Zurich: Cambridge, UK, 2019. [Google Scholar] [CrossRef]
- Al’Abri, K. The Impact of Globalization on Education Policy of Developing Countries: Oman as an Example. Literacy Information and Computer Education Journal 2011, 2, 491–502. [Google Scholar] [CrossRef]
- Albusaidi, S. Globalization and Its Impact on Higher Education: The Case of Colleges of Technology in Oman. Arab World English Journal 2021, No. 2, 284–297. [Google Scholar] [CrossRef]
- Al-Kalbani, M. S.; Price, M. F.; O’Higgins, T.; Ahmed, M.; Abahussain, A. Integrated Environmental Assessment to Explore Water Resources Management in Al Jabal Al Akhdar, Sultanate of Oman. Reg Environ Change 2016, 16, 1345–1361. [Google Scholar] [CrossRef]
- Al-Ismaily, H. A.; Probert, D. Photovoltaic Electricity Prospects in Oman. Applied Energy 1998, 59, 97–124. [Google Scholar] [CrossRef]
- Marzouk, O. A. Benchmarking the Trends of Urbanization in the Gulf Cooperation Council: Outlook to 2050. In 1st National Symposium on Emerging Trends in Engineering and Management (NSETEM’2017); WCAS [Waljat College of Applied Sciences], Muscat, Oman, 2017; pp 1–9.
- MEM, [Ministry of Energy and Minerals in the Sultanate of Oman]. MEM │ Green Hydrogen in Oman; Public Announcement; MEM [Ministry of Energy and Minerals in the Sultanate of Oman]: Muscat, Sultanate of Oman, 2022; pp 1–15. https://hydrom.om/events/hydromlaunch/221023_MEM_En.pdf (accessed 2023-10-06).
- Hydrom, [Hydrogen Oman]. About Us (Hydrom : Hydrogen Oman). https://hydrom.om/Hydrom.aspx?cms=iQRpheuphYtJ6pyXUGiNqiQQw2RhEtKe#about (accessed 2024-07-30).
- Zghaibeh, M.; Barhoumi, E. M.; Okonkwo, P. C.; Ben Belgacem, I.; Beitelmal, W. H.; Mansir, I. B. Analytical Model for a Techno-Economic Assessment of Green Hydrogen Production in Photovoltaic Power Station Case Study Salalah City-Oman. International Journal of Hydrogen Energy 2022, 47, 14171–14179. [Google Scholar] [CrossRef]
- Wang, J.; Wen, J.; Wang, J.; Yang, B.; Jiang, L. Water Electrolyzer Operation Scheduling for Green Hydrogen Production: A Review. Renewable and Sustainable Energy Reviews 2024, 203, 114779. [Google Scholar] [CrossRef]
- Marzouk, O. A. Levelized Cost of Green Hydrogen (LCOH) in the Sultanate of Oman Using H2A-Lite with Polymer Electrolyte Membrane (PEM) Electrolyzers Powered by Solar Photovoltaic (PV) Electricity. E3S Web of Conferences 2023, 469, 00101. [Google Scholar] [CrossRef]
- Zhou, H.; Xue, J.; Gao, H.; Ma, N. Hydrogen-Fueled Gas Turbines in Future Energy System. International Journal of Hydrogen Energy 2024, 64, 569–582. [Google Scholar] [CrossRef]
- Piscopo, A.; De Paepe, W.; Parente, A.; Iavarone, S. Chemical Timescale Analysis of the Partially Stirred Reactor Model for a Hydrogen-Fuelled Scramjet. Results in Engineering 2024, 23, 102834. [Google Scholar] [CrossRef]
- Farooq, A.; Alhalabi, W. Evaluation of Hydrogen Fuel Cell-Based Systematic Vehicular Application to Promote the Green Economy Using LabVIEW. Results in Engineering 2023, 20, 101607. [Google Scholar] [CrossRef]
- Li, J.-H.; Chen, Y.; Wang, J.-B.; Li, J.-Q.; Xu, H.; Li, J.-C.; Kwon, J.-T. Numerical Simulation and Optimization on the Thermofluidic Behavior of Thermal Management System in Hydrogen Fuel Cell. Results in Engineering 2024, 21, 101803. [Google Scholar] [CrossRef]
- Khan, M. W.; Bashir, S.; Kashif, M.; Shah, M. A. A.; Khan, I. W.; Khan, M. M. Hydrogen Fuel Cell Integrated Turbofan Engines Offer Lower Costs When Climate Impact Accounted for Aviation Purposes. Results in Engineering 2025, 26, 105337. [Google Scholar] [CrossRef]
- Lau, J. I. C.; Wang, Y. S.; Ang, T.; Seo, J. C. F.; Khadaroo, S. N. B. A.; Chew, J. J.; Ng Kay Lup, A.; Sunarso, J. Emerging Technologies, Policies and Challenges toward Implementing Sustainable Aviation Fuel (SAF). Biomass and Bioenergy 2024, 186, 107277. [Google Scholar] [CrossRef]
- Fasihi, M.; Breyer, C. Global Production Potential of Green Methanol Based on Variable Renewable Electricity. Energy & Environmental Science 2024, 17, 3503–3522. [Google Scholar] [CrossRef]
- Kang, S.; Pan, Z.; Guo, J.; Zhou, Y.; Wang, J.; Fan, L.; Zheng, C.; Cha, S. W.; Zhong, Z. Scientometric Analysis of Research Trends on Solid Oxide Electrolysis Cells for Green Hydrogen and Syngas Production. Front. Energy 2024, 18, 583–611. [Google Scholar] [CrossRef]
- Marzouk, O. A.; Huckaby, E. D. A Comparative Study of Eight Finite-Rate Chemistry Kinetics for CO/H2 Combustion. Engineering Applications of Computational Fluid Mechanics 2010, 4, 331–356. [Google Scholar] [CrossRef]
- Bora, N.; Kumar Singh, A.; Pal, P.; Kumar Sahoo, U.; Seth, D.; Rathore, D.; Bhadra, S.; Sevda, S.; Venkatramanan, V.; Prasad, S.; Singh, A.; Kataki, R.; Kumar Sarangi, P. Green Ammonia Production: Process Technologies and Challenges. Fuel 2024, 369, 131808. [Google Scholar] [CrossRef]
- Levikhin, A. A.; Boryaev, A. A. Low-Carbon Ammonia-Based Fuel for Maritime Transport. Results in Engineering 2025, 25, 104175. [Google Scholar] [CrossRef]
- Song, Y.; Liu, S.; Sun, P.; Qiu, W.; Li, Y.; Peng, C. Catalytic and Engineering Strategies for Enhanced Hydrogenation Reactions: A Review of Heterogeneous Catalysts and Process Optimization. Results in Engineering 2025, 25, 103958. [Google Scholar] [CrossRef]
- Borhani, M. R.; Kermani, F. Investigating the Method of Tungsten Leaching from Hydrocracking Catalyst HC-102 W/Ni/Al2O3/SiO2. Results in Engineering 2024, 23, 102488. [Google Scholar] [CrossRef]
- Trisunaryanti, W.; Wijaya, K.; Triyono, T.; Adriani, A. R.; Larasati, S. Green Synthesis of Hierarchical Porous Carbon Prepared from Coconut Lumber Sawdust as Ni-Based Catalyst Support for Hydrotreating Callophyllum Inophyllum Oil. Results in Engineering 2021, 11, 100258. [Google Scholar] [CrossRef]
- Murtza Qamar, H. G.; Guo, X.; Seif Ghith, E.; Tlija, M.; Siddique, A. Assessment of Energy Management and Power Quality Improvement of Hydrogen Based Microgrid System through Novel PSO-MWWO Technique. Sci Rep 2025, 15, 863. [Google Scholar] [CrossRef]
- Marzouk, O. A.; Jul, W. A. M. H. R.; Al Jabri, A. M. K.; Al-ghaithi, H. A. M. A. Construction of a Small-Scale Vacuum Generation System and Using It as an Educational Device to Demonstrate Features of the Vacuum. International Journal of Contemporary Education 2018, 1, 1–11. [Google Scholar] [CrossRef]
- Marzouk, O. A. English Programs for Non-English Speaking College Students. In 1st Knowledge Globalization Conference 2008 (KGLOBAL 2008); Sawyer Business School, Suffolk University: Boston, Massachusetts, USA, 2008. pp 1–8. [Google Scholar]
- Marzouk, O. A. Utilizing Co-Curricular Programs to Develop Student Civic Engagement and Leadership. The Journal of the World Universities Forum 2008, 1, 87–100. [Google Scholar] [CrossRef]
- Salman, H. Buraimi Dispute. In Global Encyclopedia of Territorial Rights; Gray, K. W., Ed.; Springer International Publishing: Cham, 2020. [Google Scholar] [CrossRef]
- OQ8, [Duqm Refinery and Petrochemical Industries Company]. About Duqm. https://www.oq8.om/about-oq8/about-duqm (accessed 2024-08-06).
- Al Farsi, A.; Dhanalekshmi, U. M.; Alam, T.; Althani, G. S.; Al-Ruqaishi, H. K.; Khan, S. A. Chemical Profiling and In Vitro Biological Evaluation of the Essential Oil of Caralluma Arabica from IBRI, Oman. Chem Nat Compd 2023, 59, 594–596. [Google Scholar] [CrossRef]
- Accessibility To The Historic Defence Sites Of Oman For People With Mobility Impairment: The Cases Of The Nakhal, Al Hazm And Khasab Fortifications.
- Benz, M. Musandam and Its Trade with Iran. Regional Linkages Across the Strait of Hormuz. In Regionalizing Oman: Political, Economic and Social Dynamics; Wippel, S., Ed.; Springer Netherlands: Dordrecht, 2013; pp. 205–216. [Google Scholar] [CrossRef]
- Nebel, S.; Richthofen, A. von. Urban Oman: Trends and Perspectives of Urbanisation in Muscat Capital Area; LIT Verlag Münster, 2016.
- Prathapar, S. A.; Khan, M.; Mbaga, M. D. The Potential of Transforming Salalah into Oman’s Vegetables Basket. In Environmental Cost and Face of Agriculture in the Gulf Cooperation Council Countries; Shahid, S. A., Ahmed, M., Eds.; Springer International Publishing: Cham, 2014; pp. 83–94. [Google Scholar] [CrossRef]
- Kazem, H. A.; Khatib, T. Techno-Economical Assessment of Grid Connected Photovoltaic Power Systems Productivity in Sohar, Oman. Sustainable Energy Technologies and Assessments 2013, 3, 61–65. [Google Scholar] [CrossRef]
- Alsadi, S.; Khatib, T. Photovoltaic Power Systems Optimization Research Status: A Review of Criteria, Constrains, Models, Techniques, and Software Tools. Applied Sciences 2018, 8, 1761. [Google Scholar] [CrossRef]
- Milosavljević, D. D.; Kevkić, T. S.; Jovanović, S. J. Review and Validation of Photovoltaic Solar Simulation Tools/Software Based on Case Study. Open Physics 2022, 20, 431–451. [Google Scholar] [CrossRef]
- Fogel, D. B. What Is Evolutionary Computation? IEEE Spectrum 2000, 37, 26–32. [Google Scholar] [CrossRef]
- Back, T.; Schwefel, H.-P. Evolutionary Computation: An Overview. Proceedings of IEEE International Conference on Evolutionary Computation; 1996; pp. 20–29. [Google Scholar] [CrossRef]
- Marzouk, O. A. University Role in Promoting Leadership and Commitment to the Community. In Inaugural International Forum on World Universities; Davos, Switzerland, 2008.
- Valko, N. V.; Kushnir, N. O.; Osadchyi, V. V. Cloud Technologies for STEM Education; [б. в.], 2020. [CrossRef]
- Marzouk, O. A. Benchmarking Retention, Progression, and Graduation Rates in Undergraduate Higher Education Across Different Time Windows. Cogent Education 2025, 12, 2498170. [Google Scholar] [CrossRef]
- Chu, W. W.; Hafiz, N. R. M.; Mohamad, U. A.; Ashamuddin, H.; Tho, S. W. A Review of STEM Education with the Support of Visualizing Its Structure through the CiteSpace Software. Int J Technol Des Educ 2023, 33, 39–61. [Google Scholar] [CrossRef]
- Gevorkian, P. Large-Scale Solar Power Systems: Construction and Economics; Cambridge University Press: New York City, New York, USA, 2012. [Google Scholar]
- Mesa-Jiménez, J. J.; Tzianoumis, A. L.; Stokes, L.; Yang, Q.; Livina, V. N. Long-Term Wind and Solar Energy Generation Forecasts, and Optimisation of Power Purchase Agreements. Energy Reports 2023, 9, 292–302. [Google Scholar] [CrossRef]
- De Groote, O.; Gautier, A.; Verboven, F. The Political Economy of Financing Climate Policy — Evidence from the Solar PV Subsidy Programs. Resource and Energy Economics 2024, 77, 101436. [Google Scholar] [CrossRef]
- Dupraz, C. Assessment of the Ground Coverage Ratio of Agrivoltaic Systems as a Proxy for Potential Crop Productivity. Agroforest Syst 2024, 98, 2679–2696. [Google Scholar] [CrossRef]
- Marzouk, O. A. Contrasting the Cartesian and Polar Forms of the Shedding-Induced Force Vector in Response to 12 Subharmonic and Superharmonic Mechanical Excitations. Fluid Dynamics Research 2010, 42, 035507. [Google Scholar] [CrossRef]
- Marzouk, O. A. In the Aftermath of Oil Prices Fall of 2014/2015–Socioeconomic Facts and Changes in the Public Policies in the Sultanate of Oman. International Journal of Management and Economics Invention 2017, 3, 1463–1479. [Google Scholar] [CrossRef]
- Shen, W.; Chen, X.; Qiu, J.; Hayward, J. A.; Sayeef, S.; Osman, P.; Meng, K.; Dong, Z. Y. A Comprehensive Review of Variable Renewable Energy Levelized Cost of Electricity. Renewable and Sustainable Energy Reviews 2020, 133, 110301. [Google Scholar] [CrossRef]
- Kessler, W. Comparing Energy Payback and Simple Payback Period for Solar Photovoltaic Systems. E3S Web Conf. 2017, 22, 00080. [Google Scholar] [CrossRef]
- Hartman, J. C.; Schafrick, I. C. The Relevant Internal Rate of Return. The Engineering Economist 2004, 49, 139–158. [Google Scholar] [CrossRef]
- Gallo, A. A Refresher on Net Present Value. Harvard Business Review. November 19, 2014, pp 1–3.
- Madayn. Suhar Industrial City. https://www.madayn.om/EN/Pages/Sohar.aspx (accessed 2025-02-26).
- Freezone, S. P. and. Sohar Port and Freezone. http://www.soharportandfreezone.com (accessed 2025-02-26).
- Suhar Airport. Tourism Guide Clone - Suhar Airport. https://www.suharairport.co.om/content/tourism-guide-clone (accessed 2025-02-26).
- Al Fazari, H. Higher Education in the Arab World: Research and Development from the Perspective of Oman and Sohar University. In Higher Education in the Arab World: Research and Development; Badran, A., Baydoun, E., Hillman, J. R., Eds.; Springer International Publishing: Cham, 2022; pp. 259–274. [Google Scholar] [CrossRef]
- Unxos GmbH. GeoNames - geographical database. https://www.geonames.org/advanced-search.html (accessed 2021-09-22).
- Öçal, M. F.; Şimşek, M.; Kapucu, S. Measuring the Height of a Flag Pole Using Smartphone GPS and Orientation Sensors. PRIMUS 2021, 31, 1007–1019. [Google Scholar] [CrossRef]
- EC, [European Commission]. PVGIS │ Data sources and calculation methods. https://joint-research-centre.ec.europa.eu/photovoltaic-geographical-information-system-pvgis/getting-started-pvgis/pvgis-data-sources-calculation-methods_en (accessed 2025-03-03).
- Maxwell, T. M.; Germino, M. J.; Romero, S.; Porensky, L. M.; Blumenthal, D. M.; Brown, C. S.; Adler, P. B. Experimental Manipulation of Soil-Surface Albedo Alters Phenology and Growth of Bromus Tectorum (Cheatgrass). Plant Soil 2023, 487, 325–339. [Google Scholar] [CrossRef]
- Marzouk, O. A. Flow Control Using Bifrequency Motion. Theoretical and Computational Fluid Dynamics 2011, 25, 381–405. [Google Scholar] [CrossRef]
- Song, B.; Park, K. Contribution of Greening and High-Albedo Coatings to Improvements in the Thermal Environment in Complex Urban Areas. Advances in Meteorology 2015, 2015, 792172. [Google Scholar] [CrossRef]
- Gul, M.; Kotak, Y.; Muneer, T.; Ivanova, S. Enhancement of Albedo for Solar Energy Gain with Particular Emphasis on Overcast Skies. Energies 2018, 11, 2881. [Google Scholar] [CrossRef]
- Sellers, W. D. Physical Climatology; University of Chicago Press: Chicago, Illinois, USA, 1965. [Google Scholar]
- Santamouris, M. Using Cool Pavements as a Mitigation Strategy to Fight Urban Heat Island—A Review of the Actual Developments. Renewable and Sustainable Energy Reviews 2013, 26, 224–240. [Google Scholar] [CrossRef]
- Xiao, B.; Bowker, M. A. Moss-Biocrusts Strongly Decrease Soil Surface Albedo, Altering Land-Surface Energy Balance in a Dryland Ecosystem. Science of The Total Environment 2020, 741, 140425. [Google Scholar] [CrossRef]
- ESC, [Energy Seal Coatings]. Cool Colors, Cool Roofs; Atlanta, Georgia, USA, 2011; pp 1–6. https://energy-seal.com/UserDyn/ACS/pdfs/ta_cool_colors,_cool_roofs.pdf (accessed 2025-06-18).
- Dickinson, R. E.; Hanson, B. Vegetation-Albedo Feedbacks. In Climate Processes and Climate Sensitivity; American Geophysical Union (AGU), 1984; pp 180–186. [CrossRef]
- Schwaiger, H. P.; Bird, D. N. Integration of Albedo Effects Caused by Land Use Change into the Climate Balance: Should We Still Account in Greenhouse Gas Units? Forest Ecology and Management 2010, 260, 278–286. [Google Scholar] [CrossRef]
- Shoukry, I.; Libal, J.; Kopecek, R.; Wefringhaus, E.; Werner, J. Modelling of Bifacial Gain for Stand-Alone and in-Field Installed Bifacial PV Modules. Energy Procedia 2016, 92, 600–608. [Google Scholar] [CrossRef]
- Johnson, J.; Manikandan, S. Experimental Study and Model Development of Bifacial Photovoltaic Power Plants for Indian Climatic Zones. Energy 2023, 284, 128693. [Google Scholar] [CrossRef]
- Sen, S.; Roesler, J.; King, D. Albedo Estimation of Finite-Sized Concrete Specimens. Journal of Testing and Evaluation 2019, 47, 738–757. [Google Scholar] [CrossRef]
- Zinzi, M. Cool Materials. In Energy Performance of Buildings: Energy Efficiency and Built Environment in Temperate Climates; Boemi, S.-N., Irulegi, O., Santamouris, M., Eds.; Springer International Publishing: Cham, Switzerland, 2016. [Google Scholar] [CrossRef]
- Cotfas, D. T.; Cotfas, P. A. Multiconcept Methods to Enhance Photovoltaic System Efficiency. International Journal of Photoenergy 2019, 2019, 1905041. [Google Scholar] [CrossRef]
- Ghosh, S.; Roy, J. N.; Chakraborty, C. A Model to Determine Soiling, Shading and Thermal Losses from PV Yield Data. Clean Energy 2022, 6, 372–391. [Google Scholar] [CrossRef]
- Jamal, J.; Mansur, I.; Rasid, A.; Mulyadi, M.; Dihyah Marwan, M.; Marwan, M. Evaluating the Shading Effect of Photovoltaic Panels to Optimize the Performance Ratio of a Solar Power System. Results in Engineering 2024, 21, 101878. [Google Scholar] [CrossRef]
- Brecl, K.; Topič, M. Self-Shading Losses of Fixed Free-Standing PV Arrays. Renewable Energy 2011, 36, 3211–3216. [Google Scholar] [CrossRef]
- Nicolás-Martín, C.; Eleftheriadis, P.; Santos-Martín, D. Validation and Self-Shading Enhancement for SoL: A Photovoltaic Estimation Model. Solar Energy 2020, 202, 386–408. [Google Scholar] [CrossRef]
- Marzouk, O. A. A Flight-Mechanics Solver for Aircraft Inverse Simulations and Application to 3D Mirage-III Maneuver. Global Journal of Control Engineering and Technology 2015, 1, 14–26. [Google Scholar] [CrossRef]
- Flores-Hernández, D. A.; Palomino-Resendiz, S.; Lozada-Castillo, N.; Luviano-Juárez, A.; Chairez, I. Mechatronic Design and Implementation of a Two Axes Sun Tracking Photovoltaic System Driven by a Robotic Sensor. Mechatronics 2017, 47, 148–159. [Google Scholar] [CrossRef]
- Xie, C.; Ding, X.; Jiang, R. Using Computer Graphics to Make Science Visible in Engineering Education. IEEE Computer Graphics and Applications 2023, 43, 99–106. [Google Scholar] [CrossRef]
- IFI, [Institute for Future Intelligence, Inc. ]. Institute for Future Intelligence │ Journal Papers. https://www.intofuture.org/journals.html (accessed 2025-03-01).
- NSF, [United States National Science Foundation]. NSF │ Funding at NSF. https://www.nsf.gov/funding (accessed 2025-06-12). /.
- NSF, [United States National Science Foundation]. NSF │ Award Abstract # 2105695 - Collaborative Research: SmartCAD: Guiding Engineering Design with Science Simulations. https://www.nsf.gov/awardsearch/showAward?AWD_ID=2105695 (accessed 2025-06-12).
- NSF, [United States National Science Foundation]. NSF │ Award Abstract # 2131097 - Science and Engineering Education for Infrastructure Transformation. https://www.nsf.gov/awardsearch/showAward?AWD_ID=2131097 (accessed 2025-06-12).
- NSF, [United States National Science Foundation]. NSF │ Award Abstract # 2301164 - Collaborative Research: A Solar and Wind Innovation and Technology Collaborative for Hawaii (SWITCH). https://www.nsf.gov/awardsearch/showAward?AWD_ID=2301164` (accessed 2025-06-12).
- Aaron, H. Aladdin │ Aaron’s Aladdin Video Tutorials. https://intofuture.org/aladdin-videos-kcc.html (accessed 2025-06-12).
- Olugbenga, A. G. Dependence of Operational Properties on Reboiler Duty in the Removal of CO2 from Natural Gas with Aspen Hysys. Results in Engineering 2024, 21, 101755. [Google Scholar] [CrossRef]
- López-Quesada, G.; Acosta-Iborra, A.; Sánchez-Rodríguez, M. R.; Salas-Colera, E.; Hernández-Jiménez, F. Preliminary CFD Simulations of a Lab-Scale Novel Design of a Particle Receiver for CSP Applications. Results in Engineering 2024, 24, 103360. [Google Scholar] [CrossRef]
- Marzouk, O. A. Simulation, Modeling, and Characterization of the Wakes of Fixed and Moving Cylinders. PhD in Engineering Mechanics, Virginia Polytechnic Institute and State University (Virginia Tech), Blacksburg, Virginia, USA, 2009. http://hdl.handle.net/10919/26316 (accessed 2024-11-26).
- Aishwarya, M.; Brisilla, R. M. Design of Energy-Efficient Induction Motor Using ANSYS Software. Results in Engineering 2022, 16, 100616. [Google Scholar] [CrossRef]
- Steiner, T. R. High Temperature Steady-State Experiment for Computational Radiative Heat Transfer Validation Using COMSOL and ANSYS. Results in Engineering 2022, 13, 100354. [Google Scholar] [CrossRef]
- Marzouk, O. A.; Nayfeh, A. H. Simulation, Analysis, and Explanation of the Lift Suppression and Break of 2:1 Force Coupling Due to in-Line Structural Vibration. In 49th AIAA/ASME/ASCE/AHS/ASC Structures, Structural Dynamics, and Materials Conference; AIAA [American Institute of Aeronautics and Astronautics]: Schaumburg, Illinois, USA, 2008; p AIAA 2008-2309. [CrossRef]
- Marzouk, O. A. Validating a Model for Bluff-Body Burners Using the HM1 Turbulent Nonpremixed Flame. Journal of Advanced Thermal Science Research 2016, 3, 12–23. [Google Scholar] [CrossRef]
- Marzouk, O. A. InvSim Algorithm for Pre-Computing Airplane Flight Controls in Limited-Range Autonomous Missions, and Demonstration via Double-Roll Maneuver of Mirage III Fighters. Scientific Reports 2025, 15, 23382. [Google Scholar] [CrossRef]
- Teja, K. V. S.; Garg, K.; Tyagi, H. Mathematical Modelling of Solar Updraft Tower. In Solar Energy: Systems, Challenges, and Opportunities; Tyagi, H., Chakraborty, P. R., Powar, S., Agarwal, A. K., Eds.; Springer: Singapore, 2020. [Google Scholar] [CrossRef]
- Martín-Olalla, J. M.; Mira, J. Assessing the Best Hour to Start the Day: An Appraisal of Seasonal Daylight Saving Time. Royal Society Open Science 2025, 12, 240727. [Google Scholar] [CrossRef]
- Kittler, R.; Darula, S. Determination of Time and Sun Position System. Solar Energy 2013, 93, 72–79. [Google Scholar] [CrossRef]
- Neumann, P.; von Blanckenburg, K. What Time Will It Be? A Comprehensive Literature Review on Daylight Saving Time. Time & Society 2025, 0961463X241310562. [CrossRef]
- Araújo, I.; Nunes, L. J. R.; Vilas, D. P.; Curado, A. The Impact of Daylight Saving Time on the Energy Efficiency of Buildings: A Bibliometric and General Review. Energies 2025, 18, 2088. [Google Scholar] [CrossRef]
- Salgado-Conrado, L.; Lopez-Montelongo, A.; Alvarez-Macias, C.; Hernadez-Jaquez, J. Review of Heliodon Developments and Computational Tools for Building Shadow Analysis. Buildings 2022, 12, 627. [Google Scholar] [CrossRef]
- Mikhael, M. G.; Metwaly, M. A Simple Heliodon System for Horizontal Placed Models. Journal of Contemporary Urban Affairs 2017, 1, 54–61. [Google Scholar] [CrossRef]
- Distance Tools. Distance Tools │ Distance Buraimi > Dubai - Air line, driving route, midpoint. Distance calculator. https://www.distance.to/Buraimi/Dubai (accessed 2025-06-18).
- Steyn, D. W.; Nemeth, W.; Page, M.; Theingi, S.; Young, D. L.; Agarwal, S.; Stradins, P. Measurement of Contact Resistivity In Symmetric Polycrystalline Si/SiOx/Monocrystalline Si Test Structures Using Variable Light Illumination. Solar RRL 2025, 9, 2400877. [Google Scholar] [CrossRef]
- Naaz, N.; Dutta, S.; Goel, S.; Ramaswamy, K. Calibrating Underwater Photovoltaic Performance: Demonstration Using Monocrystalline and Polycrystalline Silicon Solar Cells. Renewable Energy 2025, 247, 122993. [Google Scholar] [CrossRef]
- Yılmaz, M.; Çorapsız, M. R.; Çorapsız, M. F. A Novel Maximum Power Point Tracking Approach Based on Fuzzy Logic Control and Optimizable Gaussian Process Regression for Solar Systems under Complex Environment Conditions. Engineering Applications of Artificial Intelligence 2025, 141, 109780. [Google Scholar] [CrossRef]
- Hou, G.; Guo, Z. Maximum Power Point Tracking of Solar Photovoltaic under Partial Shading Conditions Based on Improved Salp Swarm Algorithm. Electric Power Systems Research 2025, 241, 111316. [Google Scholar] [CrossRef]
- Ge, Z.; Xu, Z.; Li, J.; Xu, J.; Xie, J.; Yang, F. Technical-Economic Evaluation of Various Photovoltaic Tracking Systems Considering Carbon Emission Trading. Solar Energy 2024, 271, 112451. [Google Scholar] [CrossRef]
- Chub, A.; Roman, K.; Korkh, O.; Vinnikov, D.; Kouro, S. Energy Yield Assessment Methodology for Photovoltaic Microinverters. In 2019 IEEE 15th Brazilian Power Electronics Conference and 5th IEEE Southern Power Electronics Conference (COBEP/SPEC); 2019; pp 1–5. [CrossRef]
- Tural, B.; Akar, O. Design and Economic Analysis of Marine Vessel PV Power System Based on Solar Radiation Estimation. IEEE Access 2025, 13, 89463–89480. [Google Scholar] [CrossRef]
- Angulo, A.; Huerta, M.; Mancilla–David, F. Identification of the 11-Parameter Functional Form Model for Photovoltaic Modules Using Manufacturer-Provided Ratings. IEEE Transactions on Industrial Informatics 2025, 21, 4694–4702. [Google Scholar] [CrossRef]
- NREL, [United States National Renewable Energy Laboratory]. SAM (System Advisor Model) │ Photovoltaic Models. https://sam.nrel.gov/index.php?option=com_content&view=article&id=47&Itemid=213 (accessed 2025-06-12).
- PVsyst. PVsyst documentation - Calculation and Model. https://www.pvsyst.com/help/project-design/shadings/calculation-and-model/index.html (accessed 2025-06-12).
- NREL, [United States National Renewable Energy Laboratory]. SAM (System Advisor Model) │ About. https://sam.nrel.gov/about-sam.html (accessed 2025-05-06).
- Shahzad, U. Critical Analysis For Solar Cell Models Using System Advisor Model Simulations. Journal of Electrical Engineering, Electronics, Control and Computer Science 2022, 9, 23–32. [Google Scholar]
- PVsyst. PVsyst documentation - Sandia Model. https://www.pvsyst.com/help/physical-models-used/pv-module-standard-one-diode-model/sandia-model.html (accessed 2025-06-12).
- Alfailakawi, M. S.; Michailos, S.; Ingham, D. B.; Hughes, K. J.; Ma, L.; Pourkashanian, M. Enhancing the Performance of an Aerosols-Affected Solar Power Tower in Arid Regions: A Case Study of Wind Turbines Hybridization. Results in Engineering 2024, 24, 102968. [Google Scholar] [CrossRef]
- NREL, [United States National Renewable Energy Laboratory]. SAM (System Advisor Model) │ Download. https://sam.nrel.gov/index.php?option=com_docman&view=tree&layout=default&slug=sam-versions&own=0&Itemid=146 (accessed 2025-06-12).
- R, K. P.; Pillai, A. S.; Al-Shahri, A. A Feasible and Sustainable Standalone Hybrid Renewable Energy System Experimentation for Remote Residential Applications of Khasab. Results in Engineering 2025, 26, 105360. [Google Scholar] [CrossRef]
- Manoj Kumar, N.; Chakraborty, S.; Kumar Yadav, S.; Singh, J.; Chopra, S. S. Advancing Simulation Tools Specific to Floating Solar Photovoltaic Systems – Comparative Analysis of Field-Measured and Simulated Energy Performance. Sustainable Energy Technologies and Assessments 2022, 52, 102168. [Google Scholar] [CrossRef]
- Wang, F.; Li, R.; Zhao, G.; Xia, D.; Wang, W. Simulation Test of 50 MW Grid-Connected “Photovoltaic+Energy Storage” System Based on Pvsyst Software. Results in Engineering 2024, 22, 102331. [Google Scholar] [CrossRef]
- Sereiviene, E.; Ding,Xiaotong; Jiang,Rundong; Bulseco,Dylan; and Xie, C. Learning Science and Engineering by Designing Sustainable Houses. The Science Teacher 2025, 92, 43–51. [Google Scholar] [CrossRef]
- Sereiviene, E.; Ding,Xiaotong; Jiang,Rundong; Zheng,Juan; Kashyrskyy,Andriy; Bulseco,Dylan; and Xie, C. Introducing Engineering Design to First-Year Students Through the Net Zero Energy Challenge. Journal of College Science Teaching 2024, 53, 507–515. [Google Scholar] [CrossRef]
- Sung, S.; Ding,Xiaotong; Jiang,Rundong; Sereiviene,Elena; Bulseco,Dylan; and Xie, C. Using Artificial Intelligence Teaching Assistants to Guide Students in Solar Energy Engineering Design. Journal of Geoscience Education 2024, 72, 347–366. [Google Scholar] [CrossRef]
- Jiang, R.; Ding, X.; Xie, C. Solarize Your World: Addressing Climate Change Through Renewable Energy Engineering. The Physics Teacher 2023, 61, 694–698. [Google Scholar] [CrossRef]
- Zheng, J.; Pan, Z.; Li, S.; Xie, C. Modeling Temporal Self-Regulatory Processes in STEM Learning of Engineering Design. Educational Technology & Society 2024, 27, 20–33. [Google Scholar] [CrossRef]
- Xie, C. Beyond Solar Cookers: Modeling and Designing Concentrated Solar Power as Engineering Projects in Physics Classrooms. The Physics Teacher 2023, 61, 447–452. [Google Scholar] [CrossRef]
- Sereiviene, E.; Jiang, R.; Sung, S.; Huang, X. Aladdin │ Solar Panels v. Trees (Educational Activity). https://intofuture.org/aladdin-solar-panels-v-trees.html (accessed 2025-06-12).
- Sereiviene, E.; Jiang, R. Aladdin │ Solarize Your School Curriculum Module. https://intofuture.org/aladdin-sys-unit.html (accessed 2025-06-12).
- Xie, C. Aladdin │ Visualizing the Pareto Front Using the Scalarization Method. https://intofuture.org/aladdin-generative-design-2.html (accessed 2025-06-12).
- Marzouk, O. A. Airfoil Design Using Genetic Algorithms. In The 2007 International Conference on Scientific Computing (CSC’07), The 2007 World Congress in Computer Science, Computer Engineering, and Applied Computing (WORLDCOMP’07); CSREA Press: Las Vegas, Nevada, USA, 2007; pp. 127–132. [Google Scholar]
- Xie, C. Aladdin │ Designing a Solar Farm with Artificial Intelligence. https://intofuture.org/aladdin-design-solar-farm-with-ai.html (accessed 2025-06-12).
- Agbogla, J.; Sekyere, C. K. K.; Forson, F. K.; Opoku, R.; Baah, B. Soiling Estimation Methods in Solar Photovoltaic Systems: Review, Challenges and Future Directions. Results in Engineering 2025, 26, 104810. [Google Scholar] [CrossRef]
- Mejia, F. A.; Kleissl, J. Soiling Losses for Solar Photovoltaic Systems in California. Solar Energy 2013, 95, 357–363. [Google Scholar] [CrossRef]
- Bierman, B.; O’Donnell, J.; Burke, R.; McCormick, M.; Lindsay, W. Construction of an Enclosed Trough EOR System in South Oman. Energy Procedia 2014, 49, 1756–1765. [Google Scholar] [CrossRef]
- Bierman, B.; Treynor, C.; O’Donnell, J.; Lawrence, M.; Chandra, M.; Farver, A.; Von Behrens, P.; Lindsay, W. Performance of an Enclosed Trough EOR System in South Oman. Energy Procedia 2014, 49, 1269–1278. [Google Scholar] [CrossRef]
- Borah, P.; Micheli, L.; Sarmah, N. Analysis of Soiling Loss in Photovoltaic Modules: A Review of the Impact of Atmospheric Parameters, Soil Properties, and Mitigation Approaches. Sustainability 2023, 15, 16669. [Google Scholar] [CrossRef]
- Sunpure Technology. Unveiling the Impact of Soiling Loss on PV Power Generation: Challenges and Solutions-Sunpure Intelligent Technology Co., LTD. https://en.sunpuretech.com/xiangqing/35.html (accessed 2025-06-13).
- Adekanbi, M. L.; Alaba, E. S.; John, T. J.; Tundealao, T. D.; Banji, T. I. Soiling Loss in Solar Systems: A Review of Its Effect on Solar Energy Efficiency and Mitigation Techniques. Cleaner Energy Systems 2024, 7, 100094. [Google Scholar] [CrossRef]
- Kazem, H. A.; Khatib, T.; Alwaeli, A. A. K. Optimization of Photovoltaic Modules Tilt Angle for Oman. In 2013 IEEE 7th International Power Engineering and Optimization Conference (PEOCO); 2013; pp 703–707. [CrossRef]
- Vieira, R. G.; Guerra, F. K. O. M. V.; Vale, M. R. B. G.; Araújo, M. M. Comparative Performance Analysis between Static Solar Panels and Single-Axis Tracking System on a Hot Climate Region near to the Equator. Renewable and Sustainable Energy Reviews 2016, 64, 672–681. [Google Scholar] [CrossRef]
- Gal, T.; Greenberg, H. J. Advances in Sensitivity Analysis and Parametric Programming; Springer Science & Business Media: New York, USA, 2012. [Google Scholar]
- Sulieman, H.; Kucuk, I.; McLellan, P. J. Parametric Sensitivity: A Case Study Comparison. Computational Statistics & Data Analysis 2009, 53, 2640–2652. [Google Scholar] [CrossRef]
- Marzouk, O. A. The Sod Gasdynamics Problem as a Tool for Benchmarking Face Flux Construction in the Finite Volume Method. Scientific African 2020, 10, e00573. [Google Scholar] [CrossRef]
- Xie, C.; Schimpf, C.; Chao, J.; Nourian, S.; Massicotte, J. Learning and Teaching Engineering Design through Modeling and Simulation on a CAD Platform. Comp Applic In Engineering 2018, 26, 824–840. [Google Scholar] [CrossRef]
- Ukoima, K. N.; Efughu, D.; Azubuike, O. C.; Akpiri, B. F. Investigating the Optimal Photovoltaic (PV) Tilt Angle Using the Photovoltaic Geographic Information System (PVGIS). Nigerian Journal of Technology 2024, 43, 101–114. [Google Scholar] [CrossRef]
- EC, [European Commission]. PVGIS │ User Manual. https://joint-research-centre.ec.europa.eu/photovoltaic-geographical-information-system-pvgis/getting-started-pvgis/pvgis-user-manual_en (accessed 2025-03-01).
- Psomopoulos, C. S.; Ioannidis, G. Ch.; Kaminaris, S. D.; Mardikis, K. D.; Katsikas, N. G. A Comparative Evaluation of Photovoltaic Electricity Production Assessment Software (PVGIS, PVWatts and RETScreen). Environ. Process. 2015, 2, 175–189. [Google Scholar] [CrossRef]
- Sauer, K. J.; Roessler, T.; Hansen, C. W. Modeling the Irradiance and Temperature Dependence of Photovoltaic Modules in PVsyst. IEEE Journal of Photovoltaics 2015, 5, 152–158. [Google Scholar] [CrossRef]
- Yadav, P.; Kumar, N.; Chandel, S. S. Simulation and Performance Analysis of a 1kWp Photovoltaic System Using PVsyst. In 2015 International Conference on Computation of Power, Energy, Information and Communication (ICCPEIC); 2015; pp 0358–0363. [CrossRef]
- Kandasamy, C. P.; Prabu, P.; Niruba, K. Solar Potential Assessment Using PVSYST Software. In 2013 International Conference on Green Computing, Communication and Conservation of Energy (ICGCE); 2013; pp 667–672. [CrossRef]
- Deniz, M. Analysis of Accessibility to Public Schools with GIS: A Case Study of Salihli City (Turkey). Children’s Geographies 2024, 22, 30–51. [Google Scholar] [CrossRef]
- Özen, T.; Bülbül, A.; Tarcan, G. Reservoir and Hydrogeochemical Characterizations of Geothermal Fields in Salihli, Turkey. Journal of Asian Earth Sciences 2012, 60, 1–17. [Google Scholar] [CrossRef]
- Ozgener, L.; Hepbasli, A.; Dincer, I. Energy and Exergy Analysis of Salihli Geothermal District Heating System in Manisa, Turkey. International Journal of Energy Research 2005, 29, 393–408. [Google Scholar] [CrossRef]
- JinkoSolar. Case Study │ Witznitz Energy Park 650 MW, Germany. https://jinkosolar.eu/case-study/witznitz-energy-park-650-mw-germany (accessed 2025-03-04). /.
- Smith, B.; Woodhouse, M.; Feldman, D.; Margolis, R. Solar Photovoltaic (PV) Manufacturing Expansions in the United States, 2017-2019: Motives, Challenges, Opportunities, and Policy Context; Technical Report NREL/TP-6A20-74807; NREL [United States National Renewable Energy Laboratory]: Golden, Colorado, USA, 2021. [Google Scholar] [CrossRef]
- Rowlands, I. H.; Kemery, B. P.; Beausoleil-Morrison, I. Optimal Solar-PV Tilt Angle and Azimuth: An Ontario (Canada) Case-Study. Energy Policy 2011, 39, 1397–1409. [Google Scholar] [CrossRef]
- Etukudor, C.; Orovwode, H.; Wara, S.; Agbetuyi, F.; Adozhe, A.; Obieje, B. O.; Oparaocha, C. N. Optimum Tilt and Azimuth Angles for Solar Photovoltaic Systems in South-West Nigeria. In 2018 IEEE PES/IAS PowerAfrica; 2018; pp 348–353. [CrossRef]
- Salas, V.; Olías, E. Overview of the State of Technique for PV Inverters Used in Low Voltage Grid-Connected PV Systems: Inverters above 10 kW. Renewable and Sustainable Energy Reviews 2011, 15, 1250–1257. [Google Scholar] [CrossRef]
- Vaicys, J.; Norkevicius, P.; Baronas, A.; Gudzius, S.; Jonaitis, A.; Peftitsis, D. Efficiency Evaluation of the Dual System Power Inverter for On-Grid Photovoltaic System. Energies 2022, 15, 161. [Google Scholar] [CrossRef]
- Burger, B.; Kranzer, D. Extreme High Efficiency PV-Power Converters. In 2009 13th European Conference on Power Electronics and Applications; 2009; pp 1–13.
- Lei, Y.; Barth, C.; Qin, S.; Liu, W.; Moon, I.; Stillwell, A.; Chou, D.; Foulkes, T.; Ye, Z.; Liao, Z.; Pilawa-Podgurski, R. C. N. A 2 kW, Single-Phase, 7-Level, GaN Inverter with an Active Energy Buffer Achieving 216 W/In3 Power Density and 97.6% Peak Efficiency. In 2016 IEEE Applied Power Electronics Conference and Exposition (APEC); 2016; pp 1512–1519. [CrossRef]
- Pinker, R. T.; Militana, L. M. The Asymmetry of Global Solar Radiation Around Solar Noon. 1988.
- Pereira, A. B.; Villa Nova, N. A.; Galvani, E. Estimation of Global Solar Radiation Flux Density in Brazil from a Single Measurement at Solar Noon. Biosystems Engineering 2003, 86, 27–34. [Google Scholar] [CrossRef]
- Chippindale, C. Stoned Henge: Events and Issues at the Summer Solstice, 1985. World Archaeology 1986, 18, 38–58. [Google Scholar] [CrossRef]
- Sojka, J. J.; Schunk, R. W. A Theoretical Study of the Global F Region for June Solstice, Solar Maximum, and Low Magnetic Activity. Journal of Geophysical Research: Space Physics 1985, 90, 5285–5298. [Google Scholar] [CrossRef]
- Myrabø, H. K. Temperature Variation at Mesopause Levels during Winter Solstice at 78°N. Planetary and Space Science 1984, 32, 249–255. [Google Scholar] [CrossRef]
- Trolle, A. K. Winter Solstice Celebrations in Denmark: A Growing Non-Religious Ritualisation. Religions 2021, 12, 74. [Google Scholar] [CrossRef]
- Borfecchia, F.; Caiaffa, E.; Pollino, M.; De Cecco, L.; Martini, S.; La Porta, L.; Marucci, A. Remote Sensing and GIS in Planning Photovoltaic Potential of Urban Areas. European Journal of Remote Sensing 2014, 47, 195–216. [Google Scholar] [CrossRef]
- Marzouk, O. A. A Two-Step Computational Aeroacoustics Method Applied to High-Speed Flows. Noise Control Engineering Journal 2008, 56, 396. [Google Scholar] [CrossRef]
- Gawley, D.; McKenzie, P. Investigating the Suitability of GIS and Remotely-Sensed Datasets for Photovoltaic Modelling on Building Rooftops. Energy and Buildings 2022, 265, 112083. [Google Scholar] [CrossRef]
- Marzouk, O. A. Temperature-Dependent Functions of the Electron–Neutral Momentum Transfer Collision Cross Sections of Selected Combustion Plasma Species. Applied Sciences 2023, 13, 11282. [Google Scholar] [CrossRef]
- Türkdoğru, E.; Kutay, M. Analysis of Albedo Effect in a 30-kW Bifacial PV System with Different Ground Surfaces Using PVsyst Software. Journal of Energy Systems 2022, 6, 543–559. [Google Scholar] [CrossRef]
- Ganesan, K.; Winston, D. P.; Sugumar, S.; Jegan, S. Performance Analysis of N-Type PERT Bifacial Solar PV Module under Diverse Albedo Conditions. Solar Energy 2023, 252, 81–90. [Google Scholar] [CrossRef]
- Ghenai, C.; Ahmad, F. F.; Rejeb, O.; Bettayeb, M. Artificial Neural Networks for Power Output Forecasting from Bifacial Solar PV System with Enhanced Building Roof Surface Albedo. Journal of Building Engineering 2022, 56, 104799. [Google Scholar] [CrossRef]
- OPG, [Oman Pocket Guide]. Khasab, Musandam. https://omanpocketguide.com/khasab-musandam (accessed 2025-03-03).
- Searle, M. Musandam Peninsula and Straits of Hormuz. In Geology of the Oman Mountains, Eastern Arabia; Searle, M., Ed.; Springer International Publishing: Cham, 2019; pp. 129–146. [Google Scholar] [CrossRef]
- Okonkwo, P. C.; Barhoumi, E. M.; Murugan, S.; Zghaibeh, M.; Otor, C.; Abo-Khalil, A. G.; Amer Mohamed, A. M. Economic Analysis of Cross-Breed Power Arrangement for Salalah Region in the Al-Khareef Season. International Journal of Sustainable Energy 2021, 40, 188–206. [Google Scholar] [CrossRef]
- Carr, C. M.; Yavary, M.; Yavary, M. Wave Agitation Studies for Port Expansion - Salalah, Oman. 2012, 1–10. [CrossRef]
- Padovan, A.; Del Col, D.; Sabatelli, V.; Marano, D. DNI Estimation Procedures for the Assessment of Solar Radiation Availability in Concentrating Systems. Energy Procedia 2014, 57, 1140–1149. [Google Scholar] [CrossRef]
- Dugaria, S.; Padovan, A.; Sabatelli, V.; Del Col, D. Assessment of Estimation Methods of DNI Resource in Solar Concentrating Systems. Solar Energy 2015, 121, 103–115. [Google Scholar] [CrossRef]
- Cogliani, E. The Role of the Direct Normal Irradiance (DNI) Forecasting in the Operation of Solar Concentrating Plants. Energy Procedia 2014, 49, 1612–1621. [Google Scholar] [CrossRef]
- 295. OPWP, [Oman Power and Water Procurement Company]. Solar Data - Weather Impact Analysis; OPWP [Oman Power and Water Procurement Company]: Muscat, Oman, 2013. https://omanpwp.om/PDF/Solar%20Data%20-%20Weather%20Impact%20Analysis.pdf (accessed 2021-11-03).
- Marzouk, O. A.; Huckaby, E. D. Simulation of a Swirling Gas-Particle Flow Using Different k-Epsilon Models and Particle-Parcel Relationships. Engineering Letters 2010, 18. [Google Scholar]
- Bierman, B.; Treynor, C.; O’Donnell, J.; Lawrence, M.; Chandra, M.; Farver, A.; Von Behrens, P.; Lindsay, W. Performance of an Enclosed Trough EOR System in South Oman. Energy Procedia 2014, 49, 1269–1278. [Google Scholar] [CrossRef]
- NASA, [United States National Aeronautics and Space Administration]. Earth Observatory │ Aerosol Optical Depth. https://earthobservatory.nasa.gov/global-maps/MODAL2_M_AER_OD (accessed 2025-04-25).
- NASA, [United States National Aeronautics and Space Administration]. Earth Observatory │ Aerosol Size & Aerosol Optical Depth. https://earthobservatory.nasa.gov/global-maps/MODAL2_M_AER_RA/MODAL2_M_AER_OD (accessed 2025-04-25).
- NASA, [United States National Aeronautics and Space Administration]. Ozone, Aerosol, Trace Gases │ Ozone & Atmospheric Composition. https://ozoneaq.gsfc.nasa.gov/map/#d:2024-05-02..2024-05-31,2024-05-02;l:country-outline,aura_aerosol,earth;@55.8,21.7,6.0z (accessed 2025-04-25).
Figure 1.
Photo of a bifacial photovoltaic system with a soil ground with a dark color, thus allowing very low albedo (photo taken by the author).
Figure 1.
Photo of a bifacial photovoltaic system with a soil ground with a dark color, thus allowing very low albedo (photo taken by the author).
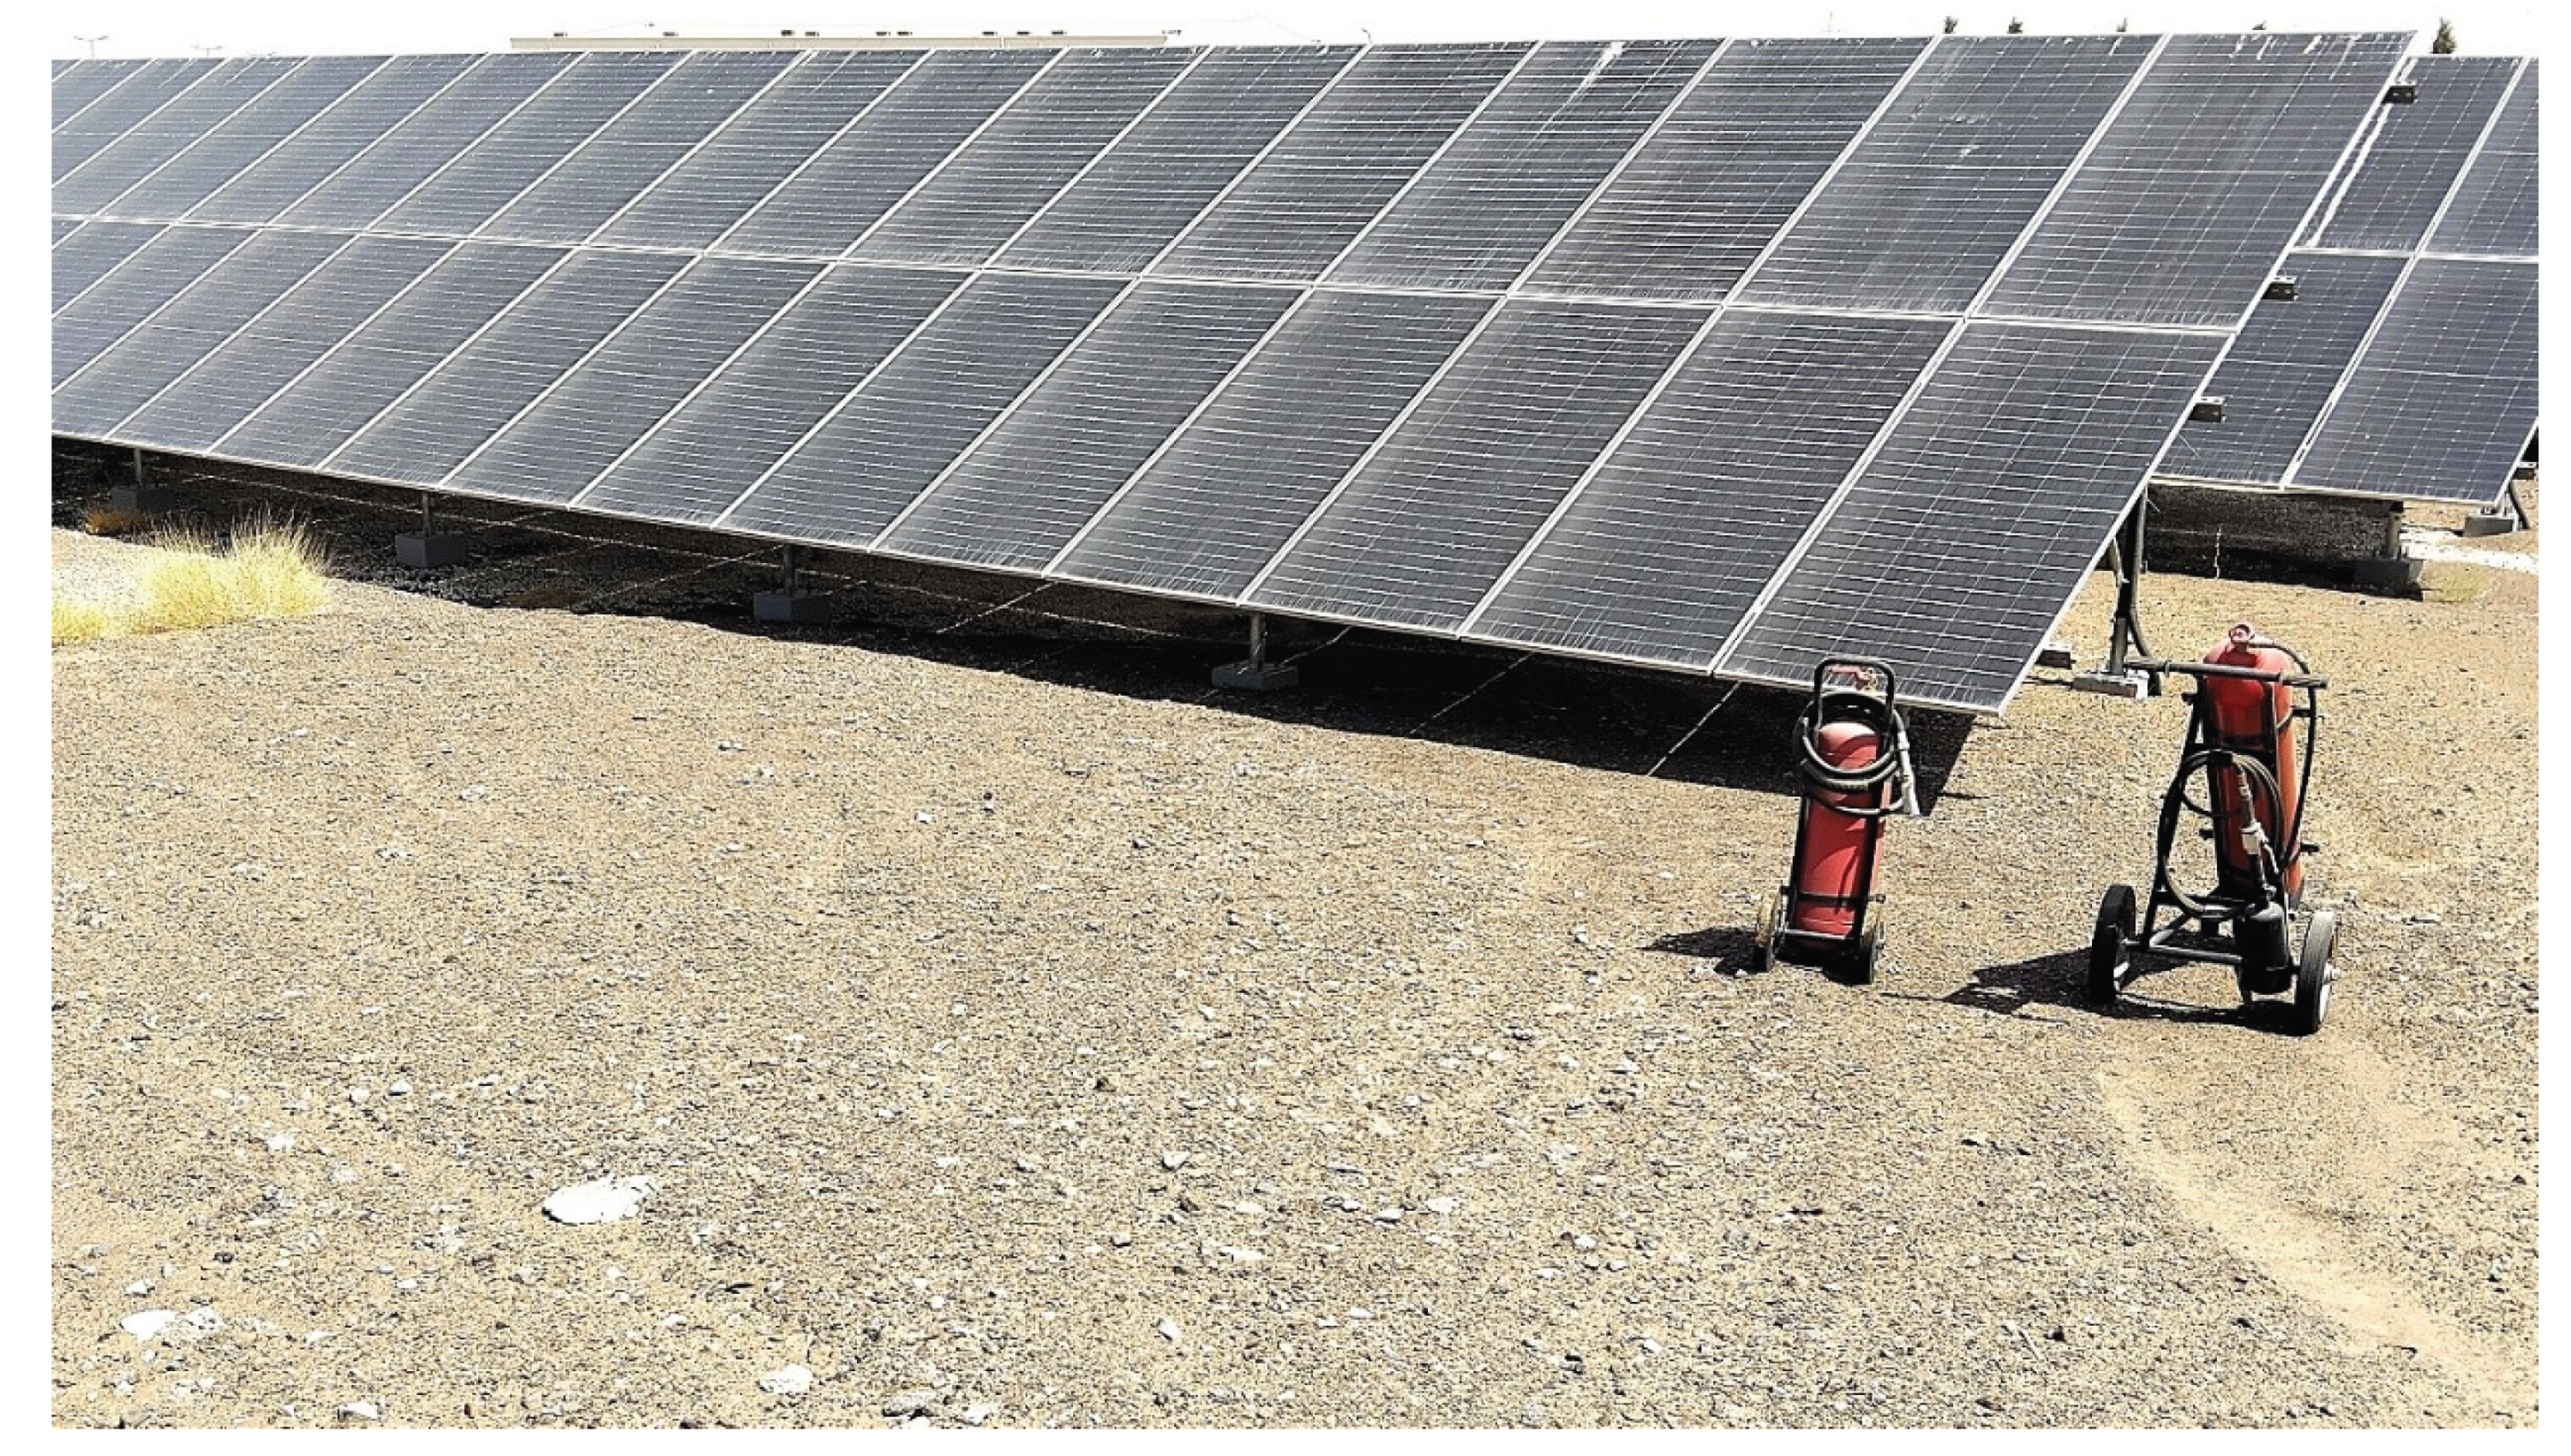
Figure 2.
Photo of a bifacial photovoltaic system with the ground covered intentionally by gravel to improve light reflection, thus allowing high albedo (photo taken by the author).
Figure 2.
Photo of a bifacial photovoltaic system with the ground covered intentionally by gravel to improve light reflection, thus allowing high albedo (photo taken by the author).
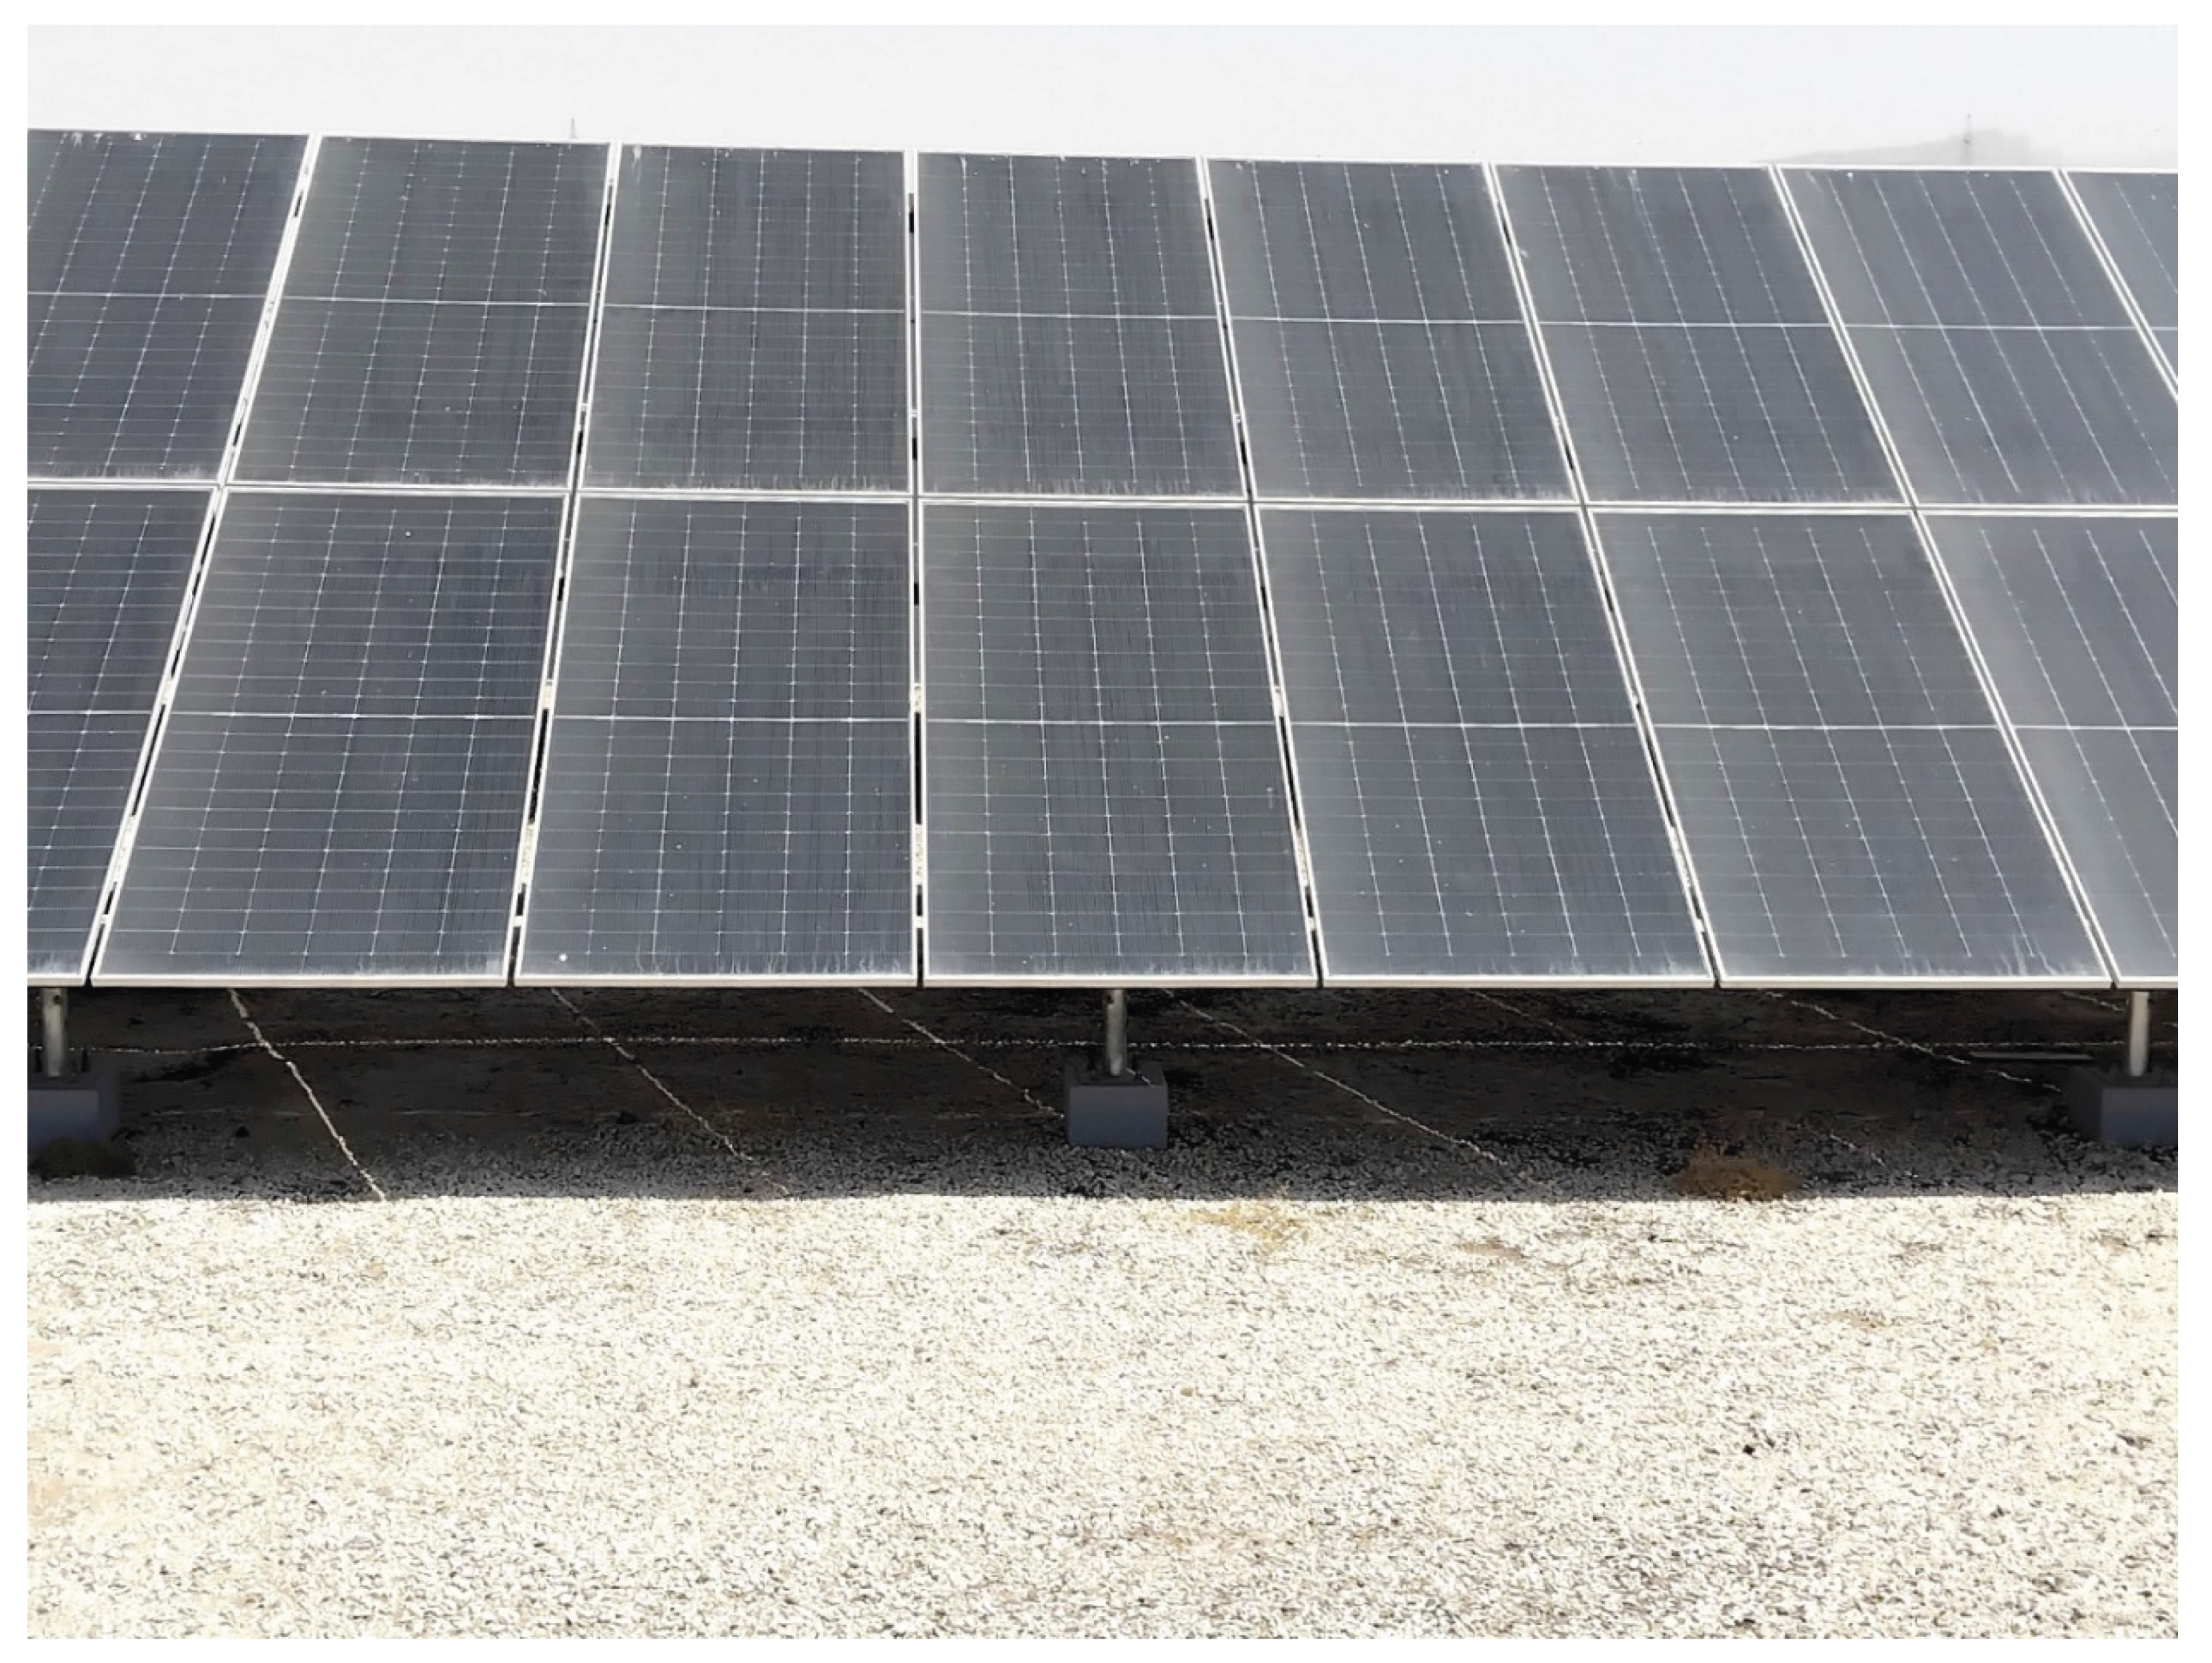
Figure 3.
Illustration of the interface of the Aladdin web-based modeling software. The heliodon is enabled. This particular view corresponds to 12 noon (solar time) on 21 December in Muscat. The view also shows the built-in weather data (monthly profiles of the maximum and minimum air temperature, and the sunshine hours).
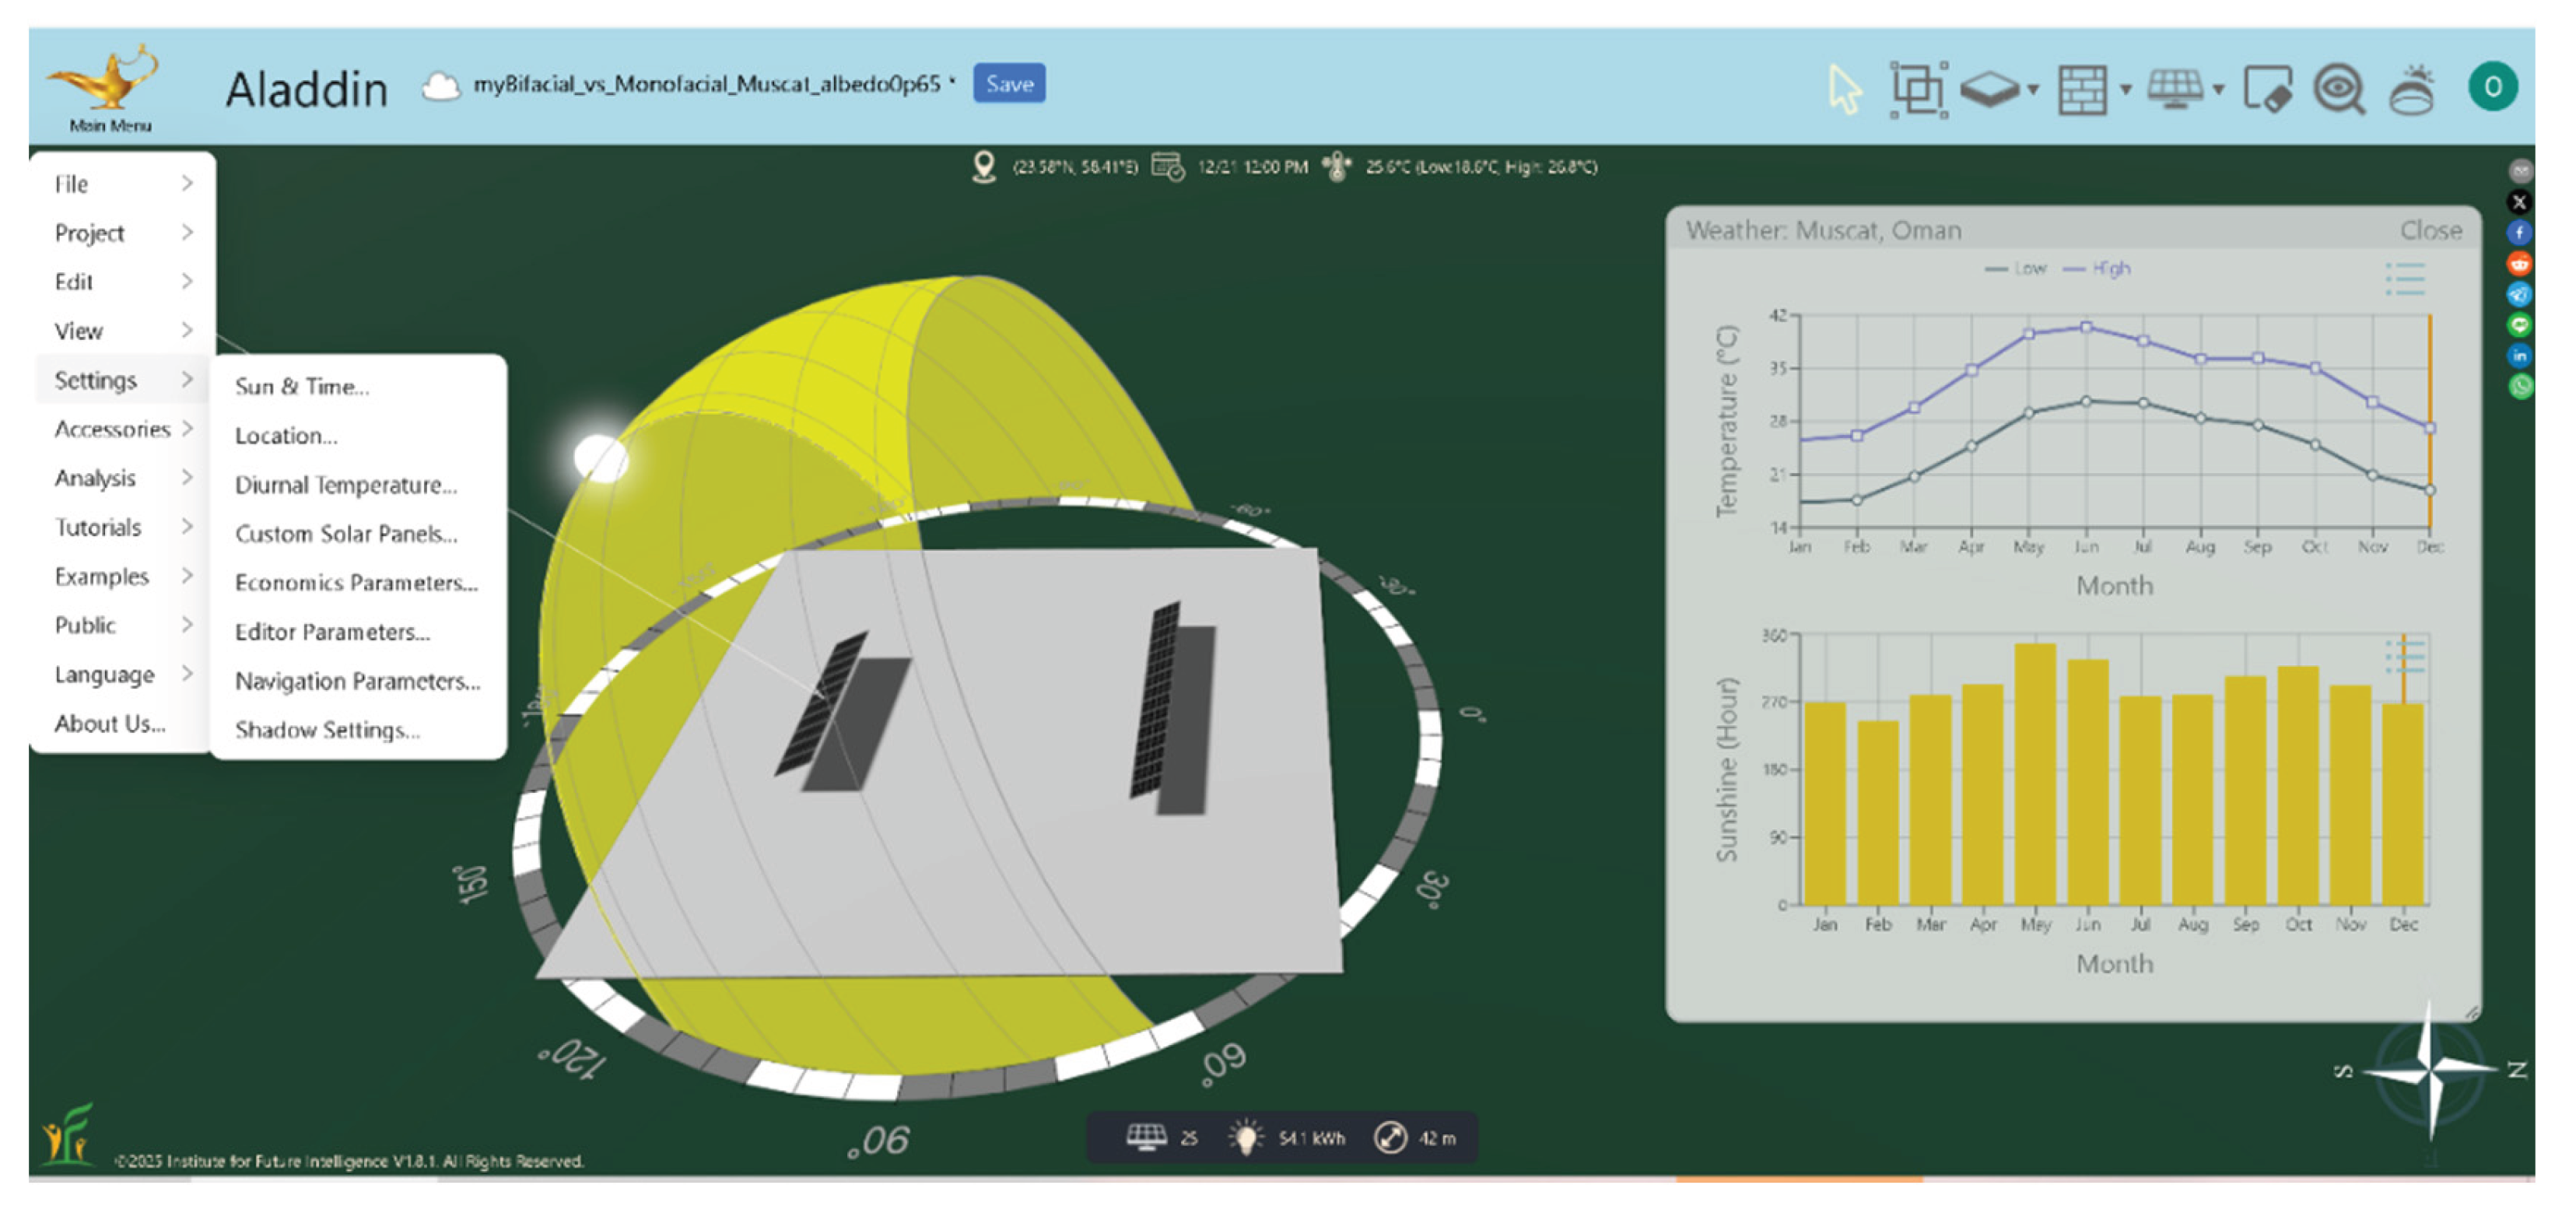
Figure 4.
Illustration of the interface of the Aladdin web-based modeling software. The heliodon is enabled. This particular view corresponds to 12 noon (solar time) on 21 June in Muscat.
Figure 4.
Illustration of the interface of the Aladdin web-based modeling software. The heliodon is enabled. This particular view corresponds to 12 noon (solar time) on 21 June in Muscat.
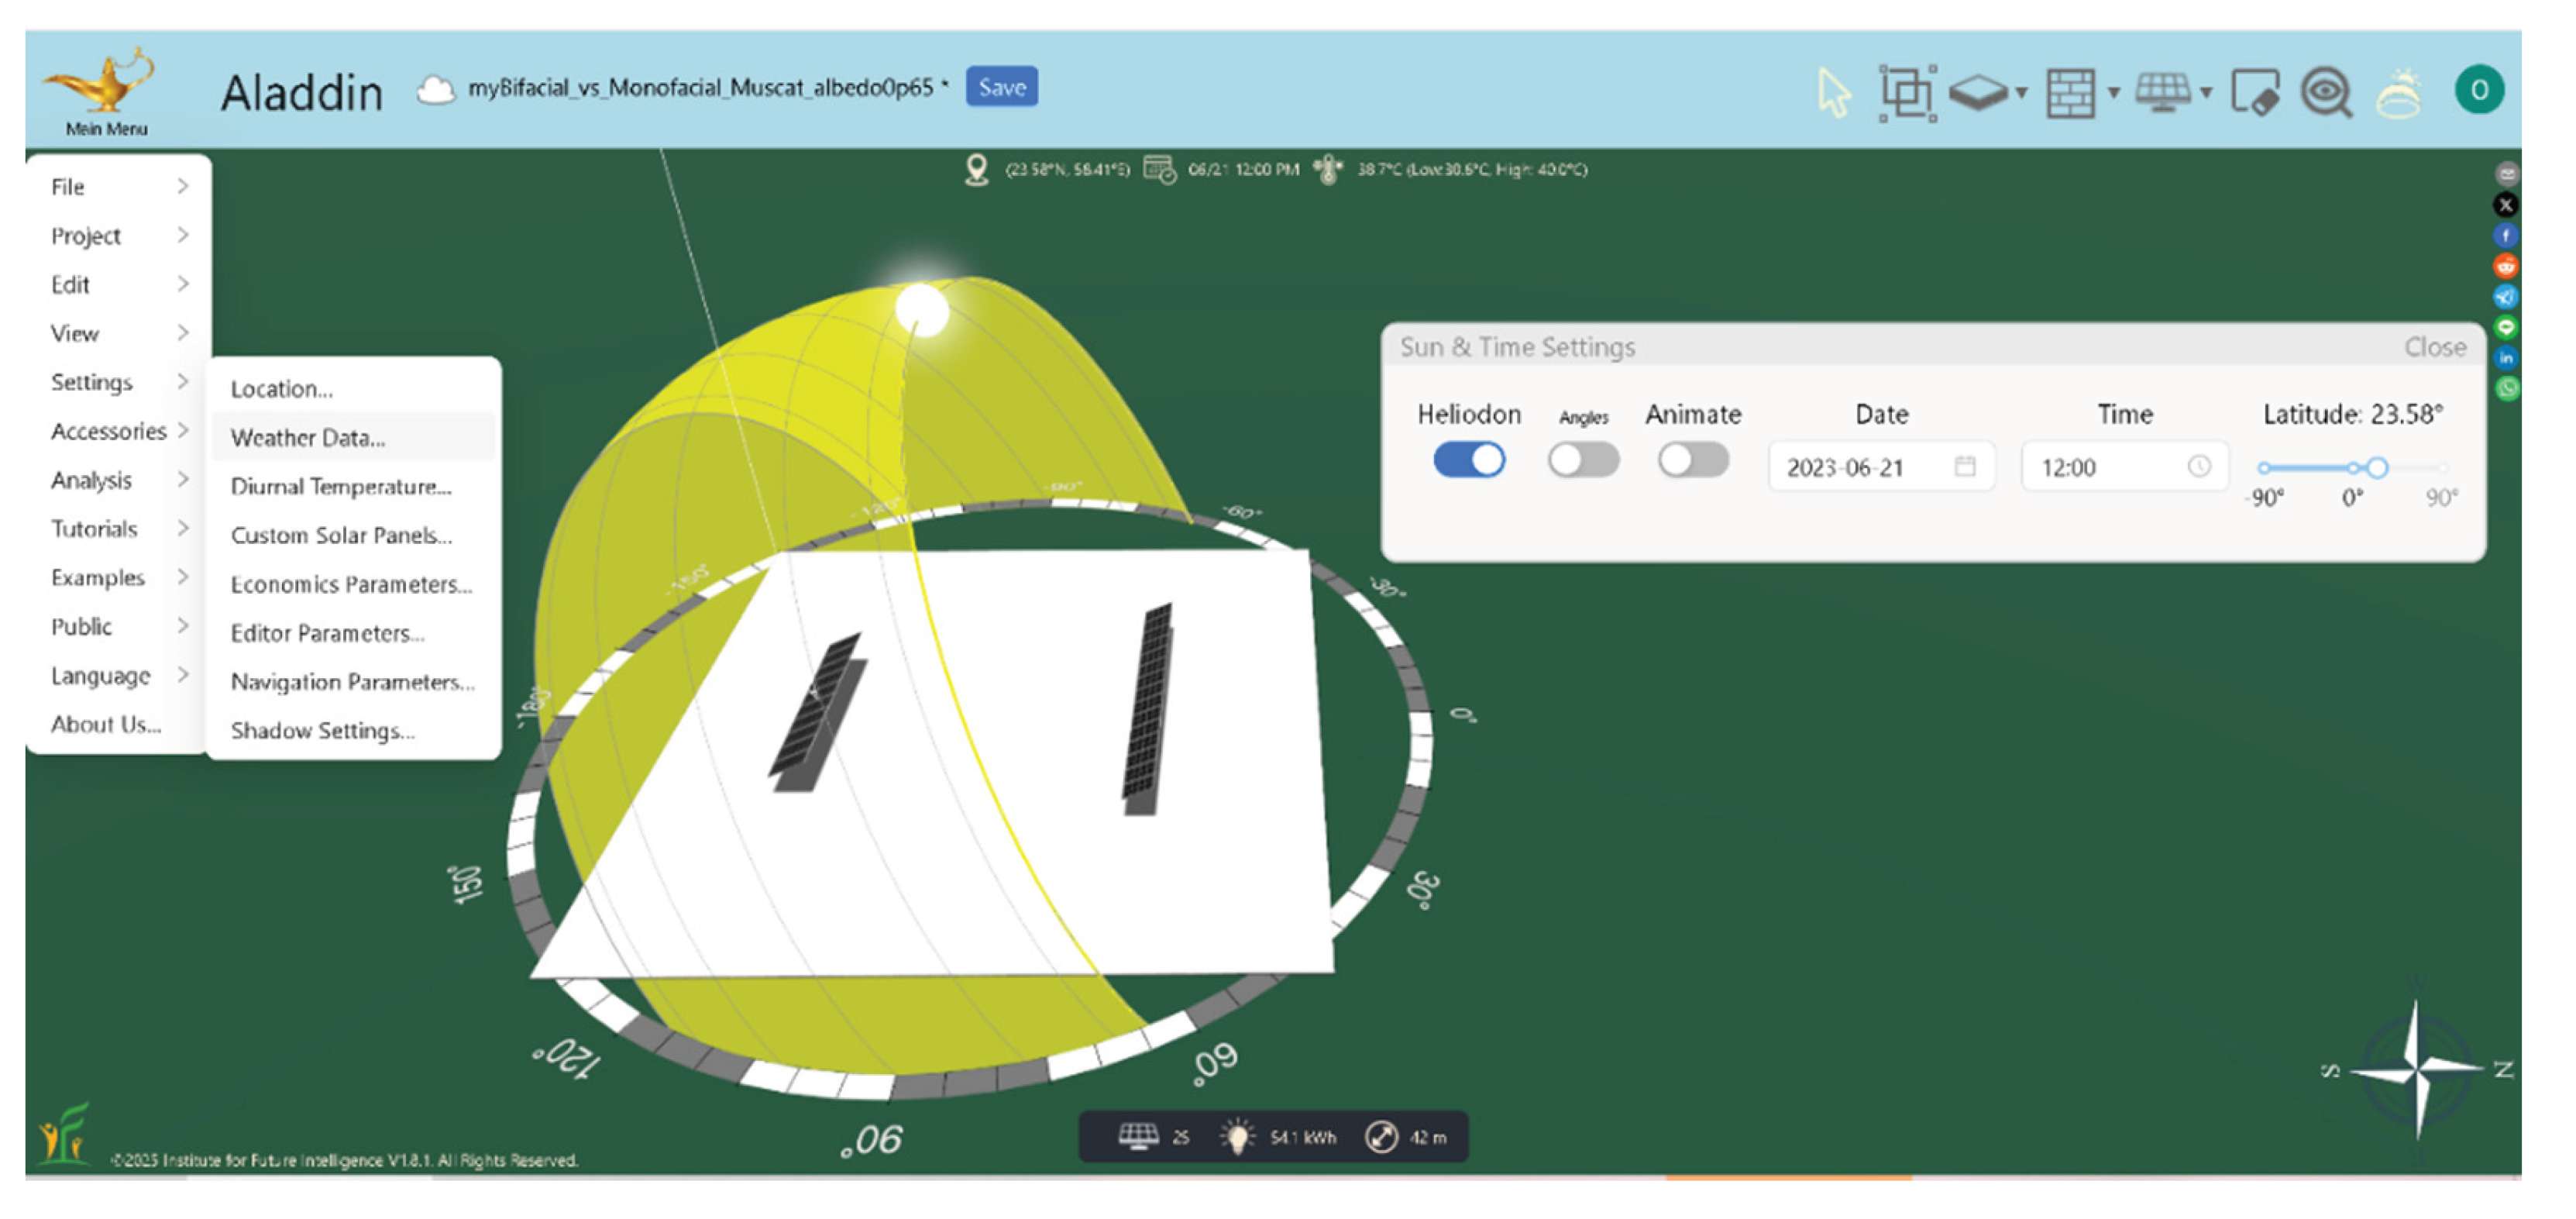
Figure 5.
Illustration of the interface of the Aladdin web-based modeling software. The heliodon is enabled. This particular view corresponds to 5 pm (solar time) on 21 June in Buraimi. The view also shows the built-in weather data (but corresponding to Dubai, the closest city available in the internal database of Aladdin).
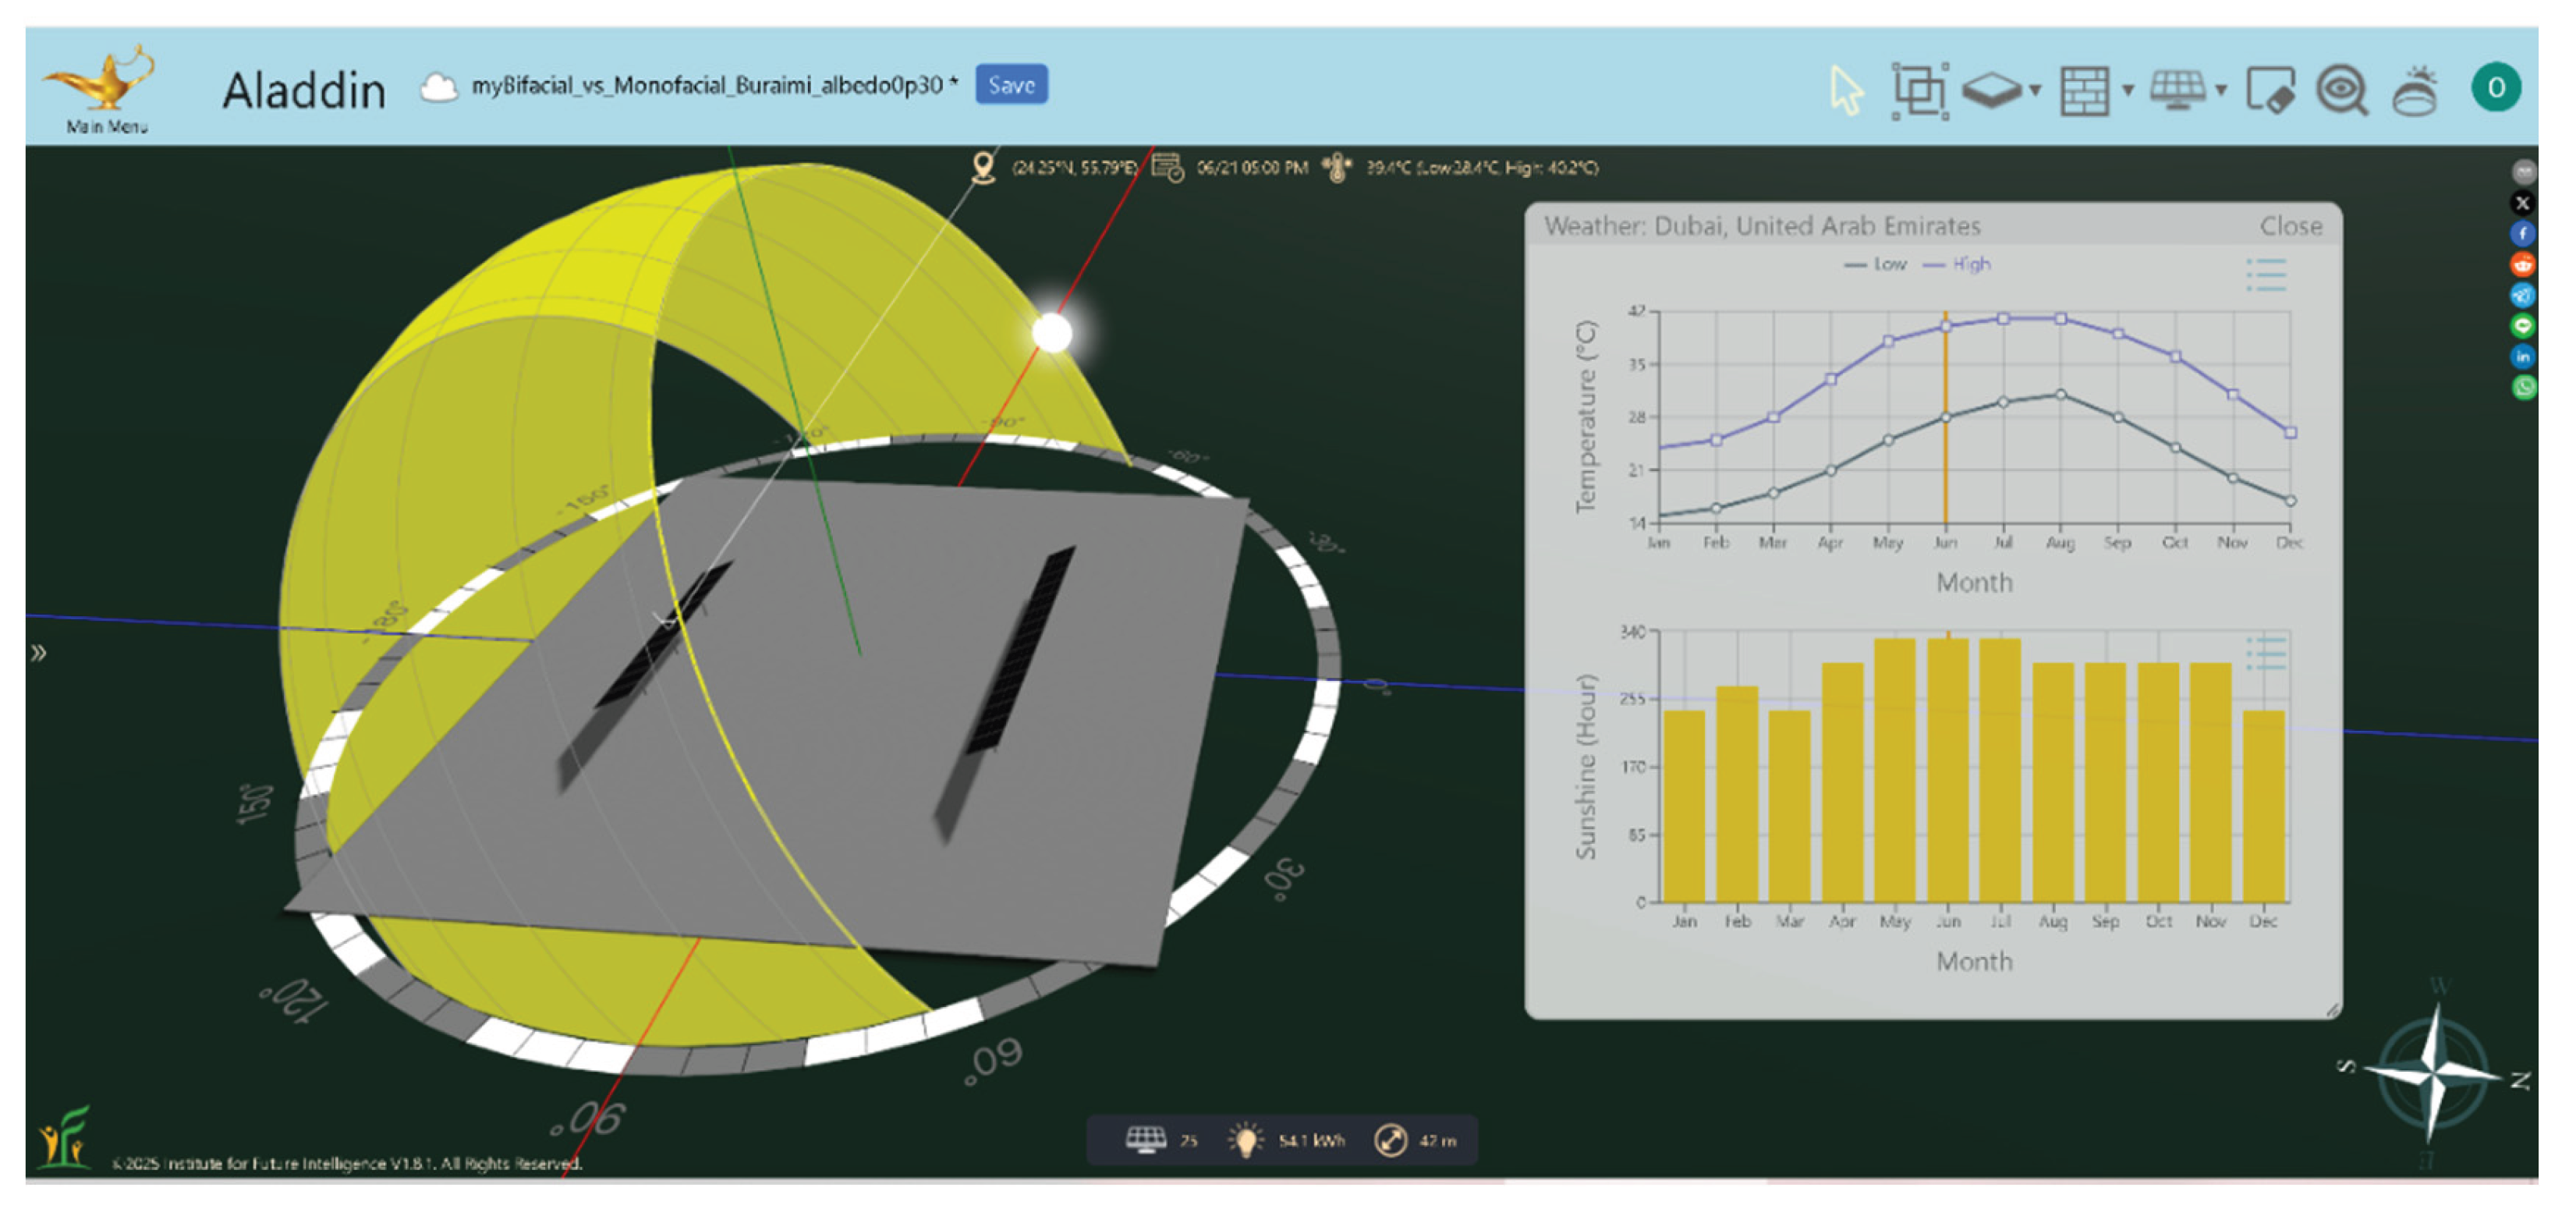
Figure 6.
Illustration of the interface of the Aladdin web-based modeling software. The heliodon is enabled. This particular view corresponds to 2:30 pm (solar time) on 21 June in Buraimi. The view also shows the modeled hourly (per hour, during the day) variation in air temperature and ground temperature (but corresponding to Dubai, the closest city available in the internal database of Aladdin).
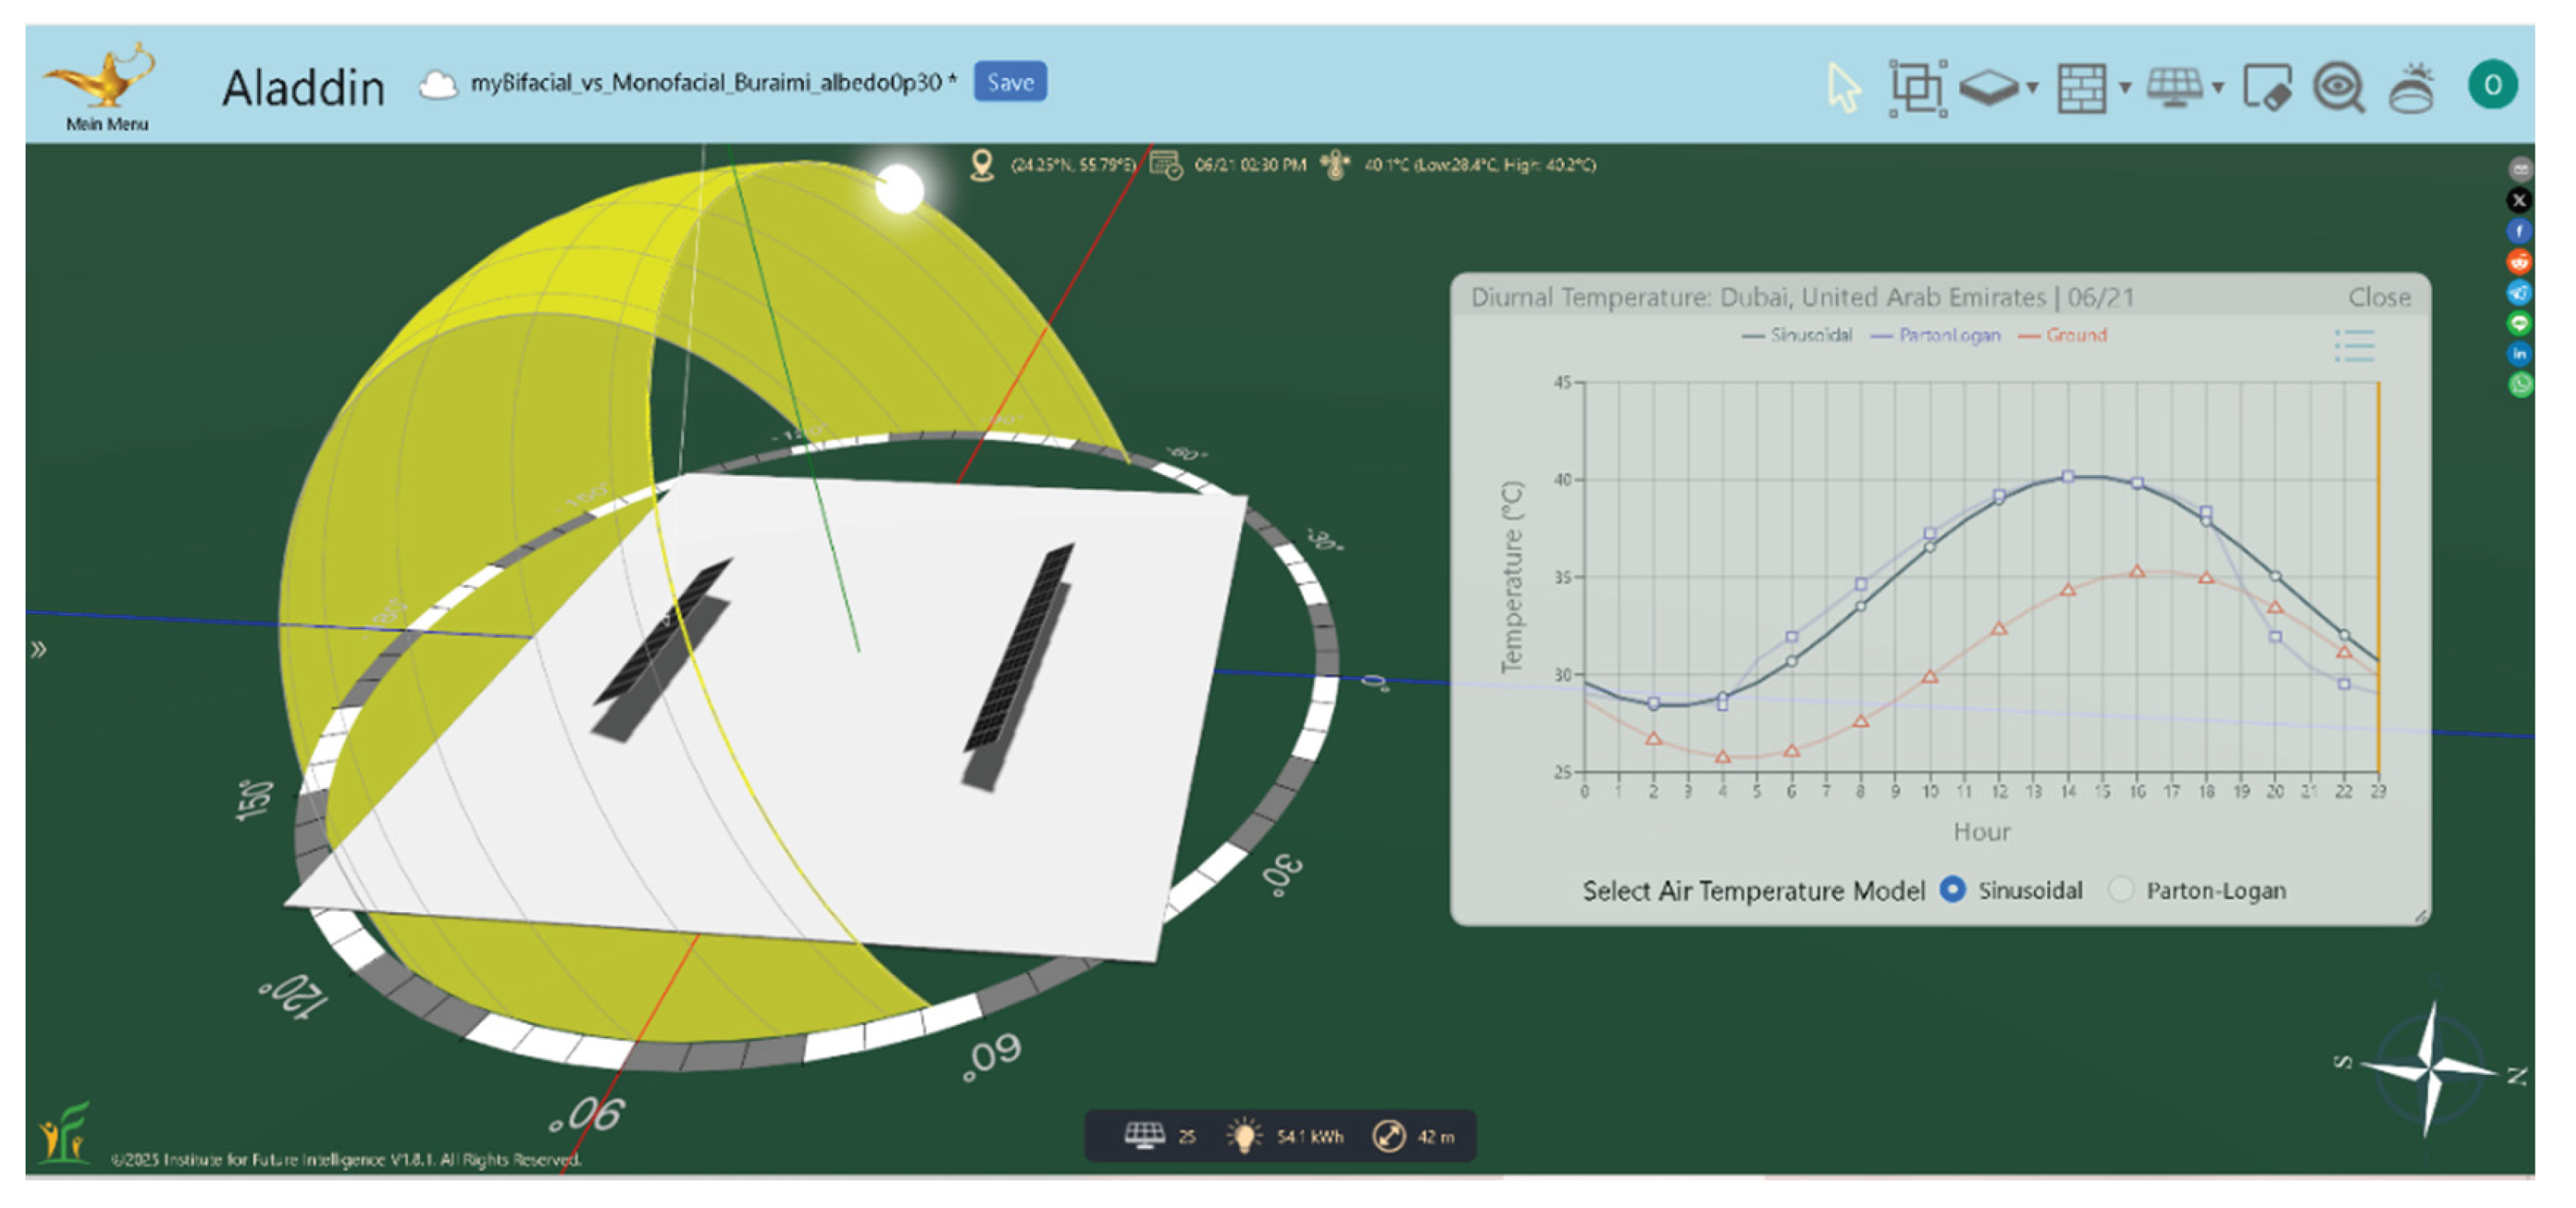
Figure 7.
Illustration of the interface of the Aladdin web-based modeling software. The heliodon is enabled. This particular view corresponds to 12 noon (solar time) on 21 June in Buraimi. The view also shows the ability to define a customized PV panel (general properties) when no model in the built-in database is suitable.

Figure 8.
Illustration of the interface of the Aladdin web-based modeling software. The heliodon is enabled. This particular view corresponds to 9:30 am (solar time) on 21 June in Buraimi. The view also shows the ability to define a customized PV panel (electrical properties) when no model in the built-in database is suitable.
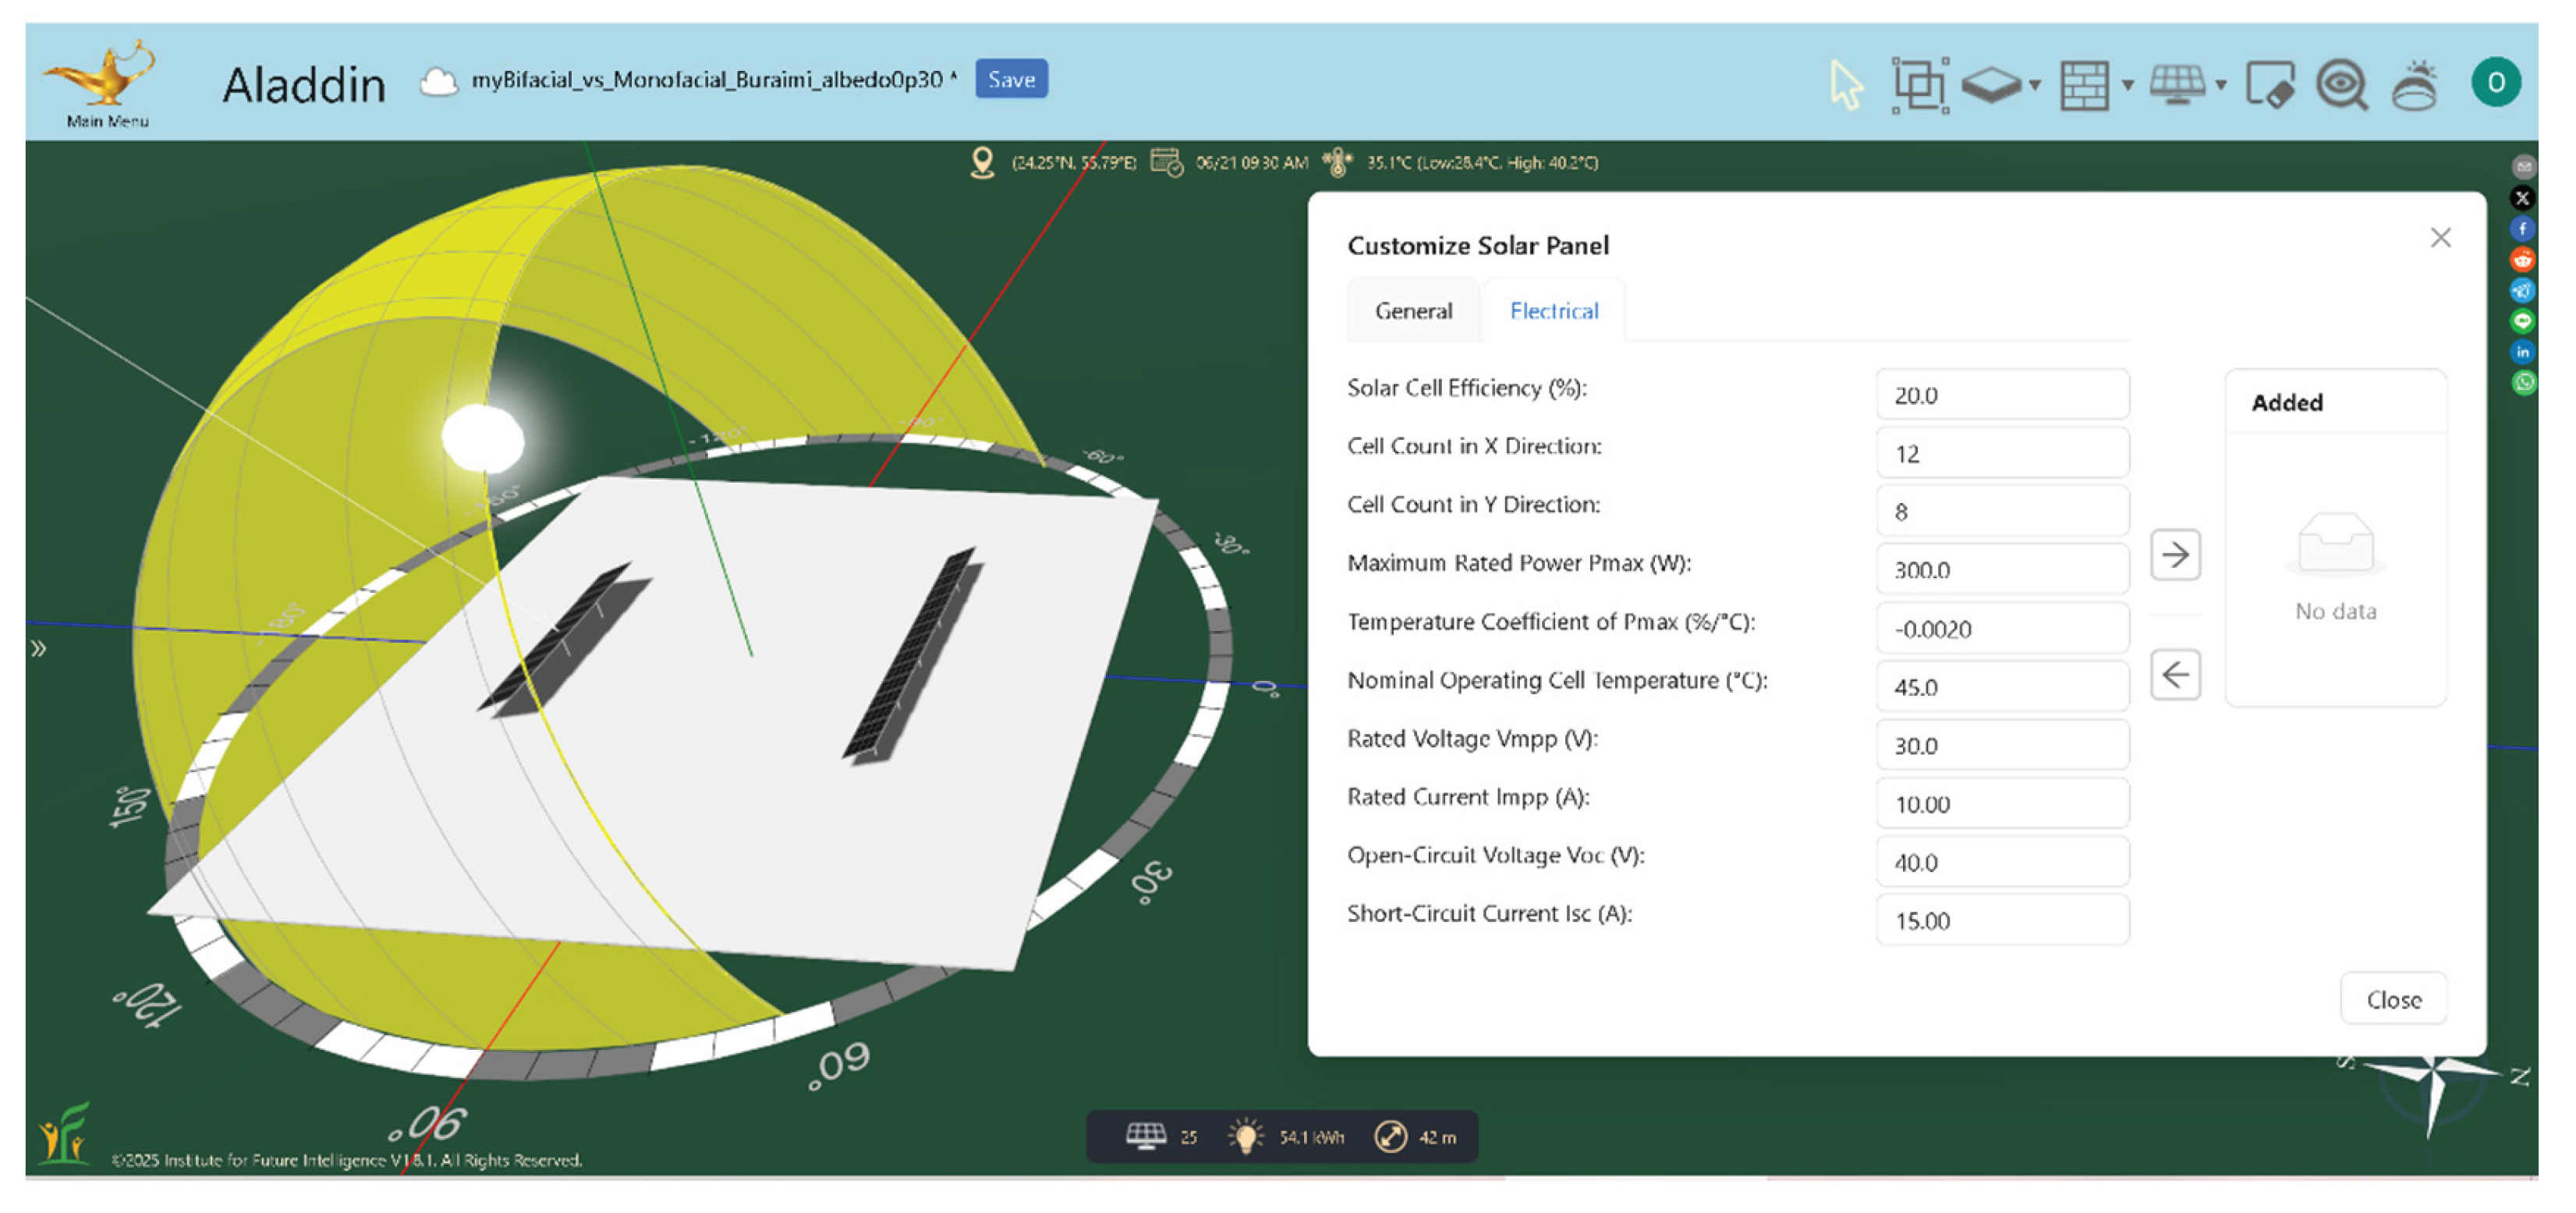
Figure 9.
Illustration of the interface of the Aladdin web-based modeling software. The heliodon is enabled. This particular view corresponds to 7:00 am (solar time) on 21 June in Buraimi. The view also shows a user-adjustable albedo value of 0.30.
Figure 9.
Illustration of the interface of the Aladdin web-based modeling software. The heliodon is enabled. This particular view corresponds to 7:00 am (solar time) on 21 June in Buraimi. The view also shows a user-adjustable albedo value of 0.30.
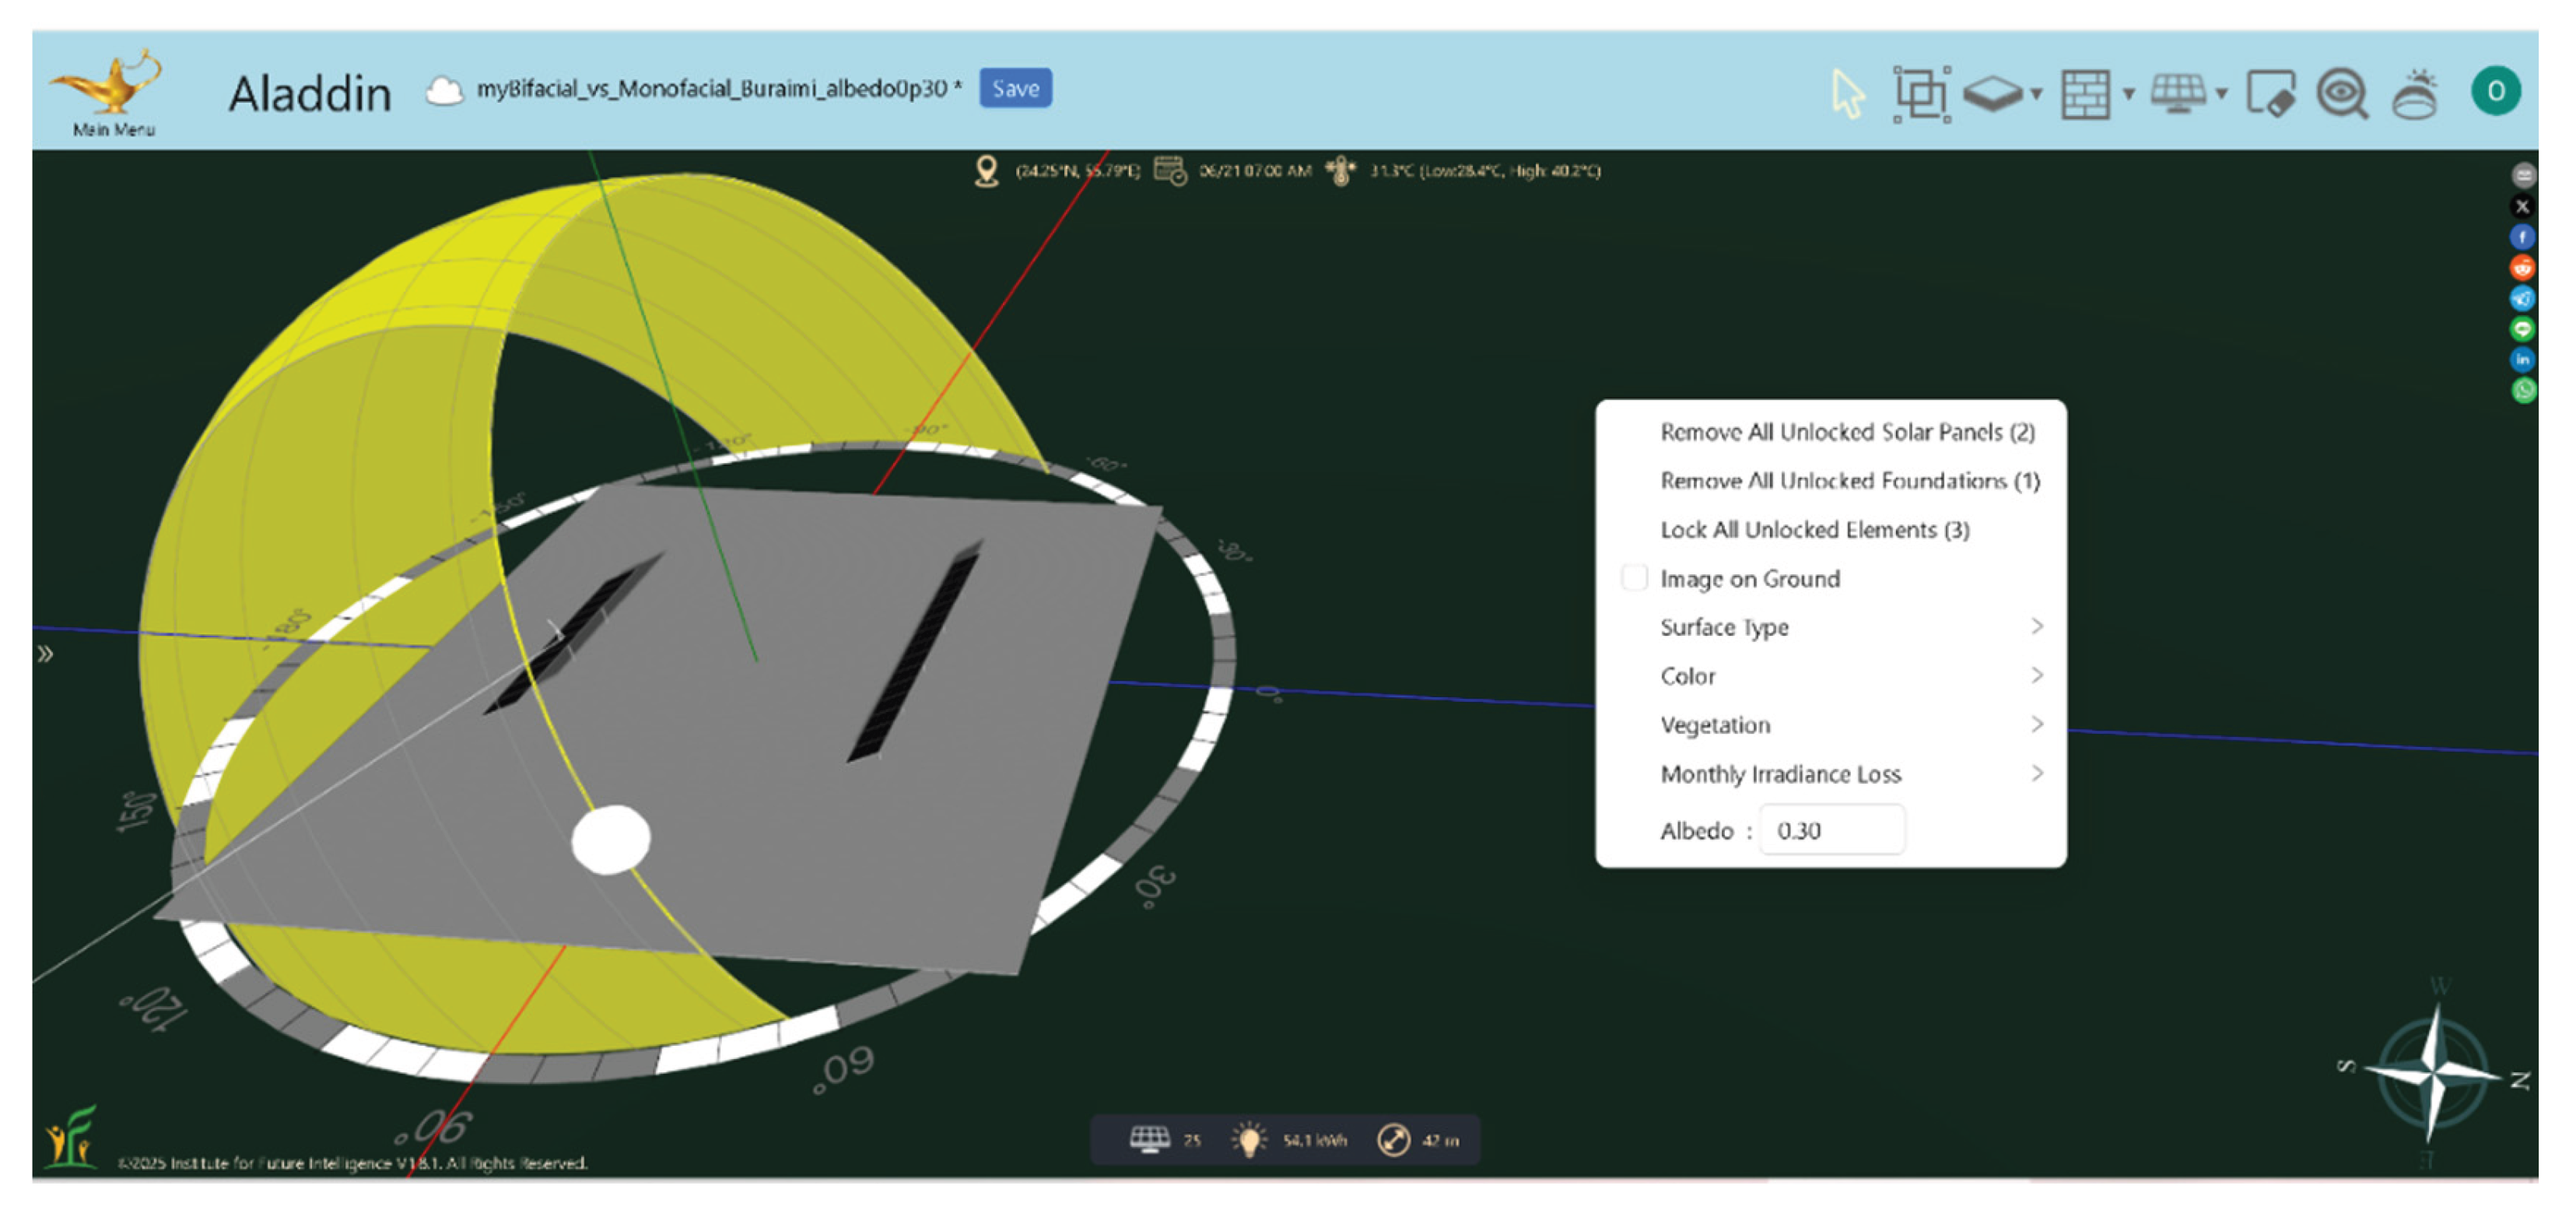
Figure 10.
Illustration of the interface of the Aladdin web-based modeling software. The heliodon is enabled. The view shows characteristics of the pre-defined monofacial PV panel (JKM300M-60) by the manufacturer Jinko Solar.
Figure 10.
Illustration of the interface of the Aladdin web-based modeling software. The heliodon is enabled. The view shows characteristics of the pre-defined monofacial PV panel (JKM300M-60) by the manufacturer Jinko Solar.
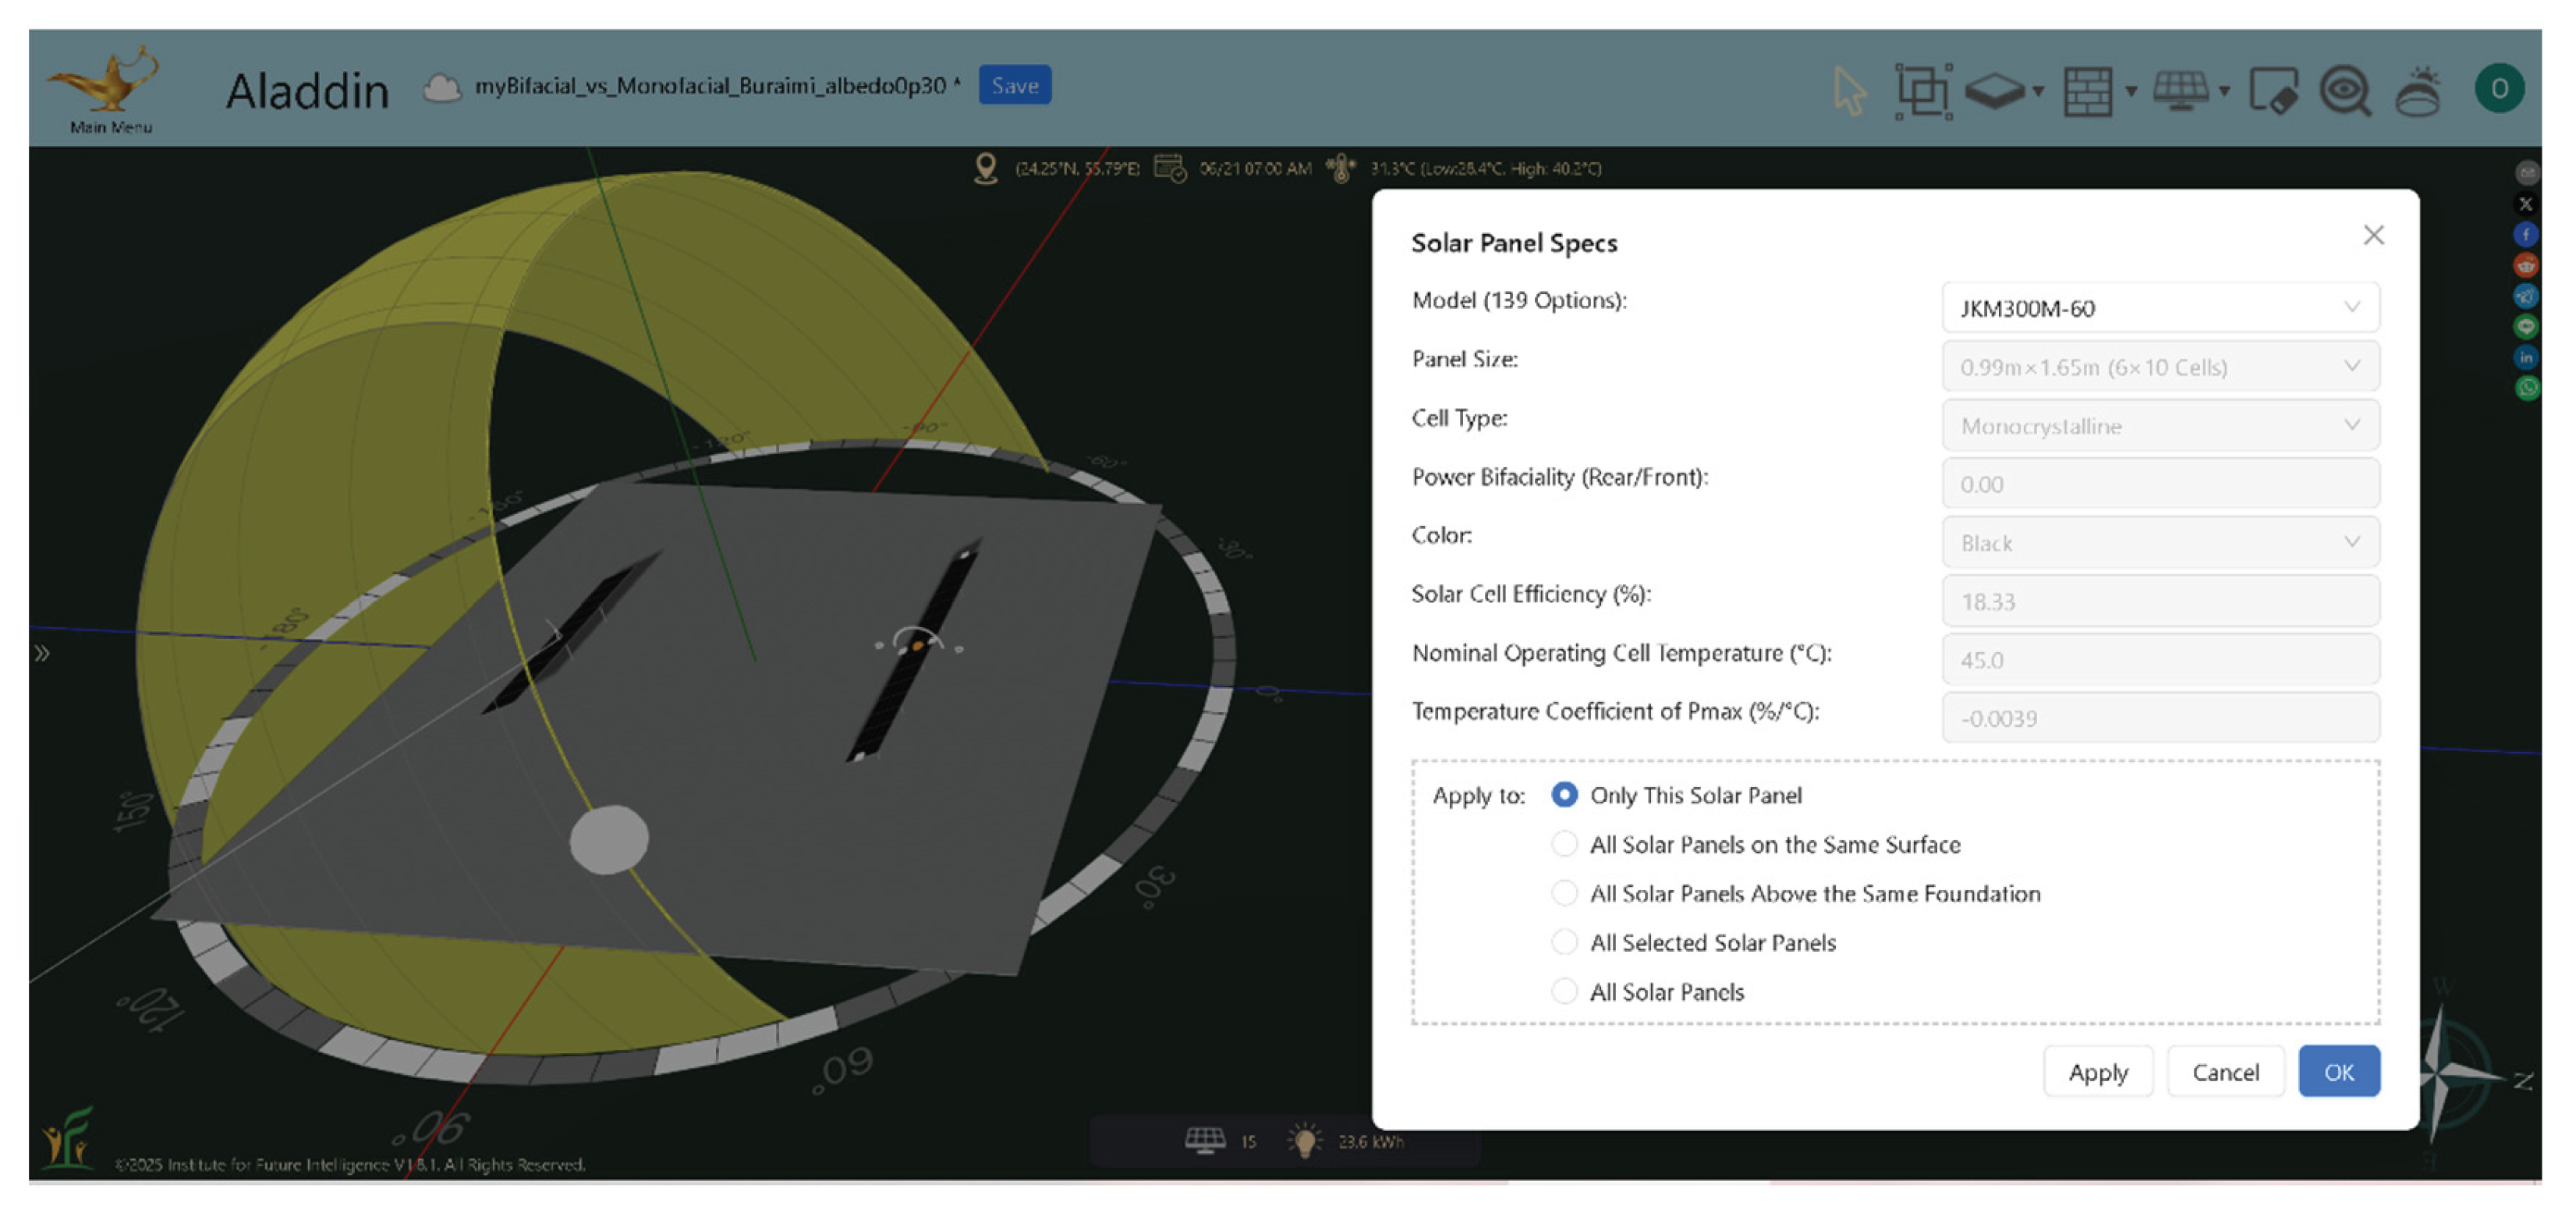
Figure 11.
Illustration of the interface of the Aladdin web-based modeling software. The heliodon is enabled. This particular view corresponds to 3 pm (solar time) on 21 December in Salalah. The view also shows the modeled hourly (per hour, during the day) variation in air temperature and ground temperature.
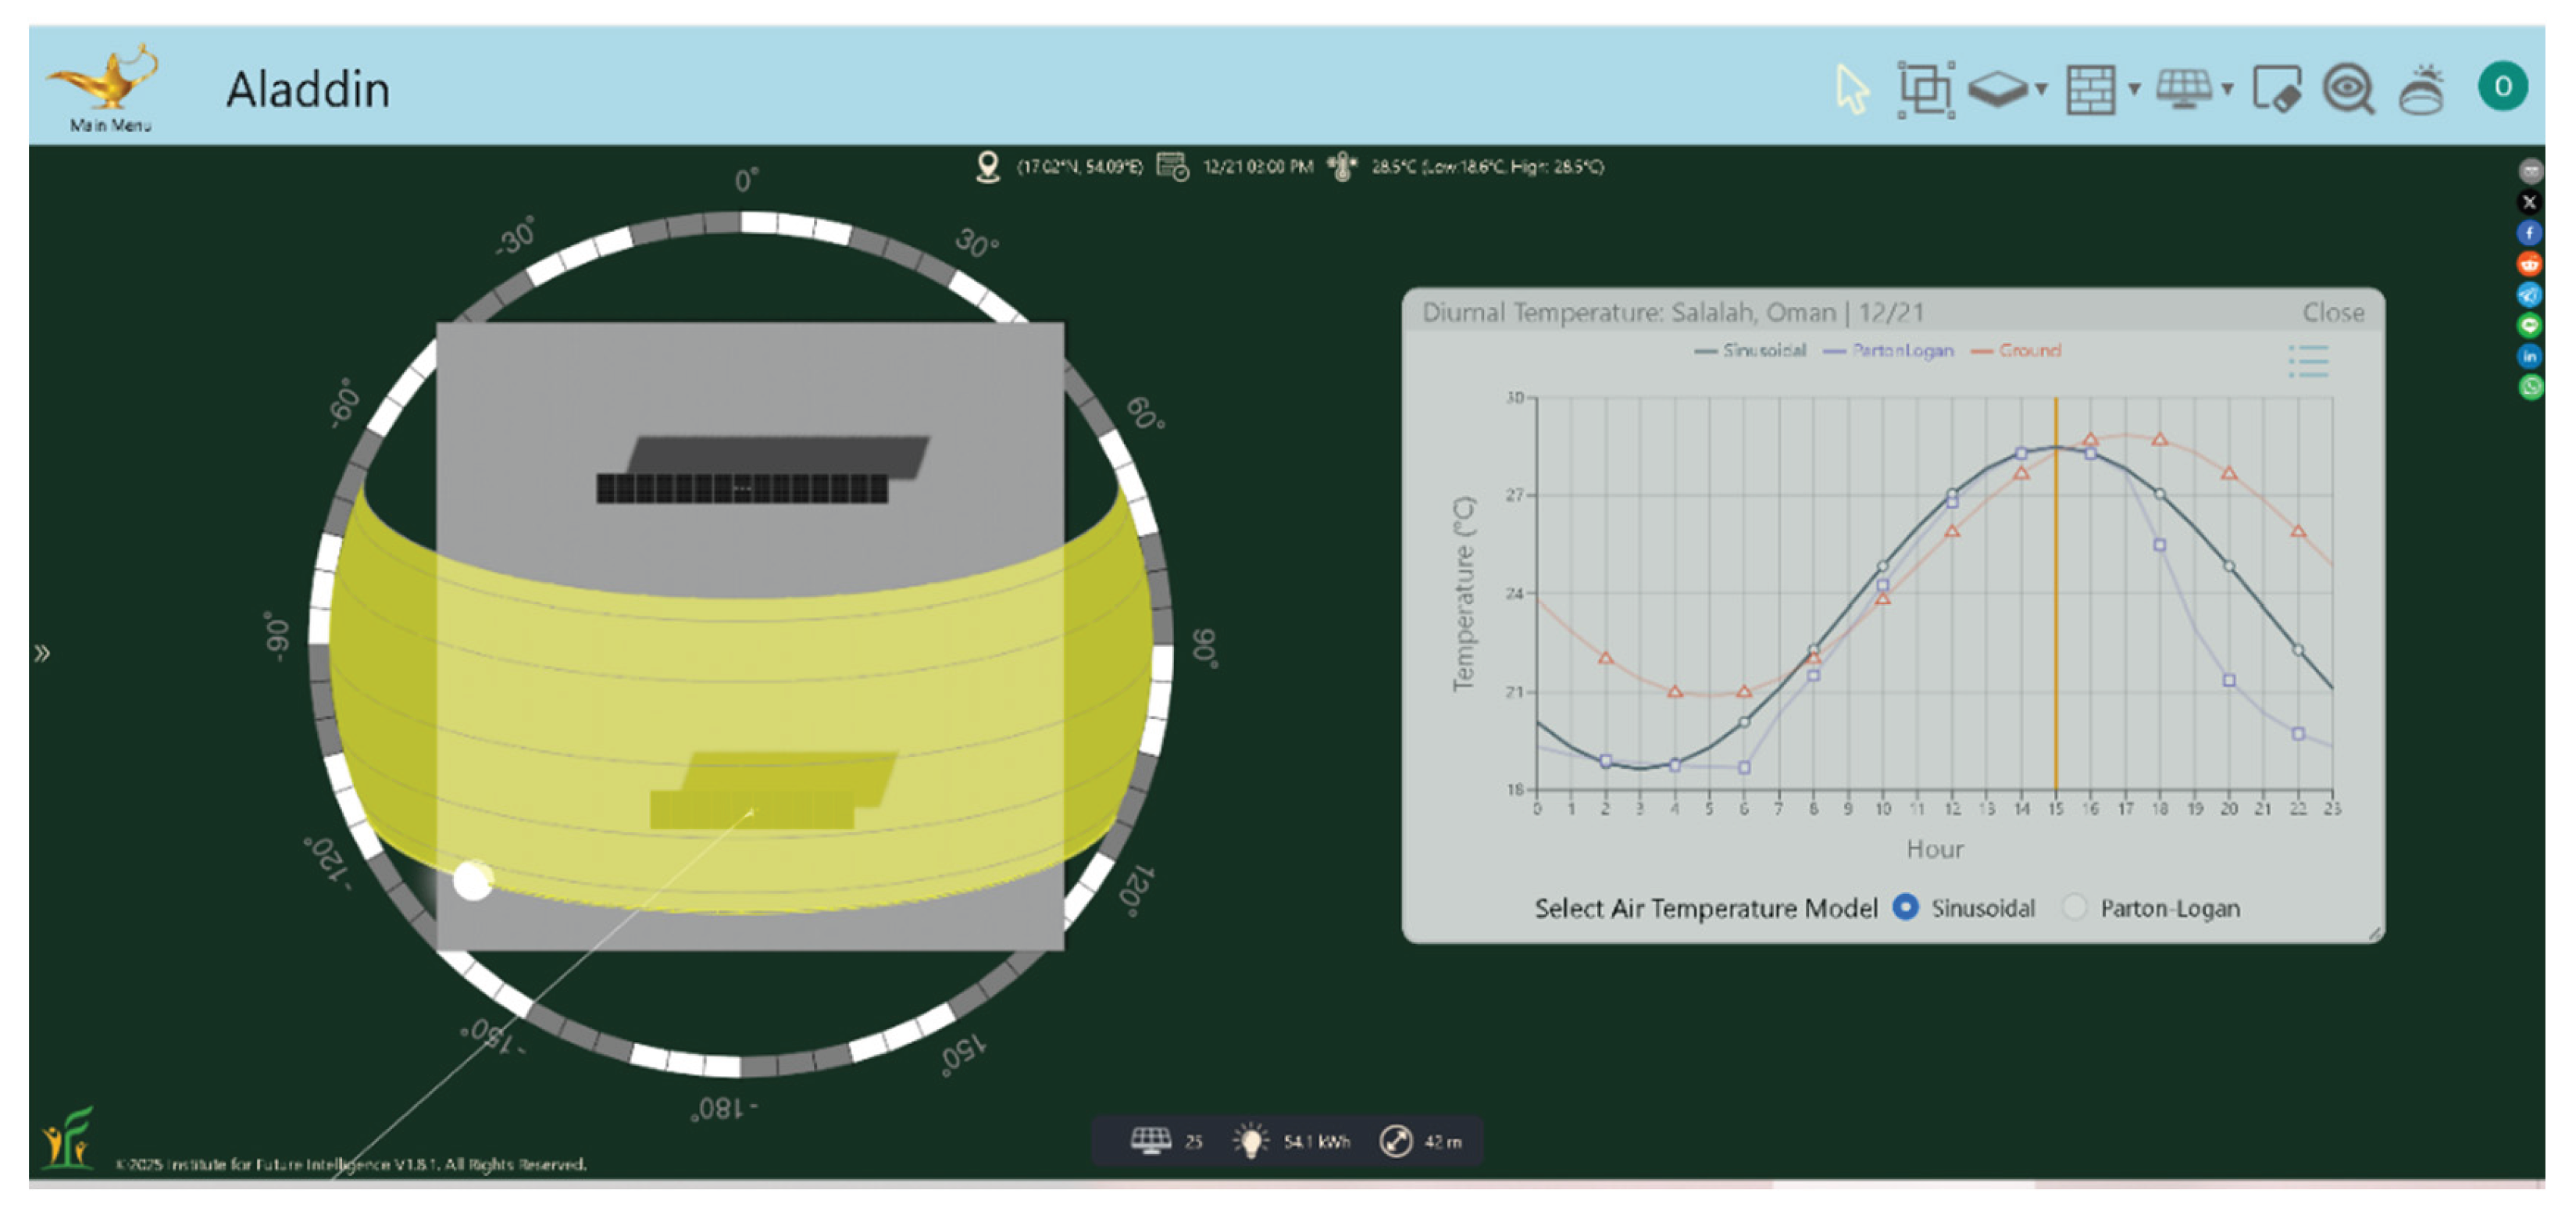
Figure 12.
Illustration of the interface of the Aladdin web-based modeling software. The heliodon is enabled. This particular view corresponds to 3 pm (solar time) on 21 Jun in Salalah. The view also shows the modeled hourly (per hour, during the day) variation in air temperature and ground temperature.
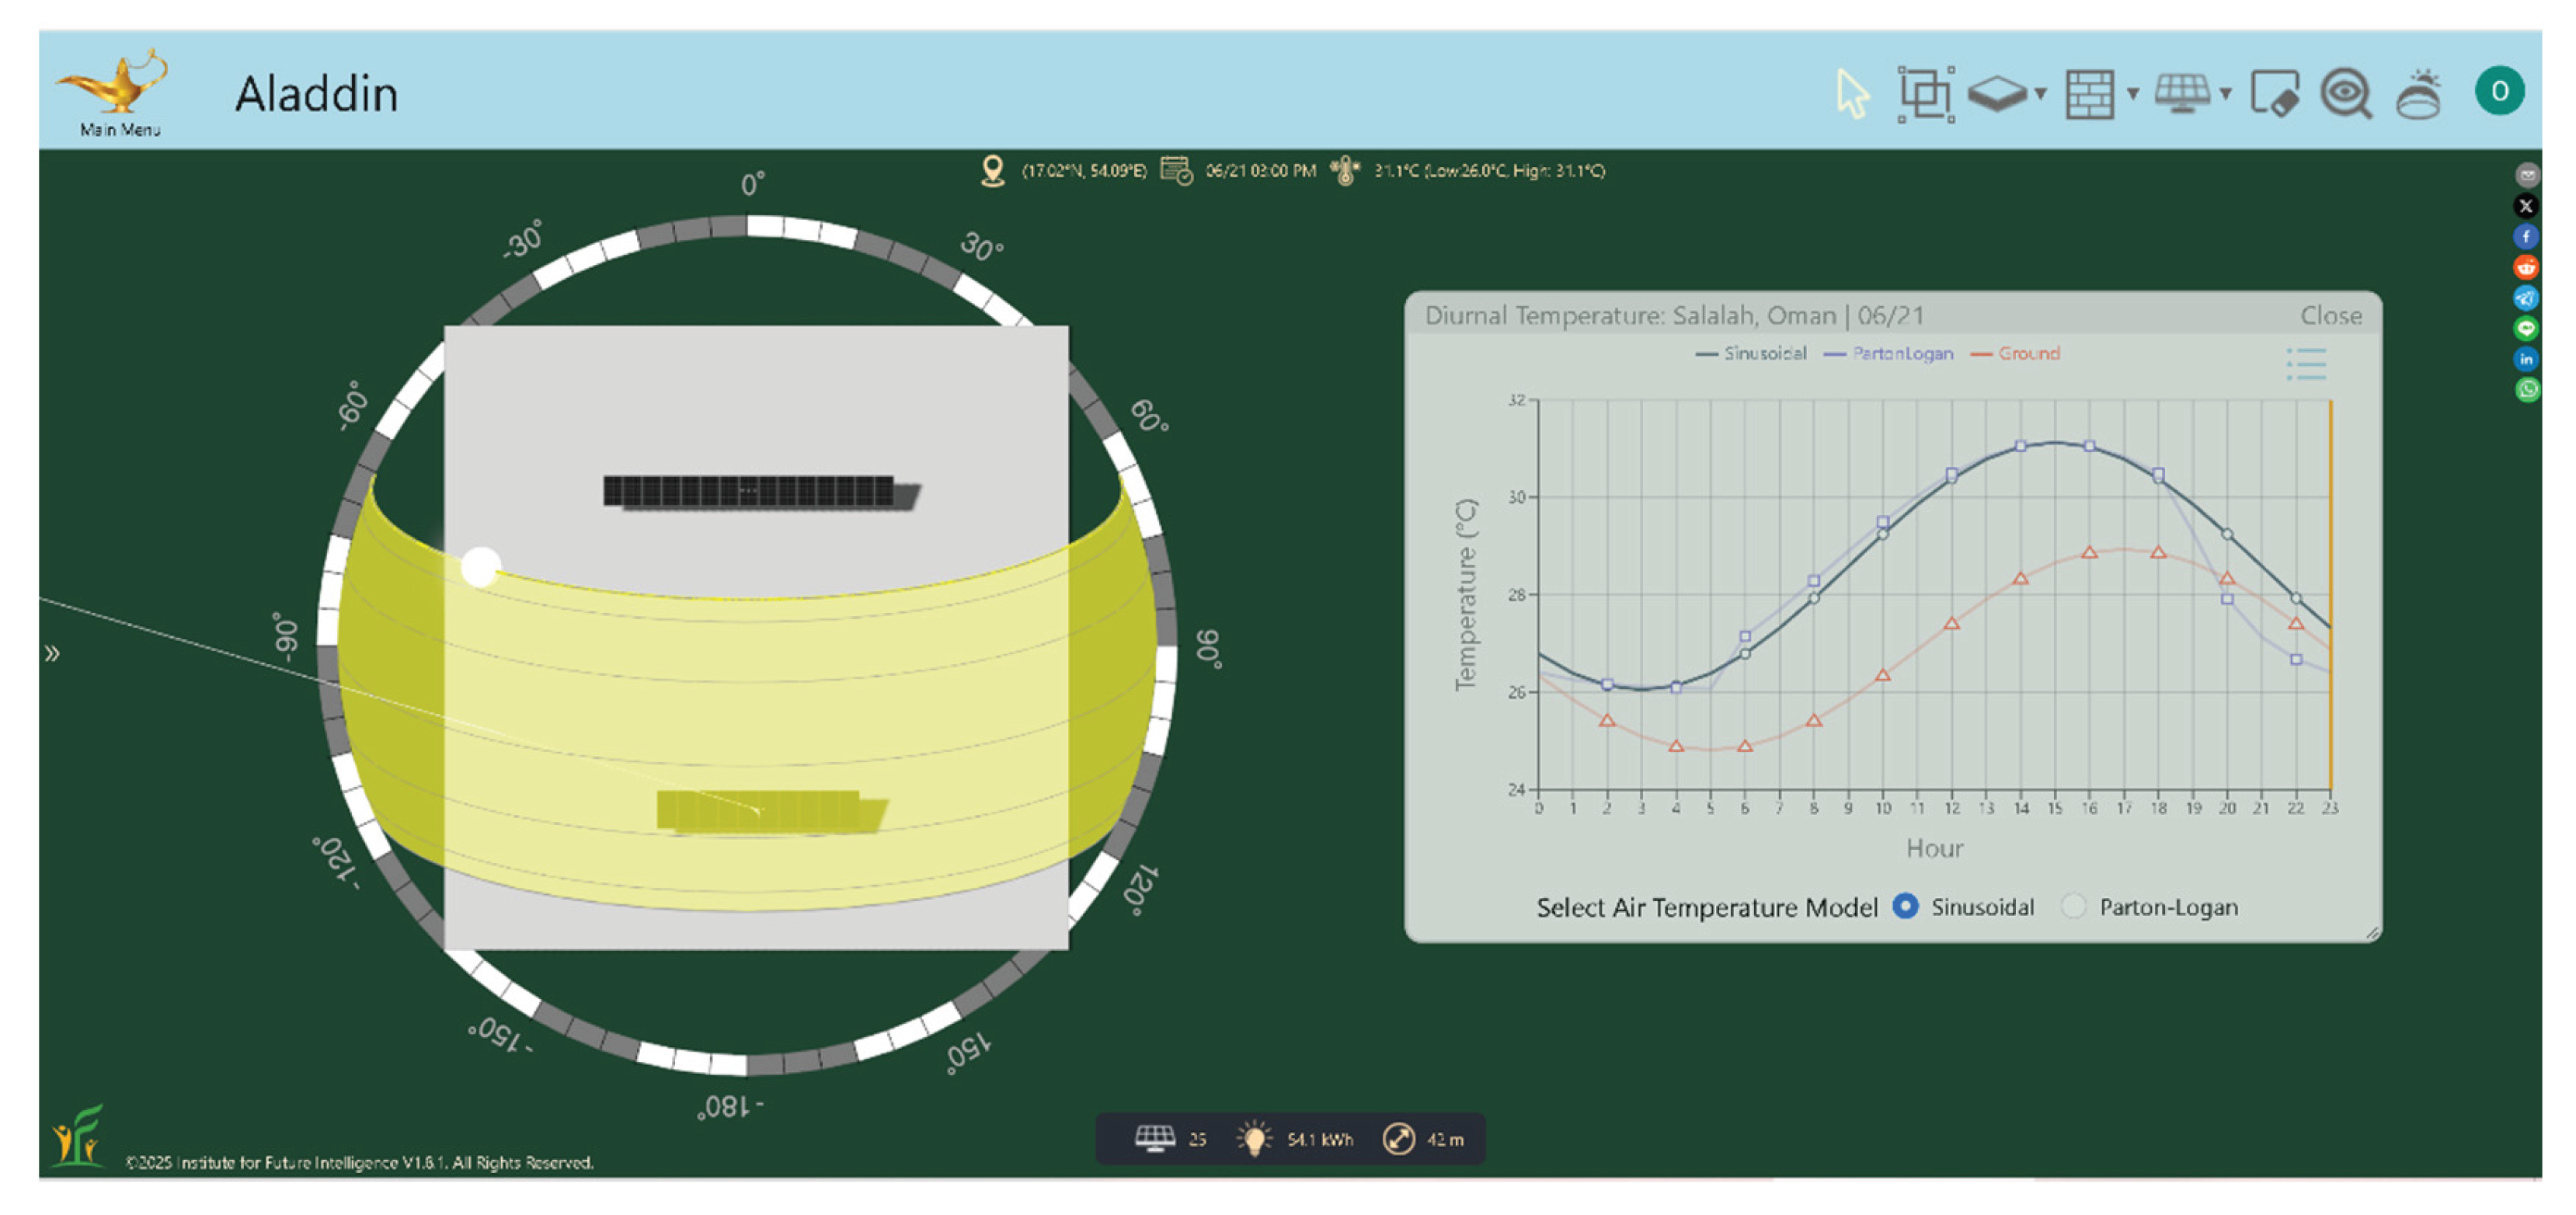
Figure 13.
Illustration of the interface of the Aladdin web-based modeling software. The heliodon is enabled. This particular view corresponds to 12 noon (solar time) on 21 Jun in Salalah. The view also shows a user-adjustable albedo value of 0.65.
Figure 13.
Illustration of the interface of the Aladdin web-based modeling software. The heliodon is enabled. This particular view corresponds to 12 noon (solar time) on 21 Jun in Salalah. The view also shows a user-adjustable albedo value of 0.65.

Figure 14.
Illustration of the interface of the Aladdin web-based modeling software. The heliodon is enabled. This particular view corresponds to 12 noon (solar time) on 21 Jun in Salalah. The view also shows the hourly (per hour, during the day) profile of the electricity generation from two 4.5 kWp systems, one of which is monofacial while the other is bifacial.
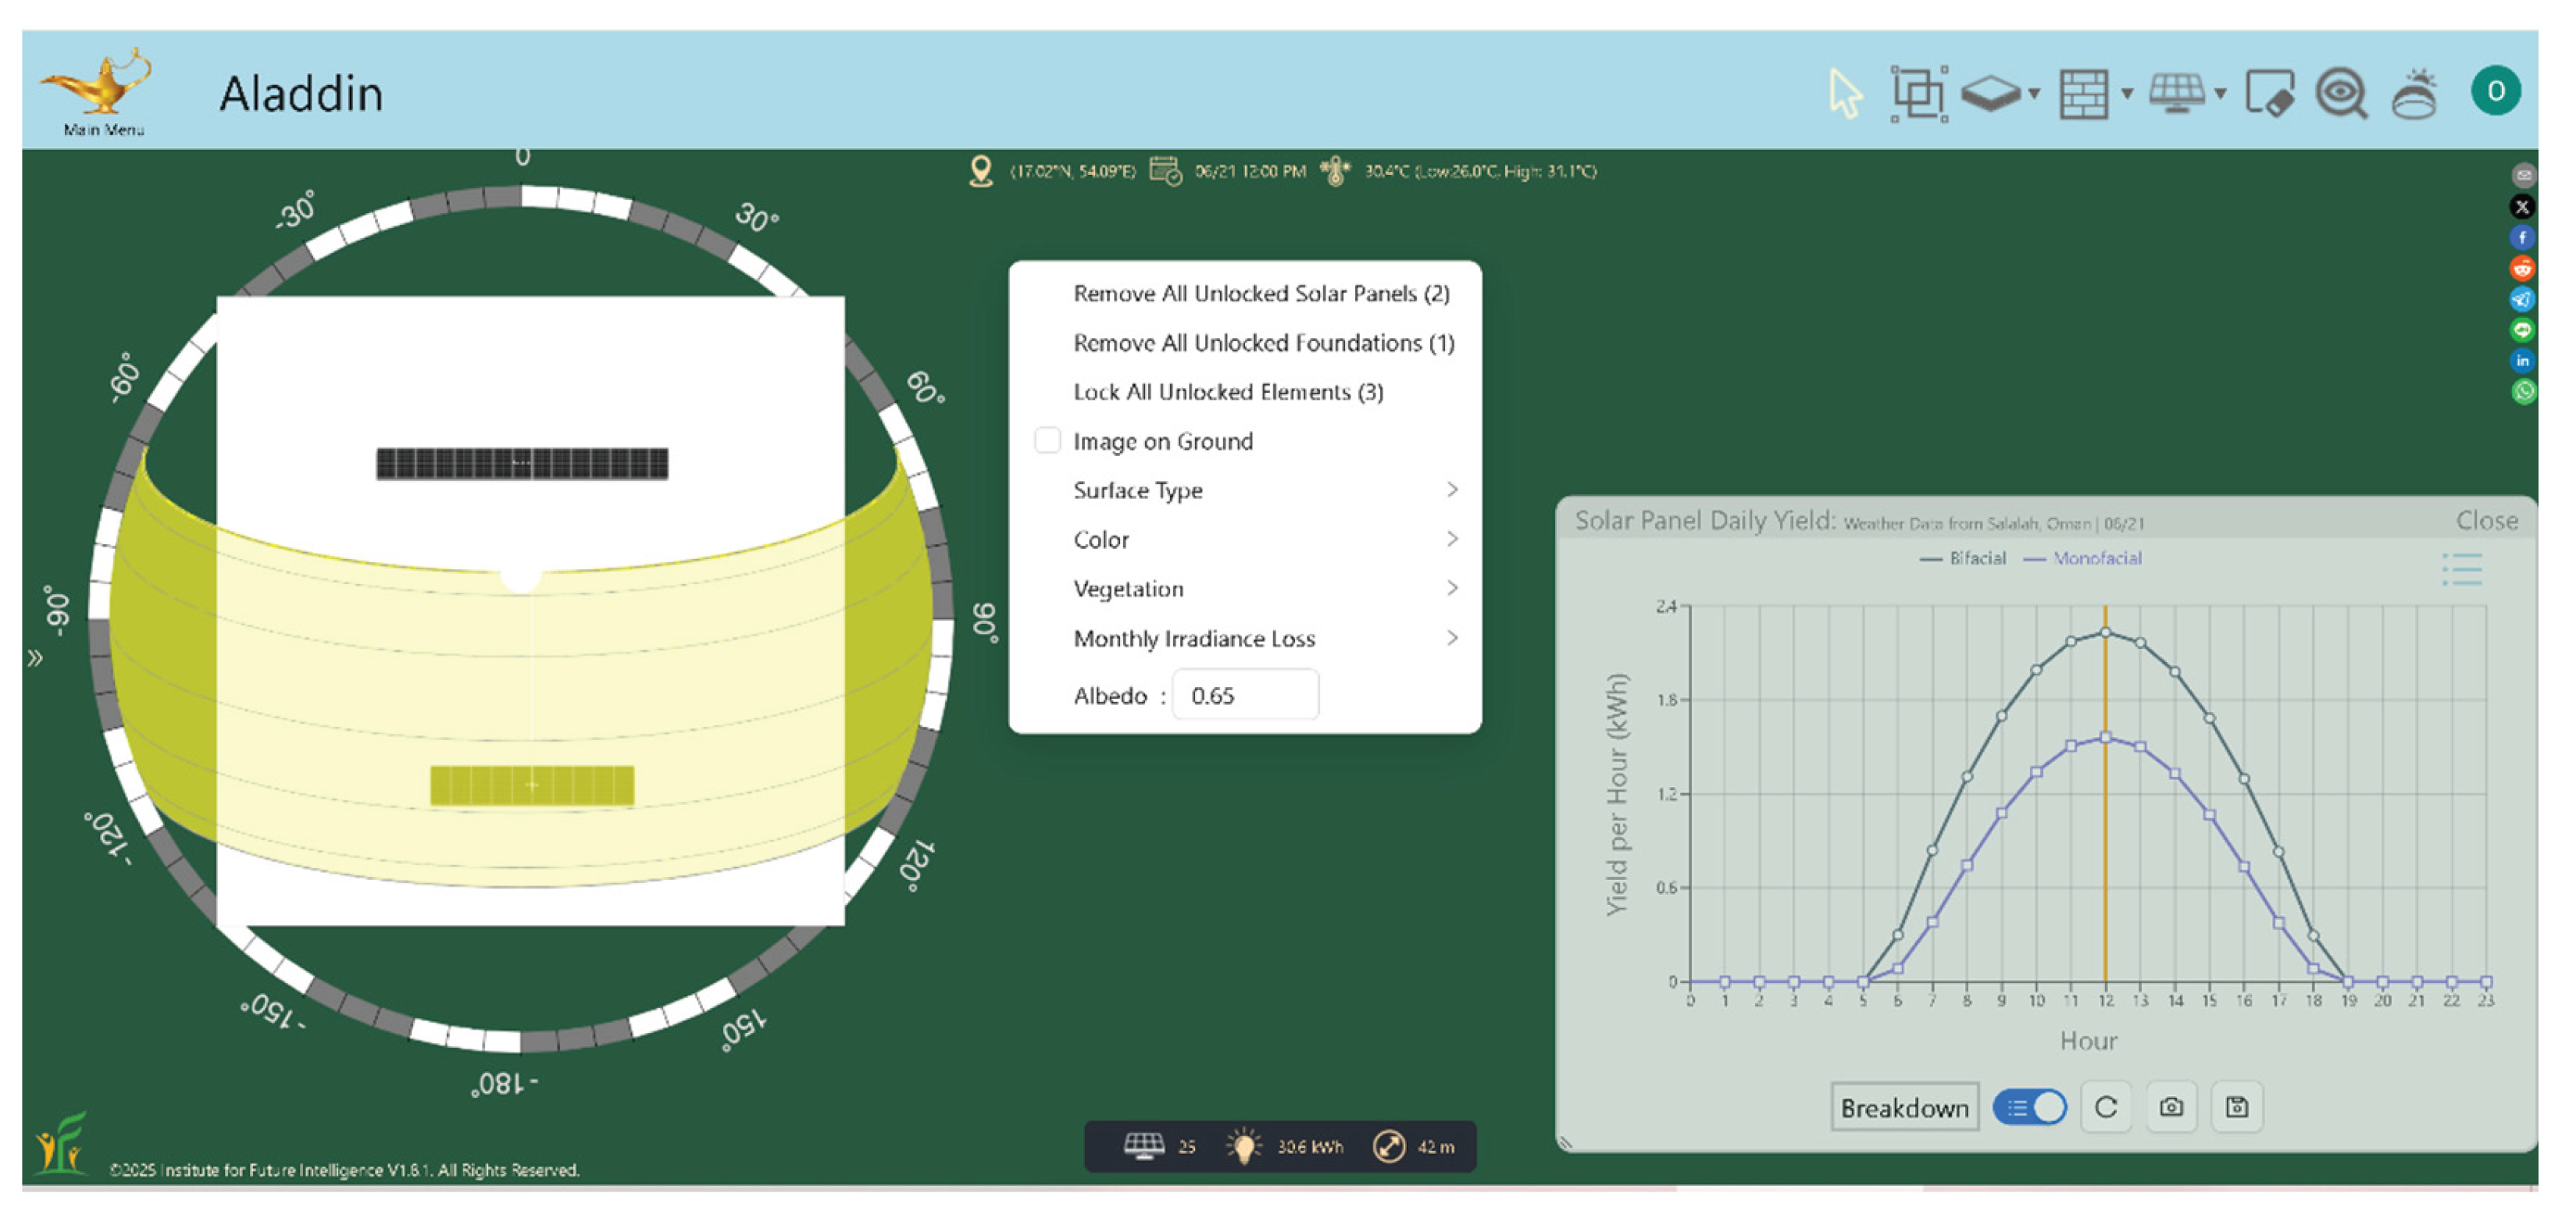
Figure 15.
Illustration of the interface of the Aladdin web-based modeling software. The heliodon is enabled. This particular view corresponds to 12 noon (solar time) on 21 Jun in Salalah. The view also shows the hourly (per hour, during the day) profile of the electricity generation from two 4.5 kWp systems, one of which is monofacial while the other is bifacial. The ground albedo is 0.65 (high).
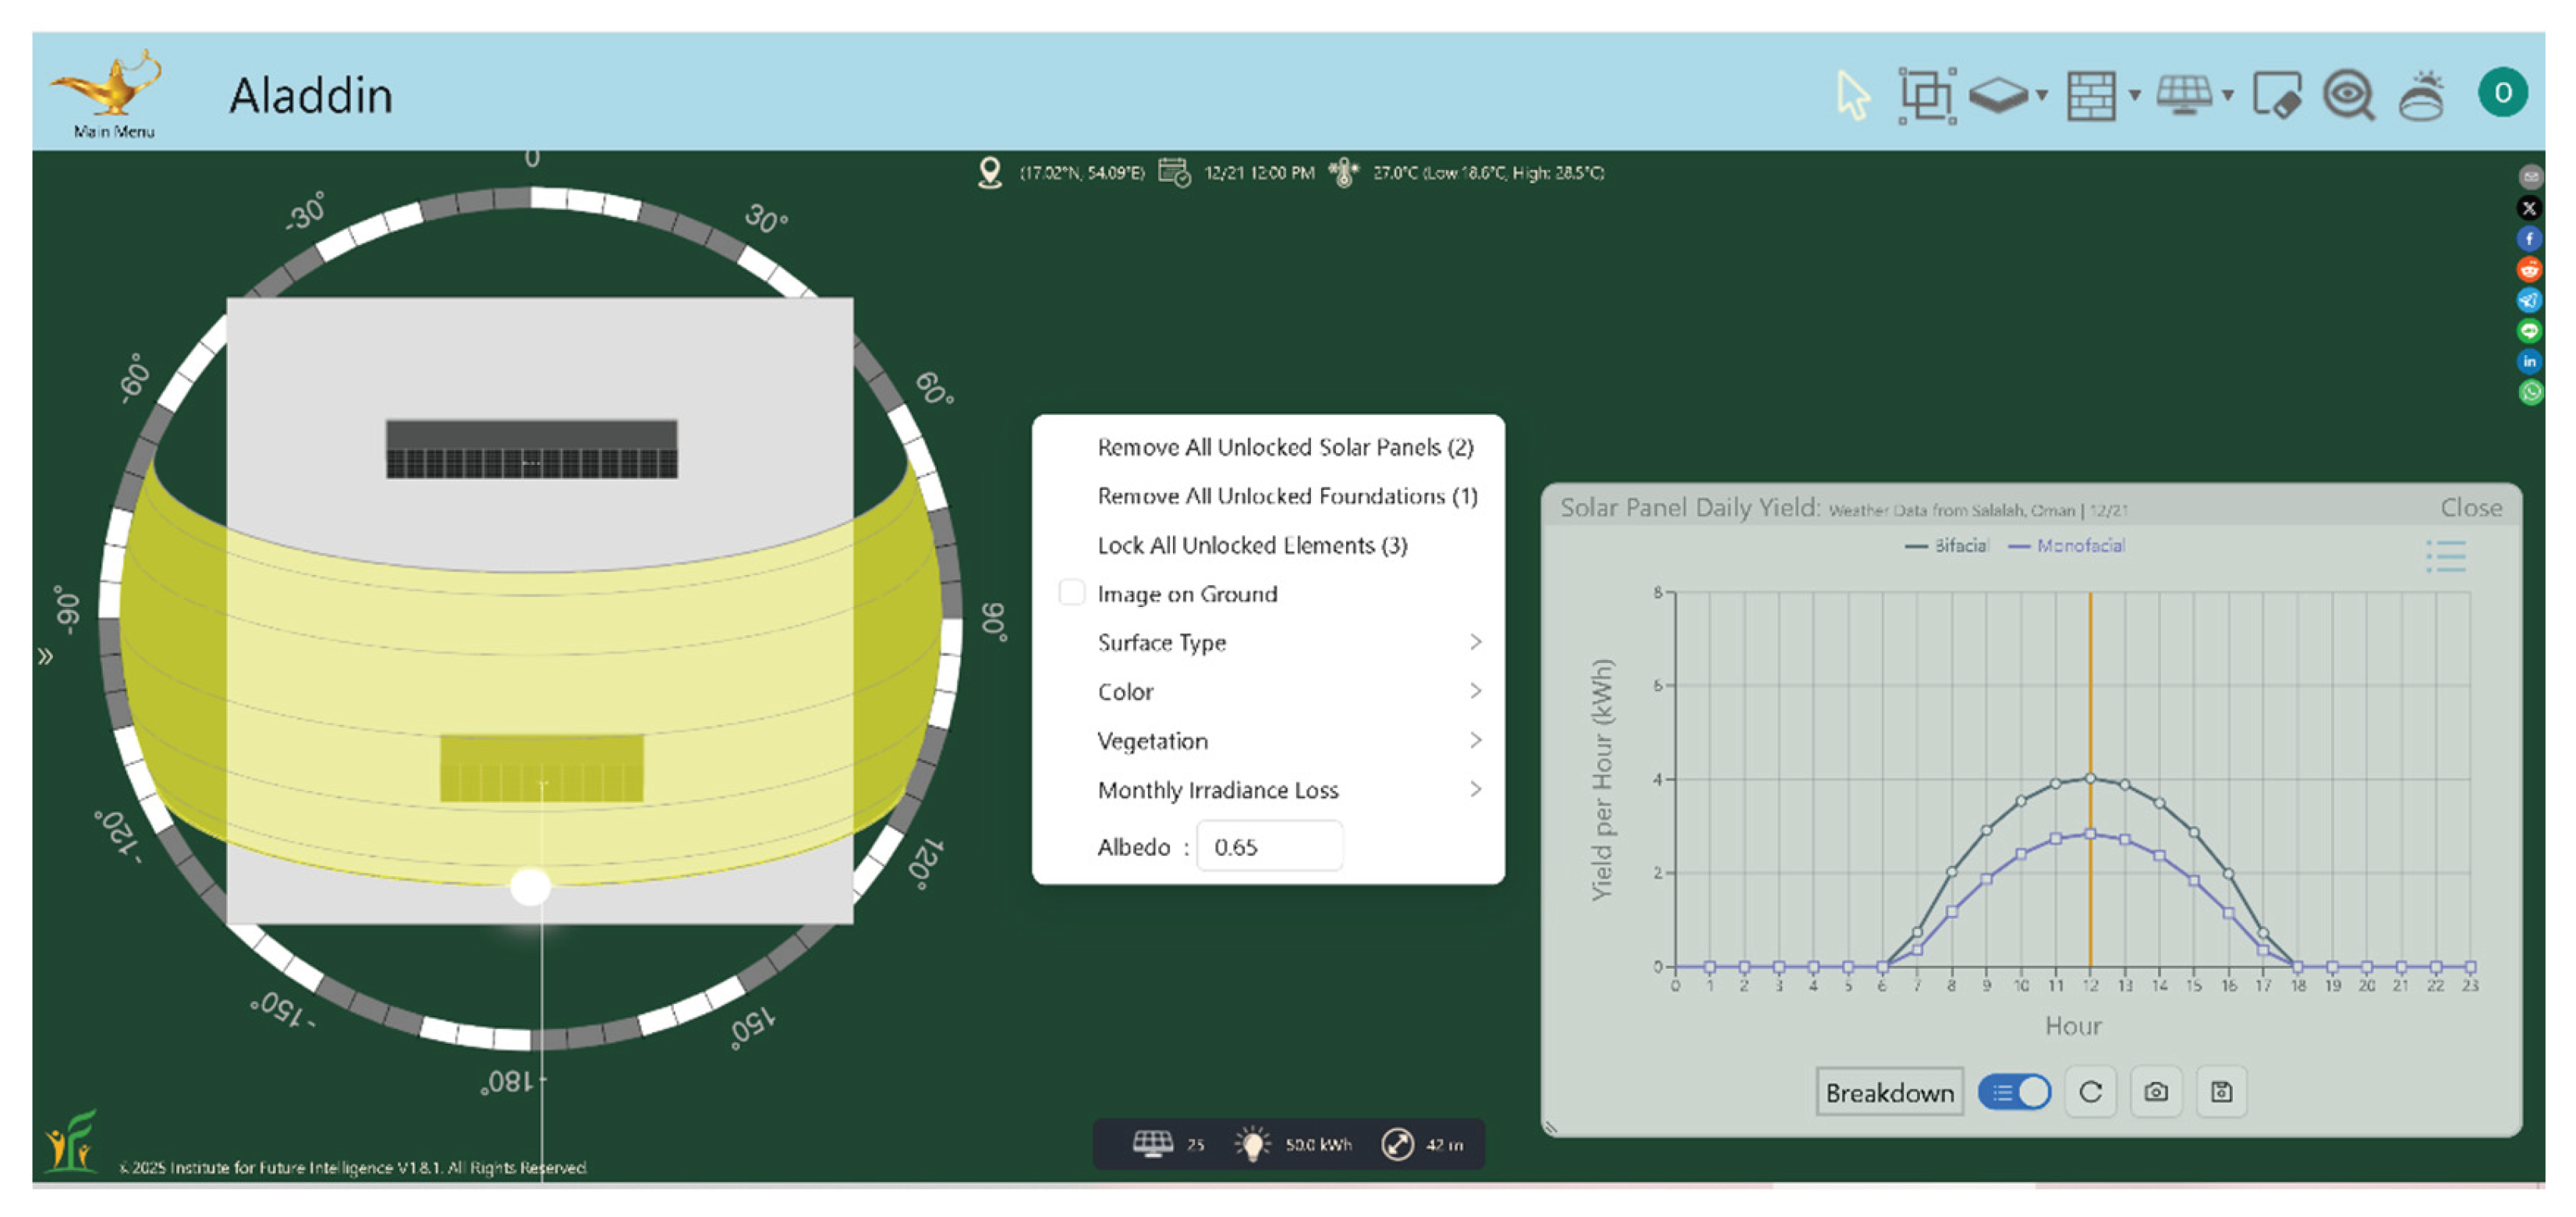
Figure 16.
Illustration of the interface of the Aladdin web-based modeling software. The heliodon is enabled. This particular view corresponds to 12 noon (solar time) on 21 Jun in Salalah. The view also shows the hourly (per hour, during the day) profile of the electricity generation from two 4.5 kWp systems, one of which is monofacial while the other is bifacial. The ground albedo is 0.30 (low).
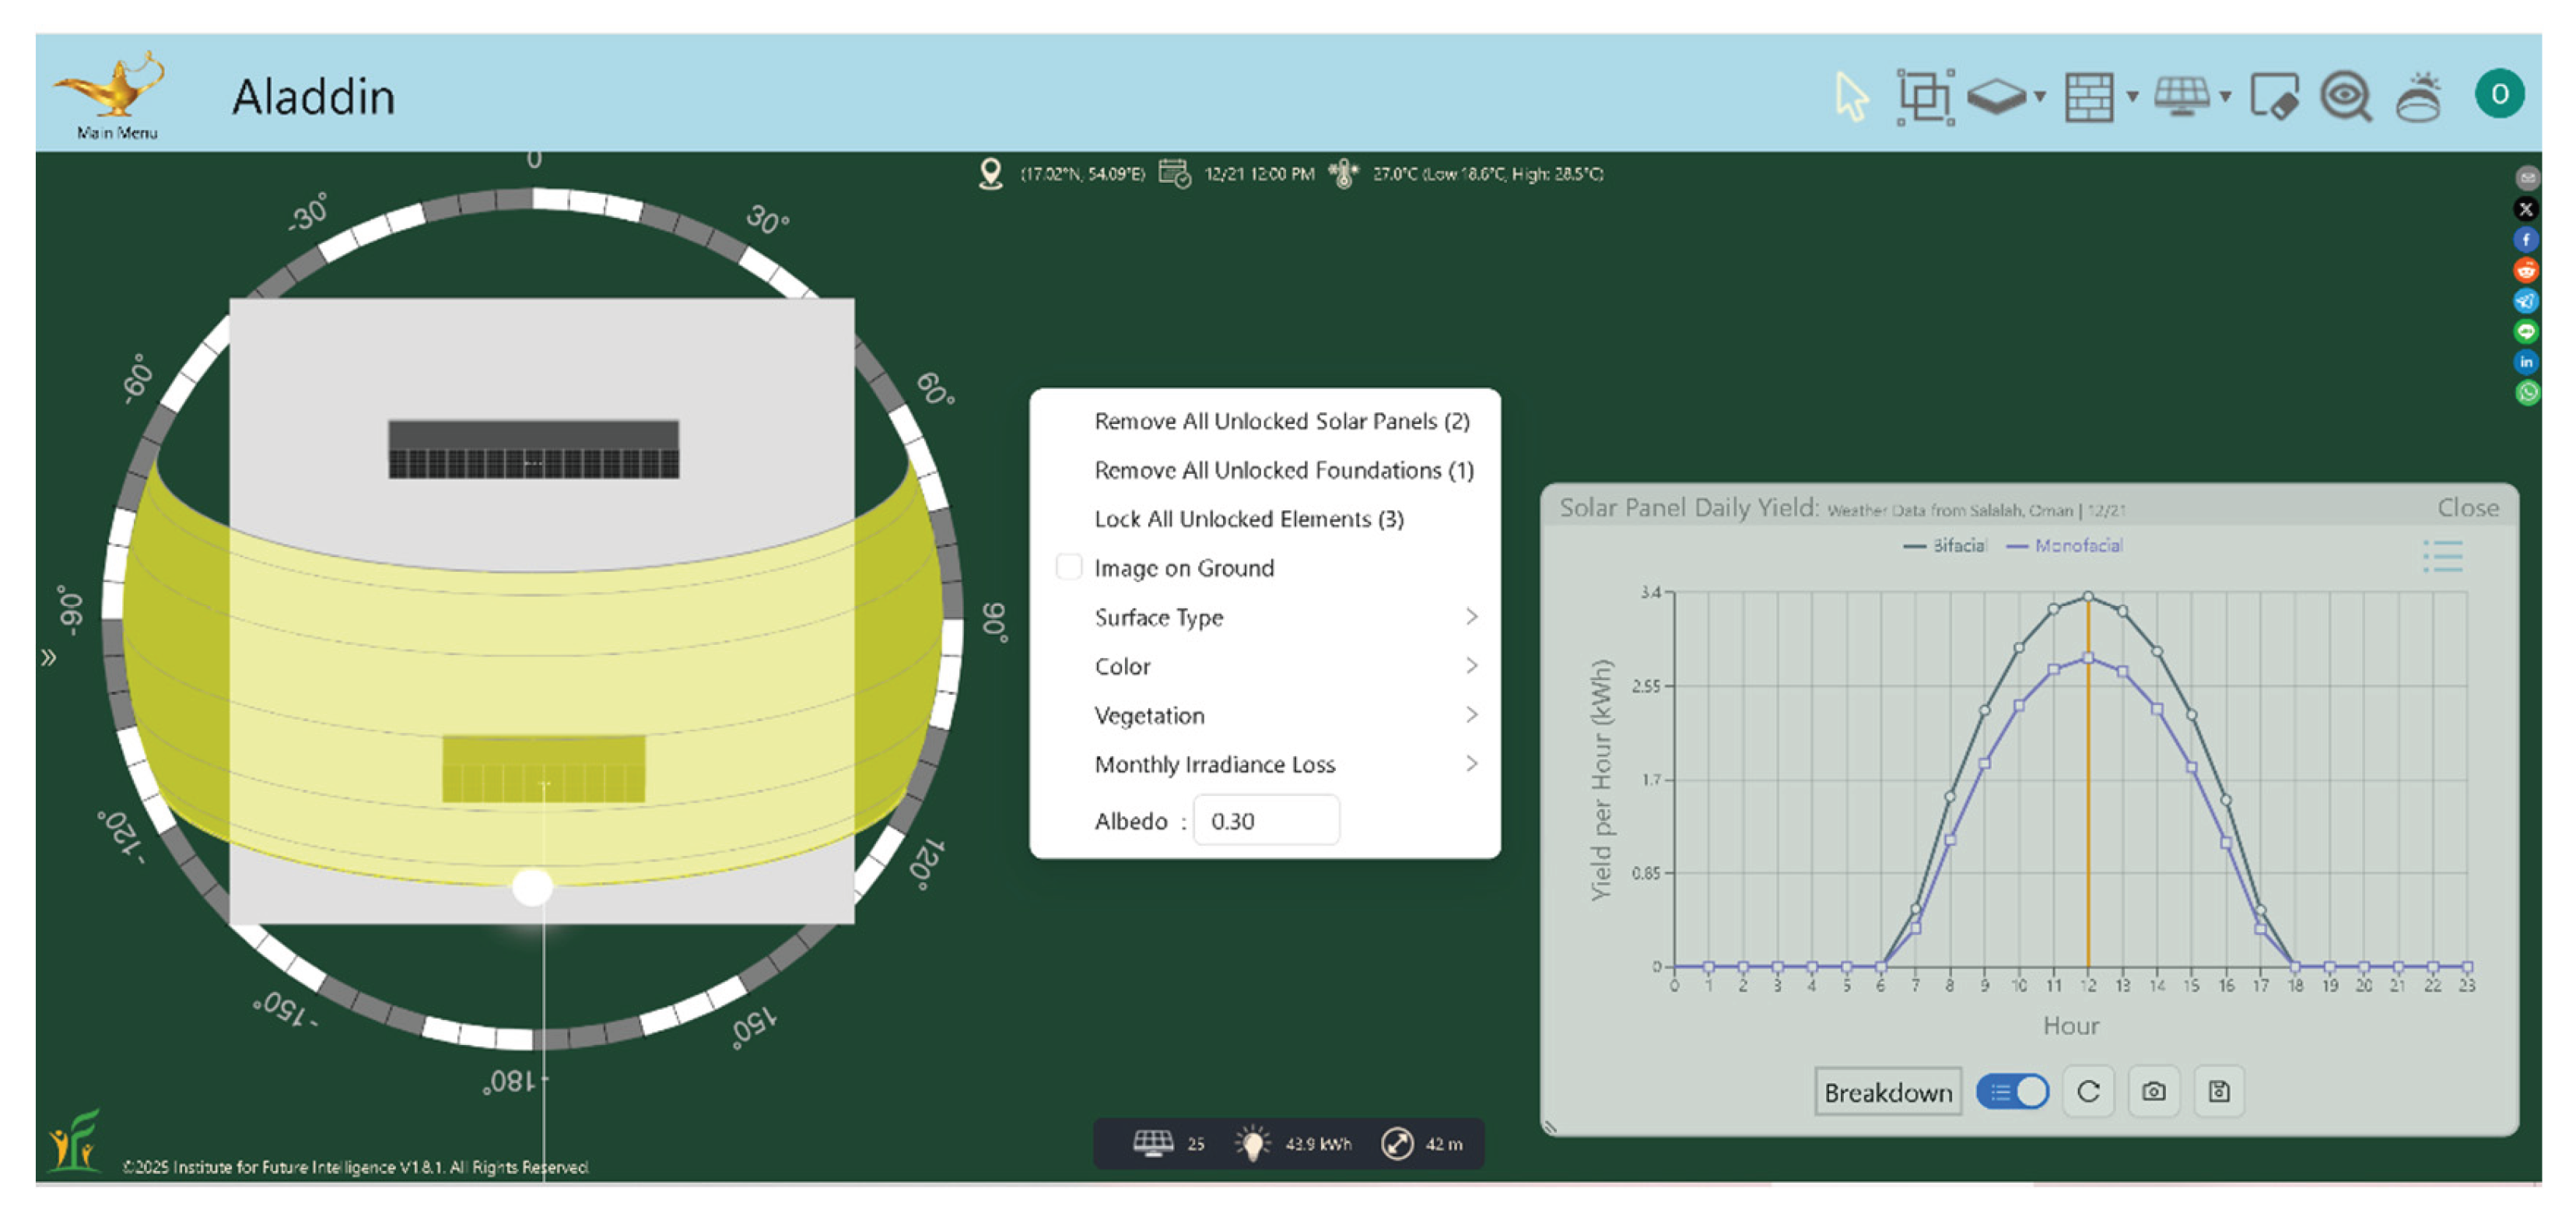
Figure 20.
Monofacial benchmarking results in terms of the monthly specific yield of electric energy (kWh/kWp/month). This benchmarking corresponds to Muscat in Oman.
Figure 20.
Monofacial benchmarking results in terms of the monthly specific yield of electric energy (kWh/kWp/month). This benchmarking corresponds to Muscat in Oman.
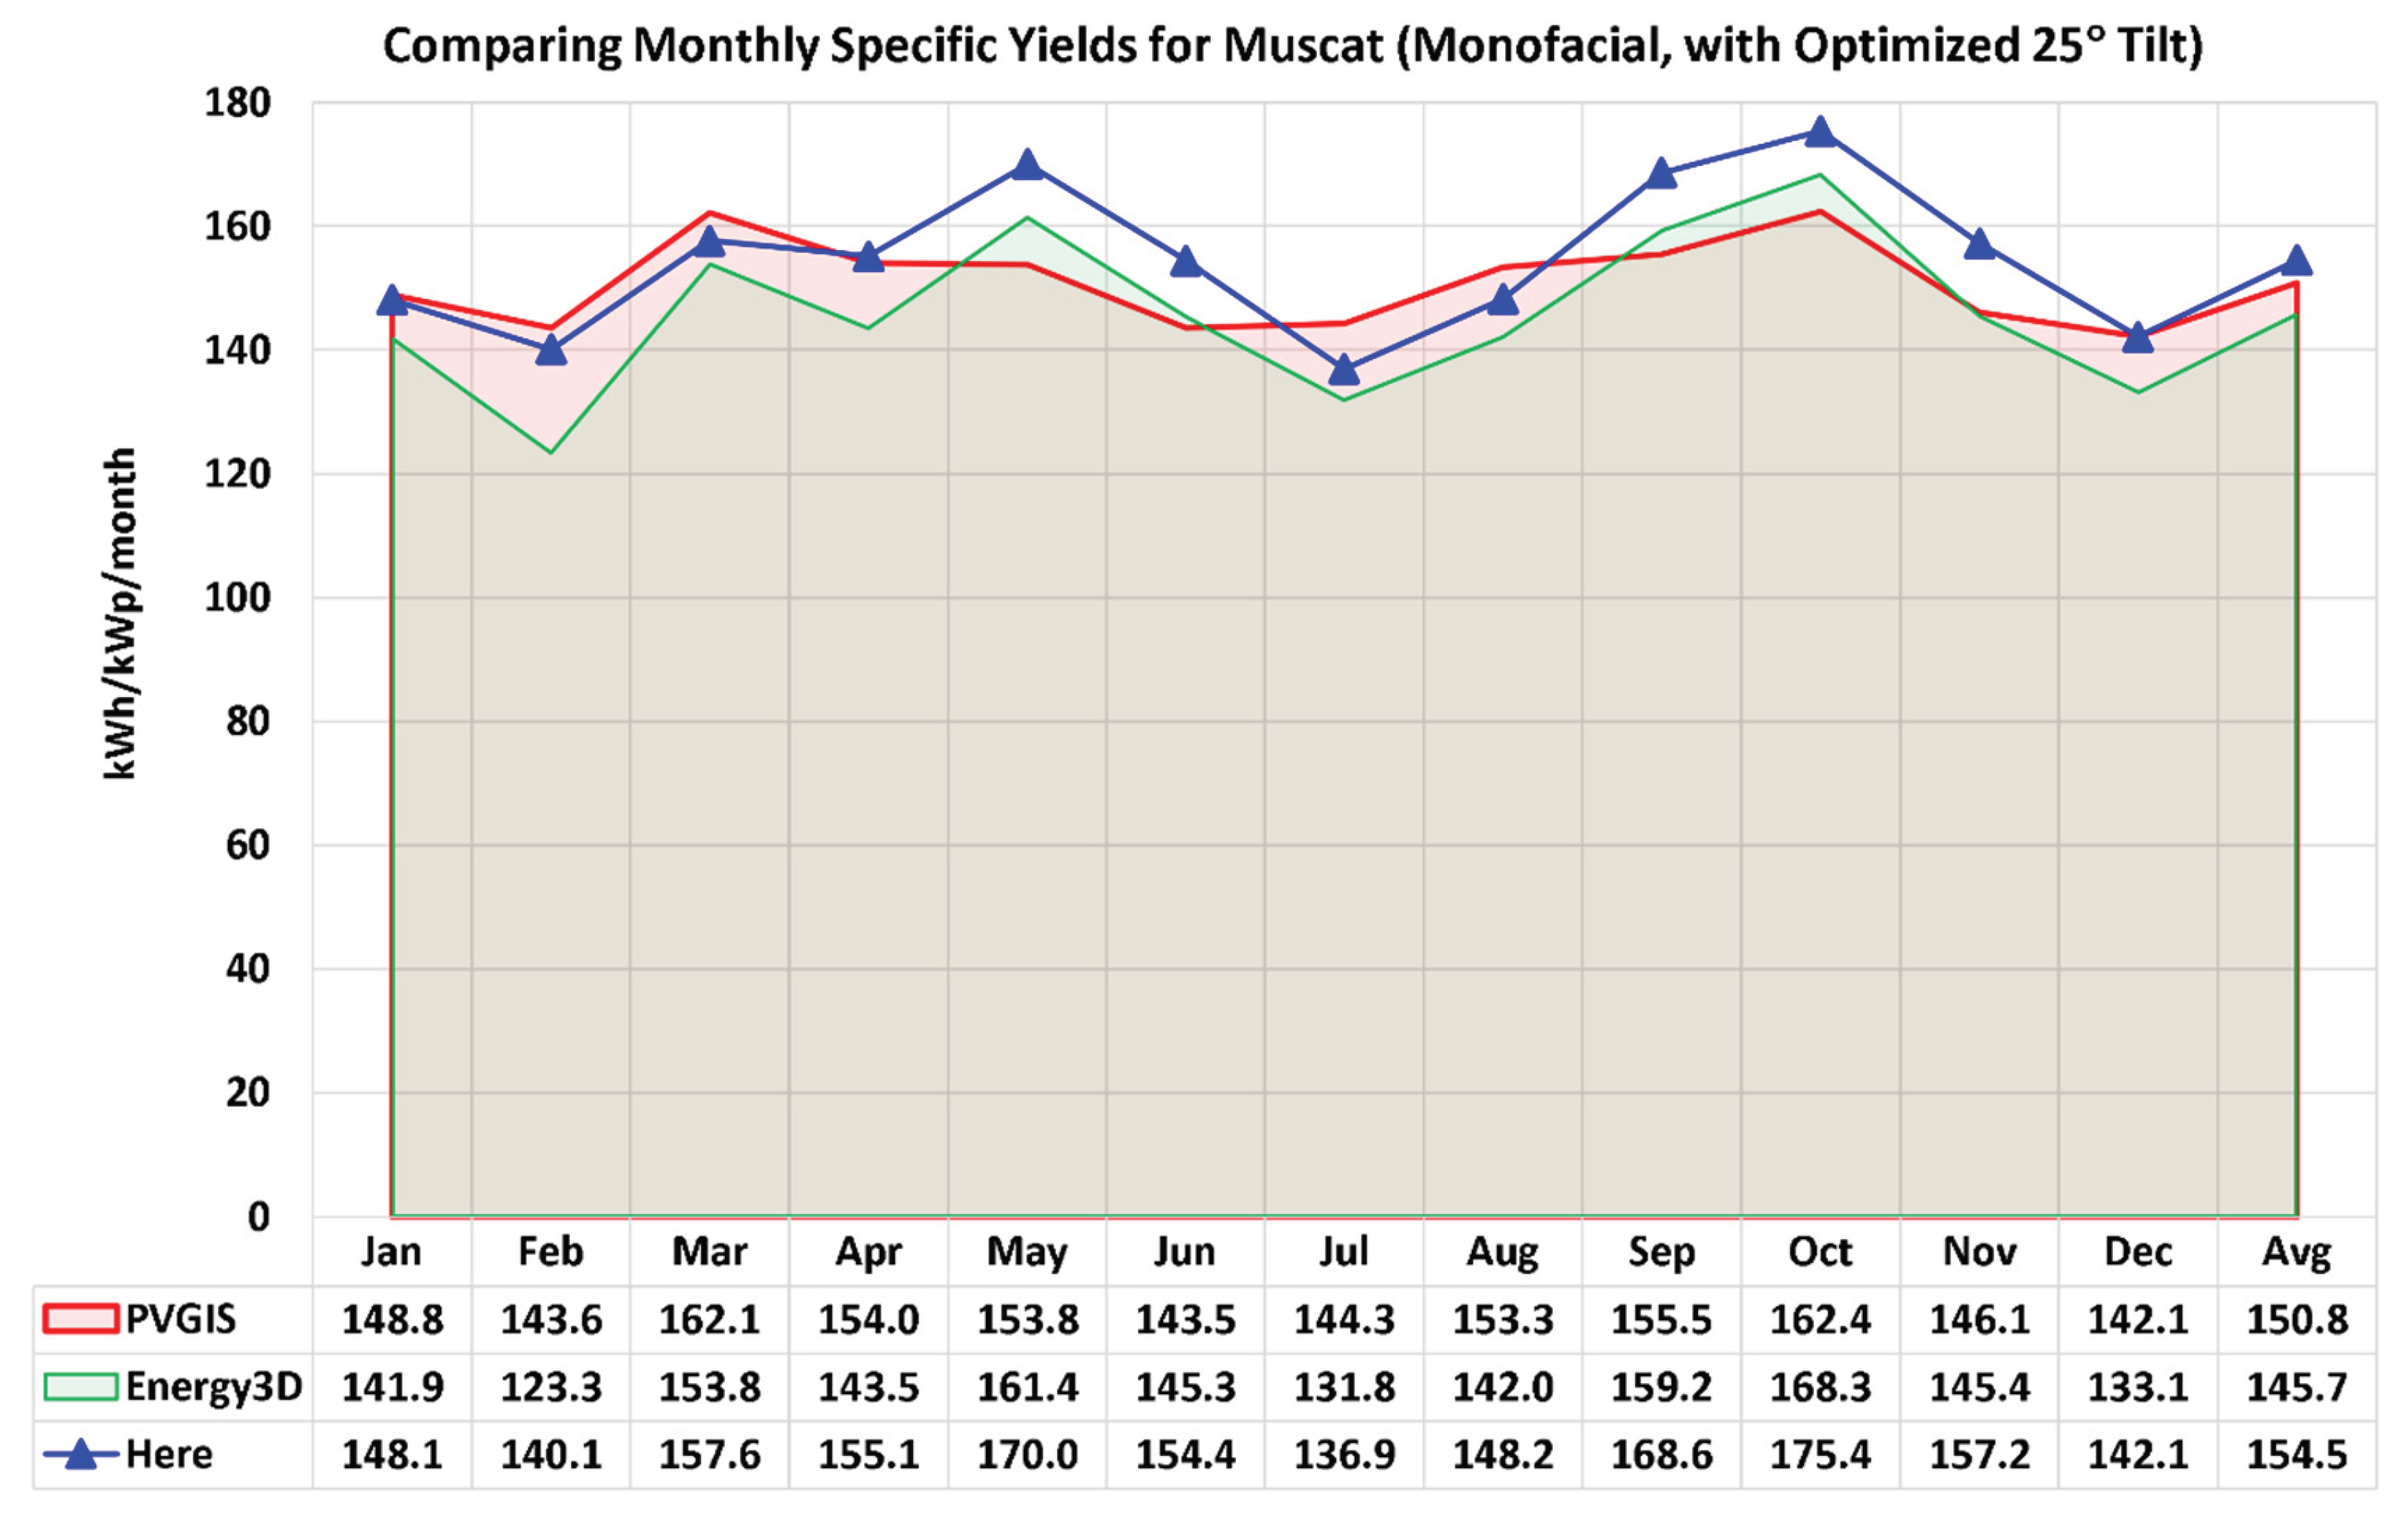
Figure 21.
Monofacial benchmarking results in terms of the annual specific yield of electric energy (kWh/kWp/year). This benchmarking corresponds to Muscat in Oman.
Figure 21.
Monofacial benchmarking results in terms of the annual specific yield of electric energy (kWh/kWp/year). This benchmarking corresponds to Muscat in Oman.
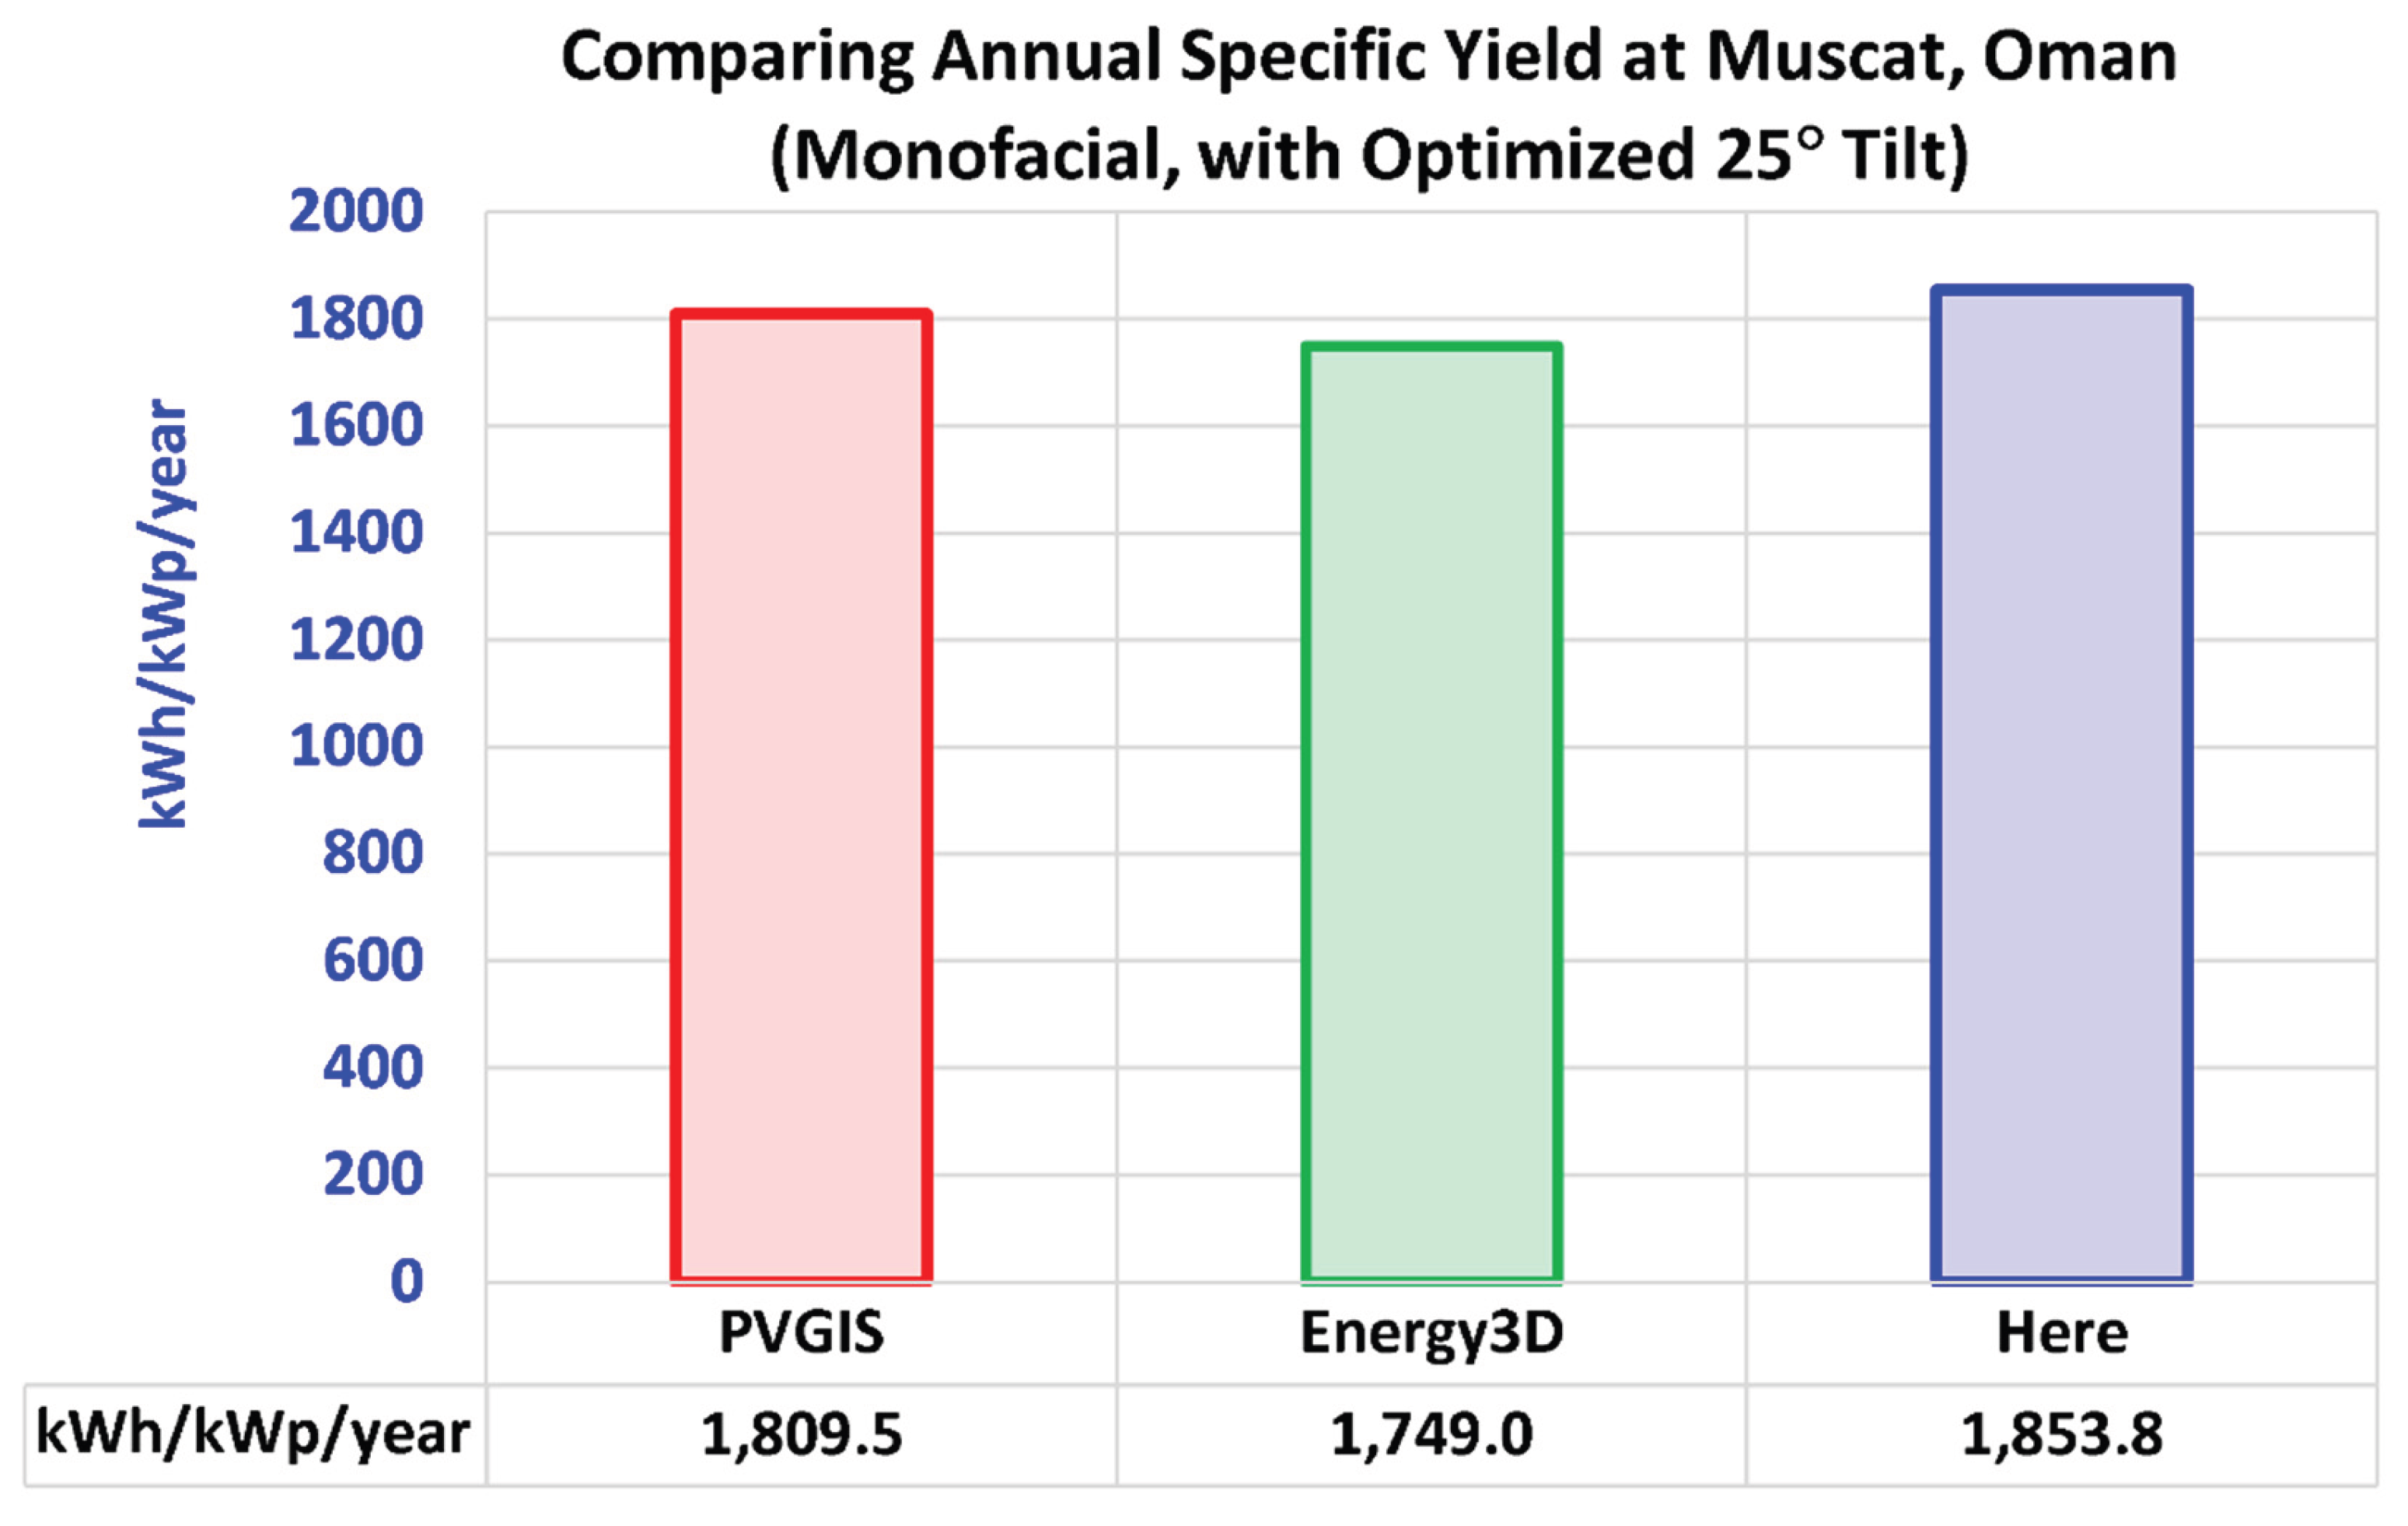
Figure 22.
Layout of the bifacial PV array used here in the bifacial benchmarking simulation that corresponds to Caferbey in Turkey. This particular view corresponds to 3 pm solar time (three hours after the sun is at its highest elevation above the horizon).
Figure 22.
Layout of the bifacial PV array used here in the bifacial benchmarking simulation that corresponds to Caferbey in Turkey. This particular view corresponds to 3 pm solar time (three hours after the sun is at its highest elevation above the horizon).
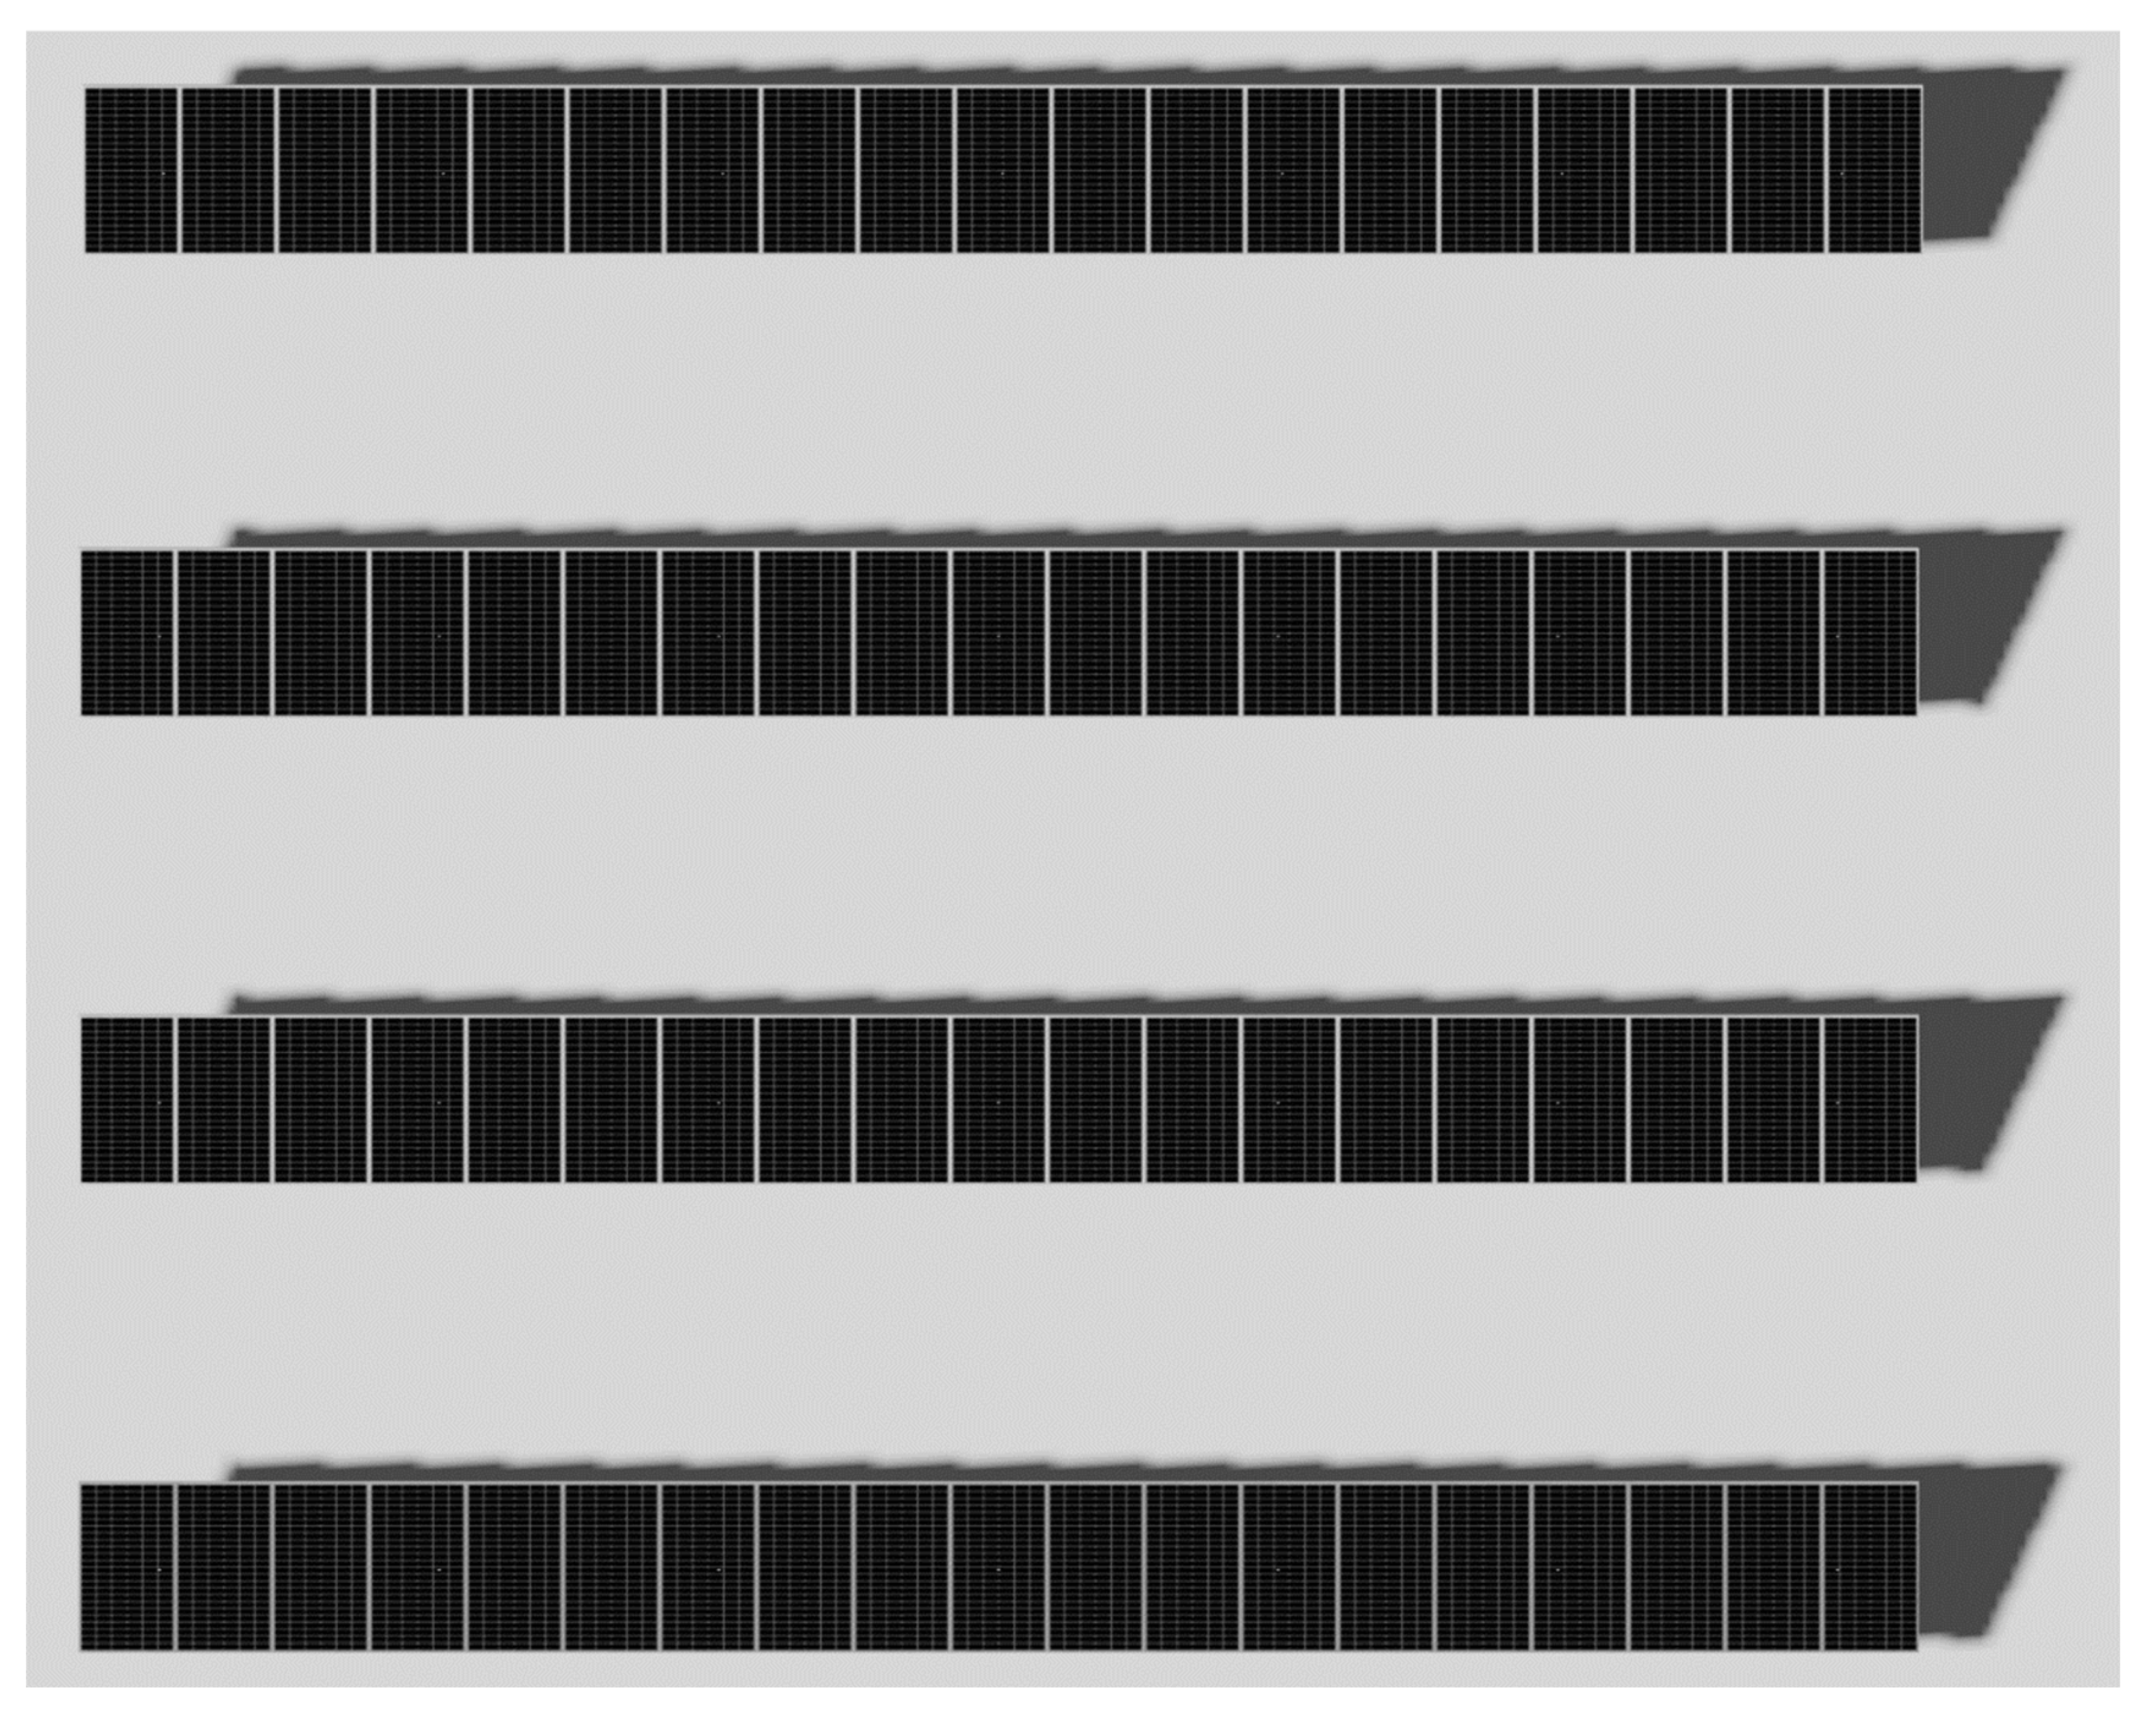
Figure 23.
Bifacial benchmarking results in terms of the annual specific yield of electric energy (kWh/kWp/year). This benchmarking corresponds to Caferbey, Manisa in Turkey.
Figure 23.
Bifacial benchmarking results in terms of the annual specific yield of electric energy (kWh/kWp/year). This benchmarking corresponds to Caferbey, Manisa in Turkey.
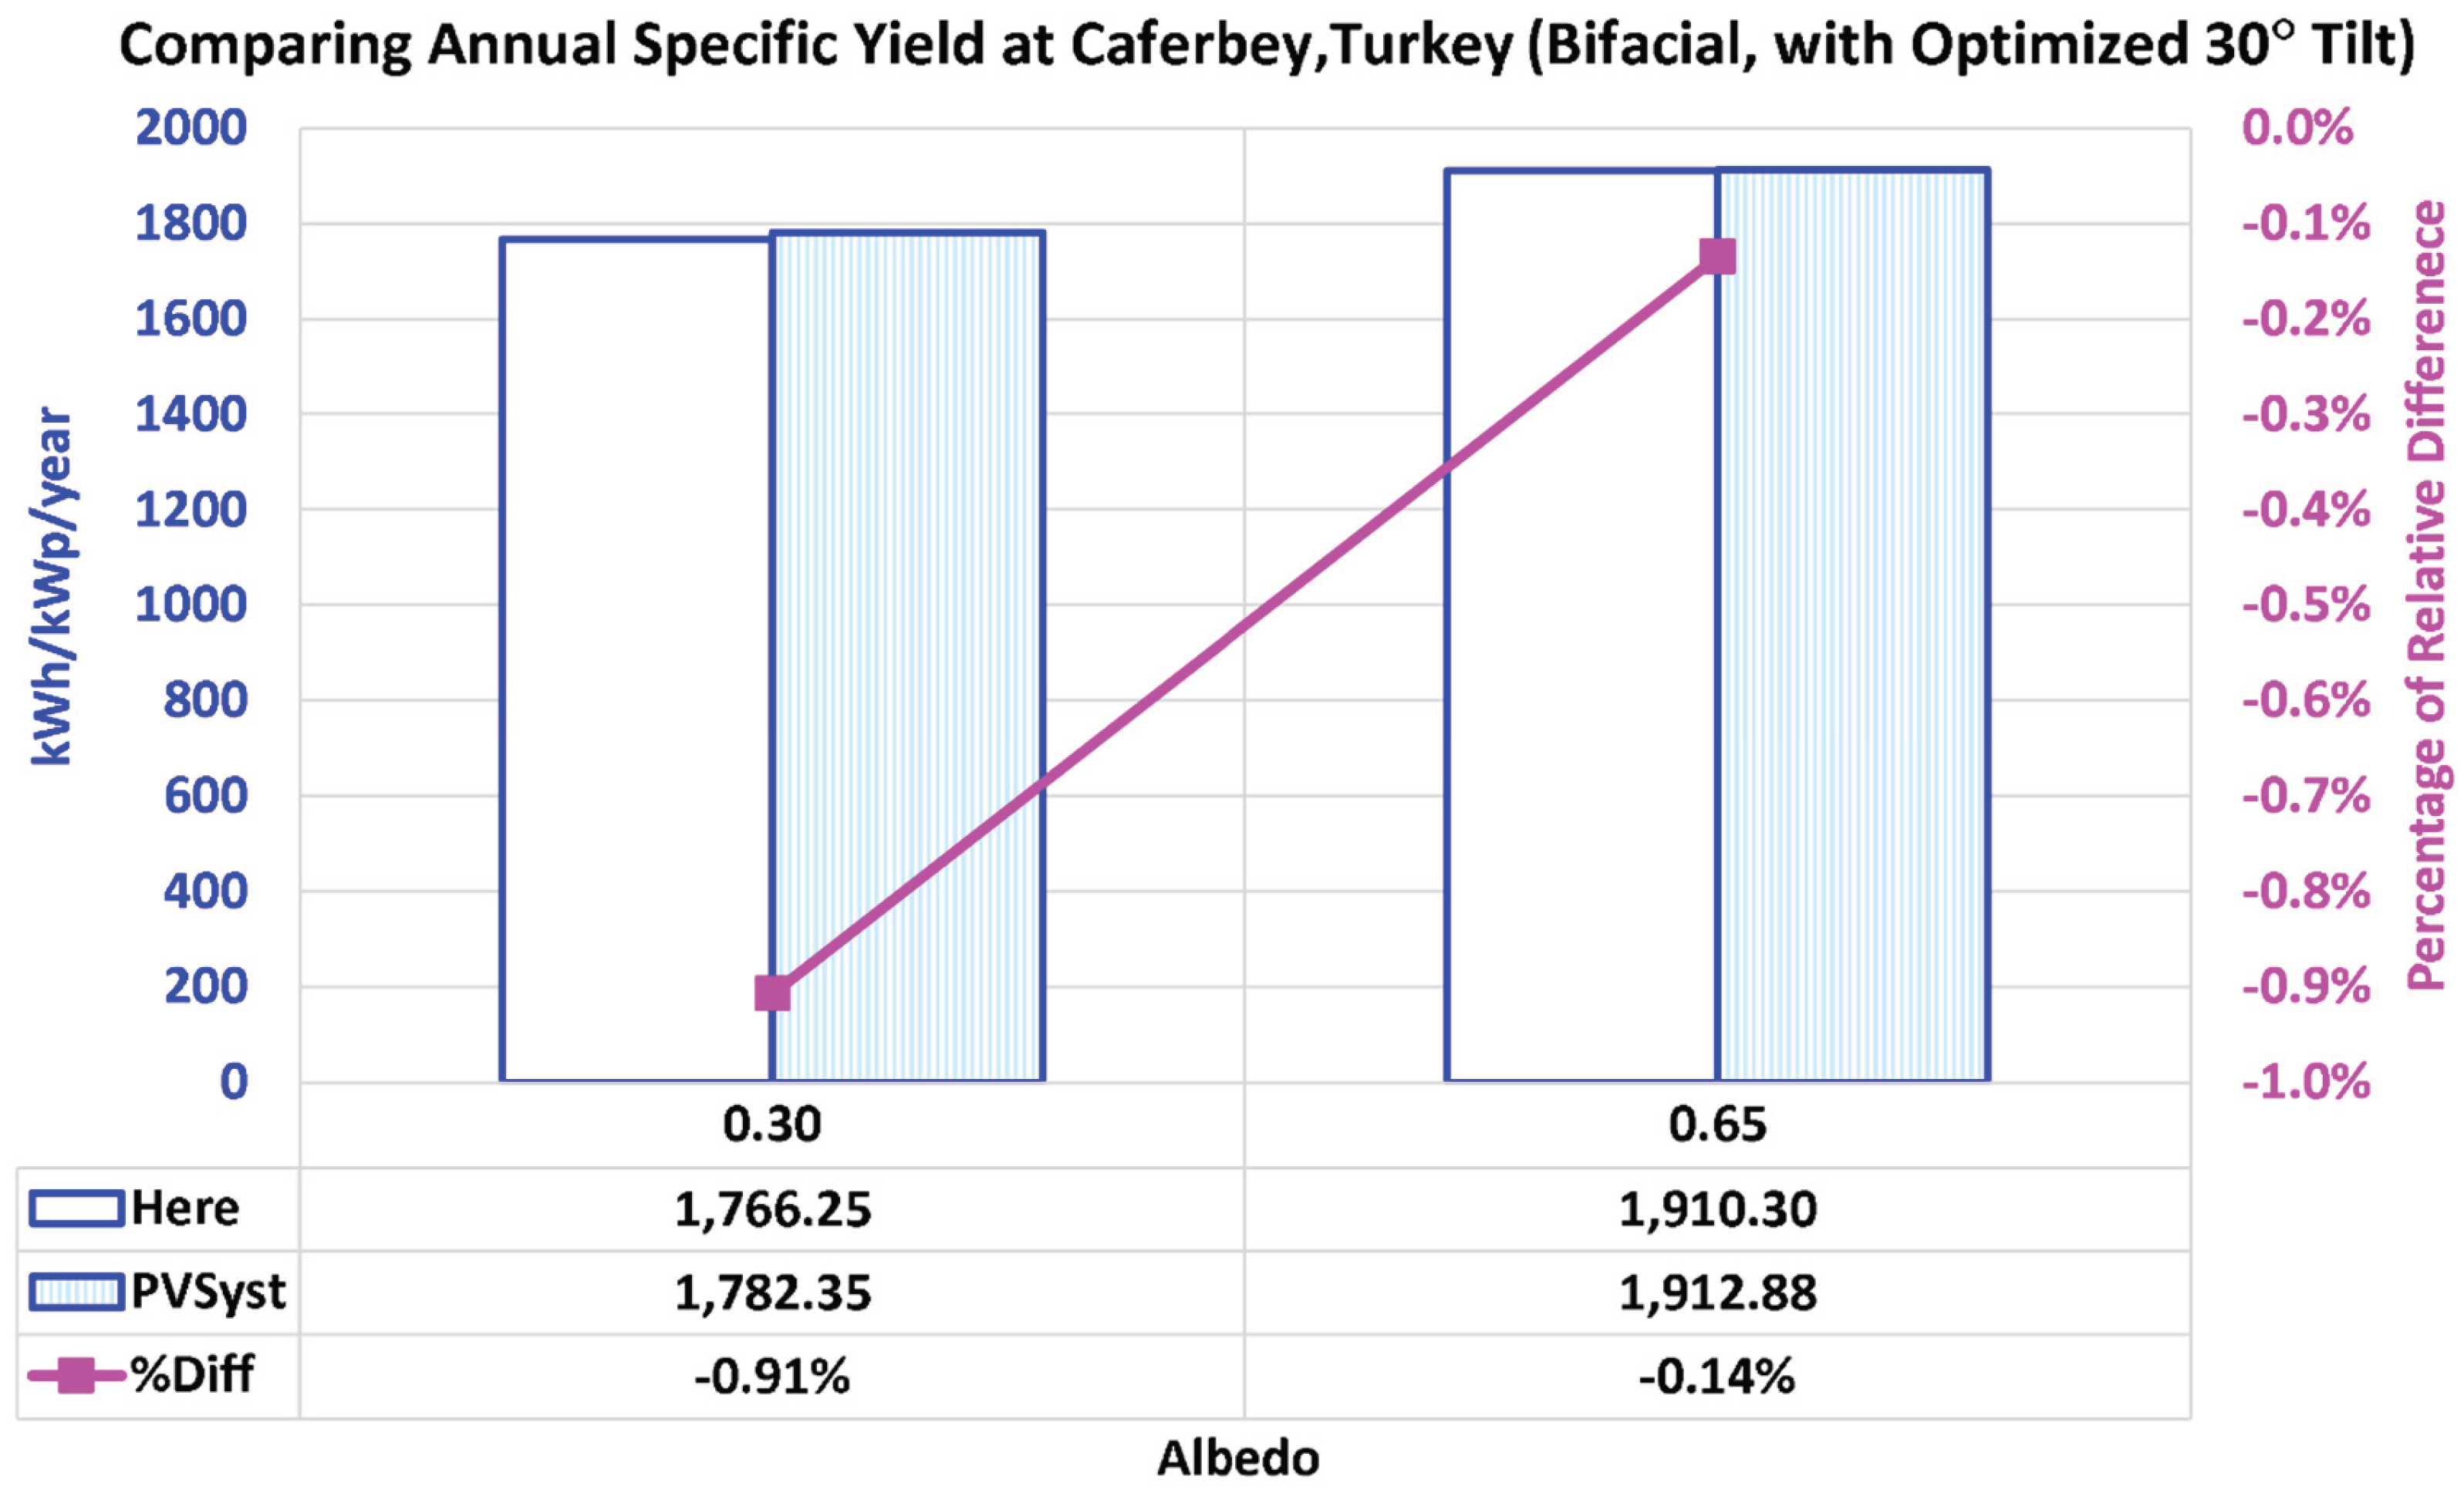
Figure 24.
Aladdin-based estimated annual specific electricity yield in seven Omani cities, with monofacial PV modules, bifacial PV modules with a low albedo value of 0.30, and bifacial PV modules with a high albedo value of 0.65.
Figure 24.
Aladdin-based estimated annual specific electricity yield in seven Omani cities, with monofacial PV modules, bifacial PV modules with a low albedo value of 0.30, and bifacial PV modules with a high albedo value of 0.65.
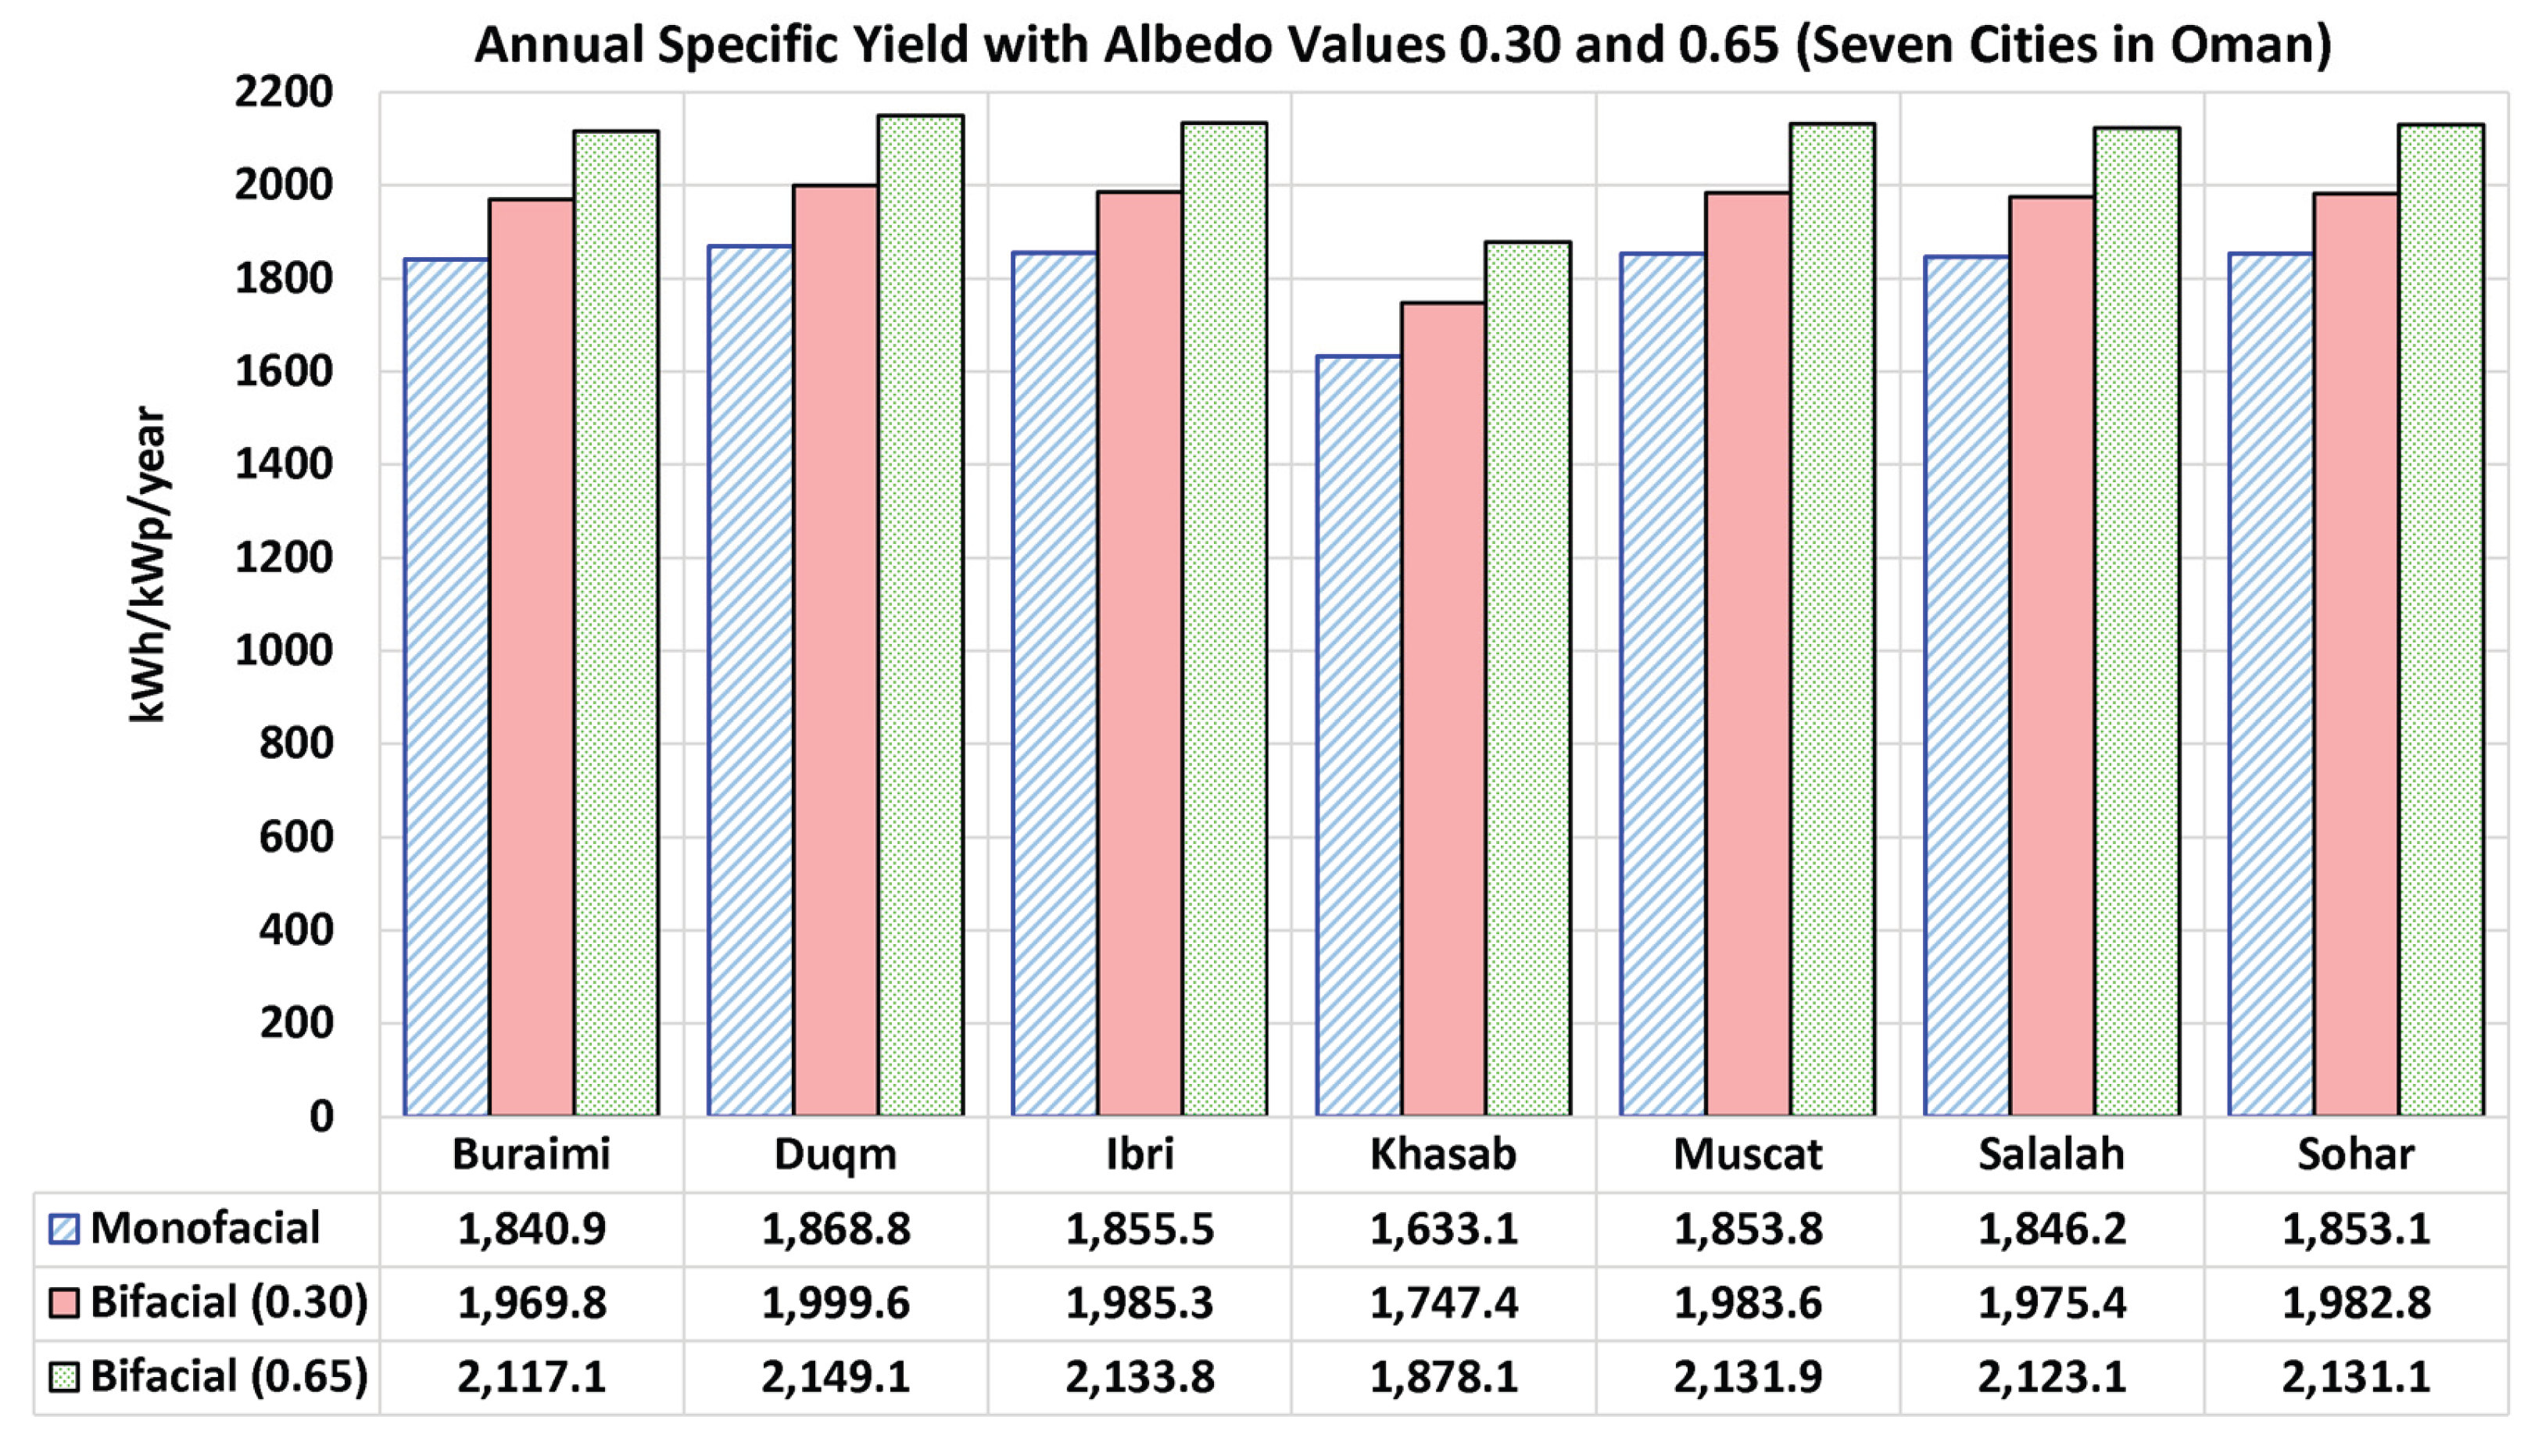
Figure 25.
Profiles of the monthly (per-month) specific yield of electricity for the seven Omani locations studied here, with monofacial PV modules.
Figure 25.
Profiles of the monthly (per-month) specific yield of electricity for the seven Omani locations studied here, with monofacial PV modules.
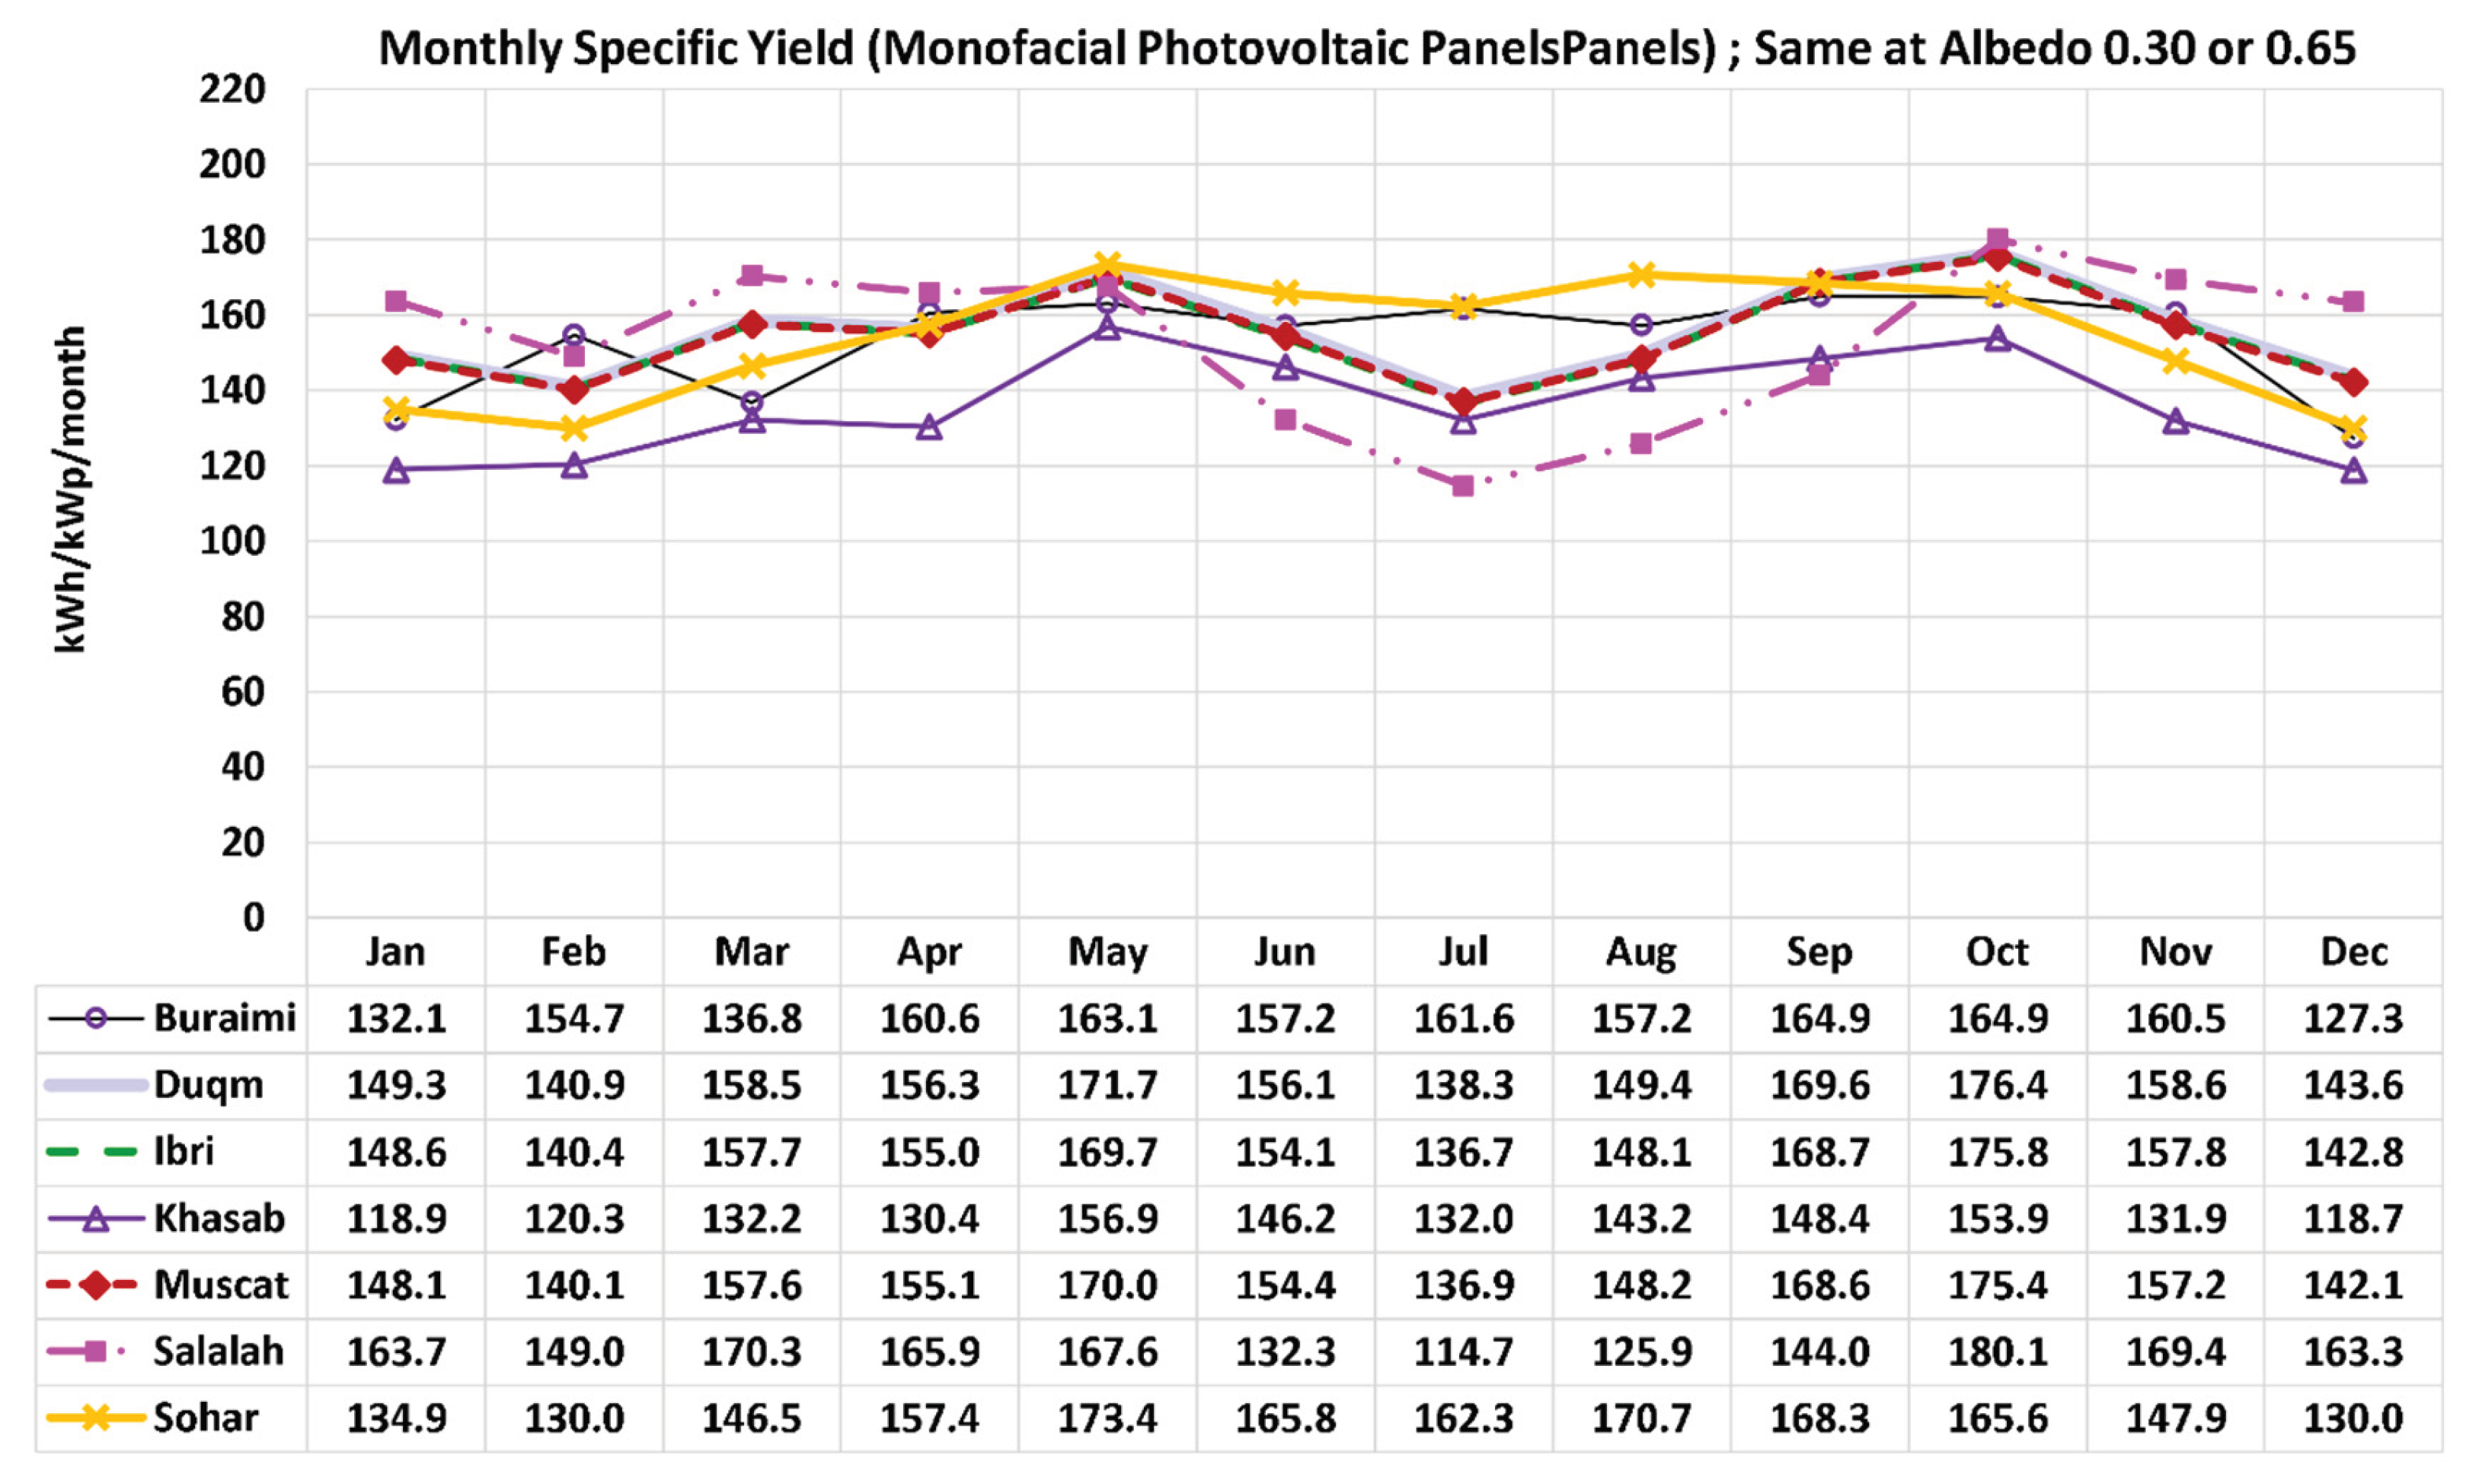
Figure 26.
Profiles of the monthly (per-month) specific yield of electricity for the seven Omani locations studied here, with bifacial PV modules and ground albedo 0.30 (low).
Figure 26.
Profiles of the monthly (per-month) specific yield of electricity for the seven Omani locations studied here, with bifacial PV modules and ground albedo 0.30 (low).
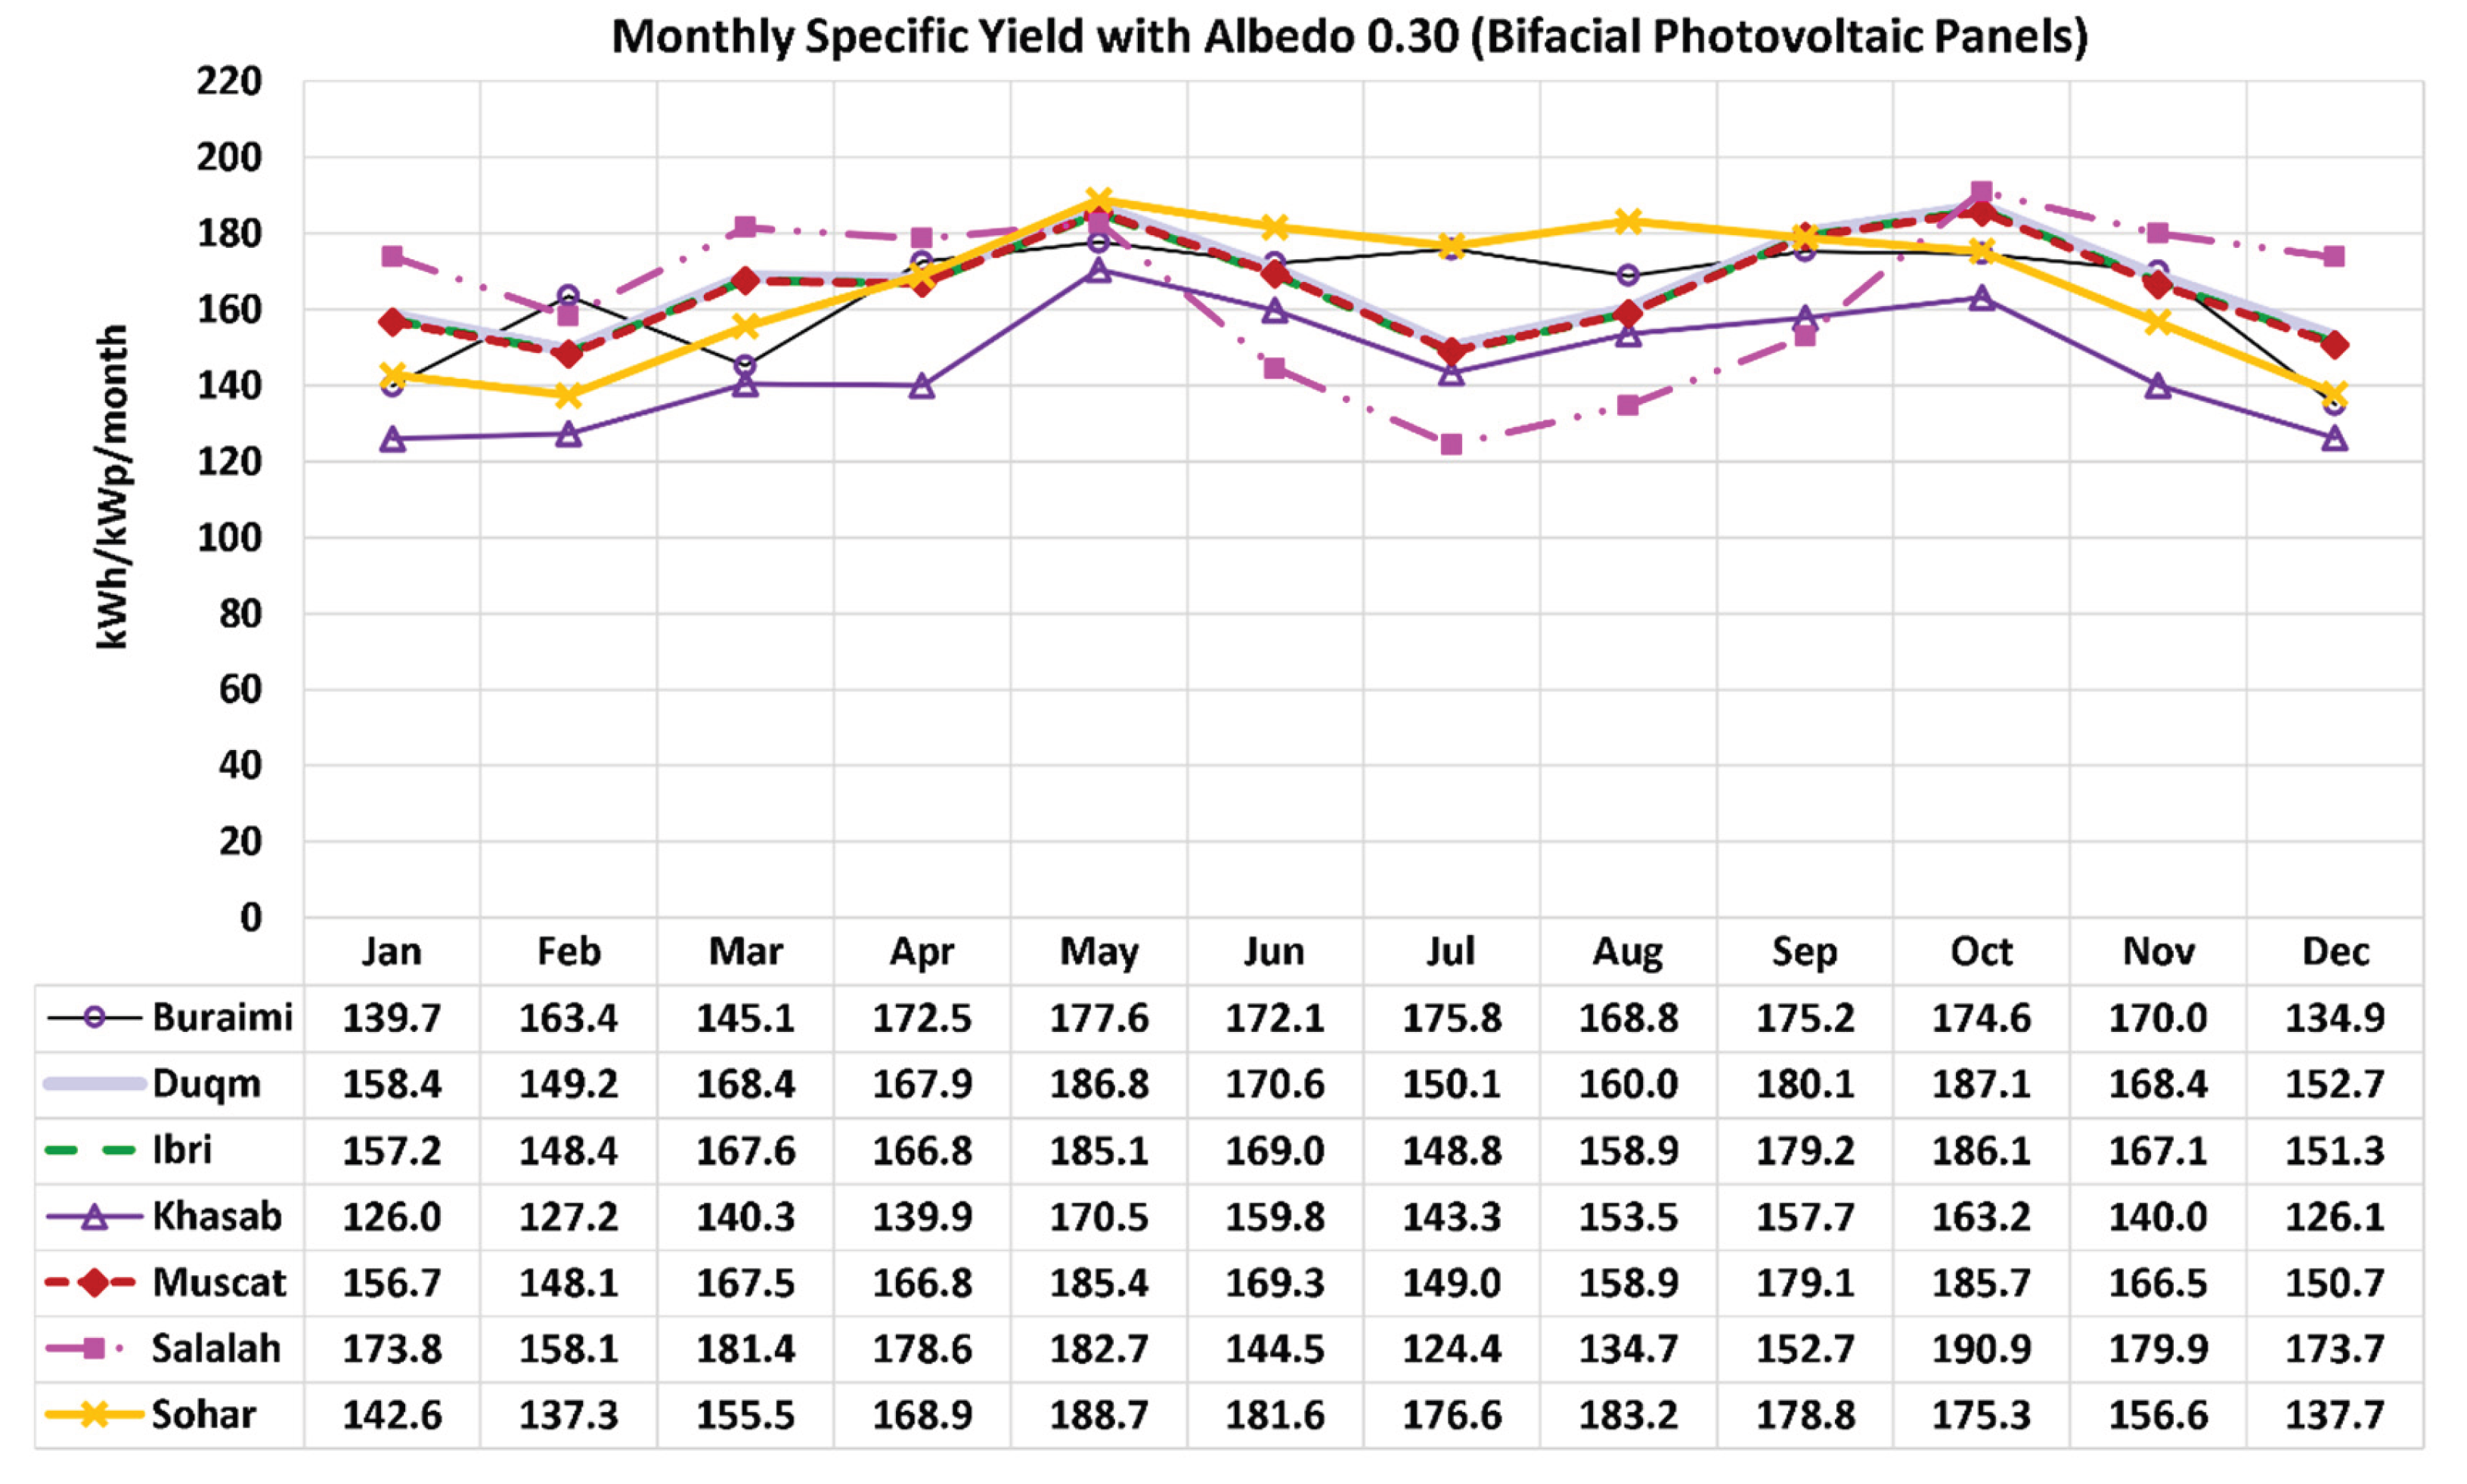
Figure 27.
Profiles of the monthly approximated bifacial gain (ABG) in electricity generation for the seven Omani locations studied here, with ground albedo 0.30 (low).
Figure 27.
Profiles of the monthly approximated bifacial gain (ABG) in electricity generation for the seven Omani locations studied here, with ground albedo 0.30 (low).
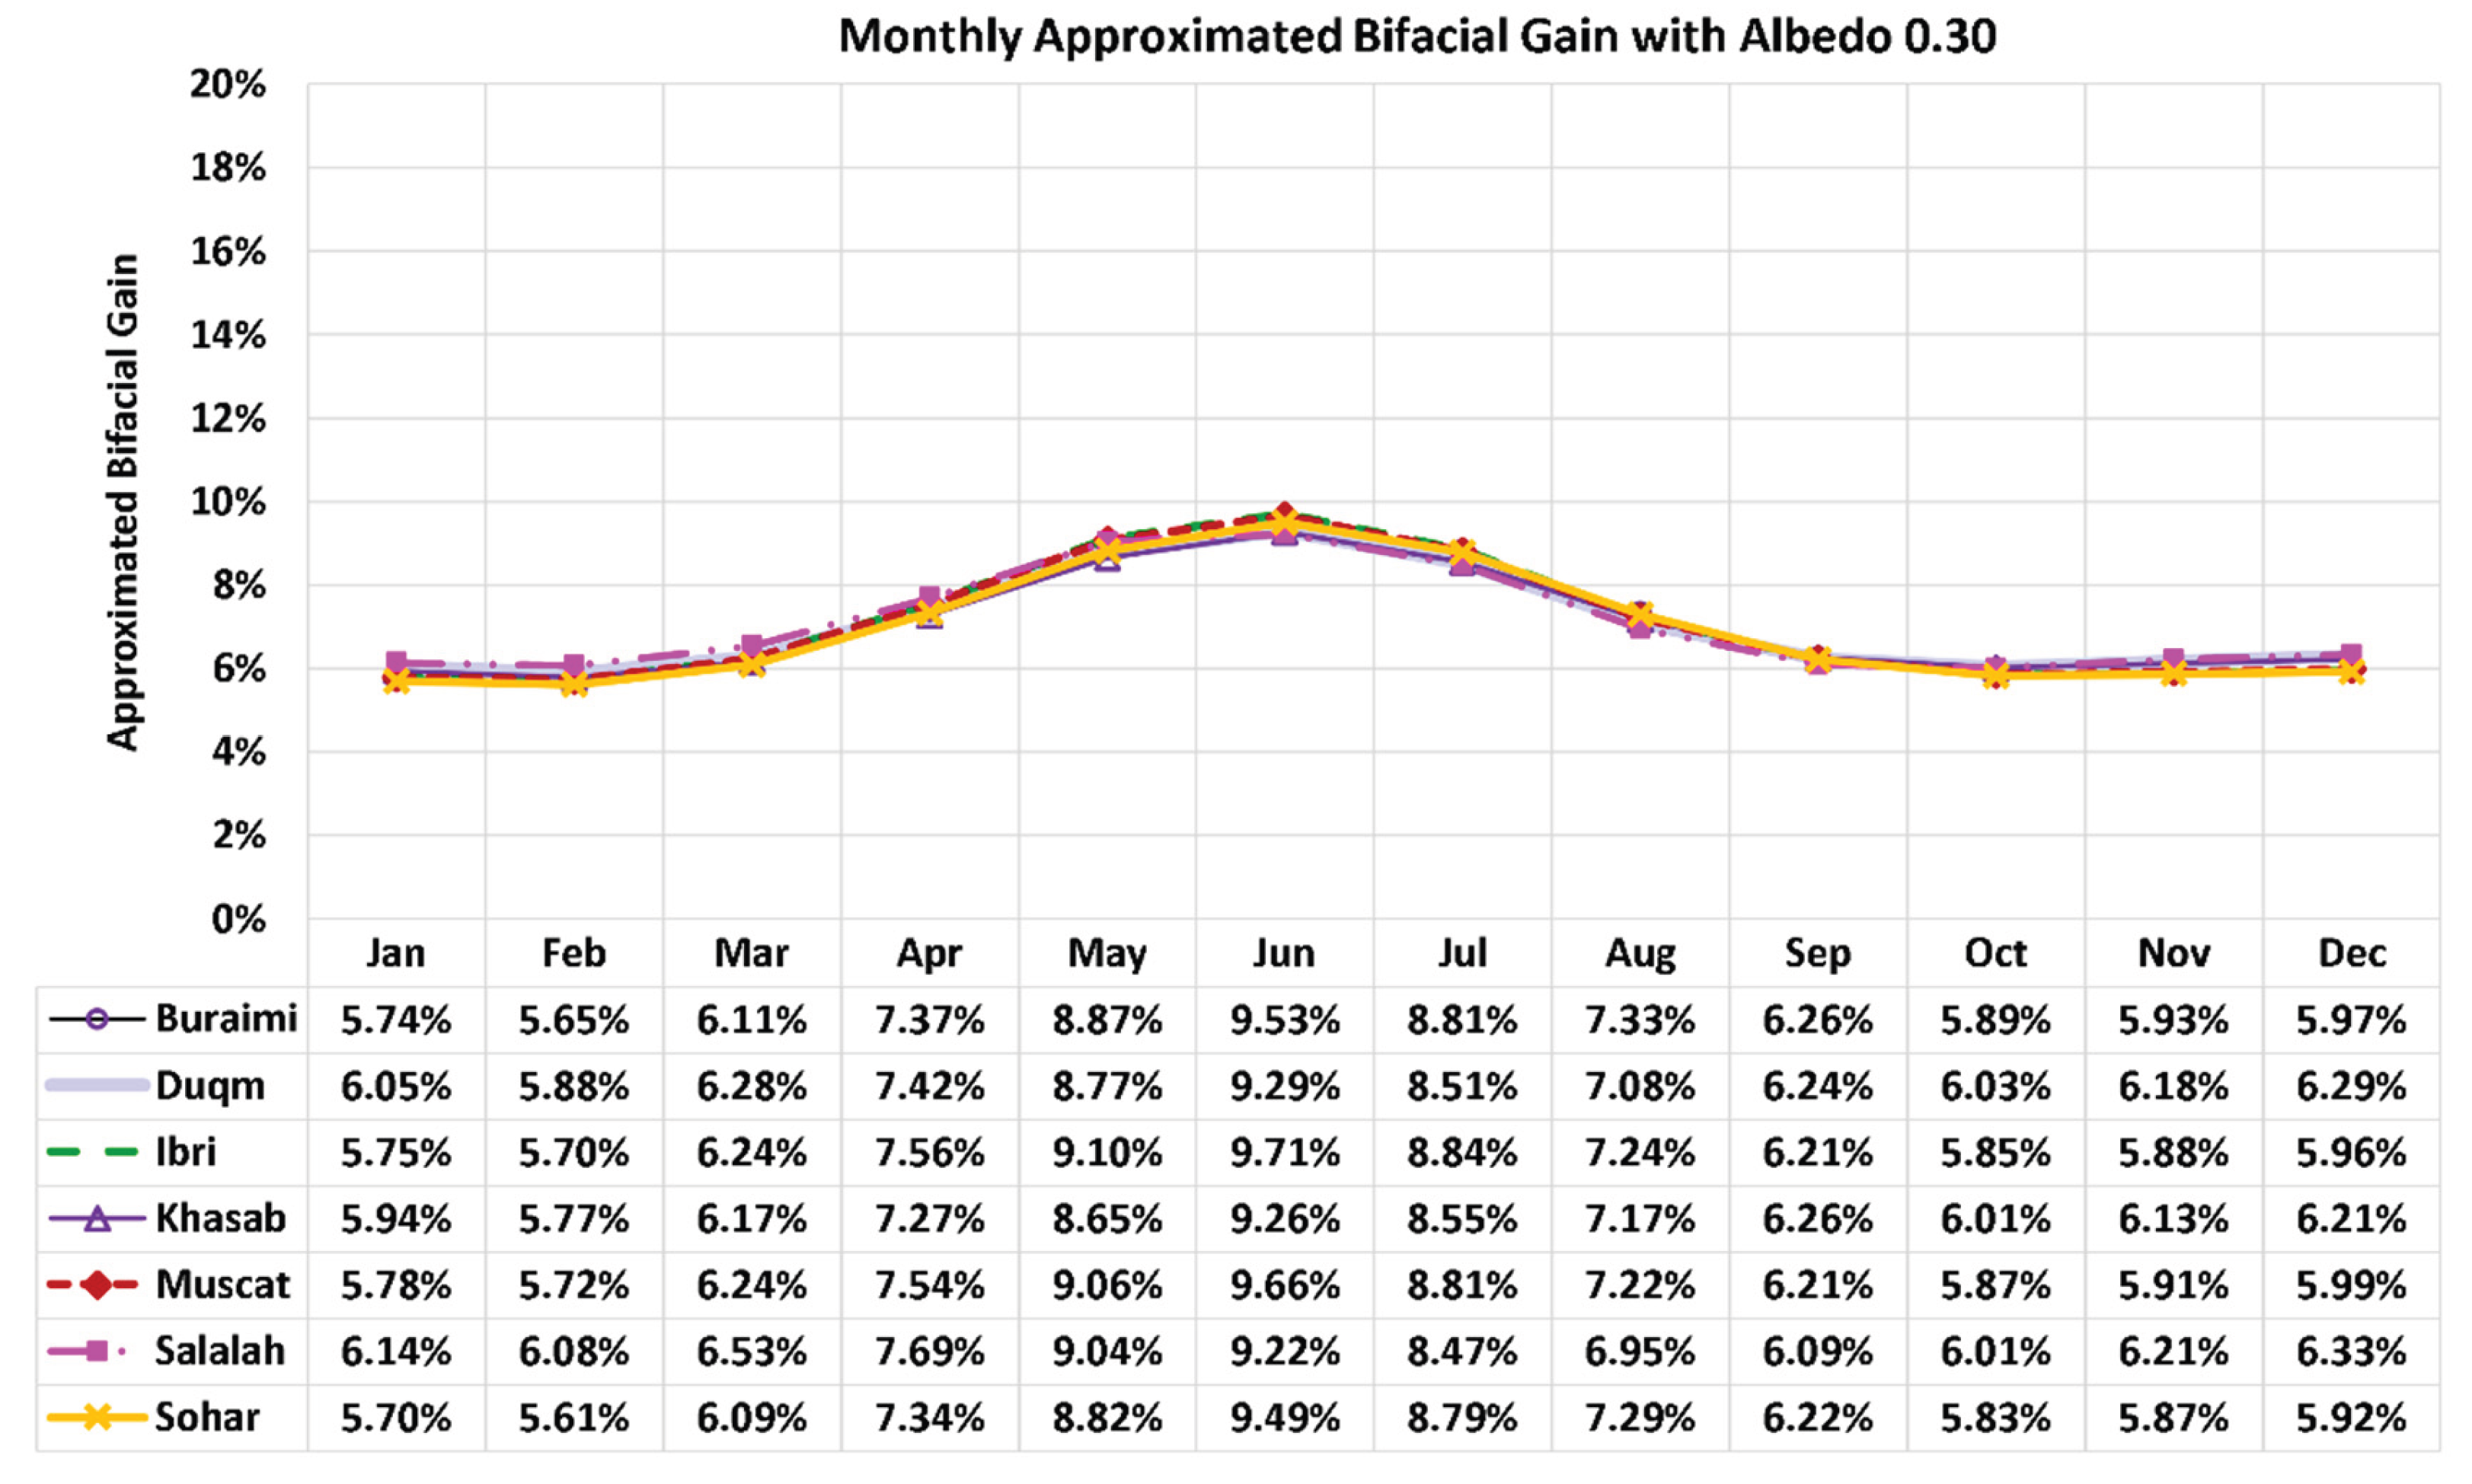
Figure 28.
Profiles of the monthly (per-month) specific yield of electricity for the seven Omani locations studied here, with bifacial PV modules and high ground albedo 0.65 (high).
Figure 28.
Profiles of the monthly (per-month) specific yield of electricity for the seven Omani locations studied here, with bifacial PV modules and high ground albedo 0.65 (high).
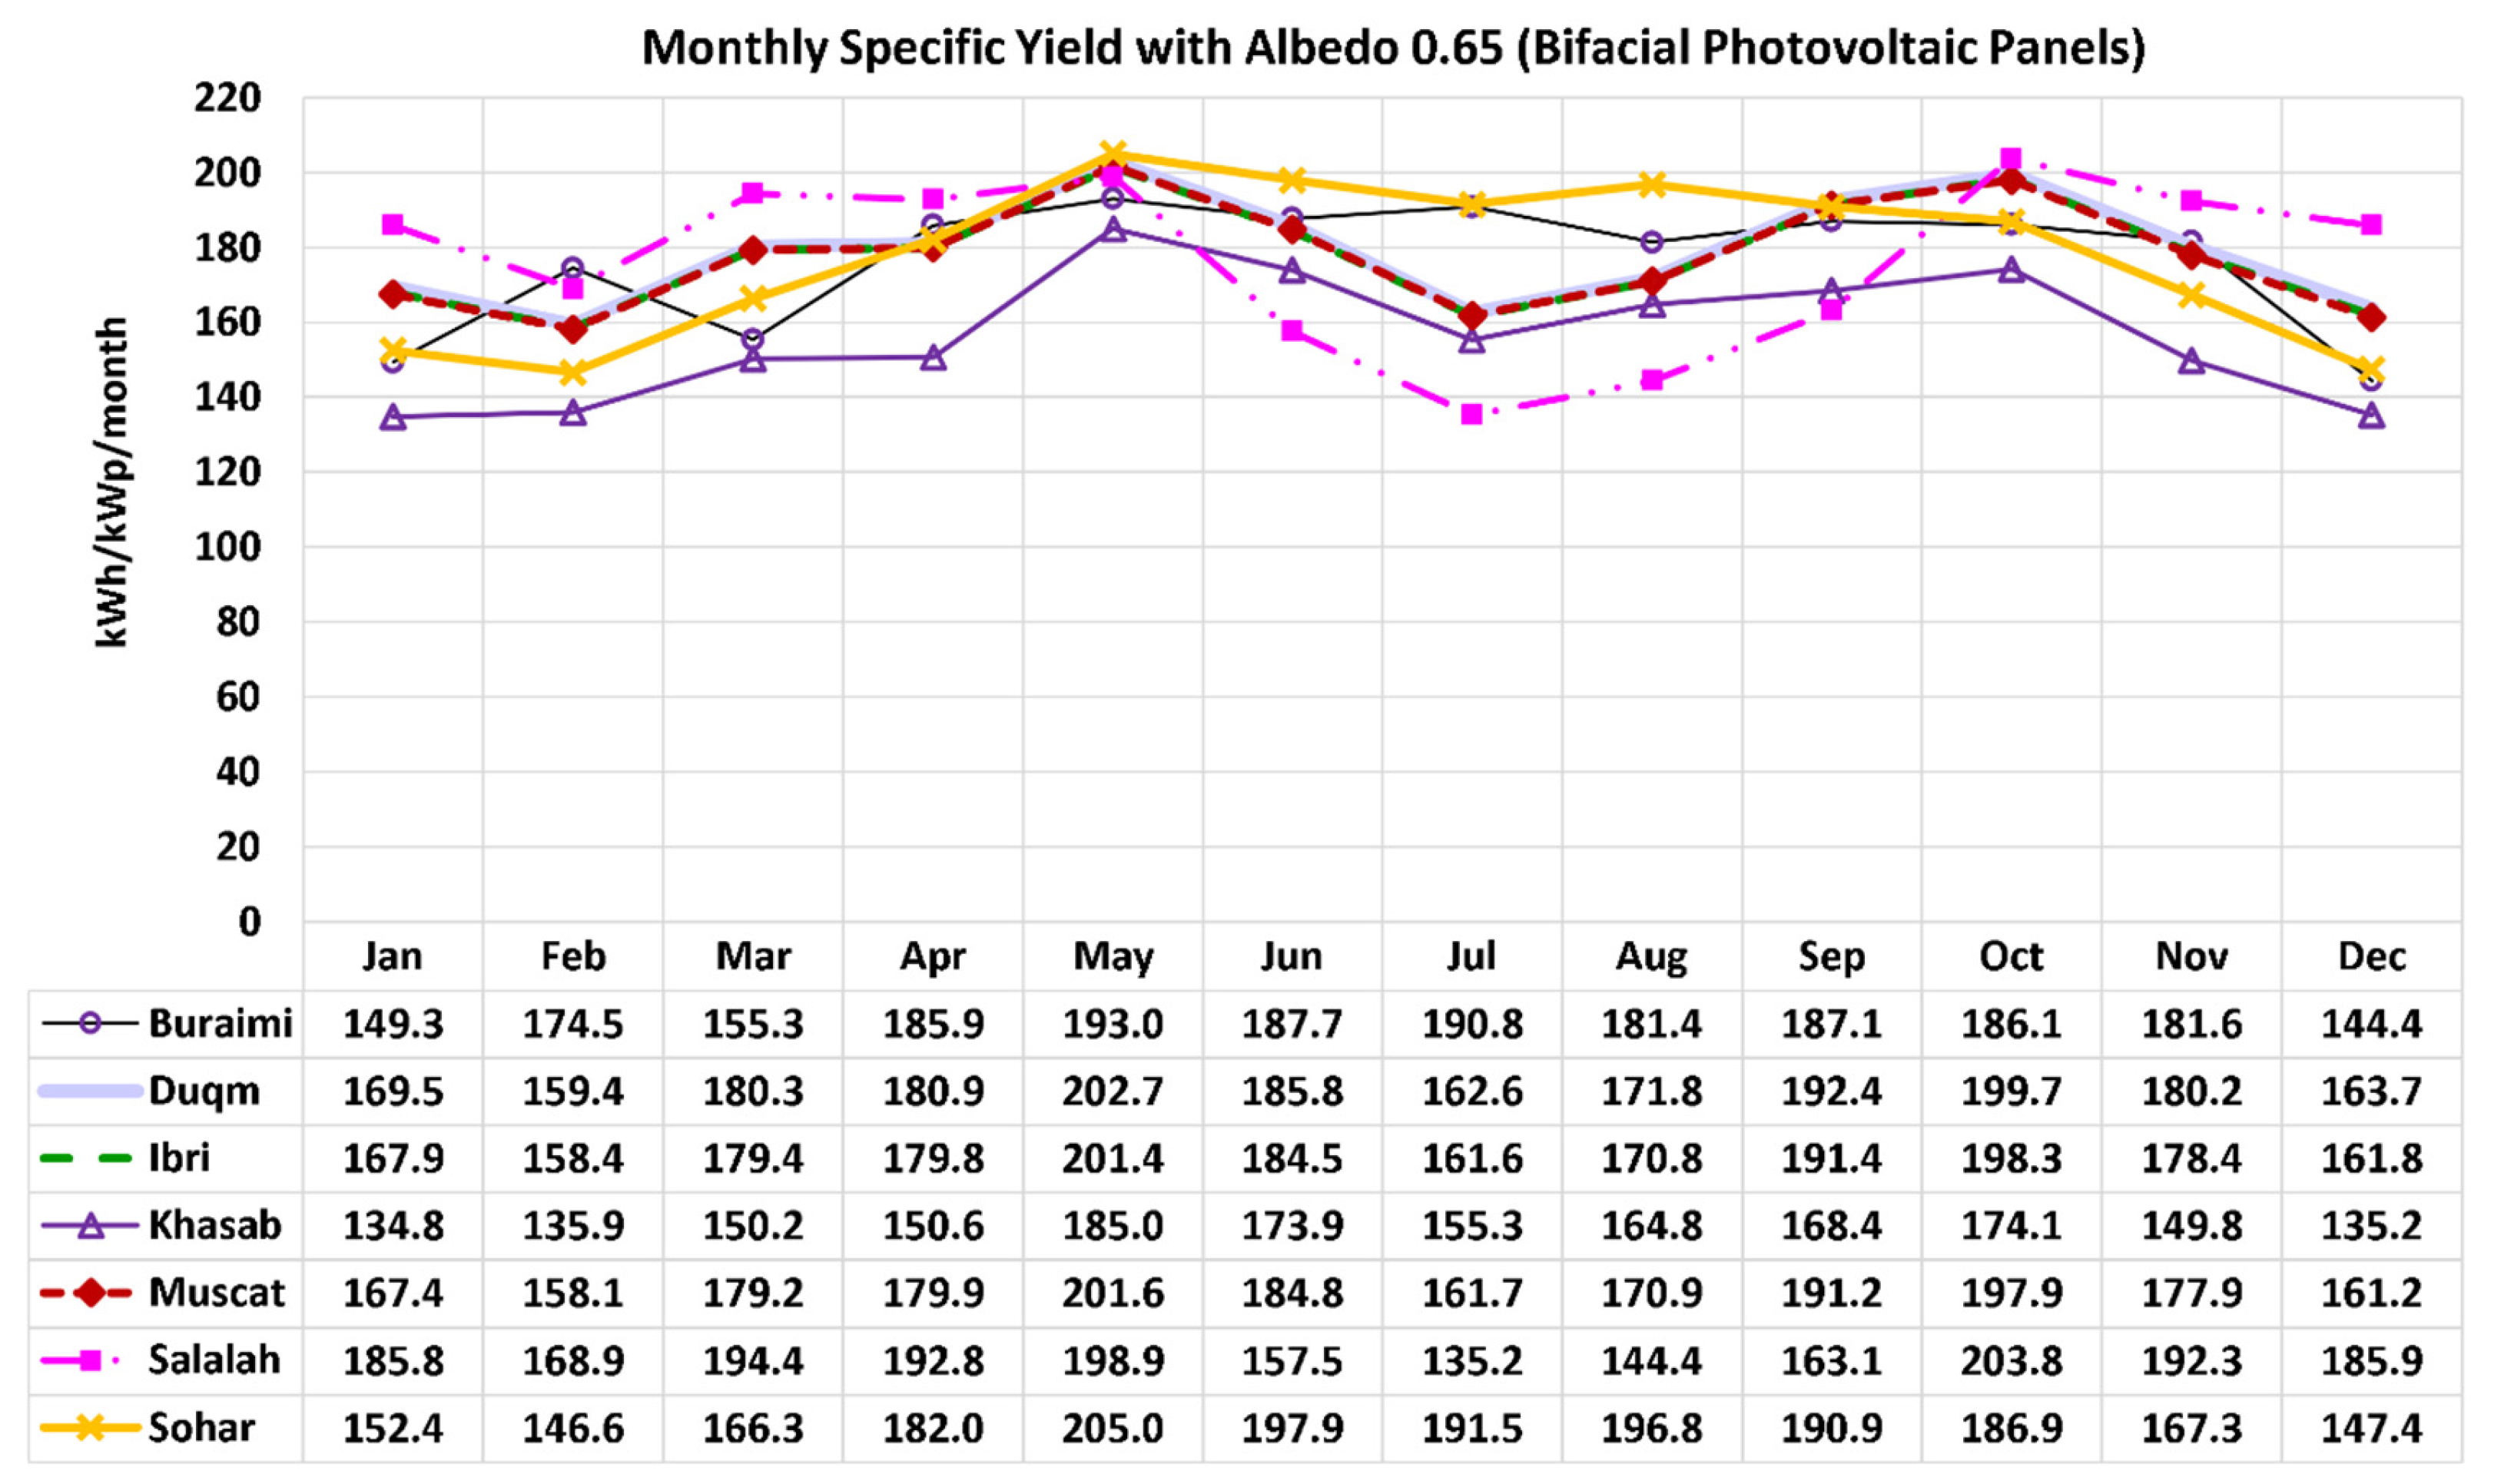
Figure 29.
Profiles of the monthly approximated bifacial gain (ABG) in electricity generation for the seven Omani locations studied here, with ground albedo 0.65 (high).
Figure 29.
Profiles of the monthly approximated bifacial gain (ABG) in electricity generation for the seven Omani locations studied here, with ground albedo 0.65 (high).
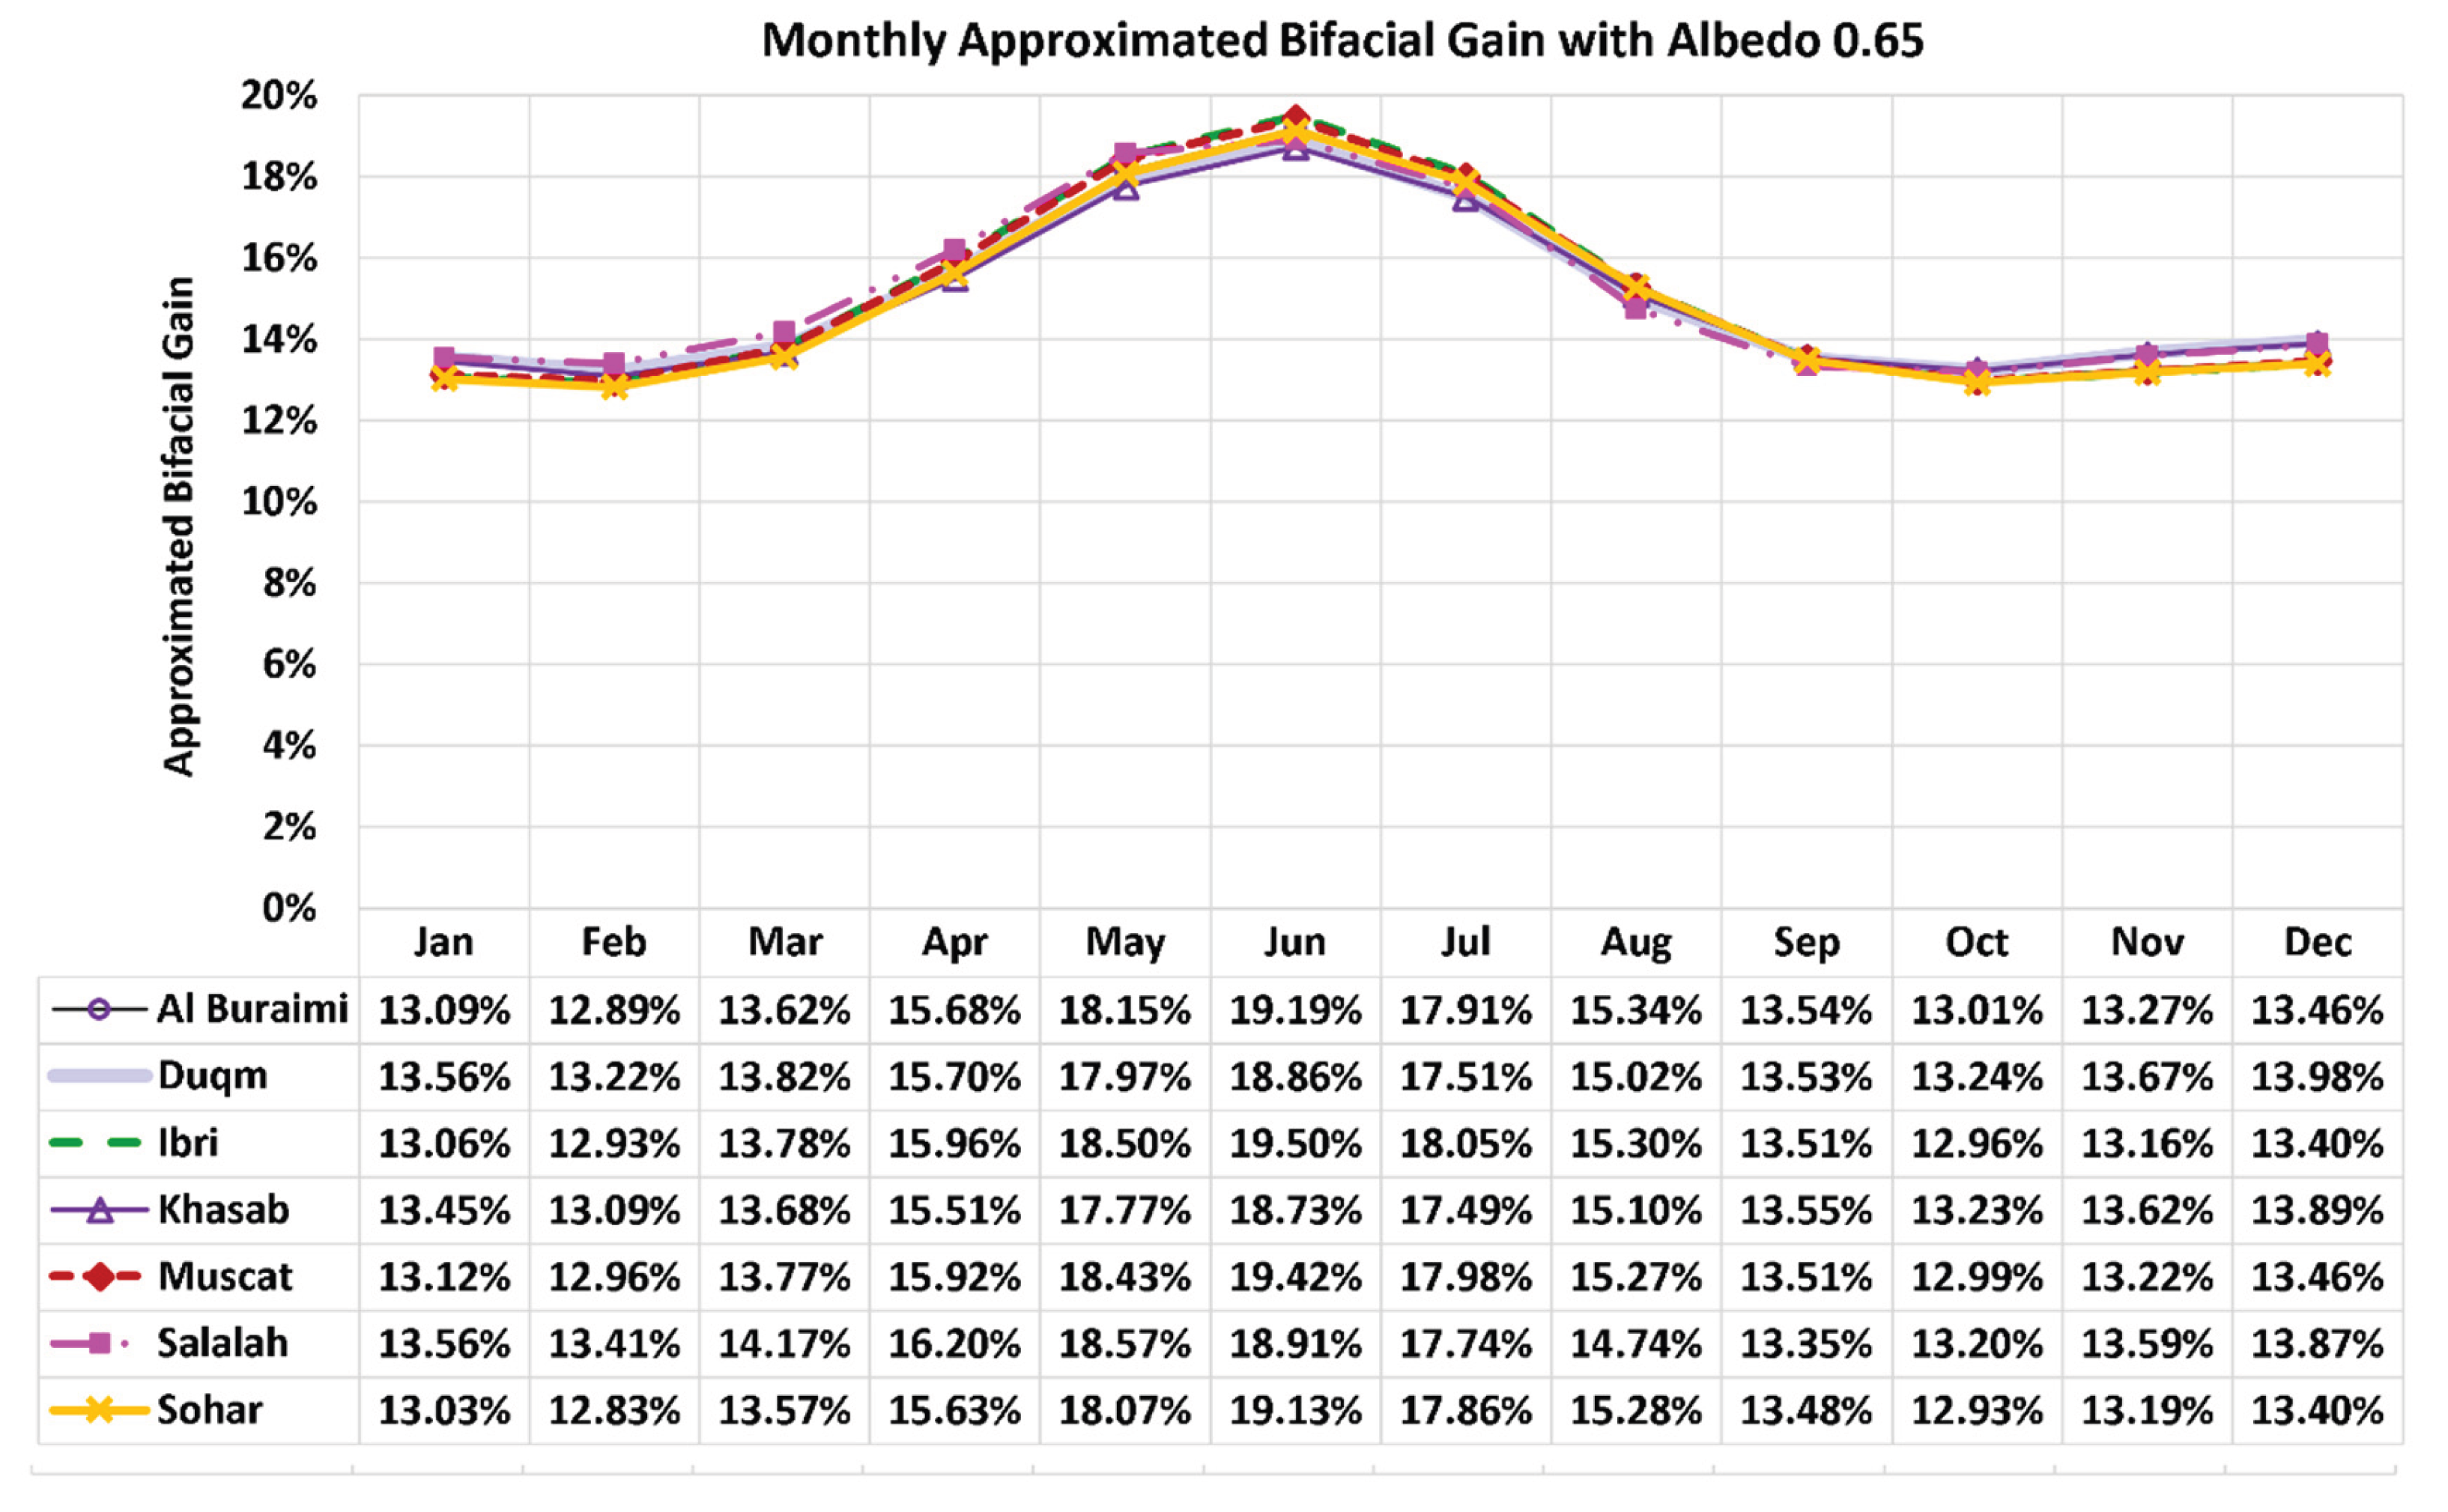

Table 1.
Additional specific modeling settings for the main simulation cases (4.5 kWp single-row photovoltaic systems, monofacial and bifacial).
Table 1.
Additional specific modeling settings for the main simulation cases (4.5 kWp single-row photovoltaic systems, monofacial and bifacial).
| Omani location | GPS coordinates (degree, minute, second – DMS) | GPS coordinates (decimal degree – DD) | Fixed optimum tilt |
|---|---|---|---|
| Buraimi | N 24°15’3’’, E 55°47’35’’ | 24.250833° N, 55.793056° E | 25° |
| Duqm | N 19°39’43’’, E 57°42’13’’ | 19.661944° N, 57.703611° E | 21° |
| Ibri | N 23°13’32’’, E 56°30’56’’ | 23.225556° N, 56.515556° E | 25° |
| Khasab | N 26°10’47’’, E 56°14’51’’ | 26.179722° N, 56.247500° E | 25° |
| Muscat | N 23°35’2’’, E 58°24’28’’ | 23.583889° N, 58.407778° E | 25° |
| Salalah | N 17°0’54’’, E 54°5’32’’ | 17.015000° N, 54.092222° E | 21° |
| Sohar | N 24°20’50’’, E 56°42’33’’ | 24.347222° N, 56.709167° E | 25° |
Table 2.
Different albedo values in the literature (ascendingly ordered by value).
| Ground / Foundation characteristics | Albedo value | Reference |
|---|---|---|
| perfectly black surface | 0 | [175] |
| black road pavement | 0.05-0.10 | [176] |
| dark soil | 0.05-0.15 | [176] |
| unpainted streets | 0.15 | [177] |
| green meadows | 0.10-0.20 | [176] |
| grassland | 0.1 | [178] |
| dark-colored soil surfaces | 0.1-0.2 | [178] |
| soil surface | 0.10–0.15 | [93] |
| crops | 0.15-0.25 | [176] |
| grayish (sometimes called “white”) roof shingles | 0.25 | [179] |
| concrete | 0.17-0.27 | [176] |
| savanna and grassland | Below 0.18 | [180] |
| grassland | 0.2 | [181] |
| bare ground | 0.2 | [175] |
| desert | 0.25-0.30 | [176] |
| cement foundation surrounded by sand | 0.3 | [182] |
| average ground albedo | 0.3 | [183] |
| concrete | 0.30–0.35 | [93] |
| dune sand | 0.35-0.45 | [176] |
| sand | 0.4 | [175] |
| white pebbles | 0.5-0.6 | [93,175] |
| concrete | 0.50-0.55 | [184] |
| white tiles | 0.7 | [185] |
| white tiles or white waterproof materials | Above 0.7 | [186] |
| white tiles | 0.7–0.8 | [93] |
| fresh snow | 0.75-0.95 | [176] |
| Snow | Up to 0.92 | [186] |
| highly reflective material (mirror or white surface, capable of total reflection) | 1 | [175] |
Table 3.
General modeling settings for the 4.5 kWp systems (bifacial and monofacial).
| Characteristics | Used value |
|---|---|
| Total nominal (peak) power capacity | 4.5 kWp |
| DC-to-AC ratio | 1.14* |
| Pole height | 1.35 m |
| Pole spacing | 3.00 m |
| Mounting type | Ground mounting |
| Solar tracking | None (fixed orientation) |
| Soiling loss (default value in Aladdin) | 5% |
| Aladdin energy analysis option: sampling frequency | 30 samples per hour (the highest available value) |
| Inverter efficiency | 98%** |
| Bifacial PV module | Jinko Solar Tiger LM 72HC-BDVP*** (Monocrystalline cells, 72 cells as 144 half-cut cells per module) |
| Bifacial PV module type and nameplate DC power | JKM450M-72HLM-BDVP (450 Wp) |
| Bifacial PV module temperature coefficient of power | –0.35% (–0.0035) |
| Number of bifacial PV modules | 10 |
| Monofacial PV module | Jinko Solar Eagle PERC 60M (Monocrystalline cells, 60 cells per module) |
| Monofacial PV module type and nameplate DC power | JKM300M-60 (300 Wp)**** |
| Monofacial PV module temperature coefficient of power | –0.39% (–0.0039) |
| Number of bifacial PV modules | 15 |
* In the external study used here for bifacial benchmarking cases, the reported DC-to-AC ratio was 1.13 (computed as 34.00 kWp ÷ 30.00 kWac = 1.1333). Here, the DC-to-AC ratio is slightly increased to 1.14 to have the same inverter’s nominal AC power of 30.00 kWac as the external benchmarking cases, despite the PV nominal peak power here being 34.20 kWp (rather than 34.00 kWp). Thus, the entered DC-to-AC ratio in the Aladdin simulation is computed as 34.20 kWac ÷ 30.00 kWp = 1.1400). This value (1.14) is then retained in all other main simulations (the term “main simulations” here refers to the simulations dedicated to obtaining data for the seven Omani cities, not for benchmarking in the Turkish site of Salihli). ** This inverter efficiency was estimated from the external study for the bifacial benchmarking cases, as the quotient of dividing 65,038 kWh (AC output energy from the inverter stage, available for addition into the grid) by 66,229 kWh (DC output energy from the PV array). This quotient is 0.9820. In Aladdin, the resolution that could be recognized as a user’s input value for this parameter was 0.01 (two digits after the decimal point). Thus, the value of 0.98 (rather than 0.9820) was used after rounding to two decimal places. Although for real-world inverters, a DC-to-AC conversion efficiency of 98% may look high [271,272], it is still achievable with modern transformer-less inverters [273,274]. Such a high (but still realistic) value had to be adopted for consistency with the benchmarking case. In Aladdin, this efficiency remains constant during the simulation. *** In the external study for the bifacial benchmarking cases, the bifacial module was GG1H-425 Bifacial PERC-72 by the Turkish PV manufacturer GTC. This exact type was not available in the online energy modeling software “Aladdin” at the time of conducting this study. Thus, an alternative model was used with proper adjustments in the number of PV panels and DC-to-AC ratio to make the modeled bifacial PV system equivalent to the one in the external study. **** This choice of the PV module type (JKM300M-60) allows us to construct a reference monofacial PV system with the exact DC power capacity of the bifacial system (given that: 10 modules × 450 Wp “bifacial” = 15 modules × 300 Wp “monofacial”). Also, the use of the same manufacturer (Jinko Solar) for this modeled monofacial module and the modeled bifacial module (JKM450M-72HLM-BDVP) is encouraged for better consistency. Figure 17 shows a three-dimensional view of the single-row 4.5 kWp bifacial system and the single-row 4.5 kWp monofacial system as modeled in Aladdin. This figure corresponds to the geographical location of Muscat, and to the solar noon [275,276] (when the sun is at its highest elevation in the sky) of 21 June, as an extreme summer day occurring during the summer solstice (estival solstice or aestival solstice) in the northern hemisphere with the sunshine hours being maximum during the year [277,278]. Figure 18 provides a similar three-dimensional view for the two single-row PV systems, but in an extreme winter day (21 December) belonging to the winter solstice (hibernal solstice) with the sunshine hours being minimum during the year [279,280] in the northern hemisphere, at 9 am solar morning (thus, three hours before the solar noon). Figure 19 is another three-dimensional view of the two single-row 4.5 kWp PV systems together (the monofacial and the bifacial), focusing on the layout of the PV modules within each PV system. These views show how well optical effects are captured in Aladdin, such as the dynamic changes in the shadows, and the natural illumination by the sunlight and its visual reflection.
Table 4.
Additional specific modeling settings for the benchmarking case.
| Characteristics | Used value |
|---|---|
| Location | Caferbey (community/village), Salihli (municipality/district), Manisa (province), Turkey |
| Latitude (degree, minute, second – DMS) | N 38°28’38” |
| Longitude (degree, minute, second – DMS) | E 28°5’50” |
| Latitude (decimal degree – DD) | 38.4772° N |
| Longitude (decimal degree – DD) | 28.0972° E |
| Tilt | 30° (year-round optimum) |
| Azimuth angle | 180° from north (0° from south) |
| Row-to-row spacing (inter-row spacing, or array pitch) | 5 m |
| PV nameplate power capacity | 34.2 kWp (In the external study, 80 bifacial modules “GG1H-425 Bifacial PERC-72” by the Turkish PV manufacturer GTC were modeled in PVsyst; thus, the nominal PV power was 34.00 kWp. Here, the modeled nominal PV power in Aladdin is 34.20 kWp, as 76 modules with 0.450 kWp each.) |
| Inverter nameplate power capacity | 30 kWac (In the external study, this is obtained as: 34.00 kWp ÷ 1.1333; here, it is obtained as: 34.20 kWp ÷ 1.1400.) |
| Number of rows of PV array | 4 (In the external study, 20 PV modules are stacked horizontally in each row; here, 19 PV modules are stacked horizontally in each row.) |
| Albedo | 0.30 (for the low-albedo simulation) 0.65 (for the high-albedo simulation) |
Table 5.
Assessed deviation between the predicted annual electric yield from a 30 kWac bifacial system in the bifacial benchmarking case.
Table 5.
Assessed deviation between the predicted annual electric yield from a 30 kWac bifacial system in the bifacial benchmarking case.
| Albedo | Total annual electric yield (using Aladdin) | Total annual electric yield (external study) | Difference in total electric yield (Aladdin value – external value) | Averaged total electric yield | Relative deviation (difference ÷ average) × 100% |
|---|---|---|---|---|---|
| 0.30 | 60,405.78 kWh/year | 60,600 kWh/year | –194.22 kWh/year | 60,502.89 kWh/year | –0.32% |
| 0.65 | 65,332.24 kWh/year | 65,038 kWh/year | 294.24 kWh/year | 65,185.12 kWh/year | 0.45% |
Table 6.
Approximate national (Oman) monthly (per-month) specific yield with monofacial PV modules (expressed in kWh/kWp/month).
Table 6.
Approximate national (Oman) monthly (per-month) specific yield with monofacial PV modules (expressed in kWh/kWp/month).
| Jan | Feb | Mar | Apr | May | Jun | Jul | Aug | Sep | Oct | Nov | Dec | Average |
| 142.3 | 139.3 | 151.4 | 154.4 | 167.5 | 152.3 | 140.4 | 149.0 | 161.8 | 170.3 | 154.8 | 138.3 | 151.8 |
Table 7.
Approximate national (Oman) monthly specific yield with bifacial PV modules and a low albedo of 0.30 (kWh/kWp/month).
Table 7.
Approximate national (Oman) monthly specific yield with bifacial PV modules and a low albedo of 0.30 (kWh/kWp/month).
| Jan | Feb | Mar | Apr | May | Jun | Jul | Aug | Sep | Oct | Nov | Dec | Average |
| 150.6 | 147.4 | 160.8 | 165.9 | 182.4 | 166.7 | 152.6 | 159.7 | 171.8 | 180.4 | 164.1 | 146.7 | 162.4 |
Table 8.
Approximate national (Oman) monthly (per-month) specific yield with bifacial PV modules and a high albedo of 0.65 (kWh/kWp/month).
Table 8.
Approximate national (Oman) monthly (per-month) specific yield with bifacial PV modules and a high albedo of 0.65 (kWh/kWp/month).
| Jan | Feb | Mar | Apr | May | Jun | Jul | Aug | Sep | Oct | Nov | Dec | Average |
| 161.0 | 157.4 | 172.2 | 178.9 | 198.3 | 181.7 | 165.5 | 171.6 | 183.5 | 192.4 | 175.4 | 157.1 | 174.6 |
Disclaimer/Publisher’s Note: The statements, opinions and data contained in all publications are solely those of the individual author(s) and contributor(s) and not of MDPI and/or the editor(s). MDPI and/or the editor(s) disclaim responsibility for any injury to people or property resulting from any ideas, methods, instructions or products referred to in the content. |
© 2025 by the authors. Licensee MDPI, Basel, Switzerland. This article is an open access article distributed under the terms and conditions of the Creative Commons Attribution (CC BY) license (http://creativecommons.org/licenses/by/4.0/).
Copyright: This open access article is published under a Creative Commons CC BY 4.0 license, which permit the free download, distribution, and reuse, provided that the author and preprint are cited in any reuse.


