
Submitted:
22 October 2025
Posted:
23 October 2025
You are already at the latest version
Abstract
High-Intensity Laser Therapy (HILT) differs from Low-Level (LLLT) and High-Power Laser Therapy (HPLT) by adding a photoacoustic component to photochemical and photothermal effects. High-peak, short-pulse emission generates pressure waves > 10 kPa in water (27 °C) and ~100 kPa in vivo—sufficient to trigger mechanotransduction and differentiation. These waves propagate like ultrasound, enabling regenerative effects centimeters deep, beyond optical limits. We introduce Pulse Energy Dose (PED) as a practical metric for determining whether a laser exceeds the photomechanical threshold while remaining in the thermoelastic regime. Only systems with kilowatt-range peak power, microsecond pulses, high pulse energy (hundreds of mJ/cm² to several J/cm²), and very low duty cycles (<1%) consistently produce therapeutic pressure waves. PED is validated against the Margheri equation, showing strong correlation across lasers. We define lower and upper operating bounds that separate true HILT from HPLT devices that rely on heat and cannot elicit meaningful photoacoustic stimulation. This classification corrects misleading nomenclature based on average power and guides parameter selection to preserve thermoelastic safety while maximizing mechanotransductive efficacy. The findings have practical implications for musculoskeletal and dental indications, including cartilage regeneration, bone healing, temporomandibular joint therapy, and deep-tissue repair, and provide a basis for protocol optimization and device evaluation.
Keywords:
high-intensity laser therapy
; pulse energy dose
; photoacoustic effects
; thermoelastic regime
; regenerative medicine
1. Introduction
The therapeutic use of light in biology was first explored in the 1960s, when Endre Mester observed accelerated tissue regeneration following low-level laser exposure, Mester & Mester [1]. This pioneering discovery laid the foundation for photobiomodulation (PBM), later advanced by Tina Karu [2], who demonstrated that Cytochrome C oxidase absorbs Red and Near-Infrared (NIR) light, enhancing ATP production and triggering intracellular signaling cascades, such as PI3K/AKT and ERK/MAPK.
Subsequent work by Turrner and Hode [3] emphasized the relevance of wavelength, fluence, and pulse structure in determining therapeutic outcomes. More recently, in vitro studies, Sleep et al. [4], confirmed the biphasic response of cells to light: moderate energy doses (~5.3 J/cm²) upregulate mitochondrial and osteogenic activity, while excessive exposure (>10 J/cm²) may inhibit these effects—especially when mechanical stimulation is absent.
Laser–tissue interactions occur through three primary biophysical mechanisms:
Photochemical effects, typical of LLLT, modulate mitochondrial function and inflammatory mediators, Lawrence & Sorra [5].
Photothermal effects, predominant in HPLT, convert light into heat, promote vasodilation, Extracellular Matrix (ECM) remodeling, and transient analgesia (Cronshaw et al. [6]; Zhang et al. [7]; Orchardson et al. [8]; Alayat et al. [9]), along with immunomodulation (Mikhaylov et al. [10], Alghitany et al. [11]). However, if not carefully dosed, thermal stress may occur.
Photoacoustic effects, exclusive to HILT, result from high-peak, short-duration pulses generating acoustic pressure waves. These waves activate mechanotransduction via tyrosine kinase signaling, Tarantino et al. [12], and cytoskeletal remodeling, Monici et al. [13], Cialdai et al. [14] and promote fibrocyte-to-fibroblast conversion [15,16], key steps in tissue repair.
Preclinical and clinical studies [17,18,19,20] show that HILT promotes deep tissue regeneration, requiring pressure waves exceeding 10 kPa in water at 27 °C. Given the higher absorption coefficients in vivo, Salomatina et al. [21], this threshold rises to ~100 kPa, consistent with mechanical stimuli used in hypergravity studies (Monici [13], Cialdai [14], Bosco [22], Cheng [23], De Cesari [24], Genchi [25]).
Although the Margheri equation [26] accurately models these effects, its complexity limits clinical utility. Therefore, we propose the Pulse Energy Dose (PED), a simplified, yet biophysically sound parameter derived from the Pulse Intensity Fluence (PIF) model, Fortuna & Masotti [27], to evaluate whether a laser system can generate therapeutic pressure waves.
This study introduces PED as the basis of a new mechanism-based classification of therapeutic lasers, distinguishing true HILT from conventional systems by their ability to exceed photoacoustic thresholds within the thermoelastic regime.
1.1. Laser Systems Classification
Laser therapy systems can be classified into three primary categories based on their average power output and predominant biological effects: Low-Level Laser Therapy (LLLT), High-Power Laser Therapy (HPLT), and High-Intensity Laser Therapy (HILT).
LLLT operates at average powers below 1 W and induces photochemical effects. It is typically used for superficial conditions, where low-energy photons modulate mitochondrial activity and inflammatory mediators without causing significant heating or mechanical stress.
HPLT systems deliver average powers above 1 W, often ranging between 5 and 20 W. These devices combine photochemical and photothermal effects, promoting vasodilation, extracellular matrix (ECM) remodeling, and analgesia. However, they generally lack the pulsed structure necessary to generate photoacoustic pressure waves. HILT systems are designed to achieve a triple mechanism of action, photochemical, photothermal, and photoacoustic, thanks to high-peak power, short-duration pulses, and low duty cycles. HILT uniquely generates acoustic pressure waves exceeding 10 kPa, which are essential for initiating mechano-transduction and regenerative biological responses. These pressure waves propagate through tissues in a manner like ultrasound, enabling therapeutic effects several centimeters deep, far beyond the optical penetration of laser light.
To properly define HILT’s operational range, it is essential to consider Markolf Niemz’s classification of laser-tissue interactions [28]. His model categorizes laser effects into five major domains based on energy density, power density, and pulse duration, as illustrated in Figure 1:
Photochemical effects – Occurring at power densities below 1 W/cm² and exposure times above 10⁻³ seconds, these low-energy interactions modulate biochemical reactions without causing significant thermal or mechanical impact.
Photothermal effects – Found in the range of 1 W/cm² to 10⁶ W/cm², with exposure times between 10⁻⁶ and 10⁰ seconds. This domain involves energy absorption that induces controlled heating, collagen remodeling, and vascular effects.
Photo-ablative effects – Ranging between 10⁶ and 10⁹ W/cm², with exposure times around the nanosecond scale (10⁻⁹ s). This effect is characterized by tissue removal through vaporization, as seen in precise surgical applications.
Photo-disruptive effects – Occurring at power densities exceeding 10⁹ W/cm² and exposure times below 10⁻⁹ seconds. At this threshold, laser-generated pressure waves lead to tissue fragmentation and micro-cavitation, transitioning into mechanical disruption.
Plasma-induced ablation – Present at extreme power densities (>10¹² W/cm²) and ultrashort pulse durations (femtosecond to nanosecond range), commonly associated with surgical and ablative laser applications (e.g., CO₂, Ho:YAG, Er:YAG lasers).
The thermoelastic domain, positioned below the photo-ablative threshold, encompasses both the photochemical and photothermal regimes. This domain represents the biological boundary of HILT, ensuring that laser-generated stress waves stimulate tissue regeneration without destructive effects. HILT operates within this thermoelastic regime, where controlled stress waves induce mechano-transduction without causing permanent tissue disruption. To maintain this non-invasive therapeutic effect, the power density must remain below 10⁶ W/cm² for pulse durations in the microsecond (µs) range, effectively preventing the transition into ablative or disruptive effects.
Furthermore, the Energy Dose (J/cm³) in vivo, which quantifies the volumetric energy distribution, is derived from the fluence (J/cm2) and the effective penetration depth (deff ). Given that at l = 1064 nm, the skin absorption coefficient in vivo is approximately a = 1.48 cm-1 (one order of magnitude higher than in water [22]), the penetration depth can be estimated as:
Thus, for a fluence of 1,000 J/cm², the Energy Dose is:
This confirms that HILT operates within an Energy Dose range of approximately 1.47 to 1,479 J/cm³, depending on the applied fluence and tissue absorption characteristics, ensuring deep, yet controlled, bio-stimulation.
In contrast, surgical lasers such as CO₂, Ho:YAG (2,100 nm), and Er:YAG (2,940 nm) operate within the photoablation and plasma-induced ablation domains, where energy densities and pressure waves exceed the thermoelastic limit. These lasers generate pressure waves exceeding millions of kPa, leading to immediate tissue fragmentation rather than controlled regenerative stimulation. The extreme power densities in these systems result in rapid energy deposition over very short pulse durations, transitioning into nonlinear effects such as plasma formation and explosive ablation, far beyond the regenerative capabilities of the thermoelastic regime.
1.2. Theoretical Foundations of HILT-Induced Pressure Waves
The ability of HILT to induce mechano-transduction stems from the generation of pressure waves, a phenomenon governed by thermoelastic effects. Foundational studies in photo-acoustics by Oraevsky et al. [29,30], along with the theoretical framework described by Wang and Wu [31] in Biomedical Optics, established the key role of pressure waves in laser–tissue interactions. Building on this foundation, Yao et al. [32] demonstrated that, for ultra-short pulses (<1 µs), pressure wave amplitude depends primarily on fluence. In contrast, in the 10–300 µs pulse range, typical of HILT, the amplitude is influenced by both fluence and laser intensity at the tissue interaction site. This dual dependence is a hallmark of HILT.
Further expanding on these principles, Esenaliev et al. [33] confirmed that pressure waves generated under thermoelastic conditions are directly proportional to laser fluence and the optical absorption coefficient of the tissue, with the Grüneisen parameter serving as a scaling factor. This relationship is mathematically described by the thermoelastic photoacoustic pressure equation:
where:
- -
- P is the peak pressure (Pa),
- -
- Γ is the Grüneisen parameter,
- -
- μₐ is the optical absorption coefficient (cm-1)
- -
- F₀ is the laser fluence (J/cm²).
This equation highlights the direct proportionality between peak pressure and both optical absorption and fluence, with the Grüneisen parameter serving as a scaling factor.
These findings reinforce that HILT remains within the thermoelastic domain, as defined by Niemz [24], where pressure waves stimulate cellular responses without exceeding the threshold for photodisruptive effects. Unlike surgical lasers (CO₂, Ho:YAG, Er:YAG), which operate in the photodisruptive and plasma-induced ablation domains, HILT preserves tissue integrity while activating regenerative pathways.
While the Margheri equation [26] provides a precise analytical method for calculating pressure waves in laser-tissue interactions, its complexity limits clinical applicability. To address this limitation, we propose the Pulse Energy Dose (PED): a simplified yet effective alternative for assessing laser-induced pressure waves and ensuring that HILT systems operate safely within the thermoelastic window.
1.3. Margheri Equation and Analytical Pressure Wave Modeling
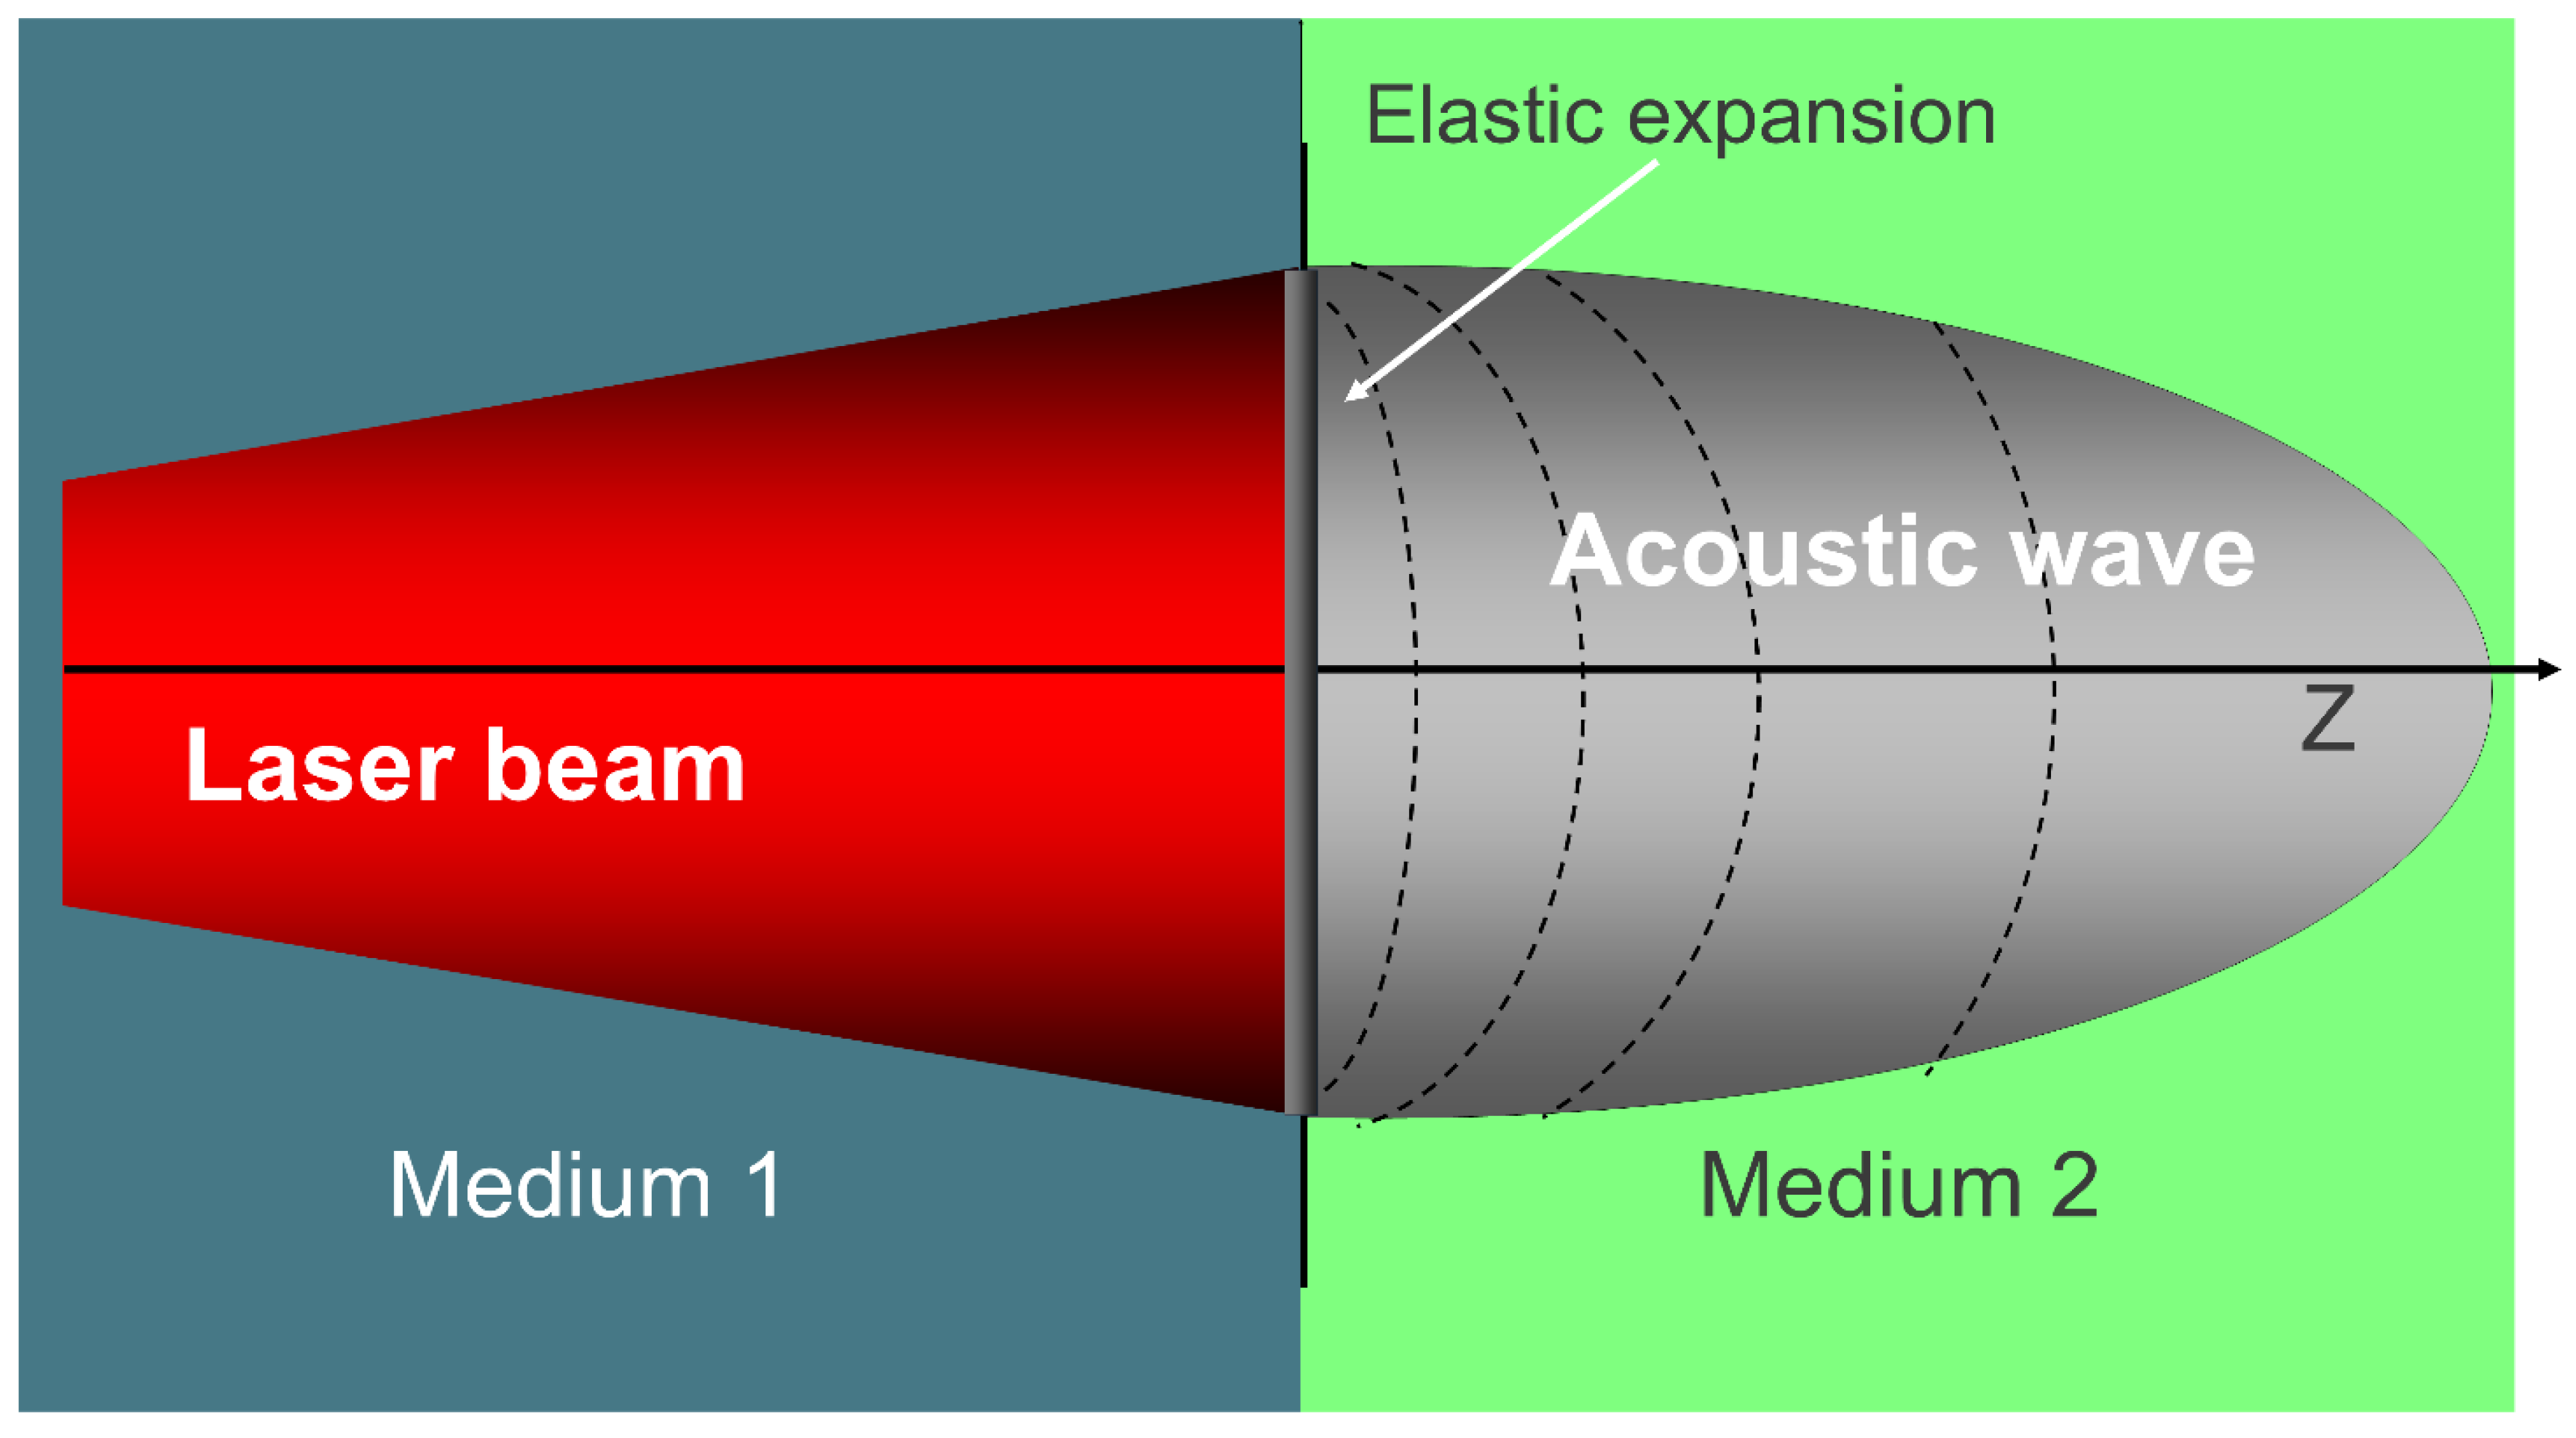
One of the key physical phenomena underlying HILT is the generation of pressure waves at the interface between air (Medium 1) and biological tissue (Medium 2). When a pulsed laser beam enters the target medium, it triggers an elastic expansion that gives rise to a pressure wave, propagating from the surface into the tissue. As illustrated in Figure 3, this transition generates an acoustic wave essential to HILT mechanisms.
The amplitude of this wave, which is critical in initiating both photomechanical and mechano-transductive responses, depends on laser parameters and the thermophysical properties of the tissue.
The most accurate theoretical model for calculating the amplitude of laser-induced pressure waves in a biological medium is provided by Margheri [26]. His equation integrates both laser settings and tissue-specific parameters:
where I is the peak intensity of the laser, v is the speed of sound in the medium, and the terms a (absorption coefficient), r (density), K (thermal conductivity), and c (specific heat) describe the intrinsic thermophysical properties of the irradiated medium.
Figure 2.
Photomechanical effect: a laser beam transitions from Medium 1 to Medium 2, generating an acoustic wave through elastic expansion, key in HILT mechanisms.
Figure 2.
Photomechanical effect: a laser beam transitions from Medium 1 to Medium 2, generating an acoustic wave through elastic expansion, key in HILT mechanisms.
While Margheri’s model offers high theoretical accuracy, its clinical applicability is limited by the need for input parameters, such as thermal conductivity, specific heat, and tissue density, that, although well documented in biophysical literature, are rarely accessible to clinicians in real-world settings. To overcome this limitation, we introduce the Pulse Energy Dose (PED), a simplified yet robust metric based on Niemz’s definition [28] and conceptually derived from the PIF model proposed by Fortuna and Masotti [27], providing a more practical tool for estimating HILT-induced pressure waves in therapeutic contexts.
1.4. Biological Effects of HILT and Mechano-Transduction
Mechanical pressure plays a fundamental role in cellular adaptation and tissue regeneration, not only in laser applications, but also in hypergravity and mechanical loading models. Studies have shown that pressure levels in the 10–800 kPa range drive key biological processes, including cell differentiation, extracellular matrix (ECM) remodeling, and angiogenesis. These findings underscore the physiological relevance of HILT-induced pressure waves in regenerative medicine.
Monici [13], Cialdai [14], Bosco [15], Cheng [23], De Cesari [24], and Genchi [25] have demonstrated that biological responses to mechanical forces emerge at pressures as low as 10 kPa (1G) but become significantly more pronounced at 100–800 kPa (10–80G). This range closely aligns closely with the Grüneisen parameter threshold (2–8 bar, 200–800 kPa) for efficient photoacoustic stimulation in biological tissues.
For example, De Cesari et al. [24] observed that exposure to hypergravity levels of ≥4G (39.2 kPa) significantly enhanced angiogenesis, cell motility, and ECM remodeling in endothelial cells. Genchi et al. [25] further showed that extreme hypergravity conditions (150G; 1,471.5 kPa) accelerate neurogenesis and neurite outgrowth, confirming the mechano-sensitivity of neuronal cells.
To contextualize these findings, it is useful to convert gravitational force into pressure using the hydrostatic equation:
where p is pressure (Pa), ρ is fluid density (kg/m³), g is gravitational acceleration (9.81 m/s²), and h is the fluid column height (m). In water (r = 1000 kg/m³), 1G corresponds to ~9.81 kPa. As explained in The Feynman Lectures on Physics [34], pressure is a fundamental mechanical quantity that governs the behavior of matter in both static and dynamic systems.
To convert any G value to pressure in kPa, we use:
This simple formula allows us to express hyper-gravity levels in terms of pressure, making it easier to interpret their effects in various applications.
The table below summarizes the relationship between pressure levels and biological responses across different studies. In biological systems, pressure is increasingly recognized as a critical mediator of cellular responses to external forces.
1.5. HILT vs. HPLT: the Need for a Distinct Classification
While High-Power Laser Therapy (HPLT) and High-Intensity Laser Therapy (HILT) are often used interchangeably in marketing and clinical contexts, this conflation is both scientifically and therapeutically misleading. Although both systems operate at average powers exceeding 1 W, their biophysical mechanisms of action are fundamentally different.
HPLT systems typically emit continuous or chopped beams with duty cycles >50%. Their therapeutic effects rely primarily on photothermal mechanisms, such as vasodilation, transient analgesia, myorelaxation, increased microcirculation, and mild tissue heating. However, they lack the ability to generate pressure waves capable of activating mechano-transduction pathways.
In contrast, HILT systems are characterized by:
- -
- Peak powers in the kilowatt range,
- -
- Pulse durations between 10–300 μs,
- -
- Pulse energy densities of several hundred mJ/cm² to >1 J/cm²,
- -
- Very low duty cycles (typically <1%).
These parameters enable the generation of photoacoustic pressure waves that exceed the 10–100 kPa threshold required to stimulate biological responses associated with mechanical signaling.

Table 1.
Biological effects of different mechanical pressures (gravity- and laser-induced) on various target tissues.
Table 1.
Biological effects of different mechanical pressures (gravity- and laser-induced) on various target tissues.
| Gravity (G) | Pressure (kPa) | Authors | Biological Effect | Target Tissue |
| 1.1G | 10.79 kPa | Bosco et al. [22] | Neuromuscular adaptation | Leg extensor muscles |
| 2G | 19.62 kPa | Bioeffects of Microgravity Cheng et al., [23] | Increased bone density | Bone |
| 4G | 39.24 kPa | De Cesari et al. [24] | Pro-angiogenic activation | Endothelial cells (HMEC-1) |
| 10G | 98.1 kPa | Monici et al. [13] | ECM remodeling and mechanotransduction | Fibroblasts, chondrocytes, endothelial cells |
| 20G | 196.2 kPa | De Cesari et al. [24] | Vascular stimulation and coagulation regulation | Vascular endothelium |
| 50G | 490.5 kPa | Genchi et al. [14] | Accelerated neurogenesis | PC12 neuronal cells |
| 150G | 1,471.5 kPa | Genchi et al. [14] | Enhanced neurite outgrowth and differentiation | PC12 neuronal cells |
| 200-800 kPa | 2-8 bar | Yao [32] | Pressure wave generation in laser therapy (Grüneisen parameter) | Laser-irradiated biological tissues |
Abbreviations: G, gravity; kPa, kilopascal; ECM, extracellular matrix; HMEC-1, human microvascular endothelial cells. The table summarizes the relationship between pressure levels and biological responses across different studies. The pressures induced by HILT (10–800 kPa) align closely with those observed in hypergravity experiments, where mechanical stimuli promote angiogenesis, ECM remodeling, neurogenesis, and tissue regeneration.
The sharp acoustic gradients produced by such pulses activate mechanosensitive ion channels, cytoskeletal remodeling, and fibroblast conversion, effects that are absent in HPLT treatments.
Despite this, many manufacturers market high-average-power diode lasers as HILT systems, even though their emission parameters are clearly of the HPLT category. This practice creates confusion and risks misapplication in clinical settings, particularly when treating deep or degenerative conditions that require photomechanical stimulation for efficacy.
A precise classification based on biophysical thresholds, rather than average power, should therefore guide both research and clinical protocols. The Pulse Energy Dose (PED) model introduced in this study addresses this gap by offering a simplified, yet mechanism-specific, metric for identifying true HILT systems.
1.6. Scope of the Study
While the Margheri equation [26] provides a precise theoretical framework for calculating laser-induced pressure waves, its complexity—requiring additional biophysical parameters—limits its applicability in clinical settings. Specifically, it depends on the optical absorption coefficient, tissue density, thermal conductivity, and specific heat: values that are well known in experimental biophysics but are rarely available or considered in routine medical practice. In contrast, PED relies solely on laser usage parameters, such as fluence, frequency, and spot size, which are readily accessible to clinicians and operators.
By correlating PED-derived pressure values with biological thresholds identified in hypergravity studies, we further validate the physiological relevance of photoacoustic effects in regenerative medicine.
The specific aims of this study are to:
- -
- Establish PED as a functional tool for classifying therapeutic laser systems, ensuring that their operating parameters fall within the thermoelastic regime, which is critical for safely inducing mechano-transduction.
- -
- Define both lower and upper operational thresholds for HILT, identifying the minimum fluence and pulse structure required to generate pressure waves above 10 kPa in vitro, while avoiding the transition into photoablative or photodisruptive domains, as defined by Niemz’s classification [28].
- -
- Differentiate HILT from HPLT systems by comparing their respective capabilities to generate photoacoustic pressure waves, and by providing quantitative criteria for identifying true HILT technologies.
2. Materials and Methods
We selected several clinical lasers, surgical and therapeutic, that can be used with different parameters, representing the most common configurations available on the market and encountered in routine clinical practice, Niemz [28] and Turnér & Hode [3]. The modelled lasers are reported in Table 2, that includes wavelength (l), absorption coefficient (a), average and peak power, spot diameter, pulse repetition frequency (PRF), pulse duration (t-on), and duty cycle (%).
We modelled their behaviour by the use of Margeri’s formula and PED.
To accurately describe the pressure wave propagation in a biological medium, the equation developed by Margheri [26] provides a robust framework:
where:
- -
- I is the laser pulse intensity.
- -
- v2 is the speed of sound in the second medium.
- -
- z is the depth.
- -
- t is the time of wave propagation.
- -
- Other parameters (Ki, bi, ri α) represent the medium’s thermal, mechanical, and optical properties.
The Pulse Energy Dose (PED) is defined as:
where:
- -
- Fluence is the energy per pulse (Ep) divided by the spot area [cm2].
- -
- Penetration is given by 1/α, where a is the absorption coefficient of water, Palmer & Williams [35].
- -
- DC (Duty Cycle) is the ratio of laser pulse duration (τ-on) to the total period (Τ), expressed as a percentage.
In other words, we are evaluating fluence in relation to penetration depth and emission time.
Through further mathematical transformations, this formula can also be written as:
where:
- -
- Ip is the peak power divided by the spot area.
- -
- f is the pulse repetition frequency (Hz).
In essence, if we know the spot size, peak power, and pulse repetition frequency, we can calculate the Pulse Energy Dose (PED) in J/cm³.
We have assumed that penetration is the reciprocal of a.
The goal here is to determine whether the intensity of light is capable of generating a pressure wave greater than 10 kPa and whether this wave remains within the thermoelastic regime, ensuring its safety for therapeutic applications.
We proceeded with the calculation of both parameters: pressure wave, according to Margheri’s formula, and Pulse Energy Dose (PED). We applied the calculations to the same lasers and configurations listed in Table 3.
We then used statistical analysis to investigate the relationshp between the two Margheri’s pressure wave and PED. To quantify it, we applied Pearson’s correlation coefficient (r), which measures the linear association between two variables. The coefficient r is expressed as:
where:
Xi represents individual pressure wave values,
Yi represents corresponding PED values,
are are the mean values of pressure wave and PED, respectively.
A high positive correlation (r ≈ 1) would indicate that PED can serve as a useful surrogate metric for estimating the laser-induced pressure wave.
For better visualization, results were categorized based on the type of laser: Surgical lasers, Pulsed therapeutic lasers, Superpulsed therapeutic lasers, Chopped therapeutic lasers.
The findings were presented in a scatter plot, where the x-axis represents the pressure wave (kPa) and the y-axis represents PED (J/cm³). This visualization allowed us to assess whether the data points followed a linear trend, further supporting the reliability of PED as a proxy for estimating laser-induced pressure waves.
Following the correlation analysis, we proceeded with the validation of these results across different laser categories by assessing the consistency of the linear relationship between PED and pressure wave amplitude (kPa) within each category. For each subset (surgical, pulsed, superpulsed, chopped), we calculated the Pearson correlation coefficient (r) and verified statistical significance (p < 0.05) to confirm the robustness of the PED model as a proxy across laser types.Since this study aims to support both preclinical investigations (e.g., cell culture experiments) and clinical applications, we calculated energy dose thresholds for both in vitro and in vivo settings. This distinction reflects the different absorption dynamics and laser–tissue interactions in cellular systems versus living organisms, and helps define appropriate operating ranges for each context.
3. Results
The study reached three main results: the evidence of the correlation between pressure wave and PED; the identification of the minimum and maximum fluence as operational thresholds for inducing photomechanical effects; the determination of a clear differentiation of HPLT and HILT in terms of their ability to generate a minimum pressure wave of 10 kPa in vitro.
3.1. Correlation Between Pressure Wave and PED
Table 3 shows the pressure wave and energy dose values of the most used settings for soft tissue surgery. As observed, the values range in the millions to billions of J/cm³, which, according to Niemz’s [28] classification, corresponds to a photoablative regime or even plasma formation. These values are far beyond the thermoelastic regime, which is the one of interest for HILT (High-Intensity Laser Therapy).
To assess the relationship between the pressure wave calculated using Margheri’s formula and the Pulse Energy Dose (PED), we computed Pearson’s correlation coefficient (r) along with its statistical significance.
Figure 3.
Scatter plot showing the relationship between Pressure Wave [kPa] and Pulse Energy Dose (PED) [J/cm³] for the surgical lasers (data from Table 4).
Figure 3.
Scatter plot showing the relationship between Pressure Wave [kPa] and Pulse Energy Dose (PED) [J/cm³] for the surgical lasers (data from Table 4).
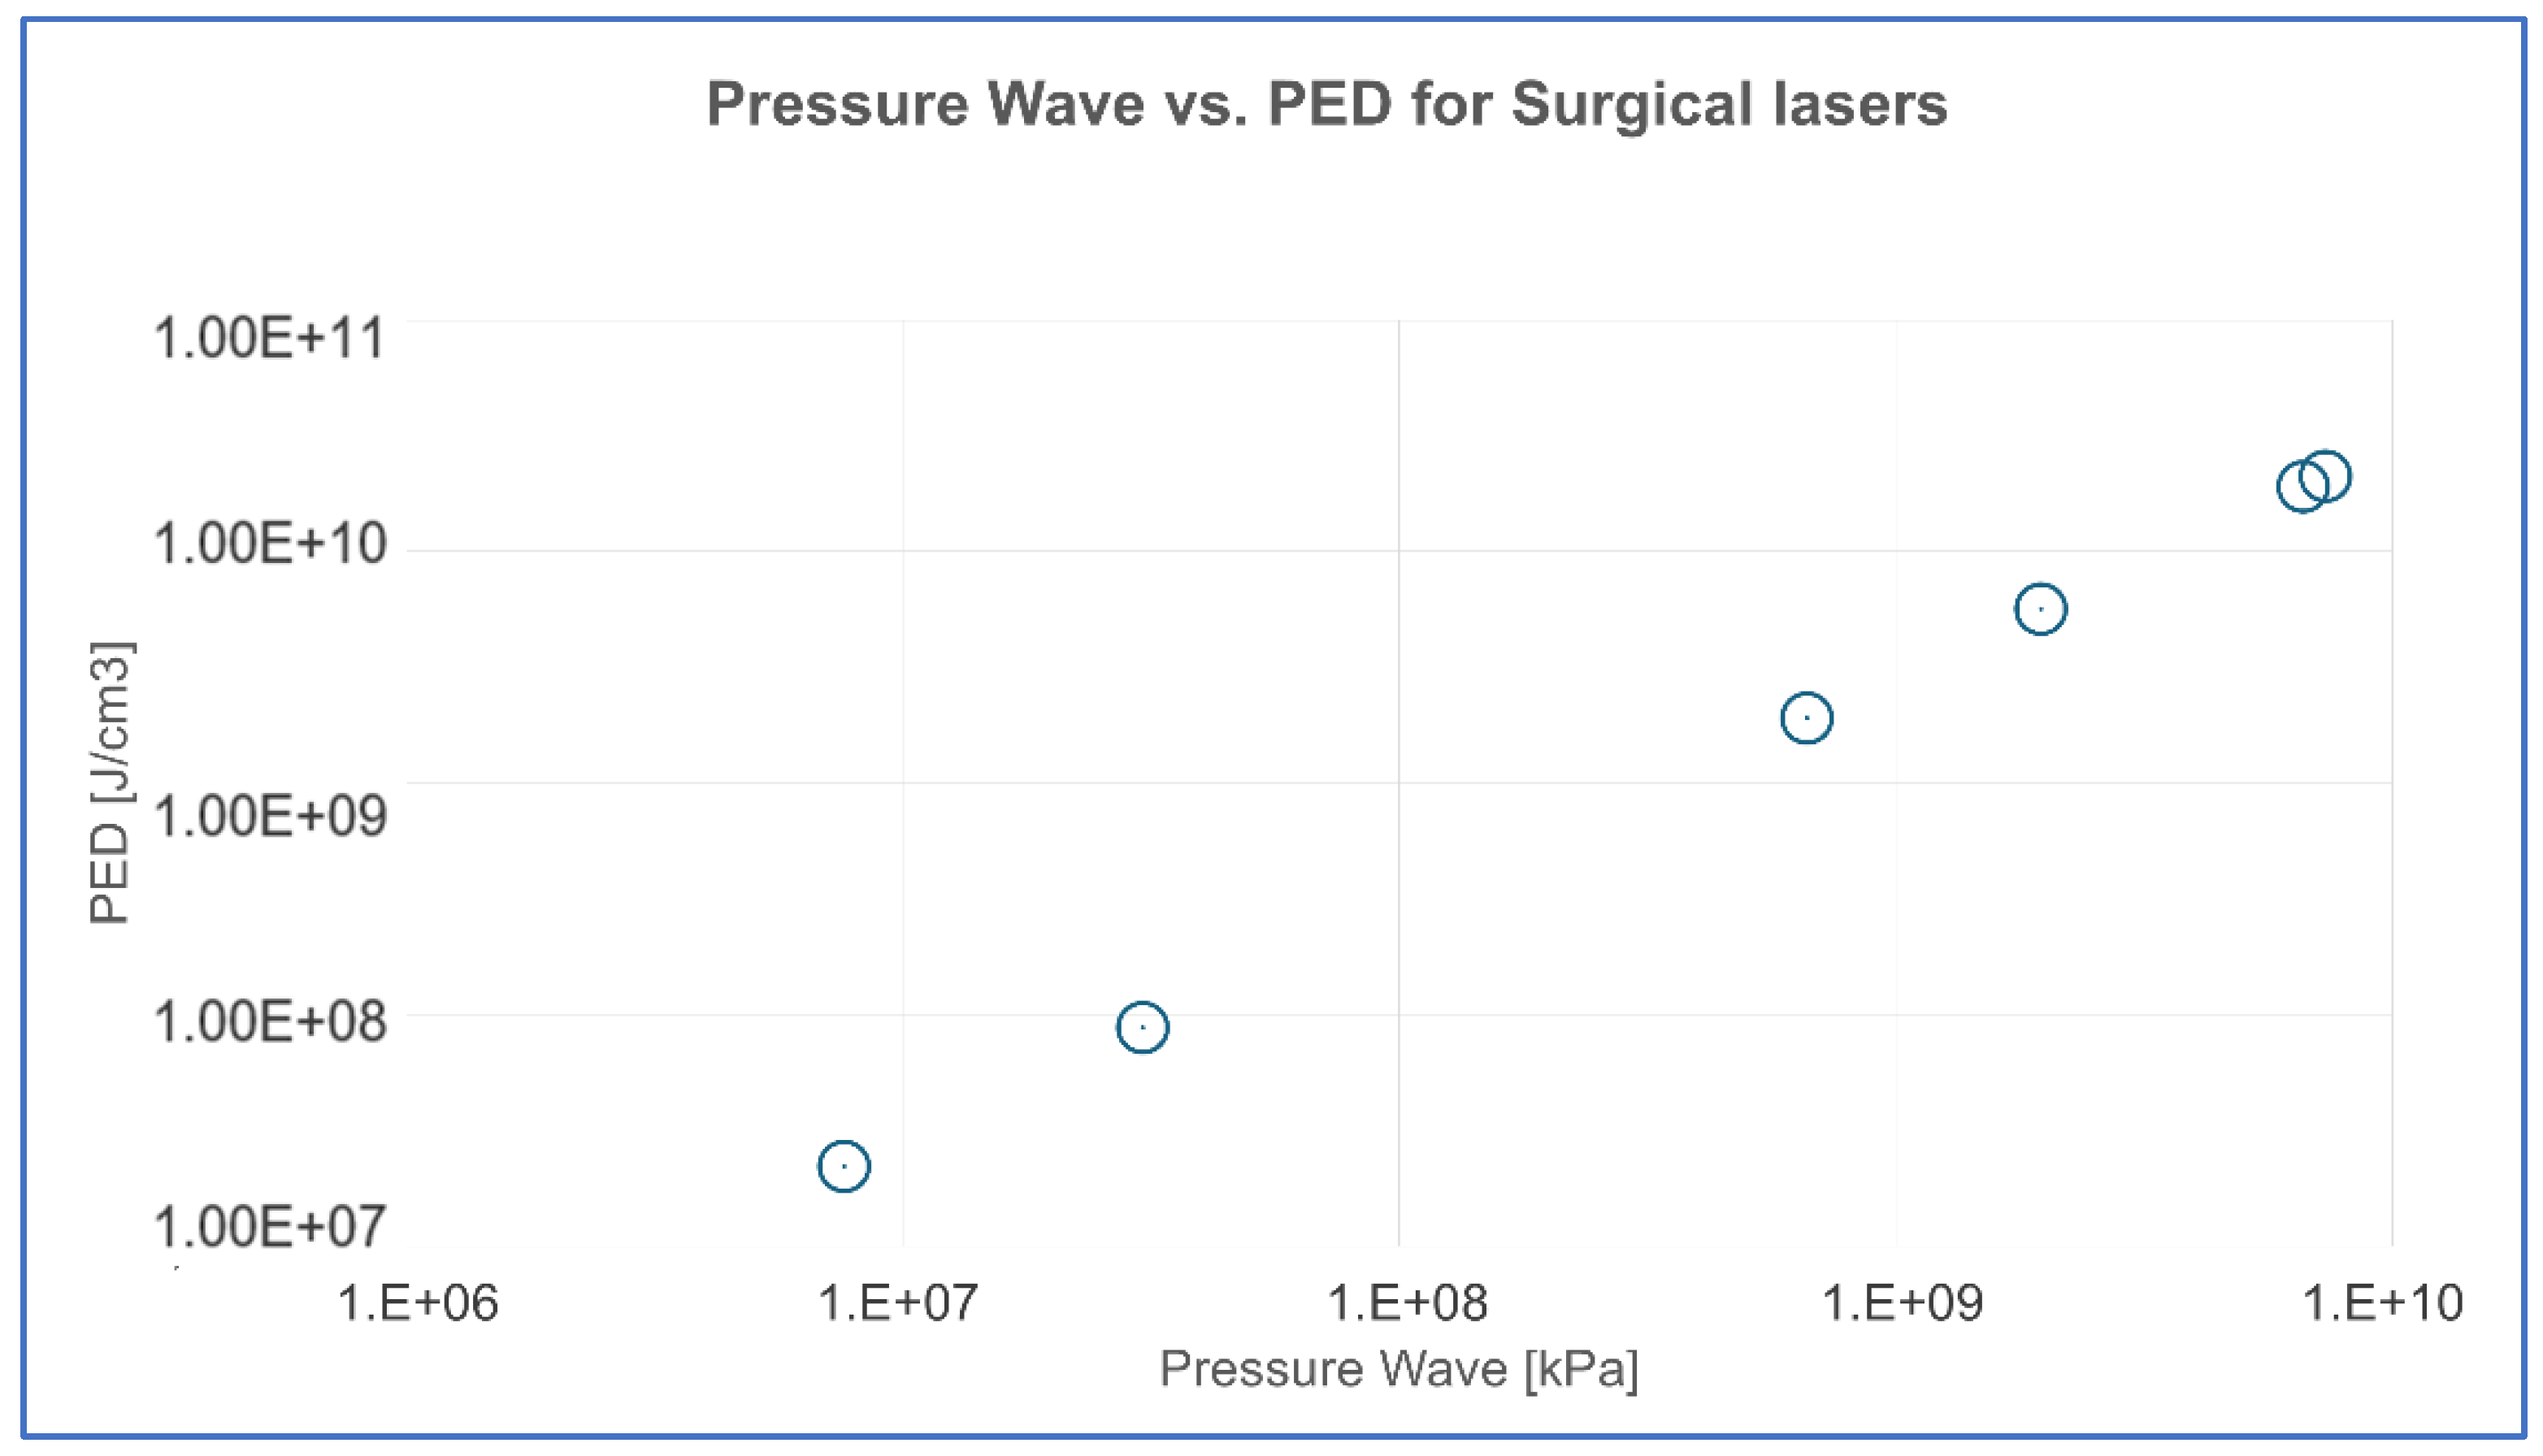
Table 4.
Statistical summary of the correlation between pressure wave and pulse energy dose (PED) in surgical lasers. Abbreviations: PED, pulse energy dose; PW, pressure wave; PED/PW, ratio between PED and pressure wave; SD, standard deviation.
Table 4.
Statistical summary of the correlation between pressure wave and pulse energy dose (PED) in surgical lasers. Abbreviations: PED, pulse energy dose; PW, pressure wave; PED/PW, ratio between PED and pressure wave; SD, standard deviation.
| Surgical Lasers | Pressure Wave [kPa] | PED [J/cm3] | PED/PW |
| Mean | 2,769,581,014 | 7,999,599,010 | 2.888378773 |
| Standard Deviation | 3,345,194,176 | 9,662,187,758 | 2.888378746 |
| Covariance | 3,23219E+19 | ||
| Pearson’s r | 1.00 | ||
| p-Value | 9.05957E-31 |
The correlation analysis between Pressure Wave [26] and PED resulted in a Pearson’s correlation coefficient of r = 1.00, indicating a perfect linear relationship between the two parameters. The associated p-value (p = 9.06×10⁻³¹) confirms that this correlation is highly statistically significant, meaning that the probability of this relationship occurring by chance is virtually zero.
Table 5 shows the pressure wave and energy dose values of the most commonly therapeutic settings used in laser therapy. As observed, the values range in J/cm³, which, according to Niemz’s [28] classification, corresponds to a thermo-elastic regime typical of therapeutic procedures.
Table 6 shows r ≈ 0.99, confirming a near-perfect linear relationship, between Pressure Wave and PED that remains extremely strong. The constant PED/PW ratio (~2.89) indicates that PED can reliably predict the pressure wave across different therapeutic laser configurations. The p-value is close to zero, ensuring that this correlation is highly statistically significant and not due to random variation.
Figure 4.
Scatter plot showing the relationship between Pressure Wave [kPa] and Pulse Energy Dose (PED) [J/cm³] for therapeutic lasers.
Figure 4.
Scatter plot showing the relationship between Pressure Wave [kPa] and Pulse Energy Dose (PED) [J/cm³] for therapeutic lasers.
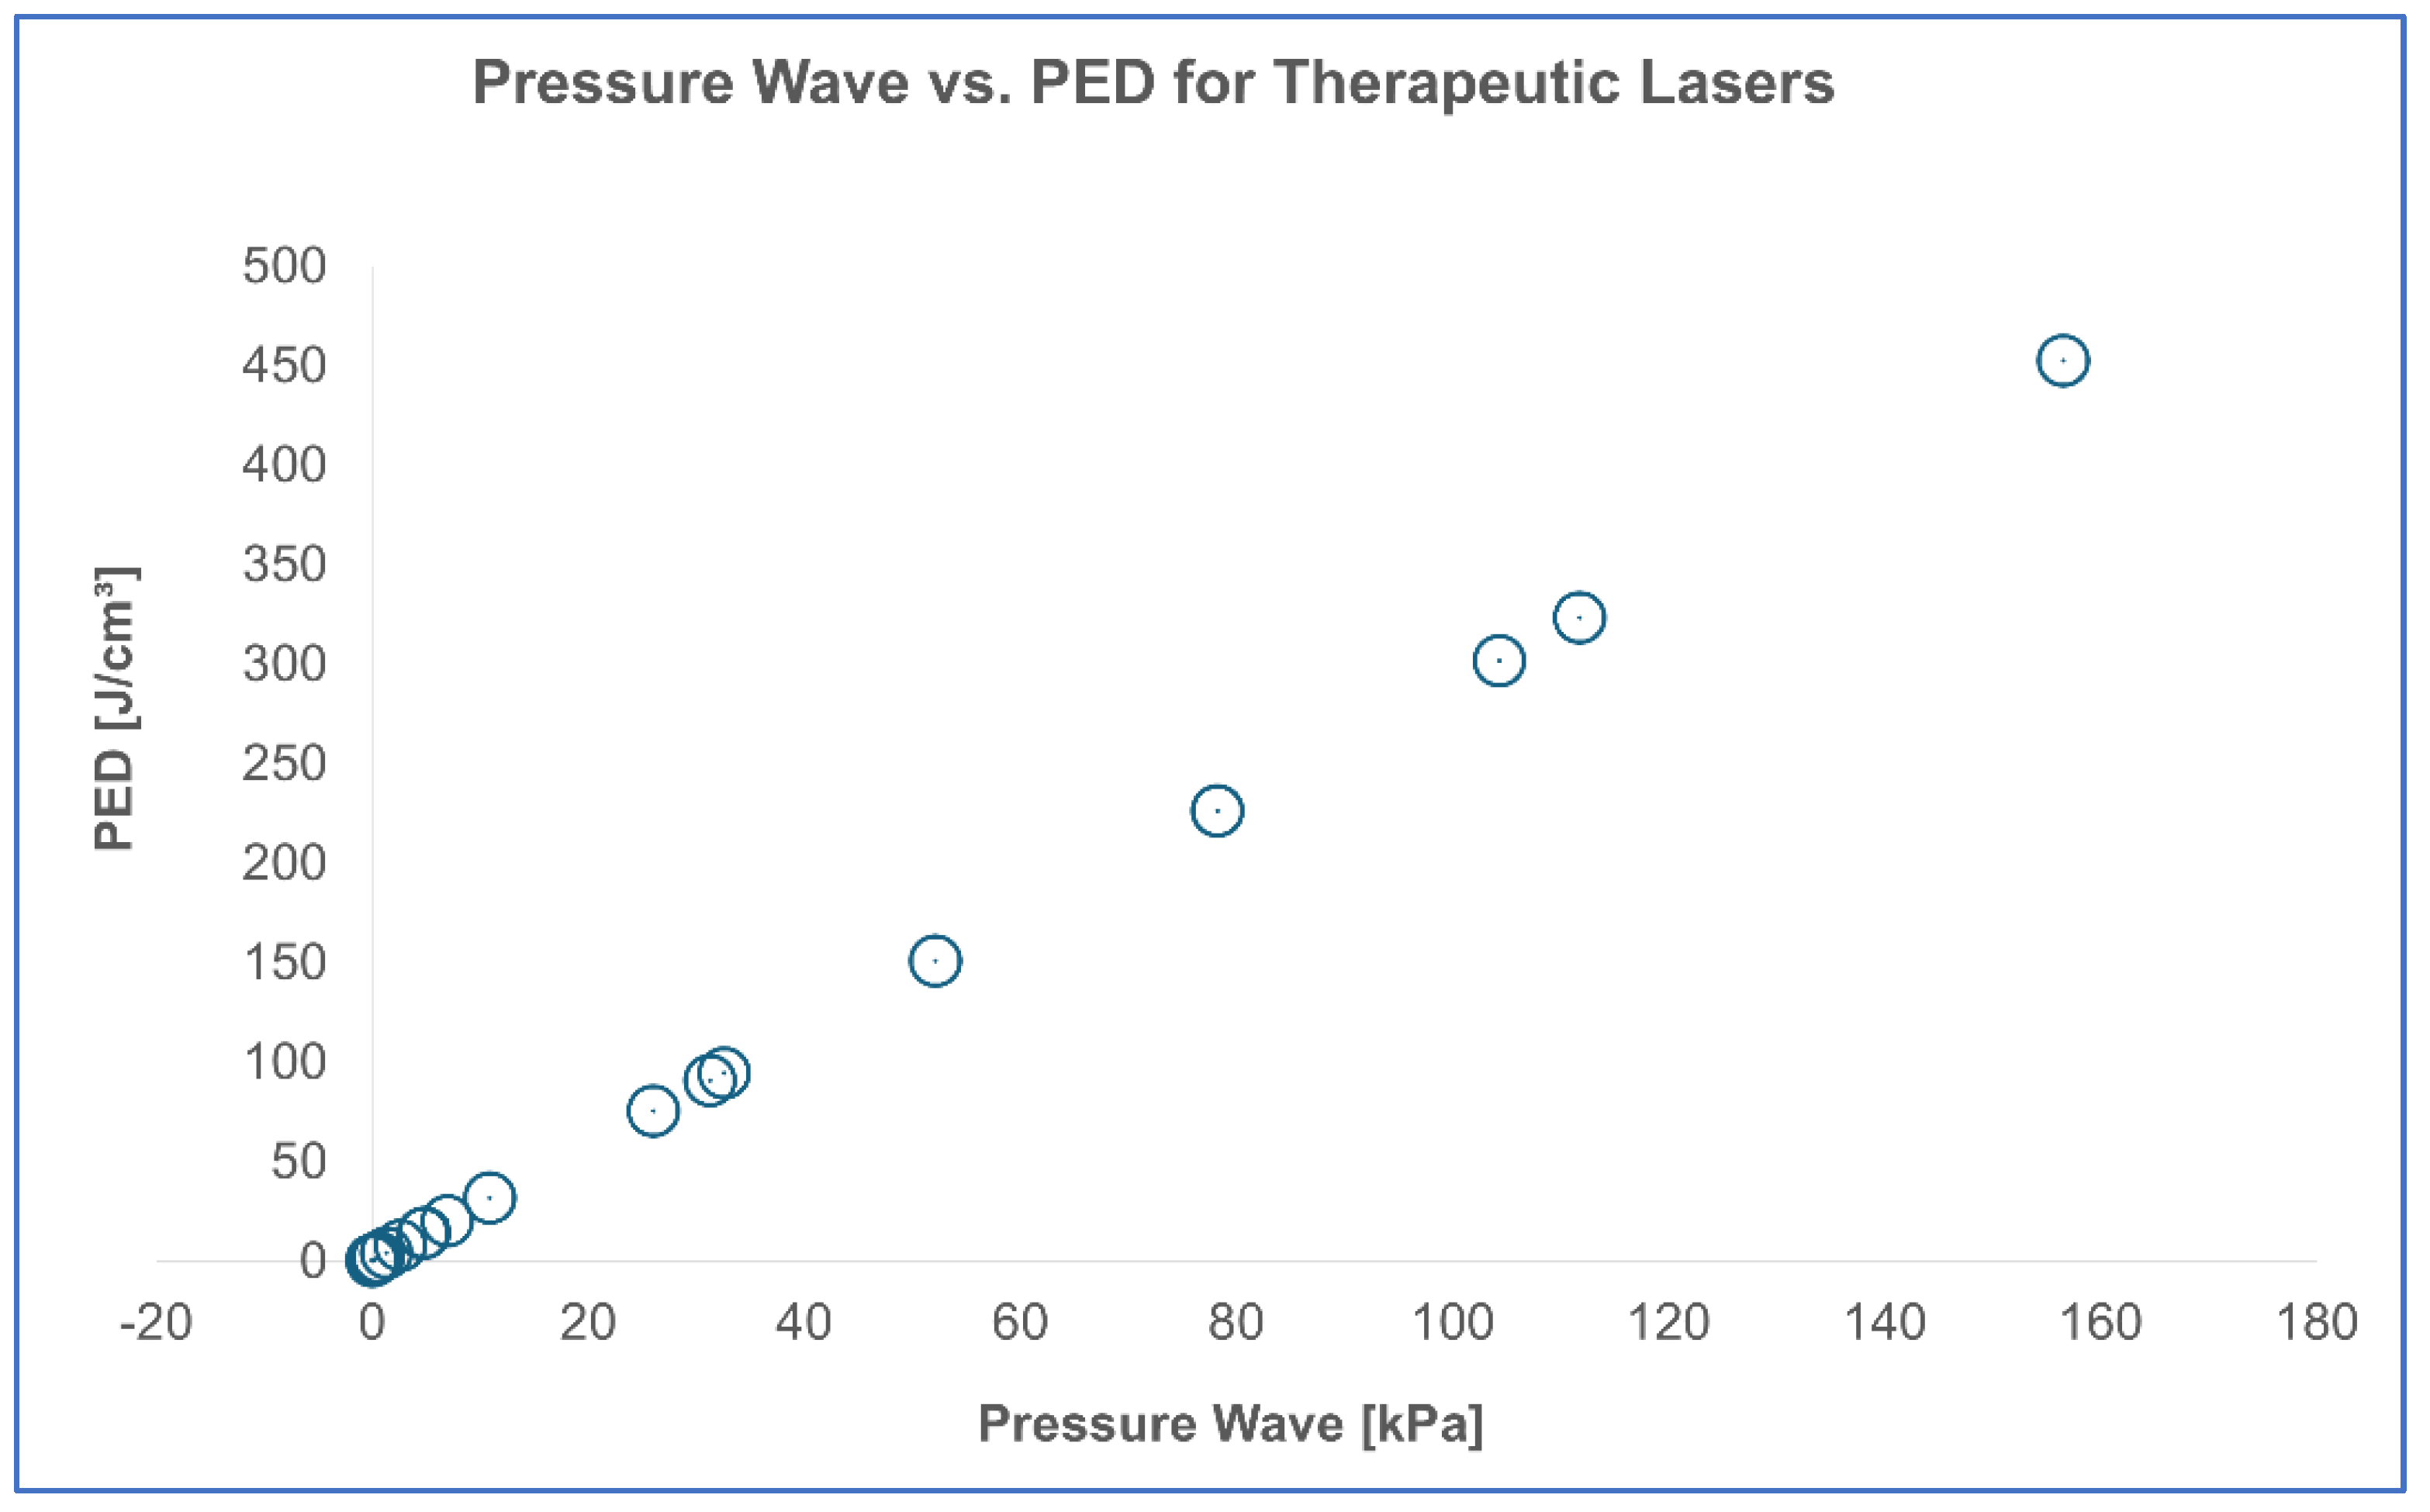
The absolute values of both Pressure Wave and PED are significantly lower, meaning that the system is within a thermoelastic regime, which is desirable for HILT applications.
The Scatter Plot illustrates the relationship between Pressure Wave [26] and PED for therapeutic lasers. The strong correlation suggests a consistent proportionality between the two variables.
3.2. Thresholds (MIN and MAX) for Photomechanical Effects
Our results indicate that a minimum Energy Dose (ED) of 30 J/cm³ is required to generate a pressure wave exceeding 10 kPa, a threshold identified as necessary for inducing significant photomechanical effects. This threshold, represented by the green band (Table 6), marks the baseline for effective photomechanical interaction.
To translate fluence (F) into Energy Dose (ED), we applied the formula:
where the depth of penetration is the reciprocal of the absorption coefficient 1/a for each wavelength (λ). This conversion allowed us to construct Table 7, which establishes the upper and lower energy dose limits for different laser wavelengths in vitro and in vivo.
Nd:YAG (1,064 nm): the maximum ED in vivo is approximately 1,480 J/cm³. Exceeding this value may lead to overstimulation. Diode lasers (980–810 nm): the upper limit ranges from 5,020 J/cm³ (980 nm) to 191 J/cm³ (810 nm). Highly absorbent wavelengths (Er:YAG - 2940 nm, CO₂ - 10,600 nm): these lasers exhibit exceptionally high ED values, exceeding practical therapeutic applications.
3.3. Compare HILT vs. HPLT Lasers Based
The data presented in Table 6 (Color-coded table) reveal the existence of three distinct laser categories:
- HILT Lasers (Green Zone) – These lasers are capable of generating pressure waves between 10 kPa and 150 kPa under common configurations.
- Transitional Lasers (Pink Zone) – While these lasers do not reach the 10 kPa threshold in vitro, they may exceed it in vivo due to higher absorption coefficients in biological tissues.
- HPLT Lasers (White Zone) – This group includes pulsed, superpulsed, and chopped lasers with varying wavelengths and spot sizes. None of these configurations reach the 10 kPa threshold, even under optimal conditions.
A quantitative analysis confirms the clear separation between HILT and HPLT systems:
- -
- Minimum Energy Dose for HILT Lasers: 31.41 J/cm³
- -
- Maximum Energy Dose for HPLT Lasers: 1.28 J/cm³
- -
- Relative Difference (Δ): 2,457% increase between HPLT max and HILT min.
- -
- Orders of Magnitude Difference: 1.39 (Log base 10).
4. Discussion
The findings of this study confirm that Pulse Energy Dose (PED) is a reliable and accessible tool for assessing a laser system’s ability to generate meaningful photomechanical effects. We propose PED as a simplified yet clinically practical alternative to the Margheri equation [26], which—although more precise in directly calculating photoacoustic pressure—is often too complex for routine clinical application. The PED formula, expressed as:
where Ip represents peak intensity [W/cm²], a is the absorption coefficient [cm⁻¹], and fis the pulse repetition frequency [Hz], allows clinicians to quickly determine whether a laser system can generate an acoustic pressure wave sufficient to induce mechanotransduction.
Contrary to the common assumption that higher average power correlates with improved therapeutic performance, our results show that not all High-Power Laser Therapy (HPLT) devices can produce effective pressure waves, even when their nominal specifications appear similar. The analysis of various systems underscores that peak power and pulse structure, not average power, are the key determinants in defining a true HILT system.
For example, a 1,064 nm pulsed laser delivering only 1.5 W of average power, but equipped with a 3,000 W peak power, 100 μs pulse duration, and 5 Hz repetition rate, can generate a pressure wave of150 kPa in water, which corresponds to approximately 1,500 kPa in vivo, based on the observation that the absorption coefficient of skin is about one order of magnitude higher than that of water, as reported by Salomatina et al. [21].
In contrast, a 10 W pulsed 1,064 nm laser with identical spot size (5 mm), but operating at 100 Hz and with a lower peak power of 1,000 W, generates only 7.5 kPa in water, well below the threshold needed for photoacoustic stimulation.
This comparison underscores a crucial aspect of HILT classification: power alone does not determine whether a laser can induce a significant biological response. Instead, the relationship between peak power, pulse duration, and repetition frequency dictates whether a system can truly qualify as High-Intensity Laser Therapy or if it remains in the category of High-Power Lasers without significant photomechanical effects.
The generation of an acoustic pressure wave is not merely a technical parameter, but has fundamental biological relevance. One of the primary reasons for inducing a pressure wave is to replicate the beneficial effects observed in regenerative medicine through hypergravity models [13,14,22,23,24,25], where mechanical stimuli have been shown to enhance cell differentiation, extracellular matrix remodeling, and tissue regeneration. Studies on hypergravity have demonstrated that pressures ranging from 10 kPa [30] to 800 kPa [28] significantly influence cellular behavior, angiogenesis, and osteogenesis, reinforcing the idea that mechanotransduction is a key driver of regenerative processes. In this context, HILT acts as a non-invasive alternative to mechanical stimulation, delivering energy in a way that mimics the effects of hypergravity at the cellular level.
Beyond its role in mechanotransduction, the ability of HILT to generate pressure waves carries additional biological significance. Unlike light, which is rapidly absorbed and scattered within the first few millimeters of tissue, acoustic pressure waves penetrate several centimeters, much like ultrasound waves. This extended penetration depth allows HILT-induced effects to reach deeper tissue layers, a property that is unattainable with purely photothermal or photochemical interactions.
Another critical aspect of HILT-induced pressure waves is their temporal sequence in tissue interaction. Light arrives first, followed by the acoustic wave, and finally the thermal wave. This chronological order is fundamental because each of these energy forms contributes distinct biological effects. Photochemical effects, as previously described in the introduction, trigger metabolic and biochemical responses through Cytochrome C oxidase activation, leading to increased ATP production and reactive oxygen species (ROS) modulation [2,4]. Photothermal effects, which dominate in HPLT systems, induce controlled heating that can enhance vascularization and collagen remodeling. However, as shown by Cronshaw et al. [6], when not properly regulated, elevated tissue temperatures may lead to protein denaturation, mitochondrial dysfunction, and metabolic stress, underscoring the importance of precise dose and beam control in therapeutic applications. Moreover, recent experimental findings support this need for dosage control. In a 2025 (Sleep et al. [4]) in vitro study on MG-63 osteoblasts, they demonstrated that continuous-wave photobiomodulation using multi-wavelength LEDs (700, 850, and 980 nm) significantly enhanced mitochondrial respiration and osteogenic gene expression at moderate doses (5.3 J/cm²). However, prolonged or repeated exposure to higher doses (10.6 J/cm² over 7 days) led to suppressed mitochondrial activity and downregulation of key differentiation markers. These results reinforce the concept of a biphasic dose-response curve and underline the biological limitations of high-dose PBM when not paired with a photomechanical effect.
In this context, High-Power Laser Therapy(HPLT) used at elevated doses, but lacking the ability to generate pressure waves, may inadvertently shift from therapeutic to inhibitory. Without the mechano-transductive stimulus characteristic of true HILT systems, such lasers risk delivering excessive photothermal energy with diminishing or even negative cellular returns. On the contrary, Low-Level Laser Therapy (LLLT), although limited in penetration and intensity, operates well within the safety zone of this biphasic response and remains biologically safe even in chronic applications.
These findings suggest that only HILT effectively bridges the gap: combining the safety and efficacy of low-dose PBM with the added regenerative stimulus of pressure waves, achieving a deeper and more complete biological response and, in conclusion, only photoacustic effects, unique to HILT, can directly stimulate mechanotransduction pathways [13,14,22,23,24,25]. This synergy between photo-thermo-mechanical interactions explains why HILT is fundamentally different from conventional laser therapies.
The concept of thermoelasticity, first defined by Niemz [28], further reinforces the distinct nature of HILT. A true HILT system operates strictly within the thermoelastic regime, where the energy delivered is sufficient to generate a pressure wave, but does not reach the threshold for photodisruptive or ablative effects. If a laser exceeds the thermoelastic limit, it transitions into the photodisruptive domain, characterized by excessive pressure waves that can fragment tissue rather than stimulate regenerative responses. This study confirms that HILT remains within the safe and effective thermoelastic range, ensuring that mechanical stimulation occurs without causing structural damage.
A crucial factor in maintaining this balance is the t-off period, or the resting time between laser pulses. Because thermal energy dissipates slowly, excessive repetition rates risk accumulating heat and shifting the system from thermoelasticity to a purely photothermal mode. HILT systems mitigate this by employing low repetition frequencies (5-30 Hz), particularly when high-energy pulses are used. This controlled pulse structuring ensures that the desired photomechanical effects occur while preventing thermal damage.
The results of this study also demonstrate a strong correlation between PED and the pressure wave amplitude calculated via Margheri’s formula [26], confirming that PED is a reliable surrogate for determining a laser’s ability to generate effective photomechanical stimulation. This was quantitatively confirmed in our correlation analysis (Table 5), where the relationship between PED and pressure wave amplitude showed a statistically significant correlation (p < 0.0001). This supports the proportionality between the two parameters, with a conversion factor of approximately 2.888 across different surgical laser settings.
A similar result was obtained for therapeutic lasers (Table 7), confirming that PED can reliably predict pressure wave amplitude in both clinical and experimental contexts.
Although Margheri’s equation provides a precise estimation of photoacoustic pressure waves, its complexity limits clinical usability. PED, by contrast, simplifies this evaluation, making it accessible to dentists and medical professionals who require a straightforward method to determine whether a laser system qualifies as true HILT.
Beyond theoretical validation, clinical cases further reinforce the significance of HILT in regenerative applications. Temporomandibular joint (TMJ) therapy, for instance, has demonstrated significant improvement in pain reduction and joint function when treated with true HILT, with pressure wave levels exceeding 50 kPa. Similarly, bone healing in post-extraction sites and surgical palatal expansion cases reveal accelerated osteogenesis and improved tissue regeneration, likely due to the combination of photochemical, photothermal, and photomechanical effects. Importantly, the pressure wave values calculated in vitro are consistently lower than those expected in vivo, as biological tissues have significantly higher absorption coefficients than water [21], leading to even greater mechanical stimulation under clinical conditions.
These findings highlight the necessity of establishing precise classification criteria for HILT.
Moreover, these findings are consistent across both surgical and therapeutic laser categories. As shown in Table 7, PED proves to be an excellent predictor of pressure wave amplitude even for therapeutic lasers, further supporting its clinical relevance as a universal evaluation metric.
This predictive capacity is particularly significant when evaluating thresholds for photomechanical stimulation. In vitro, where water is the predominant absorber, a minimum pressure wave amplitude of 10 kPa is typically required to trigger mechanotransduction. However, in vivo, due to the significantly higher absorption coefficients of biological tissues, sometimes up to an order of magnitude greater, as reported by Salomatina et al. [21], even devices that fall within the pink zone of the reference tables can exceed this 10 kPa threshold. Conversely, lasers classified in the white zone appear insufficient to generate such pressure waves, even under in vivo conditions, and should therefore be more accurately categorized as High-Power Laser Therapy (HPLT) systems, not HILT.
To determine the upper boundary of safe photomechanical stimulation, we referenced Niemz’s classification [24] of the thermoelastic regime, defined by energy fluence values ranging from 1 J/cm² to 1000 J/cm². Since our analysis emphasizes biological safety rather than technological limits, this range was adopted as the operational framework for identifying safe and effective HILT use.
These results also enable a clear distinction between HILT and HPLT systems. Despite variations in their configurations, whether pulsed, superpulsed, or chopped, HPLT lasers consistently fail to reach the therapeutic threshold of 10 kPa. The observed 1.39 orders of magnitude gap between the lowest-performing HILT system and the highest-performing HPLT laser reinforces this separation and confirms that HPLT devices do not qualify as true HILT systems due to their inability to induce meaningful photomechanical effects.
Based on the results of this study, a true HILT system must meet the following requirements:
- -
- PED > 30 J/cm³ in vitro (or > 3.7 J/cm³ in vivo)
- -
- Pressure wave amplitude > 10 kPa
- -
- Peak power in the kW range
- -
- Optimized pulse structure with controlled τ-on and τ-off
This classification ensures that only lasers capable of generating significant photomechanical effects are labeled as HILT, preventing the widespread misclassification of high-power lasers that lack true regenerative capabilities.
5. Conclusions
This study establishes a clear and objective framework for classifying High-Intensity Laser Therapy (HILT) systems by introducing Pulse Energy Dose (PED) as a practical and clinically relevant tool. The findings demonstrate that PED correlates strongly with a laser’s ability to generate photomechanical effects, offering a simplified yet accurate metric for determining whether a system operates within the thermoelastic regime, a prerequisite for safe and effective mechanotransduction.
The study accomplishes three key objectives. Firstly, it validates PED as a reliable tool for distinguishing true HILT systems from conventional High-Power Laser Therapy (HPLT) devices, demonstrating that only lasers with PED > 30 J/cm³ in vitro (or > 3.7 J/cm³ in vivo) consistently generate pressure waves exceeding 10 kPa, the minimum threshold required to trigger biological responses. Secondly, it defines the lower and upper operational thresholds of HILT systems, ensuring that these lasers remain within the thermoelastic window and avoid transitioning into ablative or disruptive regimes, in accordance with Niemz’s classification [28] of laser–tissue interactions. Thirdly, it provides a direct comparison between HILT and HPLT systems, revealing that many so-called HILT lasers fail to meet the photoacoustic pressure wave threshold, emphasizing the need to evaluate peak power, pulse structure, and duty cycle, rather than relying solely on average power specifications.
From a clinical perspective, these findings redefine the selection criteria for HILT devices. Clinicians should not base decisions solely on power ratings, but rather consider PED values and acoustic pressure thresholds to ensure they are using systems capable of inducing effective tissue regeneration. The case studies presented further support this distinction, demonstrating superior therapeutic outcomes with properly calibrated HILT lasers, particularly in bone healing, soft tissue repair, and joint therapy.
Future research should focus on refining treatment protocols for different tissue types, optimizing pulse structures for enhanced photomechanical stimulation, and exploring long-term cellular and extracellular responses to HILT. Furthermore, the standardization of PED metrics and pressure wave classifications will be essential to ensure consistency across clinical applications and improve the overall efficacy of HILT-based therapies.
In conclusion, PED emerges as a critical parameter for identifying true HILT systems. By defining both biophysical and biological thresholds for effective operation, this study lays the groundwork for improved clinical decision-making in laser therapy and regenerative medicine.
Author Contributions
Conceptualization, D.F. and F.R.; Methodology, D.F.; Investigation, D.F.; Data Curation, D.F.; Writing—Original Draft Preparation, D.F.; Writing—Review & Editing, D.F., F.M., S.P. and F.R.; Visualization, D.F.; Supervision, F.R. All authors have read and agreed to the published version of the manuscript.
Funding
This research received no external funding. APC: Not applicable.
Institutional Review Board Statement
Not applicable.
Informed Consent Statement
Not applicable.
Data Availability Statement
No new data were created or analyzed in this study. Data sharing is not applicable to this article.
Acknowledgments
The authors thank El.En. S.p.A. (Florence, Italy), DEKA Dental Lasers (Tampa, FL, USA), and the Institute of Applied Physics (CNR-IFAC, Florence, Italy) for scientific discussions and support.
Conflicts of Interest
Fabrizio Margheri is employed in the R&D department of El.En. Group (Florence, Italy), which is one of several manufacturers of HILT devices worldwide. Scott Parker is employed as VP of Clinical Affairs at DEKA Dental Lasers (Nashville, TN, USA), which is among several companies marketing HILT devices in dentistry. Damiano Fortuna serves as an external consultant for DEKA Dental Lasers (Nashville, TN, USA). The authors declare that these affiliations did not influence the design, analysis, or interpretation of the present review.
References
- Mester, A.; Mester, A. The History of Photobiomodulation: Endre Mester (1903–1984). Photomed. Laser Surg. 2017, 35, 393–394. [CrossRef]
- Karu, T. Photobiology of low-power laser effects. Health Phys. 1989, 56, 691–704. [CrossRef]
- Turner, J.; Hode, L. The Laser Therapy Handbook: A Guide for Research Scientists, Doctors, Dentists, Veterinarians and Other Interested Parties within the Medical Field; Prima Books: Grängesberg, Sweden, 2004.
- Sleep, S.; Hryciw, D.H.; Walsh, L.J.; Ranjit, E.; Tomy, N.; Arany, P.R.; George, R. Effects of Multiple Near-Infrared LEDs (700, 850, and 980 nm) CW-PBM on Mitochondrial Respiration and Gene Expression in MG63 Osteoblasts. J. Biophotonics 2025, e70015. [CrossRef]
- Lawrence, J.; Sorra, K. Photobiomodulation as Medicine: Low-Level Laser Therapy (LLLT) for Acute Tissue Injury or Sport Performance Recovery. J. Funct. Morphol. Kinesiol. 2024, 9, 181. [CrossRef]
- Cronshaw, M.; Parker, S.; Grootveld, M.; Lynch, E. Photothermal Effects of High-Energy Photobiomodulation Therapies: An In Vitro Investigation. Biomedicines 2023, 11, 1634. [CrossRef]
- Zhang, Z.; Zhang, Z.; Liu, P.; Xue, X.; Zhang, C.; Peng, L.; Shen, W.; Yang, S.; Wang, F. The Role of Photobiomodulation to Modulate Ion Channels in the Nervous System: A Systematic Review. Cell Mol. Neurobiol. 2024, 44, 79. [CrossRef]
- Orchardson, R.; Peacock, J.M.; Whitters, C.J. Effect of pulsed Nd:YAG laser radiation on action potential conduction in isolated mammalian spinal nerves. Lasers Surg. Med. 1997, 21, 142–148. [CrossRef]
- Alayat, M.S.; Battecha, K.H.; Elsodany, A.M.; Ali, M.I. Pulsed Nd:YAG laser combined with progressive pressure release in the treatment of cervical myofascial pain syndrome: A randomized control trial. J. Phys. Ther. Sci. 2020, 32, 422–427. [CrossRef]
- Mikhaylov, V.A. Laser Therapy in the Complex Prevention and Treatment of Covid-19 (Preliminary Results). Int. J. Clin. Case Rep. Rev. 2021, 6, 2. [CrossRef]
- Alghitany, A.; Khalil, M.; Eladl, A.; Gad, A.; Elgendy, A. The Effect of Laser Acupuncture on Immunomodulation and Dyspnea in Post-COVID-19 Patients. Adv. Rehabil. 2023, 37(3), 34–43. [CrossRef]
- Tarantino, C.; Rossi, G.; Flamini, G.; Fortuna, D. Cytoproliferative activity of the HILT: In vitro survey. Lasers Med. Sci. 2002, 17, A22.
- Monici, M.; Cialdai, F.; Fusi, F.; Romano, G.; Pratesi, R. Effects of pulsed Nd:YAG laser at molecular and cellular level—A study on the basis of Hilterapia®. Energy Health 2009, 3, 26–33.
- Cialdai, F.; Monici, M. Relationship between cellular and systemic effects of pulsed Nd:YAG laser. Energy Health 2010, 5, 4–9.
- Bucala, R.; Spiegel, L.A.; Chesney, J.; Hogan, M.; Cerami, A. Circulating fibrocytes define a new leukocyte subpopulation that mediates tissue repair. Mol. Med. 1994, 1, 71–81.
- Andersson-Sjöland, A.; Nihlberg, K.; Eriksson, L.; Bjermer, L.; Westergren-Thorsson, G. Fibrocytes and the tissue niche in lung repair. Respir. Res. 2011, 12, 76. [CrossRef]
- Fortuna, D.; Rossi, G.; Zati, A.; Cardillo, I.; Bilotta, T.W.; Pinna, S.; Venturini, A.; Masotti, L. Nd:YAG laser in experimentally induced chronic degenerative osteoarthritis in heavyline chicken broiler—Pilot study. Proc. SPIE 2002, 4903, 77–84.
- Fortuna, D.; Rossi, G.; Zati, A.; Gazzotti, V.; Bilotta, T.W.; Pinna, S.; Venturini, A.; Masotti, L. High Intensity Laser Therapy in experimentally induced chronic degenerative tenosynovitis in heavyline chicken broiler. Proc. SPIE 2002, 4903, 85–91.
- Fortuna, D.; Rossi, G.; Paolini, C.; Magi, A.; Losani, F.; Fallaci, S.; Pacini, F.; Porciani, C.; Sandler, A.; Dalla Torre, R.; Pinna, S.; Venturini, A. The Nd:YAG pulsed wave laser as support therapy in the treatment of teno-desmopathies of athlete horses: A clinical and an experimental trial. Proc. SPIE 2002, 4903, 105–118.
- Zati, A.; Desando, G.; Cavallo, C.; Buda, R.; Giannini, S.; Fortuna, D.; Facchini, A.; Grigolo, B. Treatment of human cartilage defects by means of Nd:YAG Laser Therapy. J. Biol. Regul. Homeost. Agents 2012, 26, 701–711.
- Salomatina, E.; Jiang, B.; Novak, J.; Yaroslavsky, A.N. Optical properties of normal and cancerous human skin in the visible and near-infrared spectral range. J. Biomed. Opt. 2006, 11, 064026. [CrossRef]
- Bosco, C. Adaptive response of human skeletal muscle to simulated hypergravity condition. Acta Physiol. Scand. 1985, 124, 507–513.
- Cheng, G.; Yu, B.; Song, C.; Zablotskii, V.; Zhang, X. Bioeffects of Microgravity and Hypergravity on Animals. Chin. J. Electr. Eng. 2023, 9, 29–46. [CrossRef]
- De Cesari, C.; Barravecchia, I.; Pyankova, O.V.; Vezza, M.; Germani, M.M.; Scebba, F.; van Loon, J.J.W.A.; Angeloni, D. Hypergravity Activates a Pro-Angiogenic Homeostatic Response by Human Capillary Endothelial Cells. Int. J. Mol. Sci. 2020, 21, 2354. [CrossRef]
- Genchi, G.G.; Cialdai, F.; Monici, M.; Mazzolai, B.; Mattoli, V.; Ciofani, G. Hypergravity stimulation enhances PC12 neuron-like cell differentiation. Biomed. Res. Int. 2015, 2015, 748121. [CrossRef]
- Margheri, F. Sviluppo di trasduttori acusto-ottici miniaturizzati per diagnostica clinica e controlli non distruttivi. Ph.D. Thesis, Università degli Studi di Firenze, Firenze, Italy, 2000.
- Fortuna, D.; Masotti, L. The HILT domain by the pulse intensity fluence (PIF) formula. Energy Health 2010, 5, 12–19.
- Niemz, M.H. Laser–Tissue Interactions: Fundamentals and Applications, 3rd ed.; Springer: Berlin/Heidelberg, Germany, 2007. ISBN 978-3-540-72191-8.
- Oraevsky, A.A.; Jacques, S.L.; Tittel, F.K. Determination of tissue optical properties by piezoelectric detection of laser-induced stress waves. Proc. SPIE 1993, 1882, 86–101.
- Oraevsky, A.A.; Esenaliev, R.O.; Jacques, S.L.; Tittel, F.K.; Benov, L. Laser optoacoustic tomography for medical diagnostics: Principles. Proc. SPIE 1996, 2676, 22–31.
- Wang, L.V.; Wu, H.-I. Biomedical Optics: Principles and Imaging; Wiley-Interscience: Hoboken, NJ, USA, 2007. ISBN 978-0471743040.
- Yao, D.K.; Zhang, C.; Maslov, K.; Wang, L.V. Photoacoustic measurement of the Grüneisen parameter of tissue. J. Biomed. Opt. 2014, 19, 017007. [CrossRef]
- Esenaliev, R.O. Optoacoustic Monitoring of Physiologic Variables. Front. Physiol. 2017, 8, 1030. [CrossRef]
- Feynman, R.P.; Leighton, R.B.; Sands, M. The Feynman Lectures on Physics, Vol. II, Chapter 40: The Flow of Dry Water; California Institute of Technology: Pasadena, CA, USA, 1964. Available online: https://www.feynmanlectures.caltech.edu/II_40.html (accessed on 25 February 2025).
- Palmer, K.F.; Williams, D. Optical properties of water in the near infrared. J. Opt. Soc. Am. 1974, 64, 1107–1110. [CrossRef]
Figure 1.
Map of laser-tissue interactions. Adapted from Niemz (2007), who modified Boulnois (1986).
Figure 1.
Map of laser-tissue interactions. Adapted from Niemz (2007), who modified Boulnois (1986).
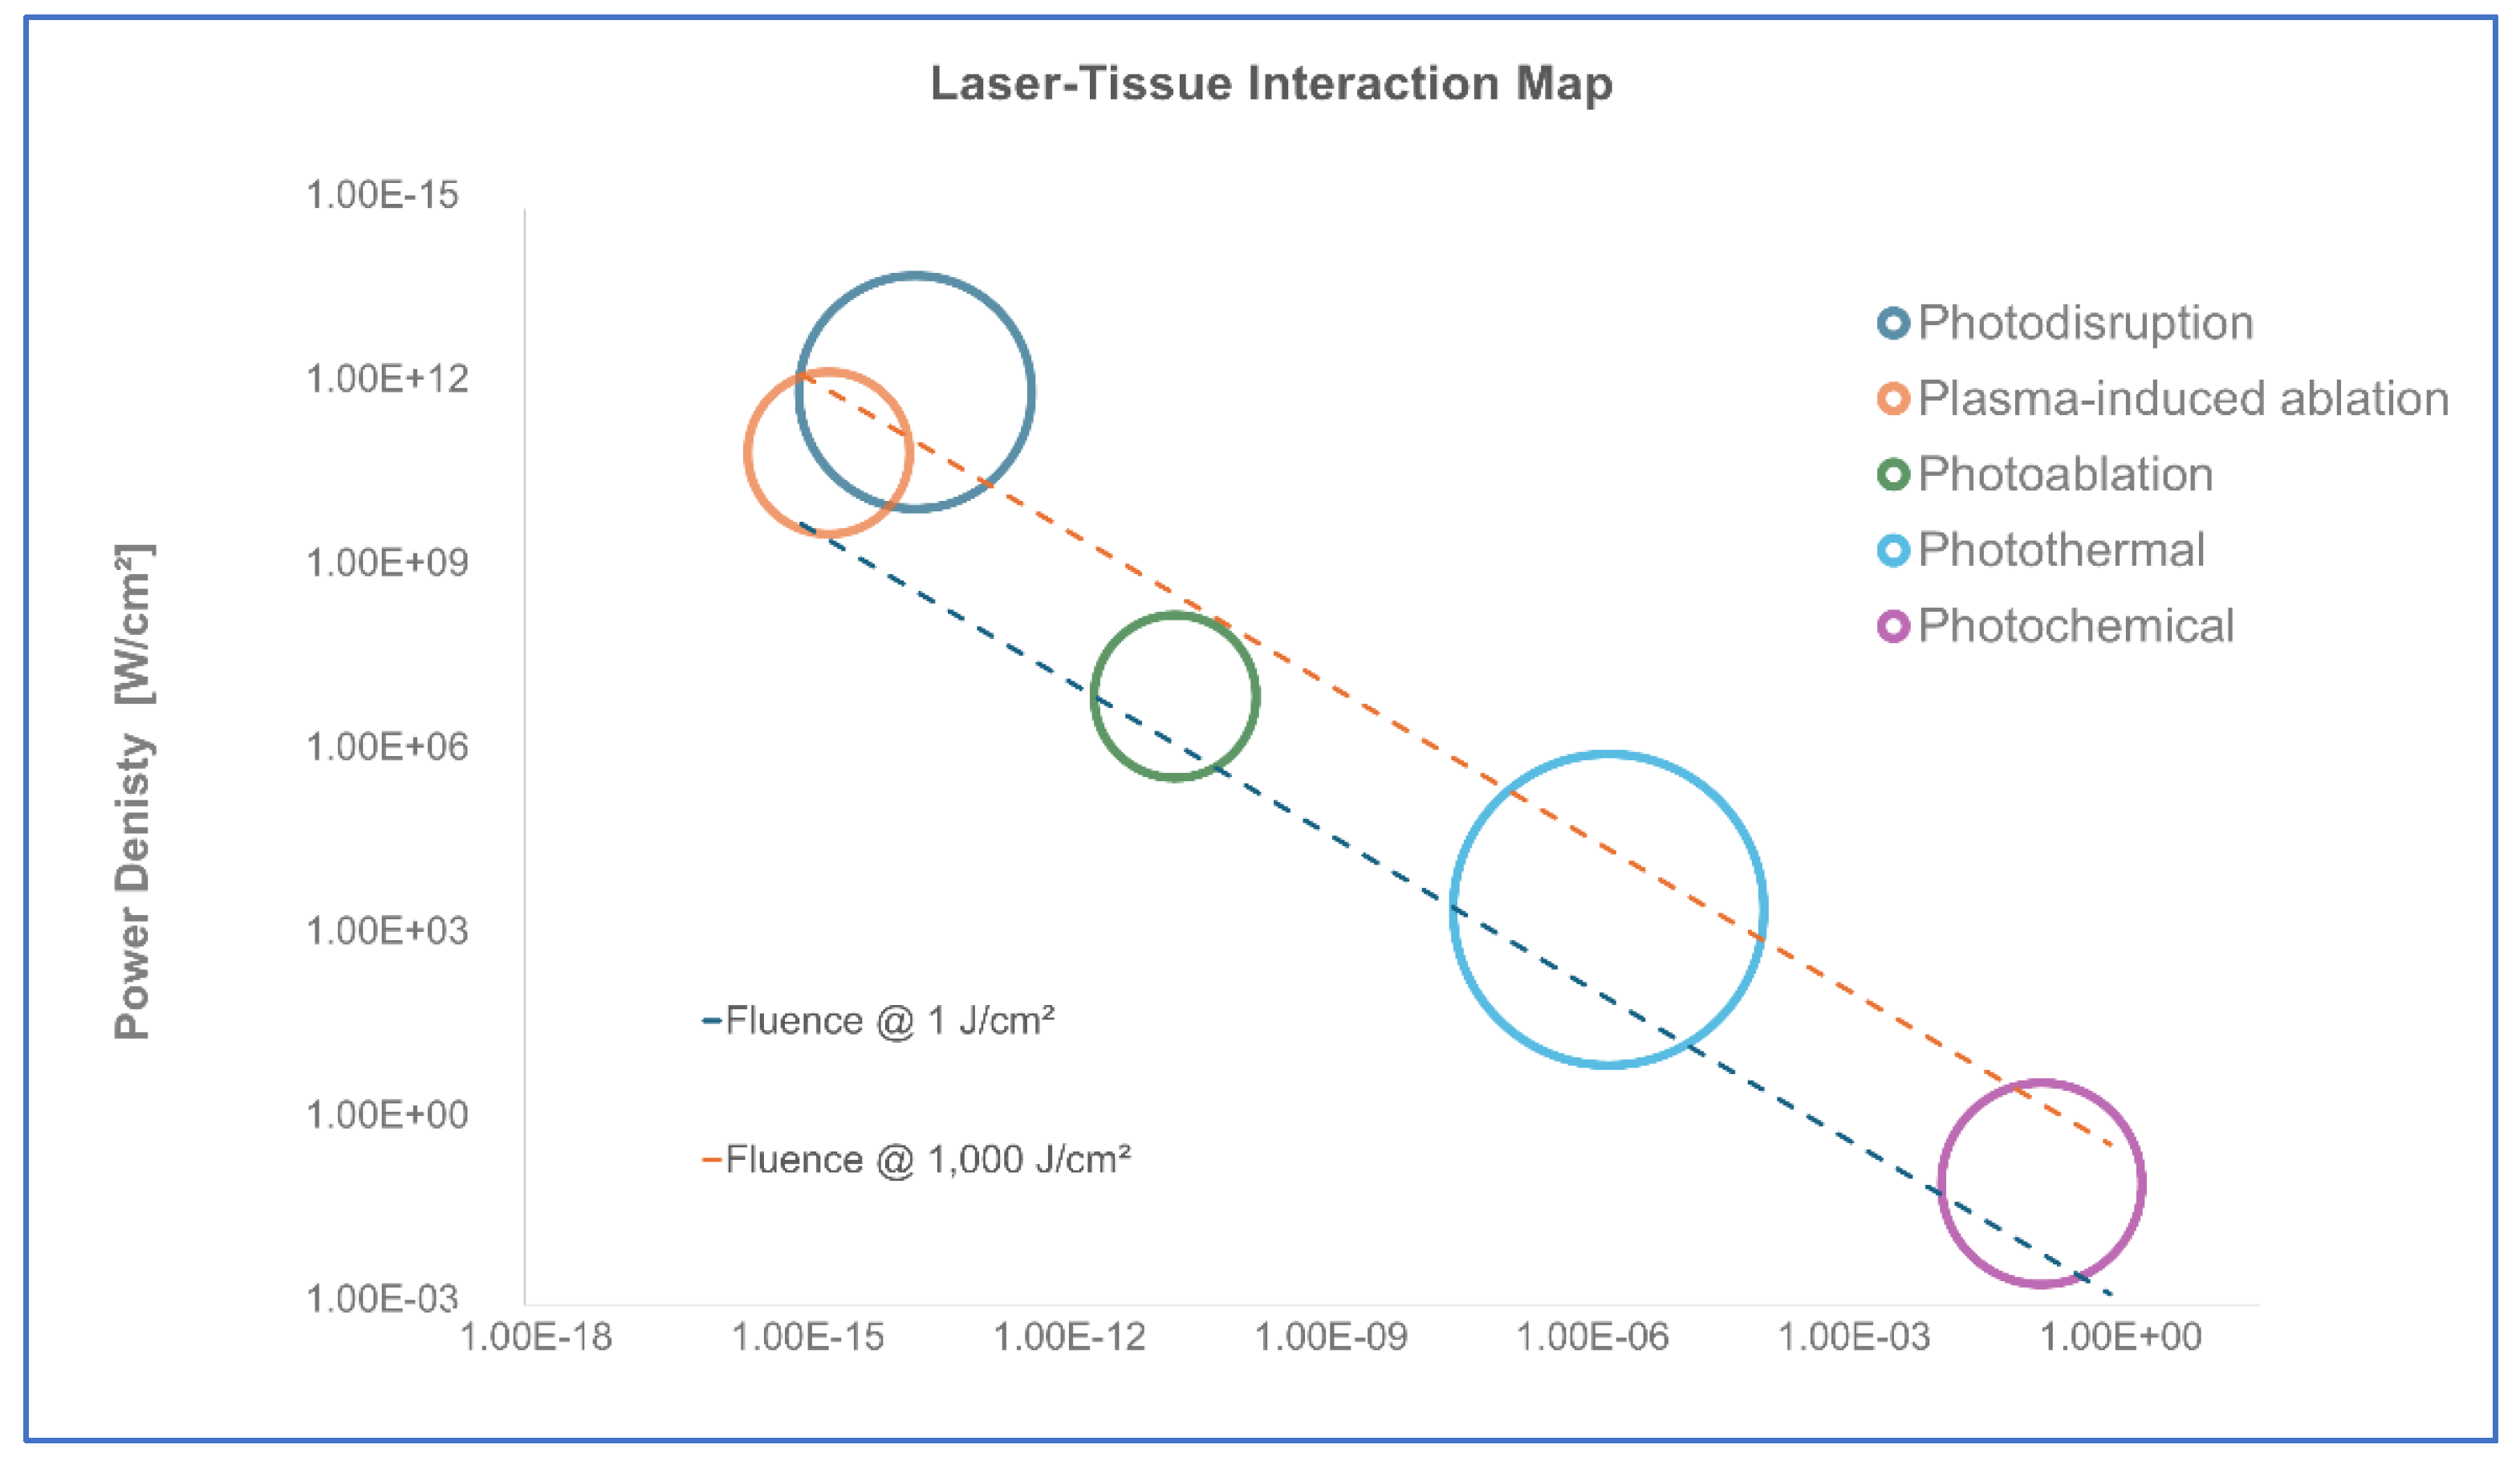
Table 2.
λ: wavelength; α: absorption coefficient; Avg Power: average output power; Peak Power: maximum instantaneous output power; Spot Diam: laser spot diameter; PRF: pulse repetition frequency; Pulse Duration τ-on: laser pulse width; Duty Cycle: ratio between pulse duration and period, expressed as percentage. T: therapeutic lasers; S: surgical lasers.
| Therapeutic (T) or surgical (S) lasers | l [nm] | a [cm-1] | Avg Power [W] | Peak Power [W] | Spot Diam [cm] | PRF [Hz] | Pulse Duration t-on [ms] | Duty Cylce [%] |
| S | 10,600 | 1,000.00 | 15 | 15,000.00 | 0.01 | 10 | 100 | 0.1% |
| S | 10,600 | 1,000.00 | 1.5 | 1,500.00 | 0.01 | 10 | 100 | 0.1% |
| S | 2,940 | 10,000.00 | 15 | 15,000.00 | 0.03 | 10 | 100 | 0.1% |
| S | 2,940 | 10,000.00 | 2 | 4,000.00 | 0.03 | 10 | 50 | 0.1% |
| S | 2,100 | 31.00 | 40 | 20,000.00 | 0.03 | 10 | 200 | 0.2% |
| S | 2,100 | 31.00 | 10 | 5,000.00 | 0.03 | 10 | 200 | 0.2% |
| T | 1,064 | 0.15 | 2 | 133.33 | 0.5 | 100 | 150 | 1.5% |
| T | 1,064 | 0.15 | 2 | 200.00 | 0.5 | 100 | 100 | 1.0% |
| T | 1,064 | 0.15 | 1.8 | 300.00 | 0.5 | 60 | 100 | 0.6% |
| T | 1,064 | 0.15 | 10 | 1,000.00 | 0.5 | 100 | 100 | 1.0% |
| T | 1,064 | 0.15 | 10 | 714.29 | 0.5 | 40 | 350 | 1.4% |
| T | 1,064 | 0.15 | 1.2 | 184.62 | 0.5 | 10 | 650 | 0.7% |
| T | 1,064 | 0.15 | 9.6 | 1,600.00 | 0.5 | 60 | 100 | 0.6% |
| T | 1,064 | 0.15 | 10 | 1,666.67 | 0.5 | 40 | 150 | 0.6% |
| T | 1,064 | 0.15 | 9 | 3,000.00 | 0.5 | 30 | 100 | 0.3% |
| T | 1,064 | 0.15 | 1.2 | 1,200.00 | 0.5 | 10 | 100 | 0.1% |
| T | 1,064 | 0.15 | 5 | 2,500.00 | 0.5 | 20 | 100 | 0.2% |
| T | 1,064 | 0.15 | 4.5 | 3,000.00 | 0.5 | 15 | 100 | 0.2% |
| T | 1,064 | 0.15 | 3 | 3,000.00 | 0.5 | 10 | 100 | 0.1% |
| T | 1,064 | 0.15 | 1.5 | 3,000.00 | 0.5 | 10 | 50 | 0.1% |
| T | 1,064 | 0.15 | 1 | 2,000.00 | 0.5 | 5 | 100 | 0.1% |
| T | 1,064 | 0.15 | 2.1 | 3,000.00 | 0.5 | 7 | 100 | 0.1% |
| T | 1,064 | 0.15 | 1.5 | 3,000.00 | 0.5 | 5 | 100 | 0.1% |
| T | 1,064 | 0.15 | 20 | 5,714.29 | 2 | 17,500 | 0 | 0.4% |
| T | 1,064 | 0.15 | 10 | 2,857.14 | 1 | 17,500 | 0 | 0.4% |
| T | 1,064 | 0.15 | 5 | 1,428.57 | 0.5 | 17,500 | 0 | 0.4% |
| T | 1,064 | 0.15 | 5 | 20.00 | 1 | 10 | 25,000 | 25.0% |
| T | 1,064 | 0.15 | 5 | 10.00 | 1 | 10 | 50,000 | 50.0% |
| T | 1,064 | 0.15 | 5 | 6.67 | 1 | 10 | 75,000 | 75.0% |
| T | 980 | 0.50 | 20 | 5,714.29 | 2 | 17,500 | 0 | 0.4% |
| T | 980 | 0.50 | 10 | 2,857.14 | 1 | 17,500 | 0 | 0.4% |
| T | 980 | 0.50 | 5 | 1,428.57 | 0.5 | 17,500 | 0 | 0.4% |
| T | 980 | 0.50 | 20 | 80.00 | 3 | 10 | 25,000 | 25.0% |
| T | 980 | 0.50 | 10 | 40.00 | 2 | 10 | 25,000 | 25.0% |
| T | 980 | 0.50 | 5 | 20.00 | 1 | 10 | 25,000 | 25.0% |
| T | 980 | 0.50 | 5 | 10.00 | 1 | 10 | 50,000 | 50.0% |
| T | 980 | 0.50 | 5 | 6.67 | 1 | 10 | 75,000 | 75.0% |
| T | 910 | 0.08 | 5 | 20.00 | 1 | 10 | 25,000 | 25.0% |
| T | 910 | 0.08 | 5 | 10.00 | 1 | 10 | 50,000 | 50.0% |
| T | 910 | 0.08 | 5 | 6.67 | 1 | 10 | 75,000 | 75.0% |
| T | 905 | 0.08 | 5 | 1,428.57 | 0.5 | 17,500 | 0 | 0.4% |
| T | 905 | 0.08 | 5 | 714.29 | 0.5 | 100,000 | 0 | 0.7% |
| T | 810 | 0.02 | 5 | 20.00 | 1 | 10 | 25,000 | 25.0% |
| T | 810 | 0.02 | 5 | 10.00 | 1 | 10 | 50,000 | 50.0% |
| T | 810 | 0.02 | 5 | 6.67 | 1 | 10 | 75,000 | 75.0% |
Table 3.
Surgical Lasers, Pressure Wave [kPa] vs. PED [J/cm3]. λ, wavelength; α, absorption coefficient; Avg Power, average power; Peak Power, peak power; Spot Diam, spot diameter; PRF, pulse repetition frequency; τ-on, pulse duration; Duty Cycle, ratio between pulse duration and period; PED, pulse energy.
| Therapeutic (T) or surgical (S) lasers | l [nm] | a [cm-1] | Avg. Power [W] | Peak Power [W] | Spot Diam. [cm] | PRF [Hz] | Pulse Duration t-on [ms] | Duty Cylce [%] | Pressure Wave, Margheri [kPa] | PED [J/cm3] |
| S | 10,600 | 1,000.00 | 15 | 15,000.00 | 0.01 | 10 | 100 | 0.1% | 6,612,218,865 | 19,098,593,171 |
| S | 10,600 | 1,000.00 | 1.5 | 1,500.00 | 0.01 | 10 | 100 | 0.1% | 661,221,887 | 1,909,859,317 |
| S | 2,940 | 10,000.00 | 15 | 15,000.00 | 0.03 | 10 | 100 | 0.1% | 7,346,910,296 | 21,220,659,079 |
| S | 2,940 | 10,000.00 | 2 | 4,000.00 | 0.03 | 10 | 50 | 0.1% | 1,959,176,079 | 5,658,842,421 |
| S | 2,100 | 31.00 | 40 | 20,000.00 | 0.03 | 10 | 200 | 0.2% | 30,367,163 | 87,712,058 |
| S | 2,100 | 31.00 | 10 | 5,000.00 | 0.03 | 10 | 200 | 0.2% | 7,591,791 | 21,928,014 |
Table 5.
Color-coded summary of therapeutic lasers, classified according to the generated pressure wave and PED values. Legend. Green rows identify real HILT devices (pressure wave >10 kPa); pink rows indicate intermediate lasers (pressure wave between 1 and 10 kPa); white rows correspond to low-power lasers (pressure wave around 0 kPa). Abbreviations: λ, wavelength; α, absorption coefficient; Avg Power, average power; Peak Power, peak power; Spot Diam, spot diameter; PRF, pulse repetition frequency; τ-on, pulse duration; Duty Cycle, ratio between pulse duration and period; PED, pulse energy dose; PW, pressure wave.
| Therapeutic (T) or surgical (S) lasers | l [nm] | a [cm-1] | Avg Power [W] | Peak Power [W] | Spot Diam [cm] | PRF [Hz] | Pulse Duration t-on [ms] | Duty Cylce [%] | Pressure Wave. Margheri [kPa] | PED [J/cm3] |
| T | 1,064 | 0.148 | 2 | 133.33 | 0.5 | 100 | 150.00 | 1.50% | 0.35 | 1.005 |
| T | 1,064 | 0.148 | 2 | 200.00 | 0.5 | 100 | 100.00 | 1.00% | 0.52 | 1.508 |
| T | 1,064 | 0.148 | 1.8 | 300.00 | 0.5 | 60 | 100.00 | 0.60% | 1.30 | 3.769 |
| T | 1,064 | 0.148 | 10 | 1,000.00 | 0.5 | 100 | 100.00 | 1.00% | 2.60 | 7.538 |
| T | 1,064 | 0.148 | 10 | 714.29 | 0.5 | 40 | 350.00 | 1.40% | 4.65 | 13.460 |
| T | 1,064 | 0.148 | 1.2 | 184.62 | 0.5 | 10 | 650.00 | 0.65% | 4.82 | 13.916 |
| T | 1,064 | 0.148 | 9.6 | 1,600.00 | 0.5 | 60 | 100.00 | 0.60% | 6.94 | 20.100 |
| T | 1,064 | 0.148 | 10 | 1,666.67 | 0.5 | 40 | 150.00 | 0.60% | 10.85 | 31.407 |
| T | 1,064 | 0.148 | 9 | 3,000.00 | 0.5 | 30 | 100.00 | 0.30% | 26.06 | 75.376 |
| T | 1,064 | 0.148 | 1.2 | 1,200.00 | 0.5 | 10 | 100.00 | 0.10% | 31.30 | 90.451 |
| T | 1,064 | 0.148 | 5 | 2,500.00 | 0.5 | 20 | 100.00 | 0.20% | 32.59 | 94.220 |
| T | 1,064 | 0.148 | 4.5 | 3,000.00 | 0.5 | 15 | 100.00 | 0.15% | 52.16 | 150.752 |
| T | 1,064 | 0.148 | 3 | 3,000.00 | 0.5 | 10 | 100.00 | 0.10% | 78.25 | 226.127 |
| T | 1,064 | 0.148 | 1.5 | 3,000.00 | 0.5 | 10 | 50.00 | 0.05% | 78.25 | 226.127 |
| T | 1,064 | 0.148 | 1 | 2,000.00 | 0.5 | 5 | 100.00 | 0.05% | 104.36 | 301.503 |
| T | 1,064 | 0.148 | 2.1 | 3,000.00 | 0.5 | 7 | 100.00 | 0.07% | 111.81 | 323.039 |
| T | 1,064 | 0.148 | 1.5 | 3,000.00 | 0.5 | 5 | 100.00 | 0.05% | 156.54 | 452.255 |
| T | 1064 | 0.148 | 20 | 5,714.29 | 2 | 17,500 | 0.20 | 0.35% | 0.00 | 0.015 |
| T | 1064 | 0.148 | 10 | 2,857.14 | 1 | 17,500 | 0.20 | 0.35% | 0.00 | 0.031 |
| T | 1064 | 0.148 | 5 | 1,428.57 | 0.5 | 17,500 | 0.20 | 0.35% | 0.00 | 0.062 |
| T | 980 | 0.502 | 20 | 5,714.29 | 2 | 17,500 | 0.20 | 0.35% | 0.01 | 0.052 |
| T | 980 | 0.502 | 10 | 2,857.14 | 1 | 17,500 | 0.20 | 0.35% | 0.03 | 0.104 |
| T | 980 | 0.502 | 5 | 1,428.57 | 0.5 | 17,500 | 0.20 | 0.35% | 0.06 | 0.209 |
| T | 905 | 0.075 | 5 | 1,428.57 | 0.5 | 17,500 | 0.20 | 0.35% | -0.01 | 0.031 |
| T | 905 | 0.075 | 5 | 714.29 | 0.5 | 100,000 | 0.07 | 0.70% | -0.01 | 0.003 |
| T | 1064 | 0.148 | 5 | 20.00 | 1 | 10 | 25,000.00 | 25.00% | 0.13 | 0.377 |
| T | 1064 | 0.148 | 5 | 10.00 | 1 | 10 | 50,000.00 | 50.00% | 0.07 | 0.188 |
| T | 1064 | 0.148 | 5 | 6.67 | 1 | 10 | 75,000.00 | 75.00% | 0.04 | 0.126 |
| T | 980 | 0.502 | 20 | 80.00 | 3 | 10 | 25,000.00 | 25.00% | 0.20 | 0.568 |
| T | 980 | 0.502 | 10 | 40.00 | 2 | 10 | 25,000.00 | 25.00% | 0.22 | 0.639 |
| T | 980 | 0.502 | 5 | 20.00 | 1 | 10 | 25,000.00 | 25.00% | 0.44 | 1.278 |
| T | 980 | 0.502 | 5 | 10.00 | 1 | 10 | 50,000.00 | 50.00% | 0.22 | 0.639 |
| T | 980 | 0.502 | 5 | 6.67 | 1 | 10 | 75,000.00 | 75.00% | 0.15 | 0.426 |
| T | 910 | 0.075 | 5 | 20.00 | 1 | 10 | 25,000.00 | 25.00% | 0.07 | 0.191 |
| T | 910 | 0.075 | 5 | 10.00 | 1 | 10 | 50,000.00 | 50.00% | 0.03 | 0.095 |
| T | 910 | 0.075 | 5 | 6.67 | 1 | 10 | 75,000.00 | 75.00% | 0.02 | 0.064 |
| T | 810 | 0.0191 | 5 | 20.00 | 1 | 10 | 25,000.00 | 25.00% | 0.02 | 0.049 |
| T | 810 | 0.0191 | 5 | 10.00 | 1 | 10 | 50,000.00 | 50.00% | 0.01 | 0.024 |
| T | 810 | 0.0191 | 5 | 6.67 | 1 | 10 | 75,000.00 | 75.00% | 0.01 | 0.016 |
Table 6.
Statistical summary of the correlation between pressure wave and pulse energy dose (PED) in therapeutic lasers. Abbreviations: PED, pulse energy dose; PW, pressure wave; PED/PW, ratio between PED and pressure wave; SD, standard deviation; Pearson’s r, correlation coefficient.
Table 6.
Statistical summary of the correlation between pressure wave and pulse energy dose (PED) in therapeutic lasers. Abbreviations: PED, pulse energy dose; PW, pressure wave; PED/PW, ratio between PED and pressure wave; SD, standard deviation; Pearson’s r, correlation coefficient.
| Therapeutic lasers | Pressure Wave [kPa] | PED [J/cm3] | PED/PW |
| Mean | 18 | 52 | 2.89 |
| Standard Deviation | 37 | 108 | 2.89 |
| Covariance | 4034.109101 | ||
| Pearson’s r | 0.999999975 | ||
| p-Value | 8.9669E-137 |
Table 7.
Maximum pulse energy dose (PED) limits in vitro and in vivo for different laser wavelengths. Abbreviations: λ, wavelength; α, absorption coefficient; 1/α, optical penetration depth; Max ED, maximum energy dose; PED, pulse energy dose. Note: Reported values indicate threshold PED levels associated with tissue optical properties, distinguishing between in vitro and in vivo experimental conditions.
| l [nm] | a [cm-1] | 1/a [cm-1] | Max ED [J/cm3] vitro | Max ED [J/cm3] vivo |
| 10,600 | 1,000.00 | 0.0010 | 1,000,000 | 10,000,000 |
| 2,940 | 10,000.00 | 0.0001 | 10,000,000 | 100,000,000 |
| 2,100 | 31.00 | 0.0323 | 31,000 | 310,000 |
| 1,064 | 0.15 | 6.7568 | 148 | 1,480 |
| 980 | 0.50 | 1.9920 | 502 | 5,020 |
| 910 | 0.08 | 13.3333 | 75 | 750 |
| 905 | 0.06 | 16.4204 | 61 | 609 |
| 810 | 0.02 | 52.3560 | 19 | 191 |
Disclaimer/Publisher’s Note: The statements, opinions and data contained in all publications are solely those of the individual author(s) and contributor(s) and not of MDPI and/or the editor(s). MDPI and/or the editor(s) disclaim responsibility for any injury to people or property resulting from any ideas, methods, instructions or products referred to in the content. |
© 2025 by the authors. Licensee MDPI, Basel, Switzerland. This article is an open access article distributed under the terms and conditions of the Creative Commons Attribution (CC BY) license (http://creativecommons.org/licenses/by/4.0/).
Copyright: This open access article is published under a Creative Commons CC BY 4.0 license, which permit the free download, distribution, and reuse, provided that the author and preprint are cited in any reuse.


