
Submitted:
21 October 2025
Posted:
21 October 2025
You are already at the latest version
Abstract
In vitro maturation (IVM) of oocytes remains suboptimal due to oxidative stress and disrupted cumulus–oocyte communication. Oocyte-derived factors (ODFs) are key mediators of this crosstalk and crucial for oocyte competence. Here, we provide systematic evidence that EFNA5 is an oocyte-derived membrane ligand capable of regulating oocyte quality during IVM. Cross-species transcriptomic analysis revealed that EFNA5 is stably enriched in mammalian oocytes but markedly reduced in in vitro–matured oocytes compared with in vivo counterparts. Using the ovine IVM model, supplementation with recombinant EFNA5 significantly improved blastocyst formation, increased total cell numbers, and reduced apoptosis. Mechanistically, EFNA5 promoted cumulus–oocyte complex expansion, reduced reactive oxygen species accumulation, activated NRF2-dependent antioxidant signaling, and suppressed NF-κB–driven inflammation. RNA-seq and functional validation further confirmed that EFNA5 enhanced redox homeostasis, and decreased DNA damage, collectively improving oocyte developmental potential. These findings establish EFNA5 as a novel and conserved ODF that alleviates oxidative and inflammatory stress to enhance oocyte quality and embryo development, providing mechanistic insight and a potential strategy for improving assisted reproductive technologies.
Keywords:
in vitro maturation
; oocyte-derived factors
; EFNA5
; oxidative stress
; inflammation
; NRF2
; NF-κB
1. Introduction
In vitro maturation (IVM) of oocytes represents a central technology in both animal in vitro embryo production (IVEP) systems and contemporary human assisted reproductive technologies (ART) [1,2,3]. Continued improvements in IVM efficiency hold the potential to further optimize ART, offering significant advancements for the treatment of human infertility and the enhancement of livestock breeding. However, compared with oocytes matured in vivo (IVO), the efficiency of IVM remains suboptimal, as oocytes matured in vitro often exhibit reduced developmental competence [4,5]. A major limitation lies in the inability of current culture systems to fully recapitulate the ovarian microenvironment, leading to excessive oxidative stress, mitochondrial dysfunction, and elevated inflammatory responses [2,6]. These adverse conditions ultimately compromise both nuclear and cytoplasmic maturation of oocytes, resulting in decreased fertilization rates and blastocyst formation [4,7]. Consequently, pinpointing paracrine or autocrine factors that reshape the oocyte IVM microenvironment to reduce oxidative stress, suppress apoptosis, and fortify cumulus-oocyte crosstalk is indispensable for unlocking high-quality oocyte production and the future of ART.
Oocyte-derived factors (ODFs) are the principal architects of mammalian folliculogenesis and oocyte competence. Increasing evidence indicates that oocytes are not merely passive recipients of cumulus cell support but actively regulate cumulus cell function and their own developmental competence through the secretion of specific growth factors, thereby maintaining oocyte quality and the homeostasis of the follicular microenvironment [8]. Canonical ODFs include growth differentiation factor 9 (GDF9) and bone morphogenetic protein 15 (BMP15), two TGF-β superfamily ligands, which promote granulosa cell proliferation and differentiation, induce cumulus cell expansion, and enhance oocyte developmental competence by facilitating bidirectional cumulus-oocyte signaling [9,10]. This core network is fine-tuned by ancillary ODFs such as fibroblast growth factor 8 (FGF8), KIT ligand (KITL), and R-spondin-2 (RSPO2), which calibrate granulosa metabolism, sustain oocyte survival, and safeguard mitochondrial function [11,12]. Together, these oocyte-borne signals converge with granulosa-derived factors to sculpt a microenvironment that licenses high-quality maturation and primes the oocytes for robust embryonic development, offering actionable targets for the rational design of IVM and embryo culture systems.
In recent years, intercellular communication has gained increasing attention for its role in regulating follicular microenvironment stability and oocyte developmental competence [13]. The Ephrin (EFN) family, comprising glycosylphosphatidylinositol (GPI)-anchored or transmembrane ligands, mediates cell adhesion, migration, and tissue morphogenesis through interactions with Eph receptor tyrosine kinases [14]. While extensive research has established their functions in neural development [15], angiogenesis, and tumorigenesis, emerging evidence suggests that ephrins may also participate in reproductive processes. Within the ovary, research on gene knockout mouse models shows that ephrin/Eph signals was implicated in folliculogenesis and the ovulatory cascade [16,17], yet its specific functions during oocyte maturation remain largely unexplored [16]. Additionally, analyses of published transcriptomic datasets detect EFNA5 expression in germ cells across multiple species, collectively suggesting that EFNA5 may play some relatively conservative roles in reproduction. [18,19,20].
In this study, to dissect the regulatory role and underlying mechanism of EFNA5 in oocyte maturation, we exploited an ovine IVM model that is both agriculturally relevant and translationally informative for human reproductive medicine. We first mapped the spatiotemporal expression of EFNA5 and its cognate receptor EPHA4 in ovine ovaries, then systematically evaluated the impact of exogenous recombinant EFNA5 on oocyte meiotic progression, blastocyst yield, and the attendant molecular circuitry. Our results showed that EFNA5, secreted by the oocyte itself, elevates nuclear and cytoplasmic maturation and augments subsequent embryonic potential by simultaneously reducing oxidative stress, curbing inflammatory signaling, and reinforcing bidirectional cumulus-oocyte communication. This study delivers the first functional evidence that EFNA5 operates as a bona fide oocyte-derived factor and provides a mechanistic framework for enhancing oocyte IVM efficiency while offering translational insights for human ART.
2. Materials and Methods
2.1. Chemicals
All chemicals and reagents, unless otherwise specified, were purchased from Sigma-Aldrich (St. Louis, MO, USA). Goat anti-rat IgG (H+L) cross-adsorbed secondary antibody and DAPI solution were obtained from Invitrogen (Carlsbad, CA, USA). HRP-conjugated Affinipure goat anti-rabbit IgG (H+L) was purchased from Proteintech (Beijing, China).
2.2. Oocyte Collection and In Vitro Maturation
Sheep ovaries were collected from a local slaughterhouse (Ulanqab, Inner Mongolia, China) and transported to the laboratory within 2 h in 0.9% saline maintained at 36 °C and supplemented with 100 IU/mL penicillin. Upon arrival, ovaries were rinsed thoroughly with pre-warmed saline, and follicular fluid from 3–8 mm follicles was aspirated using an 18-gauge needle. Cumulus–oocyte complexes (COCs) surrounded by at least three layers of compact cumulus cells were selected under a stereomicroscope. In some experiments, germinal vesicle (GV) oocytes were obtained by treating COCs with 0.3% hyaluronidase (Sigma-Aldrich, St. Louis, MO, USA) followed by gentle pipetting to remove surrounding cumulus cells. For in vitro maturation (IVM), COCs or GV oocytes were cultured in TCM-199 medium (Thermo Fisher Scientific, Waltham, MA, USA) supplemented with 10 µg/mL FSH, 10 µg/mL LH, 1 µg/mL 17β-estradiol, 100 µg/mL L-glutamine, 10% (v/v) fetal bovine serum (FBS; Gibco, Thermo Fisher Scientific), and 1% (v/v) penicillin–streptomycin (Sigma-Aldrich). Cultures were maintained at 38.5 °C under 5% CO2 in humidified air for 24 h. The efficiency of IVM was assessed by polar body extrusion (PBE).
Recombinant human ephrin-A5 (EFNA5; ProSpec, Cat. PRO-2327) was reconstituted in 0.1% BSA in PBS according to the manufacturer’s instructions, sterile-filtered (0.22 µm), aliquoted, and stored at −80 °C to avoid repeated freeze–thaw cycles. For supplementation experiments, the IVM medium was supplemented with EFNA5 at final concentrations of 0, 10, 50, or 100 ng/mL. Vehicle controls received equal volumes of the reconstitution buffer (0.1% BSA/PBS) diluted in IVM medium.
2.3. In Vitro Fertilization and Embryo Culture
Following IVM, COCs were denuded by three washes in synthetic oviductal fluid (SOF) containing 0.2% (w/v) hyaluronidase and then transferred to the IVF medium (SOF supplemented with 2% oestrous sheep serum, 3 mg/mL BSA, 6 IU/mL heparin sodium and 50 IU/mL gentamicin). Frozen semen straws were thawed in a 39 °C water bath for 1 min. After dilution in pre-equilibrated IVF medium, spermatozoa were selected by a 30 min swim-up at 38.5 °C under 5% CO2 in humidified air. The upper motile fraction was collected, centrifuged at 200 × g for 5 min, and the pellet resuspended in IVF medium to give a final concentration of 1 × 10⁶ spermatozoa/mL. Oocytes were co-incubated with spermatozoa for 20 h at 38.5 °C, 5% CO2, maximum humidity. Presumptive zygotes were washed three times in IVC medium and cultured in groups of 25-30 in 50 µL droplets of SOF supplemented with 1% (v/v) BME-essential amino acids, 1% (v/v) MEM-nonessential amino acids, 1 mM l-glutamine and 3 mg/mL BSA under 38.5 °C, 88% N2, 6% CO2 and 6% O2. Cleavage and blastocyst rates were recorded at 48 h and on day 6 post-IVF, respectively.
2.4. Evaluation of COCs Expansion
After 24 h of IVM, cumulus expansion was evaluated according to the criteria adapted from Vanderhyden et al. [21]. and scored on a scale of 1–3: 1, partial expansion restricted to the outermost cumulus cell layers; 2, expansion of all cumulus cell layers except the corona radiata; 3, complete expansion of all cumulus cells, including the corona radiata.
2.5. Detection of Apoptosis
Apoptosis was assessed using a one-step TUNEL apoptosis assay kit (Beyotime, Shanghai, China) following the manufacturer’s protocol. Briefly, COCs and blastocysts were washed in PBS, fixed in 4% paraformaldehyde (PFA) for 1 h at room temperature, and permeabilized with 1% Triton X-100 for 5 min. Samples were then incubated with freshly prepared TUNEL reaction mixture for 1 h at room temperature in the dark, followed by nuclear counterstaining with DAPI. The number of apoptotic cells was quantified by counting TUNEL-positive nuclei, and the total cell number was determined based on DAPI staining.
2.6. Measurement of Intracellular Reactive Oxygen Species (ROS) and Glutathione (GSH) Levels
Intracellular ROS and GSH levels were evaluated using DCFH-DA (Beyotime, Shanghai, China) and CMF2HC (MCE, USA), respectively. Briefly, cumulus cells were removed by treatment with IVM medium containing 0.1% (w/v) hyaluronidase, and denuded oocytes were washed thoroughly in PBS. Oocytes were then incubated with the respective fluorescent probes at 37 °C for 20 min in the dark. After washing, fluorescence signals were captured using a fluorescence microscope, and the relative fluorescence intensity of each oocyte was quantified with ImageJ software (NIH, Bethesda, MD, USA).
2.7. Lipid Peroxidation
Lipid peroxidation in oocytes was assessed using the ratiometric probe C11-BODIPY 581/591 (Invitrogen, Carlsbad, CA, USA). Briefly, cumulus cells were removed by treatment with IVM medium containing 0.1% (w/v) hyaluronidase, and denuded oocytes were washed thoroughly in PBS containing 0.1% (w/v) polyvinyl alcohol (PVA). Oocytes were incubated live with 2 µM C11-BODIPY in IVM medium at 37 °C for 30 min in the dark, followed by three washes in PBS-PVA. Fluorescence was captured immediately on a fluorescence microscope using appropriate filter sets: reduced (non-oxidized) C11-BODIPY was recorded in the red channel and oxidized C11-BODIPY in the green channel. For each oocyte, background-subtracted mean fluorescence intensities were quantified in ImageJ (NIH, Bethesda, MD, USA), and lipid peroxidation was expressed as the oxidized/reduced ratio (green/red), as specified in figure legends. Results are presented as mean ± SEM on a per-oocyte basis.
2.8. γ H2AX Staining
DNA damage in oocytes was assessed by γH2AX immunofluorescence. Denuded oocytes were fixed in 4% paraformaldehyde (PFA) at 4 °C for 1 h, permeabilized with 0.5% Triton X-100 for 30 min at room temperature, and blocked in PBS containing 1% (w/v) BSA for 1 h. Samples were incubated overnight at 4 °C with an anti-γH2AX primary antibody (1:200; Beyotime, Shanghai, China), followed by Alexa Fluor 488-conjugated goat anti-rabbit IgG secondary antibody (1:500; Invitrogen, Carlsbad, CA, USA) for 1 h at room temperature in the dark. Nuclei were counterstained with DAPI (1 µg/mL; Invitrogen, USA), and fluorescence signals were observed using a laser scanning confocal microscope. For each oocyte, γH2AX intensity was quantified in ImageJ (NIH, Bethesda, MD, USA), and results were expressed as mean ± SEM.
2.9. Cortical Granule Staining
Cortical granule (CG) distribution in oocytes was assessed using FITC-conjugated lectin staining. Denuded oocytes were fixed in 4% paraformaldehyde (PFA) at 4 °C for 30 min, permeabilized with 0.1% Triton X-100 in PBS for 1 h at room temperature, and blocked with PBS containing 1% (w/v) BSA for 1 h. Samples were incubated overnight at 4 °C in the dark with FITC-conjugated Lens culinaris agglutinin (LCA; 1:300; Thermo Fisher Scientific, L32475, Carlsbad, CA, USA). After three washes in PBS, nuclei were counterstained with DAPI (1 µg/mL; Invitrogen, USA) for 5 min. Oocytes were mounted on glass slides, and CG distribution patterns were observed using a laser scanning confocal microscope.
2.10. Immunofluorescence Localization of EFNA5 and EPHA4
Immunofluorescence staining was performed to determine the localization of EFNA5 and its receptor EPHA4 in oocytes and cumulus cells. Samples were fixed in 4% paraformaldehyde (PFA) at 4 °C for 30 min, permeabilized with 0.1% Triton X-100 in PBS for 15 min at room temperature, and blocked with 1% BSA in PBS for 1 h. Cells were incubated overnight at 4 °C with primary antibodies against EFNA5 (1:100; ABMART, TP72055, Shanghai, China) and EPHA4 (1:100; Proteintech, 21875-1-AP, Wuhan, China). After three washes in PBS, samples were incubated with Alexa Fluor 488-conjugated secondary antibodies (1:1000; Invitrogen, Carlsbad, CA, USA) for 1 h at room temperature in the dark. Nuclei were counterstained with DAPI (1 µg/mL; Invitrogen, USA) for 5 min. EFNA5 and EPHA4 localization was visualized using a laser scanning confocal microscope.
2.11. Transcriptome Sequencing Analysis
To assess EFNA5-dependent transcriptional changes, MII oocytes and cumulus cells were harvested after 24 h of IVM from control and EFNA5-treated groups for RNA-seq. Only morphologically normal oocytes (extruded first polar body and homogeneous cytoplasm) were selected, with 5-6 oocytes per sample and at least three biological replicates per group. Total RNA was extracted using a single-cell full-length mRNA amplification kit (i-SingleCell, Cat. No. N712). Libraries were prepared with a modified Smart-seq2 protocol using the TePrep™ DNA Library Prep Kit V2 (Azenta Life Sciences, USA), and library quality was assessed using a Qubit 4.0 Fluorometer and a Fragment Analyzer. Cross-species oocyte RNA-seq datasets from multiple species were obtained from the NCBI Gene Expression Omnibus (GEO; accessions: GSE158539 [22], GSE165546 [23], GSE233232 [24], GSE148022 [18], GSE95477 [25], GSE119906 [26], GSE61717 [27], GSE160334 [28])
Sequencing was performed on an Illumina NovaSeq™ X Plus platform with 150 bp paired-end reads. Adapters and low-quality reads were trimmed with Cutadapt v2.10 and Trim Galore v0.6.5. Clean reads were aligned to the ovine genome Oar_v3.1 (Ensembl release 106) using HISAT2 v2.2.1, and transcript abundance was quantified with RSEM v1.3.3 as TPM. Differential expression analysis was conducted using DESeq2 (|log2FC| > 1.5, adjusted P < 0.05). Gene Ontology (GO) and Kyoto Encyclopedia of Genes and Genomes (KEGG) enrichment analysis were performed with clusterProfiler v4.0.5, and gene set enrichment analysis (GSEA) was conducted using GSEA v4z.
2.12. RNA Extraction and Quantitative Real-time PCR (qRT-PCR)
Total RNA was extracted using a micro-scale RNA extraction kit (Tiangen, China) and reverse-transcribed into cDNA with a reverse transcription kit (Vazyme, China). Quantitative PCR was performed using SYBR Green qPCR Master Mix (Takara, Japan) in a 20 μL reaction containing 10 μL SYBR Premix Ex Taq II, 6 μL RNase-free water, 2 μL cDNA, and 1 μL of each primer. Cycling conditions were 95 °C for 30 s, followed by 40 cycles of 95 °C for 5 s, 60 °C for 30 s, and 72 °C for 30 s. ACTB served as the internal control, and relative expression levels were calculated using the 2-ΔCt method. The sequences of primers are provided in Supplementary Table S1.
2.13. Protein Extraction and Western Blot Analysis
Oocytes, cumulus cells, or COCs from control and EFNA5-treated groups were lysed in RIPA buffer with protease inhibitors (Beyotime, China). Lysates were sonicated and centrifuged at 12,000 × g for 10 min at 4 °C. Protein concentrations were measured using a BCA Protein Assay Kit (Thermo Fisher, USA). Equal amounts of protein (10 μg) were separated by SDS-PAGE and transferred to PVDF membranes (Millipore, USA). Membranes were blocked with 5% skim milk for 1 h at room temperature and incubated overnight at 4 °C with primary antibodies. After washing with TBST, membranes were incubated with HRP-conjugated secondary antibodies (1:8000, Jackson, USA) for 1 h at room temperature. Protein signals were detected using ECL substrate (Thermo Fisher, USA) and imaged on a Bio-Rad ChemiDoc system. Band intensities were quantified with ImageJ, using GAPDH as the internal control.
For clarity of presentation and consistency across figures, some Western blot images were horizontally flipped to align with the order of sample loading described in the figure legends. The original, uncropped scans of all blots with lanes clearly annotated are provided in the Supplementary Information. The orientation does not affect the data interpretation or conclusions.
2.14. Statistical Analysis
All experiments were performed with at least three biological replicates. Statistical analyses and visualization were conducted using GraphPad Prism 8. Data normality was assessed with the Shapiro-Wilk test, and variance homogeneity was evaluated. For comparisons between two groups, a two-tailed t-test was used if normality and homogeneity of variance were met; for comparisons between multiple groups, a one-way analysis of variance with Dunnett’s post hoc test was used if parametric assumptions were met. Data are presented as mean ± SEM. Statistical significance is indicated as * p < 0.05, ** p < 0.01, *** p < 0.001, and **** p < 0.0001. Different letters in figures indicate significant differences between groups (p < 0.05).
3. Results
3.1. The Expression Pattern of EFNA5 and EPHA4 in Ovine COCs
To investigate whether EFNA5 is broadly associated with oocyte development, we first re-analyzed publicly available transcriptomic datasets from multiple mammalian species, including humans, monkey, mouse, pig, cattle, and sheep. Although different members of the EFNA family exhibited species-specific expression patterns, EFNA5 was consistently detected in germinal vesicle (GV) and metaphase II (MII) oocytes across all examined species (Figure 1A). Comparative analysis further revealed that EFNA5 expression remained relatively stable during the GV-to-MII transition in primates and mice, whereas pronounced changes were observed in livestock species, particularly in ovine oocytes (Figure 1B). These data suggest that EFNA5 may play a relatively conserved role in oocyte development in various species.
To further define the expression pattern of EFNA5, we performed western blotting on isolated oocytes and cumulus cells at the GV and MII stages. The EFNA5 protein was detected exclusively in oocytes and was undetectable in cumulus cells at both stages (Figure 1C). Immunofluorescence staining further corroborated this result, showing EFNA5 confined to the oocyte with no detectable signal in the surrounding cumulus cells at either stage (Figure 1D). qRT-PCR quantification confirmed that EFNA5 transcripts were significantly enriched in oocytes relative to cumulus cells, whereas among the Eph receptors assayed, EPHA4 emerged as the predominantly expressed receptor, with higher levels detected in both cell types (Figure 1E). Immunofluorescence staining provides spatial localization, indicating that EPHA4 shows signals detected in both oocytes and cumulus cells (Figure 1F). Collectively, these results confirm that EFNA5 is an oocyte-derived factor with evolutionarily conserved expression and dynamic regulation during oocyte maturation.
3.2. EFNA5 Enhances In Vitro Matured Oocyte Developmental Potential
We investigated whether oocyte IVM affects the expression of EFNA5. The result revealed that EFNA5 expression in in vitro matured oocytes was markedly lower than in vivo matured counterparts in humans and sheep, whereas an opposite trend was observed in mice (Figure 2A). These findings suggest that EFNA5 may represent a key factor lacking in human and sheep in vitro culture systems. Recombinant EFNA5 was supplemented into sheep oocyte IVM medium at concentrations of 0, 10, 50, and 100 ng/mL to assess its functional effects (Figure 2B). EFNA5 treatment did not significantly alter cleavage rates (Figure 2C); however, the blastocyst rate was markedly increased in the 50 ng/mL group (Figure 2D). Blastocyst quality was further evaluated by quantifying total cell numbers and the incidence of apoptosis (Figure 2E). The total blastocyst cell numbers were significantly higher in the 50 ng/mL and 100 ng/mL groups compared with controls (Figure 2F). Consistently, TUNEL assays showed that the proportion of apoptotic cells was also significantly reduced in the 50 ng/mL group (Figure 2G). Collectively, these results indicate that EFNA5 supplementation during IVM enhances oocyte developmental potential, as evidenced by increased blastocyst formation rates and superior blastocyst quality.
3.3. EFNA5 Enhances Maturation Status of COCs
Because communication between cumulus cells and oocytes is critical for oocyte maturation, we first assessed the effect of EFNA5 supplementation on cumulus expansion during IVM. Morphological evaluation and expansion index analysis showed that the proportion of COCs with higher expansion grades increased after treatment with 50 ng/mL EFNA5 compared with the control group (Figure 3A,B). Further analysis revealed that the expression of key genes associated with cumulus cell migration and extracellular matrix remodeling, including pentraxin 3 (PTX3), hyaluronan synthase (HAS), prostaglandin G/H synthase 2 (PTGS2), and tumor necrosis factor alpha-induced protein 6 (TNFAIP6), were significantly upregulated in COCs treated with 50 ng/mL EFNA5 (Figure 3C). These results indicate that EFNA5 can improve the cumulus cell microenvironment, thereby optimizing conditions for oocyte maturation. Because cumulus-cell viability is indispensable for oocyte maturation, we next quantified apoptosis within COCs. TUNEL staining revealed that oocytes in EFNA5-treated groups exhibited a significantly lower proportion of apoptotic cells compared with controls (Figure 3D,E). Consistently, qRT-PCR analysis showed that EFNA5 markedly downregulated the expression of the pro-apoptotic factor TP53 while upregulating the anti-apoptotic factor BCL2 (Figure 3F). Taken together, these findings indicate that EFNA5 enhances oocyte developmental competence by promoting cumulus expansion, improving the cumulus-oocyte microenvironment, and inhibiting apoptosis. This observation is highly consistent with the previously described improvements in blastocyst formation rate and quality, further supporting a pivotal regulatory role for EFNA5 during oocyte maturation.
3.4. Effects of EFNA5 on the Transcriptional Profile of Oocytes Matured In Vitro
To elucidate the molecular mechanisms underlying the beneficial effects of EFNA5 on oocyte developmental competence, we performed RNA-sequencing on MII oocytes from the control and EFNA5-treated groups. Principal-component analysis (PCA) revealed discrete clustering of the two groups, underscoring a robust treatment-specific transcriptomic signature (Figure 4A). Volcano-plot filtering identified 565 differentially expressed genes (DEGs): 129 upregulated and 436 downregulated genes in EFNA5-treated oocytes (Figure 4B). Hierarchical heatmap visualization further highlighted the global transcriptional alterations induced by EFNA5 supplementation (Figure 4C).
GO enrichment analysis demonstrated that these DEGs were predominantly associated with biological processes related to redox homeostasis, regulation of apoptosis, hypoxia response, and cytokine signaling (Figure 4D). Consistently, KEGG pathway analysis revealed significant enrichment in autophagy, apoptosis, lysosome, AMPK and mTOR signaling, HIF-1 signaling, and the p53 pathway, all of which are crucial for stress response and cell survival (Figure 4E). Further inspection of representative genes showed that EFNA5 treatment markedly upregulated classical NRF2 targets such as SOD2, while the negative regulators of NRF2 activity, including KEAP1, were downregulated, supporting the enhanced activation of the NRF2 pathway (Figure 4F). Conversely, key components of the NF-κB signaling cascade, such as RELA, IKBKB, and NFKB1, were significantly reduced, whereas the inhibitory subunit NFKBIB was elevated, indicating effective suppression of NF-κB nuclear activity (Figure 4G). Moreover, apoptosis-related analysis revealed suppression of pro-apoptotic genes such as BAD、CASP3、CASP8、FADD and concomitant upregulation of the anti-apoptotic factor BCL2, indicating reduced apoptotic activity in EFNA5-treated oocytes (Figure 4H).
GSEA revealed that EFNA5-treated oocytes exhibited significant enrichment of pathways associated with glutathione metabolism, inflammatory signaling, and apoptosis (Figure 4I). Notably, glutathione metabolism was positively enriched, while ROS response, NF-κB signaling, and p53-mediated apoptosis were negatively enriched, reflecting enhanced antioxidant defense, reduced inflammatory activity, and suppression of apoptosis. Protein-protein interaction (PPI) network analysis identified NFE2L2 (NRF2), RELA, IL6, and TP53 as hub genes, underscoring their pivotal roles in orchestrating oxidative stress response, apoptosis, and inflammation (Figure 4J). Collectively, these findings demonstrate that EFNA5 supplementation during IVM reprograms the transcriptomic landscape of oocytes, thereby enhancing antioxidant capacity, suppressing inflammatory signaling, and mitigating apoptosis, likely through modulation of the NRF2 and NF-κB pathways.
3.5. EFNA5 Enhances Oocyte Redox Homeostasis
To test whether the transcriptome-predicted antioxidant effect of EFNA5 manifests at the cellular level, we profiled redox status and cytological hallmarks of oocyte quality in parallel. EFNA5 markedly lowered intracellular ROS while increasing GSH content (Figure 5A,B). Considering the close relationship between lipid metabolism and oxidative stress, we next examined lipid peroxidation accumulation using BODIPY staining [29]. Consistently, lipid peroxidation was attenuated, as evidenced by a reduced oxidized C11-BODIPY 581/591 signal and a decreased oxidized/reduced ratio (Figure 5C,D). At the transcriptional level, EFNA5 upregulated canonical antioxidant genes, including SOD1, SOD2, SOD3, CATALASE, GCLM, and GCLC (Figure 5I). Concomitantly, DNA damage was alleviated, with γH2AX fluorescence significantly reduced (Figure 5G,H), and cytoplasmic maturation indices improved, as shown by stronger and more uniform cortical-granule labeling with LCA lectin (Figure 5E,F). Together, these data indicate that EFNA5 restores redox balance, limits oxidative stress-associated damage, and enhances oocyte quality, thereby supporting higher developmental competence.
3.6. EFNA5 Alters the Transcriptional Profile of Cumulus Cells
To determine how EFNA5 reshapes cumulus cell function, we performed RNA-seq on cumulus cells recovered from COCs matured with or without EFNA5. PCA revealed a clear separation between the two groups, indicating that EFNA5 treatment substantially altered the transcriptomic landscape of cumulus cells (Figure 6A). Volcano plot filtering identified 444 DEGs, including 348 up-regulated and 96 down-regulated genes (Figure 6B). Heatmap visualization further highlighted the EFNA5-induced transcriptional changes, suggesting a broad regulatory impact on cumulus cells (Figure 6C). Functional enrichment of DEGs in EFNA5-treated cumulus cells mirrored the trends observed in oocytes. GO terms were significantly enriched for cellular redox homeostasis and regulation of apoptotic process, together with modules linked to extracellular matrix (ECM) organization, cell-matrix adhesion/integrin-mediated signaling, cytoskeleton dynamics, and protein phosphorylation (Figure 6D). KEGG analysis highlighted PI3K-Akt, TNF and NF-κB signaling pathways (inflammatory control), peroxisome (oxidative detoxification), and adhesion/cytoskeleton pathways including ECM–receptor interaction, focal adhesion, and regulation of actin cytoskeleton; ABC transporters also emerged among enriched terms (Figure 6E).
Detailed interrogation of key functional pathways revealed that antioxidant genes such as KEAP1, GSR, GCLC and SOD2 were significantly up-regulated in EFNA5-treated cumulus cells, suggesting activation of the NRF2 pathway (Figure 6F). In contrast, pro-inflammatory genes including RELA was down-regulated, indicating an anti-inflammatory effect (Figure 6F). Apoptosis focused analysis further showed marked down-regulation of pro-apoptotic regulators (CASP8, FADD, BAD), confirming that EFNA5 concurrently dampens oxidative stress, quells inflammation, and curbs apoptosis in cumulus granulosa cells (Figure 6F). This data was concordant with the observed phenotype of reduced apoptosis following EFNA5 treatment. Considering that EFNA5 itself is involved in cell adhesion, we further analyzed cumulus cell adhesion-related genes. The results showed significant upregulation of ITGB1, VCAM1, FN1, and CDH2 in the EFNA5-treated group (Figure 6G), suggesting that EFNA5 may enhance cumulus cell adhesion and motility, thereby strengthening cumulus cell-oocyte interactions and synergistically supporting oocyte maturation
3.7. EFNA5 Regulates NRF2 and NF-κB Signaling in COCs
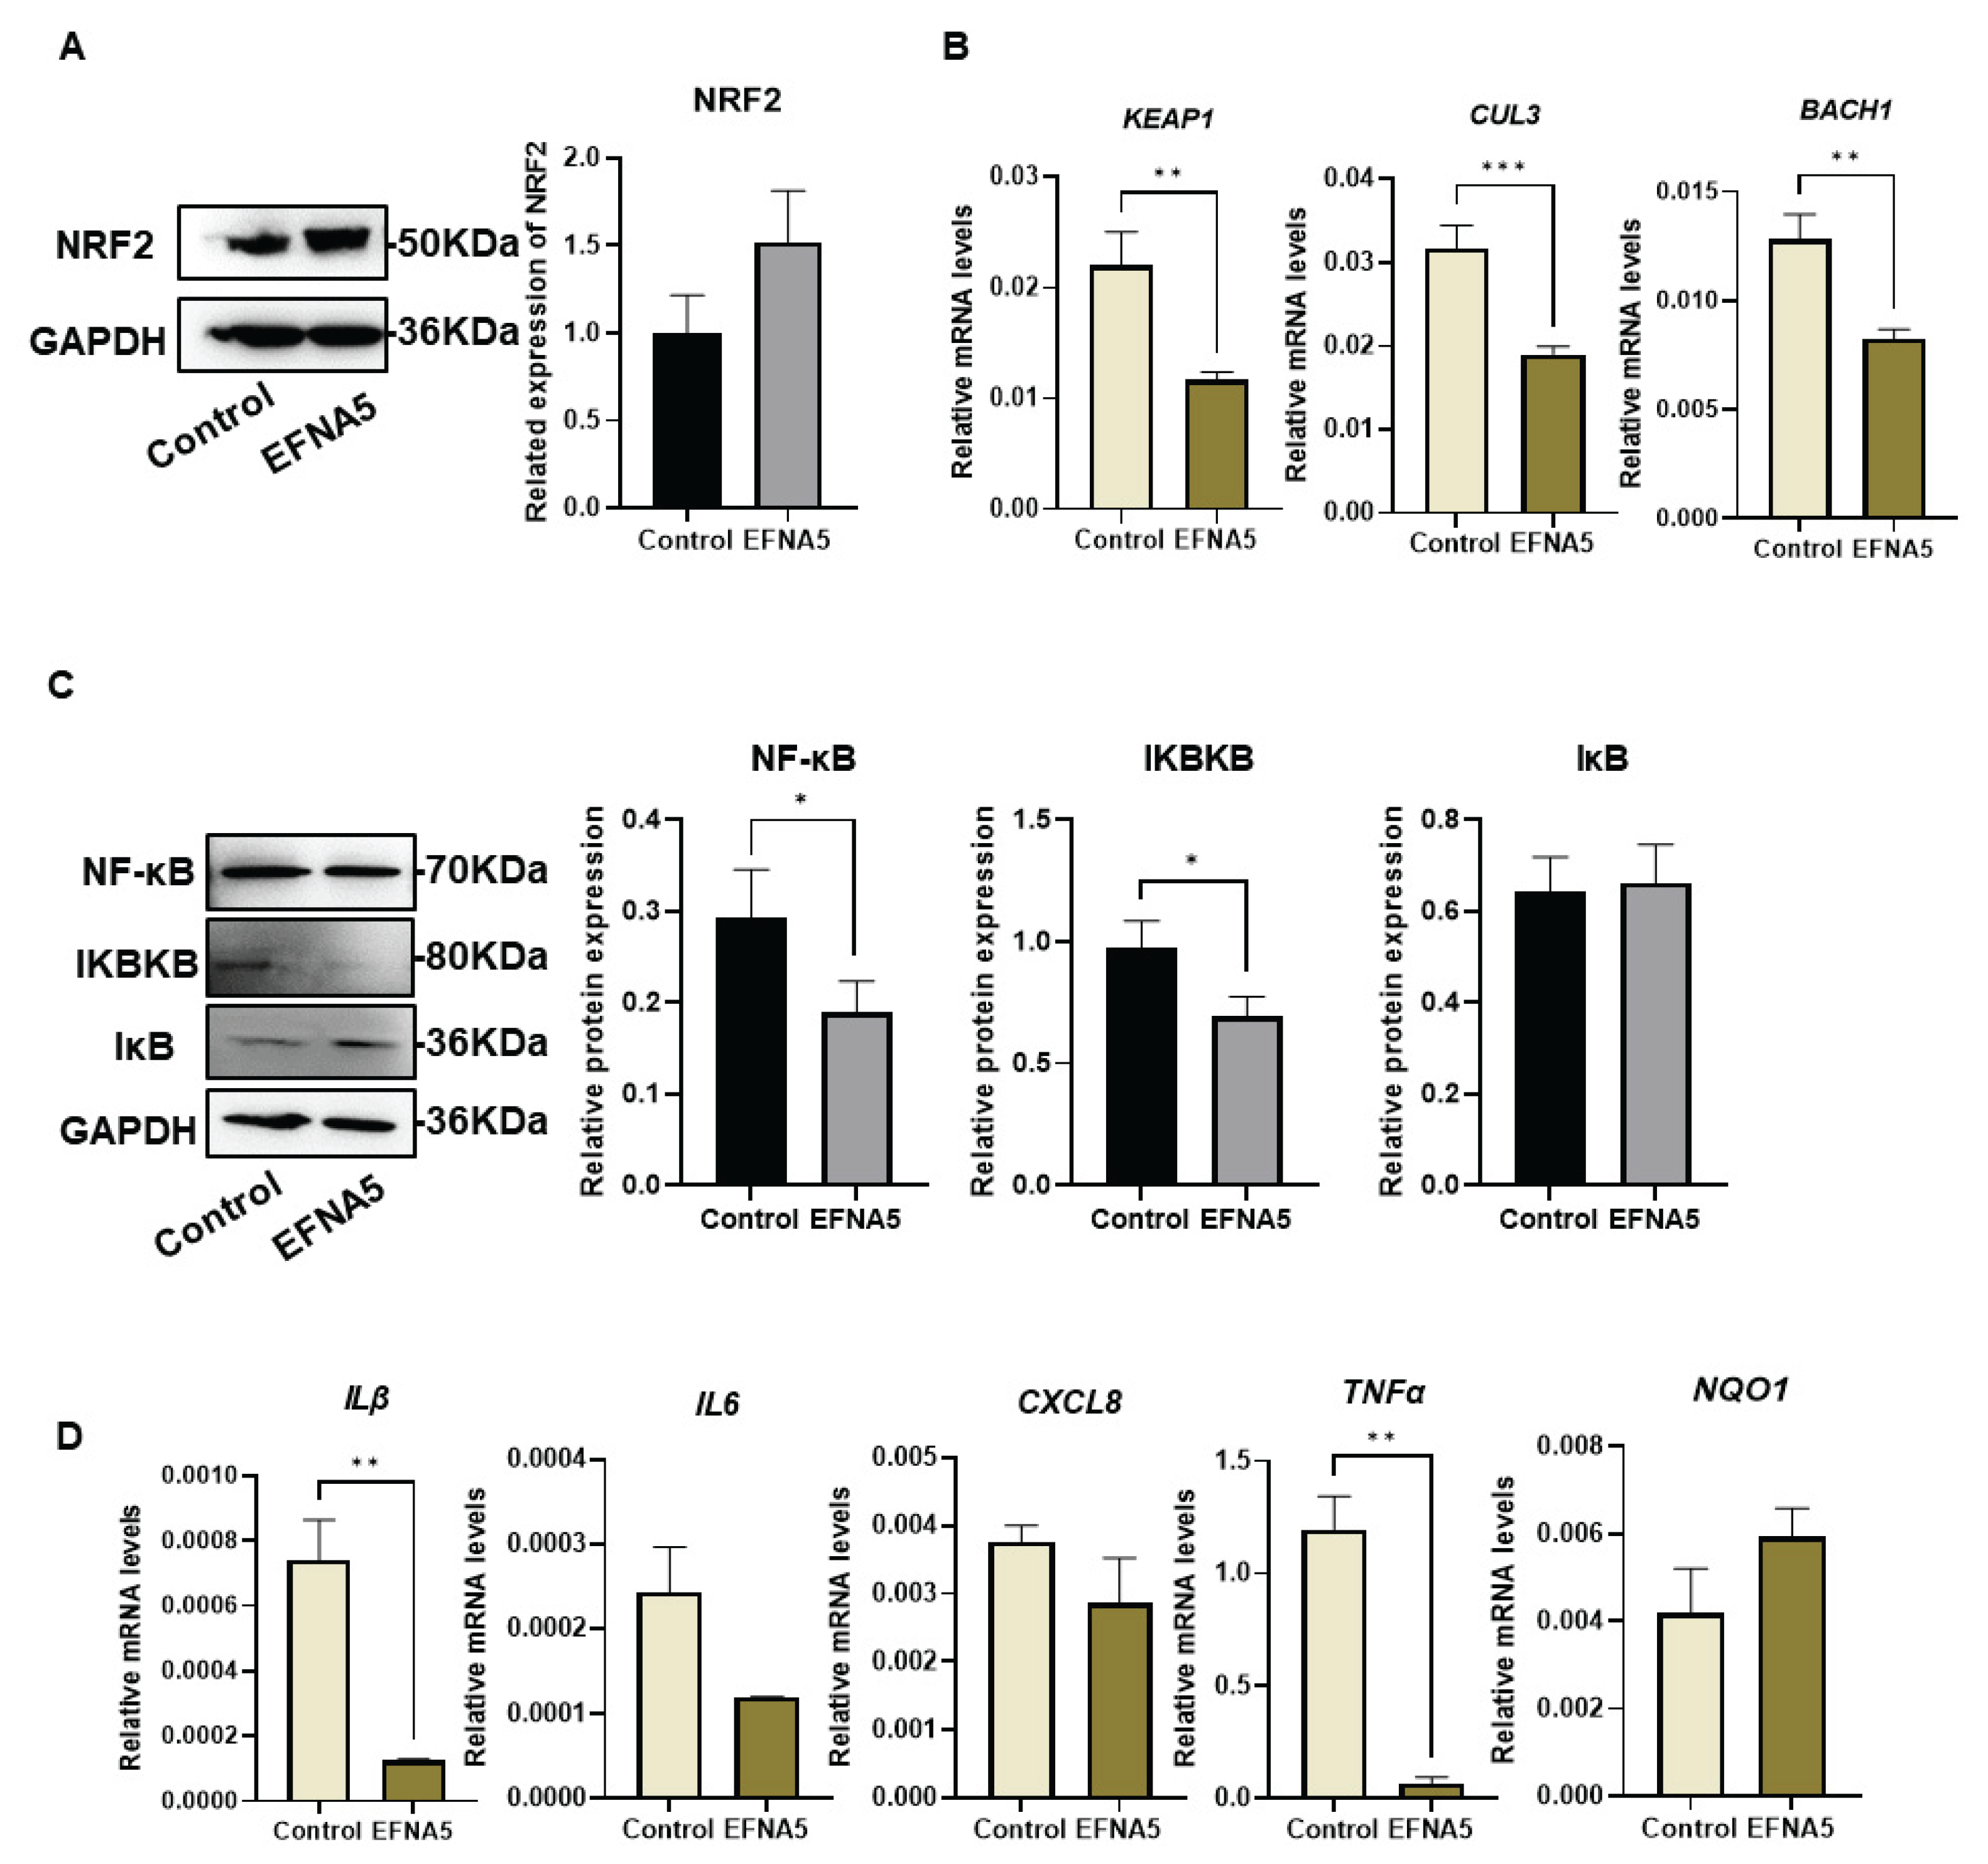
To further elucidate the molecular mechanisms by which EFNA5 enhances the developmental potential of oocytes and the function of cumulus cells, we focused on the NRF2-mediated antioxidant pathway and the NF-κB inflammatory cascade highlighted by our transcriptomic analysis. Western blotting revealed that EFNA5 treatment markedly increased accumulation of NRF2 in oocytes (Figure 7A), suggesting enhanced NRF2 activation. Consistently, the mRNA levels of NRF2 inhibitory regulators, including KEAP1, CUL3, and BACH1, were significantly reduced (Figure 7B), indicating that EFNA5 may potentiate NRF2 activity by suppressing its negative regulators. In parallel, EFNA5 treatment led to a pronounced decrease in phosphorylated NF-κB p65 (p-p65) and IKBKB expression, while IκB levels were slightly elevated (Figure 7C), implying that NF-κB activation was impaired. Consistent with attenuation of NF-κB signaling, EFNA5 significantly reduced the mRNA abundance of IL1β and TNFα in oocytes (Figure 7D). In contrast, the NRF2 target NQO1 was upregulated, supporting activation of the antioxidant program. Taken together with the redox results, these data indicate that EFNA5 enhances oocyte quality and developmental competence by activating NRF2-driven antioxidant defenses while concurrently dampening NF-κB–dependent pro-inflammatory cytokine transcription.
4. Discussion
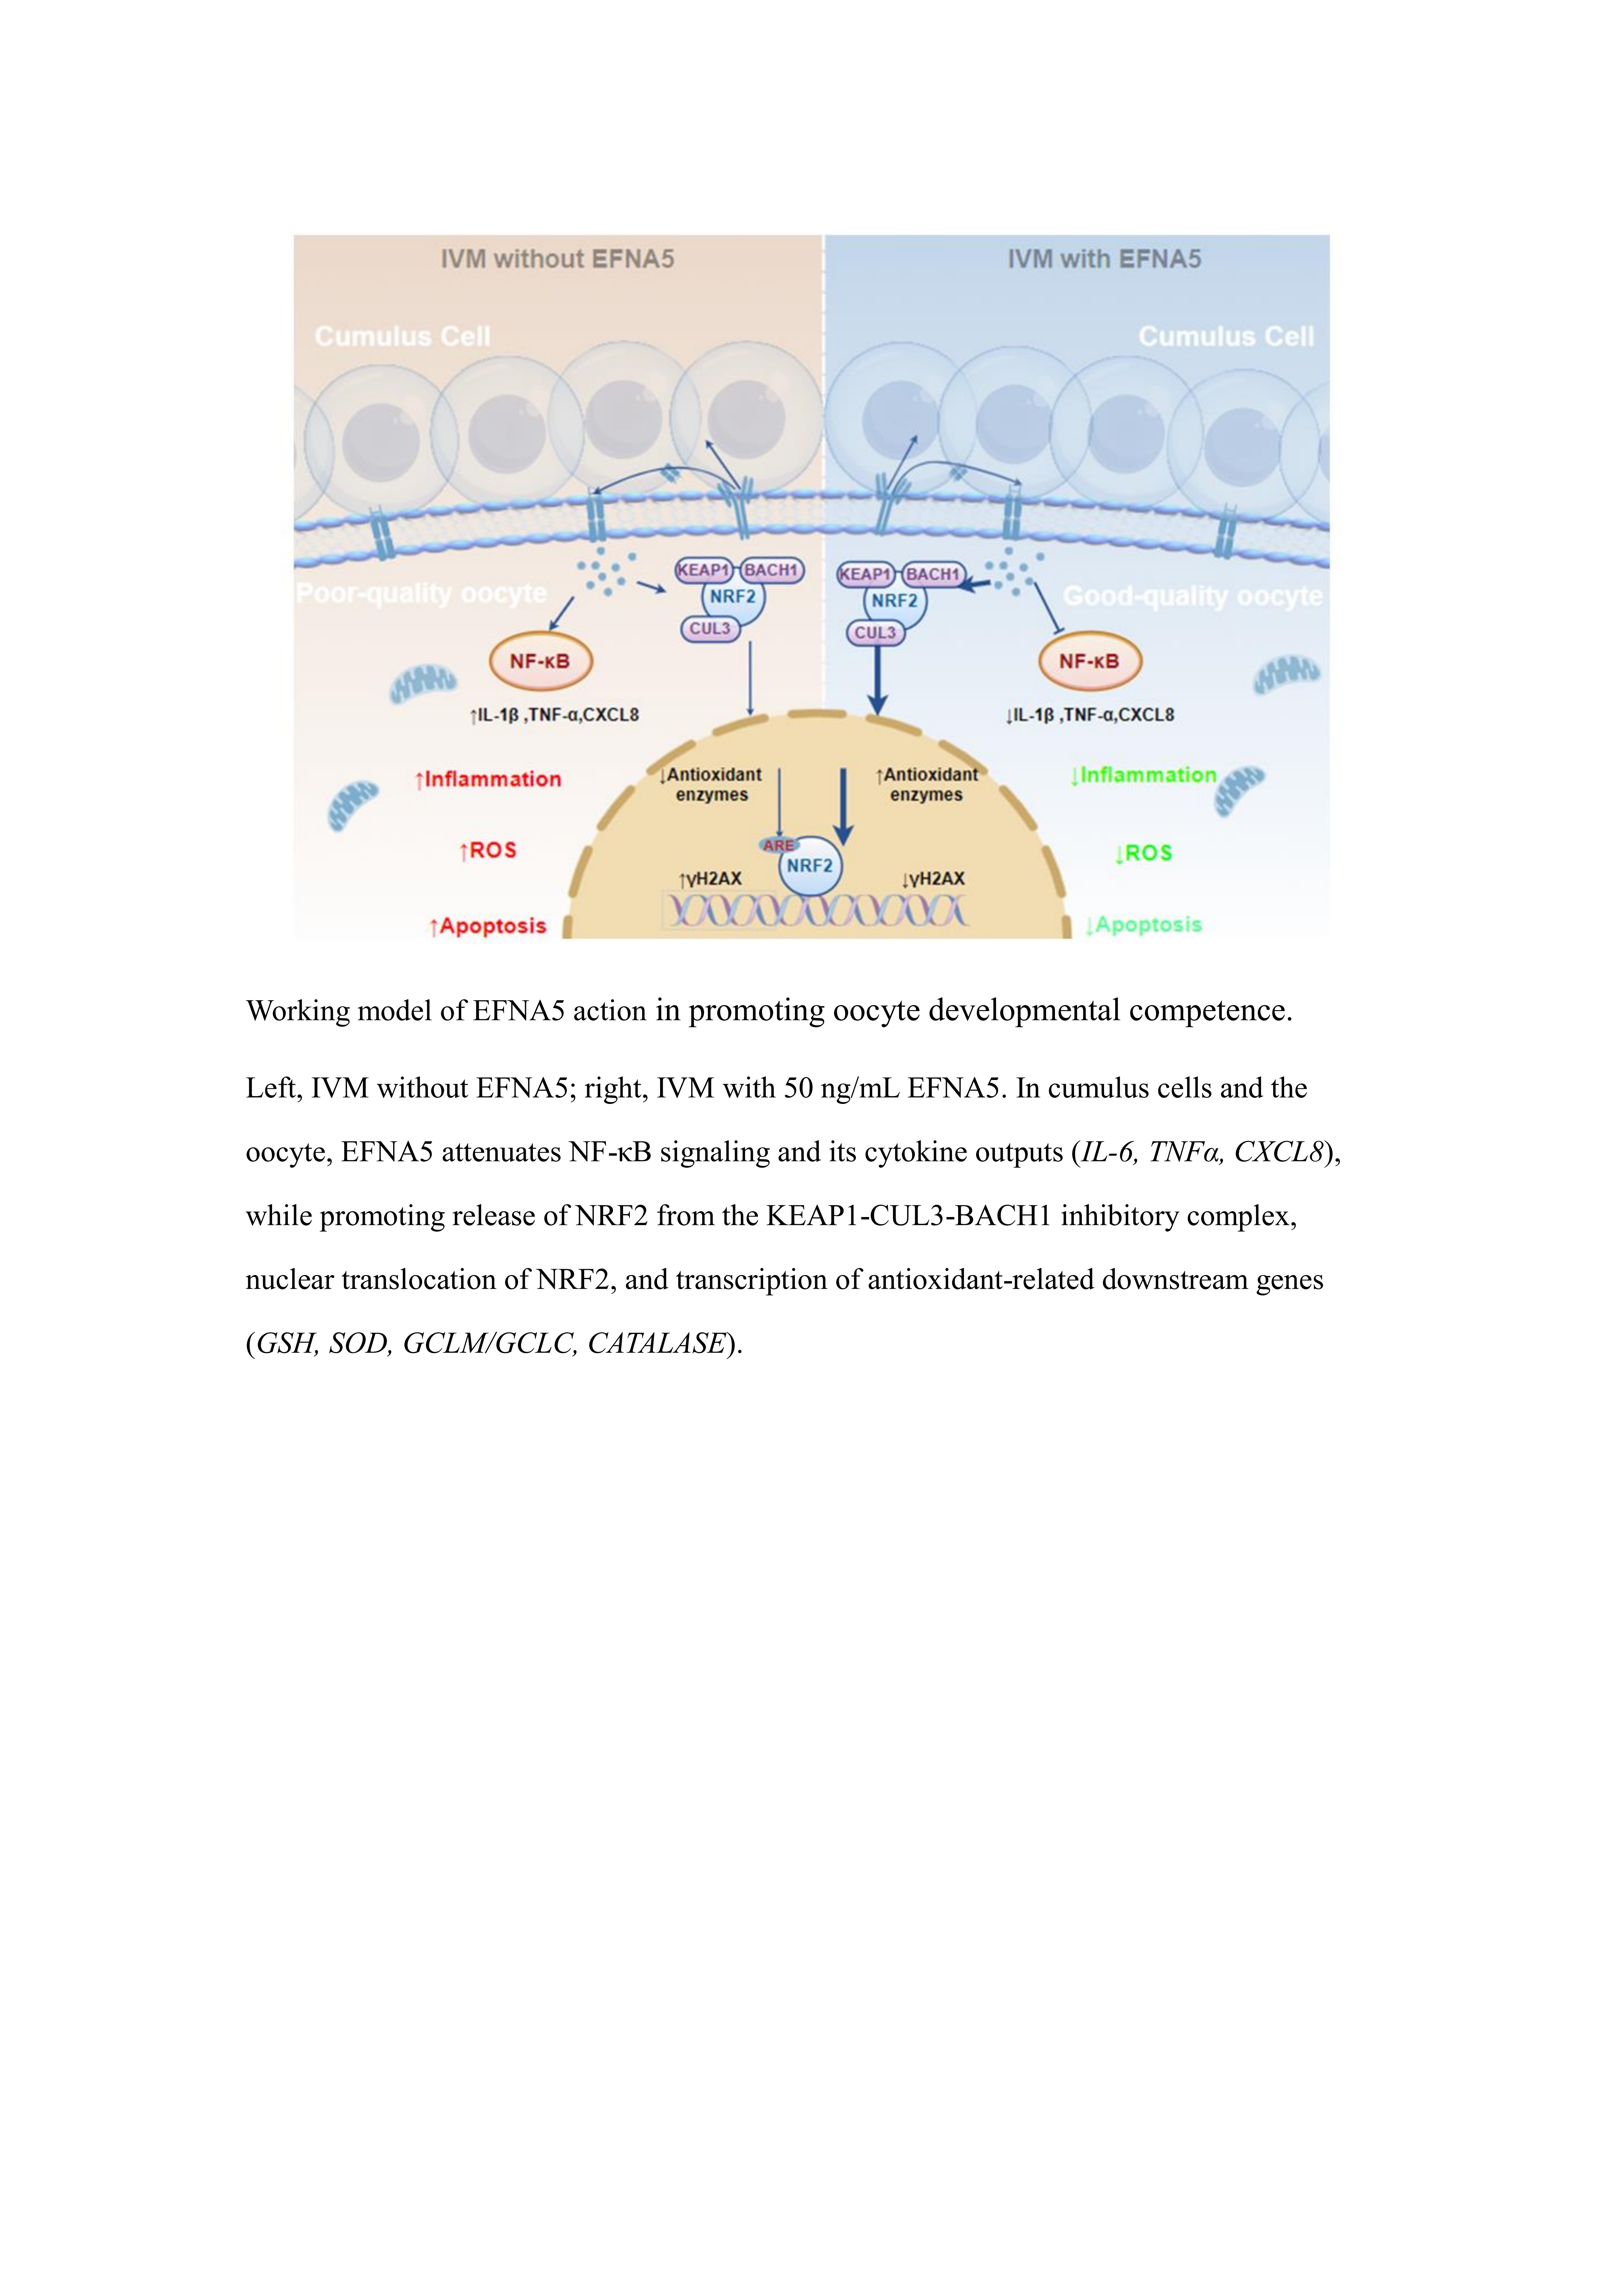
IVM is a critical step in mammalian ART, yet the limited maturation quality and developmental competence of oocytes remain major obstacles to its broader application [30,31]. ODFs play central roles in maintaining oocyte developmental potential and shaping the follicular microenvironment. Among them, the classical ODFs, GDF9 and BMP15, have been shown to regulate cumulus cell proliferation and extracellular matrix formation, thereby supporting folliculogenesis and embryo development [31,32]. However, the diversity and functional mechanisms of ODFs remain incompletely understood. In this study, we provide the first systematic evidence that EFNA5 functions as a bona fide oocyte-derived factor (ODF) that orchestrates IVM competence at both the oocyte and cumulus levels. Mechanistically, EFNA5 enhances the NRF2-mediated antioxidant defense pathway while concurrently suppressing NF-κB–driven inflammatory signaling, thereby attenuating ROS accumulation, reducing apoptosis, and stabilizing redox homeostasis. These coordinated effects ultimately improve oocyte quality and developmental competence under in vitro maturation conditions.
Cross-species transcriptomic analyses revealed that EFNA5 is stably expressed in oocytes, indicating its evolutionary conservation as a ODF. In the ovine model, EFNA5 was predominantly enriched in oocytes, whereas its main receptor, EPHA4, showed expression both in oocytes and granulosa cells. This spatiotemporal specificity suggests that EFNA5 may act via autocrine or paracrine signaling to orchestrate oocyte maturation, providing a theoretical basis for its functional study in vitro. Notably, both the direction and magnitude of EFNA5’s effects appear to be species dependent. In human and sheep, EFNA5 abundance is lower in IVM than in in vivo matured oocytes, whereas mice show the opposite trend. EFNA5 has been reported to promote apoptosis in murine granulosa cells [17], yet in sheep it exerts a clearly anti-apoptotic action that protects oocytes and improves embryo quality.
A straightforward explanation is that EFNA5 engages different EphA receptors across species, and the abundance of these receptors varies between oocytes and granulosa cells. EFNA5 can bind to multiple EPA isoforms, including EPHA4, EPHA5, and EPHA7, but the relative receptor expression differs not only across species but also between cell types within the same species [33,34,35]. Distinct EphA receptors recruit different adaptor protein complexes and preferentially activate specific downstream pathways. For instance, in pancreatic islet cells, EFNA5 interacts with EPHA5 to mediate intercellular communication and regulate glucose-stimulated insulin secretion [36]. In neuronal and epithelial cells, EFNA5 binding to EPHA3 or EPHA7 modulates cell adhesion and cytoskeletal organization [37]. In our ovine dataset, EA4 was identified as the predominant receptor in granulosa cells, whereas in the mouse ovary, other EphA isoforms appear to be more enriched [17]. In addition, species-specific differences have been widely reported for other ODFs. In mice, GDF9 and BMP15 strongly promote cumulus expansion and enhance oocyte developmental competence [30]. Notably, GDF9 deficiency leads to complete follicular arrest, whereas BMP15 deficiency results only in reduced fertilization efficiency and subfertility [38]. By contrast, in sheep, both GDF9 and BMP15 are indispensable; immune neutralization of either factor causes follicular blockage and anovulation in most ewes, while partial neutralization of BMP15 markedly increases ovulation rate, suggesting a dose-dependent effect [32]. In cattle, both GDF9 and BMP15 are essential for follicular development and ovulation [39], while in humans, mutations or deficiencies in these factors are more often associated with diminished ovarian reserve or subfertility rather than absolute infertility [40,41]. Collectively, these findings highlight that ODF-mediated mechanisms exhibit pronounced interspecies differences in both functional significance and regulatory strength.
Using the ovine IVM model, we further elucidated the molecular actions of EFNA5. Supplementation with 50 ng/mL EFNA5 significantly increased blastocyst rates, with enhanced total cell numbers and reduced cell apoptosis. These findings indicate that EFNA5 may not only promotes cell proliferation but also mitigates apoptosis, thereby improving overall blastocyst quality. Such effects align with previous studies demonstrating that OFDs, including GDF9 and BMP15, regulate granulosa cell proliferation, extracellular matrix formation, and key signaling pathways to support follicle growth, ovulation, and early embryonic development [31,32]. Furthermore, the expansion of COCs serves as an important indicator of granulosa cell function and oocyte competence during IVM [42]. COCs expansion reflect granulosa cell secretion of hyaluronic acid and remodeling of the extracellular matrix, processes that provide nutritional and signaling support to oocytes and maintain microenvironmental homeostasis [21]. EFNA5 supplementation markedly increased COCs expansion and reduced oocyte apoptosis, suggesting that EFNA5 enhances oocyte-granulosa cell interactions and protects oocytes from apoptotic damage. Notably, EFNA5 exhibited an optimal concentration effect, with 50 ng/mL being most effective for improving oocyte maturation and quality, while higher doses resulted in attenuated benefits, possibly due to feedback inhibition by endogenous EFNA5. Oxidative stress and inflammation are major limiting factors for oocyte developmental competence during IVM [43,44]. IVM oocytes frequently exhibit elevated ROS levels, depleted glutathione, and lipid peroxidation accumulation, which disrupt intracellular redox homeostasis, increase DNA damage, and cause spindle abnormalities, ultimately restricting oocyte maturation and subsequent embryonic development [45]. Activation of inflammatory pathways can further induce pro-apoptotic gene expression, exacerbating oocyte damage [46,47]. In this study, EFNA5 treatment significantly upregulated NRF2-mediated antioxidant pathways, including SOD2 and GPX4, while suppressing NF-κB signaling and downstream pro-inflammatory genes such as IL6 and TNFα. This dual regulation of oxidative stress and inflammation likely contributes to the improved oocyte quality and enhanced embryonic potential observed in EFNA5-treated groups. Complementary studies in neurons, endothelial cells, and metabolic tissues support EFNA5’s role in modulating oxidative and inflammatory responses [48,49].
Cell adhesion is essential for intercellular communication, microenvironmental stability, and tissue integrity, particularly in cumulus cells surrounding oocytes. Strong adhesion maintains the structural integrity of the COCs, which is critical for oocyte maturation [50,51]. EFNA5, as a membrane-bound ligand interacting with EphA receptors, mediates contact-dependent signaling that regulates cytoskeletal remodeling, strengthens intercellular adhesion, and stabilizes cell-matrix attachments. In neurons, EFNA5 modulates adhesion proteins such as integrins and focal adhesion components to guide axon pathfinding and synaptic stability; in endothelial cells, it promotes cell-cell junctions and vascular formation [52,53]. Our granulosa cell transcriptome analysis suggests that EFNA5 may enhance adhesion-related gene expression, indicating a potential mechanism for improved COCs stability and oocyte support, although functional validation of key adhesion molecules is warranted.
Here, we provide the first comprehensive evidence establishing EFNA5 as a newly identified oocyte-derived factor that significantly improves IVM performance. EFNA5 improves antioxidant capacity, suppresses inflammatory signaling, reduces apoptosis, and potentially regulates cell adhesion and motility, thereby optimizing the oocyte microenvironment and maintaining blastocyst quality. In conclusion, EFNA5 provides a novel molecular foundation for optimizing IVM systems and offers critical insights into the function of oocyte-derived factors. Further elucidation of the synergistic effects of multiple oocyte-derived factors could pave the way for enhancing mammalian oocyte developmental competence and refining clinical ART strategies.
5. Conclusions
EFNA5 emerges as an evolutionarily conserved oocyte-derived ligand that safeguards oocyte competence during in vitro maturation. By activating NRF2-driven antioxidant defenses and dampening NF-κB–mediated inflammation, EFNA5 enhances cumulus–oocyte communication, lowers apoptosis, and improves cytoplasmic and nuclear maturation. Functionally, EFNA5 supplementation increases blastocyst formation and embryo quality. These findings establish EFNA5 as a novel oocyte-secreted regulator essential for protecting oocyte competence under culture-induced stress and highlight its potential application in optimizing IVM systems and ART.
Author Contributions
X.L.: Writing-review & editing, Writing-original draft, Visualization, Software, Formal analysis, Data curation. J.C.: Writing-original draft, Visualization, Formal analysis, Data curation. Y.W.: Visualization, Formal analysis. J.H.: Data curation. D.C.: Data curation. L.C.: Supervision, Data curation. H.H.: Data curation. L.A.: Supervision, Data curation. J.T.: Writing-review & editing, Resources, Project administration, Funding acquisition, Conceptualization. G.X.: Writing-review & editing, Visualization, Software, Formal analysis, Supervision, Conceptualization. All authors have read and agreed to the published version of the manuscript.
Funding
This research was funded by Sci-Tech Innovation 2030 Agenda (No. 2023ZD040750202, 2022ZD040130301), Inner Mongolia Autonomous Region Science and Technology Innovation Major Demonstration Project (No.2025ZDSF0018), Central-led Local Science and Technology Development Funds (No. 2024ZY0160).
Institutional Review Board Statement
All experiments were conducted in compliance with the relevant regulations and requirements of China Agricultural University and were approved by its Animal Welfare Committee (AW11905202-1-02).
Data Availability Statement
The data are available from the first author, Xingyuan Liu (19806395675@163.com), upon request.
Acknowledgments
The authors would like to thank Inner Mongolia Sino Sheep Breeding Company for their technical support. We also wish to acknowledge Dr. Dayong Chen, Dr. Lei Cheng, and Mrs. Huijie He for their valuable contributions to this work. The authors are grateful for their assistance.
Conflicts of Interest
The authors declare no conflicts of interest.
References
- Mostinckx, L.; Goyens, E.; Mackens, S.; Roelens, C.; Boudry, L.; Uvin, V. Clinical outcomes from ART in predicted hyperresponders: in vitro maturation of oocytes versus conventional ovarian stimulation for IVF/ICSI. Hum. Reprod. 2024, 39, 586–594. [Google Scholar] [CrossRef] [PubMed]
- Banwell, K.M.; Thompson, J.G. In vitro maturation of mammalian oocytes: outcomes and consequences. Semin. Reprod. Med. 2008, 26, 162–174. [Google Scholar] [CrossRef]
- De Vos, M.; Grynberg, M.; Ho, T.M.; Yuan, Y.; Albertini, D.F.; Gilchrist, R.B. Perspectives on the development and future of oocyte IVM in clinical practice. J. Assist. Reprod. Genet. 2021, 38, 1265–1280. [Google Scholar] [CrossRef]
- Eppig, J.J.; O’Brien, M.J.; Wigglesworth, K.; Nicholson, A.; Zhang, W.; King, B.A. Effect of in vitro maturation of mouse oocytes on the health and lifespan of adult offspring. Hum. Reprod. 2009, 24, 922–928. [Google Scholar] [CrossRef]
- Chian, R.; Li, J.; Lim, J.; Yoshida, H. IVM of human immature oocytes for infertility treatment and fertility preservation. Reprod. Med. Biol. 2023, 22, e12524. [Google Scholar] [CrossRef]
- Gilchrist, R.B.; Thompson, J.G. Oocyte maturation: emerging concepts and technologies to improve developmental potential in vitro. Theriogenology 2007, 67, 6–15. [Google Scholar] [CrossRef]
- Li, R.; Albertini, D.F. The road to maturation: somatic cell interaction and self-organization of the mammalian oocyte. Nat. Rev. Mol. Cell Biol. 2013, 14, 141–152. [Google Scholar] [CrossRef]
- Gilchrist, R.B.; Lane, M.; Thompson, J.G. Oocyte-secreted factors: regulators of cumulus cell function and oocyte quality. Hum. Reprod. 2008, 14, 159–177. [Google Scholar] [CrossRef]
- Su, Y.; Wu, X.; O’Brien, M.J.; Pendola, F.L.; Denegre, J.N.; Matzuk, M.M. Synergistic roles of BMP15 and GDF9 in the development and function of the oocyte–cumulus cell complex in mice: genetic evidence for an oocyte–granulosa cell regulatory loop. Dev. Biol. 2004, 276, 64–73. [Google Scholar] [CrossRef]
- Paulini, F.; Melo, E.O. The role of oocyte secreted factors GDF9 and BMP15 in follicular development and oogenesis. Reprod. Domest. Anim. 2011, 46, 354–361. [Google Scholar] [CrossRef]
- Miyoshi, T.; Otsuka, F.; Nakamura, E.; Inagaki, K.; Ogura-Ochi, K.; Tsukamoto, N. Regulatory role of kit ligand–kit interaction and oocyte factors in steroidogenesis by rat granulosa cells. Mol. Cell. Endocrinol. 2012, 358, 18–26. [Google Scholar] [CrossRef]
- Wang, Y.; Li, H.; You, L.; Wang, S.; Bie, J.; Su, Z. RSPO2 coordinates with GDF9:BMP15 heterodimers to promote granulosa cell and oocyte development in mice. Adv. Sci. 2025, 12, 1973. [Google Scholar] [CrossRef] [PubMed]
- Xie, J.; Xu, X.; Liu, S. Intercellular communication in the cumulus–oocyte complex during folliculogenesis: A review. Front. Cell Dev. Biol. 2023, 11, 1137787. [Google Scholar] [CrossRef] [PubMed]
- Li, Y.; Zhang, L.; Wang, Y.; Hu, H.; Zhang, Z.; Nie, Q. Role of EFNAs in shaping the tumor immune microenvironment and their impact on pancreatic adenocarcinoma prognosis. Cancer Manag. Res. 2025, 17, 693–712. [Google Scholar] [CrossRef] [PubMed]
- Jiao, Z.; Feng, X.; Cui, Y.; Wang, L.; Gan, J.; Zhao, Y. Expression characteristic, immune signature, and prognosis value of EFNA family identified by multi-omics integrative analysis in pan-cancer. BMC Cancer 2022, 22, 871. [Google Scholar] [CrossRef]
- Buensuceso, A.V.; Son, A.I.; Zhou, R.; Paquet, M.; Withers, B.M.; Deroo, B.J. Ephrin-A5 is required for optimal fertility and a complete ovulatory response to gonadotropins in the female mouse. Endocrinology 2016, 157, 942–955. [Google Scholar] [CrossRef]
- Worku, T.; Wang, K.; Ayers, D.; Wu, D.; Ur Rehman, Z.; Zhou, H. Regulatory roles of ephrinA5 and its novel signaling pathway in mouse primary granulosa cell apoptosis and proliferation. Cell Cycle 2018, 17, 892–902. [Google Scholar] [CrossRef]
- Zhuang, Z.; Li, K.; Yang, K.; Gao, G.; Li, Z.; Zhu, X. Genome-wide association study reveals novel candidate genes influencing semen traits in Landrace pigs. Animals 2024, 14, 1839. [Google Scholar] [CrossRef]
- Morales, R.; Lledó, B.; Ortiz, J.A.; Lozano, F.M.; García, E.M.; Bernabeu, A. Identification of new variants and candidate genes in women with familial premature ovarian insufficiency using whole-exome sequencing. J. Assist. Reprod. Genet. 2022, 39, 2595–2605. [Google Scholar] [CrossRef]
- Hatzirodos, N.; Irving-Rodgers, H.F.; Hummitzsch, K.; Harland, M.L.; Morris, S.E.; Rodgers, R.J. Transcriptome profiling of granulosa cells of bovine ovarian follicles during growth from small to large antral sizes. BMC Genom. 2014, 15, 24. [Google Scholar] [CrossRef]
- Vanderhyden, B.C.; Caron, P.J.; Buccione, R.; Eppig, J.J. Developmental pattern of the secretion of cumulus expansion-enabling factor by mouse oocytes and the role of oocytes in promoting granulosa cell differentiation. Dev. Biol. 1990, 140, 307–317. [Google Scholar] [CrossRef]
- Lee, A.; Ng, J.; Liao, J.; Luk, A.C.; Suen, A.; Chan, T. Single-cell RNA sequencing identifies molecular targets associated with poor in vitro maturation performance of oocytes collected from ovarian stimulation. Hum. Reprod. 2021, 36, 1907–1921. [Google Scholar] [CrossRef]
- Zhang, H.; Xu, Y.; Ju, J.; Pan, Z.; Liu, J.; Sun, S. Increased environment-related metabolism and genetic expression in the in vitro matured mouse oocytes by transcriptome analysis. Front. Cell Dev. Biol. 2021, 9, 627454. [Google Scholar] [CrossRef]
- Liao, Z.; Li, Y.; Li, C.; Bian, X.; Sun, Q. Nuclear transfer improves the developmental potential of embryos derived from cytoplasmic deficient oocytes. iScience 2023, 26, 107142. [Google Scholar] [CrossRef]
- Reyes, J.M.; Silva, E.; Chitwood, J.L.; Schoolcraft, W.B.; Krisher, R.L.; Ross, P.J. Differing molecular response of young and advanced maternal age human oocytes to IVM. Hum. Reprod. 2017, 32, 2199–2208. [Google Scholar] [CrossRef]
- Zhang, F.; Li, W.; Zhu, K.; Zhou, X.; Li, L.; Lee, T. Aging-related aneuploidy is associated with mitochondrial imbalance and failure of spindle assembly. Cell Death Discov. 2023, 9, 235. [Google Scholar] [CrossRef]
- Reyes, J.M.; Chitwood, J.L.; Ross, P.J. RNA-seq profiling of single bovine oocyte transcript abundance and its modulation by cytoplasmic polyadenylation. Mol. Reprod. Dev. 2015, 82, 103–114. [Google Scholar] [CrossRef]
- Yang, C.; Liang, H.; Wu, Z.; Huo, L.; Du, Z. Identification of lncRNAs involved in maternal–zygotic transition of in vitro produced porcine embryos by single-cell RNA-seq. Reprod. Domest. Anim. 2022, 57, 111–122. [Google Scholar] [CrossRef]
- Hopps, E.; Noto, D.; Caimi, G.; Averna, M.R. A novel component of the metabolic syndrome: the oxidative stress. Nutr. Metab. Cardiovasc. Dis. 2010, 20, 72–77. [Google Scholar] [CrossRef]
- Orisaka, M.; Tajima, K.; Tsang, B.K.; Kotsuji, F. Oocyte–granulosa–theca cell interactions during preantral follicular development. J. Ovarian Res. 2009, 2, 9. [Google Scholar] [CrossRef]
- Pangas, S.A.; Matzuk, M.M. The art and artifact of GDF9 activity: cumulus expansion and the cumulus expansion-enabling factor. Biol. Reprod. 2005, 73, 582–585. [Google Scholar] [CrossRef]
- Juengel, J.L.; Hudson, N.L.; Heath, D.A.; Smith, P.; Reader, K.L.; Lawrence, S.B. Growth differentiation factor 9 and bone morphogenetic protein 15 are essential for ovarian follicular development in sheep. Biol. Reprod. 2002, 67, 1777–1789. [Google Scholar] [CrossRef] [PubMed]
- Lisabeth, E.M.; Falivelli, G.; Pasquale, E.B. Eph receptor signaling and ephrins. Cold Spring Harb. Perspect. Biol. 2013, 5, a009159. [Google Scholar] [CrossRef] [PubMed]
- Liang, L.; Patel, O.; Janes, P.W.; Murphy, J.M.; Lucet, I.S. Eph receptor signalling: from catalytic to non-catalytic functions. Oncogene 2019, 38, 6567–6584. [Google Scholar] [CrossRef] [PubMed]
- Giannopoulos, K.; Karikis, I.; Byrd, C.; Sanidas, G.; Wolff, N.; Triantafyllou, M. Eph/ephrin-mediated immune modulation: a potential therapeutic target. Front. Immunol. 2025, 16, 1523456. [Google Scholar] [CrossRef]
- Bartolomé, A.; Suda, N.; Yu, J.; Zhu, C.; Son, J.; Ding, H. Notch-mediated Ephrin signaling disrupts islet architecture and cell function. JCI Insight 2022, 7, e157694. [Google Scholar] [CrossRef]
- Lévy, J.; Schell, B.; Nasser, H.; Rachid, M.; Ruaud, L.; Couque, N. EPHA7 haploinsufficiency is associated with a neurodevelopmental disorder. Clin. Genet. 2021, 100, 396–404. [Google Scholar] [CrossRef]
- McNatty, K.P.; Juengel, J.L.; Wilson, T.; Galloway, S.M.; Davis, G.H.; Hudson, N.L. Oocyte-derived growth factors and ovulation rate in sheep. Reproduction 2003, 61, 339–351. [Google Scholar] [CrossRef]
- Juengel, J.L.; Hudson, N.L.; Berg, M.; Hamel, K.; Smith, P.; Lawrence, S.B. Effects of active immunization against growth differentiation factor 9 and/or bone morphogenetic protein 15 on ovarian function in cattle. Reproduction 2009, 138, 107–114. [Google Scholar] [CrossRef]
- Gong, Y.; Li-Ling, J.; Xiong, D.; Wei, J.; Zhong, T.; Tan, H. Age-related decline in the expression of GDF9 and BMP15 genes in follicle fluid and granulosa cells derived from poor ovarian responders. J. Ovarian Res. 2021, 14, 1. [Google Scholar] [CrossRef]
- Rossetti, R.; Ferrari, I.; Bestetti, I.; Moleri, S.; Brancati, F.; Petrone, L. Fundamental role of BMP15 in human ovarian folliculogenesis revealed by null and missense mutations associated with primary ovarian insufficiency. Hum. Mutat. 2020, 41, 983–997. [Google Scholar] [CrossRef] [PubMed]
- Sirard, M.; Richard, F.; Blondin, P.; Robert, C. Contribution of the oocyte to embryo quality. Theriogenology 2006, 65, 126–136. [Google Scholar] [CrossRef] [PubMed]
- Guerin, P.; El Mouatassim, S.; Menezo, Y. Oxidative stress and protection against reactive oxygen species in the pre-implantation embryo and its surroundings. Hum. Reprod. Update 2001, 7, 175–189. [Google Scholar] [CrossRef] [PubMed]
- Agarwal, A.; Gupta, S.; Sharma, R.K. Role of oxidative stress in female reproduction. Reprod. Biol. Endocrinol. 2005, 3, 28. [Google Scholar] [CrossRef]
- Rizos, D.; Ward, F.; Duffy, P.; Boland, M.P.; Lonergan, P. Consequences of bovine oocyte maturation, fertilization or early embryo development in vitro versus in vivo: implications for blastocyst yield and blastocyst quality. Mol. Reprod. Dev. 2002, 61, 234–248. [Google Scholar] [CrossRef]
- Gorman, S.A. Investigating the role of inflammation on bovine oocyte health and development. Ph.D. Thesis, Auburn University, Auburn, AL, USA, 2020. [Google Scholar]
- Bromfield, J.J.; Sheldon, I.M. Lipopolysaccharide initiates inflammation in bovine granulosa cells via the TLR4 pathway and perturbs oocyte meiotic progression in vitro. Endocrinology 2011, 152, 5029–5040. [Google Scholar] [CrossRef]
- Du, W.; Huang, L.; Tang, X.; Li, J.; Li, X. EphrinA5 is involved in retinal neovascularization in a mouse model of oxygen-induced retinopathy. Biomed. Res. Int. 2020, 2020, 7161027. [Google Scholar] [CrossRef]
- Ru, L.; Oeckl, P.; Timmers, M.; Lenaerts, A.; van der Vos, J.; Smolders, S. Reduction of ephrin-A5 aggravates disease progression in amyotrophic lateral sclerosis. Acta Neuropathol. Commun. 2019, 7, 114. [Google Scholar] [CrossRef]
- Emery, A.; Blaschuk, O.W.; Dinh, D.T.; McPhee, T.; Becker, R.; Abell, A.D. N-cadherin mechanosensing in ovarian follicles controls oocyte maturation and ovulation. eLife 2025, 13, RP92068. [Google Scholar] [CrossRef]
- Turathum, B.; Gao, E.; Chian, R. The function of cumulus cells in oocyte growth and maturation and in subsequent ovulation and fertilization. Cells 2021, 10, 2292. [Google Scholar] [CrossRef]
- Davy, A.; Robbins, S.M. EphrinA5 modulates cell adhesion and morphology in an integrin-dependent manner. EMBO J. 2000, 19, 5396–5405. [Google Scholar] [CrossRef]
- Zimmer, G.; Kästner, B.; Weth, F.; Bolz, J. Multiple effects of ephrin-A5 on cortical neurons are mediated by SRC family kinases. J. Neurosci. 2007, 27, 5643–5653. [Google Scholar] [CrossRef]
Figure 1.
The expression pattern of EFNA5 and EPHA4 in COCs. (A) Cross-species heatmaps of EFNA family expression in GV and MII oocytes (row-scaled Z-scores). (B) The expression of EFNA5 transcript in GV and MII oocytes from multiple species. (C) Western blots of EFNA5 in cumulus cells and oocytes with densitometry normalized to GAPDH. (D) Immunofluorescence localization of EFNA5 in COCs (DAPI, blue; EFNA5, red). Scale bars = 50 µm. (E) qRT-PCR quantification of EFNA5 and EphA receptors in oocytes and cumulus cells (row-scaled Z-scores). (F) Immunofluorescence of EPHA4 in COCs (DAPI, blue; EPHA4, red). Scale bars = 50 µm. Abbreviations: OO, oocyte; CC, cumulus cell; GV, germinal vesicle; MII, metaphase II. All experiments were repeated at least three times. Data are presented as mean ± SEM.
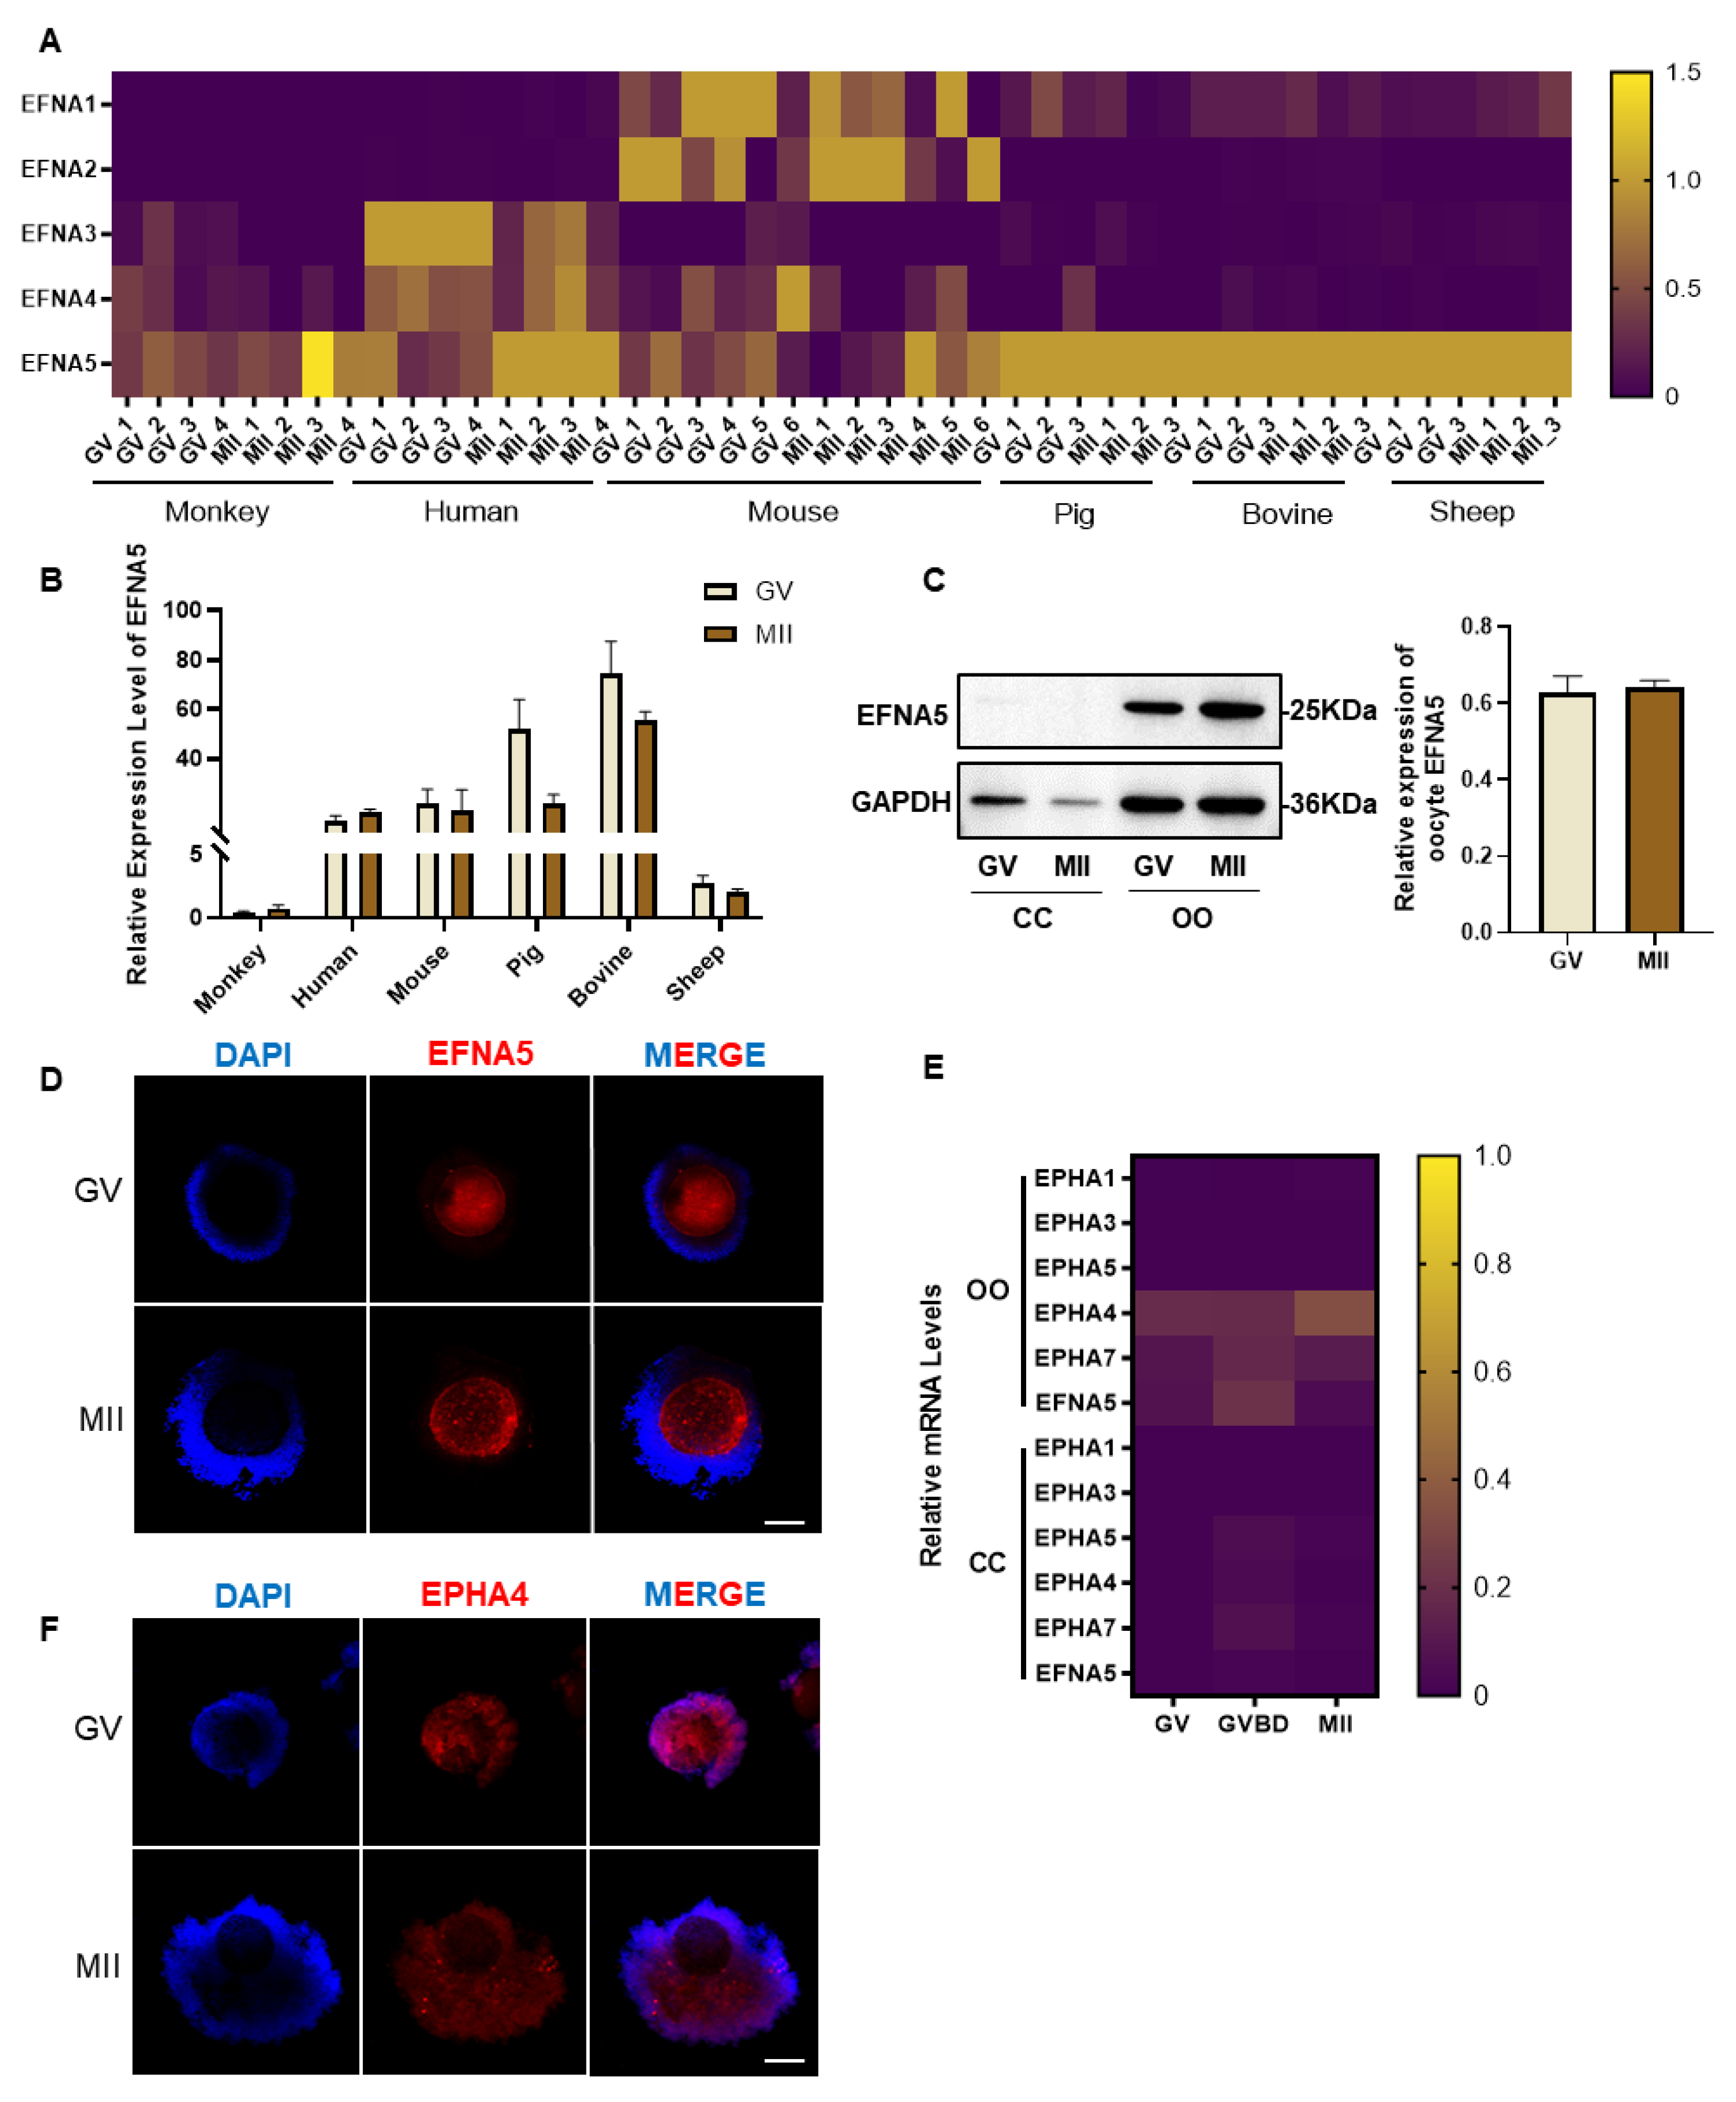
Figure 2.
EFNA5 enhances the oocyte developmental competence. (A) Cross-species heatmaps comparing EFNA5 expression IVO and IVM oocytes from human, mouse, sheep and mouse (row-scaled Z-scores). (B) Representative bright-field images of embryos derived from oocytes matured with 0, 10, 50, or 100 ng/mL recombinant EFNA5. Scale bar = 200 µm. (C-D) Cleavage rate and blastocyst rate for each group. (E) Representative images of blastocysts stained with DAPI (blue) and TUNEL (green). Scale bar = 50 µm. (F-G) Total cell number and percentage of TUNEL-positive nuclei per blastocyst. Abbreviations: IVO, in vivo maturation; IVM, in vitro maturation. All experiments were repeated at least three times. Data are mean ± SEM. Different letters indicate p < 0.05.
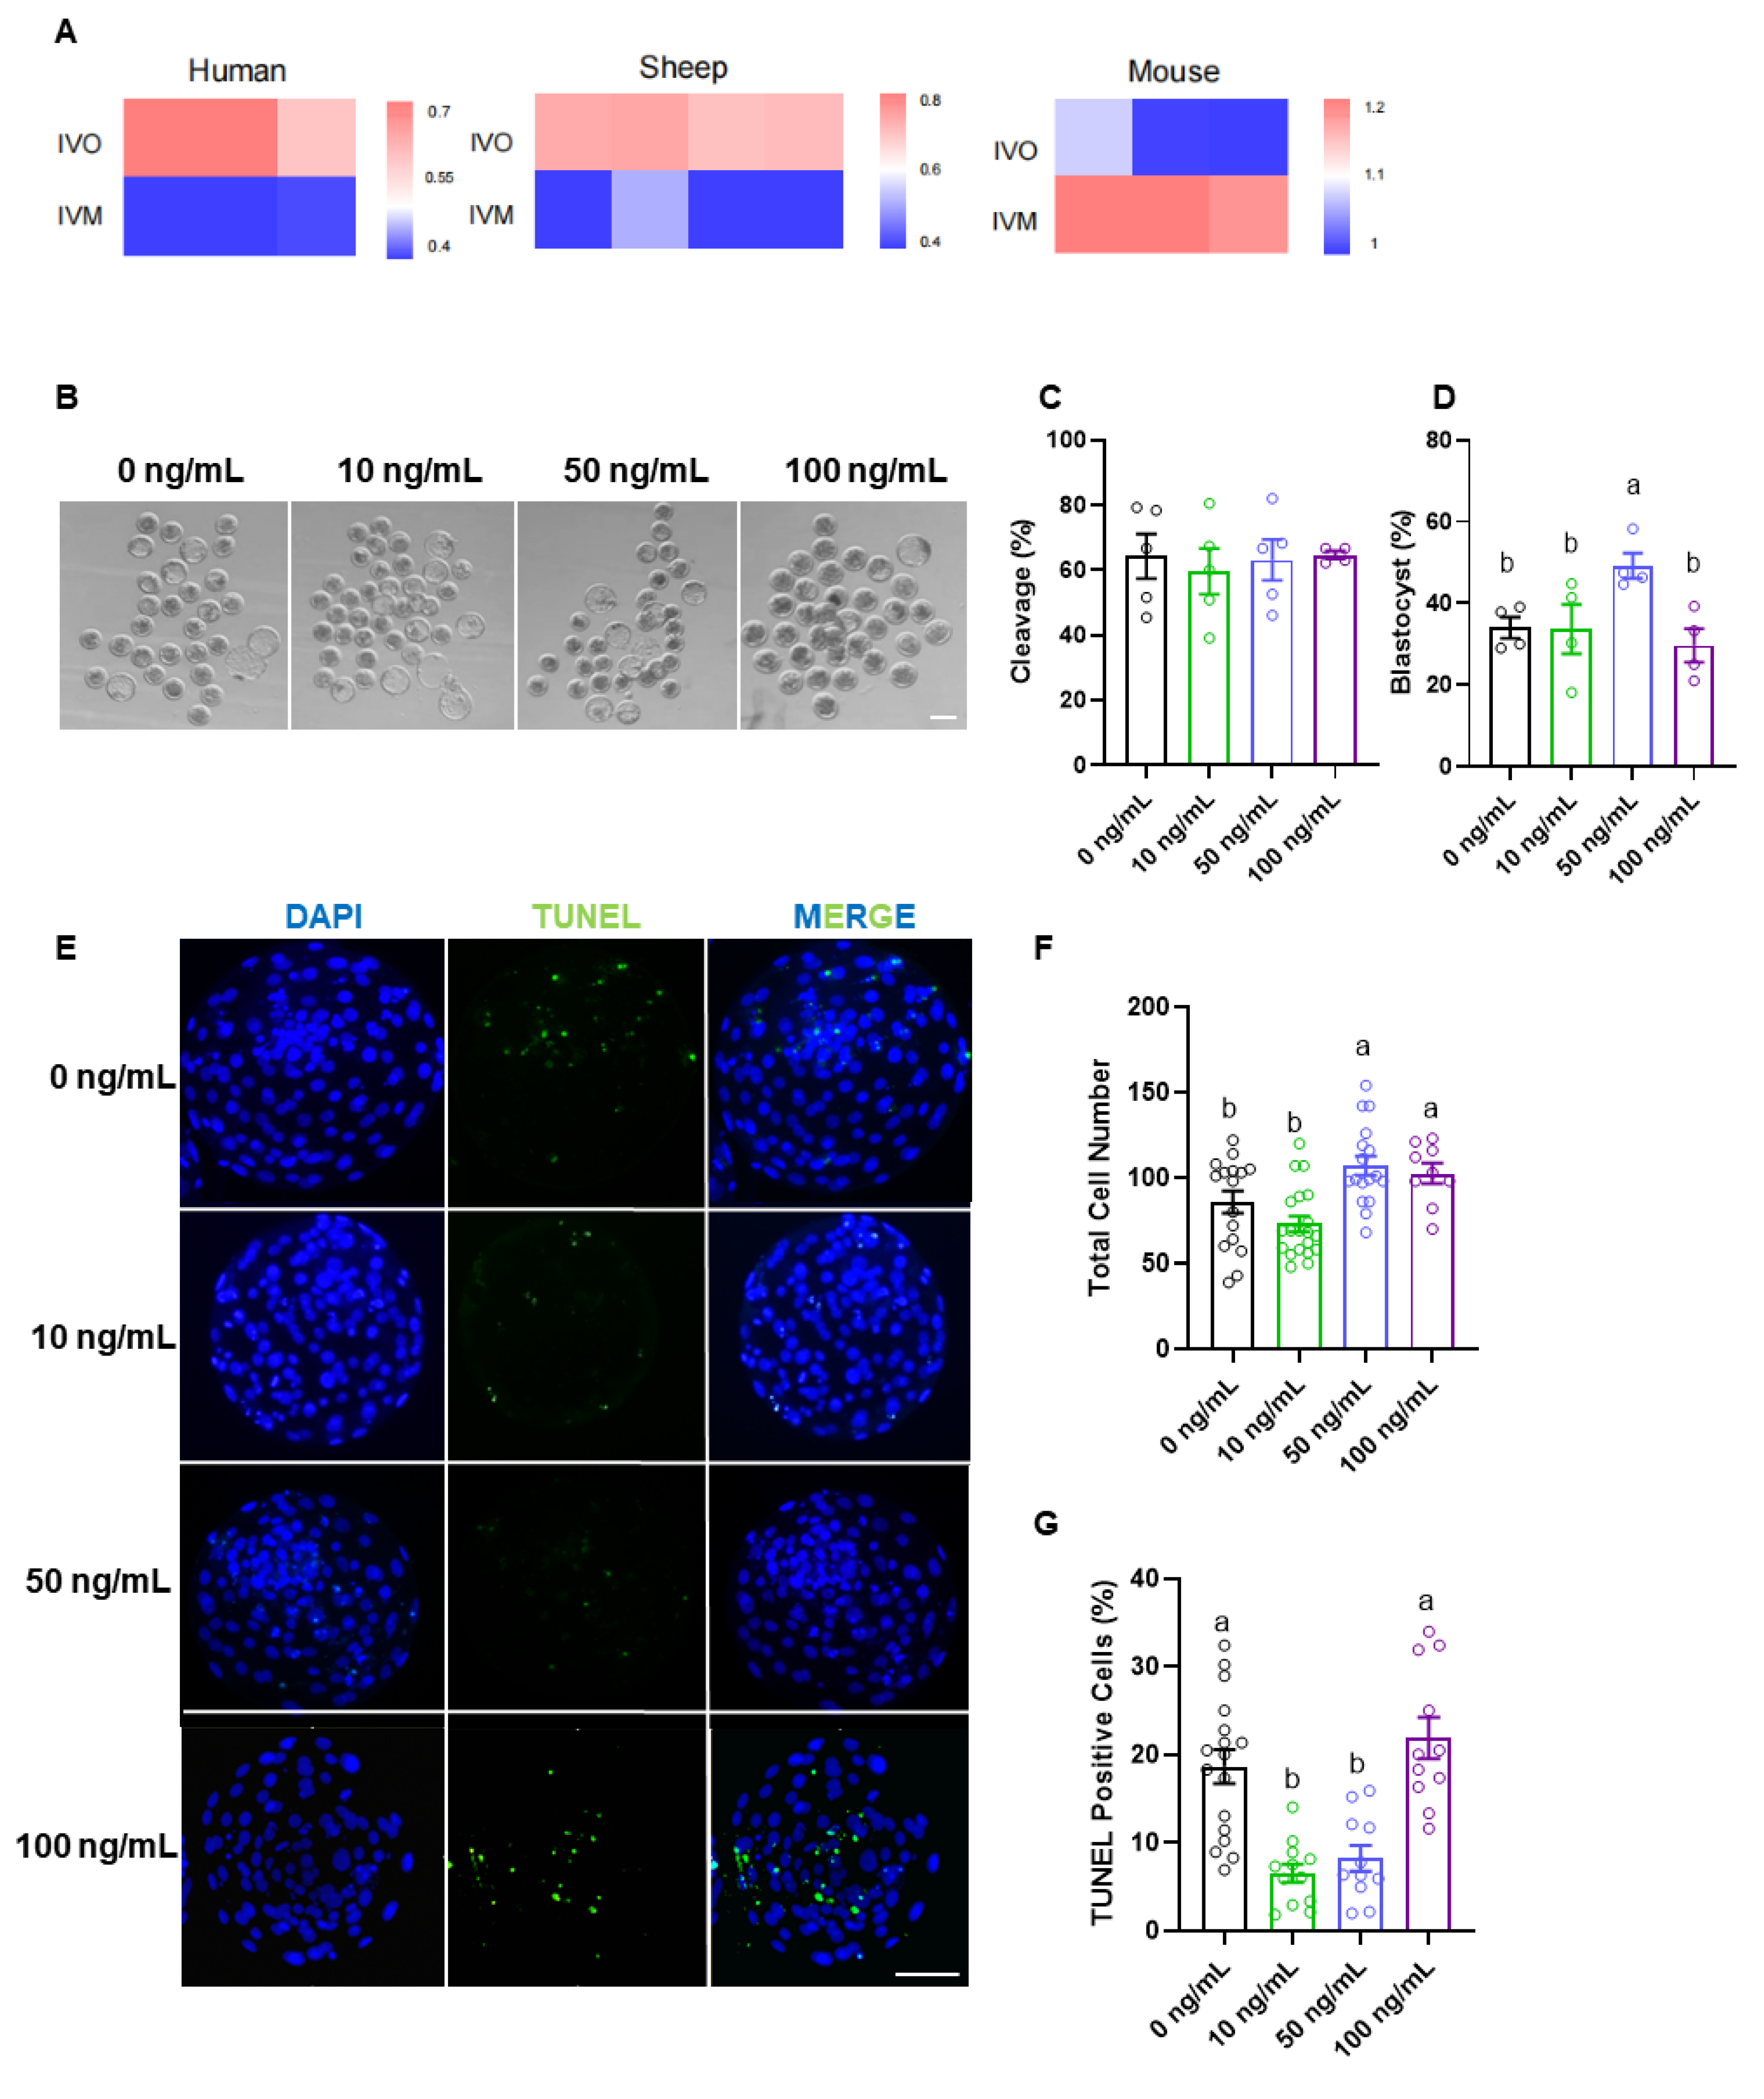
Figure 3.
EFNA5 promotes cumulus expansion and suppresses apoptosis in cumulus–oocyte complexes. (A) Bright-field images of GV and MII stage COCs matured with 0, 10, 50, or 100 ng/mL EFNA5. Scale bar = 200 µm. (B) Distribution of cumulus expansion scores (Score 1, minimal; Score 2, moderate; Score 3, full) under each EFNA5 dose. (C) qRT-PCR analysis of cumulus-expansion genes (PTX3, HAS2, PTGS2, TNFAIP6) in COCs after IVM. (D) Representative images of TUNEL staining in COCs matured with the indicated EFNA5 doses (DAPI, blue; TUNEL, green). Scale bar = 50 µm. (E) Quantification of TUNEL fluorescence intensity in COCs. (F) qRT-PCR analysis of apoptosis-related genes (BCL2 and TP53) in COCs. All experiments were repeated at least three times. Data are mean ± SEM. Different letters indicate p < 0.05.
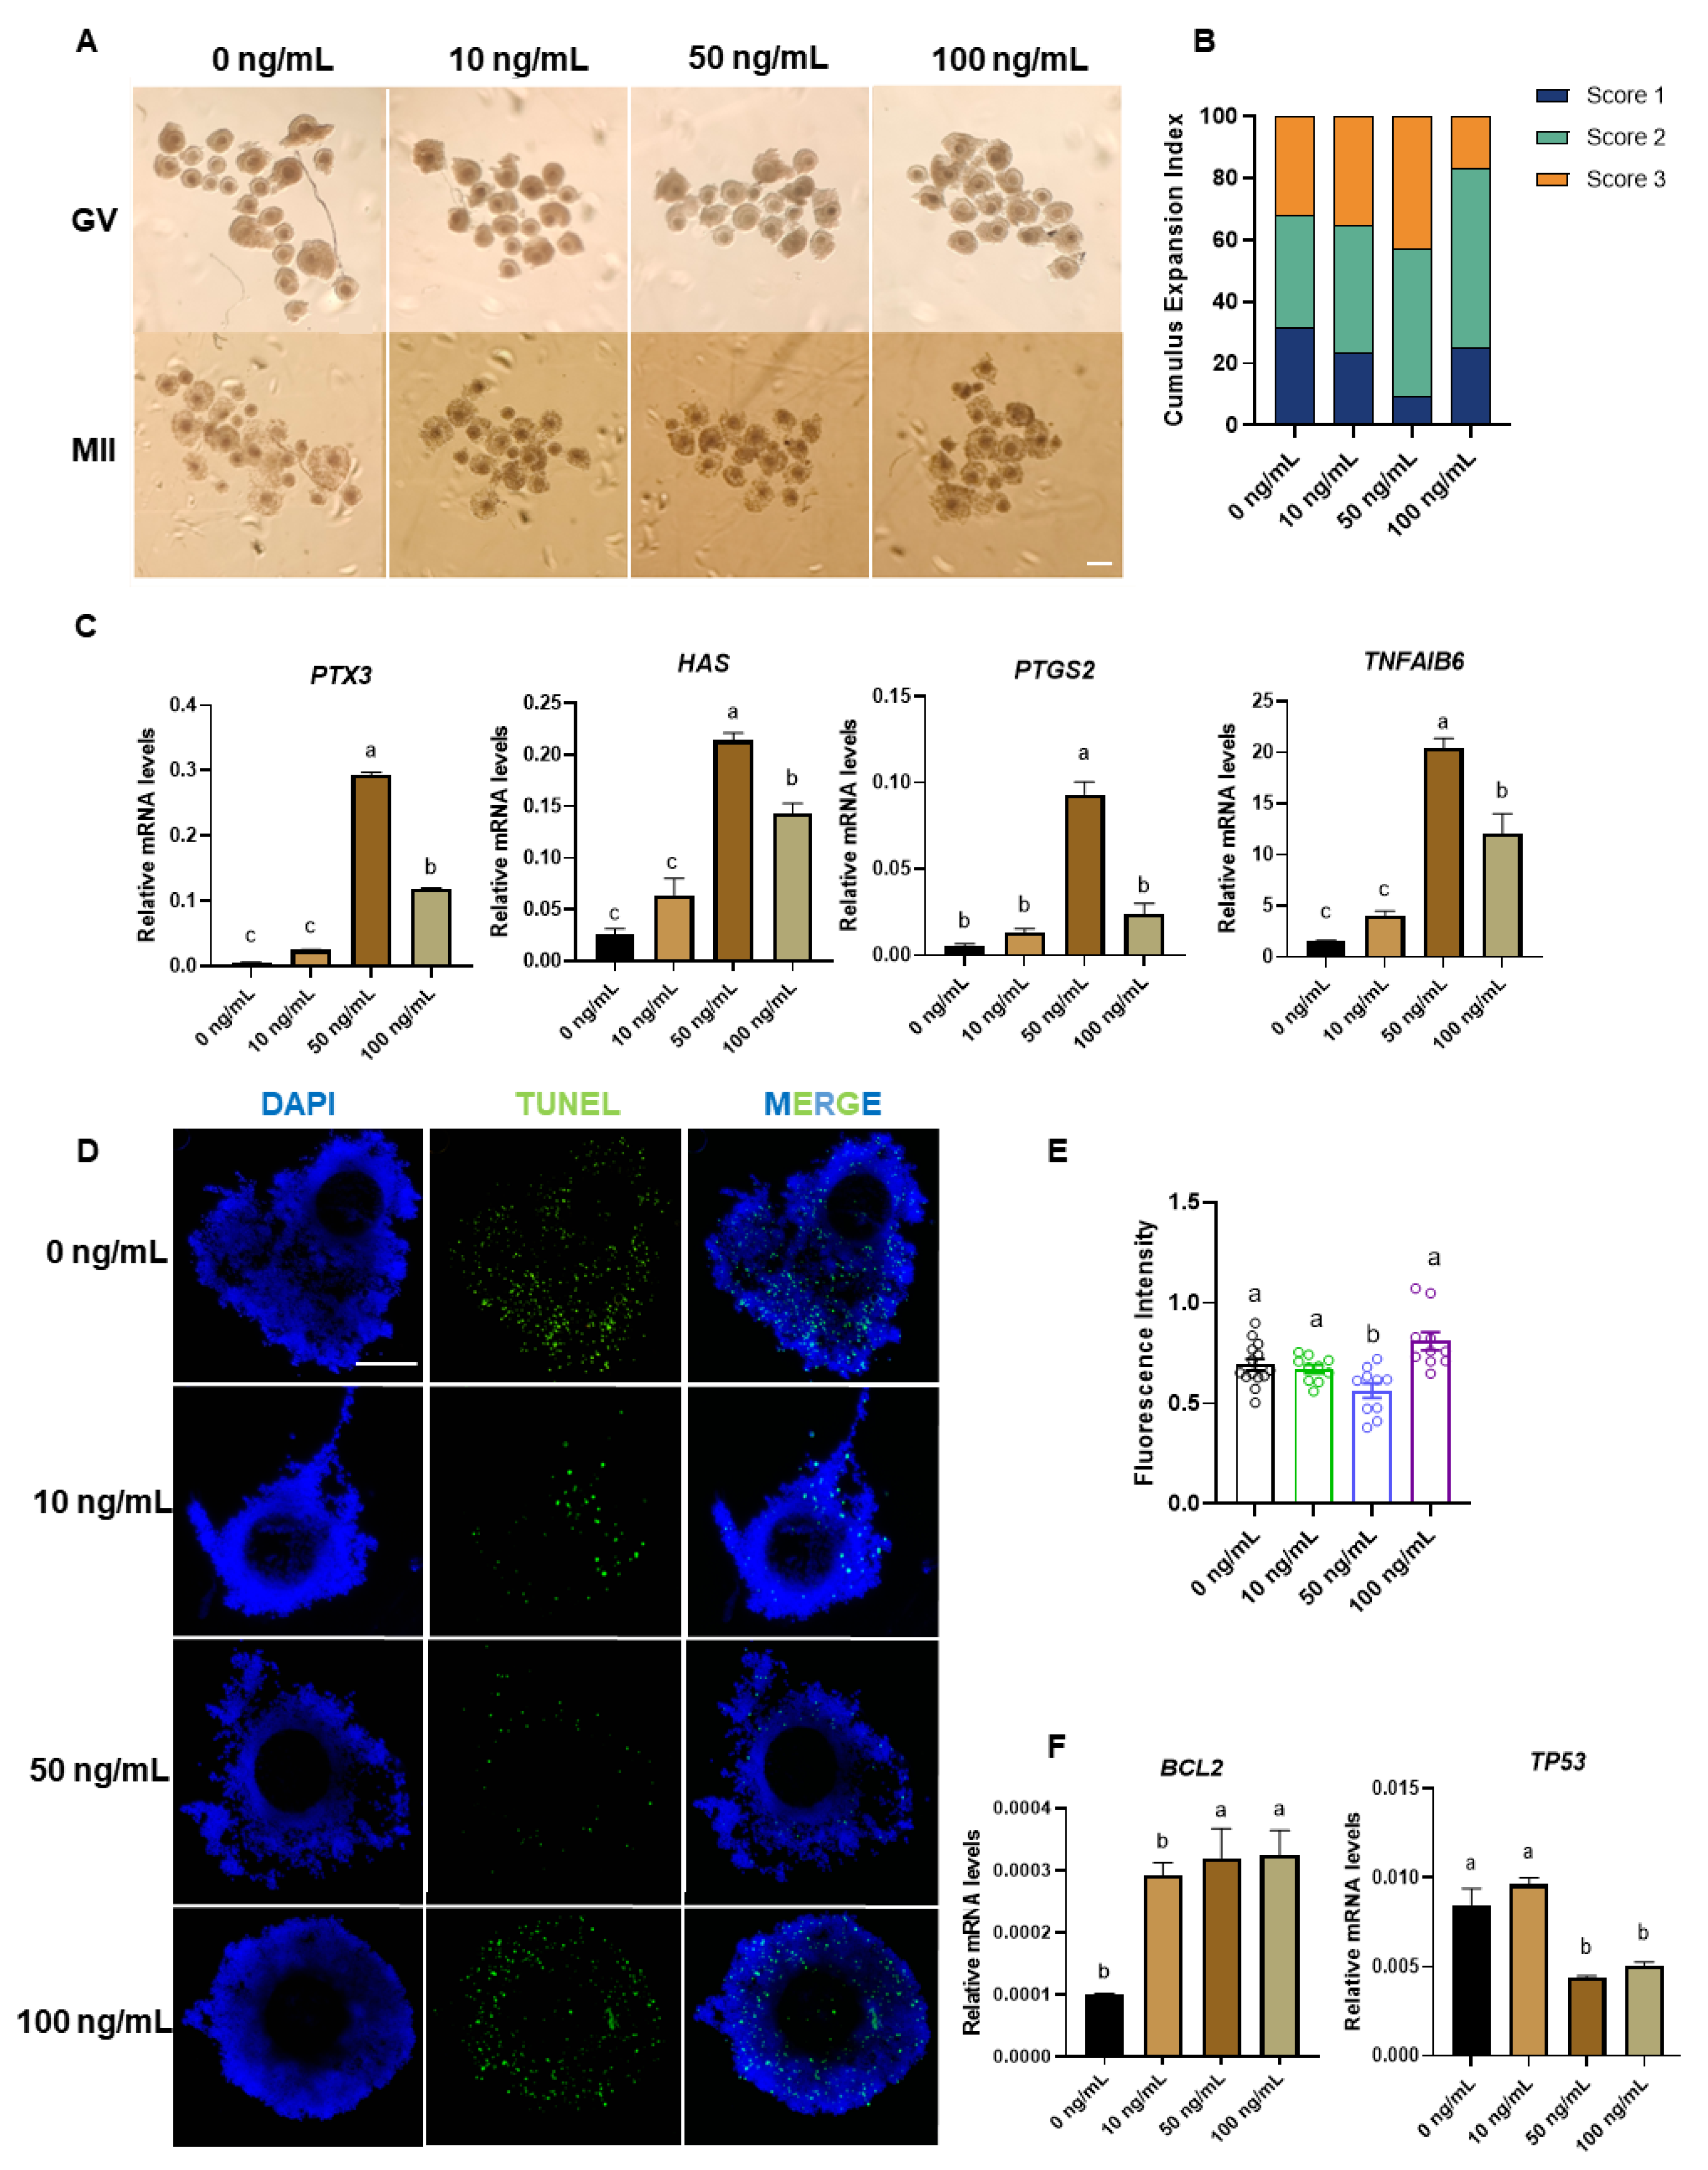
Figure 4.
Effects of EFNA5 on the transcriptional profile of oocytes matured in vitro. (A) PCA of MII oocyte transcriptomes in control and EFNA5 groups. (B) Volcano plot of DEGs; dashed lines indicate |log2FC| = 1.5 and pvalue = 0.05. Red, upregulated; blue, downregulated; grey, not significant. (C) Heatmap of DEGs across samples with hierarchical clustering (row-scaled Z-scores). (D) GO enrichment (BP/CC/MF); bar length denotes-log10(P), numbers indicate gene counts. (E) KEGG pathway enrichment; bubble size represents gene count, color indicates-log10(P), x-axis shows Gene Ratio. (F–H) Module heatmaps for antioxidant (NRF2 targets), inflammatory (NF-κB axis), and apoptotic genes (row-scaled Z-scores). (I) GSEA enrichment plots for Glutathione metabolism, NF-κB signaling, and p53 pathway. (J) PPI network of core DEGs with hub nodes (node size = degree; edge thickness = interaction confidence). Abbreviations: DEG, differentially expressed gene; BP/CC/MF, biological process/cellular component/molecular function.
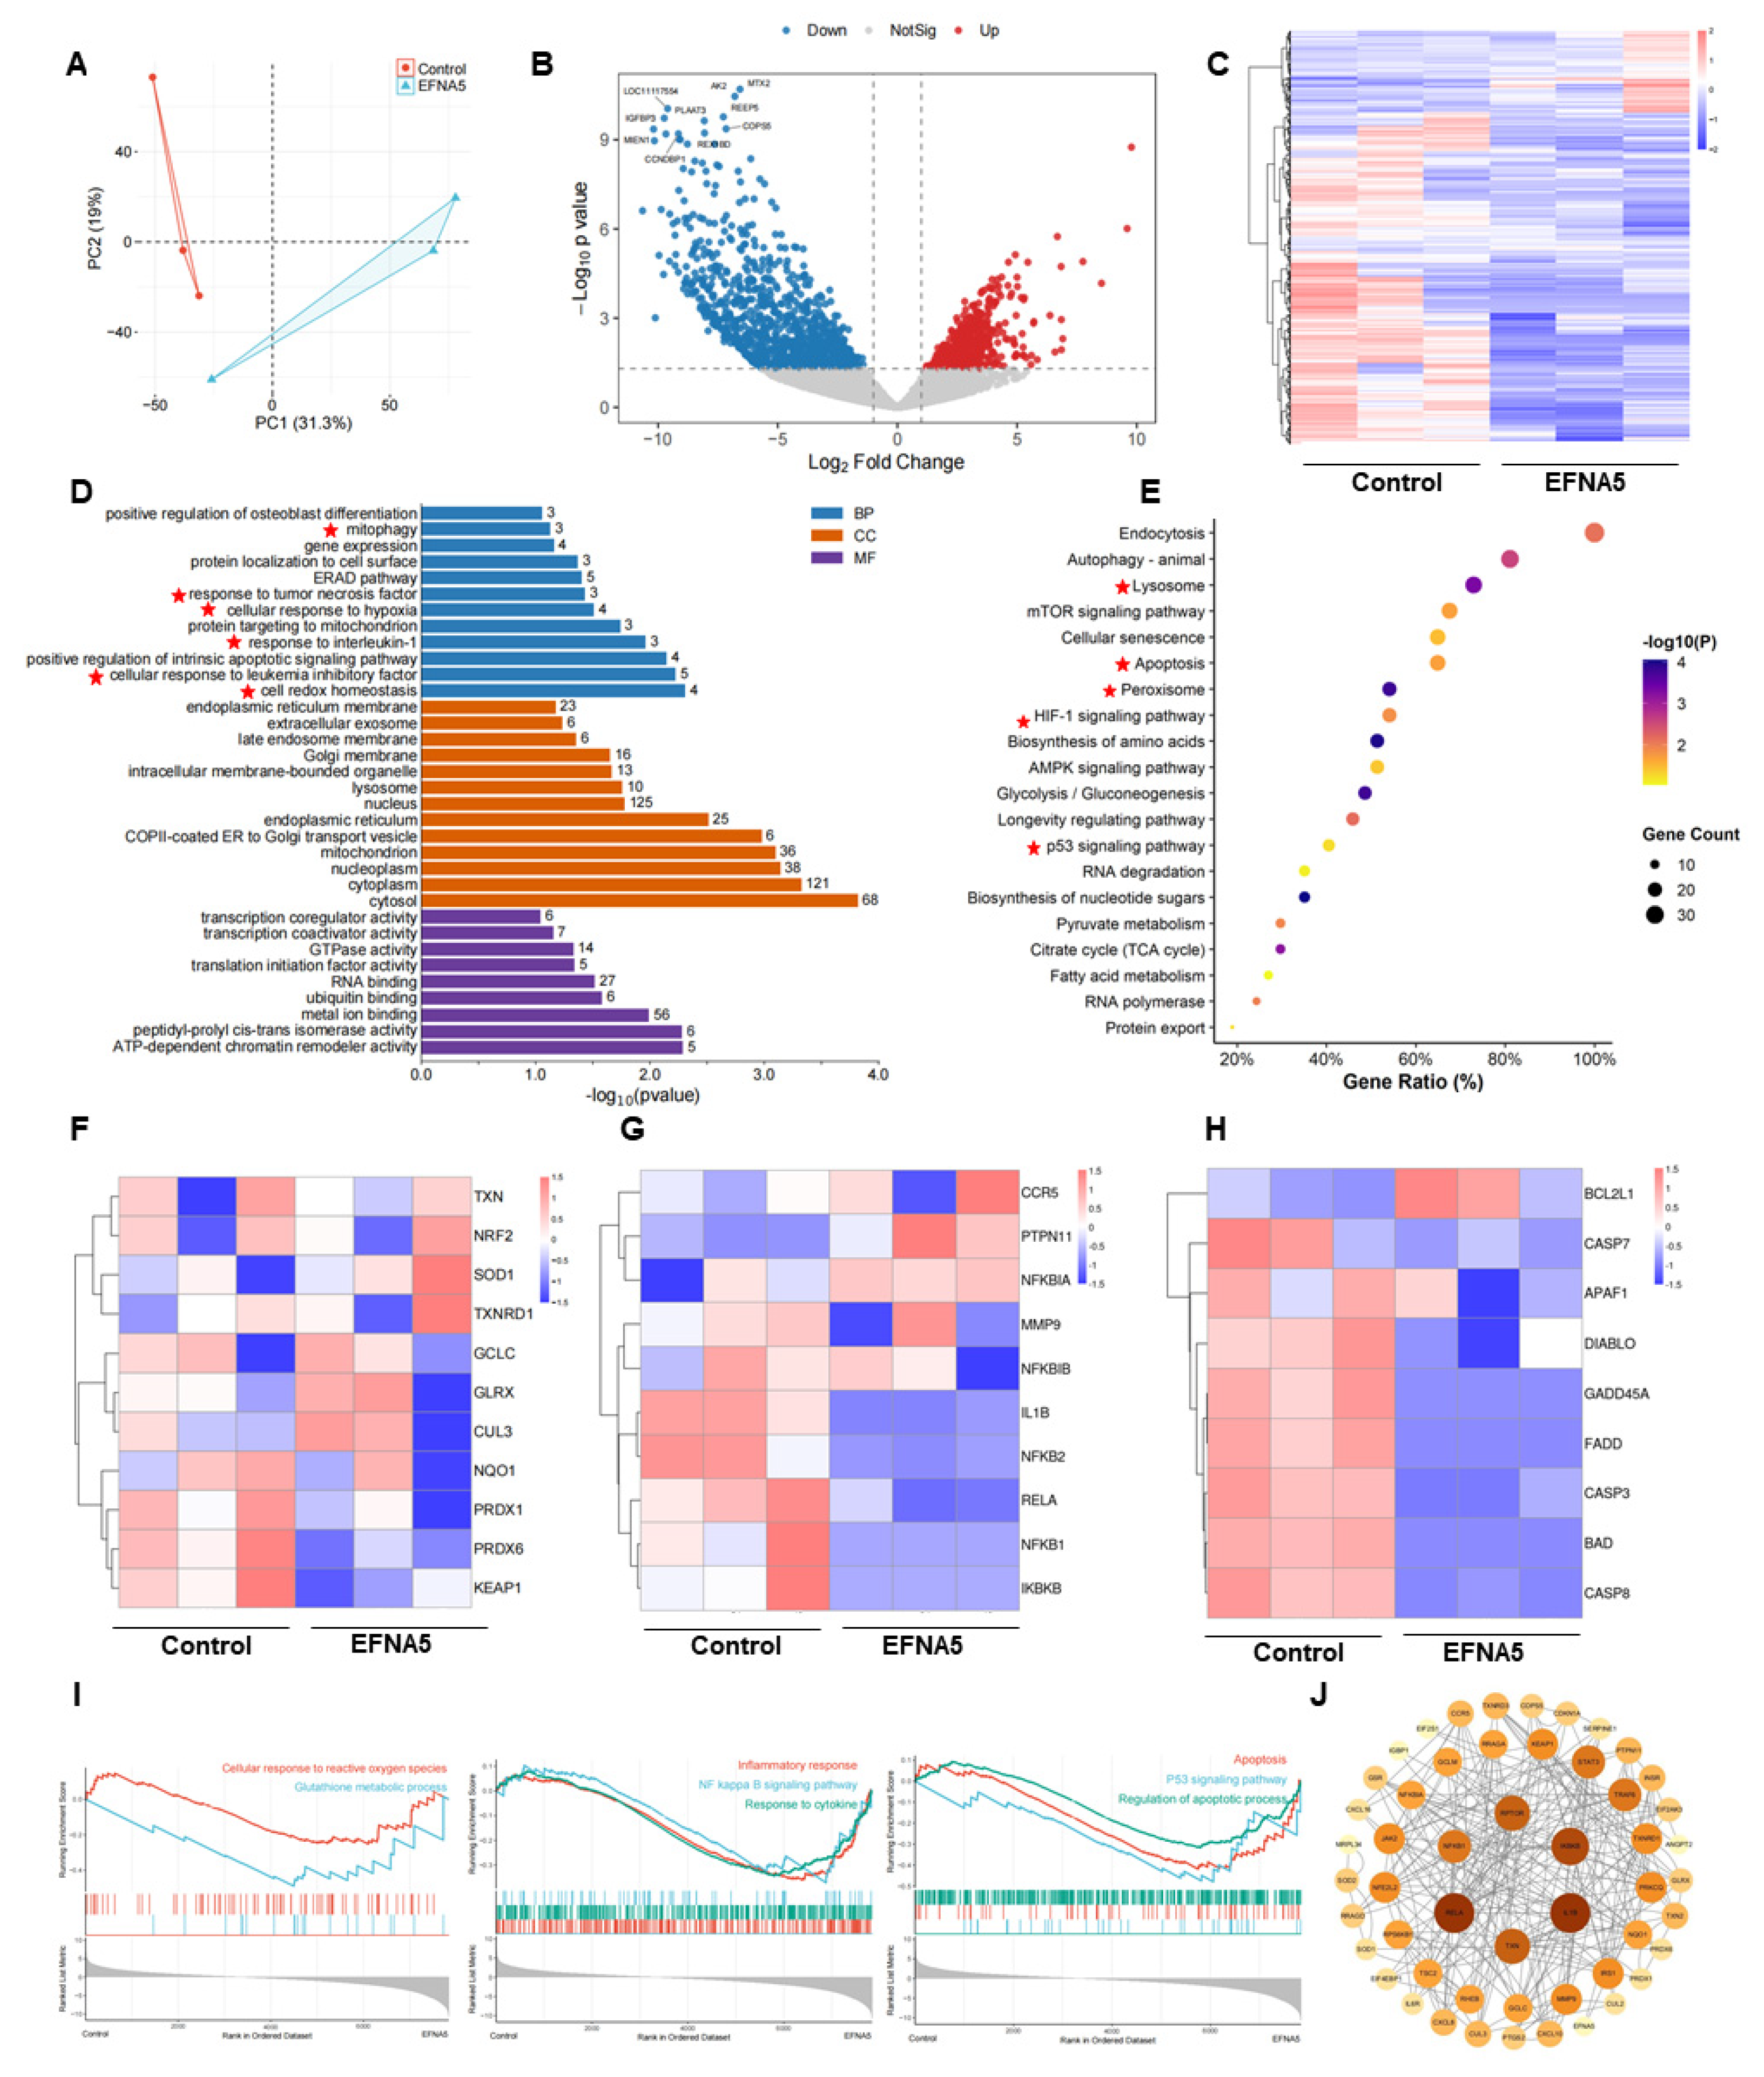
Figure 5.
EFNA5 improves oocyte redox homeostasis and oocyte quality. (A) Representative fluorescence images of intracellular GSH (left) and ROS (right) in control versus EFNA5-treated oocytes. Scale bar = 50 µm. (B) Quantification of relative fluorescence intensity for GSH (left) and ROS (right). (C) C11-BODIPY 581/591 labeling of lipid peroxidation showing reduced (red) and oxidized (green) states. Scale bar = 50 µm. (D) Ratio of oxidized/reduced C11-BODIPY signals. (E) LCA lectin staining of cortical granules in MII oocytes. Scale bar = 50 µm. (F) Quantification of LCA fluorescence intensity. (G) Immunofluorescence of γH2AX (green) indicating DNA damage (DAPI, blue). Scale bar = 20 µm. (H) Quantification of relative γH2AX fluorescence intensity. (I) qPCR analysis of antioxidant enzyme genes (SOD1, SOD2, SOD3, CATALASE, GPX) and GSH synthesis/regeneration genes (GCLC, GCLM, GSR) in Control versus EFNA5-treated oocytes. Abbreviations: GSH, glutathione; ROS, reactive oxygen species; LCA, Lens culinaris agglutinin; γH2AX, phospho-H2AX (Ser139). All experiments were repeated at least three times. Data are shown as mean ± SEM. Statistical significance: * p < 0.05, ** p < 0.01, *** p < 0.001, **** p < 0.0001.
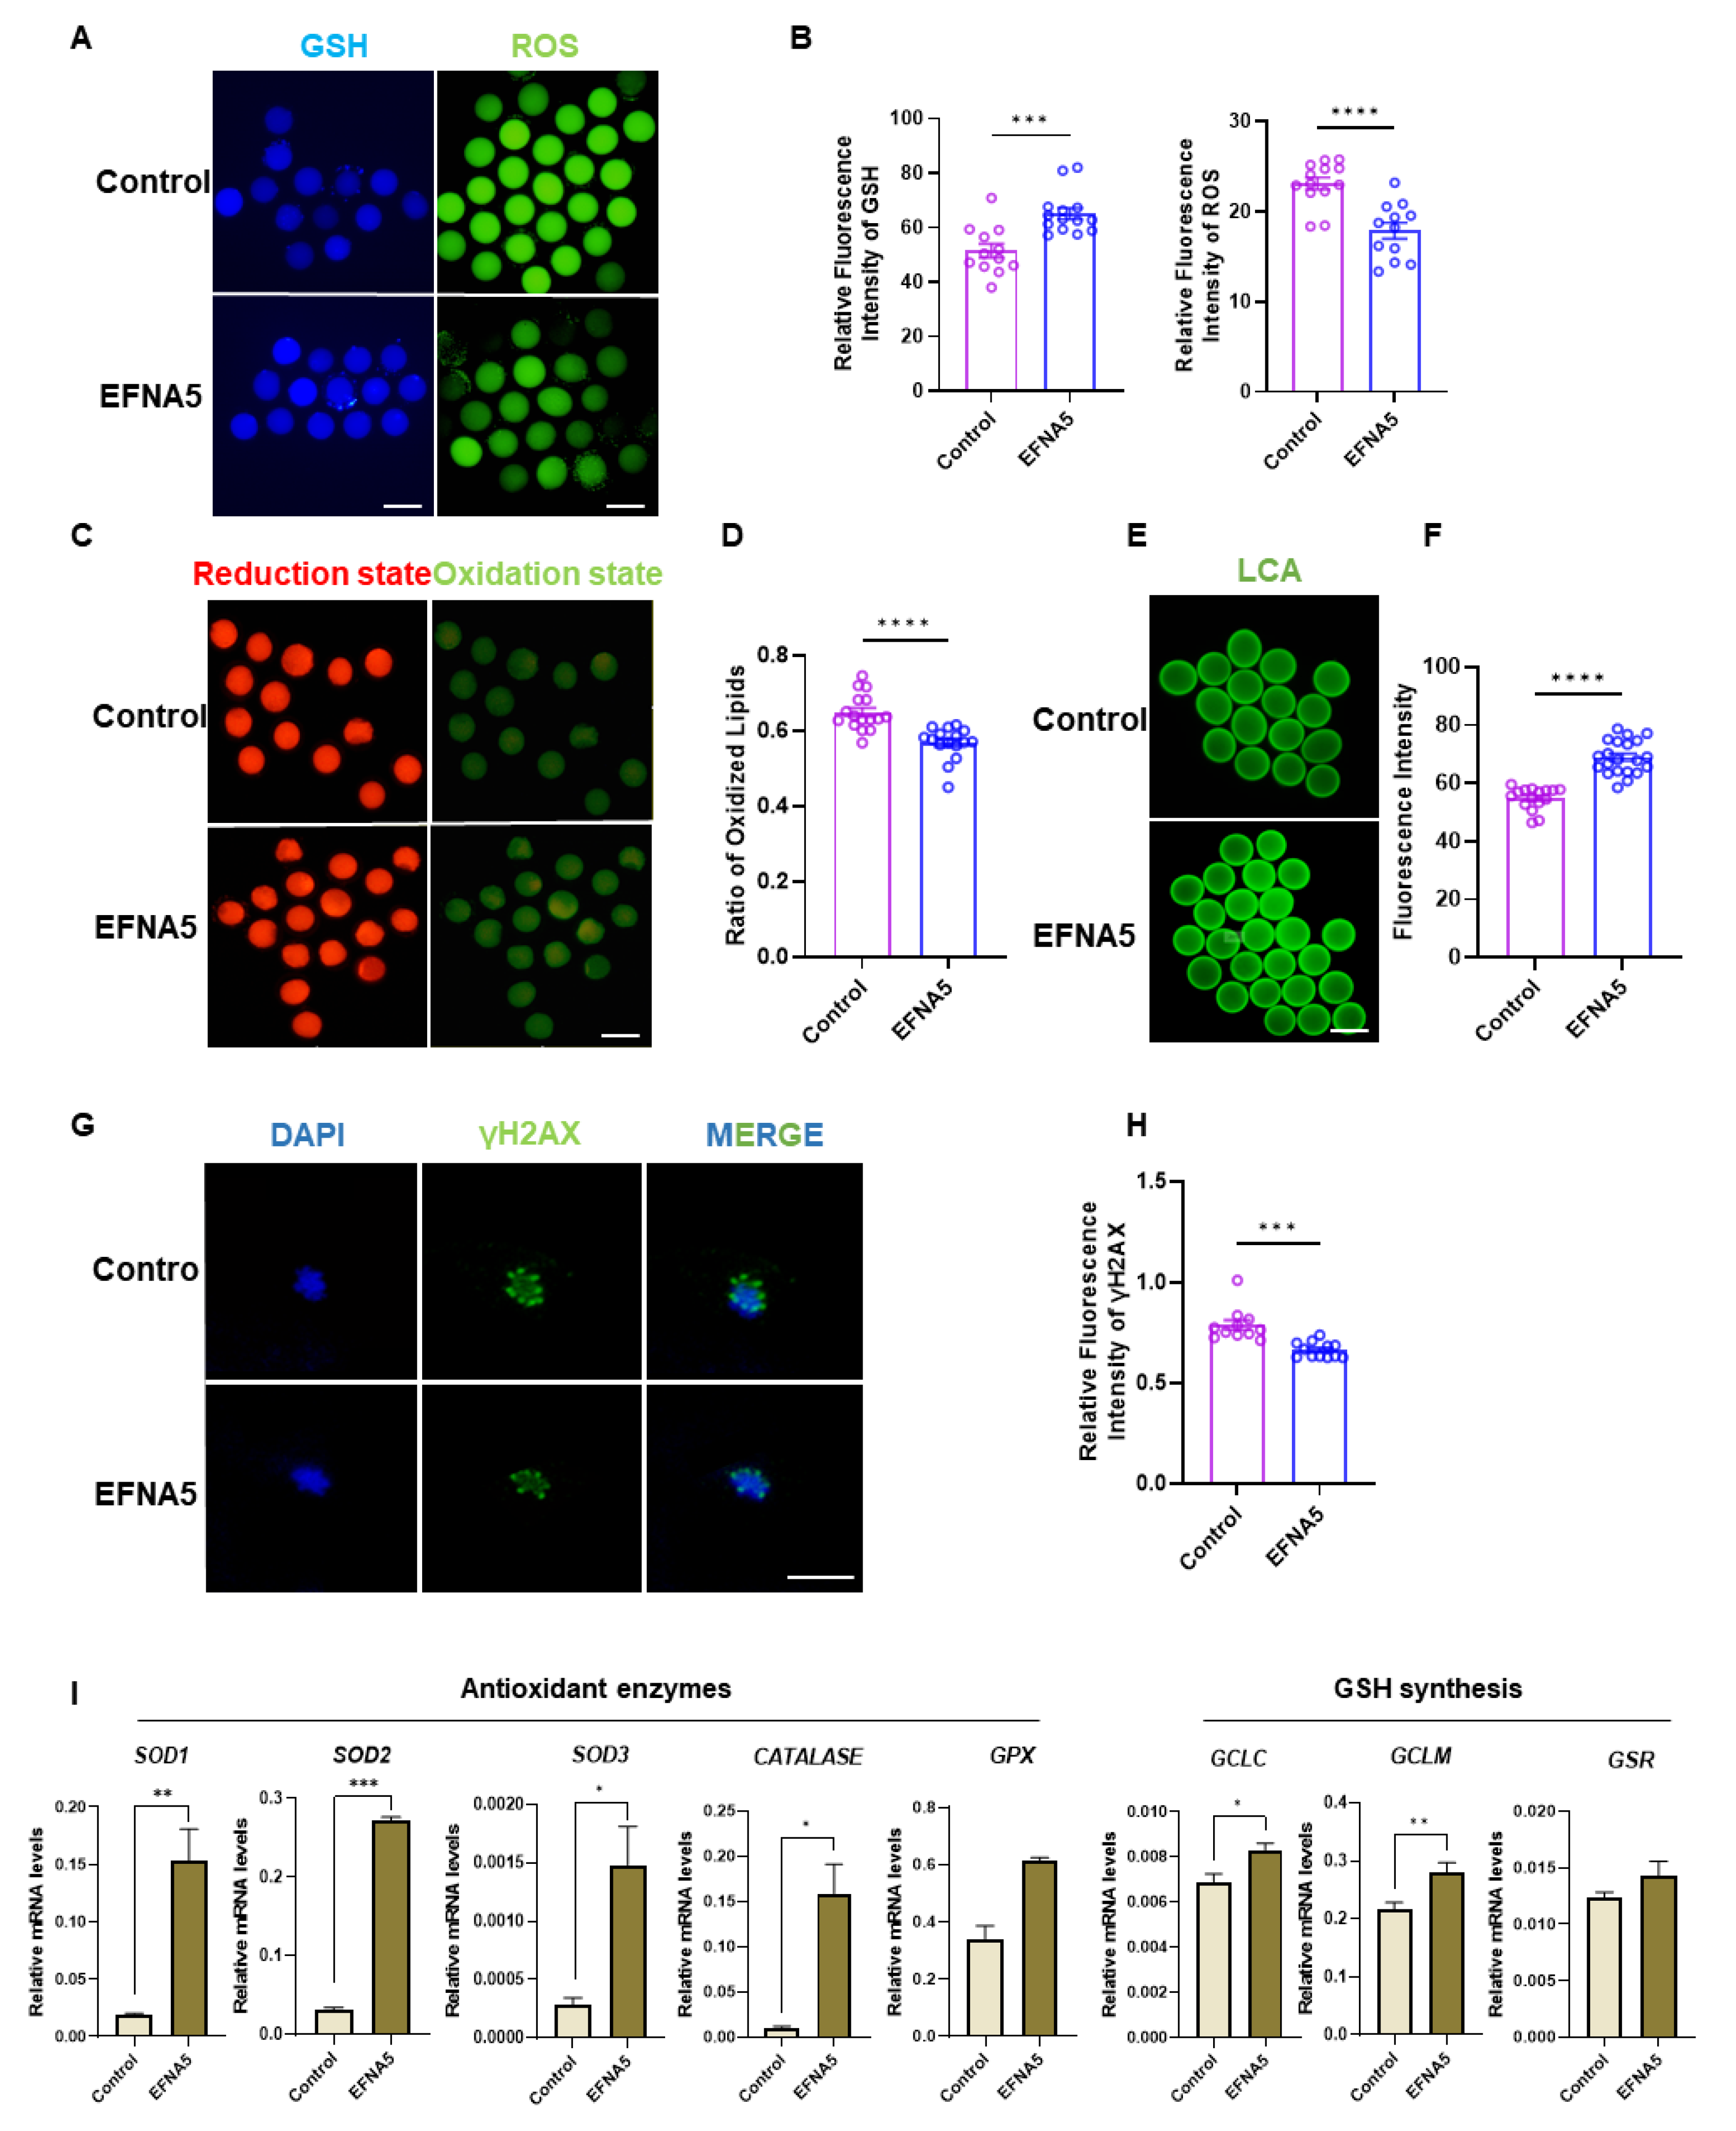
Figure 6.
EFNA5 reprograms cumulus cell transcriptomes. (A) PCA of RNA-seq profiles from control vs EFNA5-treated cumulus cells. (B) Volcano plot of DEGs; dashed lines denote thresholds |log2FC| = 1.5 and pvalue = 0.05. Red: upregulated; blue: downregulated; gray: not significant. (C) Heatmap of DEGs across samples with hierarchical clustering (row-scaled Z-scores; columns: biological replicates). (D) Gene Ontology enrichment (BP/CC/MF). Bars indicate-log10(P); numbers at bar ends show gene counts. (E) KEGG pathway enrichment. Bubble size represents gene count; color encodes -log10(P); x-axis shows Gene Ratio. (F) Module heatmap highlighting key pathways in cumulus cells: NF-κB axis (RELA, IKBKB, NFKBIA), NRF2 antioxidant genes (NRF2, GSR, GCLC, SOD2), and apoptosis genes (CASP8, FADD, BAX, BAD). (G) Adhesion-related gene heatmap (row-scaled Z-scores), including ITGAV, ITGB1, CDH1, CDH2, PTK2, FN1, VCAN.
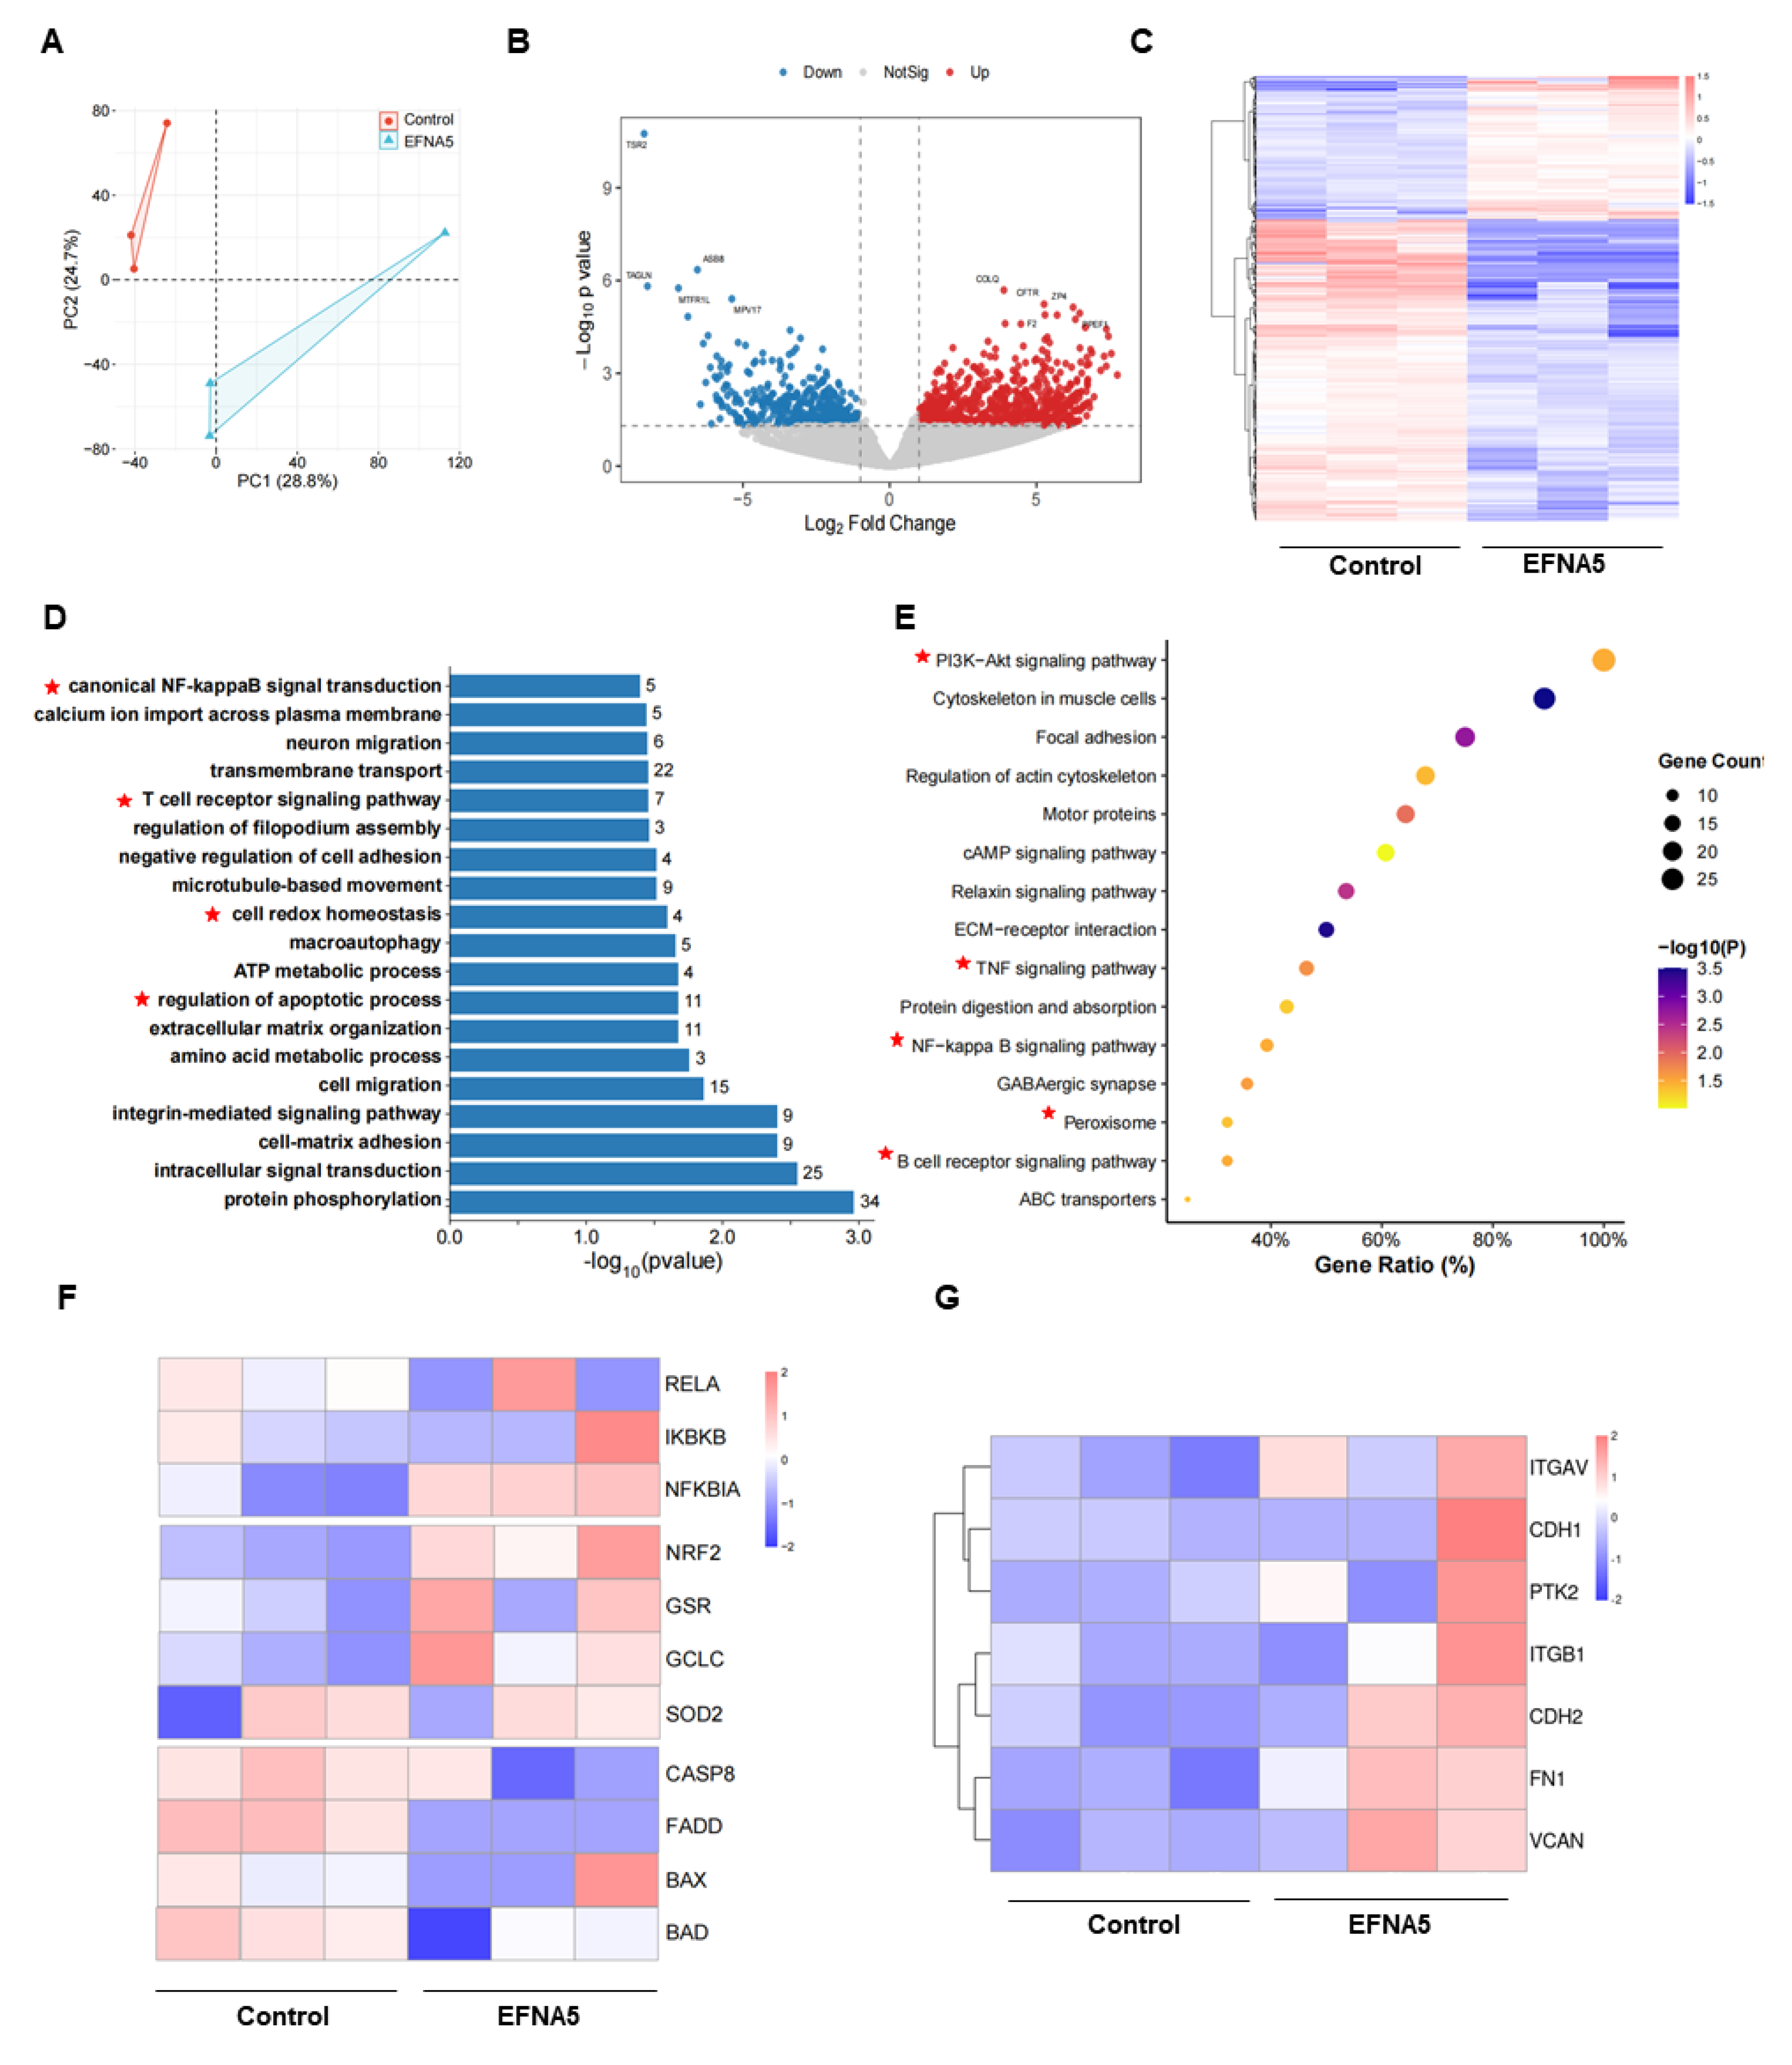
Figure 7.
EFNA5 activates NRF2 signaling and suppresses NF-κB activity in COCs. (A) Western blot and densitometry of NRF2 in control and EFNA5 groups. Note: The blot image was horizontally flipped to align with the sample order described in the legend. (B) Relative mRNA levels of KEAP1, CUL3, and BACH1 in control and EFNA5 groups. (C) Western blots and densitometry of NF-κB (p65), IKBKB, and IκB. (D) Relative mRNA levels of IL1β, IL6, CXCL8, NQO1, and TNFα in control and EFNA5 groups. All experiments were repeated at least three times. Data are shown as mean ± SEM. Statistical significance: * p < 0.05, ** p < 0.01, *** p < 0.001.
Disclaimer/Publisher’s Note: The statements, opinions and data contained in all publications are solely those of the individual author(s) and contributor(s) and not of MDPI and/or the editor(s). MDPI and/or the editor(s) disclaim responsibility for any injury to people or property resulting from any ideas, methods, instructions or products referred to in the content. |
© 2025 by the authors. Licensee MDPI, Basel, Switzerland. This article is an open access article distributed under the terms and conditions of the Creative Commons Attribution (CC BY) license (http://creativecommons.org/licenses/by/4.0/).
Copyright: This open access article is published under a Creative Commons CC BY 4.0 license, which permit the free download, distribution, and reuse, provided that the author and preprint are cited in any reuse.


