
Submitted:
25 July 2025
Posted:
28 July 2025
You are already at the latest version
Abstract
Estrogen metabolites (EMs) play a local regulatory role in mammalian ovarian function. Among them, 2-hydroxyestradiol (2-OHE2) exerts dose-dependent effects on reproductive physiology, supporting either normal ovarian processes or contributing to pathological conditions. Specifically, 2-OHE2 modulates ovarian vasculature and progesterone biosynthesis, and at 1–10 nM concentrations, it enhances in vitro developmental competence and blastocyst quality in mouse oocytes. Conversely, doses below 1 nM show no appreciable effects, suggesting the existence of a biological activity threshold. However, the impact of supra-physiological concentrations remains largely unexplored. In this study, we investigated the effects of increasing 2-OHE2 doses (0.05, 0.50, and 5.00 µM) on oocyte meiotic progression and quality. Exposure to 0.50 and 5.00 µM significantly impaired oocyte maturation, while only the highest dose notably reduced the percentage of embryos developing to the blastocyst stage. Morphometric analysis during the GV-to-MII transition revealed altered first polar body morphology, defective asymmetric division, and disruptions in cytoskeletal organization, including enlarged meiotic spindles, increased F-actin cap angles, and aberrant microtubule-organizing centers distribution. These structural alterations were paralleled by distinct changes in cytoplasmic movement velocity patterns observed through time-lapse imaging during meiotic resumption. Together, these findings demonstrate that supra-physiological exposure to 2-OHE2 compromises oocyte maturation and developmental competence by perturbing key cytoskeletal dynamics and cellular architecture necessary for successful meiosis and early embryogenesis.
Keywords:
2-hydroxyestradiol
; estrogen metabolites
; oocyte maturation
; meiotic progression
; cytoskeletal organisation
; embryo development
; microtubule-organizing centers
; F-actin cap
1. Introduction
Estrogen metabolites (EMs) are water-soluble byproducts of estrogen (E2) metabolism. The main metabolites formed through E2 hydroxylation include 2-hydroxyestradiol (2-OHE2) and 4-hydroxyestradiol (4-OHE2), which can further be converted into methoxy-derivatives, 2-methoxyestradiol (2Me-OHE2) and 4-methoxyestradiol (4Me-OHE2), respectively [1].
EMs were initially thought to have low binding affinity for E2 receptors [2,3], but a local regulatory role inthe mammalian ovarian function has been more recently clearly demonstrated [4,5,6,7,8]. Among them, the still limited literature on 2-OHE2 indicates that its dose range is key in regulating reproductive processes, either activating or inhibiting them, supporting physiological regularity or accompanying pathological conditions.
Throughout the human menstrual cycle, the variation in EMs levels is finely tuned, with 2-OHE2 increasing 2.5-fold around ovulation, reaching 27 ng/ml in urine, compared to 18 ng/ml in the pre- and post-ovulatory phases [9,10]. 2-OHE2 regulates human ovarian vasculature through its pro-angiogenic properties, promoting blood vessel formation during follicle selection, rupture, and corpus luteum (CL) development [5,6,8].
Altered levels of 2-OHE2 have been linked to reproductive disorders. In polycystic ovary syndrome (PCOS), 2-OHE2 levels are significantly reduced in both urine and follicular fluid compared to ovulatory women [6,11]. In contrast, women with endometriosis exhibit elevated levels of 2-OHE2 in the eutopic endometrium, which may contribute to the pathophysiology of this condition [12].
In vitro studies have demonstrated that 2-OHE2 stimulates the production of the vascular endothelial growth factor in human granulosa cells [4,5]. This EM also influences progesterone biosynthesis in small follicles. It stimulates porcine granulosa cells to produce progesterone [13] and promotes progesterone accumulation in rat luteal cells [14]. In the mouse, the presence of 1 nM or 10 nM 2-OHE2 during in vitro maturation of cumulus-oocyte complexes (COCs) enhances oocyte developmental competence, increasing the rate of preimplantation development and improving blastocyst quality [15].
While doses below 1 nM do not exhibit significant effects on oocyte competence or embryo quality [15], highlighting a threshold requirement for biological activity, the consequences of exposure to higher concentrations remain to be elucidated. Understanding how supra-physiological concentrations of this metabolite affect oocyte maturation and embryo development is particularly relevant in pathological contexts where EMs may be dysregulated.
To this end, mouse ovarian antral cumulus-oocyte complexes (COCs) were subjected to in vitro maturation in the presence of 2-OHE2 at concentrations of 0.05, 0.50, or 5.00 µM. We then assessed (i) the oocytes’ capacity to resume meiosis and support embryonic development up to the blastocyst stage following fertilization, and (ii) key cellular events associated with meiotic progression. Furthermore, considering that such cytological processes can be monitored as global cytoplasmic movements using bright-field time-lapse microscopy [16], we analyzed cytoplasmic movement velocity (CMV) profiles [17] to evaluate whether 2-OHE2 exposure alters the temporal dynamics of the GV-to-MII transition.
2. Materials and Methods
2.1. Animals and Reagents
Four- or five-week-old female and five-month-old male CD1 mice (Charles River Laboratories) were kept in the animal house under controlled conditions, i.e. 22°C with 60% air moisture and 12:12 light:dark photoperiod. Animal manipulation and investigations were conducted in accordance with the guiding principles of European (2010/63/UE) and Italian (Dlvo 26/2014) laws protecting animals used for scientific research (protocol numbers 909/2018-PR and 919/2023-PR).
2.2. Cumulus-Oocyte-Complexes Isolation and In Vitro Maturation
CD1 females were injected with 10 U of pregnant mare's serum gonadotropin (PMSG; Intervet Srl, Italy), 48 h before their sacrifice. Isolated ovaries were placed in HEPES-buffered α-MEM W/GLUTAMAX-I (ThermoFisher Scientific) supplemented with 6 mg/mL HEPES, 5% fetal bovine serum (FBS; ThermoFisher Scientific), 0.23 mM Sodium Pyruvate (Merck), 1 mg/mL Fetuin (Merck), 100 U/mL penicillin and 75 µg/ml streptomycin (ThermoFisher Scientific). Isolation of COCs was carried out by puncturing the ovarian surface with a sterile 26G needle for their release. COCs with fully-grown antral oocytes completely surrounded by at least 3-4 layers of follicle cells were collected and washed in fresh drops of α-MEM W/GLUTAMAX-I supplemented with 5% FBS, 0.23 mM Sodium Pyruvate, 1 mg/mL Fetuin, 100 U/mL penicillin, 75 µg/ml streptomycin, 50 mU/mL follicle-stimulating hormone (FSH; Calbiochem) and 10 ng/mL epidermal growth factor (EGF; Merck-Sigma) (α-MEM maturation medium). Then, they were in vitro matured up to metaphase I (MI) for 7 h or up metaphase II (MII) for 15 h in 5% CO2 at 37°C, in the presence of 0.05, 0.50 or 5.00 µM 2-OHE2 (Merck) or with 0.1% DMSO, 2-OHE2 vehicle (CTR). As previously reported, 0.1% DMSO did not show adverse effects during in vitro maturation (IVM) [15].
2.3. First Polar Body Morphology and Size
Polar body I (PB-I) morphology and size was evaluated as described in [15]. Briefly, cumulus cells (CCs)-free MII oocytes were photographed using an inverted Olympus IX71 microscope equipped with a JVC KY-F58 3-CCD camera and a micromanipulator. For each oocyte, images were captured (under 10x objective) with both frontal and lateral PB-I observations. These orientations were achieved by moving the oocytes using the micromanipulator micropipette. Only intact PB-Is were considered for further analysis. Pictures were analysed using the CellSens Dimension 1.4.1 software and the PB-I volumes calculated drawing three lines corresponding to three radii of each PB-I.
2.4. In Vitro Fertilization
MII oocytes were inseminated with 1.8 x 10⁶/mL capacitated sperm at 37°C and 5% CO2 for 2 h as previously described [18]. Presumptive zygotes (as determined by the presence of a second polar body, PB-II) were transferred in M16 medium (2 μL/oocyte) supplemented with 0.4% BSA, 2 mM glutamine (Gibco), 5 mM taurine and 0.23 mM pyruvate for preimplantation development. Embryonic development rate was evaluated at 24 (2-cell stage), 48 (4-cell) and 96 (blastocyst) h post-insemination.
2.5. Immunofluorescence and Analyses of Oocyte Geometrical Parameters
Detection of α-tubulin, γ-tubulin and F-actin in MI and MII oocytes was performed as previously reported [15]. Briefly, oocytes were fixed and permeabilized in 4% paraformaldehyde, diluted in a Microtubule Stabilization Buffer, supplemented with 1% Triton X-100 (Merck) for 35 min at 37°C in gentle agitation. After washing in Wash Solution (WS) gametes were incubated with the primary antibodies diluted in WS (anti-α-tubulin 1:1000, cat. n. T5168; anti-γ-tubulin 1:500, cat. n. T5326; Merck), at 37°C for 1 h in gentle agitation and then, with an AlexaFluor 488 conjugated goat secondary anti-mouse IgG (Life Technologies) diluted 1:2000 in WS together with Phalloidin-TRITC (cat. n. P1951, Merck) diluted 1:1000. Oocytes’ nuclei were counterstained with 0.2 μg/mL DAPI for 10 min at room temperature and mounted in Vectashield Antifade Mounting Medium (Vector Laboratories, cat. n. H-1000).
Samples were analysed using a Leica TCS SP8 confocal microscope equipped with a white laser and the AOBS system. Stacks were obtained with axial distances of 0.3 μm. Images were processed with ImageJ (http://imagej.nih.gov/ij/).
The extension and intensity of the cortical F-actin cap, the meiotic spindle shape and area and the microtubule organization centers (MTOCs) localization were analysed as reported in [15].
2.6. Time-Lapse Recording and Analyses
Denuded oocytes were cultured in 2-μL drops of α-MEM maturation medium (4 oocytes/drop) onto a 3.5-cm glass-bottom dish (WillCoWells), covered with mineral oil (Merck), and placed at 37°C and 5% CO2 in the incubator of a BioStation IM (Nikon). Time-lapse images of the maturing oocytes were collected every 5 min, for a total of 15 h. Images of germinal vesicle (GV) to MII transition were acquired with a 20X objective, under bright-field light with fixed parameters as previously reported in [17].
The Cell_PIV software (MATPIV v6.6.1), developed and kindly provided by Dr. Shane Windsor [19,20], was used to detect cytoplasmic movement velocity (CMV) within the oocyte during the GV-to-MII transition of both CTR and 5 µM 2-OHE2 exposed oocytes. The Cell_PIV software provided the raw data of the cytoplasmic movement, used as parametric values to perform analysis for the comparison. The calculated mean velocities are expressed in nm/min.
2.7. Statistical Analysis
Statistical analyses were carried out using the Sigma Stat 3.5 and Prism 10 software. Data, obtained from at least five independent experiments, were analysed by the Student’s t test or by the one-way ANOVA, followed by the Fisher LSD Method (post hoc test). Statistical analysis of nonparametric data was performed either by the Mann-Whitney test or by the Kruskal–Wallis test together with the Dunn’s multiple range test. Data were expressed as the mean ± SEM (Standard Error of the Mean) or mean ± SD (Standard Deviation). The statistical analysis of the absolute frequencies was performed using a Fisher’s exact test. Differences were considered significant for p values ≤ 0.05.
3. Results
3.1 The Presence of 5.00 µM 2-OHE2 During IVM Reduces both Oocyte Meiotic and Developmental Competence
Following 15 h of in vitro maturation (IVM) with 0.1% DMSO (CTR), the 2-OHE2 vehicle, 92% of fully-grown antral oocytes reached the MII stage (Table 1), confirming earlier reports [15,21]. A very similar maturation rate (p>0.05) was obtained in the presence of 0.05 µM 2-OHE2. Instead, at 0.50 or 5.00 µM 2-OHE2 exposure, the frequency of MII oocytes was significantly lower, 87% (p<0.001) or 78% (p<0.001), respectively. In the latter group, more than 20% (p<0.01) of oocytes were either blocked at the GV or germinal vesicle breakdown (GVBD) stages or were pyknotic/fragmented (Table 1).
Next, to assess MII developmental competence, matured oocytes were in vitro inseminated, and embryos were cultured to the blastocyst stage.
Following fertilisation, 62% of CTR MII reached the 2-cell stage and of these about 31% completed preimplantation development up to the blastocyst stage (Table 2), a frequency expected when COCs are in vitro grown [15,21,22]. When compared to CTR samples, 0.05 or 0.50 µM 2-OHE2-exposed MII oocytes showed no significant difference (p ≥ 0.05) in their developmental efficiency, at all embryo stages (Table 2). Instead, only 37% of 5.00 µM 2-OHE2-exposed oocytes reached the 2-cell stage and, of these, only 5% developed to blastocyst (p < 0.001) (Table 2).
Overall, these results indicate that the presence of 0.50 and 5.00 µM 2-OHE2 in the culture medium of fully-grown oocytes disrupts meiotic progression to MII and, at the highest dose, impacts on preimplantation embryonic development.
3.2. The Presence of 5.00 µM 2-OHE2 Alters Cellular Features of Cell Division And meiotic Spindle Organisation in MI and MII Oocytes
The 5.00 µM dose of 2-OHE2 had the most significant effects on both meiotic progression and preimplantation embryonic development. For this reason, only this dose was used in subsequent experiments, during which the following cellular features were analyzed:
- 1)
- the progressive clustering of microtubule organization centres (MTOCs), which play a crucial role in spindle formation during meiosis [23];
- 2)
- 3)
- the amplitude of the F-actin cap at the site of PB-I extrusion, a key event during cortical migration of the meiotic spindle [26];
- 4)
- the volume of the first polar body (PB-I), as a defining feature of the asymmetry of female meiosis, that results in the production of a large oocyte and a small PB-I [27].
3.2.1. MTOC Dynamics
MTOCs were categorized into two main types:
i) Polar MTOCs (pMTOCs), which contribute to spindle pole formation [28,29]. These are further divided into two classes:
ii) Cytoplasmic MTOCs (cMTOCs, Class III), which remain in the cytoplasm without contributing to spindle formation. Their function remains unclear [23].
In CTR MI oocytes, all analyzed samples exhibited pMTOCs. Specifically, 64.1% displayed Class I MTOCs at the spindle poles, 12.8% exhibited dispersed γ-tubulin signals along spindle fibers (Class II), and 23.1% showed a combination of Class I and II (Figure 1A–D). Additionally, 82.1% of MI oocytes had Class III MTOCs, with 79.5% presenting a few clustered γ-tubulin spots (≤ 30), while 2.6% contained numerous (> 30) smaller, dispersed spots (Table 1S). The remaining 17.9% lacked cMTOCs. Exposure to 2-OHE2 significantly reduced the proportion of MI oocytes with exclusively Class I MTOCs to 14.3% (p < 0.001), while increasing the prevalence of Class II MTOCs to 53.6% (p < 0.001). In 28.6% of cases, both Class I and II were present. Class III MTOCs remained common (78.2%, p ≥ 0.05), but 25% of exposed oocytes contained > 30 widely dispersed γ-tubulin signals (p = 0.005 vs. CTR) (Figure 1; Table 1S).
In CTR MII oocytes, the majority (97%) displayed pMTOCs, with 60.6% exhibiting Class I MTOCs, 15.2% Class II, and 21.2% a mix of both classes. Class III MTOCs were observed in 69.7% of cases. Following 2-OHE2 exposure, the proportion of oocytes with Class I MTOCs dropped to 24.2% (p = 0.005), while Class II increased to 45.2% (p = 0.002); 22.6% exhibited both classes. Class III MTOCs were present in 90.4% of exposed oocytes (p = 0.04), with 32.3% (p = 0.039) containing > 30 small, highly dispersed γ-tubulin signals. The percentage of MII oocytes lacking Class III MTOCs decreased to 9.7% (p = 0.04) (Figure 1; Table 1S).
3.2.2. Shape of the Meiotic Spindle
The meiotic spindles of both CTR and 2-OHE2-exposed MI and MII oocytes were visualized using anti-α-tubulin immunolabelling (Figure 2).
In the vast majority of CTR (93.6%, n=47) and in 71.9% (n=55) of 2-OHE2-exposed MI oocytes the spindle fibers diplayed a well-organized spindle morphology. Among these, 72.7% of CTR oocytes exhibited a barrel-like spindle shape (Figure 2A), compared to 56.4% in the 2-OHE2-exposed group (p ≥ 0.05) (Table 3). While the mean spindle area did not differ significantly between groups (p = 0.099), the barrel-like spindle pole width was significantly larger in 2-OHE2-exposed oocytes (p = 0.021) (Table 3). In MI oocytes with a rectangular-like spindle configuration (Figure 2B), 2-OHE2 exposure significantly increased both the mean equatorial spindle width (p < 0.001) and the mean area, reaching 398.8 ± 31.6 µm² (p = 0.007) (Table 3). In the remaining 6.4% of CTR MI oocytes and 29.1% of 2-OHE2-exposed MI oocytes (p < 0.05), only dispersed α-tubulin signals surrounding misaligned chromosomes were observed (Figure 1S A,D).
Similar trends were observed in MII oocytes. Among CTR MII oocytes, 61.7% displayed a barrel-like spindle shape, compared to 55.8% in the 2-OHE2-exposed group (p ≥ 0.05) (Table 3). Treatment with 2-OHE2 significantly increased both the equatorial width and area of barrel- and rectangular-like spindles. Additionally, in rectangular-like spindles, the pole width was significantly larger than in CTR oocytes (p = 0.001) (Table 3).
3.2.3. F-Actin Cap Angle Extension
The F-actin cap was visualized using phalloidin staining and measured in a total of n=90 CTR and n=143 2-OHE2-exposed MI oocytes, as well as in n=96 CTR and n=86 2-OHE2-exposed MII oocytes.
A well-defined cortical F-actin cap was observed in 92.9% (n=84) of MI CTR oocytes and 75.5% (n=101) of 2-OHE2-exposed MI oocytes (Figure 3A,B). The remaining oocytes displayed an F-actin signal distributed across the entire oolemma without a distinct cap formation. A significantly higher proportion of 2-OHE2-exposed MI oocytes (24.5%, n=42) compared to CTR oocytes (7.1%, n=6) exhibited this abnormal F-actin distribution (p < 0.05; Figure 1S B,D). Due to the absence of a distinct F-actin cap, these oocytes were excluded from further analysis.
In oocytes exhibiting proper cortical F-actin cap distribution, the angle of the circular sector formed by the F-actin arc was measured to assess its amplitude. In CTR MI oocytes, the mean angle was 101.1°, with a maximum value of 139.4° (Figure 3A,C). In contrast, MI oocytes exposed to 2-OHE2 exhibited a significantly increased median angle of 115.7° (p < 0.001), with 19% of oocytes showing values between 139.4° and 172.7° (Figure 3B,C).
After 15 hours of IVM, all MII oocytes extruded the PB-I displayed and an F-actin cap. The mean angle in CTR MII oocytes was 116.0°, whereas exposure to 2-OHE2 significantly increased this value by approximately 10° (p = 0.008) (Figure 3D).
Furthermore, fluorescence intensity analysis revealed a significantly higher (p < 0.05) F-actin cap signal in both MI and MII CTR oocytes compared to those matured in the presence of 2-OHE2 (Figure 3E).
3.2.4. Volume of the First Polar Body
In MII CTR oocytes, the mean PB-I volume was 1.2 x 10⁴ ± 1.5 x 10³ µm³ (Figure 4A,B). Following, the exposure to 5.00 µM 2-OHE2, the mean volume significantly (p ≤ 0.001) increased up to 2.3 x 10⁴ ± 2.4 x 103 µm3 (Figure 4A). Moreover, in 14% of CTR group, oocytes display a 2-cell-like configuration (having a PB-I volume > 3x10⁴ µm³; Figure 4C, while the 5.00 µM 2-OHE2-treated oocytes show a marked increase, reaching 34% (p = 0.006) of oocytes having a 2-cell-like configuration, indicative of a symmetrical division. Furthermore, it is interesting to note that even following the exclusion of 2-cell-like oocytes from the comparison, the PB-I remained significantly (p = 0.0032) larger in the 5.00 µM 2-OHE2-treated group than in the CTR group (Figure 4A).
3.3. Cytoplasmic Movement Velocity Profiles During the GV-to-MII Transition
The previous observations indicated that 2-OHE2 influences crucial events during the resumption of meiosis. In earlier studies by coupling time-lapse bright-field microscopy with image analysis based on particle image velocimetry (PIV), we and others [17,19,20] demonstrated that cytological events occurring during the GV-to-MII transition can be visualized as global cytoplasmic movements. To assess whether 2-OHE2 influences the timing of cellular events during the GV-to-MII transition we recorded the cytoplasmic movement velocity (CMV) profiles [17].
Figure 5 summarizes the CMV profiles of 32 CTR and 30 2-OHE2-exposed oocytes, aligning time-lapse measurements with critical cytological events during the GV-to-MII transition. While both groups displayed broadly similar CMV trends over time, statistical analysis revealed four specific time intervals with significant differences, each corresponding to distinct key cellular events:
1). Between 0–20 minutes – GVBD:
During this initial phase, corresponding to the onset of nuclear envelope disassembly, 2-OHE2-exposed oocytes displayed a significant increase (p = 0.0018) in CMV with 40% of them showing an increase up to twofold higher than CTR. This early cytoplasmic activity surge may reflect premature signalling events or altered meiotic entry mechanisms, consistent with previous observations on early oocyte activation dynamics [17,34].
2). Between 225–265 minutes – Spindle Assembly and Chromosome Alignment:
During this phase, when chromosomes adopt a rosette-like configuration and the MI spindle forms, 2-OHE2-exposed oocytes showed a significant increase (p ≤ 0.05) in CMV, peaking at 232 minutes, where these oocytes exhibited up to sevenfold higher CMV than CTR. This period coincides with spindle formation and preparation for cortical migration, as reported by [16,35,36].
3). Between 465–510 minutes – PB-I Extrusion:
In CTR oocytes, this interval marks the beginning of PB-I extrusion and is characterized by an increase in CMV, reaching up to threefold the levels seen in treated oocytes. In contrast, 2-OHE2-exposed oocytes exhibited a significant reduction (p ≤ 0.05) in CMV (up to twofold). This discrepancy aligns with a notable delay in PB-I extrusion in the treated group (645 min vs. 552 min in CTR; p ≤ 0.001), suggesting that altered cytoplasmic activity may reflect impaired meiotic progression [21].
4). Between 665–765 minutes – Post-MII Spindle Formation:
Following the formation of the MII spindle, CTR oocytes showed a gradual decrease in CMV, indicating stabilization of cytoplasmic dynamics. Conversely, 2-OHE2-exposed oocytes exhibited a sustained CMV elevation (p ≤ 0.05) reaching up to twofold higher than CTR, implying continued intracellular activity or delayed cytoplasmic reorganization.
After 765 minutes, CMV levels in 2-OHE2-exposed oocytes declined and converged with those of the CTR group, suggesting a partial recovery or eventual alignment in cytoplasmic behaviour at later stages.
4. Discussion
Our findings demonstrate that exposure to supra-physiological levels of 2-OHE2 during the GV-to-MII transition adversely affects oocyte maturation and developmental competence. Specifically, oocytes treated with 0.50 and 5.00 µM 2-OHE2 exhibited significantly reduced maturation rates, with increased arrest at the GV and GVBD stages, and a lower percentage reaching the MII stage. Following fertilization, only MII oocytes exposed to the highest 2-OHE2 concentration exhibited markedly compromised developmental potential, with only 37% progressing to the 2-cell stage and merely 5% developing to the blastocyst stage. These data suggest detrimental effects of this metabolite on meiotic progression and a profound impairment of oocyte developmental competence induced at the highest dose analysed.
The observed impairment was accompanied by significant cytoskeletal disruptions at both the MI and MII stages. Immunofluorescence analysis revealed an increase in the amplitude of the F-actin cap in both MI and MII oocytes exposed to 2-OHE2. This cytoskeletal alteration coincided with an enlargement of the meiotic spindle area. In MI oocytes, this increase was specific to spindles exhibiting a rectangular configuration, while in MII oocytes, both barrel-shaped and rectangular spindles showed greater width at the poles and equator. These findings align with previous studies indicating that perturbation of F-actin dynamics impairs spindle migration and compromises asymmetric division, leading to MI arrest and symmetrical cleavage [15,35,37,38,39,40,41,42]. Consistently, in our study, 78% of oocytes exposed to 5.00 µM 2-OHE2 reached the MII stage, and only 34% of these displayed a two-cell-like morphology suggestive of disrupted asymmetric division.
Notably, both spindle size and polar body dimensions have been proposed as non-invasive markers of oocyte competence, as they reflect proper cytoskeletal organization—key to successful meiotic progression and embryo development. Deviations in these structural parameters, particularly in MII spindles, are known to correlate with reduced fertilization rates and impaired blastocyst formation, with both undersized and oversized spindles falling outside the functional window of competence [15,23,38,43,44]. The morphological anomalies observed in our model thus further substantiate the detrimental impact of 2-OHE2 on oocyte quality.
Mechanistically, exposure to 2-OHE2 also induced alternations in MTOCs. At the highest dose, we observed an increased number of cytoplasmic MTOCs with aberrant clustering and mis localization along the spindle and at its poles. Approximately 45% of oocytes presented spindles with a rectangular configuration, diverging from the typical barrel-shaped morphology. In MI oocytes, spindle enlargement was limited to the rectangular configuration, whereas in MII oocytes, enlargement occurred across both configurations, indicating widespread cytoskeletal disruption. Proper MTOC distribution is essential for spindle assembly and chromosome alignment. Disrupted MTOC dynamics are associated with abnormal spindle morphology and defective chromosome segregation, ultimately compromising oocyte quality and developmental competence [45]. The aberrant MTOC behaviour observed in our study supports the hypothesis that 2-OHE2 interferes with cytoskeletal reorganization, contributing to meiotic defects [23]. In addition, time-lapse imaging revealed significant perturbations in CMV during critical meiotic events, including GVBD, spindle assembly at MI and MII, and PB-I extrusion. These observations further confirm that 2-OHE2 disrupts not only static cytoskeletal structures, but also the dynamic processes essential for meiotic progression.
In conclusion, our study highlights that supra-physiological exposure to 2-OHE2 during oocyte maturation compromises meiotic progression and developmental competence by disrupting cytoskeletal organization, particularly F-actin dynamics and MTOC-mediated spindle architecture. These findings contribute our understanding of how EMs may impair fertility under endocrine-disrupting conditions.
Supplementary Materials
The following supporting information can be downloaded at the website of this paper posted on Preprints.org., Figure S1: Fluorescence microscopy images showing the absence of a spindle fiber and of an F-actin cap in an oocyte after 6 hours of in vitro culture; Table S1: Absolute percentage of Class I, II and III microtubule organization centers (MTOCs) in control (CTR) and 2-OHE2-exposed MI or MII oocytes (5.00 µM).
Author Contributions
Conceptualization, V.M., S.G. and M.Z..; methodology, V.M. and M.Z.; writing—original draft preparation, V.M., S.G., M.Z. and P.R.; writing—review and editing, V.M., S.G., M.Z. and P.R.; funding acquisition, V.M., S.G., M.Z. and P.R. All authors have read and agreed to the published version of the manuscript.
Funding
This work was funded by the Italian Ministry of University and Research (MUR): Diparti- menti di Eccellenza Program (2018–2022)—Department of Biology and Biotechnology “L. Spallan- zani”, University of Pavia to V.M., S.G., M.Z. and P.R. and by the University of Pavia (FRG) to V.M., S.G., M.Z. and P.R.
Institutional Review Board Statement
Animal manipulation and investigations were conducted in accordance with the guiding principles of European (2010/63/UE) and Italian (Dlvo 26/2014) laws protecting animals used for scientific research (protocol numbers 909/2018-PR and 919/2023-PR).
Informed Consent Statement
Not applicable.
Data Availability Statement
Not applicable.
Acknowledgments
The authors gratefully acknowledge “Centro Grandi Strumenti” and the “Optical Microscopy Facility” of University of Pavia for their support and assistance in this work, the animal facility “Centro di servizio per la gestione unificata delle attività di stabulazione e di radiobiologia” of the University of Pavia to host the animals; We thank the “Organismo Preposto al Benessere degli Animali” (OPBA) of the University of Pavia for their ethical review and approval of the animal protocol. The authors thank Merck-MilliQ Laboratory Water Solutions for suppo
Conflicts of Interest
The authors declare no conflicts of interest.
References
- Stanczyk, F.Z. Metabolism of endogenous and exogenous estrogens in women. J Steroid Biochem Mol Biol. 2024, 242, 106539. [Google Scholar] [CrossRef] [PubMed]
- Spicer, L.J.; Hammond, J.M. Regulation of ovarian function by catecholestrogens: current concepts. J Steroid Biochem 1989, 33, 489–501. [Google Scholar] [CrossRef] [PubMed]
- Roselli, M.; Dubey, R.K. Estrogen metabolism and reproduction-is there a relationship? J Fertil Reprod 2006, 16, 19–23. [Google Scholar]
- Kohen, P.; Henríquez, S.; Rojas, C.; et al. 2-Methoxyestradiol in the human corpus luteum throughout the luteal phase and its influence on lutein cell steroidogenesis and angiogenic activity. Fertil. Steril. 2013, 100, 1397–1404. [Google Scholar] [CrossRef] [PubMed]
- Henríquez, S.; Kohen, P.; Xu, X.; Veenstra, T.D.; Muñoz, A.; Palomino, W.A.; Strauss, J.F., 3rd; Devoto, L. Estrogen metabolites in human corpus luteum physiology: differential effects on angiogenic activity. Fertil. Steril. 2016, 106, 230–237. [Google Scholar] [CrossRef]
- Henriquez, S.; Kohen, P.; Villarroel, C.; Muñoz, A.; Godoy, A.; Strauss, J.F., 3rd; et al. Significance of pro-angiogenic estrogen metabolites in normal follicular development and follicular growth arrest in Polycystic Ovary Syndrome (PCOS). Hum. Reprod. 2020, 35. [Google Scholar] [CrossRef]
- Henríquez, s.; Valdivia, M.J.; Mainigi, M.; Villarroel, C.; Velasquez, L.; Strauss, J.F., III; Devoto, L. The role of estrogen metabolites in human ovarian function. Steroids 2024, 203, 109368. [Google Scholar] [CrossRef]
- Devoto, L.; Henríquez, S.; Kohen, P.; Strauss, J.F. , 3rd. The significance of estradiol metabolites in human corpus luteum physiology. Steroids 2017, 123, 50–54. [Google Scholar] [CrossRef]
- Berg, D.; Thaler, F.; Kuss, E. Concentrations of 2-hydroxyoestrogens in human sera measured by a heterologous immunoassay with an 125I-labelled ligand. Acta Endocrinologica 1982, 100, 154–160. [Google Scholar] [CrossRef]
- Bozzolino, C.; Vaglio, S.; Amante, E.; Alladio, E.; Gerace, E.; Salomone, A.; Vincenti, M. Individual and cyclic estrogenic profile in women: Structure and variability of the data. Steroids 2019, 150, 108432. [Google Scholar] [CrossRef]
- Salih, S.; Xu, X.; Veenstra, T.D.; Duleba, A.J.; Fouad, H.; Nagamani, M.; Al-Hendy, A. Lower levels of urinary 2-hydroxyestrogens in polycystic ovary syndrome. J. Clin. Endocrinol. Metab. 2007, 92, 3285–3291. [Google Scholar] [CrossRef]
- Othman, E.R.; Markeb, A.; Khashbah, M.Y.; Abdelaal, I.; ElMelegy, I.; Fetih, A.N.; Van der Houwen, L.; Lambalk, C.B.; Mijatovic, V. Markers of Local and Systemic Estrogen Metabolism in Endometriosis. Reprod. Sci. 2021, 28, 1001–1011. [Google Scholar] [CrossRef]
- Spicer, L.J.; Tucker, W.B.; Adams, G.D. Insulin-like growth factor-I in dairy cows: relationships among energy balance, body condition, ovarian activity, and estrous behavior. J Dairy Sci. 1990, 73, 929–37. [Google Scholar] [CrossRef]
- Tekpetey, F.R.; Armstrong, D.T. Catecholestrogen modulation of steroid production by rat luteal cells: mechanism of action. Mol Cell Endocrinol. 1994, 101, 49–57. [Google Scholar] [CrossRef]
- Merico, V.; Zanoni, M.; Parada-Bustamante, A.; Garagna, S.; Zuccotti, M. In Vitro Maturation of Fully Grown Mouse Antral Follicles in the Presence of 1 nM 2-Hydroxyestradiol Improves Oocytes' Developmental Competence. Reprod Sci. 2021, 28, 121–133. [Google Scholar] [CrossRef]
- Belli, M.; Vigone, G.; Merico, V.; Redi, C.A.; Garagna, S.; Zuccotti, M. Time-lapse dynamics of the mouse oocyte chromatin organisation during meiotic resumption. Biomed Res Int. 2014, 2014, 207357. [Google Scholar] [CrossRef]
- Bui, T.T.H.; Belli, M.; Fassina, L.; Vigone, G.; Merico, V.; Garagna, S.; Zuccotti, M. Cytoplasmic movement profiles of mouse surrounding nucleolus and not-surrounding nucleolus antral oocytes during meiotic resumption. Mol Reprod Dev. 2017, 84, 356–362. [Google Scholar] [CrossRef] [PubMed]
- Zuccotti, M.; Giorgi Rossi, P.; Martinez, A.; Garagna, S.; Forabosco, A.; Redi, C.A. Meiotic and developmental competence of mouse antral oocytes. Biol Reprod. 1998, 58, 700–4. [Google Scholar] [CrossRef]
- Ajduk, A.; Ilozue, T.; Windsor, S.; Yu, Y.; Seres, K.B.; Bomphrey, R.J.; Tom, B.D.; Swann, K.; Thomas, A.; Graham, C.; Zernicka-Goetz, M. Rhythmic actomyosin-driven contractions induced by sperm entry predict mammalian embryo viability. Nat Commun. 2011, 2, 417. [Google Scholar] [CrossRef] [PubMed]
- Swann, K.; Windsor, S.; Campbell, K.; Elgmati, K.; Nomikos, M.; Zernicka-Goetz, M.; Amso, N.; Lai, F.A.; Thomas, A.; Graham, C. Phospholipase C-ζ-induced Ca2+ oscillations cause coincident cytoplasmic movements in human oocytes that failed to fertilize after intracytoplasmic sperm injection. Fertil Steril. 2012, 97, 742–7. [Google Scholar] [CrossRef] [PubMed]
- Cavalera, F.; Zanoni, M.; Merico, V.; Sacchi, L.; Bellazzi, R.; Garagna, S.; Zuccotti, M. Chromatin organization and timing of polar body I extrusion identify developmentally competent mouse oocytes. Int. J. Dev. Biol. 2019, 63, 245–251. [Google Scholar] [CrossRef] [PubMed]
- Ge, L.; Han, D.; Lan, G.C.; Zhou, P.; Liu, Y.; Zhang, X.; Sui, H.S.; Tan, J.H. Factors affecting the in vitro action of cumulus cells on the maturing mouse oocytes. Mol. Reprod. Dev. 2008, 75, 136–142. [Google Scholar] [CrossRef]
- Londoño-Vásquez, D.; Rodriguez-Lukey, K.; Behura, S.K.; Balboula, A.Z. ; Microtubule organizing centers regulate spindle positioning in mouse oocytes. Dev Cell. 2022, 57, 197–211.e3. [Google Scholar] [CrossRef]
- Ganesh, A.; Chattopadhyay, R.; Narendra Babu, K.; Chakravarty, B.; Chaudhury, K. Analysis of spindle characteristics and embryo quality in mice stimulated with letrozole using Polscope imaging. Fertil Steril. 2010, 93, 1477–81. [Google Scholar] [CrossRef] [PubMed]
- Fluks, M.; Milewski, R.; Tamborski, S.; Szkulmowski, M.; Ajduk, A. Spindle shape and volume differ in high- and low-quality metaphase II oocytes. Reproduction. 2024, 167, e230281. [Google Scholar] [CrossRef]
- Duan, X.; Sun, S.C. Actin cytoskeleton dynamics in mammalian oocyte meiosis. Biol Reprod. 2019, 100, 15–24. [Google Scholar] [CrossRef]
- Levi, M.; Kaplan-Kraicer, R.; Shalgi, R. Regulation of division in mammalian oocytes: implications for polar body formation. Mol Hum Reprod. 2011, 17, 328–34. [Google Scholar] [CrossRef]
- Schuh, M.; Ellenberg, J. Self-organization of MTOCs replaces centrosome function during acentrosomal spindle assembly in live mouse oocytes. Cell. 2007, 130, 484–98. [Google Scholar] [CrossRef]
- Clift, D.; Schuh, M. A three-step MTOC fragmentation mechanism facilitates bipolar spindle assembly in mouse oocytes. Nat Commun. 2015, 6, 7217. [Google Scholar] [CrossRef]
- Szollosi, D.; Calarco, P.; Donahue, R.P. Absence of centrioles in the first and second meiotic spindles of mouse oocytes. J Cell Sci. 1972, 11, 521–41. [Google Scholar] [CrossRef] [PubMed]
- Luksza, M.; Queguigner, I.; Verlhac, M.H.; Brunet, S. Rebuilding MTOCs upon centriole loss during mouse oogenesis. Dev Biol. 2013, 382, 48–56. [Google Scholar] [CrossRef]
- Balboula, A.Z.; Nguyen, A.L.; Gentilello, A.S.; Quartuccio, S.M.; Drutovic, D.; Solc, P.; Schindler, K. Haspin kinase regulates microtubule-organizing center clustering and stability through Aurora kinase C in mouse oocytes. J Cell Sci. 2016, 129, 3648–3660. [Google Scholar] [CrossRef]
- Breuer, M.; Kolano, A.; Kwon, M.; Li, C.C.; Tsai, T.F.; Pellman, D.; Brunet, S.; Verlhac, M.H. HURP permits MTOC sorting for robust meiotic spindle bipolarity, similar to extra centrosome clustering in cancer cells. J Cell Biol. 2010, 191, 1251–60. [Google Scholar] [CrossRef]
- FitzHarris, G.; Marangos, P.; Carroll, J. Changes in endoplasmic reticulum structure during mouse oocyte maturation are controlled by the cytoskeleton and cytoplasmic dynein. Dev Biol. 2007, 305, 133–44. [Google Scholar] [CrossRef]
- Schuh, M.; Ellenberg, J. A new model for asymmetric spindle positioning in mouse oocytes. Curr Biol. 2008, 18, 1986–92. [Google Scholar] [CrossRef] [PubMed]
- Kincade, J.N.; Hlavacek, A.; Akera, T.; Balboula, A.Z. Initial spindle positioning at the oocyte center protects against incorrect kinetochore-microtubule attachment and aneuploidy in mice. Sci Adv. 2023, 9, eadd7397. [Google Scholar] [CrossRef]
- Longo, F.J.; Chen, D.Y. Development of cortical polarity in mouse eggs: involvement of the meiotic apparatus. Dev Biol. 1985, 107, 382–94. [Google Scholar] [CrossRef] [PubMed]
- Choi, T.; Fukasawa, K.; Zhou, R.; Tessarollo, L.; Borror, K.; Resau, J.; Vande Woude, G.F. The Mos/mitogen-activated protein kinase (MAPK) pathway regulates the size and degradation of the first polar body in maturing mouse oocytes. Proc Natl Acad Sci U S A. 1996, 93, 7032–5. [Google Scholar] [CrossRef] [PubMed]
- Ebner, T.; Moser, M.; Sommergruber, M.; Yaman, C.; Pfleger, U.; Tews, G. First polar body morphology and blastocyst formation rate in ICSI patients. Hum Reprod. 2002, 17, 2415–8. [Google Scholar] [CrossRef]
- Azoury, J.; Lee, K.W.; Georget, V.; Rassinier, P.; Leader, B.; Verlhac, M.H. Spindle positioning in mouse oocytes relies on a dynamic meshwork of actin filaments. Curr Biol. 2008, 18, 1514–9. [Google Scholar] [CrossRef]
- Li, H.; Guo, F.; Rubinstein, B.; Li, R. Actin-driven chromosomal motility leads to symmetry breaking in mammalian meiotic oocytes. Nat Cell Biol. 2008, 10, 1301–8. [Google Scholar] [CrossRef]
- Ma, C.; Zhang, X.; Zhang, Y.; Ruan, H.; Xu, X.; Wu, C.; Ding, Z.; Cao, Y. Sirtuin 5-driven meiotic spindle assembly and actin-based migration in mouse oocyte meiosis. Heliyon. 2024, 10, e32466. [Google Scholar] [CrossRef]
- Namgoong, S.; Kim, N.H. Roles of actin binding proteins in mammalian oocyte maturation and beyond. Cell Cycle. 2016, 15, 1830–43. [Google Scholar] [CrossRef] [PubMed]
- Tomari, H.; Honjo, K.; Kunitake, K.; Aramaki, N.; Kuhara, S.; Hidaka, N.; Nishimura, K.; Nagata, Y.; Horiuchi, T. Meiotic spindle size is a strong indicator of human oocyte quality. Reprod Med Biol. 2018, 17, 268–274. [Google Scholar] [CrossRef] [PubMed]
- Wasielak-Politowska, M.; Kordowitzki, P. Chromosome Segregation in the Oocyte: What Goes Wrong during Aging. Int J Mol Sci. 2022, 23, 2880. [Google Scholar] [CrossRef] [PubMed]
Figure 1.
Representative fluorescent images of microtubule organization centers (MTOCs) (white arrowheads) localisation in MII oocytes following double immunostaining with γ- (red) and α- (green) tubulin antibodies. (A-B) Class I MTOCs clustered at the two poles of the bipolar spindle. (C-D) Class II MTOCs dispersed along the spindle fibers. (E-F) Class III MTOCs scattered throughout the cytoplasm. Chromosomes are counterstained with DAPI (cyan). Bars: 10 µm (A-D) and 30 µm (E-F)..
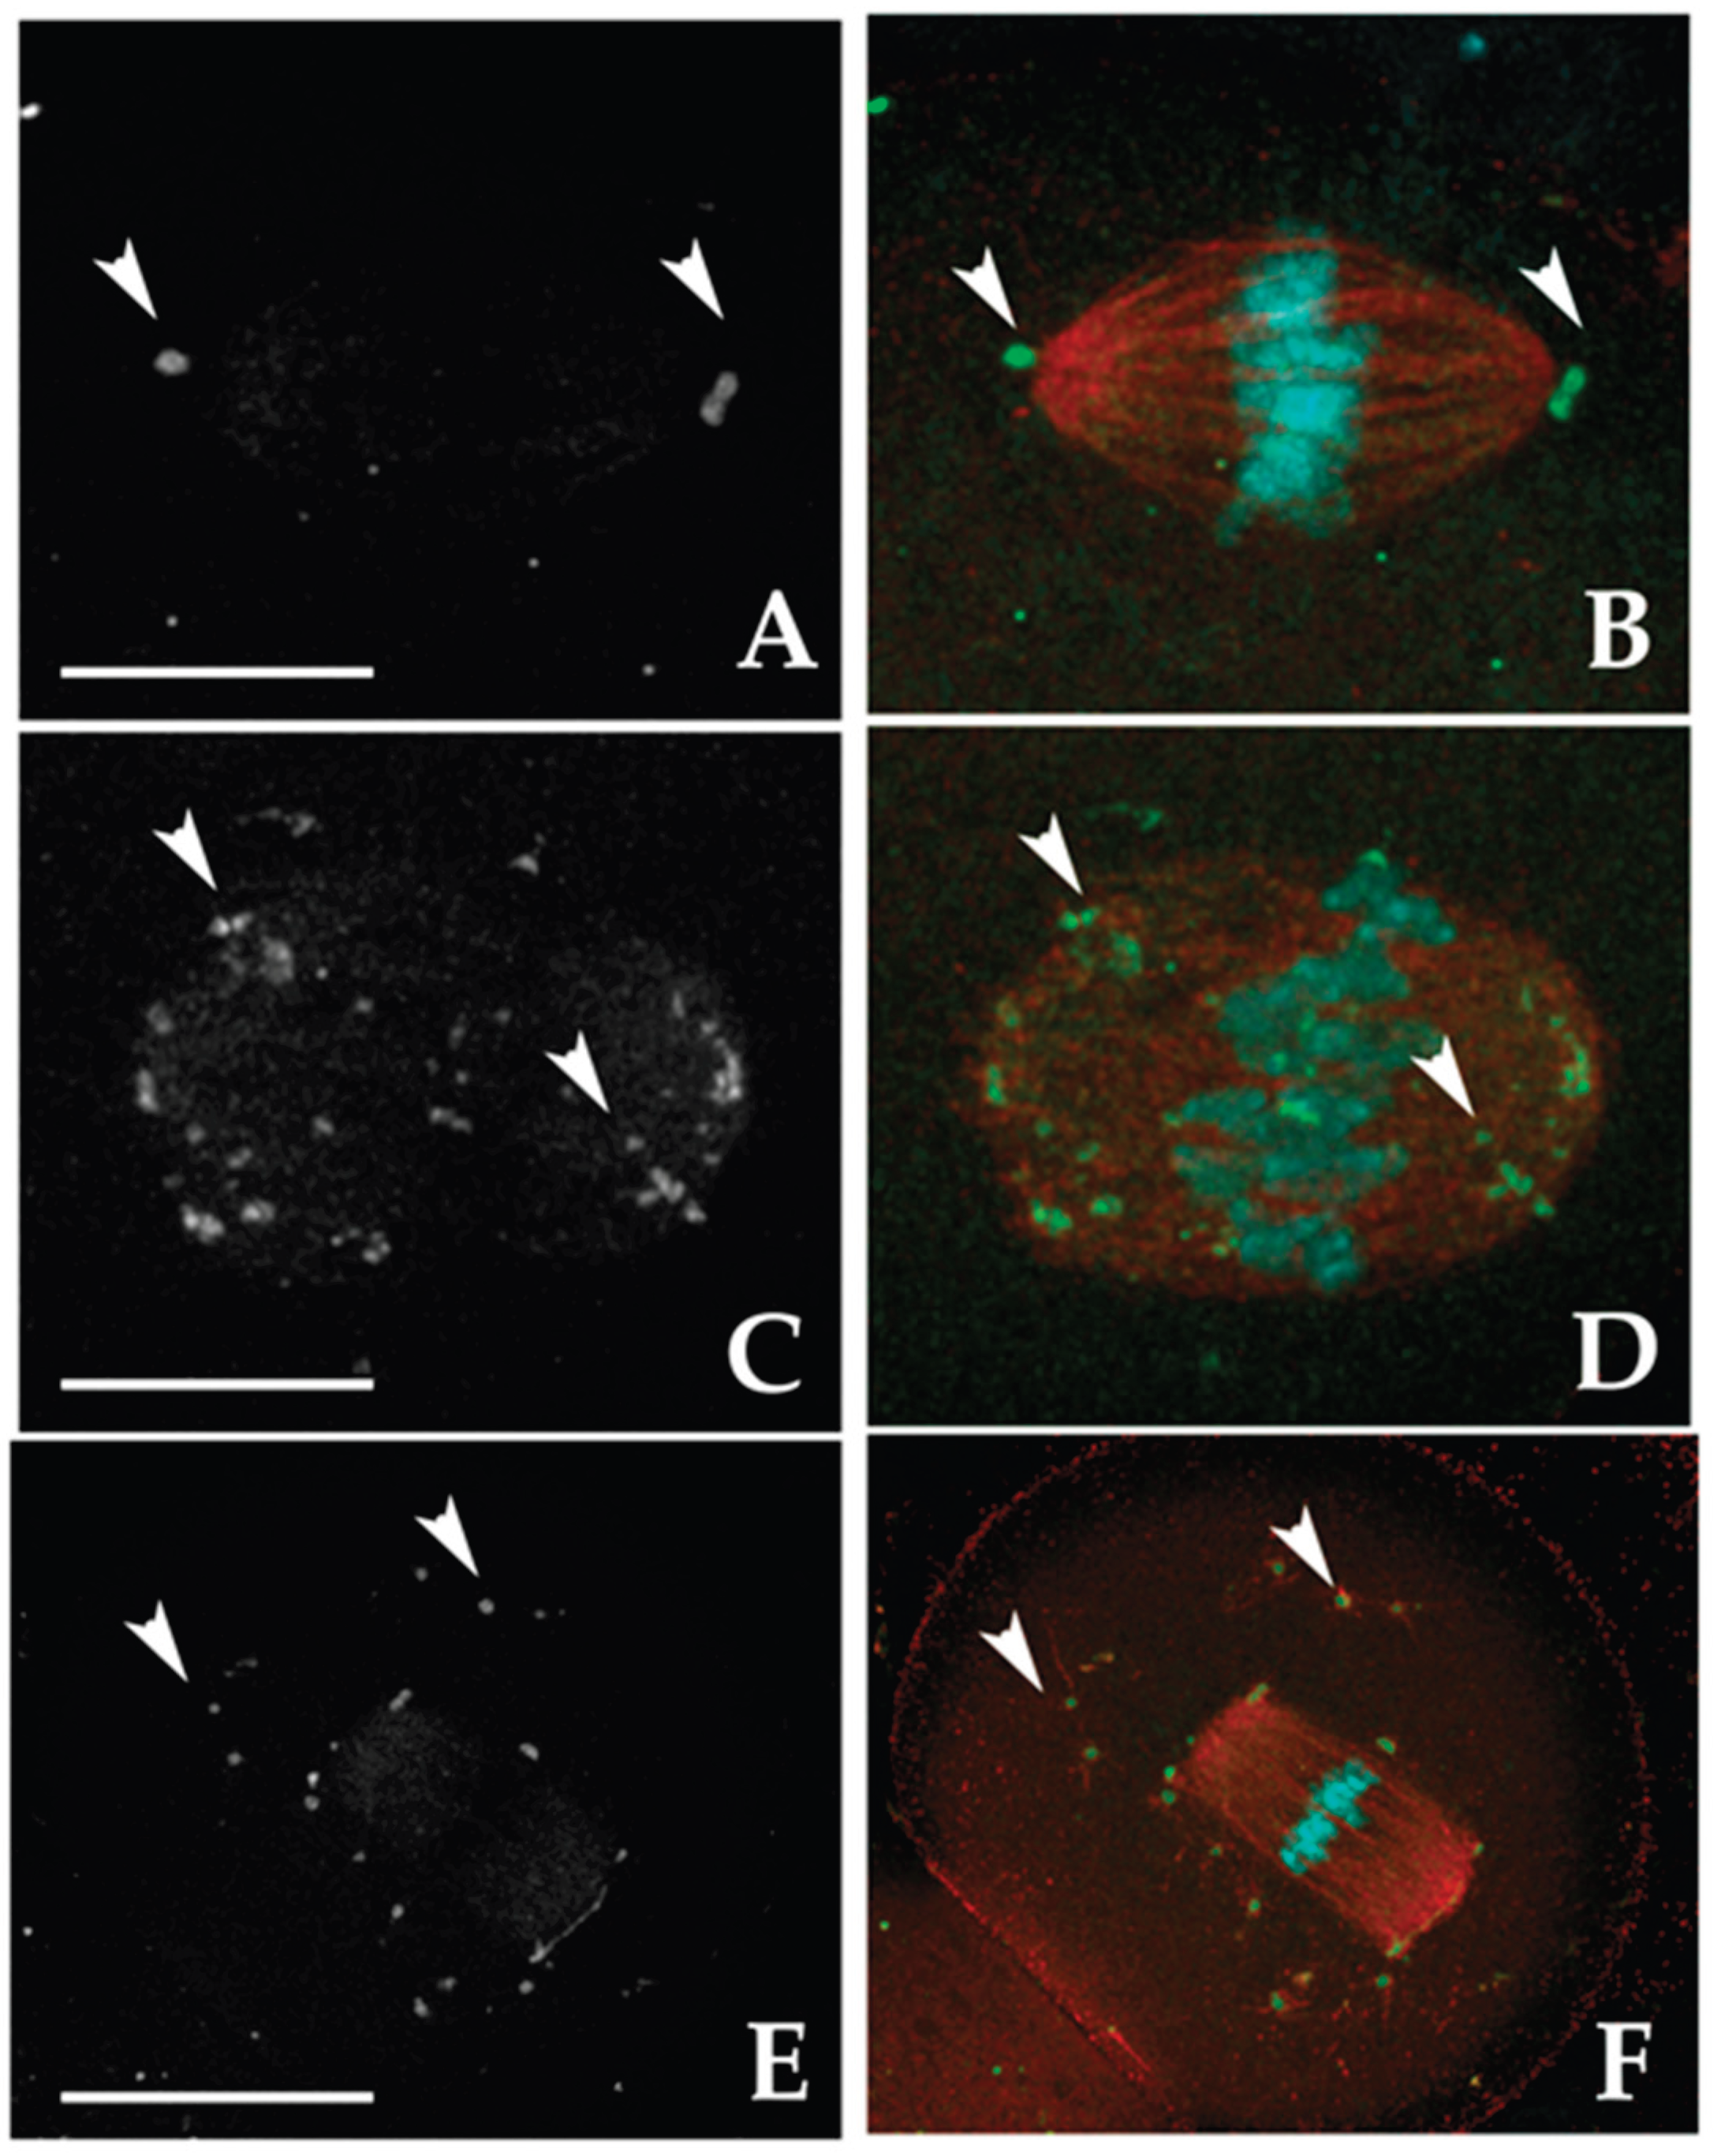
Figure 2.
Meiotic spindle morphology. Representative fluorescent images of MI spindles with barrel- (A) or rectangular-shape (B). The spindle fibers were labelled with α-tubulin (red) and chromosomes were counterstained with DAPI (cyan). Bars: 5 µm.
Figure 2.
Meiotic spindle morphology. Representative fluorescent images of MI spindles with barrel- (A) or rectangular-shape (B). The spindle fibers were labelled with α-tubulin (red) and chromosomes were counterstained with DAPI (cyan). Bars: 5 µm.
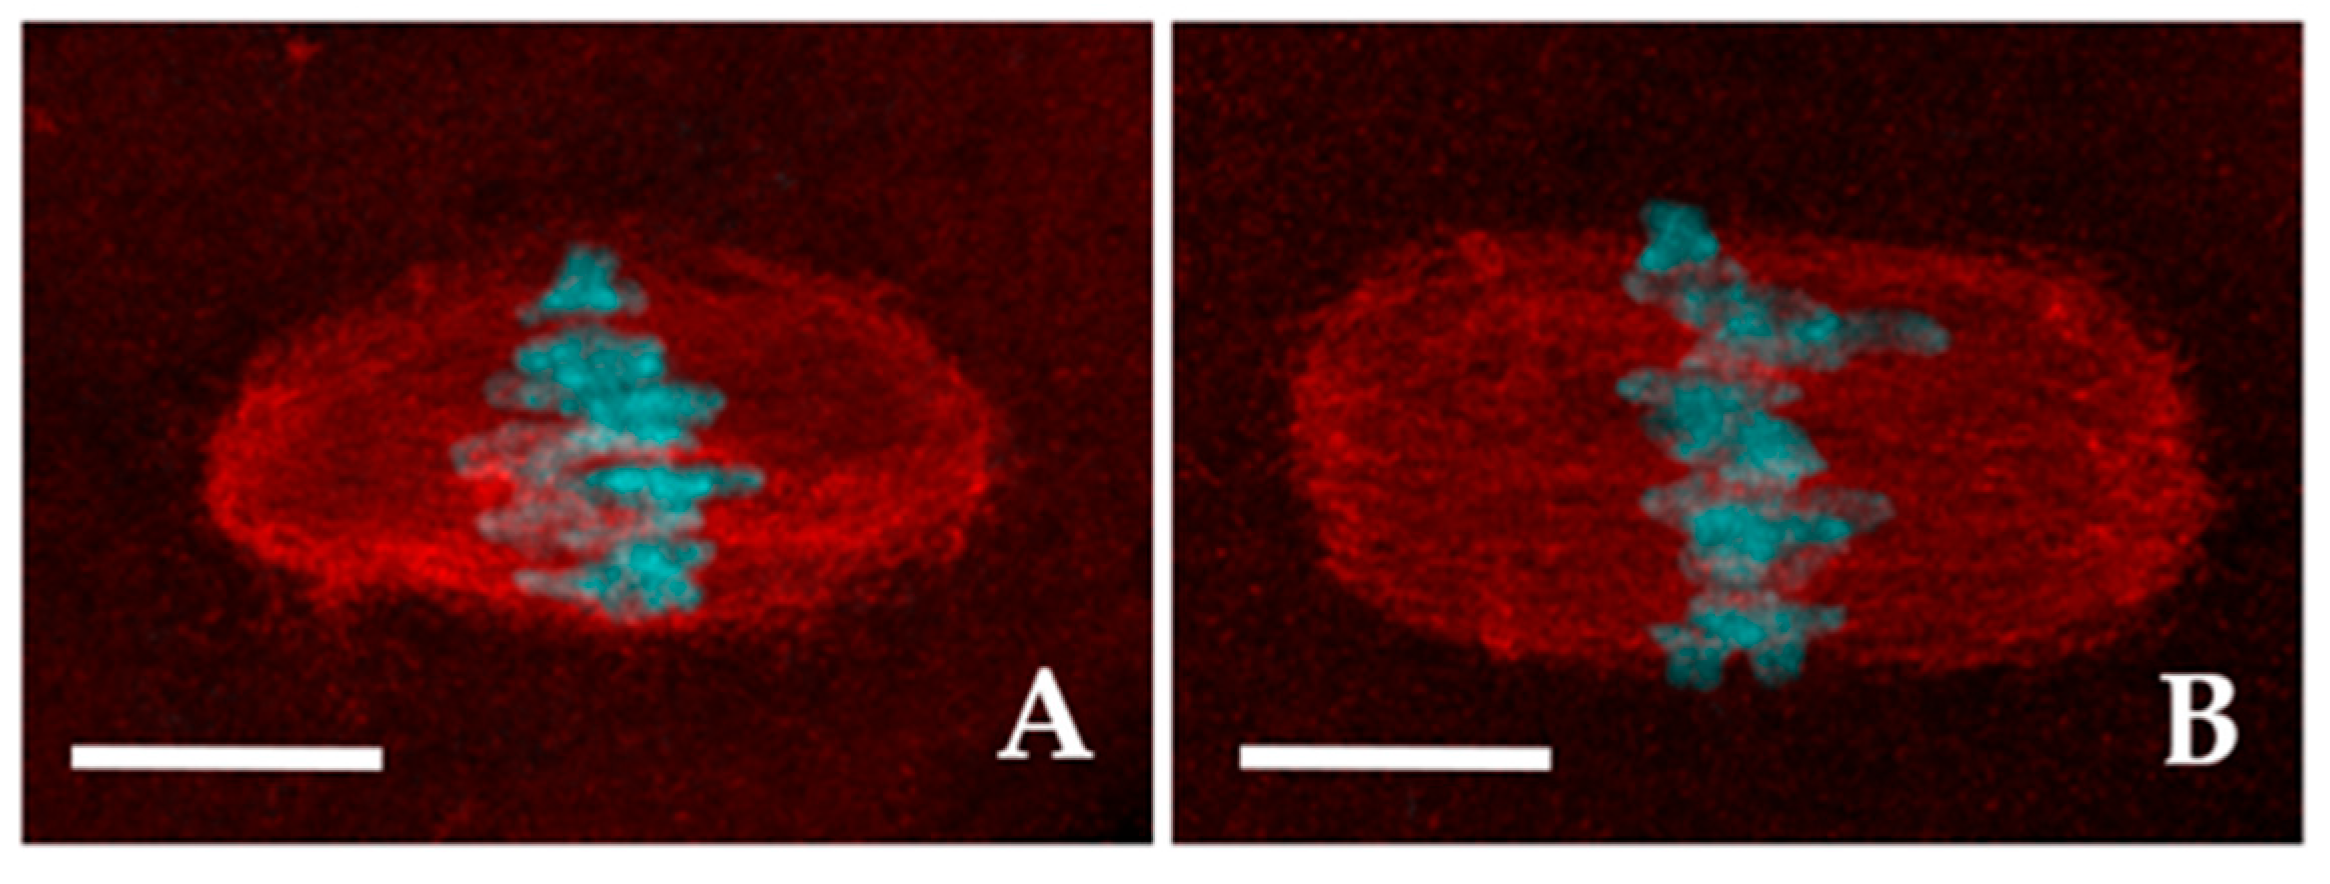
Figure 3.
Representative images of the cortical F-actin cap in MI or MII oocytes from control (CTR) (A) and 5.00 µM 2-OHE2-exposed (B) groups. α is the angle of the circular sector defined by the two white lines extending from the oocyte centroid to the endpoints of the F-actin cap arc. Points "p" and "d" represent opposite ends of a dotted line (yellow) drawn through the oocyte’s centroid, intersecting the MI (A) or MII (B) plate. Bar: 25 µm. Plots showing the F-actin cap angle (α, dotted white lines) extension in MI (C) and MII (D) oocytes. Red lines indicate median values. * p < 0.05 (E) Histograms showing the relative fluorescence intensity of the F-actin cap in MI and MII oocytes, expressed as the p/d ratio (intensity at point “p” divided by that at point “d”) * p < 0.05.
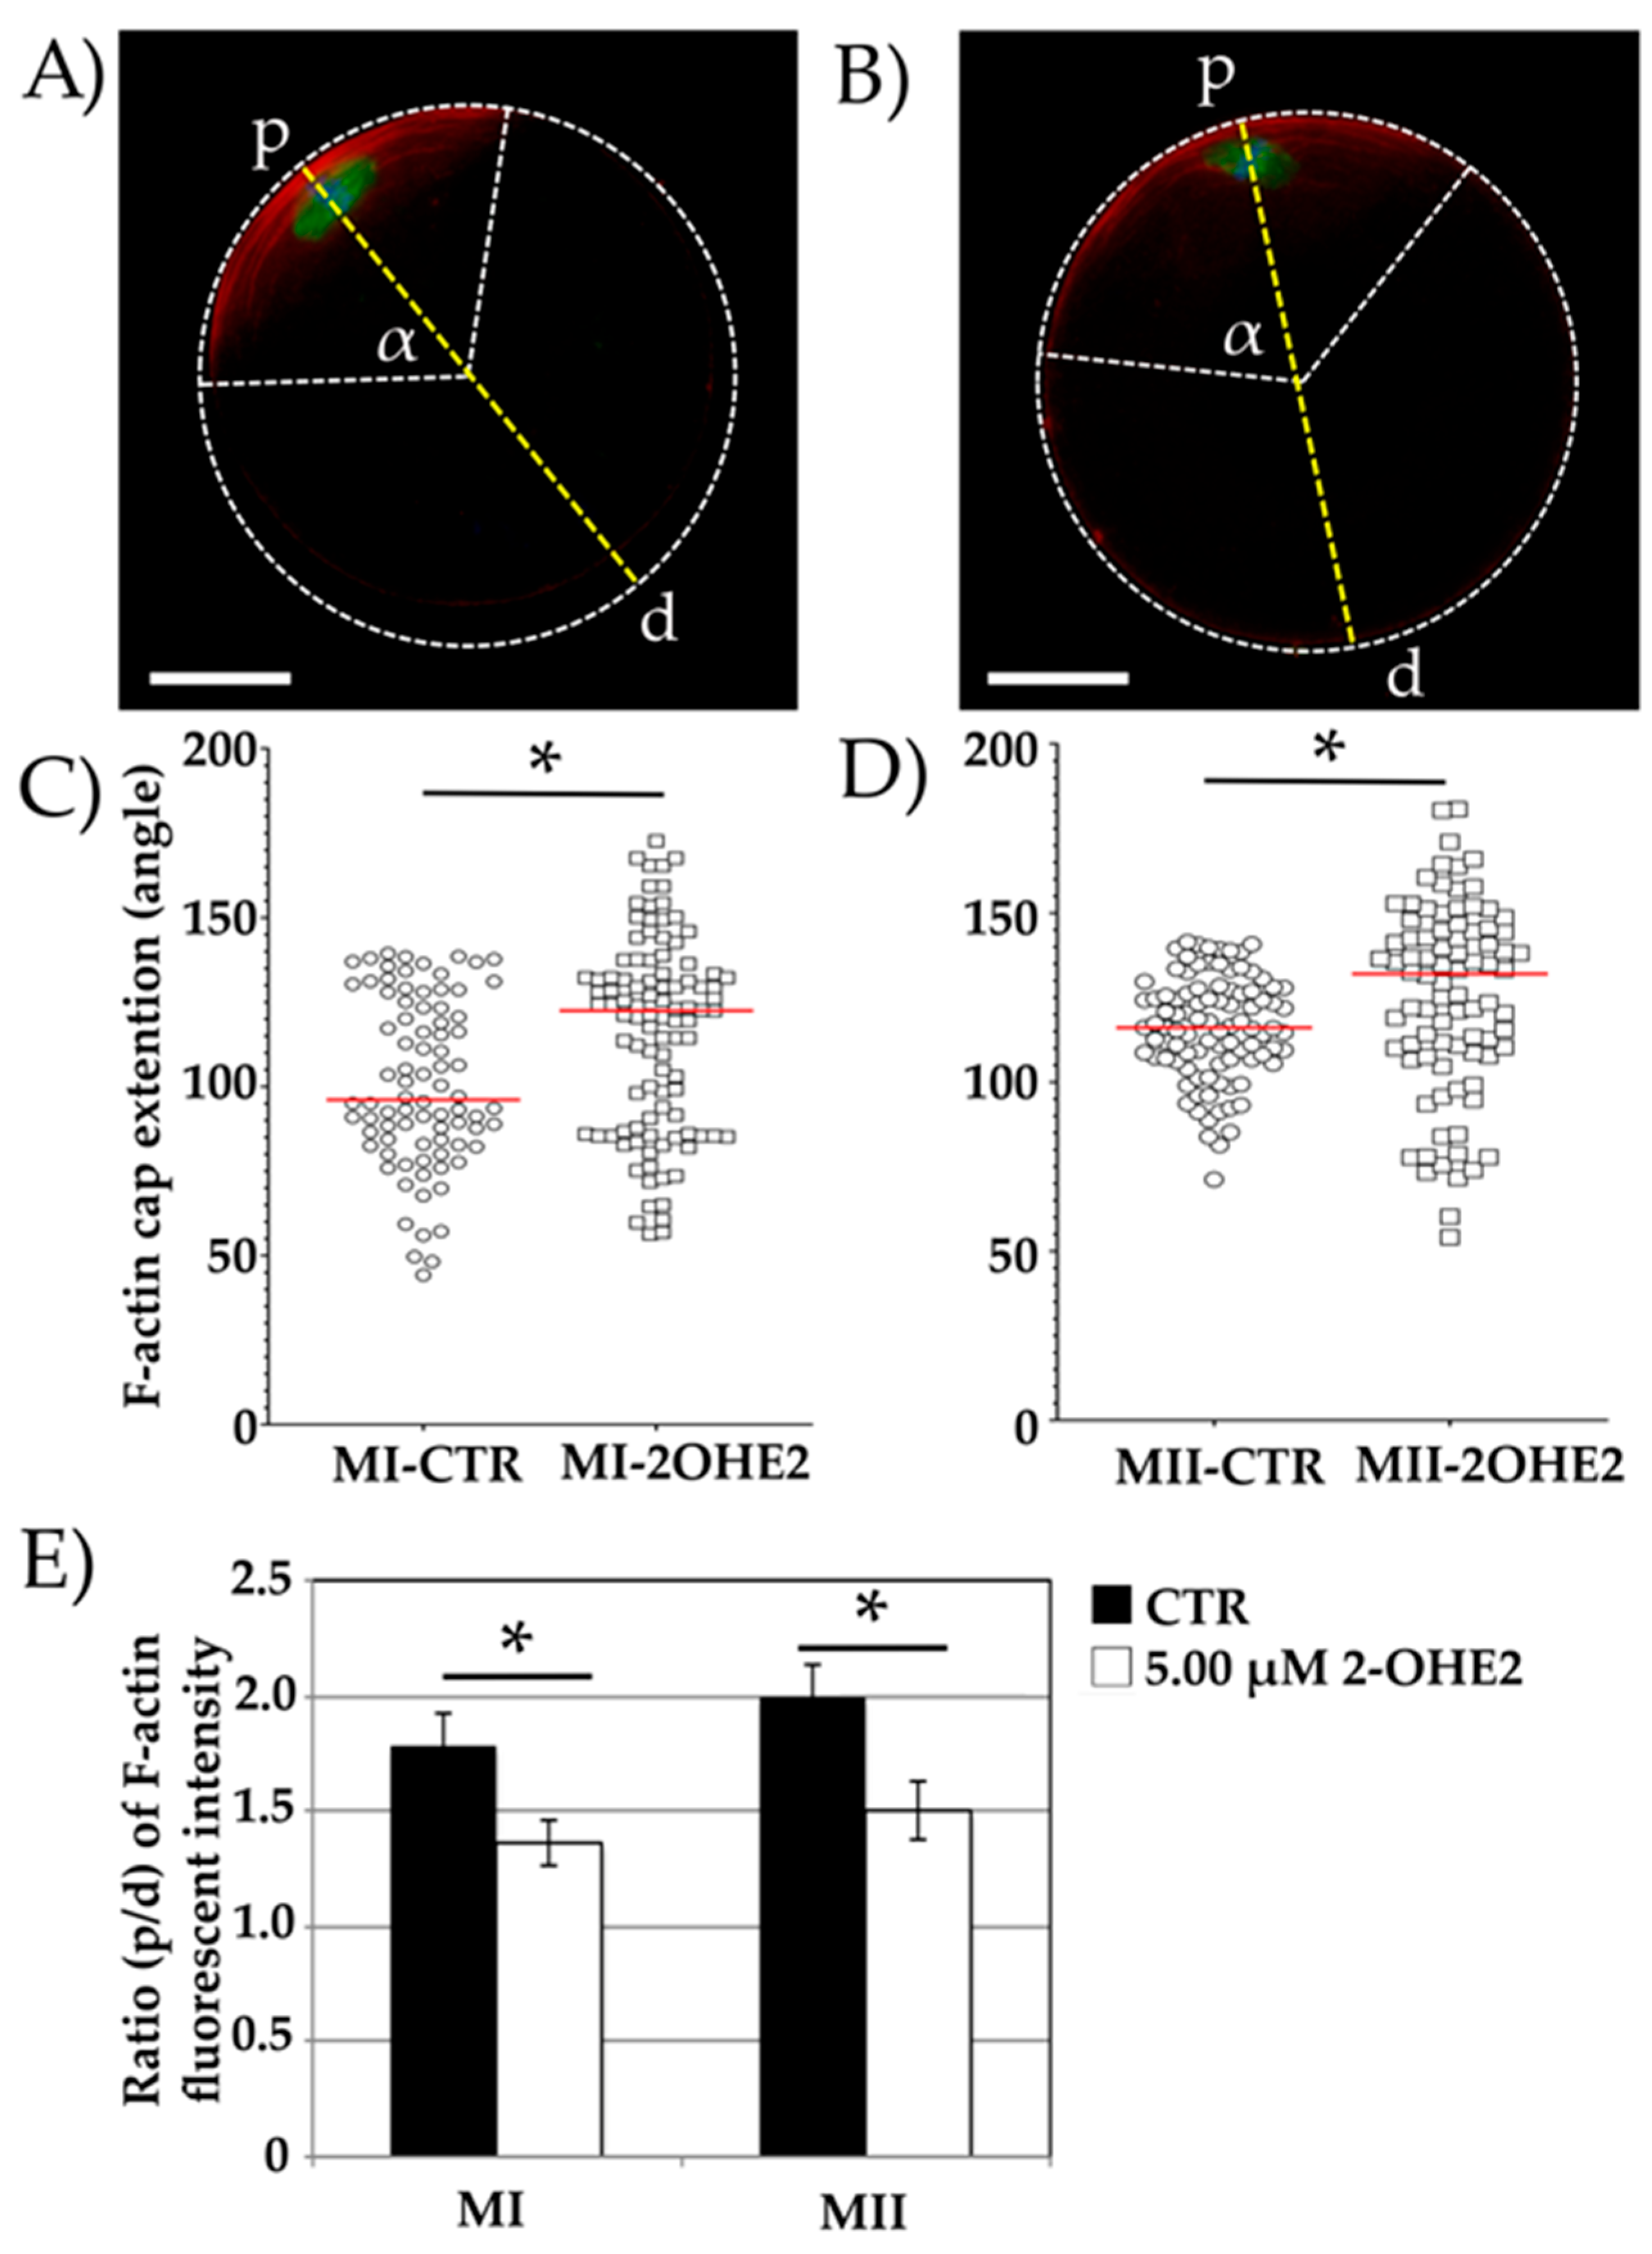
Figure 4.
A) Plot distribution of PB-I volume of control (CTR) and 2-OHE2-exposed oocytes including (CTR or 5.00 µM) or excluding (CTR or 5.00 µM w/o 2-cell like). Red bar represents the median value. * p ≤ 0.001. Examples of MII oocyte with a PB-I derived after an asymmetric (B) or symmetric, 2-cell-like configuration, division (C); bar: 30 µm.
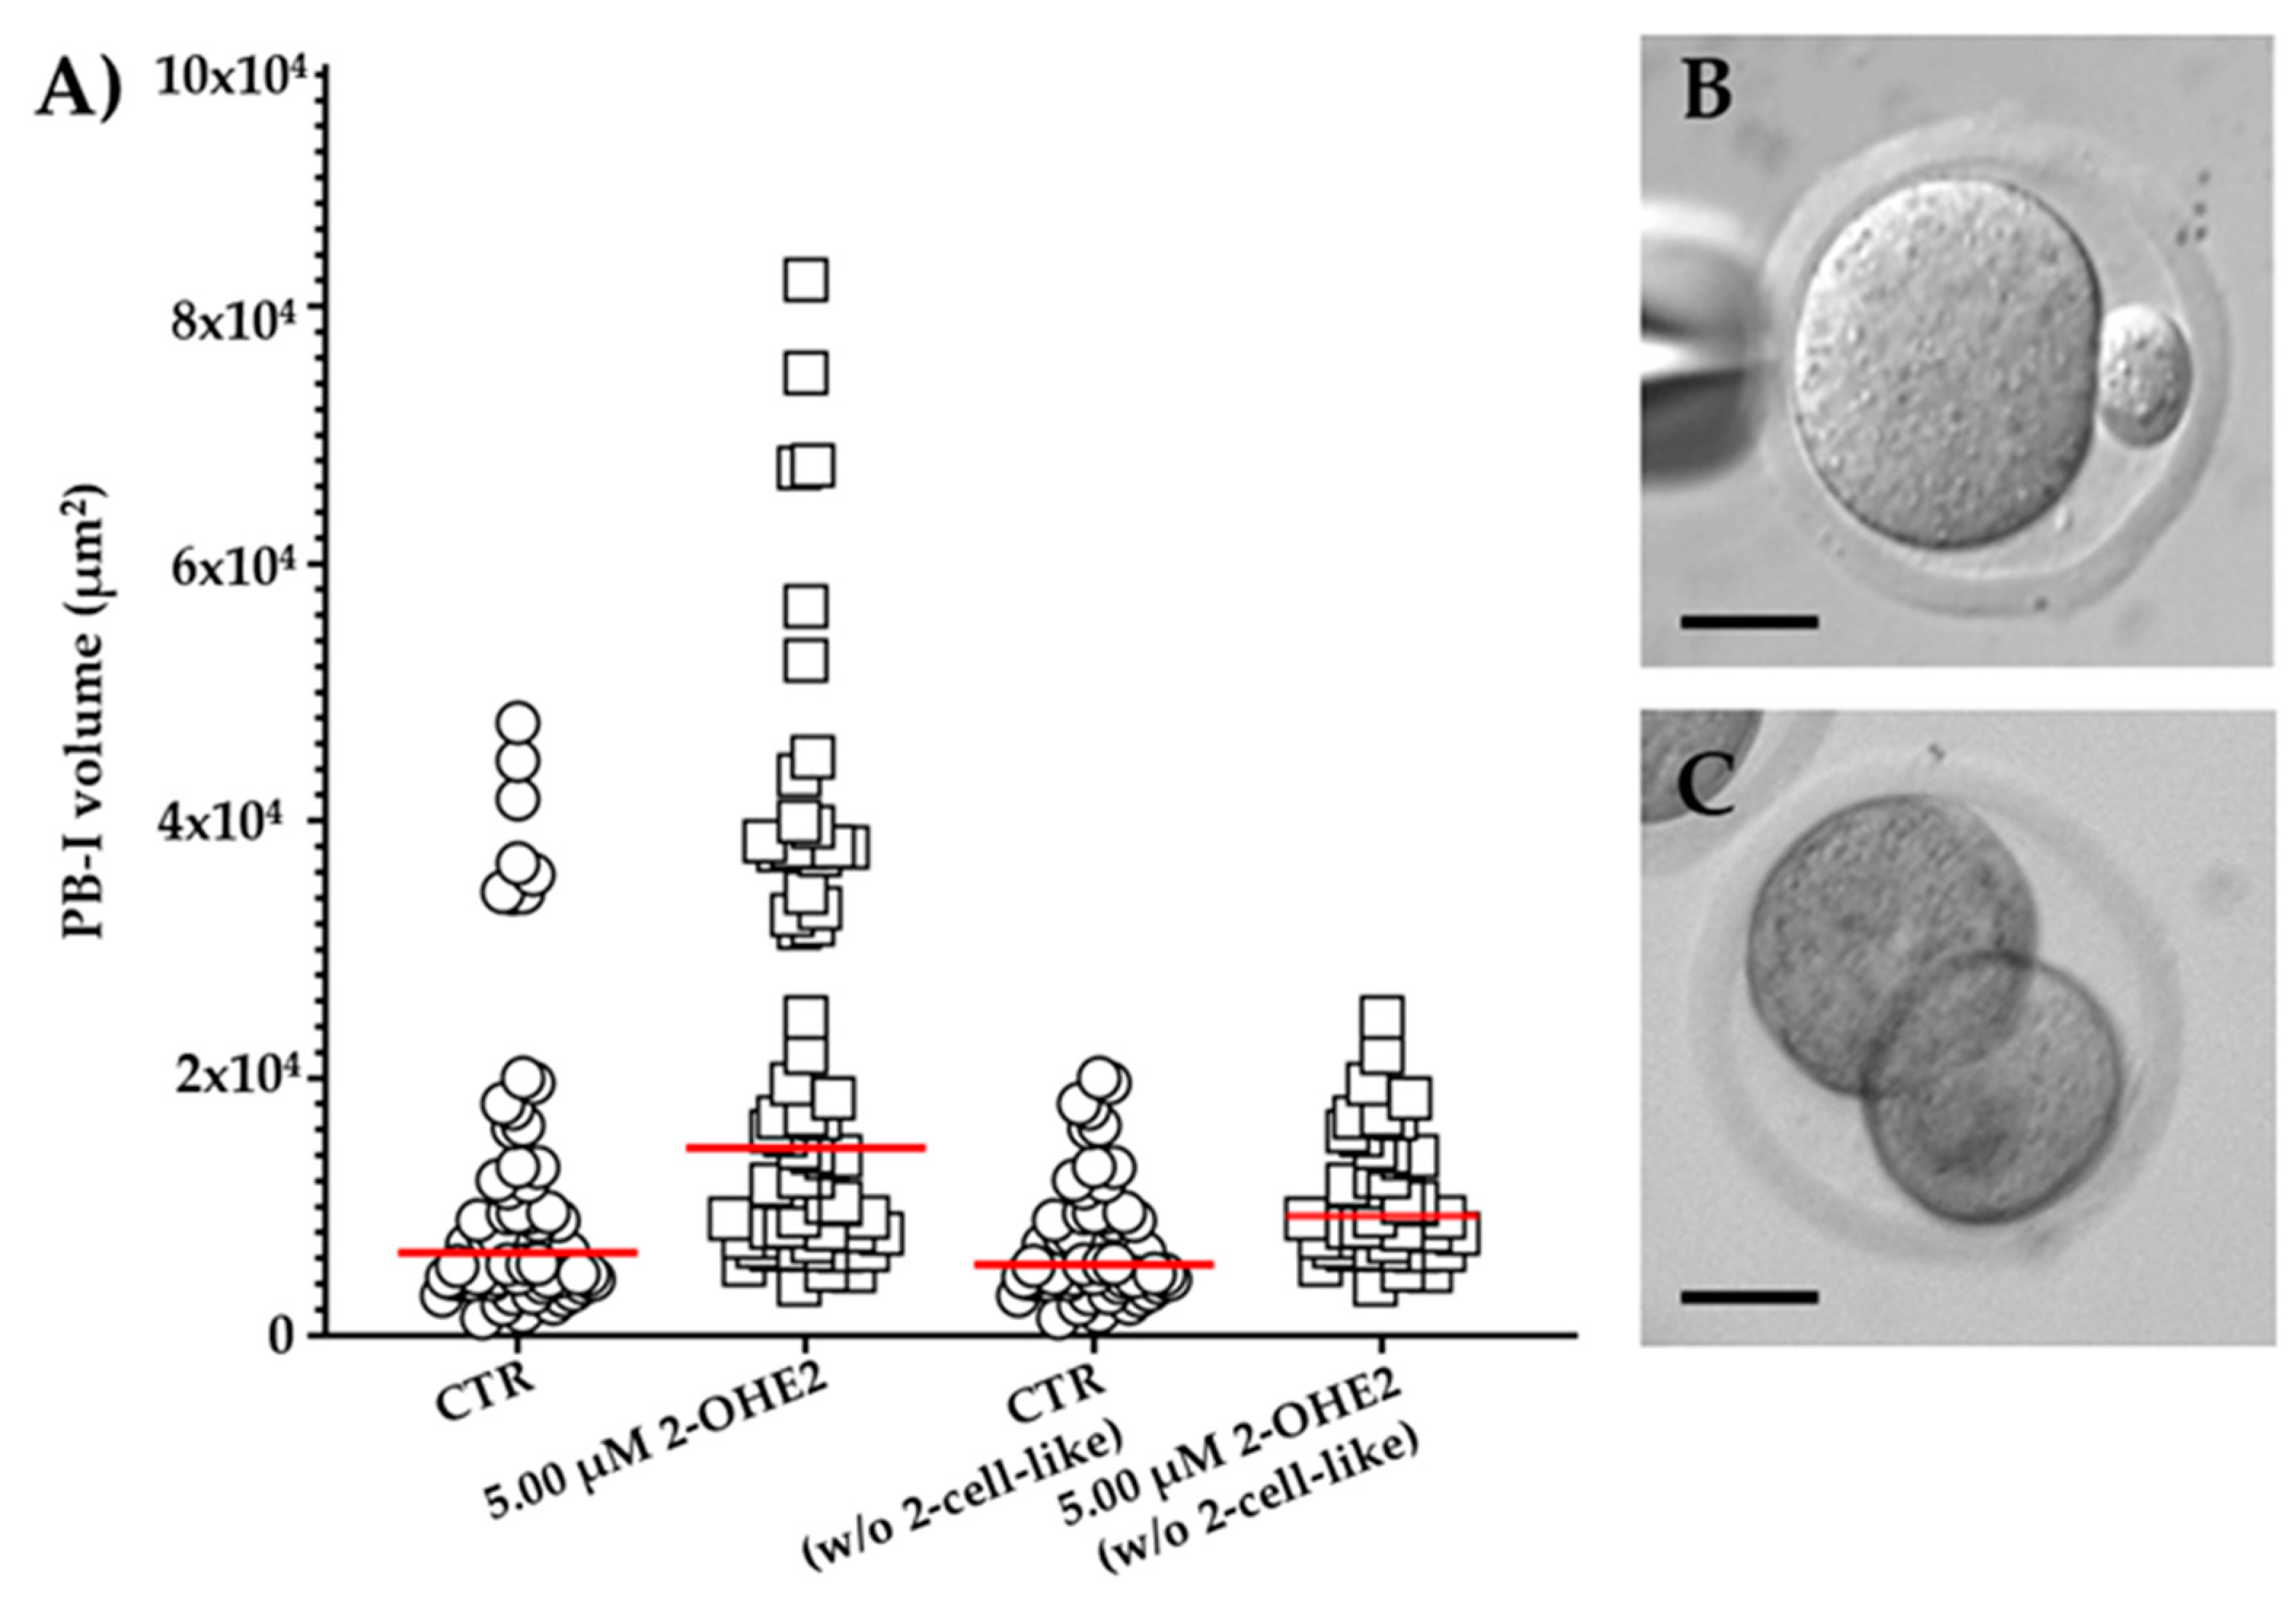
Figure 5.
Cytoplasmic movements velocity (CMV) profiles of control (CTR) and 2-OHE2-exposed oocytes recorded over a 15-hour period during the GV-to-MII transition. GVBD (germinal vesicle breakdown), MI (metaphase I), PB-I (polar body I), and MII (metaphase II). * p < 0.05.
Figure 5.
Cytoplasmic movements velocity (CMV) profiles of control (CTR) and 2-OHE2-exposed oocytes recorded over a 15-hour period during the GV-to-MII transition. GVBD (germinal vesicle breakdown), MI (metaphase I), PB-I (polar body I), and MII (metaphase II). * p < 0.05.
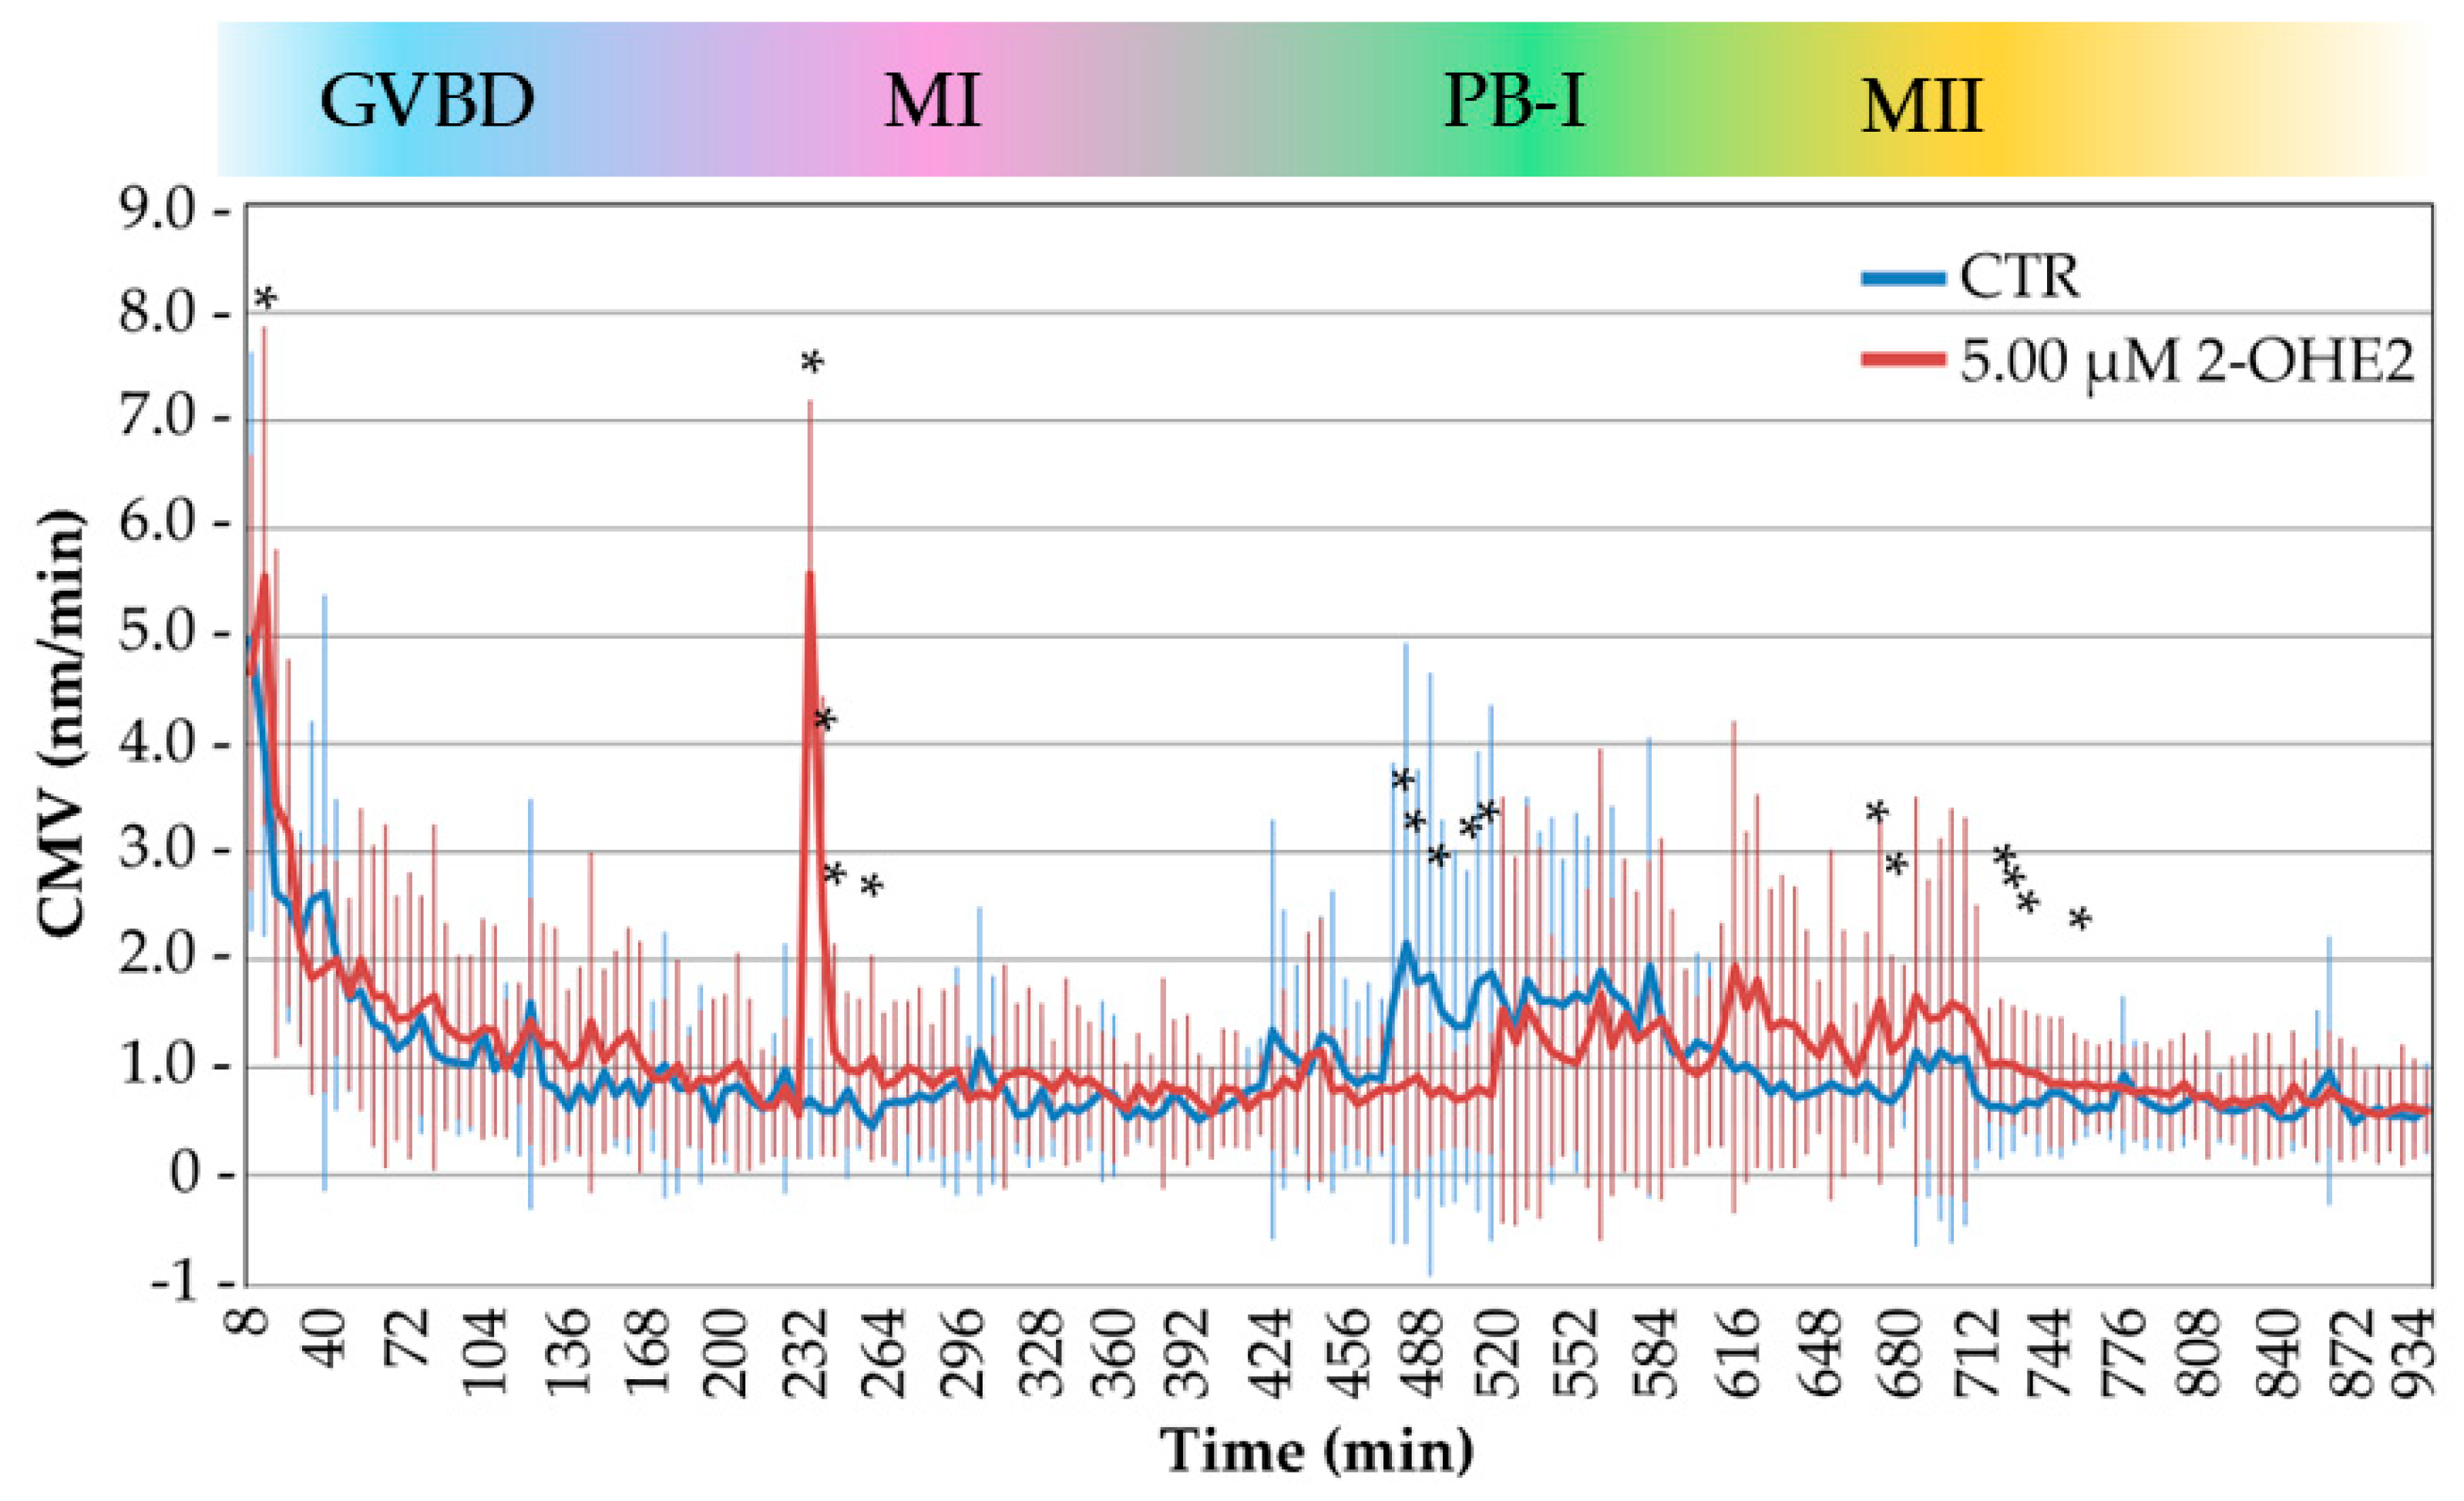

Table 1.
Rate of fully grown antral oocytes progression into Metaphase II (MII) when cultured in the absence (CTR) or presence of 2-OHE2. GV, Germinal Vesicle; GVBD, Germinal Vesicle Breakdown; SEM, Standard Error of the Mean; * p < 0.01; ** p < 0.001.
Table 1.
Rate of fully grown antral oocytes progression into Metaphase II (MII) when cultured in the absence (CTR) or presence of 2-OHE2. GV, Germinal Vesicle; GVBD, Germinal Vesicle Breakdown; SEM, Standard Error of the Mean; * p < 0.01; ** p < 0.001.
| Treatment | Stages of oocyte maturation % ± SEM (number) |
||||
|---|---|---|---|---|---|
| GV | Blocked at GV or GVBD |
Fragmented or pyknotic |
MII | ||
| CTR | 100 (416) |
6.13 ± 0.67 (25) |
1.46 ± 0.51 (6) |
92.41 ± 0.61 (385) |
|
| 2-OHE2 (µM) | 0.05 | 100 (155) |
5.58 ± 1.61 (10) |
1.46 ± 0.60 (3) |
92.98 ± 1.04 (166) |
| 0.50 | 100 (315) |
8.34 ± 0.65 (13) |
4.64 ± 0.79 (7)* |
87.04 ± 0.79 (135)** |
|
| 5.00 | 100 (330) |
11.14 ± 1.42 (39)* |
10.70 ± 0.96 (33)** |
78.16 ± 1.40 (258)** |
|
The presence of 2-OHE2 in the culture medium at concentrations of 0.50 and 5.00 µM significantly reduced the frequency of antral oocytes capable of completing meiosis and reaching the MII stage, suggesting an impact of both concentrations on the correct progression of the first meiotic division.
Table 2.
Rate of in vitro preimplantation embryonic development of Metaphase II (MII) oocytes derived from cumulus oocyte complexes previously matured in the absence or presence of 2-OHE2. SEM, Standard Error of the Mean; * p < 0.001.
Table 2.
Rate of in vitro preimplantation embryonic development of Metaphase II (MII) oocytes derived from cumulus oocyte complexes previously matured in the absence or presence of 2-OHE2. SEM, Standard Error of the Mean; * p < 0.001.
| Treatment | Stages of preimplantation development % ± SEM (number) |
||||
|---|---|---|---|---|---|
| Inseminated MII | 2-cell | 4-cell** | Blastocyst** | ||
| 0.01% DMSO | 100 (223) |
61.71 ± 3.86 (130) |
53.82 ± 6.02 (69) |
31.41 ± 1.60 (41) |
|
| 2-OHE2 (µM) | 0.05 | 100 (144) |
66.66 ± 3.18 (93) |
53.96 ± 2.72 (50) |
36.62 ± 2.08 (33) |
| 0.50 | 100 (133) |
64.72 ± 4.76 (83) |
45.50 ± 7.21 (36) |
28.88 ± 2.06 (24) |
|
| 5.00 | 100 (118) |
36.64 ± 2.83 (42) * |
38.58 ± 5.69 (15) |
5.00 ± 5.00 (2) * |
|
**The developmental rate was calculated based on the number of 2-cell embryos (set at 100%).
Table 3.
Frequency and geometrical features (mean ± SEM) of barrel- and rectangular-like spindles in control (CTR) or 2-OHE2-exposed MI or MII oocytes (5.00 µM). * p = 0.021; ** p ≤ 0.007.
Table 3.
Frequency and geometrical features (mean ± SEM) of barrel- and rectangular-like spindles in control (CTR) or 2-OHE2-exposed MI or MII oocytes (5.00 µM). * p = 0.021; ** p ≤ 0.007.
| Experimental condition | Spindle shape | ||||||||
| Barrel | Rectangular | ||||||||
| % (N) | Equatorial width | Pole width | Area µm2 ± SEM |
% (N) | Equatorial width | Pole width | Area µm2 ± SEM |
||
| MI | CTR | 72.7 (32) | 13.8 ± 0.9 | 7.0 ± 0.3 | 363.2 ± 15.5 | 27.3 (12) | 11.6 ± 0.9 | 6.6 ± 0.5 | 283.7 ± 13.2 |
| 2-OHE2 | 56.4 (22) | 14.9 ± 0.9 | 8.4 ± 0.5* | 423.2 ± 38.8 | 43.6 (17) | 14.7 ± 1.2 | 11.2 ± 0.7** | 398.8 ± 31.6** | |
| MII | CTR | 61.7 (21) | 11.1 ± 0.3 | 4.5 ± 0.2 | 143.0 ± 4.4 | 38.3 (13) | 11.0 ± 0.2 | 6.0 ± 0.3 | 144.2 ± 16.5 |
| 2-OHE2 | 55.8 (25) | 14.0 ± 0.5** | 4.8 ± 0.3 | 255.4 ± 15.9** | 44.2 (19) | 13.5 ± 0.7** | 7.8 ± 0.4** | 278.6 ± 45.7** | |
Disclaimer/Publisher’s Note: The statements, opinions and data contained in all publications are solely those of the individual author(s) and contributor(s) and not of MDPI and/or the editor(s). MDPI and/or the editor(s) disclaim responsibility for any injury to people or property resulting from any ideas, methods, instructions or products referred to in the content. |
© 2025 by the authors. Licensee MDPI, Basel, Switzerland. This article is an open access article distributed under the terms and conditions of the Creative Commons Attribution (CC BY) license (http://creativecommons.org/licenses/by/4.0/).
Copyright: This open access article is published under a Creative Commons CC BY 4.0 license, which permit the free download, distribution, and reuse, provided that the author and preprint are cited in any reuse.


