
Submitted:
20 October 2025
Posted:
21 October 2025
You are already at the latest version
Abstract
Grasslands occupy 24% of Earth’s surface and in most areas of the world are either destroyed, fragmented or converted into cultivated field. In Africa, their biodiversity is still insufficiently known. This study reports on the avian assemblages associated with grasslands in South African Highveld and Lesotho Drakensberg. Special attention was paid to the species richness, diversity, and population densities and dominance of particular species. Birds were counted by means of the Line Transect Method in three distinguished grassland types: Dry Cymbopogon-Themeda Grassland (transect length: 28 km), Wet Cymbopogo-Themeda Grassland (27 km) km, and Mountain Themeda-Festuca Grassland (31 km). In total, 86 bird species were recorded. While cumulative dominance was similar between the Dry and Wet Grassland (61-65%), these two were much different from that in the Mountain Grassland (46%). However the dominance index was similar in all three grassland types compared (0.25-0.33). Only one species, the Long-tailed Widow was a common dominant species for all three grassland types. African Stonechat, Wing-snapping Cisticola, Levaillant’s Cisticola and Yellow Bishp were dominant only in the Mountain Grassland; Northern Korhaan and the Clapper Lark - only in the Dry and Wet Grassland; Ostrich, Cloud Cisticola, African Quailfinch and Pied Starling – only in the Dry Grassland, while the Helmeted Guineafowl, Zitting and African Pipit – only in the Wet Grassland. Despite these obvious differences in dominance and population densities of species, Diversity and evenness indices were similar in all three grassland types. Shannon’s Diversity Index (H’) varied between 1.22 and 1.35; Simpson Diversity Index between 0.91 and 0.94, while Pielou’s dominance Index (J’) varied between 0.33 and 0.36. However, Sørensen Similarity Index between the three grassland types was low, ranging between 0.07 and 0.26. Proportions of ecological guilds were similar in the Dry and Wet Grassland, but differed from mountain Grassland. In comparison with other tropical grassland, avian communities in southern Africa are characterized by higher species richness and higher its variance between particular grassland types.
Keywords:
grasslands
; highveld
; Drakensberg
; community ecology
; population densities
; habitat conservation
1. Introduction
Grasslands are the largest of the four major vegetational formations on Earth and comprise 24% of its surface (Smith 1996). They occupy regions with precipitation raging between 250 and 750 per annum, more in the mountains. Primary production of grasslands is directly related to this precipitation and is heavily influenced by grazing by herbivore animals. Grasslands are dominated by grasses (Poaceae), while forbs and shrubs constitute an admixture.
Unfourtunately due to rich soil, most grasslands have been converted to arable grounds supporting cultivation of grain (grass) plants, such as the corn, wheat, and barley (Hoekstra et al. 2005). While in North America, most of the vast grasslands (prairie) have been almost totally converted to cultivated lands, in other parts of the world these may still present original state, although often overutilized as pasture for the livestock (Douglas et al. 2023).
In southern Africa, grasslands occupy Hihgveld, central part of the Republic of South Africa (Free State and the former Transvaal provinces) and Lesotho. at altitude ranging from 900 to 3459 m a.s.l. most of the rain comes in summer (wet season), i.e. October-March. The heaviest rainfall in in the mountains of the east, the lowest in the west, where the grasslands grads into semideserts of the Great Karoo. Once it was inhabited by multitude of bovid herbivores, replaced today in most places by the livestock.
Grasslands occupy two physiographic units in southern Africa: Highveld and Drakensberg. Two subunits are recognized in the Highveld: the Arid West, 900-1600 m a.s.l., rainfall: 450-600 mm per annum, covered with the Dry Cymbopogon-Themeda grassland, and Central Plateaus, 1500-2000 m a.s.l, 650-900 mm per annum, with the Wet Cymbopogon-Themeda grassland. The Drakensberg in the east form mountains covered with the Mountain Festuca-Themeda grassland, 1600-3459 m a.s.l., >900 mm per annum (Thomas & Grant 2004).
Grassland ecosystems are dependent on periodic disturbance for habitat maintenance. Grazing and fire are the major factors maintaining grassland areas (Vickery et al. 1999). Due to the loss (mainly to agriculture), degradation and fragmentation of grasslands in most parts of the world, birds living there are experiencing widespread population decline. In overall, grasslands are considered as one of the terrestrial biomes most vulnerable to biodiversity loss (Hoekstra et al., 2005, Azpiros et al. 2012, Habel et al. 2013, Vickery et al. 1999, Douglas et al. 2023).
The Highveld grasslands are poorly conserve today. Less than 1% of the Highveld grasslands are under protection (e.g. Golden Gate and Qwakwa National Parks, Willem Pretorius Game Reserve), while more than 7% of the Drakensberg (e.g. Sehlabathebe National Park) grassland is protected (Thomas & Grant 2004). There is an urgent need to develop a net of protected areas throughout the Highveld and Drakensberg, as these areas are seriously threatened by conversion into cultivated field and intensively used (often overgrazed) pastures.
For a few reasons, birds are good indicators of grassland condition (Browder et al. 2002; Maphisa et al. 2016, 2017). Some bird species are strictly associated with particular grass type (e.g. Cisticola cisticolas and Mirafra larks). Many bird species (e.g. Ploceus weavers, Passer sparrows and Streptopelia doves) may breed across a broad gradient of man-modified grassland, from pristine grasslands through pastures and to totally transformed grasslands into cultivated fields or urbanized habitats. Most bird species live only a few years, so changes in species composition and abundance will be reflected relatively quickly after a disturbance in grassland.
Birds associated with the grassland biome in South Africa and Lesotho were subject of some studies aiming to determine their status and abundance. A thorough annotated checklist of birds in Bloemfontein area, with details on the population density of some bird species has been published by Kopij (2019) and further supplemented by De Swardt (2017). A similar checklist has been prepared for the northern part of the Dewetsdorp district in SE Free State province, where the Dry Cymbopogon-Themeda grasslands predominate (Kopij 2001). Regional checklist of species with some data on population densities were published for the mountainous north-eastern part of the Free State, i.e. Golden Gate Highland National Park (Earle & Lawson 1988), Qwakwa National Park (De Swardt & van Niekerk 1996), Willem Pretorius Game Reserve (Kopij 1997a), Wolluterskop Nature Reserve (Kopij 1999), Bethlehem Highlands (Kopij 2002b), and Wet C-T grassland near Van Reenen on the Free State/ KwaZulu-Natal border (Maphisa et al. 2016, 2017). Also population studies on all diurnal birds of were conducted in the Rooiberge, eastern Free State (Kopij 1996).
In Lesotho, data on the population densities of some grassland birds associated with grasslands were published for the Semonkong area (Kopij2014), Sehlabathebe NP (Kopij 2002a) and Thabana Ntlenyana area in the Alpine grasslands (Kopij 2010). A comparative study on the species diversity, population structure and population densities of birds has been conducted in Lesotho highlands, where bird community in the Alpine grassland was compared with that in the Mountain grasslands (Kopij 2015a, 2015b). So far, this is the only study dealing comprehensively on the species diversity, population structure and population densities of birds associated with grasslands in southern Africa.
The purpose of this study was to investigate the species richness, biodiversity and population densities of birds associated with the three major types of southern African grasslands. These information are of vital importance for conservation biology and may motivate establishing various conservation areas in the Highveld and Drakensberg.
2. Materials and Methods
2.1. Study Area
Studies were conducted in three sites in suthern Africa:
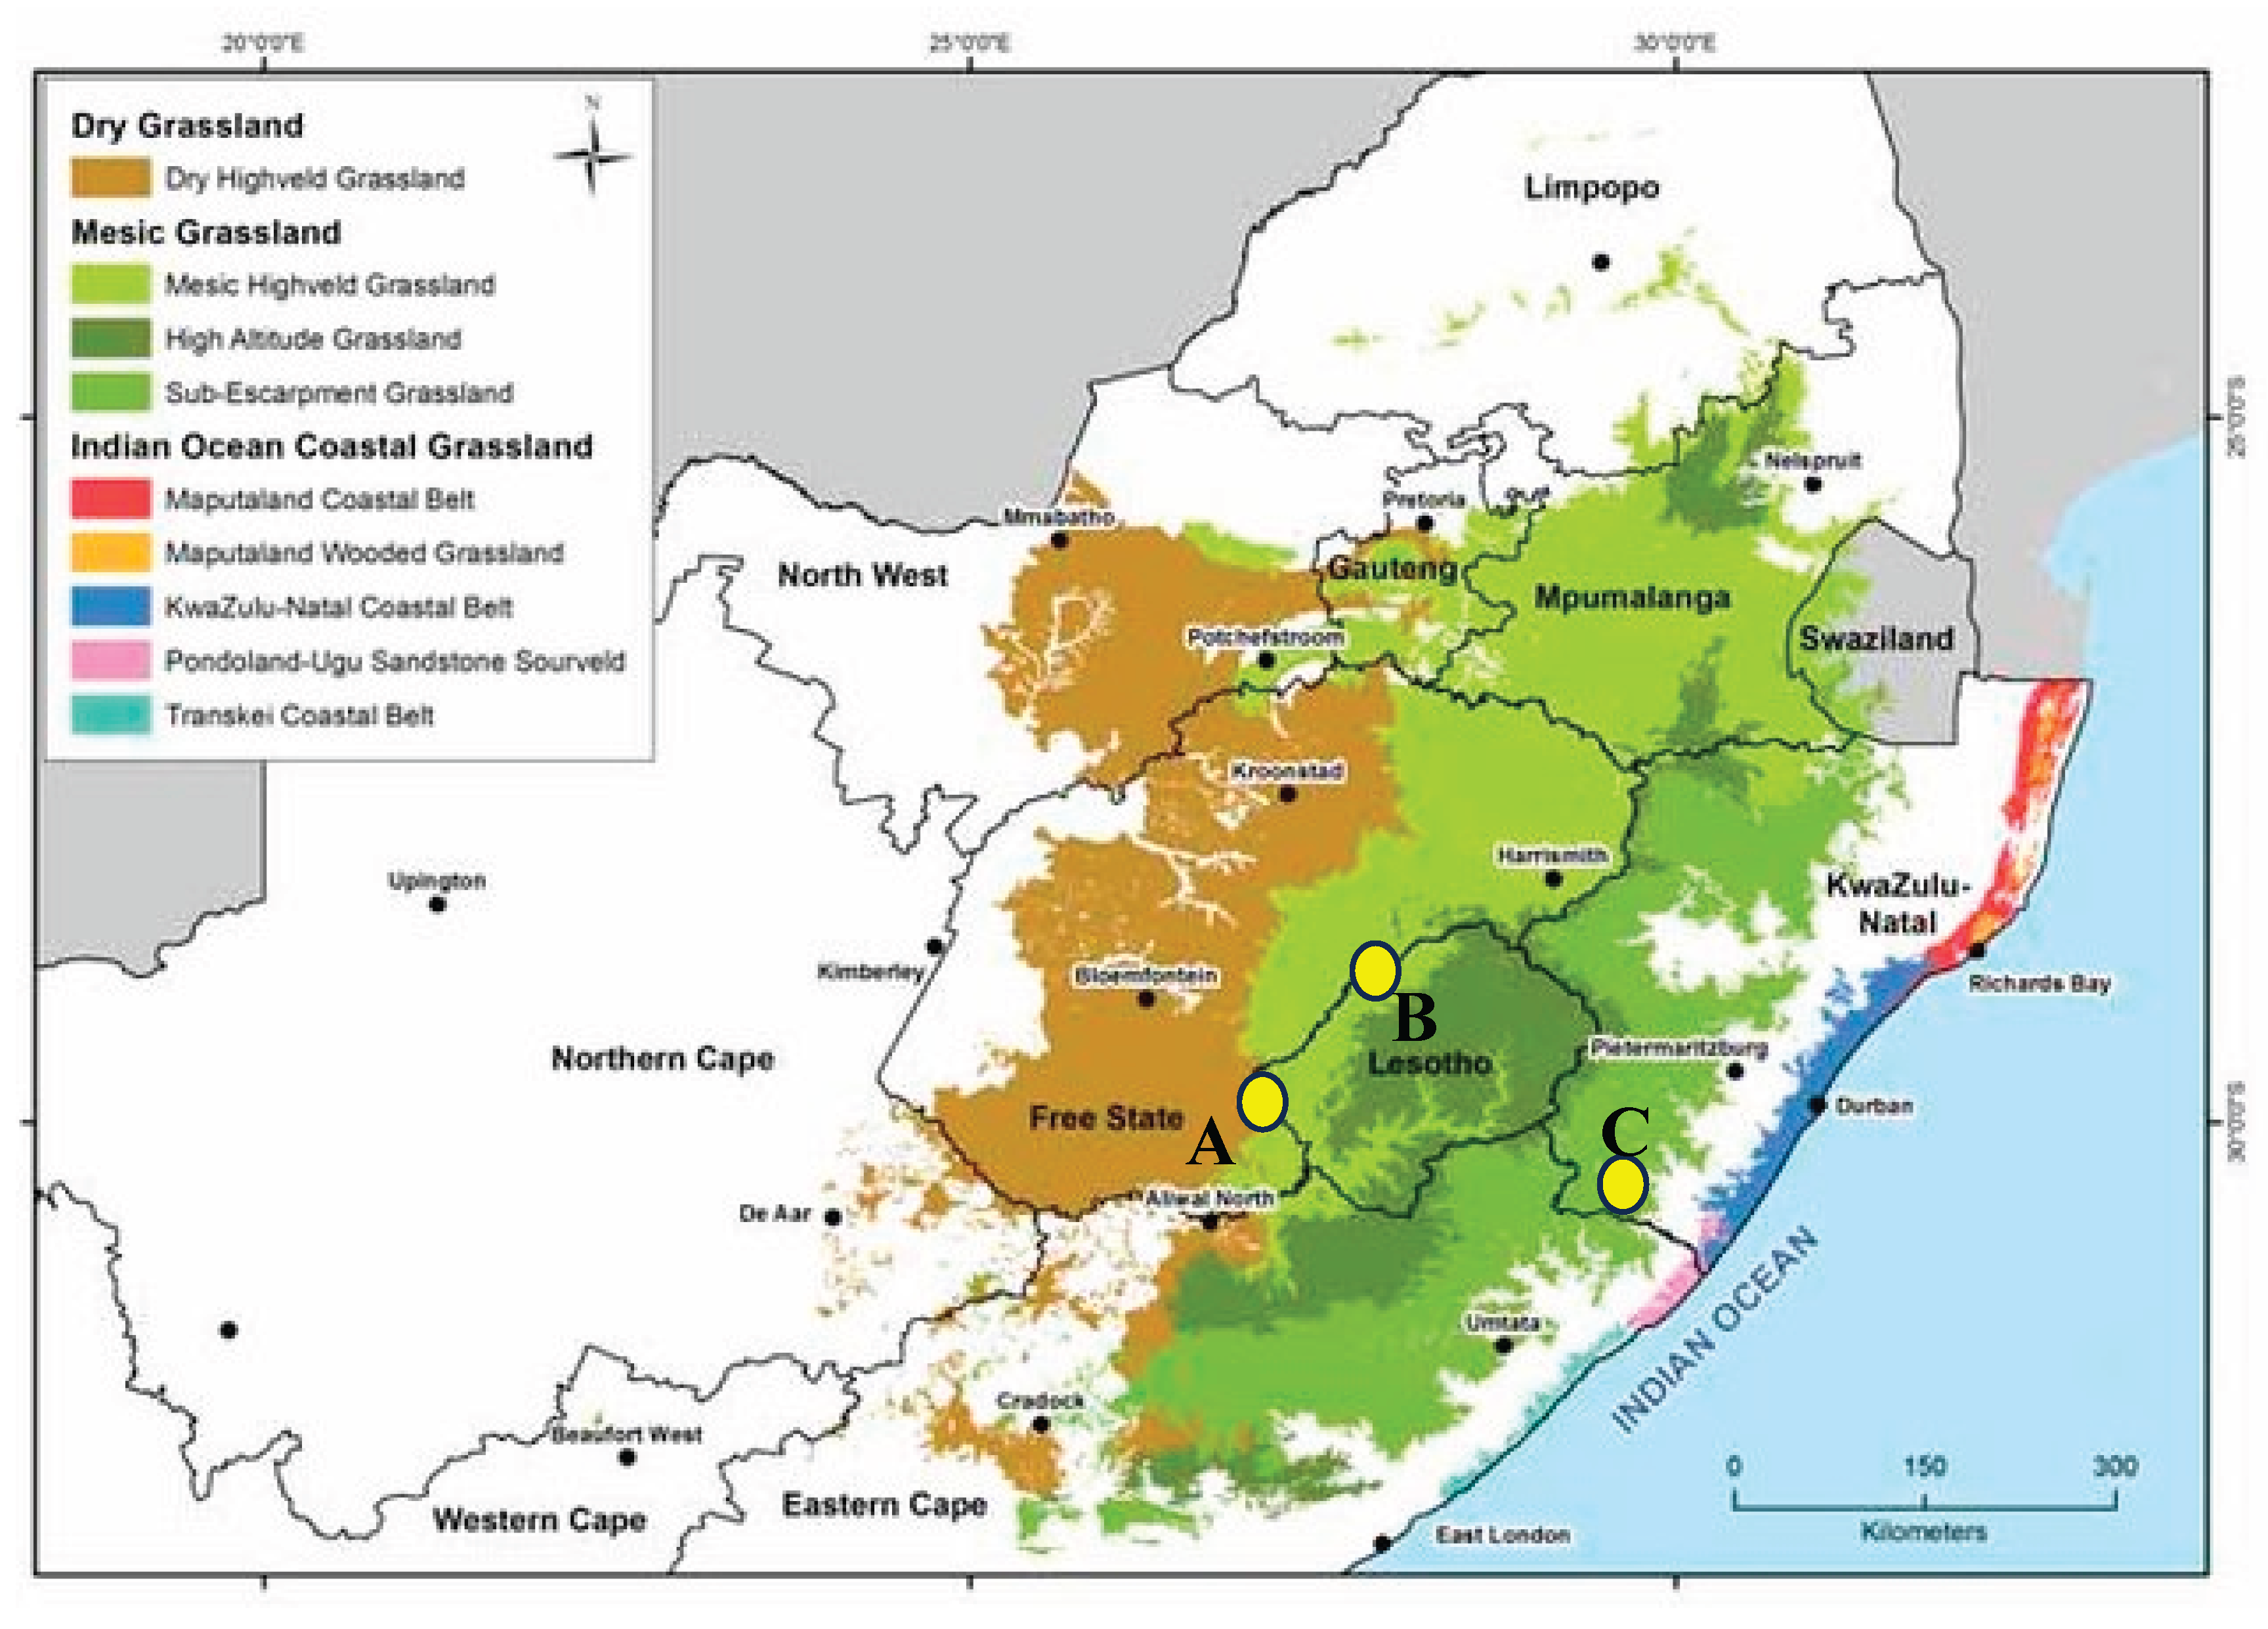
1. Dry Cymbopogon-Themeda Grassland (sweetveld) in the northern part of the Dewetsdorp District, Free State, South Africa (c. 1000 km2); c. 1500 m a.s.l; total transect length: 28 km. Semiarid climate with a mean annual precipitation of 340 mm. Dominant grass species: Red Grass Themeda triandra and Terpentine Grass Cymbopogon plurinoides. Date and time of counting: 14.12.1993 and 19.01.1994, erroded grassy plain with a sparse karroid vegetation in the upper stretch of the Modder River valley, 13 km; 28.11.1993 and 12.01.1994, grassy plain with sparse Acacia karroo thorns in the middle stretch of the Modder River valley, 15 km
2. Wet Cymbopogon-Themeda Grassland in Willem Pretorius Game Reserve (12,000 ha), Free Satte, South Africa. Semiarid climate with a mean annual precipitation of 390 mm. Dominant grass species: Red Grass and Terpentine Grass. Date and time of counting: 22.11.1995, 05h30-12h10, undulating grassy plain c. 1440 m a.s.l.; total transect length: 13 km; 770 mm rainfall. 27.11.1995, 07h00-11h00, grassy plain with spars thorn shrubs on a shorline of the Allamanskraal Dam, 8 km; 27.11.1995, 11h00-15h00, a grassy plain transient to Acacia karroo thorns, with some notrrow reed-beds along the Sand River, 6 km
3. Mountain Themeda-Festuca Grassland in Sehlabathebe National Park (7239 ha), Lesotho; 2200-2600 m a.s.l.; total transect length: 31 km. Dominant grass species: Goat Festuca Festuca caprina, Red Grass, Mountain Broom Grass Merxmuellera macowanii, Weeping Lovegrass Eragrostis curvula. Date and time of counting: 12.01.2001, 06h00-11h00, grassland with numerous stream valleys at the foot of Thaba Ntšo along the road from the research station to the lodge, 9 km; 13.01.2001, 6h00-10h00, mainly short grassland with a few stream valleys and sand-stone formation, from the research station along the north-west border of the park through Koti-se-Seholo Tsoe-likane to Tsoelikane Falls, 7 km; 13,01,2001, 10h00-12h30 extensive marshlandwith fairly tall and dense grass and sedges along the Tsoelikane River from Letamong village to the waterfall, 6 km; 15.01.2001, 6h00-11h00, grassland with sandstone formations and stream valleys from the research station through the north-western corner of the park, Herdboy and Central Valleys to the waterfall, 9 km.
Figure 1.
Distribution of three grassland types in South Africa and Lesotho (modified from Rutherford et al. 2006), with the study plots indicated with yellow dots: A – Dry C-T., B – Wet C-T. and C – Mountain F-T.
Figure 1.
Distribution of three grassland types in South Africa and Lesotho (modified from Rutherford et al. 2006), with the study plots indicated with yellow dots: A – Dry C-T., B – Wet C-T. and C – Mountain F-T.
2.2. Data Collection
Studies were conducted by means of the Line Transect Method (Sutherland 1996, Bibby et al. 2012).
As recommended in this method, a potential breeding pair, not an individual, was a census unit. Counts were conducted once on each transect by walking slowly in the mornings (from 5 a.m. to c. 11 a.m.) and recording all seen and heard birds. Spatial attention was paid to singing males and individuals showing territorial or/and breeding behavior. Caution was taken to not count the same birds twice by noting their movements and by recording simultaneously singing males (i.e., singing at the same time). Excluded were all birds passing over the area, definitively not associated with the grassland as a breeding or/and feeding habitat (e.g., herons, egrets, cormorants).
In the case of the Southern Masked Weaver Ploceus velatus and African Red Bishop Euplectes orix, the number of breeding pairs was equal to the number of males counted. In the case of the Helmeted Guineafowl and mousebirds the number of breeding pairs was based on the number of adult birds present in the flock/group divided by 2.
2.3. Data Analysis
The dominance is expressed as the percentage of the total number of pairs of a given species in relation to the total number of all pairs of all species recorded. Dominant species: >5%, subdominant: 2–4.99%.
Linear density is the number of breeding pairs per 1 km of transect. Overall density is the linear density of all breeding pairs of all species per 1 km (≈ 10 ha).
The following guilds were distinguished:
Diet: G–granivorous, I–insectivorous, f – frugivorous, N – nectarivores, C – carnivorous and O - omnivorous.
Foraging: T – gleaning eaves of trees and shrubs, V – gleaning herbaceous vegetation, G – collecting from the ground, A – aerial feeders, P – perching and pursue
Nesting: T–in trees or shrubs, V – in herbaceous vegetation, R– on rocks, G – on the ground, H – in holes
The following indices were used to characterize the diversity and evenness of the communities:
- (1)
- Shannon’s diversity index:
H’ = −∑ pi ln pi
- (2)
- Simpson’s diversity index:
D = ((∑n(n − 1))/N(N − 1)
where: n–total number of breeding pairs belonging to a given species, N–total number of breeding pairs of all species. D ranges between 0 and 1; 1 represents infinite diversity, while 0 represents no diversity.
- (3)
- Pielou’s evenness index:
J’ = (−∑ pi ln pi)/ln S,
where pi is the proportion of breeding pairs belonging to the ith species; S–the total number of species. J’ varies between 0 and 1. The less variation between species in a community, the higher J’.
- (4)
- Community dominance index:
DI = (n1 + n2)/N
where n1, n2–number of pairs of two most abundant species, N–total number of pairs of all species.
The Sørensen index was used to investigate similarities between avian communities in various land categories, subcategories, and different habitats in Macaronesia: S = c/(a + b), where “c” is the number of species common for two compared communities, a–number of species in the community “a”, b–number of species in the community “b”. The index changes from 0 (absolute dissimilarity between communities) to 1 (identical communities),
The one-way analysis of variance (ANOVA) was used to identify differences in the abundance of species between various grassland types. The x2-test was used to test differences in the number of species recorded between various grassland types and in the number of breeding pairs per 1 km between different grassland types.
3. Results
3.1. Avian Diversity
A total of 86 species were recorded in all grassland types pooled (App. 1). The number of species was not significantly different between the Dry and Wet (x2=3.1, p>0.05) and between Wet and Mountain (x2=1.0, p>0.01), but it was significantly different between Dry and Mountain Grassland (x2=4.5, p<0.05).
The number of dominant species was the highest (n=7) in Wet Grassland, the lowest (n=5) in the Mountain Grassland. Only one species, the Long-tailed Widow Euplectes progne was a common dominant species for all three grassland types. All others, i.e. African Stonechat Saxicola torquatus, Wing-snapping Cisticola Cisticola ayersii, Levaillant’s Cisticola Cisticola tinniens and Yellow Bishop Euplectes capensis were dominant only in the Mountain Grassland. The Northern Black Korhaan Afrotis afroides and the Clapper Lark Mirafra apiata were common dominant species in the Dry and Wet Grassland. The Ostrich Struthio camelus, Cloud Cisticola Cisticola textrix, African Quailfinch Ortygospiza atricollis and Pied Starling Spreo bicolor were the only dominant species in the Dry Grassland, while the Helmeted Guineafowl, Zitting Costicola Cisticola juncides and African Pipit Anthus cinnamomeus were the only dominant species in the Wet Grassland.
Large terrestrial birds, columbids and larks were more common in the Dry and Wet than in the mountain Grassland, whereas the reverse was true in the case of raptors, cisticolas, turdids and fringillids (mainly canaries) (Table 2).

Table 1.
Characterization of bird communities in various grassland types.
| Parameter | Dry C-T | Wet C-T | Mount. F-T | Total |
| Number of pairs | 429 | 630 | 666 | 1720 |
| Number of species | 28 | 43 | 47 | 86 |
| Overall density | 151.4 | 233.3 | 214.8 | 200.0 |
| Cumulative dominance | 61.4 | 64.6 | 46.2 | 29.0 |
| Dominance index | 0.28 | 0.33 | 0.25 | 0.19 |
| N. of dominant species | 6 | 7 | 5 | 14 |
| H’ index | 1.22 | 1.27 | 1.35 | 1.59 |
| J’ index | 0.36 | 0.36 | 0.33 | 0.36 |
| D index | 0.92 | 0.91 | 0.94 | 0.96 |
Table 2.
Characterization of bird communities in various grassland types.
| Group | Dry C-T | Wet C-T | Mount. F-T | Total |
| Passerines | ||||
| Alaudidae | 7.8 | 23.5 | 0 | 10.5 |
| Anthus/Macronyx spp. | 1.4 | 5.4 | 5.2 | 6.1 |
| Cisticola spp. | 7.5 | 9.2 | 18.5 | 9.6 |
| Euplectes spp. | 13.5 | 10.3 | 16.5 | 13.5 |
| Ploceidae | 11.3 | 2.1 | 9.2 | 5.6 |
| Turdidae | 8.2 | 3.5 | 15.4 | 9.2 |
| Fringillidae | 0.2 | 0.9 | 16.6 | 4.4 |
| Others | 15.6 | 7.1 | 2.9 | 13.0 |
| Sub-total | 49.9 | 54.9 | 81.4 | 58.9 |
| Non-passerines | ||||
| Columbidae (doves) | 5.2 | 7.7 | 0.7 | 4.3 |
| Large terrestrial birds | 27.2 | 26.7 | 6.1 | 17.9 |
| Raptors | 0 | 0 | 2.1 | 1.0 |
| Others | 2.1 | 3.6 | 6.8 | 4.9 |
| Sub-total | 34.5 | 38 | 15.7 | 28.1 |
| Total | 84.4 | 92.9 | 97.1 | 87 |
While cumulative dominance was similar between the Dry and Wet Grassland (61-65%), these two were much different from that in the Mountain Grassland (46%). However the dominance index was similar in all three grassland types compared (0.25-0.33) (Table 1).
3.2. Comparison of Avian Richness Between Different Grassland Types
Diversity and evenness indices were similar in all three grassland types. Shannon’s Diversity Index (H’) varied between 1.22 and 1.35; Simpson Diversity Index between 0.91 and 0.94, while Pielou’s Dominance Index (J’) varied between 0.33 and 0.36 (Table 1).
The Sørensen Similarity Index between the three grassland types was low, ranging between 0.07 and 0.26 (Table 3). The differences in the number of species was statistically significant only between the Dry and Mountain Grasslands (Table 3). Only four species (out of 87), namely the African Stonechat, Cape Robin-Chat Cossypha caffra Long-tailed Widow and Cape Turtle Dove Streptopelia capicola were common for all three grassland types. Such number was the highest between Dry and Wet Grassland (n=19), but much lower between Dry and Mountain Grassland (n=9) and between Wet and Mountain Grassland (n=6).
3.3. Comparison of Population Densities of Particular Bird Species in Different Grasslands
The overall differences in population densities between the three grassland types were not statistically significant (F=7.49; p > 0.05; Table 3), as the variances were not homogenous.
Nine species has reached a linear density higher than 10 pairs per 10 km: 6 species in the Dry Grassland (Clapper Lark, Cloud Cisticola, Long-tailed Widow, Northern Black Korhaan and Pied Starling), three species in the Mountain Grassland (African Stonechat, Wing-snapping Cisticola and Yellow Bishop), and only one species, the Clapper Lark, in the Wet Grassland (however it was the only species with a density higher than 20 pairs per 10 km).
Table 4.
Results of ANOVA analysis used to identify the existence of differences in the abundance of species between various grassland types.
Table 4.
Results of ANOVA analysis used to identify the existence of differences in the abundance of species between various grassland types.
| Source of variation | SS | df | S2 | F |
| Between | 392 | 2 | 196 | 7.49 |
| Within | 6723 | 260 | 26 | |
| Total | 67623 | 257 |
F 2,118 = 7.49; p>0.05.
3.4. Ecological Guilds
Two main feeding guilds were distinguished in the study area: granivores and insectivores. The proportion of insectivores in the Mountain Grassland was much higher than granivores, in the Dry Grassland it was equal, while in the Wet Grassland the proportion of granivores was higher than insectivores (Figure 2).
Among foraging guilds, more than 60% of all birds in the Dry and Wet Grasslands, were those foraging on the ground, but in the Mountain Grassland it was only 41%. Also the proportion of birds foraging in trees and shrubs was lower in the mountain than in the other grassland types. On the other hand proportion of birds with hunting technique ‘perch and purchase’ were higher in the Mountain than the other grassland types, and the aerial feeder were found only in the Mountain Grassland (Figure 3).
Proportions of birds nesting on the ground or in trees and shrubs were higher in the Wet than in other grassland types, whereas the proportions of birds nesting in grass and herbaceous vegetation or on rocks were higher in the Mountain than in the other grassland types. The proportion of hole-nesting birds were much higher in the Dry Grassland than in any other type (Figure 4).
4. Discussion
4.1. Comparison with Other African Grasslands
The comparative analysis of the population densities and dominance values obtained in this study with similar studies on avian assemblages conducted in other grasslands in Africa is very limited. Most of these studies did not present species abundance based on the number of breeding pairs recorded, as recommended by Sutherland (1996), Bibby et al. (2012) and other authors. Breeding population can only be reliable assessed if the breeding pair, not an individual is a census unit.
There is apparently one such study conducted in the Serengeti National Park, Tanzania (Gottschalk et al. 2007), although even there, data on population densities and dominance are not presented straightforward. These are here retrieved from provided raw data. It is therefore justified to present these re-calculated data. Studies were conducted by means of the mapping method (Bibby et al. 2012) in 10 study plots (long grass – 4 plots, short grass – 3, intermediate grass – 1, wood grass – 2), each plot was 25 ha in surface area, one was 21 ha (surface area of all pooled plots was therefore 246 ha). A total of 576 breeding pair, represented by 34 species were recorded. Three groups were distinguished. 1) Ubiquitous species: Pectoral-patch Cisticola Cisticola brunnescens: 6.0 p./10 ha (25.7%), Zitting Cisticola Cisticola juncidis: 5.2 p./10 ha (22.4%), Rufous-naped lark Mirafra africana 1.0 p./10ha (4.2%). 2) Differential species: Rosy-breasted Longclaw Macronyx ameliae: 0.6 p./10 ha (2.4%), White-tailed Lark Mirafra albicauda: 3.8 p./10 ha (16.3%), Winding Cisticola Cisticola galactotes: 0.5 p./10 ha (2.1%), Somali Short-toed Lark Calandrella somalica: 0.6 p./10 ha (2.6%), African Pipit Anthus cinnamomeus: 0.8 p./10 ha (3.3%), Red-capped Lark Calandrella cinerea: 1.2 p./10 ha (5.0%), Fischer’s Sparrow-lark Eremopterix leucopareia: 0.6 p./10 ha (2.4%), Capped Wheatear Oenanthe pileate: 0.9 p./10 ha (4.0%). 3) Other species with at least 3 pairs: Harlequin Quail Coturnix delegorguei 0.4 p./10 ha (1.6%), Croaking Cisticola Cisticola natalensis: 0.3 p./10 ha (1.4%), Coqui Francolin Francolinu scoqui: 0.1 p./10 ha (0.5%), Siffling Cisticola Cisticola brachyptera: 0.2 p./10 ha (0.9%), Plain-backed Pipit Anthus leucophrys: 0.2 p./10 ha (0.9%), Crowned Lapwing Vanellus coronatus: 0.1 p./10 ha (0.5%). Similarities between plots varied from 0.02 to 0.97. Therefore, the number of dominant species was 4 and these comprised as much as 69.4%; dominance index was also high (0.48). Major taxonomic groups: cisticolas: 53.4%, larks: 30.7%, pipit: 6.8%, turdids: 4.0%, large terrestrial birds: 3.9, columbids: 0.2%, no raptors, others: 1.1%. Most these values differ significantly from those obtained in this study. Especially evident is much higher contribution of cisticolas and larks in the breeding bird community in Tanzania if compare with southern African grasslands.
4.2. Avian Communities of Natural Compared to Modified Grasslands
Natural grasslands can be converted to artificial grasslands, to cultivated fields dominated by wheat (de facto also grasses), or into artificial parklands (forest- or savanna-type habitats). In terms of species richness, artificial temperate grasslands are pauperized in comparison with natural ones (Bollinger 1995). For instance, in the New York state, U.S.A., more than 90% of all breeding pairs belonged to the Red-winged Blackbird Agelaius phoeniceus, Bobolink Dolichonyx oryzivorus and Savanna Sparrow Passerculus sandwichensis, and in Saskatchewan highlands, the Vesper Sparrow Pooectes gramineus strongly dominated in the avian community (MacMaster et al. 2005).
In southern Africa, even very transformed grasslands present more heterogenous environment than natural ones. For instance, in the city of Bloemfontein which is situated amidst the dry Cymbopogon-Themeda Grassland, 78 breeding species were recorded (Kopij 2015a), so it is almost double what has been recorded in the pure surrounding Dry Grasslands (this study). The most common were the Speckled Pigeon Columba guinea, Cape Turtle-Dove, Laughing Dove Spilopelia senegalensis, Little Swift Apus affinis, House Sparrow Passer domesticus and Cape Sparrow Passer melanurus. None of them was recorded as dominant in the natural Dry Grassland (this study). Granivores comprised 71% of all breeding birds, frugivores – 14%, while insectivores – 15%; shrub/tree nesting birds – 61% while birds nesting on/in buildings – 36% (Kopij 2015a), quite different proportions from those recorded in the Dry Grassland. Farmlands around Bloemfontein hold also quite different breeding bird communities (Kopij 2019a) from those in the natural Dry Grassland (this study).
In Roma suburban woodland, Lesotho, transformed from the Wet Cymbopogon-Themeda Grassland, 55 breeding species were recorded, with five dominant species, such as the Laughing Dove, Grey-headed Sparrow Passer diffusus, Speckled Pigeon, Cape Turtle Dove and Common Fiscal Lanius collaris. These species were therefore totally different from those recorded as dominant in the natural Wet Cymbopogon-Themeda Grassland (Kopij 2001). Granivores were by far (72%) more abundant them insectivores (10%) and frugivores (16%); while the shrub/tree nesting birds clearly dominated (60%) over those adapting buildings as nesting sites (31%). Proportions quite different from those recorded in the surrounding Wet Grasslands (this study). In farmlands of Lesotho Highveld, the breeding bird communities were also quite different from those recorded in natural Wet Cymbopogon-Themeda Grassland (Kopij 1997a).
4.3. Segregation of Avian Communities in Grasslands
The large number of bird species that were found in only one study plot might suggest a high variability of species composition. It appear that in southern Africa, the vegetation structure, rather than the age of grassland, is for birds the most important covariance of habitat selection. This study revealed a fairly clear separation of the Cymbopogon-Themeda Grasslands from the Mountain Grassland. The separation is not so clear between the Dry and Wet variations of the Cymbopogon-Themeda Grasslands, although it remain unknown to what extend the bird community in the Dry Grassland has been modified by livestock grazing. A separation of bird communities was also revealed within relatively small area in Serengeti Plains, Tanzania, along main types of tropical grasslands, i.e. short grass, intermediate grass, long grass and wooded grass land (Gottschalk et al. 2007).
4.4. Comparison with Grasslands out of Africa
4.4.1. Species Compositions and Dominant Species
Species composition of grassland birds is influenced by a set of factors that include habitat types, landscape forms and composition, and the availability of prey (Hamer et al. 2006). In grassland communities, the variation in overall species density is strongly affected by variation in densities of the dominant species, which can change dramatically from year to year (Dunning 1986).
In North American prairies, plant species composition differ distinctly between seeded grassland and native mixed prairie, but the differences are not translated into meaningful differences in species composition, diversity, and population density of breeding birds. The most abundant bird species, the Grasshopper Sparrow Ammodrammus savannarum, Western Meadowlark Sturnella neglecta, Eastern Meadowlark Sturnella magna, Dickcissel Spiza americana, and Lark Sparrow Chondestes grammacus were similarly abundant in the seeded grassland and the mixed prairie (Chapman et al. 2004).
In Argentinian pampas, the species richness was not high (28 spp., including
13 grassland dependent species, viz. the Red-winged Tinamou Rynchotus rufescens, Darwin’s Nothura Nothura darwini, Pampas Pipit Anthus chacoensis, Correndera Pipit Anthus correndera, Grassland Sparrow Ammodramus humeralis, Grassland Yellow Finch Sicalis luteola, White-browed Meadowlark Leistes superciliaris, Long-tailed Meadowlark Sturnella loyca; and 4 habitat-independent species, viz. the Southern Lapwing Vanellus chilensis, Firewood-gatherer Annumbius annumbi, Rufous-collared Sparrow Zonotrichia capensis, Suffron Finch Sicalis flaveola. (Isacch et al. 2005).
In southern Brazilian campos, the species richness was relatively high (42 species, including 17 grassland dependent). The following were dominant species: the Rufous-collared Sparrow (15.4%), Grassland Sparrow (10.6%), Pampa Finch Embernagra platensis (9.5%), Long-tailed Reed Finch Donacospiza albifrons (6.0%), Grassland Yellow Finch (5.0%). These comprised together 46.5% (Becker et al. 2019).
Most of species in North American and Neotropical grasslands are representatives of families other than in Africa, viz. Funariidae, Icteridae, Parulidae, Passerellidae, Thraupidae and Tyrannidae. Only few families are the same (Motacillidae, Fringillidae, Turdidae).
4.4.2. Genera Representativeness and Level of Endemism
According to Cody (1966), avian diversity and general structure are similar in Arctic, temperate and tropical grasslands. As can be seen in Table 5, many bird species breeding is southern African grasslands have their ecomorphological equivalents in grasslands in other parts of the world. However, on the global scale, the species diversity of birds in grasslands is declining northwards. While the Arctic grasslands support 22 typical grassland bird species, in temperate North American grasslands, 35 such species have been identified (Chapman et al. 2004), 121 species were recorded in Neotropical grasslands (Vickery et al. 1999) and 96 species in Afrotropical grasslands (G. Kopij, own data). The likely reason for such discrepancy is a differential primary production resulting in differences in food abundance. In Arctic grassland, the mean productivity is 144 g/m2/year, whereas in tropical grasslands it varies between 1000 and 2000 g/m2/year (Smith 1996). This is further evidenced by the number of dominant avian genera. While the average number of species with genera is strikingly similar in the Arctic, temperate and Afrotropical grasslands (1.4; 1.5 and 1.6 respectively), the number of dominant genera is declining from tropical to Arctic grasslands. So, Neotropical grasslands are dominated by 10 genera, Afrotropical by four, temperate by one, and Arctic grasslands by none genus (Vickery 1999, G. Kopij own data).
Not only diversity of grassland genera, but also endemism shows a clinal change from the tropical towards Arctic grasslands. While only 5 and 6 endemic genera occur in the Arctic and temperate grasslands respectively, 37 and 59 such genera were identified in the Neotropical and Afrotropical grasslands respectively. There are no endemic families in Arctic and tempera grasslands (Vickery et al. 1999), but as many as 16 such families are in Afrotropical grasslands (G. Kopij, own data).
4.4.3. Large Terrestrial Birds
In North American prairie, larger species are most abundant in relatively stable and productive tall grass, and are rare in instable and less productive short grass (Wiens 1974), but the reverse is true is South African Highveld. Such large terrestrial species as the Northern Black Korhaan, Crowned Lapwing, Helmeted Guineafowl, spurfowls and francolins are abundant in instable and relatively low-productive Dry Grassland, and are rare in more stable and more productive Mountain Grassland. It is partly because some of these large terrestrial species are insectivorous to certain extend, and insects and other arthropods are more abundant in drier grasslands (G. Kopij, own observ.).
Although the Mountain Grassland is characterized by more stable year-to-year climatic conditions, seasonal variation in primary productivity is much higher than in Dry Grassland, and it may adversely affect sedentary species, especially those characterized by high level of philopatry
Table 5.
Avian ecological equivalents in temperate and tropical grasslands. Based on: Dickinson (2002), Vickery et al. (1999), Becker et al. (2019), Snow & Perrins (1998), Hockey et al. (2005), Gottschalk et al. (2007).
Table 5.
Avian ecological equivalents in temperate and tropical grasslands. Based on: Dickinson (2002), Vickery et al. (1999), Becker et al. (2019), Snow & Perrins (1998), Hockey et al. (2005), Gottschalk et al. (2007).
| Type | Temperate grasslands | Neotropical grasslands | Afrotropical grasslands | ||||
| prairie | steppe | pampas | campos | Highveld | Maloti | Serengeti | |
| Lapwing-type | Bertramia chilensis | Vanellus vanellus | Vanellus chilensis | Vanellus chilensis | Vanellus coronatus | Vanellus armatus | Vanellus coronatus |
| Partridge-type | - | Perdix perdix | Nothura maculosa | Nothura maculosa | Francolinus levaillantoides | Francolinus africanus | Francolinus coqui |
| Quail-type | Tympanu-chus spp. | Coturnix coturnix | - | - | Coturnix coturnix | Cotunix coturnix | Coturnix delegorguei |
| Kestrel-type | Falco sparverius | Falco naumanni | Falco sparverius | Falco sparverius | Falco rupicoloides | Falco rupicolis | Falco rupicoloides |
| Falcon-type | Falco mexicanus | Falco cherrug | Caracara plancus | Caracara plancus | Falco peregrinus | Falco biarmicus | Falco biarmicus |
| Buzzard-type | Buteo swainsoni | Buteo rufinus | Parabuteo unicintcus | Buteogallus meridionalis | Buteo rufofuscus | Buteo rufofuscus | Buteo augur |
| Harrier-type | Circus cyaneus | Circus pygargus | Circus buffoni | Circus cinereus | Circus ranivorus | Circus maura | Circus ranivorus |
| Eagle-type | Aquila chrysaetos | Aquila nipalensis | Buteo albicaudatus | Harpyhaliaetus coronatus |
Aquila rapax |
Aquila verrrauxi | Aquila rapax |
| Vulture-type | Cathares aura | Gyps fulvus | Coragyps atrata | Coragyps atratus | Gyps africanus | Gyps coprotheres | Gyps rueppellii |
| Bubo-type | Bubo virginianus | Bubo virginianus | Bubo virginianus | Bubo africanus | Bubo capensis | Bubo africanus | |
| Asio- type | Asio otus | Asio otus | Asio otus | Asio flammeus | Asio capensis | - | Asio capensis |
| Tyto- type |
Tyto alba | Tyto alba | Tyto alba | Tyto alba | Tyto alba | Tyto alba | Tyto alba |
| Athene-type | Athene cunicularia | Athene noctua | Athene cunicularia | Athene cunicularia | - | - | - |
| Dove-type | Zanaida macroura | Streptopelia decaocto | Zanaida auriculata | Zanaida auriculata | Spilopelia senegalensis | Streptopelia capensis | Spilopelia senegalensis |
| Pipit- type |
Anthus spraguei | Anthus campestris | Anthus correndera | Anthus hellmayri | Anthus cinnamomeus | Anthus hoeschi | Anthus cinnamomeus |
| Bunting-type |
Calamospiza melanocorys |
Emberiza calandra | Sporophila caerulescens | Sicalis luteola | Emberiza tahapisi | Emberiza capensis | Emberiza leucopareia |
| Cisticola-type | - | Cisticola juncidis | - | - | Cisticola textrix | Cisticola ayresii | Cisticola brunnescens |
| Lark- type |
Strunella neglecta | Alauda arvensis | Strunella defilippi | Strunella supercilliaris | Mirafra apiata | Galerida magnirostris | Mirafra albicauda |
| Sparrow-type | Zonotrichia leucophrys | Passer domesticus | Zonotrichia capensis | Zonotrichia capensis | Passer melanurus | Passer diffusus | Passer suahelicus |
4.4.4. Spatial and Temporal Variation in Population Densities
In temperate grassland of North America, overall breeding population density does not differ between various grassland types (Wiens 1974). In southern Africa, the differences are however evident, and may be accounted on main differences in primary productivity of particular habitats, as well as on the seasonal variation in this productivity. Long-term studies on overall breeding densities of birds in southern African grasslands are lacking. Year-to-year or even month-to-month variations in such densities are however apparent, especially in the Cymbepogon-Themeda Grassland(Kopij 1997d, 2004a, 2004b). In southern African grasslands, in springs (beginning of the wet season) with rainfall lower than the long-term average, some territorial bird species may vacate their territories established in dry areas and settle down in the neighbouring more humid areas (i.e. near rivers, dams, gardens, irrigated fields, urbanized habitats), which may have more food resources (Kopij 1997b, 2004b).
Breeding population densities of some bird species may show marked month-to-month and year-to-year fluctuations following strictly similar changes in the precipitation (e.g. Kopij 2004b).
4.5. Indicator Species in Southern African Grasslands
Maphisa et al. (2017) have identified eight bird species as indicators of grassland environmental health/habitat suitability for breeding birds (well-balanced fire and grazing management to maintain proper height and cover density) in South Africa (Wet Cymbopogon-Themeda Grassland), namely the Wing-snapping Cisticola: 4-5 exx./10 ha, Cape Longclaw: 4-5 exx./10 ha, African Pipit: 3 exx./10 ha, African Quail Finch: 2-3 exx./10 ha, Yellow-breasted Pipit: 1 exx./10 ha, Red-capped Lark: 1 ex./10 ha, Zitting Cisticola: 0.5 ex./10 ha and Common Quail: 1 ex./10 ha. Of these, only the Yellow-breasted Pipit is a threatened species. All these species were common both in Maphisa’s Ingula study plots near Ven Reenen on the border of the Free State and KwaZulu-Natal, as well as in study plots designed in the Free State and Lesotho in this study. To these could be added the Long-tailed Widow, Clapper Lark and Mountain Pipit. For most of these species, population density was related to grass height and cover. The Mountain Pipit, Clapper Lark, African Quailfinch and Common Quail prefer short and sparse grass. The African Pipit, Yellow-breasted Pipit and Red-capped Lark prefer short and dense grass. The Long-tailed Widow, Cape Longclaw and Zitting Cisticola prefer tall and dense grass. The Wing-snapping Cisticola preferred grass of intermediate height and cover.
4.6. Conservation Implications
Grasslands are ecosystems that have evolved with frequent disturbances. Historically, the agents principally responsible for maintaining grassland habitats were drought, grazing by native herbivores, and fire. Therefore, grazing by livestock, prescribed burning, and mowing/haying are the most frequently used, and versatile, grassland management techniques (SANBI 2014). Grassland birds prefer a wide range of grass heights and grass densities. Three species groups may be distinguished in this regard: a) species preferring short and sparse vegetation, b) species preferring taller and more dense vegetation, c) species showing no preferences. Due to differences in these preferences and regional differences in soils and plant species composition, the responses of particular grass bird species to specific grassland management practices can be variable and often are regionally dependent (Dauglas et al. 2023). As a result, grassland areas should be managed as a mosaic of different grassland types. Such situation can be maintained through rotational system which can provide a variety of habitat types in every year, ensure the availability of suitable habitat for birds (Vickery et al. 1999). In order to halt current species habitat loss and species extinction, critical are conservation decisions on reliable density estimates and their changes.
5. Conclusions
Southern African grasslands are characterize by relatively high level of species richness and high biodiversity. In tends to increase with the altitude, being the highest in the Mountain Grassland. Species compositions dominance and population densities vary markedly between different grassland types. The avifauna of southern African grasslands requires further studies, especially related to the population density estimates and population dynamics of some indicative species.
Funding
This research received no external funding.
Data Availability Statement
The original contributions presented in the study are included in the article, further inquiries can be directed to the corresponding author.
Acknowledgments
Prof. O. B. Kok, Mr J. van Niekerk, and Mrs. Therons are thanked for logical help during this study.
Conflicts of Interest
The author declares no conflicts of interest.
Appendix A
Table A1.
Bird assemblages in South African grasslands. Dominant species in whatever grassland type are indicated with bold case. Guilds: Fe – feeding, Ne – nesting, Fo – foraging. For further details see the text. Parameters: n – number of breeding pairs, d - linear density (pairs per 10 km, ≈ 10 ha), %d – dominance. X2-test: * p<0.01, - p<0.05.
| Scientific species name | Common species name | Guilds | Dry C-T, 28 km | Wet C-T, 27 km | Mount. F-T, 31 km | Total | x2-test | |||||||||||||
| Fe | Ne | Fo | n | d | %d | n | d | %d | n | d | %d | n | d | %d | 1/2/3 | 1/2 | 1/3 | 2/3 | ||
| Mirafra apiata | Clapper Lark | G | G | G | 33 | 11.8 | 7.8 | 148 | 54.8 | 23.5 | 0 | 0 | 0 | 181 | 21 | 10.5 | 200.1* | 36.5* | 16.5* | 74.0* |
| Euplectes progne | Long-tailed Widowbird | G | V | V | 49 | 17.5 | 11.6 | 57 | 21.1 | 9 | 33 | 10.6 | 5 | 139 | 16.2 | 8.1 | 6.4- | 0.3 | 1.6 | 3.2 |
| Saxicola torquatus | African Stonechat | I | G | P | 18 | 6.4 | 4.2 | 8 | 3 | 1.3 | 80 | 25.8 | 12 | 106 | 12.3 | 6.2 | 86.1* | 1.9 | 19.6* | 29.5* |
| Afrotis afroides | Northern Black Korhaan | I | G | G | 55 | 19.6 | 13 | 41 | 15.2 | 6.5 | 0 | 0 | 0 | 96 | 11.2 | 5.6 | 51.1* | 1 | 27.5* | 20.5* |
| Cisticola ayresii | Wing-snapping Cisticola | I | V | G | 0 | 0 | 0 | 0 | 0 | 0 | 86 | 27.7 | 12.9 | 86 | 10 | 5 | 172.0* | 43.0* | 43.0* | |
| Euplectes capensis | Yellow Bishop | G | V | V | 8 | 2.9 | 1.9 | 1 | 0.4 | 0.2 | 71 | 22.9 | 10.7 | 80 | 9.3 | 4.6 | 142.0* | 35.5* | 35.5* | |
| Spreo bicolor | Pied Starling | F | H | G | 66 | 23.6 | 15.6 | 0 | 0 | 0 | 1 | 0.3 | 0.2 | 67 | 7.8 | 3.9 | 128.1* | 33* | 31.5* | 0.5 |
| Numida meleagris | Helmeted Guineafowl | G | G | G | 14 | 5 | 3.3 | 42 | 15.6 | 6.7 | 0 | 0 | 0 | 56 | 6.5 | 3.3 | 49.0* | 7* | 7.0* | 21.0* |
| Cisticola juncides | Zitting Cisticola | I | V | V | 0 | 0 | 0 | 46 | 17 | 7.3 | 0 | 0 | 0 | 46 | 5.3 | 2.7 | 92.0* | 23* | 23.0* | |
| Cisticola textrix | Cloud Cisticola | I | V | V | 32 | 11.4 | 7.5 | 14 | 5.2 | 2.2 | 0 | 0 | 0 | 46 | 5.3 | 2.7 | 33.6* | 3.5 | 16.0* | 7.0- |
| Struthio camelus | Common Ostrich | O | G | G | 0 | 0 | 0 | 39 | 14.4 | 6.2 | 0 | 0 | 0 | 39 | 4.5 | 2.3 | 78.0* | 19.5* | 19.5* | |
| Cisticola tinniens | Levaillant’s Cisticola | I | V | V | 0 | 0 | 0 | 1 | 0.4 | 0.2 | 37 | 11.9 | 5.6 | 38 | 4.4 | 2.2 | 70.2* | 0.5 | 18.5* | 17.1* |
| Ortygospiza atricoll. | African Quailfinch | G | G | G | 25 | 8.9 | 5.9 | 0 | 0 | 0 | 11 | 3.5 | 1.7 | 36 | 4.2 | 2.1 | 26.2* | 12.5* | 2.7 | 5.5- |
| Ploceus velatus | South. Masked Weaver | G | T | T | 27 | 9.6 | 6.4 | 9 | 3.3 | 1.4 | 0 | 0 | 0 | 36 | 4.2 | 2.1 | 31.5* | 4.5- | 13.5* | 4.5- |
| Streptopelia capicola | Cape Turtle-Dove | G | T | G | 13 | 4.6 | 3.1 | 22 | 8.1 | 3.5 | 1 | 0.3 | 0.2 | 36 | 4.2 | 2.1 | 18.5* | 1.2 | 5.1- | 9.6* |
| Macronyx capensis | Cape Longclaw | I | G | G | 6 | 2.1 | 1.4 | 0 | 0 | 0 | 29 | 9.4 | 4.4 | 35 | 4.1 | 2 | 40.2* | 3 | 7.6* | 14.5* |
| Anthus cinnamomeus | African Pipit | I | G | G | 0 | 0 | 0 | 34 | 12.6 | 5.4 | 0 | 0 | 0 | 34 | 4 | 2 | 68.0* | 17* | 17.0* | |
| Motacilla capensis | Cape Wagtail | I | G | G | 11 | 3.9 | 2.6 | 0 | 0 | 0 | 21 | 6.8 | 3.2 | 32 | 3.7 | 1.9 | 20.7* | 5.5- | 1.6 | 10.5* |
| Crithagra symonsi | Drakensberg Siskin | G | G | V | 0 | 0 | 0 | 0 | 0 | 0 | 30 | 9.7 | 4.5 | 30 | 3.5 | 1.7 | 60.0* | 15.0* | 15.0* | |
| Anthus hoeschi | Mountain Pipit | I | G | G | 0 | 0 | 0 | 0 | 0 | 0 | 29 | 9.4 | 4.4 | 29 | 3.4 | 1.7 | 58.0* | 14.5* | 14.5* | |
| Pternistes nanalensis | Natal Spurfowl | G | G | G | 0 | 0 | 0 | 27 | 10 | 4.3 | 0 | 0 | 0 | 27 | 3.1 | 1.6 | 54.0* | 13.5* | 13.5* | |
| Coturnix coturnix | Common Quail | I | G | G | 0 | 0 | 0 | 0 | 0 | 0 | 26 | 8.4 | 3.9 | 26 | 3 | 1.5 | 52.0* | 13.0* | 13.0* | |
| Spilopelia senegalensis | Laughing Dove | G | T | G | 6 | 2.1 | 1.4 | 20 | 7.4 | 3.2 | 0 | 0 | 0 | 26 | 3 | 1.5 | 24.3* | 3.8 | 3 | 10.0* |
| Apus barbatus | African Black Swift | I | R | A | 0 | 0 | 0 | 0 | 0 | 0 | 25 | 8.1 | 3.8 | 25 | 2.9 | 1.5 | 50.0* | 12.5* | 12.5* | |
| Emberiza capensis | Cape Bunting | G | R | G | 0 | 0 | 0 | 0 | 0 | 0 | 24 | 7.7 | 3.6 | 24 | 2.8 | 1.4 | 48.0* | 12.0* | 12.0* | |
| Myrmecocichla formic. | Ant-eating Chat | I | G | P | 14 | 5 | 3.3 | 9 | 3.3 | 1.4 | 0 | 0 | 0 | 23 | 2.7 | 1.3 | 13.1* | 0.5 | 7.0* | 4.5 |
| Riparia cincta | Banded Martin | I | H | A | 0 | 0 | 0 | 0 | 0 | 0 | 18 | 5.8 | 2.7 | 18 | 2.1 | 1 | 36.0* | 9.0* | 9.0* | |
| Monticola explorator | Sentinel Rock-Thrush | I | G | G | 0 | 0 | 0 | 0 | 0 | 0 | 17 | 5.5 | 2.6 | 17 | 2 | 1 | 34.0* | 8.5* | 8.5* | |
| Ploceus capensis | Cape Weaver | G | T | T | 0 | 0 | 0 | 0 | 0 | 0 | 17 | 5.5 | 2.6 | 17 | 2 | 1 | 34.0* | 8.5* | 8.5* | |
| Gocolaptes olivaceus | Ground Woodpecker | I | H | G | 0 | 0 | 0 | 1 | 0.4 | 0.2 | 15 | 4.8 | 2.3 | 16 | 1.9 | 0.9 | 26.4* | 0.5 | 7.5* | 6.1- |
| Serinus canicollis | Cape Canary | G | T | V | 0 | 0 | 0 | 0 | 0 | 0 | 15 | 4.8 | 2.3 | 15 | 1.7 | 0.9 | 30.0* | 7.5* | 7.5* | |
| Vanellus armatus | Blacksmith Plover | I | G | G | 0 | 0 | 0 | 14 | 5.2 | 2.2 | 0 | 0 | 0 | 14 | 1.6 | 0.8 | 28 | 7 | 7.0* | |
| Telophorus zeyonensis | Bokmakierie | I | T | T | 5 | 1.8 | 1.2 | 8 | 3 | 1.3 | 0 | 0 | 0 | 13 | 1.5 | 0.8 | 7.5 | 0.3 | 2.5 | 4 |
| Vanellus coronatus | Crowned Lapwing | I | G | G | 0 | 0 | 0 | 12 | 4.4 | 1.9 | 0 | 0 | 0 | 12 | 1.4 | 0.7 | 24 | 6- | 6.0- | |
| Cossypha caffra | Cape Robin-Chat | F | T | T | 3 | 1.1 | 0.7 | 3 | 1.1 | 0.5 | 5 | 1.6 | 0.8 | 11 | 1.3 | 0.6 | 0.7 | 0 | 0.3 | 0.3 |
| Hirundo cucullata | Greater Striped Swallow | I | R | A | 0 | 0 | 0 | 0 | 0 | 0 | 11 | 3.5 | 1.7 | 11 | 1.3 | 0.6 | 22 | 5.5- | 5.5- | |
| Pternistes swainsonii | Swainson’s Spurfowl | G | G | G | 5 | 1.8 | 1.2 | 6 | 2.2 | 1 | 0 | 0 | 0 | 11 | 1.3 | 0.6 | 5.6 | 0 | 2.5 | 3 |
| Tricholaema leucomelas | Acacia Pied Barbet | F | H | T | 1 | 0.4 | 0.2 | 10 | 3.7 | 1.6 | 0 | 0 | 0 | 11 | 1.3 | 0.6 | 16.5 | 3.7 | 0.5 | 5.0- |
| Buteo rufofuscus | Jackal Buzzard | C | R | P | 0 | 0 | 0 | 0 | 0 | 0 | 9 | 2.9 | 1.4 | 9 | 1 | 0.5 | 18 | 4.5- | 4.5- | |
| Eupodotis caerulescens | Blue Korhaan | I | G | G | 9 | 3.2 | 2.1 | 0 | 0 | 0 | 0 | 0 | 0 | 9 | 1 | 0.5 | 18 | 4.5- | 4.5- | |
| Oena capensis | Namaqua Dove | G | T | G | 3 | 1.1 | 0.7 | 5 | 1.9 | 0.8 | 0 | 0 | 0 | 8 | 0.9 | 0.5 | 4.8 | 0.25 | 1.5 | 2.5 |
| Prinia flavicans | Black-chested Prinia | I | V | V | 0 | 0 | 0 | 8 | 3 | 1.3 | 0 | 0 | 0 | 8 | 0.9 | 0.5 | 16 | 4 | 4 | |
| Vidua macroura | Pin-tailed Whydah | G | T | G | 0 | 0 | 0 | 8 | 3 | 1.3 | 0 | 0 | 0 | 8 | 0.9 | 0.5 | 16 | 4- | 4.0- | |
| Hirundo albigularis | White-throated Swallow | I | R | A | 0 | 0 | 0 | 0 | 0 | 0 | 7 | 2.3 | 1.1 | 7 | 0.8 | 0.4 | 14 | 3.5 | 3.5 | |
| Acrocephalus baeticatus | African Reed Warbler | I | V | V | 0 | 0 | 0 | 6 | 2.2 | 1 | 0 | 0 | 0 | 6 | 0.7 | 0.3 | 12 | 3 | 3 | |
| Scleroptila levaillant. | Orange River Francolin | G | T | G | 5 | 1.8 | 1.2 | 1 | 0.4 | 0.2 | 0 | 0 | 0 | 6 | 0.7 | 0.3 | 7 | 1.3 | 2.5 | 0.5 |
| Charadrius tricollaris | Three-banded Plover | I | G | G | 5 | 1.8 | 1.2 | 0 | 0 | 0 | 0 | 0 | 0 | 5 | 0.6 | 0.3 | 10 | 2.5 | 2.5 | |
| Chrysoccoccyx caprius | Diederick Cuckoo | I | T | T | 5 | 1.8 | 1.2 | 0 | 0 | 0 | 0 | 0 | 0 | 5 | 0.6 | 0.3 | 10 | 2.5 | 2.5 | |
| Euplectes ardens | Red-collared Widowbird | G | V | V | 0 | 0 | 0 | 0 | 0 | 0 | 5 | 1.6 | 0.8 | 5 | 0.6 | 0.3 | 10 | 2.5 | 2.5 | |
| Nectarinia famosa | Malachite Sunbird | N | T | V | 0 | 0 | 0 | 0 | 0 | 0 | 5 | 1.6 | 0.8 | 5 | 0.6 | 0.3 | 10 | 2.5 | 2.5 | |
| Anthus chloris | Yellow-breasted Pipit | I | G | V | 0 | 0 | 0 | 0 | 0 | 0 | 4 | 1.3 | 0.6 | 4 | 0.5 | 0.2 | 8 | 2 | 2 | |
| Apus caffer | White-rumped Swift | I | R | A | 0 | 0 | 0 | 0 | 0 | 0 | 4 | 1.3 | 0.6 | 4 | 0.5 | 0.2 | 8 | 2 | 2 | |
| Scleroptila africanus | Grey-winged Francolin | G | G | G | 0 | 0 | 0 | 0 | 0 | 0 | 4 | 1.3 | 0.6 | 4 | 0.5 | 0.2 | 8 | 2 | 2 | |
| Sigelus silens | Fiscal Flycatcher | I | T | T | 0 | 0 | 0 | 4 | 1.5 | 0.6 | 0 | 0 | 0 | 4 | 0.5 | 0.2 | 8 | 2 | 2 | |
| Trachyphonus vaillantii | Crested Barbet | F | H | T | 0 | 0 | 0 | 4 | 1.5 | 0.6 | 0 | 0 | 0 | 4 | 0.5 | 0.2 | 8 | 2 | 2 | |
| Bostrychia hagedash | Hadada Ibis | I | T | G | 1 | 0.4 | 0.2 | 0 | 0 | 0 | 2 | 0.6 | 0.3 | 3 | 0.3 | 0.2 | 2 | 0.5 | 0.2 | 1 |
| Colis colius | White-backed Mousebird | F | T | T | 0 | 0 | 0 | 3 | 1.1 | 0.5 | 0 | 0 | 0 | 3 | 0.3 | 0.2 | 6 | 1.5 | 1.5 | |
| Columba guinea | Speckled Pigeon | G | R | G | 0 | 0 | 0 | 0 | 0 | 0 | 3 | 1 | 0.5 | 3 | 0.3 | 0.2 | 6 | 1.5 | 1.5 | |
| Crithagra atrogularis | Black-throated Canary | G | T | T | 0 | 0 | 0 | 3 | 1.1 | 0.5 | 0 | 0 | 0 | 3 | 0.3 | 0.2 | 6 | 1.5 | 1.5 | |
| Hirundo fuligula | Rock Martin | I | R | A | 0 | 0 | 0 | 0 | 0 | 0 | 3 | 1 | 0.5 | 3 | 0.3 | 0.2 | 6 | 1.5 | 1.5 | |
| Lanis collaris | Common Fiscal | I | T | P | 2 | 0.7 | 0.5 | 1 | 0.4 | 0.2 | 0 | 0 | 0 | 3 | 0.3 | 0.2 | 2 | 0.2 | 1 | 0.5 |
| Passer melanurus | Cape Sparrow | G | T | G | 0 | 0 | 0 | 1 | 0.4 | 0.2 | 2 | 0.6 | 0.3 | 3 | 0.3 | 0.2 | 2 | 0.5 | 1 | 0.2 |
| Batis pririt | Pirit Batis | I | T | T | 0 | 0 | 0 | 2 | 0.7 | 0.3 | 0 | 0 | 0 | 2 | 0.2 | 0.1 | 4 | 1 | 1 | |
| Cercotrichas paena | Kalahari Scrub Robin | I | T | T | 0 | 0 | 0 | 2 | 0.7 | 0.3 | 0 | 0 | 0 | 2 | 0.2 | 0.1 | 4 | 1 | 1 | |
| Corvus capensis | Black Crow | C | T | P | 0 | 0 | 0 | 0 | 0 | 0 | 2 | 0.6 | 0.3 | 2 | 0.2 | 0.1 | 4 | 1 | 1 | |
| Crithagra flaviventris | Yellow Canary | G | T | T | 0 | 0 | 0 | 1 | 0.4 | 0.2 | 1 | 0.3 | 0.2 | 2 | 0.2 | 0.1 | 1 | 0.5 | 0.5 | 0 |
| Emberiza tahapisi | Cinnamon-b. Bunting | G | R | G | 1 | 0.4 | 0.2 | 1 | 0.4 | 0.2 | 0 | 0 | 0 | 2 | 0.2 | 0.1 | 1 | 0 | 0.5 | 0.5 |
| Onychogntahus morio | Red-winged Starling | F | R | T | 0 | 0 | 0 | 0 | 0 | 0 | 2 | 0.6 | 0.3 | 2 | 0.2 | 0.1 | 4 | 1 | 1 | |
| Quelea quelea | Red-billed Quelea | G | T | V | 0 | 0 | 0 | 2 | 0.7 | 0.3 | 0 | 0 | 0 | 2 | 0.2 | 0.1 | 4 | 1 | 1 | |
| Rhinopomastes cyanom. | Common Scimitarbill | I | H | T | 0 | 0 | 0 | 2 | 0.7 | 0.3 | 0 | 0 | 0 | 2 | 0.2 | 0.1 | 4 | 1 | 1 | |
| Scopus umbetta | Hamerkop | C | T | P | 2 | 0.7 | 0.5 | 0 | 0 | 0 | 0 | 0 | 0 | 2 | 0.2 | 0.1 | 4 | 1 | 1 | |
| Anthus crenatus | African Rock Pipit | I | R | G | 0 | 0 | 0 | 0 | 0 | 0 | 1 | 0.3 | 0.2 | 1 | 0.1 | 0.1 | 2 | 0.5 | 0.5 | |
| Bubo capensis | Cape Eagle Owl | C | R | P | 0 | 0 | 0 | 0 | 0 | 0 | 1 | 0.3 | 0.2 | 1 | 0.1 | 0.1 | 2 | 0.5 | 0.5 | |
| Burhinus capensis | Spotted Thick-knee | I | G | G | 0 | 0 | 0 | 1 | 0.4 | 0.2 | 0 | 0 | 0 | 1 | 0.1 | 0.1 | 2 | 0.5 | 0.5 | |
| Ceryle rudis | Pied Kingfisher | C | H | P | 0 | 0 | 0 | 0 | 0 | 0 | 1 | 0.3 | 0.2 | 1 | 0.1 | 0.1 | 2 | 0.5 | 0.5 | |
| Circus maurus | Black Harrier | C | G | P | 0 | 0 | 0 | 0 | 0 | 0 | 1 | 0.3 | 0.2 | 1 | 0.1 | 0.1 | 2 | 0.5 | 0.5 | |
| Circus ranivorus | African Marsh Harrier | I | V | P | 0 | 0 | 0 | 0 | 0 | 0 | 1 | 0.3 | 0.2 | 1 | 0.1 | 0.1 | 2 | 0.5 | 0.5 | |
| Estrilda astrild | Common Waxbill | G | V | V | 0 | 0 | 0 | 0 | 0 | 0 | 1 | 0.3 | 0.2 | 1 | 0.1 | 0.1 | 2 | 0.5 | 0.5 | |
| Falco biarmicus | Lanner Falcon | C | R | P | 0 | 0 | 0 | 0 | 0 | 0 | 1 | 0.3 | 0.2 | 1 | 0.1 | 0.1 | 2 | 0.5 | 0.5 | |
| Gypaetus barbatus | Bearded Vulture | C | R | P | 0 | 0 | 0 | 0 | 0 | 0 | 1 | 0.3 | 0.2 | 1 | 0.1 | 0.1 | 2 | 0.5 | 0.5 | |
| Passer diffusus | S. Grey-headed Sparrow | G | T | G | 0 | 0 | 0 | 0 | 0 | 0 | 1 | 0.3 | 0.2 | 1 | 0.1 | 0.1 | 2 | 0.5 | 0.5 | |
| Prinia hypoxantha | Drakensberg Prinia | I | V | V | 0 | 0 | 0 | 0 | 0 | 0 | 1 | 0.3 | 0.2 | 1 | 0.1 | 0.1 | 2 | 0.5 | 0.5 | |
| Rhinoptilus africanus | Double-banded Courser | I | G | G | 0 | 0 | 0 | 0 | 0 | 0 | 1 | 0.3 | 0.2 | 1 | 0.1 | 0.1 | 2 | 0.5 | 0.5 | |
| Streptopelia semitorqua. | Red-eyed Dove | G | T | T | 0 | 0 | 0 | 1 | 0.4 | 0.2 | 0 | 0 | 0 | 1 | 0.1 | 0.1 | 2 | 0.5 | 0.5 | |
| Sylvia subcaeruleum | Chestnut-v. Tit-Babbler | I | T | T | 0 | 0 | 0 | 1 | 0.4 | 0.2 | 0 | 0 | 0 | 1 | 0.1 | 0.1 | 2 | 0.5 | 0.5 | |
| Urocolis indicus | Red-faced Mousebird | F | T | T | 0 | 0 | 0 | 1 | 0.4 | 0.2 | 0 | 0 | 0 | 1 | 0.1 | 0.1 | 2 | 0.5 | 0.5 | |
References
- Ambarlı, D.; Bilgin, C. C. Effects of landscape, land use and vegetation on bird community composition and diversity in Inner Anatolian steppes. Agric. Eecos. Envir. 2014, 182, 37-46. [CrossRef]
- Azpiroz, A. B.; Isacch, J. P.; Dias, R. A.; Di Giacomo, A. S.; Fontana, C. S.; Palarea, C. M. Ecology and conservation of grassland birds in southeastern South America: a review. J. Field Orn. 2012, 83(3), 217-246. [CrossRef]
- Becker, R. G.; Paise, G.; Pizo, M. A. A comparison of bird communities in natural and revegetated grasslands in south Brazil. Rev. Brasil. Orn. 2019, 27(3), 199-206. [CrossRef]
- Bibby, C. J.; Burgess, N. D.; Hill, D. A.; Mustoe, S. Bird Census Techniques, 2nd ed. Academic Press, London, 2000.
- Billinger, E. K. Successful changes and habitat selection in hayfield bird communities. Auk 1995, 112: 720-730.
- Browder, S. F.; Johnson, D. H.; Ball, I. J. Assemblages of breeding birds as indicators of grassland condition. Ecol Indicators 2002, 2(3), 257-270. [CrossRef]
- Chapman, R. N.; Engle, D. M.; Masters, R. E.; Leslie Jr, D. M. Grassland vegetation and bird communities in the southern Great Plains of North America. Agric. Ecosyst. Environ. 2004, 104(3), 577-585. [CrossRef]
- Cody, M. L. 1974. Competition and the structure of bird communities. Princton Univ. Press, Princeton (USA), 1974.
- De Swardt, D. H. Birds of the Bloemfontein pentad 2905_2610: a review over a 30 year period. Biodiv. Observ. 2017, 8, 43-1.
- De Swardt, D. H.; Van Niekerk, D. J. An annotated check list of the birds of Qwaqwa National Park. Koedoe 1996, 39(1), 89-106. [CrossRef]
- Dickinson, M. D. (ed.). Field Guide to birds of North America. 4th ed. National Geographic Society, Washington, 2002.
- Douglas, D. J.; Waldinger, J.; Buckmire, Z. et al. A global review identifies agriculture as the main threat to declining grassland birds. Ibis 2023, 165(4), 1107-1128. [CrossRef]
- Dunning, Jr, J. B. Shrub-steppe bird assemblages revisited: implications for community theory. American Naturalist 1986, 128(1), 82-98. [CrossRef]
- Earlé, R.A.; Lawson, A. B.. An annotated check list of the birds of the Golden Gate Highlands National Park. Koedoe 1988, 31, 227-243. [CrossRef]
- Gottschalk, T. K.; Ekschmitt, K.; Bairlein, F. Relationships between vegetation and bird community composition in grasslands of the Serengeti. Afr. J. Ecol. 2007, 45(4), 557-565. [CrossRef]
- Hamer, T. L.; Flather, C. H.; Noon, B. R. Factors associated with grassland bird species richness: the relative roles of grassland area, landscape structure, and prey. Landsc. Ecol. 2006, 21(4), 569-583. [CrossRef]
- Hockey, P. A. R.; Dean, W. R. J.; Ryna, P. G. (eds.) 2005. Roberts’ Birds of Southern Africa. 7th ed. John Voelcker Bird Book Fund, Cape Town.
- Hoekstra, J. M.; Boucher, T. M.; Ricketts, T. H.; Roberts, C. Confronting a biome crisis: global disparities of habitat loss and protection. Ecol. Let. 2005, 8(1), 23-29. [CrossRef]
- Isacch, J. P.; Maceira, N. O.; Bo, M. S.; Demaría, M. R.; Peluc, S. Bird-habitat relationship in semi-arid natural grasslands and exotic pastures in the west pampas of Argentina. J. Arid Environ. 2005, 62(2), 267-283. [CrossRef]
- Jacoboski, L. I.; Paulsen, R. K.; Hartz, S. M. Bird-grassland associations in protected and non-protected areas in southern Brazil. Persp. Ecol. Conserv. 2017, 15(2), 109-114. [CrossRef]
- Kopij, G. Distribution and abundance of diurnal raptors in the Cold Highveld Grassland of South Africa. J. Afr. Raptor Biol. 1996, 11(1/2), 7-10.
- Kopij, G. Quantitative studies on birds in the Willem Pretorius Game Reserve. Mirafra 1997, 14(1/2), 17-21.
- Kopij, G. The birds of Bloemspruit, Bloemfontein. Mirafra 1997, 14(1/2), 8-12.
- Kopij, G. Birds of Wolluterskop Nature Reserve, Bethelehem, South Africa. Mirafra (Bloemfontein), 1999, 16 (2), 15-21.
- Kopij, G. Bird communities of some typical microhabitats in the Cymbopogon-Themeda Veld of the Free State, South Africa. Mirafra 2000, 17(4), 45-50.
- Kopij, G. Birds of the western part of the Dewetsdorp district, Free State. Mirafra, 2001, 18 (2): 1-16.
- Kopij, G. The birds of Sehlabathebe National Park, Lesotho. Koedoe 2002, 45(1), 65-78. [CrossRef]
- Kopij, G. Birds of the Bethlehem Highlands, South Africa. Mirafra 2002, 19(2): 25-48.
- Kopij G. Breeding density of Fiscal Shrike (Lanius collaris). Biol. Lett. 2004, 41(2), 77-85.
- Kopij, G. Bird communities of suburb habitats in South African Highveld during the wet and dry season. Zesz. nauk. AR Wroclaw 2004, 50(488), 205-211.
- Kopij, G. Avian assemblages in the area around Thabana Ntlenyana, the highest peak of Southern Africa, 2010. Zesz. nauk. AR Wroclaw 2010, 60(577), 67-75.
- Kopij, G. Die Vogelgemeinschaft des afromontanen Themeda-Festuca Graslandes der endemitenreichen Drakensberg-Region, Südafrica. Orn. Mit. 2014, 66(3/4), 99-107.
- Kopij, G. Avian assemblages in Afro-mountain and Alti-mountain Grasslands in the endemic Maloti/Drakensberg region of Lesotho. Zool. Ecol., 2015a, 25(4), 319-326. [CrossRef]
- Kopij, G. Avian Diversity Along an Altitudinal Gradient in Highveld/Drakensberg Grasslands. Vest. Zool., 2015, 49(4), 351-360. [CrossRef]
- Kopij, G. Avian diversity in an urbanized South African grassland. Zool. Ecol. 2015, 25(2), 87-100. [CrossRef]
- Kopij, G. Avian assemblages in lowland and foothill agro-ecosystem in Lesotho. Acta Biol. Sibir., 4(4), 81-88. Vest. Zool. 2018, 53(2), 155–164.
- Kopij, G. Birds of the Bloemfontein area, Free State Province, South Africa, during the years 1977-2000: an overview. Acta zool. cracov. 2019, 62(2), 41-76. [CrossRef]
- Kopij, G. Population Densities and Community Structure of Birds Breeding in a Suburban Wooded Grassland in the Highveld of Lesotho. Vest. Zool., 2019, 53(2), 155–164. [CrossRef]
- Krook, K.; Bond, W. J.; Hockey, P. A. The effect of grassland shifts on the avifauna of a South African savanna. Ostrich 2007, 78(2), 271-279. [CrossRef]
- MacMaster, D. G.; Dervies, J. H.; Davis, S. K. Grassland birds nesting in haylandsof southern Seskatchewan: landscape infuluences and conservation priorities. J. Wildl. Mgmt. 2005, 69, 211-221.
- Maphisa, D. H.; Smit-Robinson, H.; Underhill, L. G.; Altwegg, R. Drivers of bird species richness within moist high-altitude grasslands in eastern South Africa. PloS one 2016, 11(10), e0162609. [CrossRef]
- Maphisa, D. H.; Smit-Robinson, H.; Underhill, L. G.; Altwegg, R. Management factors affecting densities of common grassland birds of high elevation grasslands of eastern South Africa: Ingula as a case study. Avian Res. 2017, 8(1), 5. [CrossRef]
- McCracken, J. D. Where the Bobolinks roam: the plight of North America’s grassland birds. Biodiversity 2005, 6(3), 20-29. [CrossRef]
- Pavey, C. R.; Nano, C. E. M. Bird assemblages of arid Australia: vegetation patterns have a greater effect than disturbance and resource pulses. J. Arid Environ. 2009, 73(6-7), 634-642. [CrossRef]
- Pärtel, M.; Bruun, H. H.; Sammul, M. Biodiversity in temperate European grasslands: origin and conservation, 2005.
- Peterjohn, B. G.; Sauer, J. R. Population status of North American grassland birds from the North American breeding bird survey. Stud. Avian Biol. 1999, 19, 27-44.
- Rutherford, M. C.; Mucina, L.; Powrie, L. W. Biomes and Bioregions of Southern Africa. Sterlizia 2006, 19, 1-51.
- SANBI. Grazing and Burning Guidelines: Managing Grasslands for Biodiversity and Livestock Production. South African National Biodiversity Institute, Pretoria, 2014.
- Smith, R. L. Ecology and Field Biology, 5th ed. Addison-Wesley Educational Publishers, Menlo Park, CA (U.S.A.), 1996.
- Snow, D. W.; Perrins, C. M. The Birds of the Western Palearctic. Oxford Univ Press, Oxford (UK), 1998.
- Squires, V. R.; Dengler, J.; Feng, H.; Hua, L. Grasslands of the World. CRC Press, 2018.
- Sutherland, W. J. Ecological Census Techniques: a handbook. Cambridge University Press, Cambridge (U.K.), 1996.
- Thomas, V.; Grant, R. Highveld and the Drakensberg. Jacana, Johannesburg, 2004.
- Vickery, P. D.; Herkert, J. R. (eds.). Ecology and conservation of grassland birds of the Western Hemisphere. Stud. Avian Biol. 1999, 19, 1-299.
- Vickery, P. D.; Tubaro, P. L.; Maria Cardosa da Silva, J. et al. Introduction: Conservation of Grassland Birds in the Western Hemisphere. Stud. Avian Biol. 1999, 19(1), 4.
- Wiens, J. A. Pattern and process in grassland bird communities. Ecol. Mon. 1973, 43(2), 237-270. [CrossRef]
- Wiens, J. A. Climatic instability and the ‘ecological saturation’ of bird communities in North American grasslands. Condor 1974, 76, 385-400. [CrossRef]
Figure 2.
Proportions of main feeding guilds in three grassland types in southern Africa.
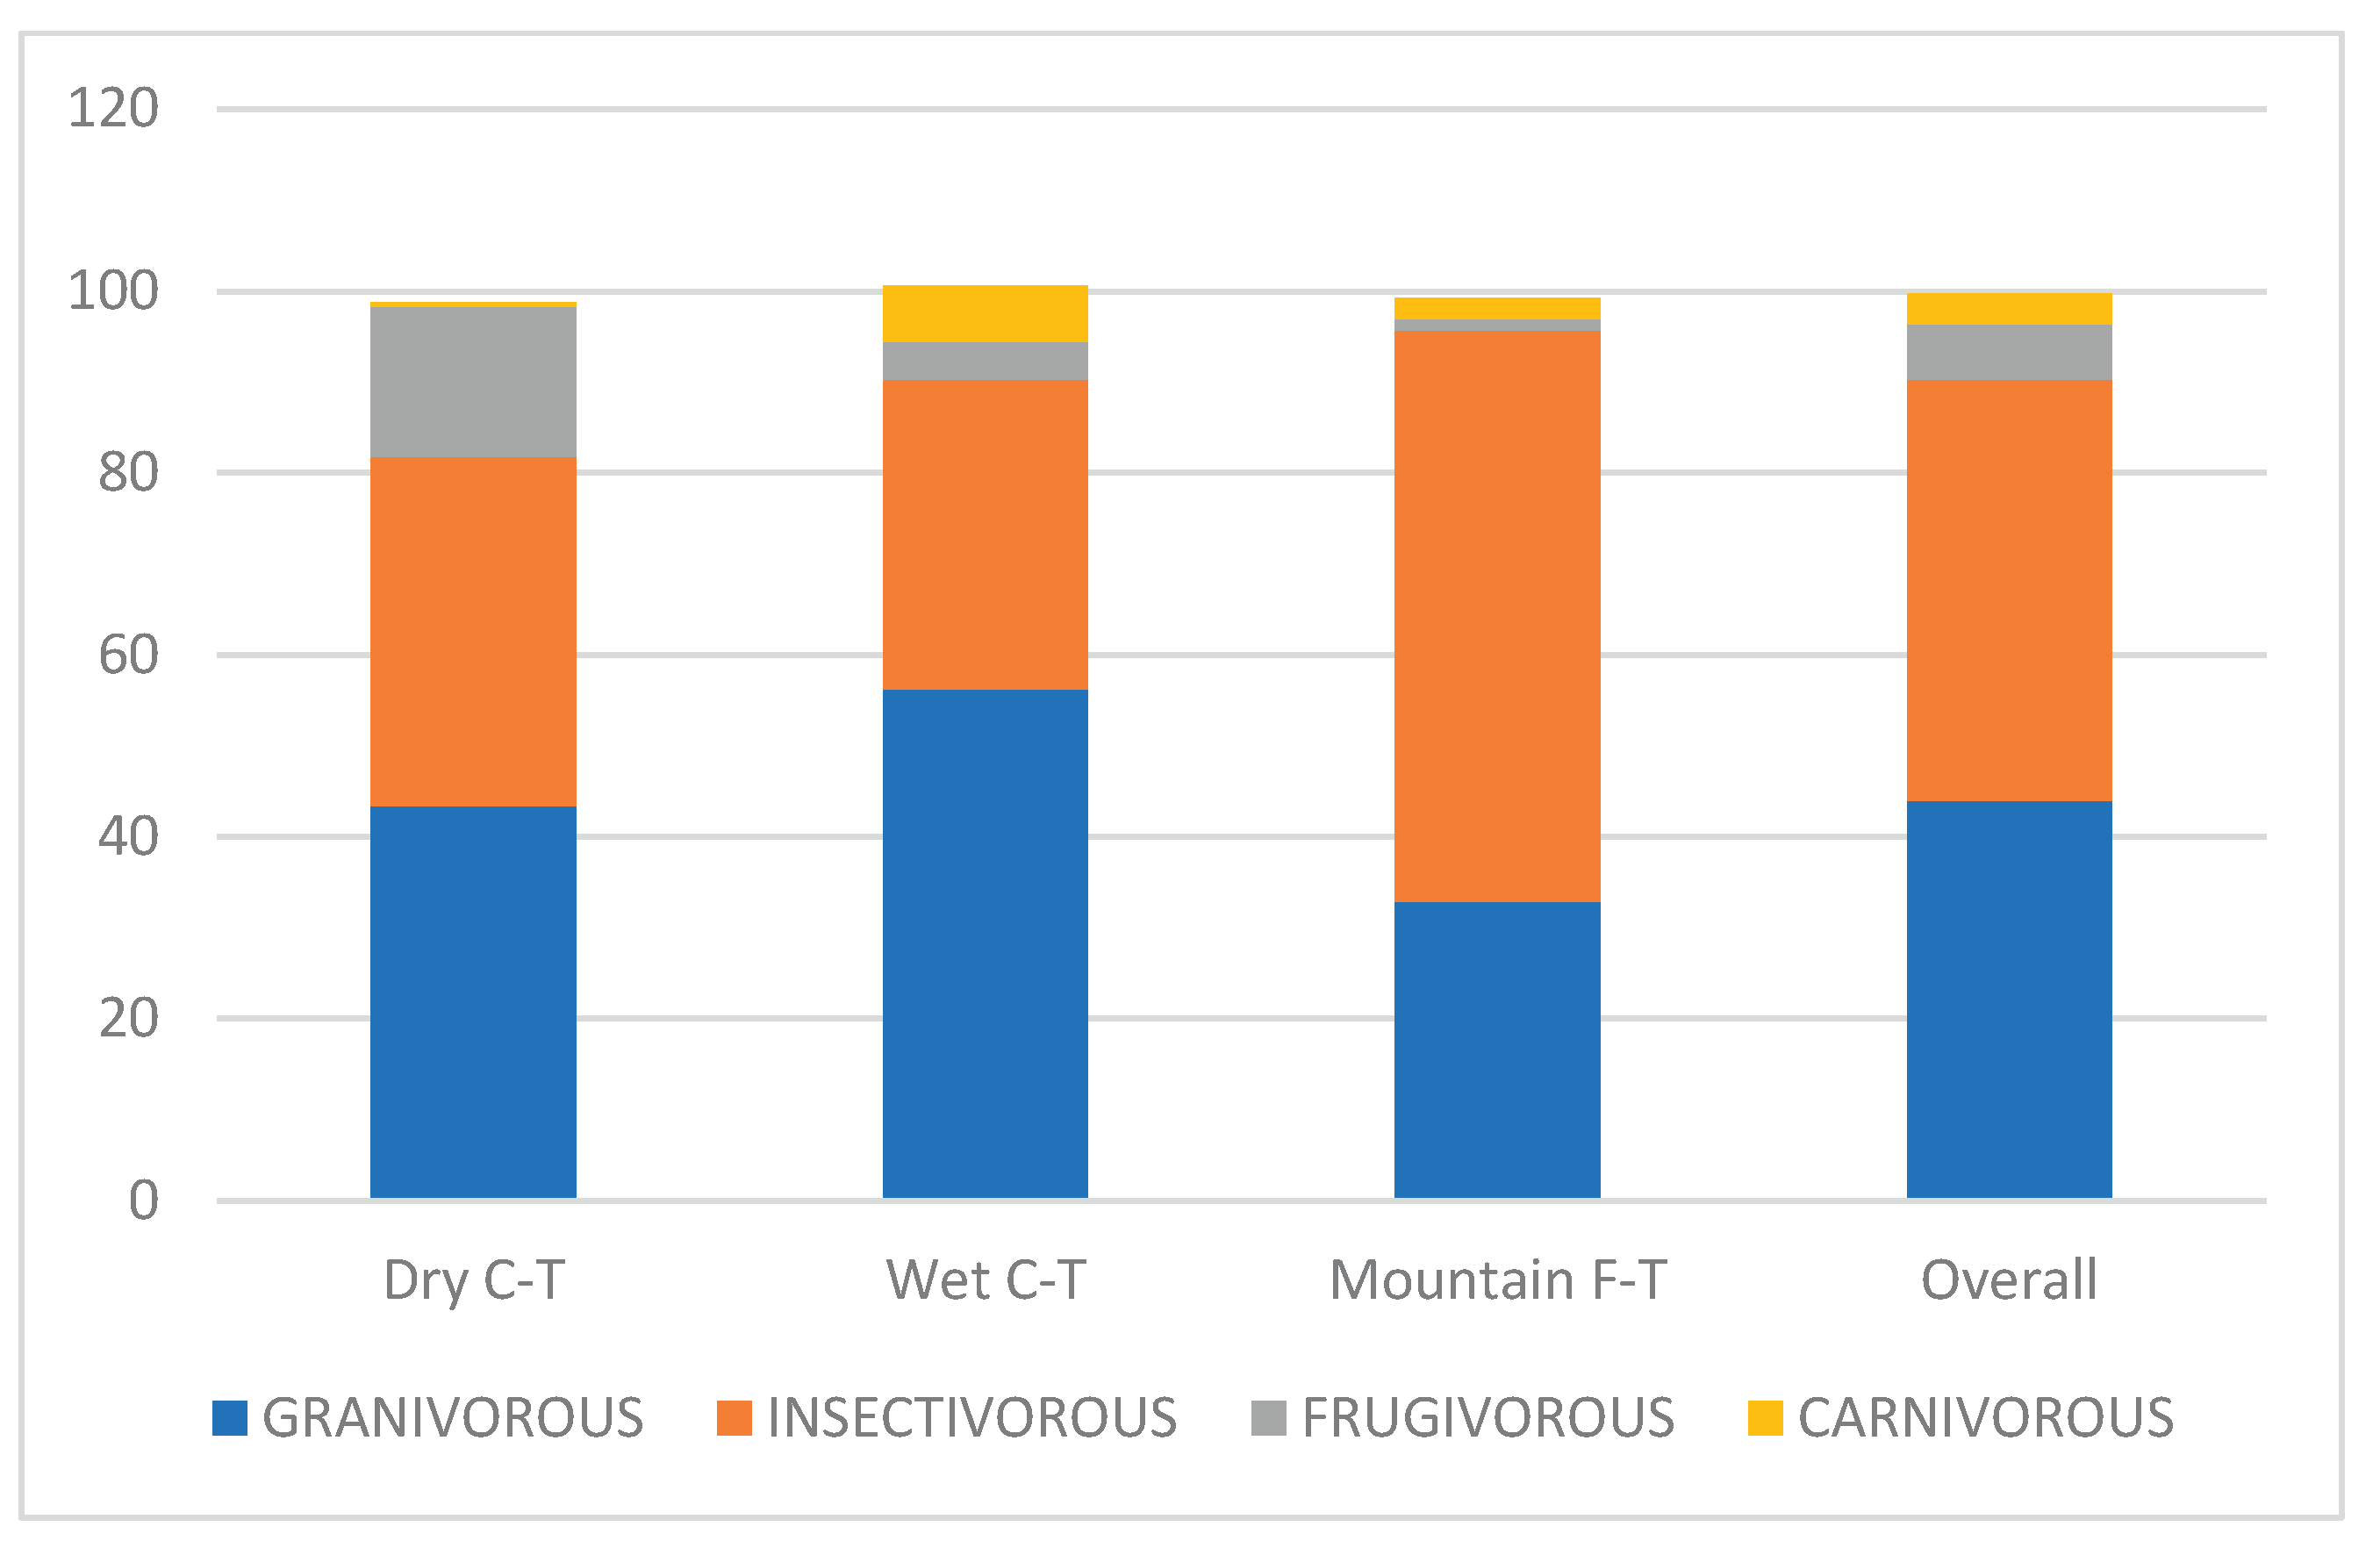
Figure 3.
Proportions of main foraging guilds in three grassland types in southern Africa.
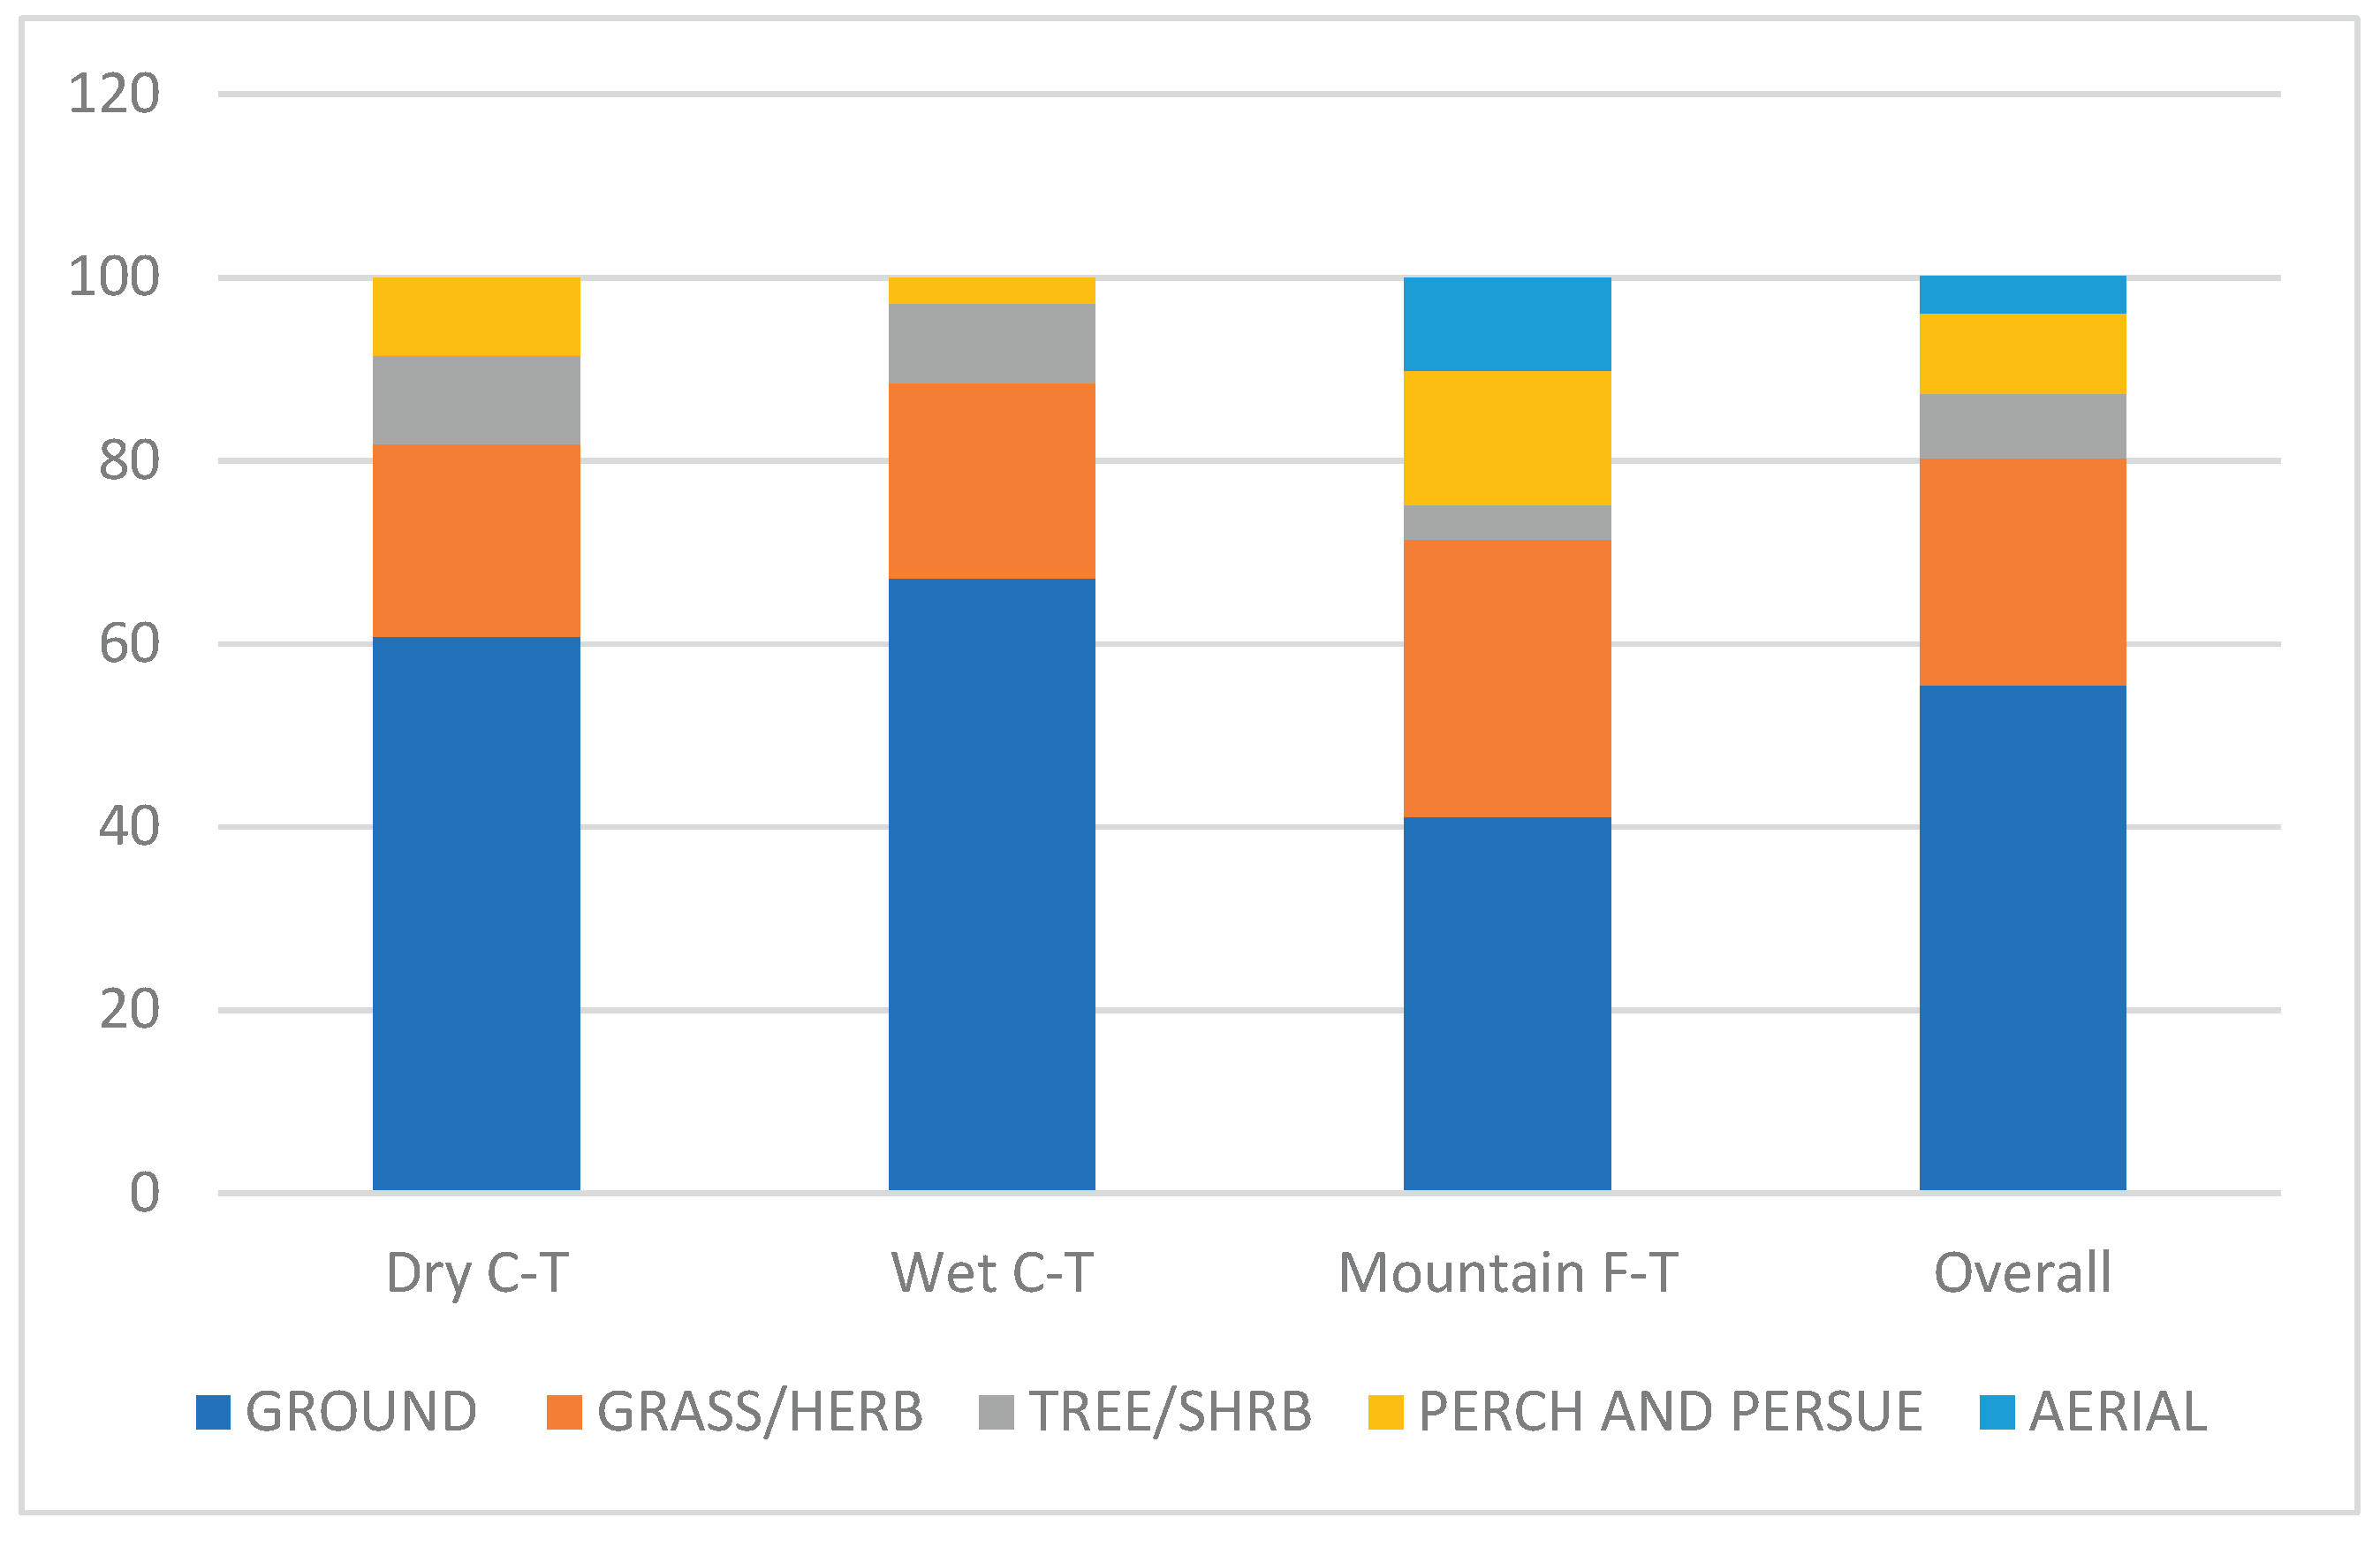
Figure 4.
Proportions of main nesting guilds in three grassland types in southern Africa.
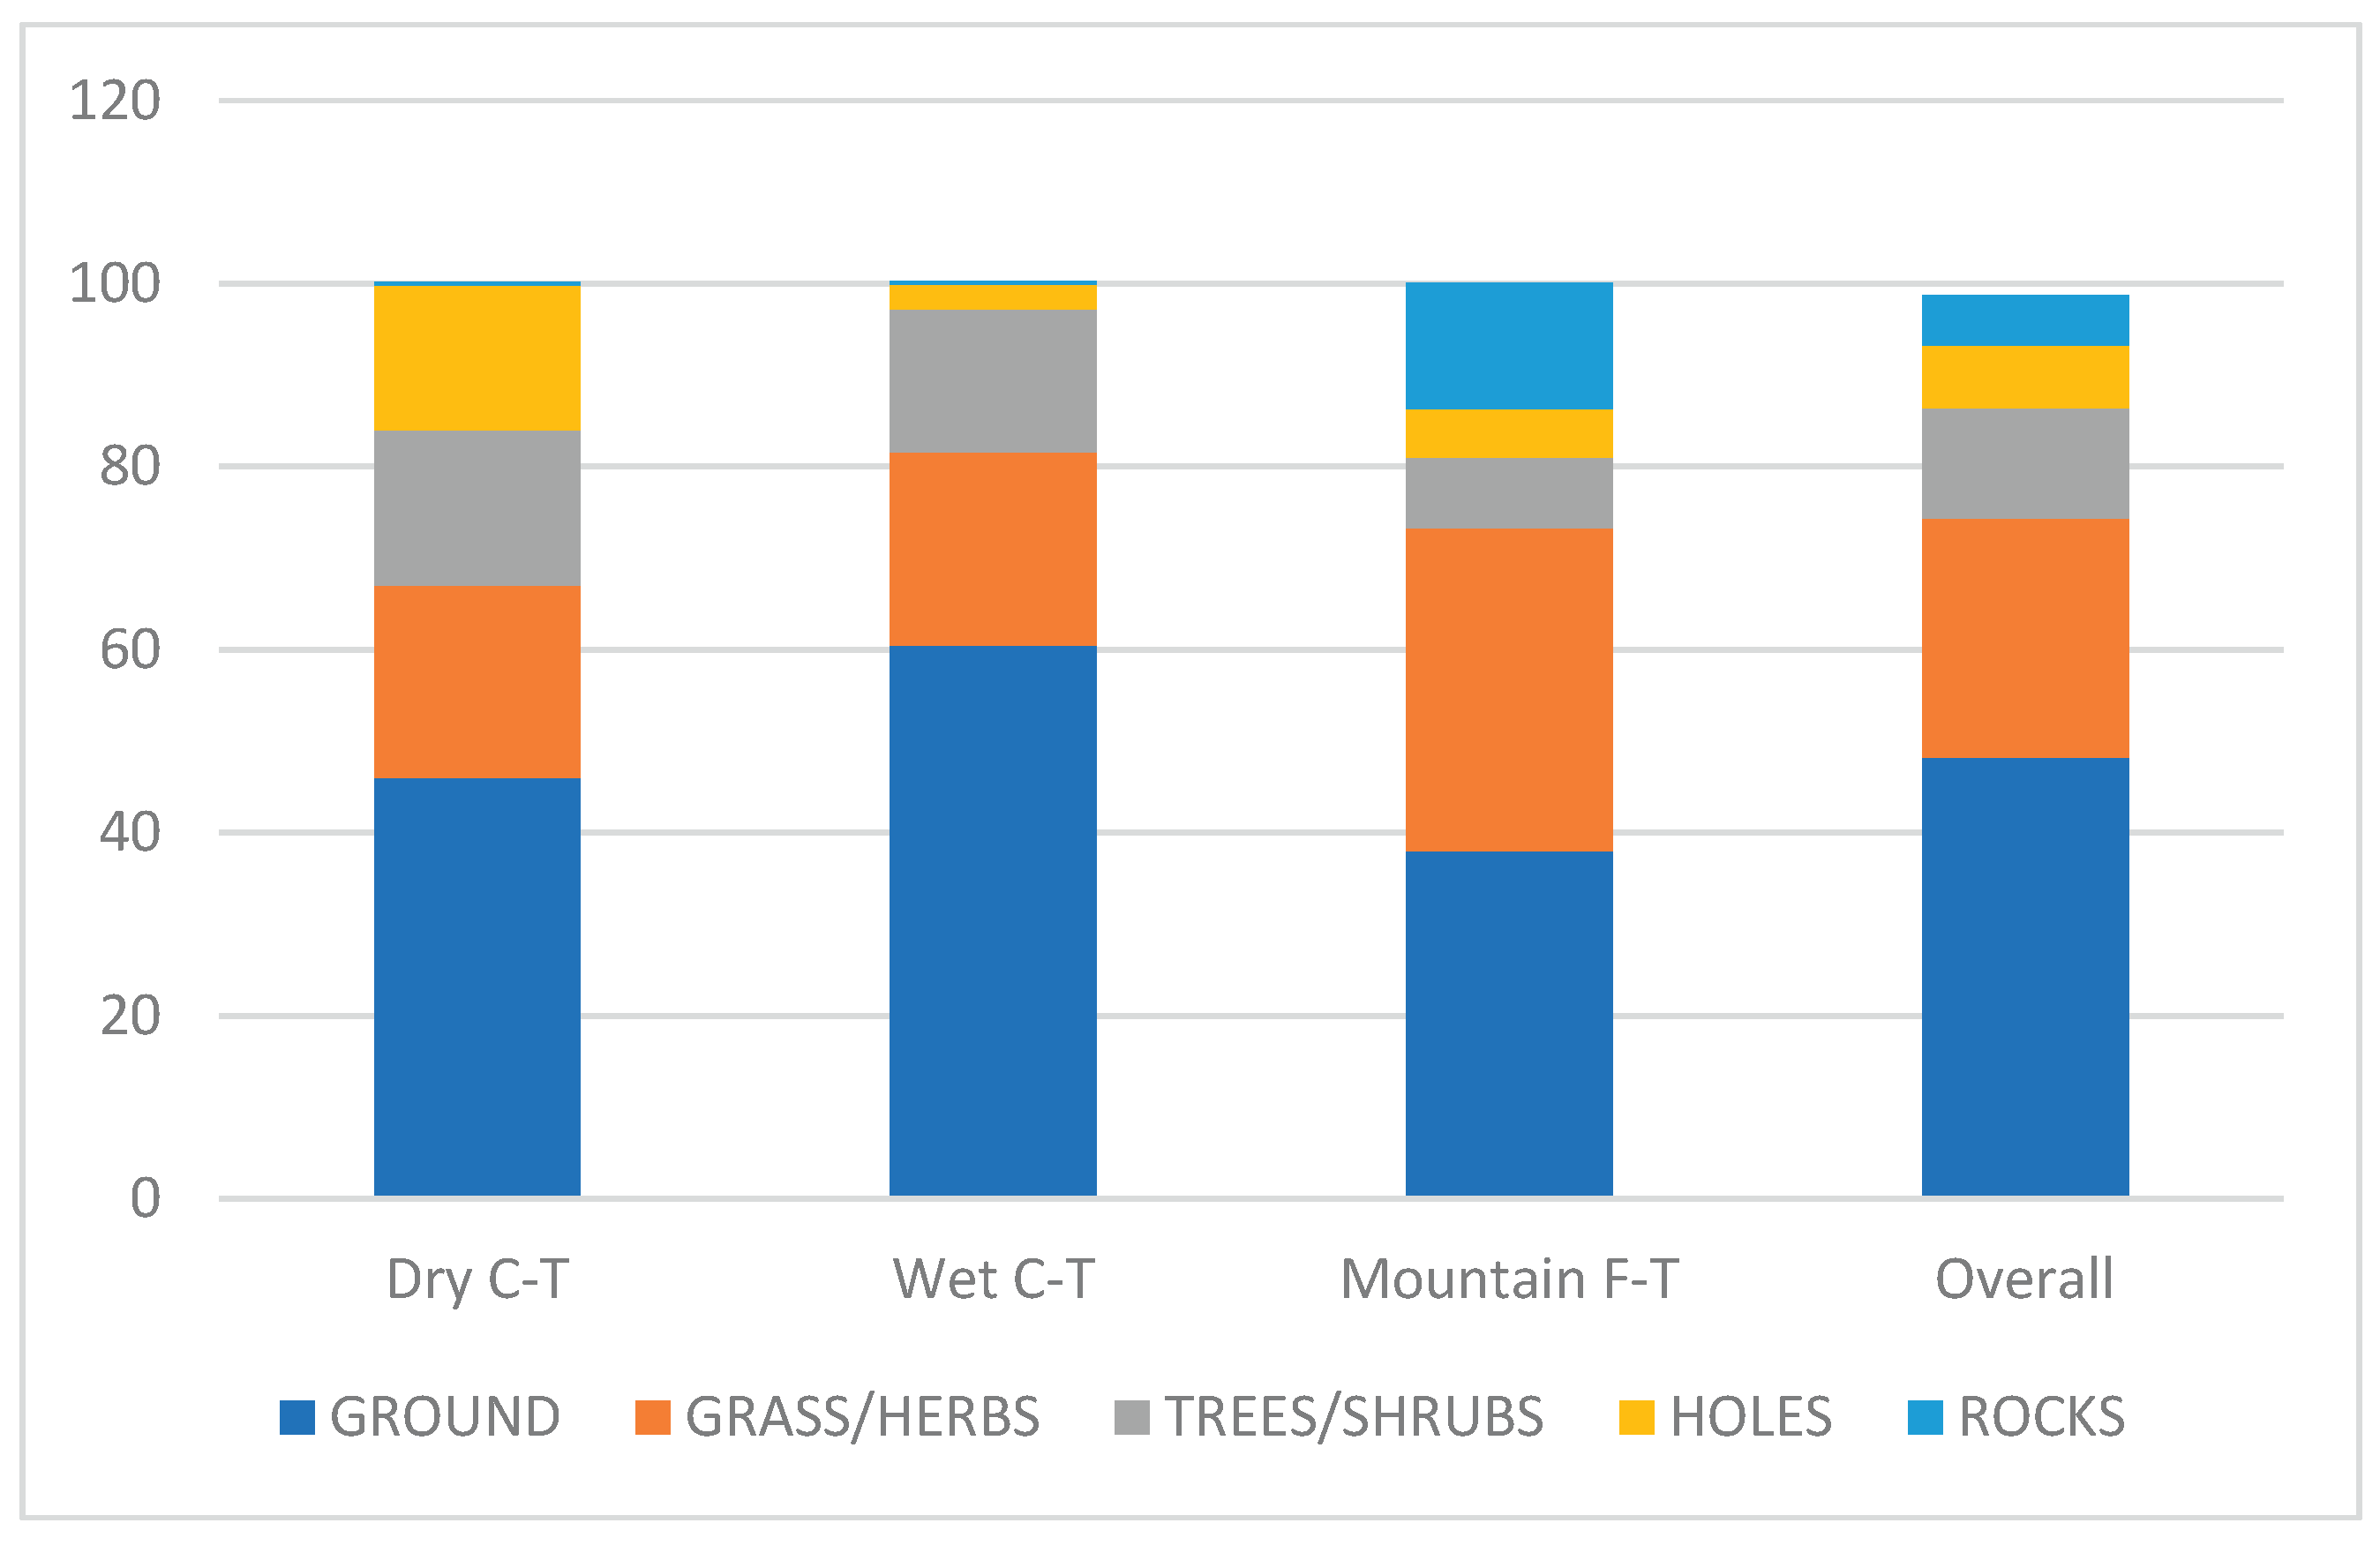
Table 3.
Sørensen index (left diagonal) and statistical differences (x2-test) between the numbers of species (right diagonal).
Table 3.
Sørensen index (left diagonal) and statistical differences (x2-test) between the numbers of species (right diagonal).
| A | B | C | |
| A | x | 0.26 | 0.12 |
| B | 1.54 | x | 0.07 |
| C | 18.53* | 0.05 | x |
Disclaimer/Publisher’s Note: The statements, opinions and data contained in all publications are solely those of the individual author(s) and contributor(s) and not of MDPI and/or the editor(s). MDPI and/or the editor(s) disclaim responsibility for any injury to people or property resulting from any ideas, methods, instructions or products referred to in the content. |
© 2025 by the authors. Licensee MDPI, Basel, Switzerland. This article is an open access article distributed under the terms and conditions of the Creative Commons Attribution (CC BY) license (http://creativecommons.org/licenses/by/4.0/).
Copyright: This open access article is published under a Creative Commons CC BY 4.0 license, which permit the free download, distribution, and reuse, provided that the author and preprint are cited in any reuse.


