Preprint
Article

This version is not peer-reviewed.

Tecno-Nutritional Improvement of Gluten-Free Breads Using Spontaneous Sourdough of Quinoa and Buckwheat Flours

A peer-reviewed article of this preprint also exists.

Submitted:

13 October 2025

Posted:

14 October 2025

You are already at the latest version

Abstract

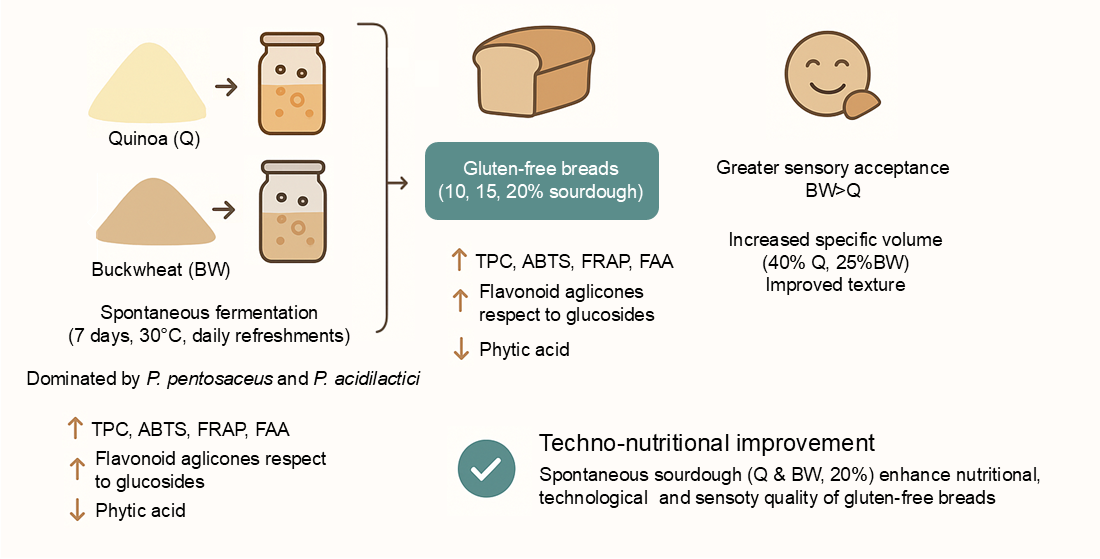
The aim of this study was to evaluate the effect of spontaneous sourdoughs on the quality of gluten-free breads formulated with quinoa (Q) and buckwheat (BW) flours, in order to improve their nutritional, technological, and sensory attributes. The microbiota of the sourdoughs was dominated by Pediococcus pentosaceus and P. acidilactici. Total polyphenols, antioxidant capacity, phytic acid, and free amino acids were determined in sourdoughs (before and after fermentation), and breads. Breads were prepared with three levels of sourdough, 10%, 15%, and 20%. Bread specific volume, crumb firmness, staling rate, crumb structure, and consumer acceptability were evaluated. Sourdoughs showed higher phenolic compound contents compared to the unfermented control, and breads with sourdough contained on average 67% more phenolics than control breads. Antioxidant activity also increased, particularly in BW sourdough samples. Phytic acid decreased in both sourdoughs and breads, while free amino acids increased. Breads with Q and BW sourdoughs exhibited 40% and 25% higher specific volume, respectively, than the control, along with lower firmness and slower staling. BW sourdough breads reached the highest overall consumer acceptance. Incorporation of Q and BW spontaneous sourdoughs, especially at 20% substitution, significantly improved the nutritional, technological, and sensory quality of gluten-free breads.

Keywords: 
;  ;  ;  ;  

1. Introduction

Pseudocereals are dicotyledonous plants that produce grains with an appearance and starch content similar to those of true cereals (grasses) [1]. Grains are milled into flours that are used in the production of pasta and baked goods, yet they are naturally gluten-free. The most popular pseudocereals are amaranth (Amaranthus spp.), quinoa (Chenopodium quinoa Willd), and buckwheat (Fagopyrum esculentum Moench and Fagopyrum tataricum (L.) Gaertn) [2]. Quinoa cultivation began approximately 7,000 years ago in the Peruvian highlands of Ayacucho [3], while buckwheat originated in southwestern China, outside the major agricultural centers associated with rice and millet [4].
In recent decades, the production and consumption of these crops have steadily increased [5], largely due to their potential health benefits, as they are rich in polyphenols, vitamins, phytosterols, betalains, minerals, dietary fiber, lignans, high-quality proteins, and unsaturated fatty acids [1]. Additionally, the use of pseudocereals contributes to agricultural diversification by expanding crop rotation options and increasing the availability and diversity of food species. This is especially relevant considering that just four crops—wheat, rice, potatoes, and maize—account for approximately 60% of global calorie intake, while 30 crops supply 95% [6].
Pseudocereals also offer a clear advantage for the formulation of gluten-free baked goods. Demand for such products continues to rise each year, driven both by dietary choices—often influenced by the perception that gluten is an unsafe ingredient—and by medical needs, such as celiac disease, wheat allergy, or non-celiac gluten sensitivity. Altogether, it is estimated that up to 7% of the global population is affected by these conditions [7]. In this context, expanding the study of gluten-free grains becomes essential.
Sourdough has a long-standing tradition in breadmaking. It is traditionally prepared by mixing flour and water and allowing the autochthonous microbiota present in the raw materials to develop under appropriate time and temperature conditions. The process requires regular refreshments (backsloppings), typically every 16 to 24 hours, over a period of 7 to 10 days [8]. This is the case for spontaneous sourdough, as opposed to inoculated sourdoughs, in which selected microorganisms are deliberately added.
During spontaneous fermentation two main types of microorganisms coexist: lactic acid bacteria (LAB) and yeasts. The metabolic interactions between these microorganisms influence the technological functionality of the dough, improving both the sensory quality and nutritional properties of the final bread. Reported effects include increased loaf volume, improved texture, reduced levels of antinutritional factors such as phytic acid, and enhanced levels of bioactive compounds [9]. LAB, in particular, acidifies the dough and activates endogenous flour enzymes—such as xylanases, proteases, phytases, and peptidases—as well as other enzymes that transform amino acids. These transformations not only generate bioactive compounds, but also flavor precursors that directly affect the bread's organoleptic characteristics.
It has been highlighted both the need and the opportunity to improve the sensory properties of gluten-free breads, as these products are often described as having a flat appearance, pale crust, crumbly texture, high staling rate, and bland flavor [10]. In this context, sourdough fermentation is a promising strategy to enhance the nutritional and sensory qualities of gluten-free breads. Therefore, the aim of this study was to evaluate the effect of spontaneous sourdoughs on the quality of gluten-free breads formulated with quinoa and buckwheat flours, in order to improve their nutritional profile as well as their technological and sensory quality.

2. Materials and Methods

2.1. Materials

Refined rice flour was obtained from the local market (Córdoba, Argentina), while quinoa and buckwheat grains were supplied by local producers. Quinoa grains were washed then dried to remove saponins. Then, both grains were milled using a hammer mill equipped with a 0.5 mm screen (Supplementary material, Table S1).

2.2. Preparation of Quinoa and Buckwheat Sourdoughs

Sourdoughs were prepared by mixing water and flour to achieve a dough yield (dough weight/flour weight × 100) of 200 for quinoa and 300 for buckwheat, based on preliminary bread quality results. The doughs were mixed manually and fermented at 30°C for 24 h, with continuous back-slopping for 7 days.

2.3. Sourdough Characterisation

2.3.1. LAB and Yeast Identification

Colonies from each sourdough -13 from Q and 14 from BW sourdoughs- were isolated in duplicate at the end of fermentation process (7 days) and identified by matrix-assisted laser desorption ionization time-of-flight mass spectrometry (MALDI-TOF MS). A colony growth was smeared on the MALDI target and overlaid with 1.5 µl of formic acid (70% w/v), air dried and overlaid with 1 µl of matrix (α-cyano-4-hydroxycinnamic acid). Mass spectra were acquired using the MALDI-TOF MS spectrometer in positive mode (Microflex, Bruker Daltonics). A bacterial test standard was used for instrument calibration. Each sample was analyzed in duplicate and mass spectra were analyzed in the m/z range of 2000 to 20000. and strains were identified using the MALDI Biotyper v.3.0 library and the MALDI Biotyper v.3.1 software. The cutoff score used for identification was ≥1.7 at the species level.

2.3.2. pH, Total Titratable Acidity (TTA) and Cell Count

Daily measurements of pH and total titratable acidity (TTA) were performed. pH was measured using a pHmeter Testo 205 (Lenzkirch, Germany) with a food penetration probe. TTA was determined after homogenization of 10 g of dough with 90 mL of distilled water, and expressed as the amount of 0.1M NaOH needed to reach the value of pH of 8.3, phenolphthalein (2.5% w/v in ethanol) was used as indicator.
LAB were enumerated by plating serial dilutions of doughs (days 1, 3 and 7) into MRS agar media. Plates were incubated at 37 °C for 24 h.
A fraction of sourdough before (day 0) and after (day 7) fermentation was freeze-dried for further analyses.

2.4. Breadmaking

The formulation used for gluten-free breads is shown in Supplementary material (Table S2). Ingredients were mixed in a planetary mixer (Peabody SmartChef, Argentina) for 1 min at low speed and 2 min at high speed. The dough was proofed for 30 min at 30 °C and 96% RH in a fermentation chamber. It was then mixed again for 1 min at low speed, 60 g portions were placed in individual aluminum molds, and fermentation continued for 40 min under the same conditions. After fermentation, the loaves were baked for 20 min at 180 °C (Beta 107 IPA - Pauna, Argentina). Breads were then cooled for 2 h before technological analysis. A fraction of the breads was frozen at −40 °C and freeze-dried for further analyses. Breadmaking was performed in duplicate.
Different controls were considered: (1) bread without sourdough (C), (2) bread with chemically acidified dough (ChA) (pH 3.5 with a mixture of lactic acid:acetic acid in a 4:1 molar ratio), and (3) bread with unfermented quinoa sourdough (Q-C) and unfermented buckwheat sourdough (BW-C).

2.5. Evaluation of Bread Technological Quality

Bread volume was determined by rapeseed displacement. Specific bread volume (SBV) was calculated as the ratio of volume to weight (cm³ g⁻¹). To evaluate crumb firmness, two breads of each batch were cut longitudinally, and two 15-mm-thick slices were taken from the central part of each loaf. Firmness was measured using an Instron universal testing machine (Instron, USA) with a 25 mm diameter probe, at a speed of 5 mm/s and 40% compression. Breads were stored in sealed plastic bags at 25 °C, and firmness was evaluated after 2, 24 and 72 h. The staling rate was calculated as the slope of the regression line obtained from the three measurement points [11]. Crumb structure was analyzed by obtaining digital images of bread slices 2 h after baking using a scanner (HP Scanjet G3010, USA) at a resolution of 800 dpi. Images were converted to 8-bit grayscale and binarized using the default threshold in ImageJ software (National Institutes of Health, USA). A pixel-to-centimeter scale was calibrated with a ruler in each image. The crumb area was selected as the region of interest, and the Analyze Particles function was used to quantify total air area (%), number of pores/mm², and average pore size (mm²) [11].

2.6. Nutritional Quality

2.6.1. Total Polyphenol Extraction

For polyphenol extraction, 0.5 g of each sample (flours, freeze-dried Q and BW sourdoughs, and freeze-dried breads) were weighed, and 5 ml of HCl 1.2 M:methanol (1:1) were added. The mixture was shaken for 2 h at room temperature in the dark, then it was centrifuged at 8000 × g for 30 min at 15 °C, and the supernatants were recovered. The whole process was repeated once, and the supernatants were then combined. Duplicate extractions were conducted from two independent samples (two distinct freeze-dried sourdoughs and two loaves from different breadmaking batches).

2.6.2. Total Polyphenol Content (TPC) and Antioxidant Capacity

TPC in the extracts was determined by the Folin–Ciocalteu method adapted by [12]. Absorbance was measured at 765 nm with a spectrophotometer (UV-Visible Jasco V-730, Japan). Quantification was performed using a calibration curve with gallic acid. The ABTS radical scavenging capacity was determined according to Re et al. [13], and ferric reducing activity was determined by the FRAP method according to Pulido et al. [14]. In both methods Trolox was used as a standard. Absorbance was measured at 734 and 593 nm, respectively, with a spectrophotometer. Determinations were performed in duplicate.

2.6.3. Identification and Quantification of Phenolic Compounds

The characterization of the phenolic compounds present in the samples was carried out by HPLC-DAD-MS/MS, according to the procedure described by Lingua et al. (2018). For this purpose, an Agilent 1200 Series LC system (Agilent, Santa Clara, USA) was employed, equipped with a diode array detector (DAD, Agilent 1200 Series) and coupled to a mass spectrometer (Micro-QTOF II; Bruker Daltonics, Billerica, MA, USA) through an electrospray ionization (ESI) interface. The identification of polyphenols was established based on retention time, exact molecular mass, and fragmentation patterns obtained from MS and MS/MS, and was compared with authentic standards whenever available. In cases where reference standards could not be obtained, compounds were tentatively identified using accurate MS and MS/MS signals, together with information reported in the literature. Quantification was performed by means of external calibration curves prepared with available phenolic standards. A calibration mixture was prepared at different concentrations within this range (0.025–100 ppm), including the following standards: p-coumaric acid, gallic acid, isoquercetin, quercetin, and catechin. When the exact standard was not accessible, a structurally related compound was used as the reference for quantification. Limits of detection (LOD) and quantification (LOQ) were experimentally derived from the calibration curves. LOQ values were between 0.04 and 0.54 ppm, while LOD values ranged from 0.01 to 0.16 ppm. All determinations were carried out in triplicate.

2.6.4. Free Amino Acid Content (FAA)

A total of 0.25 g of sample (flours, freeze-dried sourdoughs, or freeze-dried breads) was mixed with 25 ml of water and shaken for 30 min at room temperature. The mixture was then centrifuged at 1000 ×g for 6 min. Finally, 400 μl of the supernatant were used to determine free amino acids following the o-phthaldialdehyde (OPA) method [15]. Quantification was carried out using a calibration curve with serine as a standard.

2.6.5. Phytic Acid Content (PA)

PA content (flours, freeze-dried sourdoughs, and freeze-dried breads) was determined according to the method developed by [16]. Absorbance was measured at 540 nm with a spectrophotometer. Results were quantified using a calibration curve prepared with phytic acid sodium salt.

2.7. Sensory Analysis of Breads

Control bread without sourdough (C), bread with 20% Q sourdough (Q20), and bread with 20% BW sourdough (BW20), were subjected to sensory evaluation to determine consumer acceptance and preference. This set of samples was randomly presented to a panel of 70 untrained consumers for evaluation. The panel consisted of 43% female and 57% male participants, with an average age of 24 years. All participants were adults who provided written informed consent prior to participation in the study. A 7-point hedonic scale was used, where 1 corresponded to Dislike very much and 7 to Like very much, for the following parameters: crumb appearance, color, odor, flavor, texture, and overall preference.

2.8. Statistical Analysis

Results are expressed as the mean of at least two replicates. Data were analyzed by ANOVA, and results were compared using Fisher’s test at a significance level of 0.05. Sensory analysis was evaluated using the Friedman test. Correlation between measured parameters was evaluated by Pearson’s test (p < 0.05). All analyses were performed using the statistical software INFOSTAT.

3. Results

3.1. Sourdough Characterization

Pediococcus pentosaceus was the most representative species in both sourdoughs, followed by Pediococcus acidilactici. Lactiplanbacillus plantarum was also found whereas Limosilactobacillus fermentum was found in only BW and Latilactobacillus curvatus in Q. Saccharomyces cerevisiae was the only yeast present in both sourdoughs (Table S3).
Before fermentation, Q had higher acidity (measured both by pH and TTA) than BW (Table S4). From day 1 onward, a significant decrease in pH was observed, with reductions of 31.3% in Q and 38.7% in BW compared to day 0, the decrease being more pronounced in BW. This trend continued throughout fermentation, with a plateau from day 3 and a marked difference between sourdoughs toward the end. As expected, TTA values showed the same behavior, with significantly higher acidity in BW sourdough throughout fermentation. Similarly, Q sourdoughs showed a higher initial cell count than BW, but by the end of fermentation BW sourdoughs had a significantly higher cell count. As expected, negative correlations were found between pH and TTA (r = –0.93, p < 0.05) and between pH and cell growth (r = -0.89, p < 0.05). Consequently, bacterial growth was significantly higher in BW than in Q.

3.2. Bioactive and Nutritional Compounds

3.2.1. Total Polyphenol Content and Antioxidant Activity

Unfermented BW sourdough (BW-UnF) showed higher TPC concentration and antioxidant activity than quinoa unfermented sourdough (Q-UnF), as shown in Table 1. Q-F experienced a 190% increase in TPC compared to Q-UnF. On the other hand, TPC concentration in BW-F increased 24% compared to BW-UnF. In breads, sourdough addition resulted in higher TPC and antioxidant capacity, and the rise was proportional to the level of sourdough substitution. Q-20 showed 65.75% more TPC than the Q-C; similarly, BW-20 showed a 69.1% increase compared to BW-C. In turn, BW-20 had 75.6% more TPC than Q-20. Consistently, FRAP values increased significantly after fermentation in both Q and BW sourdoughs, rising by 30.1% in Q-F compared to Q-UnF and by 45.1% in BW-F compared to BW-UnF. A similar trend was observed in breads, where sourdough addition led to increases of 60.3% and 75.9% in Q-20 and BW-20, respectively, compared to their controls (Q-C and BW-C). ABTS also increased after fermentation, showing a 214.2% rise for Q and 131% for BW. In breads, a 20% substitution with Q sourdough resulted in a 92% increase, with 30.8% gain between 10% and 20% substitution. For BW, a 140% increase was observed at 20% substitution compared to BW-C, with a 37.3% rise between 10% and 20% substitution levels. Notably, BW-20 breads exhibited more than twice the activity of Q-20 breads.
A significant correlation was found between TPC and ABTS (r = 0.81, p < 0.05) and between TPC and FRAP (r = 0.68, p < 0.05) in sourdoughs; similar correlations were observed in breads (r = 0.87, p < 0.05; r = 0.79, p < 0.05, respectively). Q sourdoughs showed a greater increase in TPC and antioxidant activity than BW sourdoughs, whereas in breads, BW sourdoughs led to higher TPC, and in terms of concentration, breads with BW sourdough always showed higher values. In both breads, higher substitution levels resulted in greater increases in TPC content and antioxidant activity.

3.2.2. Polyphenol Profile

In BW, a total of 14 phenolic compounds (PC) were identified (Table S5). The flavonol group was the most abundant family, accounting for 78.3% in the unfermented sourdough and 73.9% in fermented sourdough (Table 2). The main compounds in BW-UnF were rutin and isoquercetin, representing 32.5% and 33.4% of the total PCs, respectively. In BW-F, quercetin represented 64.2%, isoquercetin 6.6%, and rutin 1.73%. Within the flavanols, catechin and epicatechin stood out, accounting for 9.7% and 6.1% of the total in unfermented, and 15.8% and 3.9% in fermented sourdoughs, respectively.
In quinoa, 8 compounds were detected. In Q-UnF, 95.3% of the phenolic compounds corresponded to flavonols, with quercetin-apiofuranoside, quercetin glucuronide, and rutin being the most abundant (38.2%, 23.4%, and 13.3%, respectively). In Q-F, flavonols represented 85.4% of the phenolic compounds, with the most abundant being rutin, quercetin, and quercetin-apiofuranoside (34.3%, 26.3%, and 16.1%, respectively). In addition, the presence of p-coumaric acid was notable in Q-F (14.6%).
During buckwheat fermentation, a significant increase in PC content was observed, from 159.6 µg/g in flour to 332.6 µg/g in sourdough. In turn, an important increase in quercetin and catechin was observed, along with a decrease in isoquercetin, rutin, and kaempferol glucoside.
On the other hand, during quinoa fermentation, the content of phenolic compounds decreased from 26.2 µg/g in flour to 20.5 µg/g in sourdough. There was a decrease in quercetin glucuronide (from 6.12 µg/g to 0.57 µg/g), quercetin-apiofuranoside (from 9.9 to 3.3 µg/g), and isoquercetin (from 2.5 to 0.1 µg/g), while an increase in rutin (from 3.5 to 7.1 µg/g) and quercetin (from 1.8 to 5.4 µg/g) was observed compared to flour.
The use of sourdough in breadmaking led to an increase in PC content compared to the control bread: 25% for bread with Q sourdough and 186% for bread with BW sourdough.
In sourdough breads, similar trends were detected: a decrease in p-coumaric acid, increase in gallic acid and epicatechin, increase in quercetin and isoquercetin, especially in breads with buckwheat sourdough, kaempferol and rutin also increased, whereas catechin remained stable.

3.2.3. Phytic Acid Content

In general, both in Q and BW, a decrease in phytic acid (PA) concentration was observed after sourdough fermentation and baking (Table 1). At the end of Q sourdough fermentation (Q-F), PA was reduced by 44% compared to the control (Q-UnF). The BW sourdough at D7 showed a 38% reduction in PA concentration. The same trend was observed after baking: a decrease of 32% was found in breads with Q sourdough, with 20% substitution, which was significantly lower than the other substitution levels. For breads with BW sourdough, the reduction was 34% compared to the control bread, although no significant differences were observed among the different substitution levels (Table 1).

3.2.4. Free Amino Acid Content (FAA)

Both in sourdoughs and breads made with Q and BW an increase in FAA was observed compared to their respective controls (Table 1). At the end of fermentation, Q showed 100% more FAA than the control (Q-UnF), while BW sourdough showed a 36% increase. After baking, the average increase was 140% for breads with Q sourdough compared to the control bread. In breads with 20% BW sourdough, the increase was twofold compared to the control bread. In both Q and BW, breads followed the trend that higher substitution levels led to higher FAA content, with significant differences among them.

3.3. Technological Quality

Table 3 shows the technological quality parameters of the gluten-free breads. The highest SBV was observed in breads with 20% of sourdough, both Q and BW. In this regard, Q-20 breads showed a 25% increase in SBV compared to Q-C and a 40% increase compared to C. The same trend was observed for BW-20 sourdough, with an 11% increase compared to BW-C and a 25.4% increase compared to C. The controls—C, ChA, Q-C, and BW-C—showed lower SBV and higher initial firmness than those with sourdough, especially Q-20 and BW-20 (4.58 N; 6.79 N, respectively). The incorporation of sourdough reduced the staling rate, with a 63% and 59% decrease in Q-20 and BW-20, respectively (Table 3).
In general, breads with sourdough exhibited a more open crumb structure compared to the controls, particularly breads with 20% BW sourdough, which had the highest air fraction, even compared to breads with Q sourdough (Table 3, Figure S1).

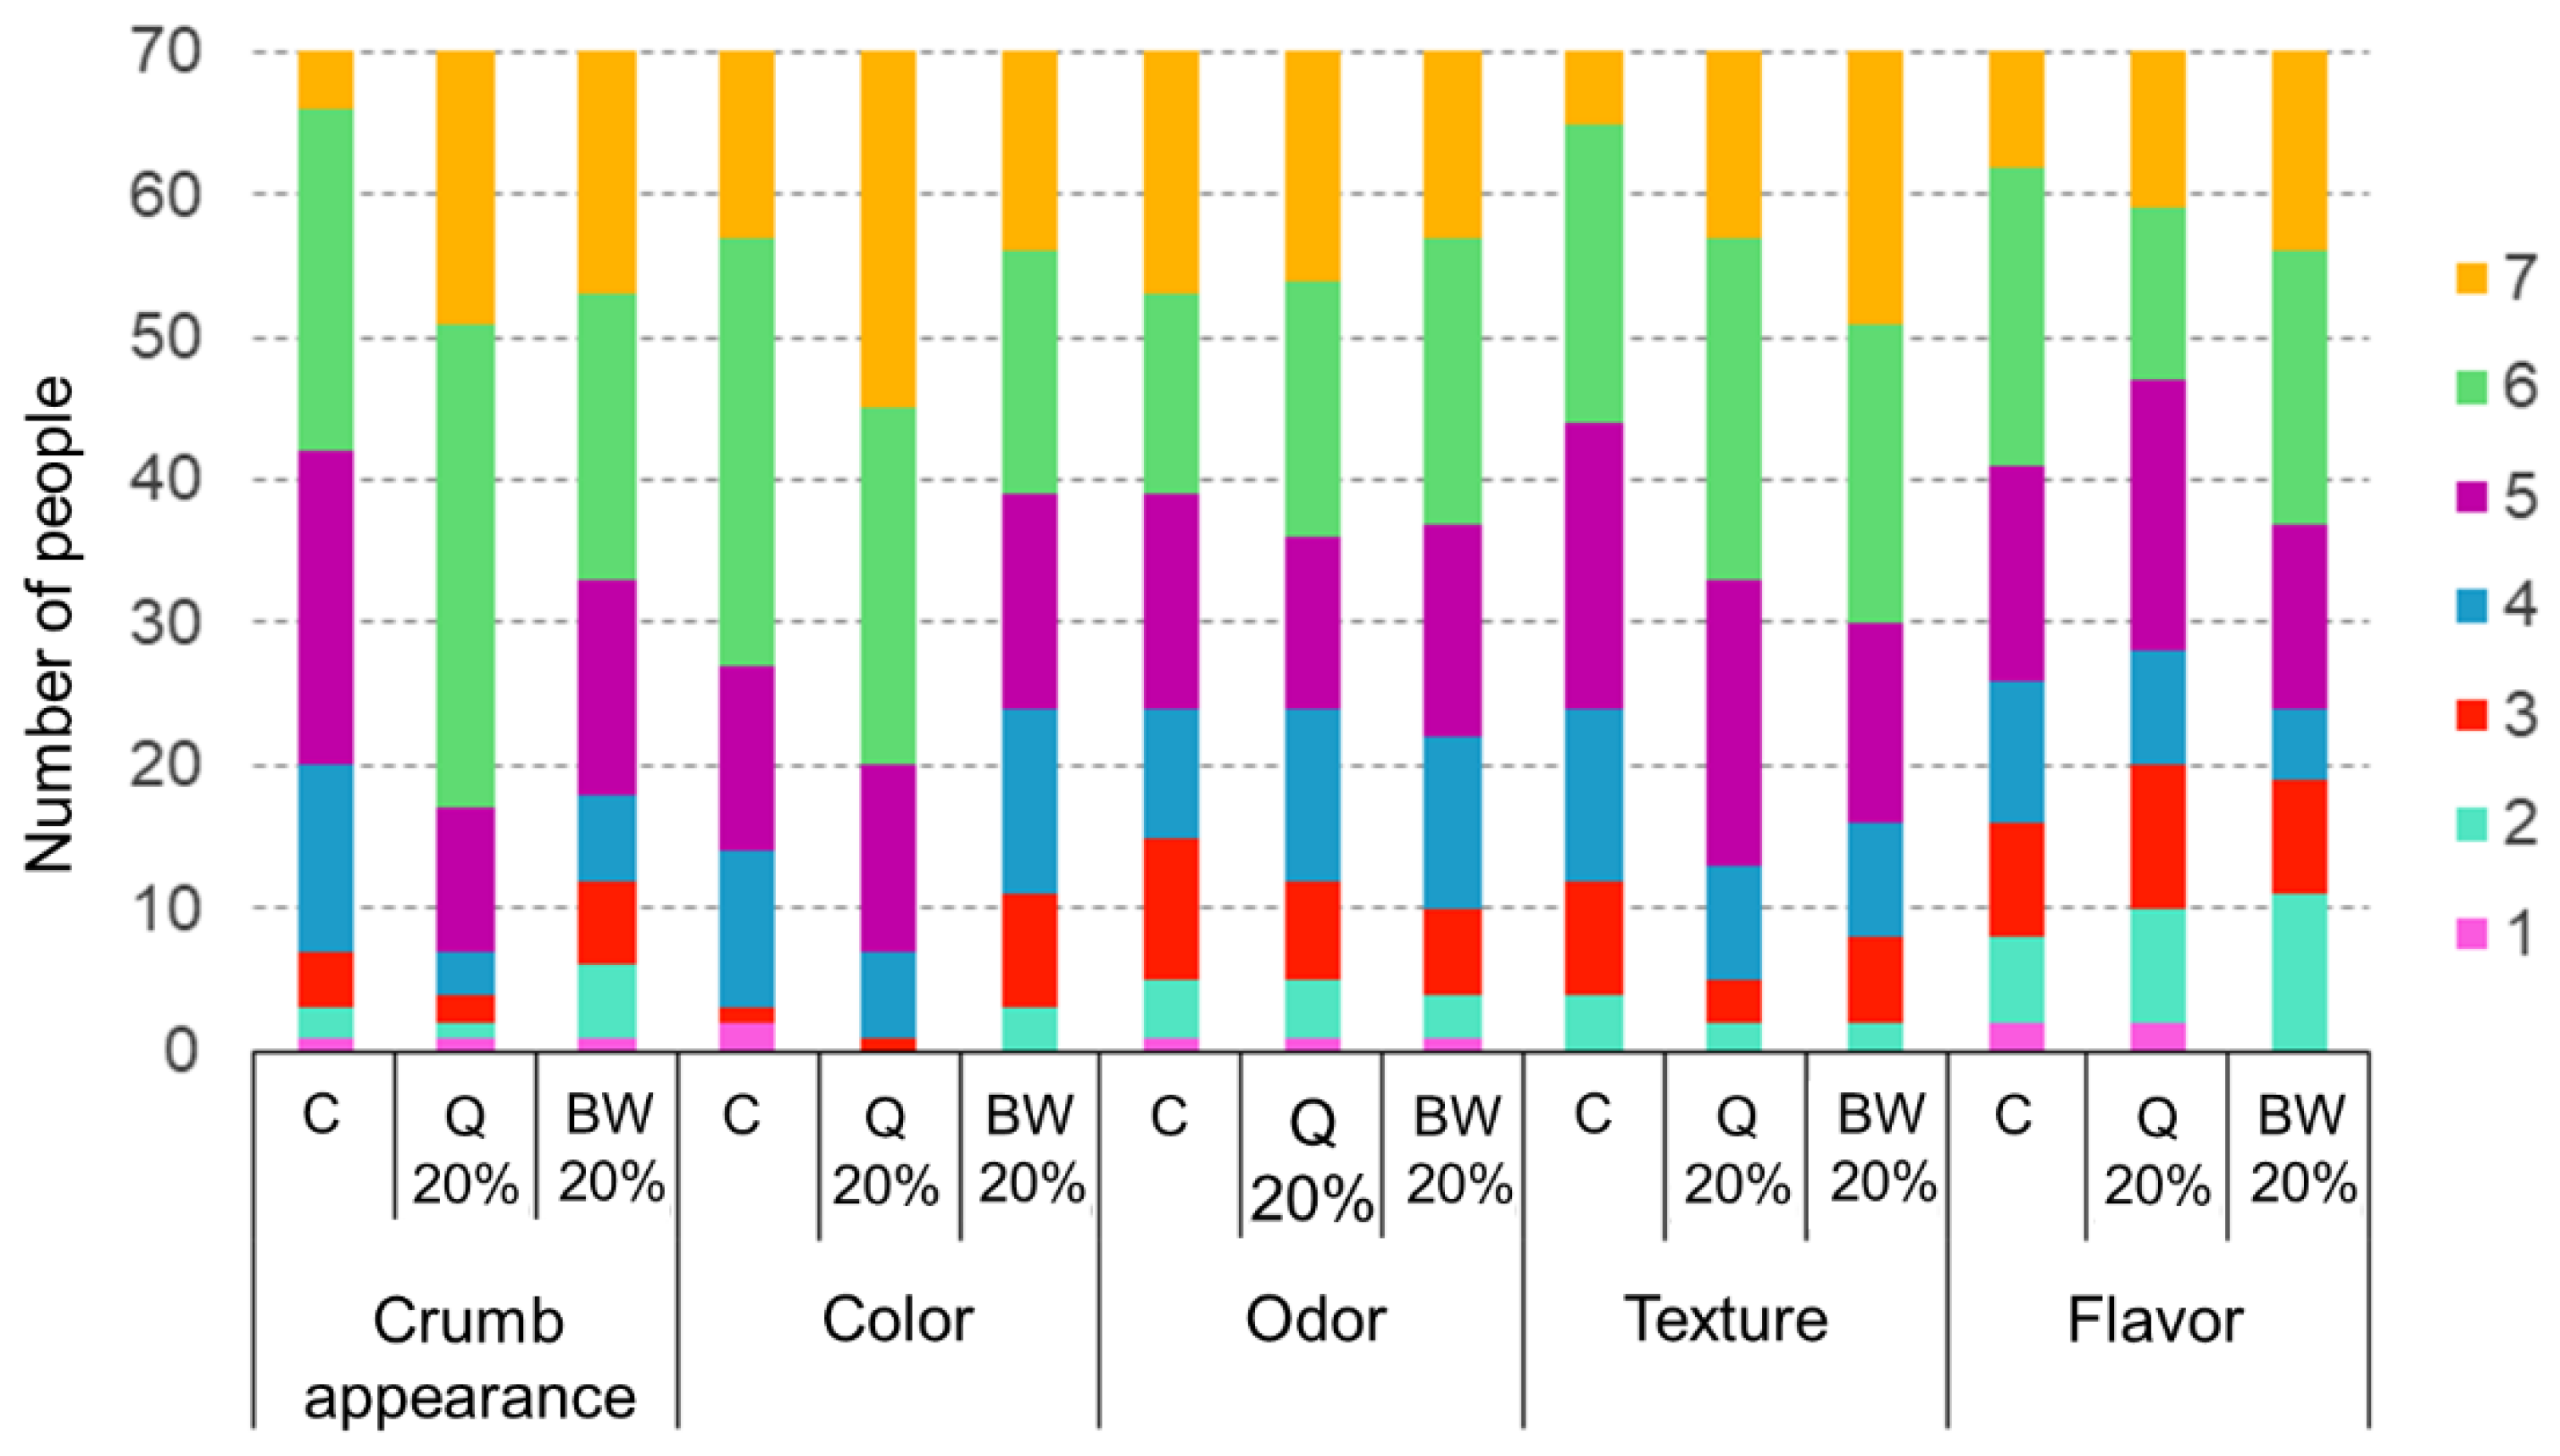
3.4. Sensory Analysis

The control bread (C), Q-20 and BW-20 were evaluated, given the better performance in terms of nutritional and technological quality. The consumer panel consisted of 70% participants who had never consumed gluten-free baked goods, 7.14% who consumed them every 15 days, 12.85% once a month, and 10% one to two times per week. The panelists found significant differences among the breads, especially regarding crumb appearance, texture, crust color, and overall flavor. Concerning crumb appearance, C bread obtained the lowest scores, while Q-20 was perceived most positively by the panelists (p < 0.05), being described as the spongiest. A total of 51.4% of the panelists considered the crust color of breads with Q or BW sourdough more appealing. In terms of aroma, no significant differences were found. The perceived texture of BW-20 was significantly better, surpassing Q sourdough bread by 5% and the control bread by 20%. A similar trend was observed in flavor, where the BW-20 showed the most attractive taste (“Like” and “Like very much”), with 47.1%, followed by the control bread with 41.4%, and lastly the Q-20 with 32.8% (Figure 1).
Regarding overall preference, 65.7% of participants chose breads with sourdough, of which 65.2% corresponded to BW, making it the most frequently selected sample. With respect to the possibility of consuming this product regularly, 81% of respondents answered affirmatively, despite it being a relatively unfamiliar product.

4. Discussion

In this work, a predominance of P. pentosaceus and P. acidilactici was observed in both sourdoughs. Although Pediococcus spp. are generally considered to occur at intermediate stages of fermentation [8], they have also been found to dominate the microbiota of mature quinoa sourdoughs [17] and buckwheat sourdoughs [18]. The found dominance of Pediococcus spp. can be due to the presence, in pseudocereals, of fibre rich in hexoses compared to other grains [19]; this high availability of hexoses may favor homofermentative bacteria such as Pediococcus spp. compared to heterofermentative LAB and its ability for fast acidification. Likewise, the initial microbiota of the grains and the local environment could also explain their establishment [20].
The initial acidity (TTA and pH) and cell count were higher in the Q doughs than in the BW doughs, but the BW sourdoughs underwent a faster acidification, ending the process with significantly higher acidity and a higher cell count. This difference could be explained, at least in part, by the higher dough yield of the BW sourdoughs, since it has been observed that variations in dough consistency influence the performance of microorganisms in sourdoughs: sourdoughs with lower consistency produce more lactic acid and ethanol, ferment faster, and consume more fermentable sugars [21].
In this study, BW showed higher TPC and antioxidant capacity than Q, consistent with previous reports [22, 23]. Fermentation significantly increased TPC values, in line with Lancetti et al. [22]. This effect has been attributed to LAB activity, through enzymatic hydrolysis of complex and glycosylated forms, activation of endogenous enzymes, acidification-driven solubilization, and the conversion of phenolic acids into phenols and derivatives through the action of LAB reductases and decarboxylases [22, 23].
The incorporation of both Q and BW sourdough enhanced TPC and antioxidant capacity in breads, with higher values than those previously reported [24,25]. BW breads exhibited greater antioxidant capacity than Q breads, largely influenced by the initial composition of the flours. Antioxidant activity depends not only on the polyphenolic content but also on the diversity of polyphenols, as these compounds may exhibit synergistic interactions [23]. This is closely related to the impact of LAB fermentation on the polyphenol profile, which in turn influences the antioxidant contribution of each compound.
Thermal processing also influenced results; while baking can degrade phenolics [26], it may simultaneously generate new antioxidant compounds, such as Maillard products [27].
HPLC analysis confirmed that both pseudocereals are rich in flavonoids, in agreement with Delcourt-García et al. [28], and in contrast with other reports under comparable matrices and extraction conditions, such as (Rocchetti et al. [23]. These discrepancies suggest strong genetic, environmental, and postharvest influences [29].
A significant increase in phenolic compounds was observed during sourdough fermentation, as was also the case for TPC. In BW sourdough, a marked increase in phenolic content was detected, particularly in quercetin and catechin, accompanied by a decrease in isoquercetin, rutin, and kaempferol glucoside. During quinoa fermentation, decreases were observed in quercetin glucuronide, quercetin apiofuranoside, and isoquercetin, while increases were found in rutin and quercetin. In other words, after fermentation, the concentration of aglycones increased while that of flavonoid glycosides decreased. These changes reflect LAB glycosidase and decarboxylase activities [30], which favor aglycone release. Since aglycones display stronger bioactivity and higher intestinal absorption than glycosides [31], these shifts may enhance the nutritional potential of sourdough breads. Overall, although baking reduced absolute levels, sourdough incorporation consistently increased phenolic content and antioxidant potential.
As can be observed, there are quantitative differences in phenolics content depending on the analytical method used. It should be noted that general methods (e.g., Folin–Ciocalteu) quantify compounds against a gallic acid calibration curve —which belongs to the hydroxybenzoic acid family—compounds that were scarcely represented in the samples studied. On the other hand, in HPLC analysis, quantification is carried out using calibration curves of standards belonging to the specific families of phenolic compounds analyzed.
Phytic acid in gluten-free flours and foods is an important factor to consider, particularly for celiac patients who often suffer from micronutrient deficiencies, as it can chelate essential minerals [18]. PA content can be reduced through fermentation, since the decrease in pH may activate the endogenous phytases of the flour. In this work we found that the pH of BW and Q sourdoughs decreased to values below 5.0, 3.8 and 4.2, respectively, close to the optimum pH of phytases [32]. The higher PA content observed in BW sourdough may be attributed to the initial amount of PA present in this flour.
The drop in pH also leads to the activation of flour proteases and peptidases, while lactic acid bacteria participate in secondary proteolysis, releasing FAA, which in turn undergo various catabolic reactions by the same microorganisms. The higher FAA content found in Q sourdough, and their corresponding breads, is consistent with other studies [33]. The optimum pH of Q and BW proteases ranges between 3.5 and 5.0, which matches the pH reached after fermentation. During baking, FAA are converted into volatile compounds, which are responsible for the typical flavor and aroma of sourdough bread.
Regarding bread technological quality, the incorporation of sourdough resulted in an increase in SBV. The breads obtained in this study showed higher SBV than those reported by other authors working with wholegrain gluten-free flours [34, 35], though lower than those described by [36]. A positive effect of sourdough on crumb texture was observed, decreasing firmness and firming during storage. Similar results were reported by other authors [37]. Initial firmness was lower in breads with sourdough compared to the control, especially at 20% substitution, and particularly in Q samples. These results cannot be explained exclusively by an acidification effect, since ChA bread showed higher initial firmness than those with sourdough. The specific activity of the microbiota promotes protein solubilization and modifies structural components of dough, such as starch and arabinoxylans; this results in breads with a softer crumb texture [22,37]. Moreover, breads with sourdough showed a decrease in staling rate compared to controls, mainly in BW-20. This effect could be explained by the presence of organic acids produced during sourdough fermentation, since they delay staling by affecting starch retrogradation [38].
As for sensory quality, 65.7% of consumers preferred breads with sourdough over the control, in agreement with other authors [39]. This result highlights that sourdough is mainly used as a flavor enhancer in the baking industry, but it also acts as a texture improver. Among those who preferred sourdough breads, 65% chose BW sourdough breads, mainly valuing their texture and flavor. Although Q-20 showed lower crumb instrumental firmness, they were perceived as “less sandy” by the panelists (data not shown). Those panelists who preferred Q-20 emphasized crumb structure and the more familiar color. Quinoa grains are characterized by a bitter aftertaste upon consumption, which mostly affects their perception negatively. Consistently, Manzatti et al. [40] reported that the characteristic flavor and aroma of quinoa had a negative impact on the perception of breads, Moreover, Q sourdough breads showed higher FAA content, precursors of aromatic compounds, many of which can be perceived as invasive. According to Irakli et al. [41], improvements in sensory properties and overall bread quality achieved through sourdough fermentation have contributed to increased consumption and to the general perception of sourdough bread as a healthy, high-quality product.

5. Conclusions

In this work, the spontaneous fermentation of quinoa and buckwheat wholegrain flours was dominated by Pediococcus spp. as lactic acid bacteria and Saccharomyces cerevisiae as yeast. The use of sourdough increased the concentration of phenolic compounds and antioxidant capacity, while decreasing phytic acid content. The incorporation of quinoa and buckwheat sourdough led to gluten-free breads with improved nutritional, technological, and sensory quality, particularly when added at 20%. Moreover, sourdough addition produced crumbs with a more open structure and higher air fraction, along with a slower staling rate and greater consumer acceptability. Breads with quinoa sourdough exhibited a higher concentration of free amino acids, reduced phytic acid content, increased bread volume, and lower crumb firmness, while breads with BW sourdough showed higher polyphenol contents, greater antioxidant activity, and higher overall consumer acceptance. Overall, these findings demonstrate the effectiveness of using unconventional flours for sourdough production in gluten-free breads, representing a promising strategy to improve their nutritional and sensory properties compared to those currently available on the market, and contributing to the development of high-quality products tailored to the needs of individuals with gluten-related disorders.

Supplementary Materials

The following supporting information can be downloaded at the website of this paper posted on Preprints.org.

Author Contributions

Conceptualization, G.T.P., E.J.S and L.S.S; methodology, M.S.L. and M.V.B.; software, R.D.P.; validation, G.T.P., E.J.S and L.S.S; formal analysis, M.S.L.; investigation, M.S.L., E.J.S., G.T.P., and L.S.S.; resources, G.T.P and L.S.S.; data curation, M.S.L; writing—original draft preparation, M.S.L.; writing—review and editing, L.S.S., G.T.P., E.J.S. and M.V.B.; supervision, L.S.S. and G.T.P.; funding acquisition, M.S.L.. All authors have read and agreed to the published version of the manuscript.

Funding

This research was funded by the National Scientific and Technical Research Council (CONICET) and the National Agency for the Promotion of Scientific Research, Technological Development, and Innovation of Argentina (PICT 2020-2829).

Institutional Review Board Statement

National University of Córdoba do not require ethical approval for sensory evaluation. There are no human ethic committees or formal documentation procedures available for sensory evaluation.

Informed Consent Statement

Informed consent for participation was obtained from all subjects involved in the study.

Data Availability Statement

Dataset available on request from the authors.

Conflicts of Interest

The authors declare no conflicts of interest.

References

  1. Martínez-Villaluenga, C.; Peñas, E.; Hernández-Ledesma, B. Pseudocereal grains: Nutritional value, health benefits and current applications for the development of gluten-free foods. Food Chem Toxicol 2020, 137, 111178. [Google Scholar] [CrossRef]
  2. Graziano, S.; Agrimonti, C.; Marmiroli, N.; Gullì, M. Utilisation and limitations of pseudocereals (quinoa, amaranth, and buckwheat) in food production: A review. Trends Food Sci Technol 2022, 125, 154–165. [Google Scholar] [CrossRef]
  3. Murphy, K.M.; Matanguihan, J.B.; Fuentes, F.F.; Gómez-Pando, L.R.; Jellen, E.N.; Maughan, P.J.; Jarvis, D.E. Quinoa breeding and genomics. Plant Breed Rev 2018, 42, 257–320. [Google Scholar]
  4. Hunt, H.V.; Shang, X.; Jones, M.K. Buckwheat: a crop from outside the major Chinese domestication centres? A review of the archaeobotanical, palynological and genetic evidence. Veg Hist Archaeobot 2018, 27, 493–506. [Google Scholar] [CrossRef] [PubMed]
  5. FAO. FAOSTAT Statistical Database. Food and Agriculture Organization of the United Nations. 2025.
  6. Wijerathna-Yapa, A.; Pathirana, R. Sustainable agro-food systems for addressing climate change and food security. Agriculture 2022, 12, 1554. [Google Scholar] [CrossRef]
  7. Asri, N.; Rostami-Nejad, M.; Anderson, R.P.; Rostami, K. The gluten gene: unlocking the understanding of gluten sensitivity and intolerance. Appl Clin Genet 2021, 37–50. [Google Scholar] [CrossRef]
  8. De Vuyst, L.; Van Kerrebroeck, S.; Harth, H.; Huys, G.; Daniel, H.M.; Weckx, S. Microbial ecology of sourdough fermentations: diverse or uniform? Food Microbiol 2014, 37, 11–29. [Google Scholar] [CrossRef]
  9. Casado, A.; Álvarez, A.; González, L.; Fernández, D.; Tornadijo, M. Effect of fermentation on microbiological, physicochemical and physical characteristics of sourdough and impact of its use on bread quality. Czech J Food Sci 2017, 35(6), 496–506. [Google Scholar] [CrossRef]
  10. O'Shea, N.; Arendt, E.; Gallagher, E. State of the art in gluten-free research. J Food Sci 2014, 79(6), R1067–R1076. [Google Scholar] [CrossRef] [PubMed]
  11. Sciarini, L.; Ribotta, P.; León, A.; Pérez, G. Incorporation of several additives into gluten free breads: Effect on dough properties and bread quality. J Food Eng 2012, 111, 590–597. [Google Scholar] [CrossRef]
  12. López Martinez, L.; Oliat–Ros, G.; Valerio Alfaro, C.; Lee, K.; Garcia, H. Antioxidant activity, phenolic compounds and anthocyanins content of eighteen strains of Mexican maize. LWT-Food Sci Technol 2009, 42, 1187–1192. [Google Scholar] [CrossRef]
  13. Re, R.; Pellegrini, N.; Proteggente, A.; Pannala, A.; Yang, M.; Rice-Evans, C. Antioxidant activity applying an improved ABTS radical cation decolorization assay. Free Radic Biol Med 1999, 26: 1231-1237.
  14. Pulido, R.; Bravo, L.; Saura-Calixto, F. Antioxidant activity of dietary polyphenols as determined by a modified ferric reducing/antioxidant power assay. J Agric Food Chem 2000, 48(8), 3396–3402. [Google Scholar] [CrossRef]
  15. Nielsen, P.; Petersen, D.; Dambmann, C. Improved method for determining food protein degree of hydrolysis. J Food Sci 2001, 66(5): 642-646.
  16. Reichwald, K.; Hatzack, F. Application of a modified Haug and Lantzsch method for rapid and accurate photometrical phytate determination in soybean, wheat, and maize meals. J Agric Food Chem 2008, 56, 2888–2891. [Google Scholar] [CrossRef]
  17. Carrizo, S, de LeBlanc, A.; LeBlanc, J.G.; Rollán, G. Quinoa pasta fermented with lactic acid bacteria prevents nutritional deficiencies in mice. Food Res Int 2020, 127, 108735.
  18. Moroni, A.V.; Arendt, E.K.; Dal Bello, F. Biodiversity of lactic acid bacteria and yeasts in spontaneously-fermented buckwheat and teff sourdoughs. Food Microbiol 2011, 28(3), 497–502. [Google Scholar] [CrossRef]
  19. Lamothe, L.M.; Srichuwong, S.; Reuhs, B.L.; Hamaker, B.R. Quinoa (Chenopodium quinoa W) and amaranth (Amaranthus caudatus L) provide dietary fibres high in pectic substances and xyloglucans. Food Chem 2015, 167, 490–496. [Google Scholar] [CrossRef] [PubMed]
  20. Xing, X.J.; Fu, Z.; Zhao, Y.; Ai, Z.; Suo, B. Diversity of bacterial communities in traditional sourdough derived from three terrain conditions (mountain, plain and basin) in Henan Province, China. Food Res Int 2020, 133, 109139. [Google Scholar] [CrossRef] [PubMed]
  21. Martínez-Anaya, M.A.; de Barber, C.B.; Esteve, C.C. Effect of processing conditions on acidification properties of wheat sour doughs. Int J Food Microbiol 1994, 22(4), 249–255. [Google Scholar] [CrossRef] [PubMed]
  22. Lancetti, R.; Salvucci, E.; Moiraghi, M.; Pérez, G.T.; Sciarini, L.S. Gluten-free flour fermented with autochthonous starters for sourdough production: Effect of the fermentation process. Food Biosci 2022, 47, 101723. [Google Scholar] [CrossRef]
  23. Rochetti, G.; Miragoli, F.; Zacconi, C.; Lucini, L.; Rebecchi, A. Impact of cooking and fermentation by lactic acid bacteria on phenolic profile of quinoa and buckwheat sedes. Food Res Int 2019, 119, 886–894. [Google Scholar] [CrossRef]
  24. Wang, X.; Lao, X.; Bao, Y.; Guan, X.; Li, C. Effect of whole quinoa flour substitution on the texture and in vitro starch digestibility of wheat bread. Food Hydrocoll 2021, 119, 106840. [Google Scholar] [CrossRef]
  25. García Ramón, F.; Alvarez, H.; Sotelo-Méndez, A.; Norabuena, E.; Sumarriva Bustinza, L. Calidad nutricional, evaluación física, sensorial y biológica en panes convencionales y libres de gluten. Nutricion Clínica Dietetica Hospitalaria 2022, 42(1), 106-114.
  26. Yu, L.; Nanguet, A.; Beta, T. Comparison of antioxidant properties of refined and whole wheat flour and bread. Antioxidants 2013, 2, 370–383. [Google Scholar] [CrossRef]
  27. Gélinas, P.; McKinnon, C. Effect of wheat variety, farming site, and bread-baking on total phenolics. Int J Food Sci Technol 2006, 41, 329–332. [Google Scholar] [CrossRef]
  28. Delcourt-García, M.M.; Escribano-Bailón, M.T.; Dueñas, M. Determination of phenolic composition in ancestral grains for food use. comparison of analytical methods and antioxidant activity. FarmaJournal 2020, 5(2), 27–41. [Google Scholar]
  29. Wang, Q.; Yao, L.; Li, Q.; Xie, H.; Guo, Y.; Huang, T.; Zhang, X.; Liu, J.; Zhang, P.; Li, L.; Qin, P. Integrative analysis of the metabolome and transcriptome provides insights into the mechanisms of flavonoid biosynthesis in quinoa seeds at different developmental stages. Metabolites 2022, 12(10), 887. [Google Scholar] [CrossRef]
  30. Svensson, L.; Sekwati-Monang, B.; Lutz, D.L.; Schieber, A.; Gänzle, M.G. Phenolic acids and flavonoids in nonfermented and fermented red sorghum (Sorghum bicolor (L.) Moench). J Agric Food Chem 2010, 58(16), 9214-9220.
  31. Guo, N.; Zhu, Y.W.; Jiang, Y.W.; Li, H.K.; Liu, Z.M.; Wang, W.; Chan, C.H.; Fu, Y.J. Improvement of flavonoid aglycone and biological activity of mulberry leaves by solid-state fermentation. Ind Crops Prod 2020, 148, 112287. [Google Scholar] [CrossRef]
  32. Oh, B.C., Choi, W.C., Park, S., Kim, Y. O., Oh, T. K. Biochemical properties and substrate specificities of alkaline and histidine acid phytases. Appl Microbiol Biotechnol 2004, 63(4), 362-372.
  33. Rizzello, C.; Nionelli, L.; Coda, R.; Gobbetti, M. Effect of sourdough fermentation on stabilization, and chemical and nutritional characteristics of wheat germ. Food Chem 2016, 119(3), 1079–1089. [Google Scholar] [CrossRef]
  34. Cera, S.; Tuccillo, F.; Knaapila, A.; Sim, F.; Manngård, J.; Niklander, K.; Verni, M.; Rizzello, C. G.; Katina, K.; Coda, R. Role of tailored sourdough fermentation in the flavor of wholegrain-oat bread. Curr Res Food Sci 2024, 8, 100697. [Google Scholar] [CrossRef]
  35. Jagelaviciute, J.; Cizeikiene, D. The influence of non-traditional sourdough made with quinoa, hemp and chia flour on the characteristics of gluten-free maize/rice bread. LWT-Food Sci Technol 2021, 137, 110457. [Google Scholar] [CrossRef]
  36. Olojede, A. O.; Sanni, A.I.; Banwo, K. Effect of legume addition on the physiochemical and sensorial attributes of sorghum-based sourdough bread. LWT-Food Sci Technol 2020, 118, 108769. [Google Scholar] [CrossRef]
  37. Arendt, E.; Ryan, L.; Dal Bello, F. Impact of sourdough on the texture of bread. Food Microbiol 2007, 24, 165–174. [Google Scholar] [CrossRef]
  38. Bender, D.; Schonlechner, R. Innovative approaches towards improved gluten-free bread properties. J Cereal Sci 2020, 91, 102–904. [Google Scholar] [CrossRef]
  39. Katsi, P.; Kosma, I.; Michauledou, S.; Argiriou, A.; Kontominas, M. Characterization of artisanal spontaneous sourdough wheat bread from central Greece: Evaluation physicho-chemical, microbiological, and sensory properties and relation to conventional yeast leavened wheat bread. Foods 2021, 10, 635. [Google Scholar] [CrossRef]
  40. Manzatti, N.; de Morais, E.C.; Steel, C.J.; Bolini, H.M.A. Sensory characterisation of gluten-free bread with addition of quinoa, amaranth flour and sweeteners as an alternative for coeliac patients. Int J Food Sci Technol 2017, 52(4), 872–879. [Google Scholar]
  41. Irakli, M.; Mygdalia, A.; Chatzopoulou, P.; Katsantonis, D. Impact of the combination of sourdough fermentation and hop extract addition on baking properties, antioxidant capacity and phenolics bioaccessibility of rice bran-enhanced bread. Food Chem 2019, 285, 231–239. [Google Scholar] [CrossRef] [PubMed]
Figure 1. Sensory evaluation of gluten-free breads. C: control; Q 20%: bread with Q sourdough; BW-20%: bread with BW sourdough. 1: dislike very much; 2: dislike slightly; 3: dislike; 4: neither like nor dislike; 5: like; 6: like slightly; 7: like very much.
Preprints 180728 g001
Table 1. Total polyphenol content (TPC), antioxidant activity (FRAP and ABTS), and phytic acid and free amino acids contents of different samples.
TPC
(mg GAE/100 mg)
FRAP
(µmol TE/g)
ABTS
(mmol TE/g)
Phytic acid(g/100g) µmol serine/g protein
Sourdough Q-UnF 52.55±0.51a 80.53±0.56a 1.56±0.03a 2.06±0.05b 0.89±0.14a
Q-F 152.42±0.96b 104.74±0.35b 4.90±0.08b 1.16±0.16a 1.80±0.00b
Bread C 90.58±0.61c 69.33±0.05a 2.97±0.05b 1.77±0.02c 0.78±0.02a
ChA 84.55±1.16b 69.88±2.84a 2.23±0.03a 1.84±0.00c 0.83±0.03a
Q-C 68.24±0.09a 97.06±0.32b 3.12±0.071b 1.78±0.02c 1.09±0.01b
Q-10 107.29±0.25d 140.98±0.01c 4.56±0.28c 1.32±0.07ab 2.28±0.13c
Q-15 106.83±1.19d 150.57±2.03d 5.57±0.08d 1.37±0.07b 2.58±0.04d
Q-20 113.12±0.43e 155.52±0.98e 5.95±0.06e 1.21±0.07a 2.98±0.08e
Sourdough BW-UnF 164.65±0.13a 120.34±0.96a 3.92±0.10a 2.24±0.01b 0.99±0.05a
BW-F 203.90±1.41b 174.59±0.45b 9.06±0.45b 1.39±0.05a 1.36±0.01b
Bread C 90.58±0.61b 69.33±0.05a 2.97±0.05b 1.77±0.02b 0.78±0.02a
ChA 84.55±1.16a 69.88±2.84a 2.23±0.03a 1.84±0.00b 0.83±0.03a
BW-C 138.23±0.73c 107.04±0.77b 5.72±0.02c 1.81±0.01b 1.19±0.01b
BW-10 213.56±059d 158.22±0.02c 9.99±0.23d 1.21±0.04a 1.96±0.02c
BW-15 224.33±1.02e 183.38±0.34d 11.167±0.67e 1.21±0.03a 2.12±0.04d
BW-20 233.72±1.25f 188.38±1.62e 13.70±0.00f 1.19±0.09a 2.33±0.06e
Different letters within a column, for each sample type (sourdough or bread) and flour (Q or W), indicate significant differences (p < 0.05). Q: quinoa; BW: buckwheat; UnF: unfermented; F: fermented; C: control (bread without sourdough); ChA: chemically acidified control; Q-C: bread with unfermented quinoa sourdough; BW: bread with unfermented buckwheat sourdough.
Table 2. Polyphenol profile of unfermented and fermented sourdoughs, and gluten-free breads.
Phenolic compound Family ug/g
Sourdough Bread
Q-UnF Q-F BW-UnF BW-F C Q-C Q-20 BW-C BW-20
p-coumaric acid Hydroxycinnamic acid 1.23±0.05 2.99±0.69 0.73±0.01 5.63±0.35 2.15±0.15 1.49±0.71 1.91±0.67 2.23±0.13 1.95±0.72
Gallic acid Hydroxybenzoic acid nd nd 3.71±0.05 11.39±0.16 1.10±0.12 1.48±0.68 2.59±2.16 2.82±0.35 1.78±0.78
Catechin Flavanol nd nd 15.48±0.84 52.65±3.29 3.33±0.37 1.02±0.14 3.74±3.43 5.28±0.12 3.13±2.49
Epicatechin Flavanol nd nd 9.69±0.06 13.08±0.44 0.76±0.03 0.43±0.28 0.58±0.41 2.35±0.05 1.70±0.46
Epicatechin gallate Flavanol nd nd 0.57±0.00 0.11±0.01 0.03±0.00 nd nd 0.11±0.04 0.09±0.01
Epicatechin O-dimethylgallate Flavanol nd nd 0.55±0.08 0.44±0.03 0.02±0.03 nd nd 0.09±0.03 0.07±0.00
Quercetin Flavonol 1.76±0.14 5.41±1.09 10.07±2.61 213.20±49.17 5.37±0.32 5.34±0.27 6.56±1.06 21.70±9.16 20.12±1.91
Quercetin glucuronide Flavonol 6.12±0.22 0.57±0.06 nd nd 1.04±0.03 1.61±0.89 1.04±0.35 4.06±0.01 2.28±0.52
Quercetin rhamnoside Flavonol nd nd 2.27±0.14 2.45±0.06 0.25±0.05 0.19±0.03 0.35±0.10 0.91±0.04 0.71±0.27
Isoquercetin Flavonol 2.51±0.01 0.09±0.03 51.93±5.89 21.98±0.99 5.92±0.21 4.09±0.69 5.35±1.99 26.28±0.79 18.21±4.07
Quercetin apiofuranoside Flavonol 9.99±0.17 3.29±0.91 nd nd 1.84±0.10 1.89±1.22 1.74±0.78 4.34±0.32 2.81±0.63
Kaempferol glucoside Flavonol 0.09±0.00 0.05±0.02 7.27±0.20 2.35±0.00 0.04±0.01 0.33±0.08 0.39±0.13 1.51±0.11 1.07±0.33
Rutin Flavonol 3.48±0.09 7.05±1.79 53.39±0.66 5.74±0.63 1.19±0.04 4.32±1.49 5.03±2.55 18.14±1.88 13.42±3.98
Mauritanian Flavonol 0.99±0.02 1.09±0.16 nd nd 0.94±0.04 0.66±0.29 0.79±0.29 1.19±0.11 1.23±0.19
Q: quinoa; BW: buckwheat; UnF: unfermented; F: fermented; C: control (bread without sourdough); ChA: chemically acidified control; Q-C: bread with unfermented quinoa sourdough; BW: bread with unfermented buckwheat sourdough.
Table 3. Technological properties of gluten-free breads with and without sourdough.
SBV (cm3/g) Initial
firmness (N)
Firming
rate (N/day)
Pores/mm2 Total air area (%) Pore average size (mm2)
C 1.9370.018a 13.63±1.18f 5,00 0.390±0.014ab 41.59±5.91a 0.593±0.045a
ChA 2.116±0.011b 11.96±0.76e 5.06 0.383±0.005a 40.43±1.92a 0.533±0.006a
Q-C 2.169±0.014b 10.80±0.71d 4.65 0.415±0.010bcd 47.76±1.24b 0.585±0.033a
Q-10 2.463±0.028c 7.12±0.25b 4.35 0.415±0.013bcd 50.93±4.60bc 0.887±0.085b
Q-15 2.542±0.062d 4.67±0.85a 3.96 0.403±0.025abc 55.16±3.12cd 0.958±0.029b
Q-20 2.712±0.054e 4.58±0.28a 2.95 0.508±0.010ef 61.83±3.49e 1.075±0.013c
BW-C 2.171±0.046b 12.23±0.56e 4.64 0.433±0.015d 47.73±1.55b 0.608±0.022a
BW-10 2.273±0.037c 8.58±0.39c 4.54 0.428±0.021cd 61.31±3.89e 1.070±0.104c
BW-15 2.259±0.041c 7.49±0.60b 4.04 0.485±0.010e 57.98±3.42de 0.893±0.039b
BW-20 2.417±0.045d 7.22±0.13b 2.74 0.515±0.038f 60.72±3.07e 0.913±0.047b
Different letters within a column indicate significant differences (p < 0.05). Q: quinoa; BW: buckwheat; C: control (bread without sourdough); ChA: chemically acidified control; Q-C: bread with unfermented quinoa sourdough; BW: bread with unfermented buckwheat sourdough.
Disclaimer/Publisher’s Note: The statements, opinions and data contained in all publications are solely those of the individual author(s) and contributor(s) and not of MDPI and/or the editor(s). MDPI and/or the editor(s) disclaim responsibility for any injury to people or property resulting from any ideas, methods, instructions or products referred to in the content.
Copyright: This open access article is published under a Creative Commons CC BY 4.0 license, which permit the free download, distribution, and reuse, provided that the author and preprint are cited in any reuse.
Prerpints.org logo

Preprints.org is a free preprint server supported by MDPI in Basel, Switzerland.

Subscribe

Disclaimer

Terms of Use

Privacy Policy

Privacy Settings

© 2025 MDPI (Basel, Switzerland) unless otherwise stated