
Submitted:
28 October 2024
Posted:
29 October 2024
You are already at the latest version
Abstract
For the development of a high-quality functional bread it is of crucial importance to find a compromise between improving the functional value of the product and impairing its quality. Therefore, the primary aim of this work was to define the effects of carob pulp flour (CF; 10-20% on flour basis) on rheological behavior of dough and quality parameters of bread. Introduction of CF caused a major increase in dough resistance while significantly decreasing dough extensibility, resulting in lower volume with denser crumb structure of obtained bread samples. The negative effects of CF on dough and bread characteristics were partialy compensated by the addition of dry sourdough (DS) as an improver in the amount of 5-10% (flour basis). It was determined that by combining 15% CF and 10% DS bread of very good sensory quality can be produced. The content of total dietary fiber (6.48 g), Mn (0.76 mg) and Cu (0.21 mg) per 100 g of mentioned bread was sufficient for the nutritional claims: "high in fiber", "high in manganese" and "source of copper". Obtained bread had 10 times higher content of total phenols and multiple times higher antioxidant activity compared to the control. Moreover, microbiological tests confirmed the durability of bread with 15% CF and 10% DS up to seven days. Therefore, carob pulp flour can be successfully applied in the production of bread, which characteristics are adapted to modern trends in nutrition.
Keywords:
functional bread
; carob pulp flour
; rheology
; mineral composition
; antioxidant activity
; microbial stability
1. Introduction
By studying the health and physiological effects of certain food ingredients, many research studies showed a direct correlation between diet rich in foods with bioactive components and a reduced risk of chronic non-communicable diseases [1]. For this reason, the importance of plant foods has been emphasized more and more in recommendations for proper nutrition. Thus, lesser-known plant varieties are gaining popularity among scientists, since they are a source of vitamins, minerals, dietary fibers and other, also known as functional components [2].
The best effects of the mentioned functional ingredients can be achieved if they are included in the composition of foods that are consumed on a daily basis. Cereal-based products, primarily bread, as the most common foods in a proper and balanced diet, are therefore justifiably the focus of such research [3,4]. However, any change in bread formulation or production process can affect the acceptability of enriched product due to changes occurring in taste, texture and other attributes [5]. Since functional food can achieve the desired effects only when products with a modified composition meet the majority of consumer expectations [6], it is clear that the bakery industry is faced with a difficult and challenging task when it comes to the production of functional bakery products.
Due to the abundance of functional compounds present in the composition of carob pulp flour, this raw material, which is a by-product of the industrial processing of carob fruit, rightly attracts the attention of the scientific community [7]. The presence of crude dietary fiber (up to 47%), the largest part of which are insoluble fibers, as well as minerals and polyphenolic compounds, makes it interesting from the point of view of research and manufacturers, as it provides an opportunity to obtain innovative products, which can largely satisfy new requirements consumers [8]. The beneficial health effects of phenolics are considered in the light of their potent antioxidant, anti-inflammatory, antimicrobial and immunomodulatory properties, and the consequent reduction of the risk of developing mass non-communicable diseases, as well as their potential therapeutic effect [9].
In terms of appearance and taste, carob pulp flour is similar to cocoa, so it is often used as its substitute [10]. The use of carob pulp flour in various beverages, such as liqueurs [11], kvass [12], Moroccan traditional carob drink [13], and carob juice [14], also in dairy products, such as yogurt [15], kefir [16] and carob-based milk beverage [17]. Carob jams and liqueurs are produced in Turkey, Malta, Portugal, Spain and Silicon. In Libya, syrup is extracted from carob and used to prepare their traditional dessert [7].
However, in scientific research, the most commonly investigated was the possibility of adding carob pulp flour to various cereal-based products: muffins [18], cookies [19], biscuits [20], cake [21], tarhana [22] and pasta [23].
Although the inclusion of flour obtained from carob pulp in the composition of wheat bread has only been examined in a few scientific works [24,25,26,27], inevitable changes in the rheological properties of the formed dough were recorded, which caused the reduction in quality and acceptability of the obtained product. For this reason, great attention must be paid to the preparation of raw materials and optimization of the raw material composition of functional bread with carob.
Literature data indicate that pretreatment of fiber-rich raw materials, such as pre-hydration, can reduce the negative effects of fibers have on dough behavior during kneading and processing to a certain extent [28,29]. However, in some cases to achieve the stated goal the use of additives is inevitable. Considering that it is a functional product, it is very important that the additive used is in the domain of clean label. Therefore, the modern bakery industry resorts to the use of different types of sourdough, given that they have been shown to be effective in improving the properties and acceptability of rye flour bread or bread with the addition of non-traditional raw materials [30].
Based on all of the above, the aim of this research was the utilization of the antimicrobial and bioactive potential of carob pulp flour in the production of bread with improved technological and nutritional quality. For the accomplishment of the set goal, it is necessary to define the influence of carob pulp flour on the quality indicators of dough and bread, as well as to determine the optimal amount of dry sourdough in bread formulation in order to obtain a product of acceptable physical and sensory quality. Finally, for bread sample of optimal quality, the main indicators of its functionality were examined, i.e., nutritional profile, antioxidant capacity and microbiological stability.
2. Materials and Methods
2.1. Raw Materials
Carob pulp flour (CF) used in this work was a commercial product available on the market in Serbia, supplied by Vega ADM (Senta, Serbia). Ingredients used for the preparation of bread were: wheat flour (moisture 11.8%, ash 0,55% d.w., protein 12.7% d.w. and wet gluten content 27%) was supplied by the local mill (Kikindski mlin AD, Kikinda, Serbia), salt (Solana d.d., Tuzla, BiH) and bakers’ yeast (Lesaffre, Budapest, Hungary). As baking additive a commercial concentrated mixture with dry sourdough for special types of bread and pastries “Pecipan soft” (DS) was used (Kvasac d.o.o., Prigorje Brdovečko, Croatia).
2.2. Chemicals
Trolox (6-hydroxy-2,5,7,8-tetramethylchroman-2-carboxylic acid) was purchased from Sigma-Aldrich (Milano, Italy). Following chemicals were purchased from Sigma-Aldrich Chem (Steinheim, Germany): Folin–Ciocalteu reagent, gallic acid, (±)-catechin, 2,2-diphenyl-1-picrylhydrazyl (DPPH), TPZT (2,4,6-tris (2-pyridil)-s triazine), ABTS (2,2′-azino-bis-(-3-ethylbenzothiazoline-6-sulfonic acid) diammoniumsalt), iron (III)-chloride, iron (II)-sulfatheptahydrate and potassium persulfate. All other chemicals used in this study were of an analytical grade.
2.3. Experimental Plan
The full factorial experimental design 32 was used in order to investigate the dependence of the relevant parameters of dough and bread quality as a function of two independent variables (CF, 10-20% and DS, 0-10%) at three levels (Table 1). CF was introduced as a functional ingredient into the dough while a part of the wheat flour was substituted with corresponding amount of CF. On the other hand, DS had the role of an improver and was added to the total flour weight in corresponding amounts.
2.4. Preparation of Carob Flour
Before incorpotation into the dough CF was prehydrated, meaning it was hydrated with precisely defined volume of water for defined time period. The amount of water for prehydration was defined by determining the water holding capacity (WHC) of CF, according to the method [31]. The volume of water required for the prehydration of CF was calculated as the product of CF weight and WHC (2.65 g/g). The time required for complete hydration of CF was defined by monitoring the WHC of CF in time periods from 15 to 90 min. Since for the examined time period there was no significant difference in obtained WHC values, the shortest time (15 min) was used for the prehydration of CF before mixing with wheat flour. The representation of the prehydrated and untreated CF is shown in Figure 1.
2.5. Rheological Assesment
Mixing properties of dough samples with CF and DS, as well as the control dough (without CF and DS) was determined using Brabender farinograph, while the extensional behavior of mentioned samples was determined using Brabender extensograph according to the standard methods [32,33]. In both methods, from the total amount of water required for kneading, part of the water was used for prehydration of CF.
2.6. Bread Making
Raw material composition of the control sample was: wheat flour (900 g), salt (2%, on flour basis) and yeast (2.5%, on flour basis). Other bread samples were formulated according to the previously presented experimental plan (Table 1). The amount of water for kneading was calculated based on the farinograph water absorption determined for each sample and reduced by 1.4% (correction for water content in yeast). In samples with CF, from the total amount of water required for kneading the dough, part of the water was used for prehydration of CF. The temperature of the water for kneading was 32 °C. The dough was mixed in a high-speed spiral mixer MS-6 for 4 minutes, and the prepared dough was left in a fermentation chamber at 30 ˚C for 60 minutes, with one kneading after 45 minutes. The fermented dough was then divided into 3 dough pieces of 450 g and was rounded by hand. The dough was left to relax for 10 minutes, after which were shaped into loaves and inserted into Teflon molds, followed by final proofing at 30 °C and 80% RH. The optimally fermented dough was baked in a laboratory oven for 25-30 minutes at 220 ˚C, i.e., until a 10% weight loss was achieved. After cooling for 2 h obtained bread samples were packaged in polyethylene bags and stored at ambient conditions.
2.7. Specific Volume
Bread samples were weighed and the volume was measured by the rapeseed displacement method [34]. Specific volume was calculated as ratio of bread volume and its weight, and was expressed in cm3/g.
2.8. Sensory Analysis
Sensory properties of bread were defined using the scoring method, which was performed 24 h after baking. The evaluation of the sensory properties of bread was carried out by a six-member panel of trained evaluators in an adequate space [35,36]. The following quality attributes were evaluated with grades from 1 to 5: external appearance, crumb structure, smell and taste. Given that different attributes contribute differently to the overall sensory quality of bread, grades (G) for individual attributes were multiplied by an importance factor (IF). The product of the obtained grade and the corresponding importance factor for the observed attribute represents the number of points (P). Sum of points for all the examined sensory properties gives the total score (TS) for each bread sample. Based on the total score bread samples were classified into five quality categories: excellent (89,1-100,0), very good (78,1-89,0), good (67,1-78,0), acceptable (56,1-67,0), unacceptable (≤ 56,0).
2.9. Chemical Characterization
2.9.1. Nutritional Value
The chemical composition of bread was determined according to the methods described in the AOAC: moisture (No. 926.5), ash (No. 930.22), fat (No. 935.38), protein (No. 950.36), total, soluble, and insoluble dietary fibers (No. 958.29) [37]. The factor 6.25 were used for the conversion of nitrogen to protein content. The content of total and digestible carbohydrates was determined by calculation.
The energy value of bread (EV) was calculated based on the results of the chemical composition (protein - P, carbohydrates – CH, fat - F, dietary fiber - DF) and data on the energy value of individual nutrients using the following equation:
2.9.2. Mineral Content
The content of calcium, copper, iron, magnesium, manganese, potassium and zinc in bread was determined according to the ISO standard method [38]. The method is based on dissolving the sample in hydrochloric acid after incineration at 550 ± 15 °C. A suitably diluted solution was sprayed in mixture of air and acetylene gas on an atomic absorption spectrometer (Varian spectra AA 10, Varian techtron pty limited, Australia). For irradiation, corresponding cathode lamps were used for the determination of Ca, Cu, Fe, Mg, Mn, K and Zn, and measurements were performed at sensitive wavelengths: 766.5 nm for K, 422.6 nm for Ca, 285.2 nm for Mg, 324.8 nm for Cu, 248.3 nm for Fe, 279.5 nm for Mn, 213.8 nm for Zn. The measured absorbance of each element were compared with the absorbance of calibration solutions for the same metal [39]. The result was given as a mean value of three measurements.
2.9.3. Bioactive Components
In order to determine the content of polyphenols and the antioxidant activity, active principles were extracted from bread according to the procedure described by Gumul et al. [40]. 3 g of sample (bread crumb only/crust and crumb) was weighed into a glass cuvette and mixed with 15 ml of 80% (w/w) ethanol. The cuvettes were placed in a rotary thermostat at room temperature for 3 hours. Samples were centrifuged for 10 min at 4000 rpm. The supernatant was separated by decantation, collected in dark vials and stored at 4 °C until analysis. The procedures for determination of total phenols content (TP), total flavonoids content (TF) and antioxidant activity by DPPH, FRAP and ABTS assays were described in detail in previous study [41]. All measurements were conducted in triplicate and the results were expressed per 100 g of bread.
2.10. Microbiological Quality
2.10.1. Microbiological Stability
Microbiological stability of bread was assessed by monitoring the microbial load of investigated samples for 14 days. Sampling was performed on 4±1 days, during which 20 g of bread crumb was taken and homogenized with 180 mL of sterile saline for 15 minutes at 200 rpm (Unimax 1010, Heidolph, Germany). Prepared stock solution was analyzed by the determination of: mesophilic bacteria on plate count agar (Merck, Darmstadt, Germany) incubated for 3 days at 30 °C [42]; Enterobacteriaceae on violet red bile glucose agar (Merck, Darmstadt, Germany) incubated for 1 day at 37 °C [43]; yeast and molds on saboraud maltose agar (Merck, Darmstadt, Germany) incubated for 5 days at 25 °C [44]; Bacillus cereus on mannitol egg yolk polymyxin (Merck, Darmstadt, Germany) incubated for 1 day at 30 °C [45]. In order to determine the total number of sporogenic aerobic bacteria, 10 ml was taken from the basic solution and transferred into sterile test tubes. The tubes were placed in a water bath and the contents were heated to 95 °C for 5 minutes. From the treated stock solution, 1 ml was transferred to an empty Petri plate, and then the PCA medium was poured. The plates were incubated for 3 days at 30 °C [46]. After incubation, colonies of mesophilic bacteria, Enterobacteriaceae, yeast and molds were counted and presented as log CFU/g of bread, while the results of B. cereus were presented as positive (when typical growth has been observed) or negative.
2.10.2. Inoculation Test
Aspergillus flavus (isolated from corn flour) and Penicillium aurantiogriseum (isolated from whole wheat flour), both products of the Serbian market, were used for preparation of spore suspensions. The total number of mold spores was 1.8x10⁸ CFU/mL for A. flavus and 1.0x10⁸ CFU/mL for P. aurantiogriseum. Then, two slices of approximately 30 g were cut from each bread sample under sterile conditions and placed in large sterile Petri dishes. 20 µl of the prepared mold suspension was applied to the middle of the bread slice. Prepared samples were stored in ambient conditions, and mold growth was monitored for 14 days by measuring the mycelia diameter [47].
2.11. Statistical Analysis
Statistical analysis was performed using the STATISTICA 14.0.0.15 software (TIBCO Statistica™, Palo Alto, CA, USA). In the analysis of variance (one-way ANOVA) Duncan’s test was used for estimation of the significance of the differences between the mean values at p<0.05 significance level.
3. Results
3.1. Rheological Properties of Dough
The results of the farinographic parameters of dough with the addition of CF and DS are shown in Table 2. Substitution of part of the wheat flour with CF did not have a statistically significant effect on the water absorption (p>0.05). The registered differences were less than 1% and remained at the level of the control sample. According to literature, the substitution of 20% of wheat flour with carob flour can cause both an increase and a decrease in water absorption by about 2.5% [24,25], which can be explained by the different composition of carob flour used in the aforementioned research, and therefore different hydration characteristics [48].
On the other hand, a significant increase in water absorption, by about 10%, was caused by the addition of DS. The mentioned results were expected, given that DS consists mostly of wheat flour and contains 10.4% protein and 75.9% carbohydrates (mainly starch), which are responsible for absorption of water. In addition, higher water absorption values with the addition of DS can also be explained by the increase in gluten solubility due to the increase in dough acidity and the reduction of disulfide bonds of gluten proteins by heterofermentative lactic acid bacteria (LAB) [49]. The addition of DS (on total flour weight) requires larger amount of water to achieve optimal consistency, which contributes to a higher yield of dough, and further to higher yield of bread.
It can also be seen that the substitution of wheat flour with CF up to 15% did not drastically affect the development time compared to the control sample. However, in the samples with the maximum amount of CF, dough development time was extended 3.6 times in regards to the control (Table 2). Data from literature show that the addition of carob flour can prolong the dough development time in much greater extend, from 8 to 11 min for samples with 10-20% CF [25,26]. It is assumed that the development time for dough with CF in our study is lower compared to the literature data due to the applied pre-hydration of the carob flour. The above results are in agreement with the results of Nawrocka et al. [50] that pre-hydration of fiber from carob flour shortens dough development and reduces the interaction between proteins and fibers, which makes it more resistant to mechanical damage during mixing. The mentioned research indicated that the substitution of part of the flour with pre-hydrated carob fibers caused mainly the formation of hydrated/extended β-sheets in the gluten structure, in contrast to aggregates and pseudo-β-sheets that were present if the pretreatment is omitted. Therefore, the obtained results along with the literature suggest that the pre-hydration of CF can reduce negative effects of carob flour constituents on the formation of gluten network. Nevertheless, statistically significant increase in development time (p<0.05) in the sample with the maximum amount of CF flour can be explained by the effect of “gluten dilution” that occurred as a result of replacing a larger amount of wheat flour with CF [51], so it is assumed that with a higher proportion of carob flour rich in insoluble fibers, primarily cellulose, structural and conformational changes occur in the gluten network. In addition, CF is rich in polyphenols, which are able to interact with gluten by forming covalent or hydrogen bonds between protein SH groups and polyphenolic OH groups and thus can affect the redistribution of water and dehydration of gluten during mixing [52]. Also, the presented results (Table 2) indicate that the addition of DS caused a significant increase in the dough development time. The mentioned effect is more pronounced in dough samples with 10 and 15% CF, where development time is 4.5 to 5.0 times longer compared to samples without DS.
When it comes to the stability of the dough, it can generally be said that the addition of CF had a positive effect on the stability. Compared to the stability of the control dough (0.5 min) in all samples there is an increase in stability by 2 to 4 times. However, considering that viscoelastic properties are evaluated based on both the stability and the degree of softening, for a more realistic picture of the contribution of the mentioned increase in stability, the values of the degree of softening must also be considered. The results shown in Table 2 indicate that the addition of CF causes an increase in the degree of dough softening by about 80%. In practice, higher stability and lower degree of softening indicate an improvement in the technological characteristics of the dough [51]. Therefore, the obtained results suggest that the dough with CF would not be able to withstand intensive mechanical processing during production. However, in this aspect the use of DS in the production of bread with CF was justified, since there was a significant increase in the dough stability by 50% and 100%, but also a simultaneous decrease in the degree of softening by 40 to 50% when DS was added to the dough mixture with up to 15% CF (Table 2). The positive effect of DS on the stability of samples with 20% CF was absent, but the degree of softening with 5 and 10% DS was lower by about 50% compared to samples with corresponding amount of CF without DS.
Based on the results obtained by extensographic measurements, it is evident that substitution of a part of the wheat flour with CF majorly negatively affects all parameters. The dough with 10% CF had 2 times higher resistance than the control sample (315 EJ), while increasing the amount of carob flour from 10 to 15 and 20% increased the resistance by an additional 25% (Figure 2). The sample with 20% CF had almost 3 times higher resistance value compared to the control sample, which was also the highest registered value of the mentioned parameter. The observed effect is in agreement with the literature, although the level of recorded values for resistance of the dough with carob flour differs among the published data [25,26,53,54]. The mentioned effect can be explained by the interactions that occur between wheat proteins and the structural components of CF, primarily proteins and fibers, which lead to gluten strengthening [55,56]. However, the addition of DS to the dough with CF caused the opposite effect, where a significant decrease of the initially increased dough resistance was observed. Regardless of the amount of CF in the dough, the addition of 10% DS led to a decrease in resistance to approximate value of 540 EU.
Even though the extensibility of control sample was slightly above the value for standard quality flour, the addition of CF resulted in significant decrease in mentioned parameter (Figure 2). The highest investigated amount of CF lead to a decrease in extensibility by as much as 2 times compared to the control. The obtained values confirmed the cause-and-effect relationship between dough resistance and extensibility. Based on the experimental results, as well as literature data, it can be said that the incorporation of CF into wheat dough does not lead to gluten strengthening as much as to an increase in the stiffness of its structure, which results in less flexible dough and would inevitable cause a deterioration in the quality of the finished product [26]. In addition, when substituting wheat flour with raw materials rich in dietary fiber, the decrease in extensibility is also a consequence of the decrease in gluten content, which enables the dough to stretch during deformation [57].
On the other hand, the addition of DS increased the extensibility of the dough, but only to a small extent (Figure 2). The smallest changes were observed in samples with 10% CF, while the mentioned effect is more pronounced in samples with 15 and 20% CF. The positive effect of DS addition on dough extensibility may be due to a decrease in pH value during sourdough fermentation, which contributes to an increase in gluten elasticity [58]. The mentioned effect coupled with the influence of sourdough on proteolysis leads to a “loosening” of the gluten structure, which was also observed visually during the analysis (Figure 3).
The energy needed for dough stretching is interpreted as an indicator of flour quality, i.e., the dough quality and the qualitative characteristics of the bread. It is considered that optimal rheological properties, good dough workability, and consequently a large, well-shaped product, can be achieved when energy values range between 80-110 cm2 [59]. In Figure 4 it is shown that samples with 10 and 15% CF without DS have higher energy compared to the control dough. Although high energy of dough is highly desirable in breadmaking, the ratio of resistance and extensibility (R/E ratio) is also very important. The R/E ratio of the control sample was in the interval of optimal values for bakery needs from 1.5 to 2.5. A significant increase in this parameter was recorded in all other samples. The dough with 20% CF had the highest R/E ratio, 6 times higher than the control sample.
From the aspect of the energy value and the R/E ratio, a significant impact of the addition of DS was recorded. With an increase in the proportion of DS, there was a decrease in both energy and the R/E ratio of dough with CF (Figure 4). The greatest impact of DS on the reduction of energy and the R/E ratio was registered in samples with 15% CF. The results closest to the optimal values were obtained in samples with 10 and 15% CF with 5 and 10% DS, and it is predicted that those formulations could ensure the appropriate stability of dough during fermentation with the ability to retain formed gases, and thus achieve the appropriate quality of bread.
3.2. Physical and Sensory Quality of Bread
Among the physical properties, the most important quality indicator for bread is its volume. A prerequisite for obtaining large-volume bread is suitable rheological properties of bread dough. The obtained results for the specific volume of bread with CF are shown in Figure 5. By comparing the specific volume of samples with 10% CF and the control, it is noticeable that there is no statistically significant difference in the values of the mentioned parameter (p<0.05). However, replacing wheat flour with 15 and 20% CF significantly reduced the specific volume of bread compared to the control bread. Also, in samples with 15 and 20% CF, there is a noticeable increase in the specific volume of bread with the addition of DS, whereby the stated effect is statistically significant only in samples with 15% CF (Figure 5). Presented results confirmed the predictions made on the basis of the results obtained by rheological measurements. Namely, increasing the amount of CF reduced the extensibility and increased the resistance of the dough, prevented the expansion of gas bubbles during fermentation and ultimately resulted in a smaller product volume. The obtained results are also consistent with the registered positive effect of DS on the behavior of dough with CF, reaffirming the justification of its use in this specific bread formulation.
The sensory quality of the product is of crucial importance for the consumer when choosing and deciding on a certain type of product. For the development of functional products, whose characteristics often deviate from traditional products, it is extremely important that the changes in the parameters that define the sensory quality are within acceptable limits. This ensures its acceptability in the wider population and increases the intake of functional components in the daily diet.
The sensory quality of bread was tested using the scoring method, where the basic attributes of the product were evaluated and the obtained results are shown in Table 3. From the presented results, it can be seen that the only parameter on which the addition of CF and DS had no effect is the smell. By smell was meant the presence or absence of a scent characteristic for a given product and/or used raw materials. The smell of all tested samples was described as characteristic, pleasant and rounded.
The external appearance of the control bread had the maximum score, while in the samples with the addition of 10% and 15% CF there was a slight decrease in the number of points for the external appearance of the bread. The addition of the maximum tested amount of CF had a negative effect on the external appearance, which resulted in a significant decrease in total score (Table 3). In general, the addition of DS in bread with CF did not improve the external appearance of the product.
The greatest importance factor among the tested sensory attributes was assigned to the taste and crumb structure of bread and unequivocal trends were observed. Namely, for both parameters, there was a decrease in the obtained points with an increase in the amount of CF, while the reverse trend was achieved by including DS in the bread formulation (Table 3). When it comes to the taste of bread, half of the observed samples (with 10 and 15% CF) had the same or higher number of points than the control bread (24.0). The exception is sample CF15DS0, where the number of points for taste was 25-40% lower compared to the previously mentioned samples. However, among the samples with 15% CF another exception was the sample with 10% DS, which was characterized by good melting in the mouth, and therefore was easy to chew. A more pronounced negative influence of carob flour on the taste of bread is evident in samples with 20% CF. Although the addition of DS to bread with 20% CF had a positive effect on the taste of the product (increasing the number of points from 12.0 to 18.0), the sample had undesirable doughy taste and smearing in the mouth during chewing was present.
As for the crumb structure, samples with 10, 15 and 20% CF and without DS obtained significantly lower grades, which resulted in a decrease in points by 12, 25 and 37% (Table 3). Furthermore, the presented results indicate that the structure of bread with CF can be significantly improved by adding only a minimum amount of DS. It is important to point out that the compact, rather crumbly, underdeveloped structure of bread with 20% CF was visibly improved by the addition of DS, which confirms the increase in the score for the structure by 20 and 33% (Table 3).
Based on the results for total score it can be seen that with the increase in the proportion of CF, the quality of bread deteriorates, while the addition of DS, regardless of the applied amount, contributes to a positive change in quality category compared to samples without sourdough. Thus, the samples with 10 and 15% CF with DS are in the excellent and very good category, which is at the level of the quality of the control sample or one category higher. The sample with 20% CF without DS had the worst sensory quality, and belonged to the acceptable quality category.
Finally, the optimal raw material composition for bread was chosen in aim to achieve a compromise between the addition of the maximum possible amount of functional ingredient and the deterioration of the physical and sensory characteristics of the product. Sample that would fit within the specified limits was obtained by replacing a part of the wheat flour with carob flour in the amount of 15% and adding the maximum amount of dry sourdough (10%).
3.3. Nutrients and Bioactive Compounds in Bread
Bread sample with optimal raw material composition was further characterized and compared to common white bread (control sample). First, the nutritional composition and mineral content was analyzed and the obtained results were presented in Table 4. From the results shown, it is evident that the energy value of the examined samples was similar, since the composition of the main nutrients was quite uniform. The moisture content of carob bread is 1.2% lower compared to the white bread. Also only small differences were observed in fat content. Although bread belongs to products with low fat content, in the carob bread, the value of this parameter was even lower than in white bread. On the other hand, the protein content in the carob bread was slightly higher compared to the control sample. Carbohydrates make up the largest share in the composition of bread, which is expected given that starch is dominantly present in wheat flour [60]. The difference in the content of total carbohydrates in the examined samples is negligible and amounts to about 55%, however, significant differences occur when looking at the content of available carbohydrates (starch, sugars) and dietary fibers. In carob bread, there was a significant increase in the content of total dietary fibers from 1.27 to 6.48%, where 50% was soluble and 50% insoluble fiber (Table 4). According to the results shown and the Regulation of the European parliament and of the council on nutrition and health claims made on foods [61], bread made with 15% carob flour can carry the nutritional claim “rich in fiber” which can be applied to products containing at least 6 g of dietary fiber per 100 g of product.
In addition, it can be observed that in carob bread there was an increase in the ash content compared to the white bread, which indicates an increase in the content of minerals. The detailed mineral composition of the carob and white bread is shown in Table 5. Based on the obtained results, carob bread had about 2 times higher content of all tested macro minerals (K, Ca and Mg) compared to control sample. When looking at the content of micro minerals (Fe, Zn, Mn and Cu), the differences between the samples were not so obvious, however were significant. Namely, in carob bread the content of Fe, Mn and Cu was higher compared to the white bread. The obtained results were expected considering that carob flour is rich in minerals, which was previously shown in several scientific works [62,63,64]. However, the determination of mineral content in bread with carob flour was not found in the literature. Babiker et al. [65] examined the mineral composition of biscuits with different proportions of carob flour obtained by grinding whole carob fruit. Their results confirmed that the addition of carob increases the content of most of the investigated minerals in biscuits, which is in agreement with the results of our study.
Furthermore, Table 5 shows the Nutritional Reference Values (NRV) and the value 15% NRV, which is defined as a Significant Amount of minerals. Those are a set of numerical values that are used for the purposes of nutrition labelling and relevant claims. Accordingly, nutrition claim “source of mineral” is allowed when the mineral content in food product contains at least a Significant Amount of minerals (15% NRV per 100 g of bread), while for nutrition claim “high in mineral” the twice the Significant Amount of those nutrients is required [61]. The obtained amounts of minerals in carob bread were sufficient for the use of nutrition claim “rich in manganese” and “source of copper”. Provided that the legal conditions prescribed by the already mentioned Regulations [61] are met, in addition to the mentioned nutritional claims, carob bread can be a potential holder of 8 health claims related to copper and 4 health claims related to manganese, which certainly confirms its functional characteristics.
Furthermore, polyphenol content and antioxidant activity of carob and white bread were determined and compared. According to the results shown in Table 6, the content of total phenols (TP) in carob bread was about 10 times higher compared to the control sample. Even more pronounced difference between the tested bread samples was confirmed by antioxidant tests. Carob bread had about 5.5 times greater ability to reduce Fe3+ ions (FRAP test), about 12 times greater ability to neutralize DPPH radicals, while the ability to neutralize ABTS radicals of the mentioned bread was 26 times higher compared to the corresponding antioxidant activities of white bread.
However, when it comes to the content of total flavonoids (TF), it is evident that the obtained results are unrealistic. Namely, the registered content of TF is higher than the content of TP, which is illogical considering that flavonoids are a subgroup of phenols [66]. In addition, the values obtained for the content of total flavonoids in the control sample are initially high and relatively close to the values obtained for the sample with carob flour, which indicates that when performing the mentioned spectrophotometric analysis of bread samples, regardless of the type of additive or raw material composition, certain interferences occur. Since the TF content was not examined in any of the scientific publication dealing with the topic of bread with carob flour, it was not possible to compare experimentally obtained values with other research. There are some studies investigating bread with different raw materials that also showed higher content of TF compared to TP [67,68,69], however, this phenomenon was not clarified or discussed.
It is important to point out that a higher content of phenolic compounds and a higher antioxidant activity were registered in the whole bread (crust and crumb) compared to the bread crumb only, especially in the case of carob bread (Table 6). The obtained results are in agreement with the literature data, where it was shown that the mentioned increase in antioxidant activity in the bread crust occurs due to the formation of Maillard reaction products [70]. Although in the past the Maillard reaction products were characterized as anti-nutritive and toxic, the above results confirm that they can also be potential carriers of antioxidant activity in food products [71].
3.3. Microbiological Quality of Bread
In order to examine the effects of the addition of carob flour on the microbiological quality of bread, the total number of bacteria, spore-forming bacteria, Enterobacteriaceae, molds and yeasts, as well as the presence of Bacillus cereus, was determined. The microbiological quality of the examined samples was monitored for 14 days, and the results are shown in Table 7. During the 14 days of testing, the presence of B. cereus was not detected and the total number of Enterobacteriaceae and yeasts was <1.0 log CFU/g for both samples.
It can be observed that on the fourth day, the total bacterial count (TBC) in the control sample was > 5 log CFU/g, while in the carob bread there was no change in TBC (Table 7). During the first seven days the difference between samples was the most pronounced – carob bread had about 4 and 3 log CFU/g lower TBC compared to the white bread. In the second week of monitoring the mentioned differences decreased and were around 1 log CFU/g (day 11) and <1 log CFU/g (day 14).
The total spore count (TSC) in the white bread from the fourth day ranged from 2.3 to 2.9 log CFU/g. The changes in the total spore count (TSC) during the sampling period was not consistent. However, the obtained results mainly indicate that carob bread had lower TSC in regards to white bread until day eleven. The presence of molds in the carob bread was not detected during the fourteen days of monitoring, while in the control bread their presence was detected on the first and fourth day (Table 7).
According to guidelines for the microbiological quality of certain groups of food products it is defined that the total count of aerobic bacteria in bakery products should not exceed < 105 CFU/g, and total yeast and molds count should be < 104 CFU/g [72,73]. Based on the mentioned prescribed values, the microbiological quality of the white bread after four days was unsatisfactory, while the quality of carob bread was within the acceptable limits for eleven days.
In order to obtain a more complete picture of the antimicrobial potential of carob flour and to examine the effects of its addition on mold growth and development in bread, an inoculation test was performed. The application of this microbiological test is especially important when developing new products with the addition of raw materials that have a certain antimicrobial potential [74]. The molds Aspergillus flavus and Penicillium aurantiogriseum, which were used to perform this test, are among the most common contaminants of basic ingredients for the production of bakery products and are their main cause of their spoiling [75].
Figure 6 shows the results of the inoculation test, which indicate that there was no visible growth of A. flavus during the first three days of testing. From day four to day eleven the mycelia diameter of A. flavus in carob bread was lower compared to white bread. From the eighth to the thirteenth day the growth stagnation of A. flavus on white bread sample was observed, with a diameter of 50 mm. Similarly, in carob bread the mycelia diameter was constant, but only for three days, after which there was an increase of the observed parameter, and the registered values were higher compared to the control sample.
The effect of carob flour addition in bread on the growth of P. aurantiogriseum was less pronounced compared to the growth of A. flavus (Figure 7). The first visible colony growth, as in the case of A. flavus inoculation, was recorded only on the fourth day. However, during the first six days of monitoring, there was no difference in the mycelia diameter between the examined bread samples. During the next six days the mycelia diameter of P. aurantiogriseum on carob bread was smaller compared to the mycelia on white bread. Stagnation of mycelia growth was observed from day nine to day twelve for both samples. After that, there was a sudden increase in the observed parameter, where, unlike A. flavus, there was no difference in mycelia diameter of P. aurantiogriseum between the observed samples.
Based on the obtained results, it can be concluded that carob flour contributes to the improvement of the microbiological quality of the bread and due to the presence of antimicrobial components prolongs the durability of the product up to 7 days.
4. Conclusions
The addition of carob flour (CF) has a negative effect on the rheological behavior of the dough and consequently impairs the physical and sensory properties of the bread. By pre-hydration of CF for 15 minutes, the negative effects on dough development were successfully overcome for samples with 10 and 15% CF. However, the negative effects of CF on resistance and extensibility of the dough were compensated by the addition of dry sourdough (DS). The higher specific volume, the well-developed crumb structure and the better sensory properties of the bread with CF achieved by the addition of DS justify its use as an improver in the production of functional bread with carob flour. The bread with optimal physical and sensory quality was the sample with 15% CF and 10% DS and was characterized by a specific volume of 2.82 cm3/g and total score for sensory attributes of 86.0 (max. 100), placing it in the quality class “very good”.
From the results of this study it was concluded that the addition of CF improves the nutritional value of the bread, as the bread with 15 % CF had total fiber content of 6.48 g/100 g, which was sufficient for the nutritional claim “rich in fiber”. The contribution of CF to improving the nutritional quality of the bread was also evident in the increase in the mineral content, especially of manganese and copper. Due to the presence of bioactive compounds, the antioxidant activity of bread with 15 % CF was several times higher compared to common white bread. In addition, microbiological tests confirmed that CF affected the freshness and durability of the bread, which was prolonged for up to seven days, so that it can be labeled as bread with an extended shelf life. Therefore, carob flour as a by-product of carob processing can be successfully used for the development of functional bread whose nutritional value is adapted to modern dietary trends.
Author Contributions
Conceptualization, D.Š.-S. and S.K.-T.; methodology, B.P. and S.B.; validation, J.P. and Z.Š.; formal analysis, L.P., D.B., N.M.; investigation, J.Z.; data curation, B.P.; writing—original draft preparation, J.P. and J.Z.; writing—review and editing, D.Š.-S., S.K.-T. and B.P.; visualization, J.Z.; supervision, Z.Š. and D.Š.-S. All authors have read and agreed to the published version of the manuscript.
Funding
This research was funded by Ministry of Science, Technological Development and Innovations of the Republic Serbia, No. 451-03-66/2024-03/200134 and No. 451-03-65/2024-03/200134.
Data Availability Statement
Data is contained within the article.
Acknowledgments
The authors would like to thank prof. Peter Raspor and prof. Sonja Smole Možina (University of Ljubljana, Slovenia) for the original idea from which this research derived and therefore acknowledge their contribution.
Conflicts of Interest
The authors declare no conflicts of interest.
References
- Miletić, I.; Šobajić, S.; Đorđević, B. Funkcionalna hrana – uloga u unapređenju zdravlja. J. Med. Biochem. 2008, 27(3), 367–370. [Google Scholar] [CrossRef]
- Baumel, A.; Mirleau, P.; Viruel, J.; Bou, M.; Kharrat, D.; La Malfa, S.; Ouahmane, L.; Diadema, K.; Moakhar, M.; Sanguin, H.; Médail, F. Assessment of plant species diversity associated with the carob tree (Ceratonia siliqua, Fabaceae) at the Mediterranean scale. Plant Ecol. Evol. 2018, 151(2), 185–193. [Google Scholar] [CrossRef]
- Novaković, B.; Mirosavljev, M. Higijena ishrane; Medicinski fakultet: Novi Sad, 2002. [Google Scholar]
- Gębski, J.; Jezewska-Zychowicz, M.; Szlachciuk, J.; Kosicka-Gębska, M. Impact of nutritional claims on consumer preferences for bread with varied fiber and salt content. Food Qual. Prefer. 2019, 76, 91–99. [Google Scholar] [CrossRef]
- Almeida, E. L.; Chang, Y. K.; Steel, C. J. Dietary fibre sources in bread: Influence on technological quality. LWT-Food Sci. Technol. 2013, 50 (2), 545-553. [CrossRef]
- De Steur, H.; Gellynck, X.; Storozhenko, S.; Liqun, G.; Lambert, W.; Van Der Straeten, D.; Viaene, J. Willingness-to-accept and purchase genetically modified rice with high folate content in Shanxi Province, China. Appetite 2010, 54(1), 118–125. [Google Scholar] [CrossRef]
- Brassesco, M. E.; Brandão, T. R. S.; Silva, C. L. M.; Pintado, M. Carob bean (Ceratonia siliqua L.): A new perspective for functional food. Trends Food Sci. Technol. 2021, 114, 310–322. [Google Scholar] [CrossRef]
- Spiteri, M.; Soler, L. G. Food reformulation and nutritional quality of food consumption: An analysis based on households panel data in France. Eur. J. Clin. Nutr. 2018, 72(2), 228–235. [Google Scholar] [CrossRef]
- Stavrou, I. J.; Christou, A.; Kapnissi-Christodoulou, C. P. Polyphenols in carobs: A review on their composition, antioxidant capacity and cytotoxic effects, and health impact. Food Chem. 2018, 269, 355–374. [Google Scholar] [CrossRef]
- Yousif, A. K.; Alghzawi, H. M. Processing and characterization of carob powder. Food Chem. 2000, 69(3), 283–287. [Google Scholar] [CrossRef]
- Rodríguez-Solana, R.; Carlier, J. D.; Costa, M. C.; Romano, A. Multi-element characterisation of carob, fig and almond liqueurs by MP-AES. J. Inst. Brew. 2018, 124, 300–309. [Google Scholar] [CrossRef]
- Polanowska, K.; Varghese, R.; Kuligowski, M.; Majcher, M. Carob kibbles as an alternative raw material for production of kvass with probiotic potential. J. Sci. Food Agric. 2021, 101(13), 1–11. [Google Scholar] [CrossRef]
- Elfazazi, K.; Harrak, H.; Achchoub, M.; Benbati, M. Physicochemical criteria, bioactive compounds and sensory quality of Moroccan traditional carob drink. Mater. Today: Proc. 2020, 27, 3249–3253. [Google Scholar] [CrossRef]
- Rababah, T. M.; Al-u’datt, M.; Ereifej, K.; Almajwal, A.; Al-Mahasneh, M.; Brewer, S.; Alsheyab, F.; Yang, W. Chemical, functional and sensory properties of carob juice: Properties of carob juice. J. Food Qual. 2013, 36, 238–244. [Google Scholar] [CrossRef]
- Moreira, T. C.; Transfeld da Silva, Á.; Fagundes, C.; Ferreira, S. M. R.; Cândido, L. M. B.; Passos, M.; Krüger, C. C. H. Elaboration of yogurt with reduced level of lactose added of carob (Ceratonia siliqua L.). LWT - Food Sci. Technol. 2017, 76, 326–329. [Google Scholar] [CrossRef]
- Mahtout, R.; Zaidi, F.; Ould Saadi, L.; Boudjou, S.; Oomah, B. D.; Hosseinian, F. Carob (Ceratonia siliqua L.) flours and pulp mucilage affect kefir quality and antioxidant capacity during storage. Int. J. Eng. Technol. 2016, 2(2), 168–180. http://www.ijetjournal.org/Volume2/Issue2/IJET-V2I2P28.pdf.
- Srour, N.; Daroub, H.; Toufeili, I.; Olabi, A. Developing a carob-based milk beverage using different varieties of carob pods and two roasting treatments and assessing their effect on quality characteristics: Effect of roasting on a carob-based milk beverage. J. Sci. Food Agric. 2016, 96, 3047–3057. [Google Scholar] [CrossRef]
- Červenka, L.; Frühbauerová, M.; Velichová, H. Functional properties of muffin as affected by substituing wheat flour with carob powder. Slovak J. Food Sci. 2019, 13(1), 212–217. [Google Scholar] [CrossRef]
- Farias, J. N.; do Nascimento, F. P. B.; Salvador, A. A.; da Silva, A. A. N.; dos Anjos Tamasia, G.; Rossetti, F. X.; de Brito Bello, S. R.; Vicentini, M. S. Desenvolvimento de biscoitos integrais à base de farinha de alfarroba como uma alternativa para substituição do cacau em pó. Int. J. Nutr. 2019, 12, 41–47. [Google Scholar] [CrossRef]
- Youssef, M. K. E.; Ali, H. M.; El-Manfaloty, M. M. Nutritional assessment of wheat biscuits and fortified wheat biscuits with carob pod powder (Ceratonia siliqua L.). Food Public Health 2013, 3, 336–340. [Google Scholar]
- Rosa, C. S.; Tessele, K.; Prestes, R. C.; Silveira, M.; Franco, F. Effect of substituting of cocoa powder for carob flour in cakes made with soy and banana flours. Int. Food Res. J. 2015, 22, 2111–2118. [Google Scholar]
- Herken, E.; Aydin, N. Use of carob flour in the production of tarhana. Pol. J. Food Nutr. Sci. 2015, 65, 167–174. [Google Scholar] [CrossRef]
- Sęczyk, Ł.; Świeca, M.; Gawlik-Dziki, U. Effect of carob (Ceratonia siliqua L.) flour on the antioxidant potential, nutritional quality, and sensory characteristics of fortified durum wheat pasta. Food Chem. 2016, 194, 637–642. [Google Scholar] [CrossRef]
- Salinas, M. V.; Carbas, B.; Brites, C.; Puppo, M. C. Influence of different carob flours (Ceratonia siliqua L.) on wheat dough performance and bread quality. Food Bioprocess Technol. 2015, 8, 1561–1570. [Google Scholar] [CrossRef]
- Šoronja-Simović, D.; Smole-Možina, S.; Raspor, P.; Maravić, N.; Zahorec, J.; Luskar, L.; Šereš, Z. Carob flour and sugar beet fiber as functional additives in bread. Acta Period. Technol. 2016, 47, 83–93. [Google Scholar] [CrossRef]
- Šoronja-Simović, D.; Zahorec, J.; Šereš, Z.; Maravić, N.; Smole Možina, S.; Luskar, L.; Luković, J. Challenges in determination of rheological properties of wheat dough supplemented with industrial by-products: carob pod flour and sugar beet fibers. J. Food Meas. Charact. 2021, 15, 914–922. [Google Scholar] [CrossRef]
- Rico, D.; Alonso De Linaje, A.; Herrero, A.; Asensio-Vegas, C.; Miranda, J.; Martínez-Villaluenga, C.; De Luis, D. A.; Martin-Diana, A. B. Carob by-products and seaweeds for the development of functional bread. J. Food Process. Preserv. 2018, 42(8), 1–9. [Google Scholar] [CrossRef]
- Adams, V.; Ragaee, S.; Abdel-Aal, E.-S. M. Impact of wheat fiber on frozen dough shelf life and bread quality. Cereal Chem. 2015, 92(4), 370–377. [Google Scholar] [CrossRef]
- Miś, A.; Krekora, M.; Niewiadomski, Z.; Dziki, D.; Nawrocka, A. Water redistribution between model bread dough components during mixing. J. Cereal Sci. 2020, 95, 103035. [Google Scholar] [CrossRef]
- Betoret, E.; Rosell, C. M. Enrichment of bread with fruits and vegetables: Trends and strategies to increase functionality. Cereal Chem. 2020, 97(1), 9–19. [Google Scholar] [CrossRef]
- Raghavendra, S. N.; Rastogi, N. K.; Raghavarao, K. S. M. S.; Tharanathan, R. N. Dietary Fiber from Coconut Residue: Effects of Different Treatments and Particle Size on the Hydration Properties. Eur. Food Res. Technol. 2004, 218, 563–567. [Google Scholar] [CrossRef]
- AACC International. AACCI Method 54-10.01 Physical Dough Tests Methods: Extensigraph Method, General. In Approved Methods of the American Association of Cereal Chemists, 11th ed.; AACC International: St. Paul, MN, USA, 2010. [Google Scholar]
- AACC International. AACCI Method 54-21.02 Physical Dough Tests Methods: Rheological Behavior of Flour by Farinograph: Constant Flour Weight Procedure. In Approved Methods of the American Association of Cereal Chemists, 11th ed.; AACC International: St. Paul, MN, USA, 2010. [Google Scholar]
- AACC International. AACCI Method 10-05 Baking Quality Methods: Guidelines for Measurement of Volume by Rapeseed Displacement. In Approved Methods of the American Association of Cereal Chemists, 11th ed.; AACC International: St. Paul, MN, USA, 2008. [Google Scholar]
- ISO 8586. Sensory Analysis—General Guidelines for the Selection, Training and Monitoring of Selected Assessors and Expert Sensory Assessors; ISO: Geneva, Switzerland, 2012. [Google Scholar]
- ISO 8589. Sensory Analysis—General Guidance for the Design of Test Rooms; ISO: Geneva, Switzerland, 2007. [Google Scholar]
- AOAC (Association of Official Analytical Chemists). Official Methods of Analysis of the Association of Official Analytical Chemists International, 17th ed.; Association of Official Analytical Communities: Gaithersburg, MD, USA, 2000. [Google Scholar]
- SRPS EN ISO 6869/2008. Animal Feeding Stuffs–Determination of the Contents of Calcium, Copper, Iron, Magnesium, Manganese, Potassium, Sodium and Zinc—Method Using Atomic Absorption Spectrometry; Institute for Standardization of Serbia: Belgrade, Serbia, 2008. [Google Scholar]
- Peić Tukuljac, L.; Krulj, J.; Kojić, J.; Šurlan, J.; Bodroža-Solarov, M.; Miljević, B.; Šereš, Z.; Maravić, N. Biosorption of Na+, K+, and Ca2+ from Alkalized Sugar Juice by Unmodified Pressed Sugar Beet Pulp in Closed-Loop Column System. Sugar Tech 2023, 25, 766–776. [Google Scholar] [CrossRef]
- Gumul, D.; Korus, J.; Ziobro, R.; Kruczek, M. Enrichment of Wheat Bread with Apple Pomace as a Way to Increase Pro-Health Constituents. Qual. Assur. Saf. Crops Foods 2019, 11(3), 231–240. [Google Scholar] [CrossRef]
- Zahorec, J.; Šoronja-Simović, D.; Kocić-Tanackov, S.; Bulut, S.; Martić, N.; Bijelić, K.; Božović, D.; Pavlić, B. Carob Pulp Flour Extract Obtained by a Microwave-Assisted Extraction Technique: A Prospective Antioxidant and Antimicrobial Agent. Separations 2023, 10, 465. [Google Scholar] [CrossRef]
- ISO 4833-1. Microbiology of the Food Chain–Horizontal Method for the Enumeration of Microorganisms–Part 1: Colony Count at 30 Degrees C by the Pour Plate Technique; International Organization for Standardization: Geneva, Switzerland, 2013. [Google Scholar]
- ISO 21528-1. Microbiology of the Food Chain–Horizontal Method for the Detection and Enumeration of Enterobacteriaceae–Part 1: Detection of Enterobacteriaceae; International Organization for Standardization: Geneva, Switzerland, 2017. [Google Scholar]
- ISO 7954. Microbiology–General Guidance for Enumeration of Yeasts and Moulds–Colony Count Technique at 25 Degrees C; International Organization for Standardization: Geneva, Switzerland, 1987. [Google Scholar]
- ISO 7932. Microbiology of Food and Animal Feeding Stuffs–Horizontal Method for the Enumeration of Presumptive Bacillus cereus–Colony-Count Technique at 30 Degrees C; International Organization for Standardization: Geneva, Switzerland, 2003. [Google Scholar]
- ISO 20976-1. Microbiology of the Food Chain–Requirements and Guidelines for Conducting Challenge Tests of Food and Feed Products; International Organization for Standardization: Geneva, Switzerland, 2019. [Google Scholar]
- Samapundo, S.; Devlieghere, F.; Vroman, A.; Eeckhout, M. Antifungal Activity of Fermentates and Their Potential to Replace Propionate in Bread. LWT - Food Sci. Technol. 2017, 76, Part A, 101–107. [Google Scholar] [CrossRef]
- Thebaudin, J. Y.; Lefebvre, A. C.; Harrington, M.; Bourgeois, C. M. Dietary Fibres: Nutritional and Technological Interest. Trends Food Sci. Technol. 1997, 8(2), 41–48. [Google Scholar] [CrossRef]
- Gänzle, M. G.; Lopponen, J.; Gobetti, M. Proteolysis in Sourdough Fermentations: Mechanisms and Potential for Improved Bread Quality. Trends Food Sci. Technol. 2008, 19, 513–521. [Google Scholar] [CrossRef]
- Nawrocka, A.; Krekora, M.; Niewiadomski, Z.; Szymańska-Chargot, M.; Krawęcka, A.; Sobota, A.; Miś, A. Effect of Moisturizing Pre-treatment of Dietary Fibre Preparations on Formation of Gluten Network During Model Dough Mixing–A Study with Application of FT-IR and FT-Raman Spectroscopy. LWT-Food Sci. Technol. 2020, 121, 108959. [Google Scholar] [CrossRef]
- Dapčević Hadnađev, T.; Pojić, M.; Hadnađev, M.; Torbica, A. The Role of Empirical Rheology on Flour Quality Control. In Wide Spectra of Quality Control; Akyar, I., Ed.; InTech: Rijeka, Croatia, 2011; pp. 335–360. [Google Scholar]
- Krekora, M.; Nawrocka, A. Effect of a Polyphenol Molecular Size on the Gluten Proteins–Polyphenols Interactions Studied with FT-Raman Spectroscopy. Food Biophys. 2022, 17(4), 535–544. [Google Scholar] [CrossRef]
- Issaoui, M.; Flamini, G.; Delgado, A. Sustainability Opportunities for Mediterranean Food Products Through New Formulations Based on Carob Flour (Ceratonia siliqua L.). Sustainability 2021, 13, 8026. [Google Scholar] [CrossRef]
- Šoronja-Simović, D.; Zahorec, J.; Šereš, Z.; Griz, A.; Sterniša, M.; Smole Možina, S. The Food Industry By-products in Bread Making: Single and Combined Effect of Carob Pod Flour, Sugar Beet Fibers and Molasses on Dough Rheology, Quality and Food Safety. J. Food Sci. Technol. 2022, 59(4), 1429–1439. [Google Scholar] [CrossRef]
- Miś, A.; Dziki, D. Extensograph Curve Profile Model Used for Characterising the Impact of Dietary Fibre on Wheat Dough. J. Cereal Sci. 2013, 57(3), 471–479. [Google Scholar] [CrossRef]
- Miś, A.; Nawrocka, A.; Dziki, D. Behaviour of Dietary Fibre Supplements During Bread Dough Development Evaluated Using Novel Farinograph Curve Analysis. Food Bioprocess Technol. 2017, 10, 1031–1041. [Google Scholar] [CrossRef]
- Kieffer, R.; Garnreiter, F.; Belitz, H. D. Beurteilung von Teigeigenschaften Durch Zugversuche im Mikromassstab. Z. Lebensm.-Unters. Forsch. 1981, 127, 193–194. [Google Scholar] [CrossRef]
- Oshiro, M.; Zendo, T.; Nakayama, J. Diversity and Dynamics of Sourdough Lactic Acid Bacteriota Created by a Slow Food Fermentation System. J. Biosci. Bioeng. 2021, 131, 333–340. [Google Scholar] [CrossRef] [PubMed]
- Atwell, W. A.; Finnie, S. Wheat Flour, 2nd ed.; Woodhead Publishing: Sawston, UK, 2016; ISBN 978-1-891127-90-8. [Google Scholar]
- Gao, X.; Tong, J.; Guo, L.; Yu, L.; Li, S.; Yang, B.; Wang, L.; Liu, Y.; Guo, J.; Zhai, S.; Liu, C.; Rehman, A.; Farahnaky, A.; Wang, P.; Wang, Z.; Cao, X. Influence of Gluten and Starch Granules Interactions on Dough Mixing Properties in Wheat (Triticum aestivum L.). Food Hydrocolloids 2020, 106, 105885. [Google Scholar] [CrossRef]
- European Parliament and Council. Regulation (EC) No 1924/2006 on Nutrition and Health Claims Made on Foods. Official Journal of the European Union, 2007, L12, 3–18.
- Özcan, M. M.; Arslan, D.; Gökçalik, H. Some Compositional Properties and Mineral Contents of Carob (Ceratonia siliqua) Fruit, Flour, and Syrup. Int. J. Food Sci. Nutr. 2009, 58(8), 652–658. [Google Scholar] [CrossRef]
- Oziyci, H. R.; Tetik, N.; Turhan, I.; Yatmaz, E.; Ucgun, K.; Akgul, H.; Gubbuk, H.; Karhan, M. Mineral Composition of Pods and Seeds of Wild and Grafted Carob (Ceratonia siliqua L.) Fruits. Sci. Hortic. 2014, 167, 149–152. [Google Scholar] [CrossRef]
- Papaefstathiou, E.; Agapiou, A.; Giannopoulos, S.; Kokkinofta, R. Nutritional Characterization of Carobs and Traditional Carob Products. Food Sci. Nutr. 2018, 6(8), 2151–2161. [Google Scholar] [CrossRef]
- Babiker, E. E.; Özcan, M. M.; Ghafoor, K.; Al Juhaimi, F.; Ahmed, I. A. M.; Almusallam, I. A. Physico-Chemical and Bioactive Properties, Fatty Acids, Phenolic Compounds, Mineral Contents, and Sensory Properties of Cookies Enriched with Carob Flour. J. Food Process. Preserv. 2020, 44(10), e14745. [Google Scholar] [CrossRef]
- Mrduljaš, N.; Krešić, G.; Bilušić, T. Polyphenols: Food Sources and Health Benefits. In Functional Food-Improve Health through Adequate Food; Heda, M. C., Ed.; InTech: Rijeka, Croatia, 2017; pp. 23–41. [Google Scholar]
- Badr, S. A. Quality and Antioxidant Properties of Pan Bread Enriched with Watermelon Rind Powder. Curr. Sci. Int. 2015, 4(1), 117–126. [Google Scholar]
- Bhatt, S. M.; Gupta, R. K. Bread (Composite Flour) Formulation and Study of Its Nutritive, Phytochemical, and Functional Properties. J. Pharmacogn. Phytochem. 2015, 4(2), 254–268. [Google Scholar]
- Özcan, M. M. The Effect of Ginger (Zingiber officinale) Powders at Different Concentrations on Bioactive Compounds, Antioxidant Activity, Phenolic Constituents, Nutrients, and Sensory Characteristics of Wheat Bread. Int. J. Gastronomy Food Sci. 2022, 28, 100532. [Google Scholar] [CrossRef]
- Michalska, A.; Amigo-Benavent, M.; Zielinski, H.; del Castillo, M. D. Effect of Bread Making on Formation of Maillard Reaction Products Contributing to the Overall Antioxidant Activity of Rye Bread. J. Cereal Sci. 2008, 48(1), 123–132. [Google Scholar] [CrossRef]
- Echavarría, A. P.; Pagán, J.; Ibarz, A. Melanoidins Formed by Maillard Reaction in Food and Their Biological Activity. Food Eng. Rev. 2012, 4, 203–223. [Google Scholar] [CrossRef]
- Gilbert, R.; De Louvois, J.; Donovan, T.; Little, C.; Nye, K.; Ribeiro, C.; Richards, J.; Roberts, D.; Bolton, F. J. Guidelines for the Microbiological Quality of Some Ready-to-Eat Foods Sampled at the Point of Sale. Commun. Dis. Public Health 2000, 3(3), 163–167. [Google Scholar] [PubMed]
- Ali, M. A.; Hashish, M. H.; Fekry, M. M. Microbiological Quality of Some Packed and Unpacked Bread Products in Alexandria, Egypt. J. Egypt. Public Health Assoc. 2023, 98(1), 16. [Google Scholar] [CrossRef]
- Hoornstra, E.; Notermans, S. Quantitative Microbiological Risk Assessment. Int. J. Food Microbiol. 2001, 66(1–2), 21–29. [Google Scholar] [CrossRef] [PubMed]
- Saranraj, P.; Geetha, M. Microbial Spoilage of Bakery Products and Its Control by Preservatives. Int. J. Pharm. Biol. Arch. 2012, 3(1), 38–48. [Google Scholar]
Figure 1.
Carob pulp flour a) untreated and b) prehydrated.
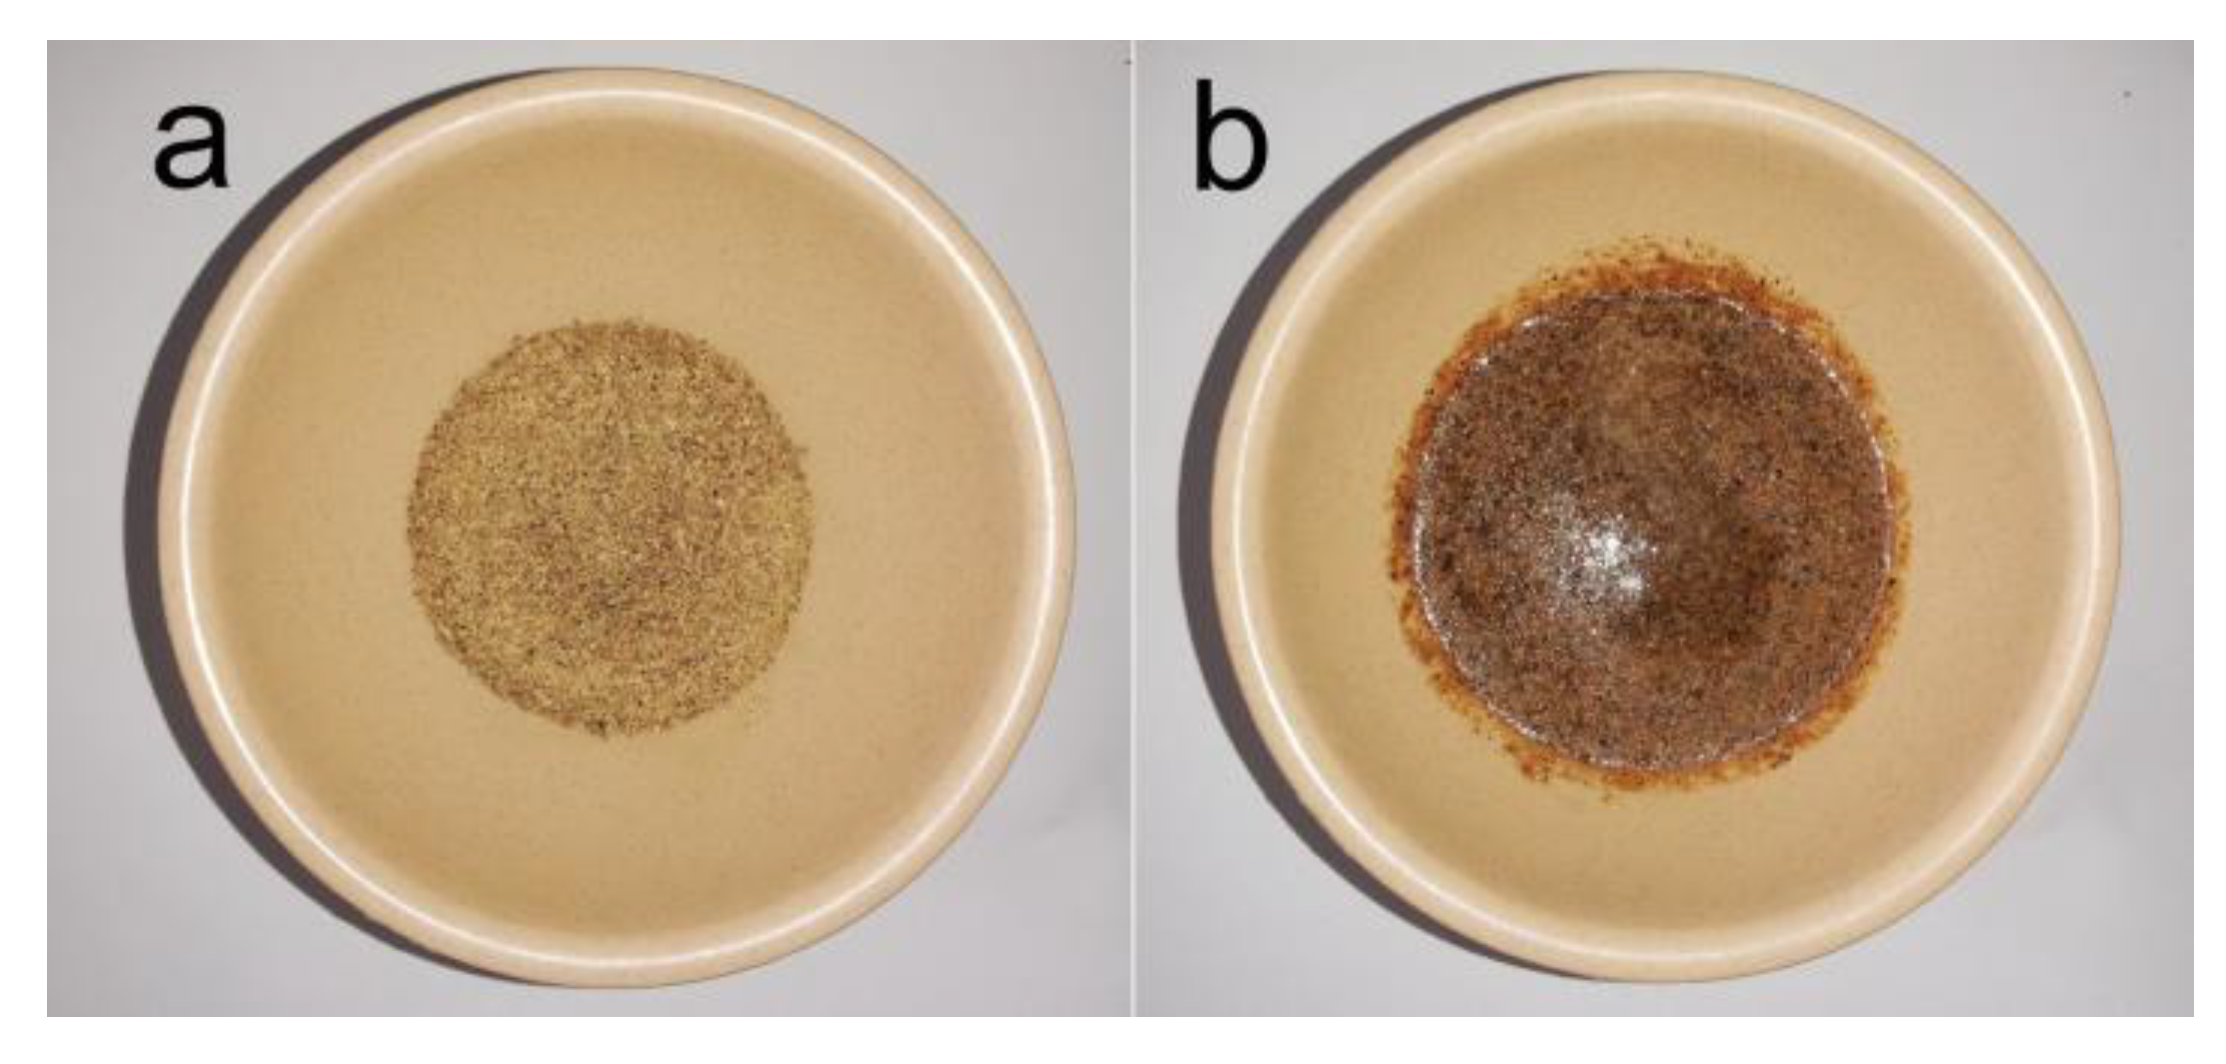
Figure 2.
Influence of carob flour (CF) and dry sourdough (DS) addition on: (a) resistance and (b) extensibility.
Figure 2.
Influence of carob flour (CF) and dry sourdough (DS) addition on: (a) resistance and (b) extensibility.
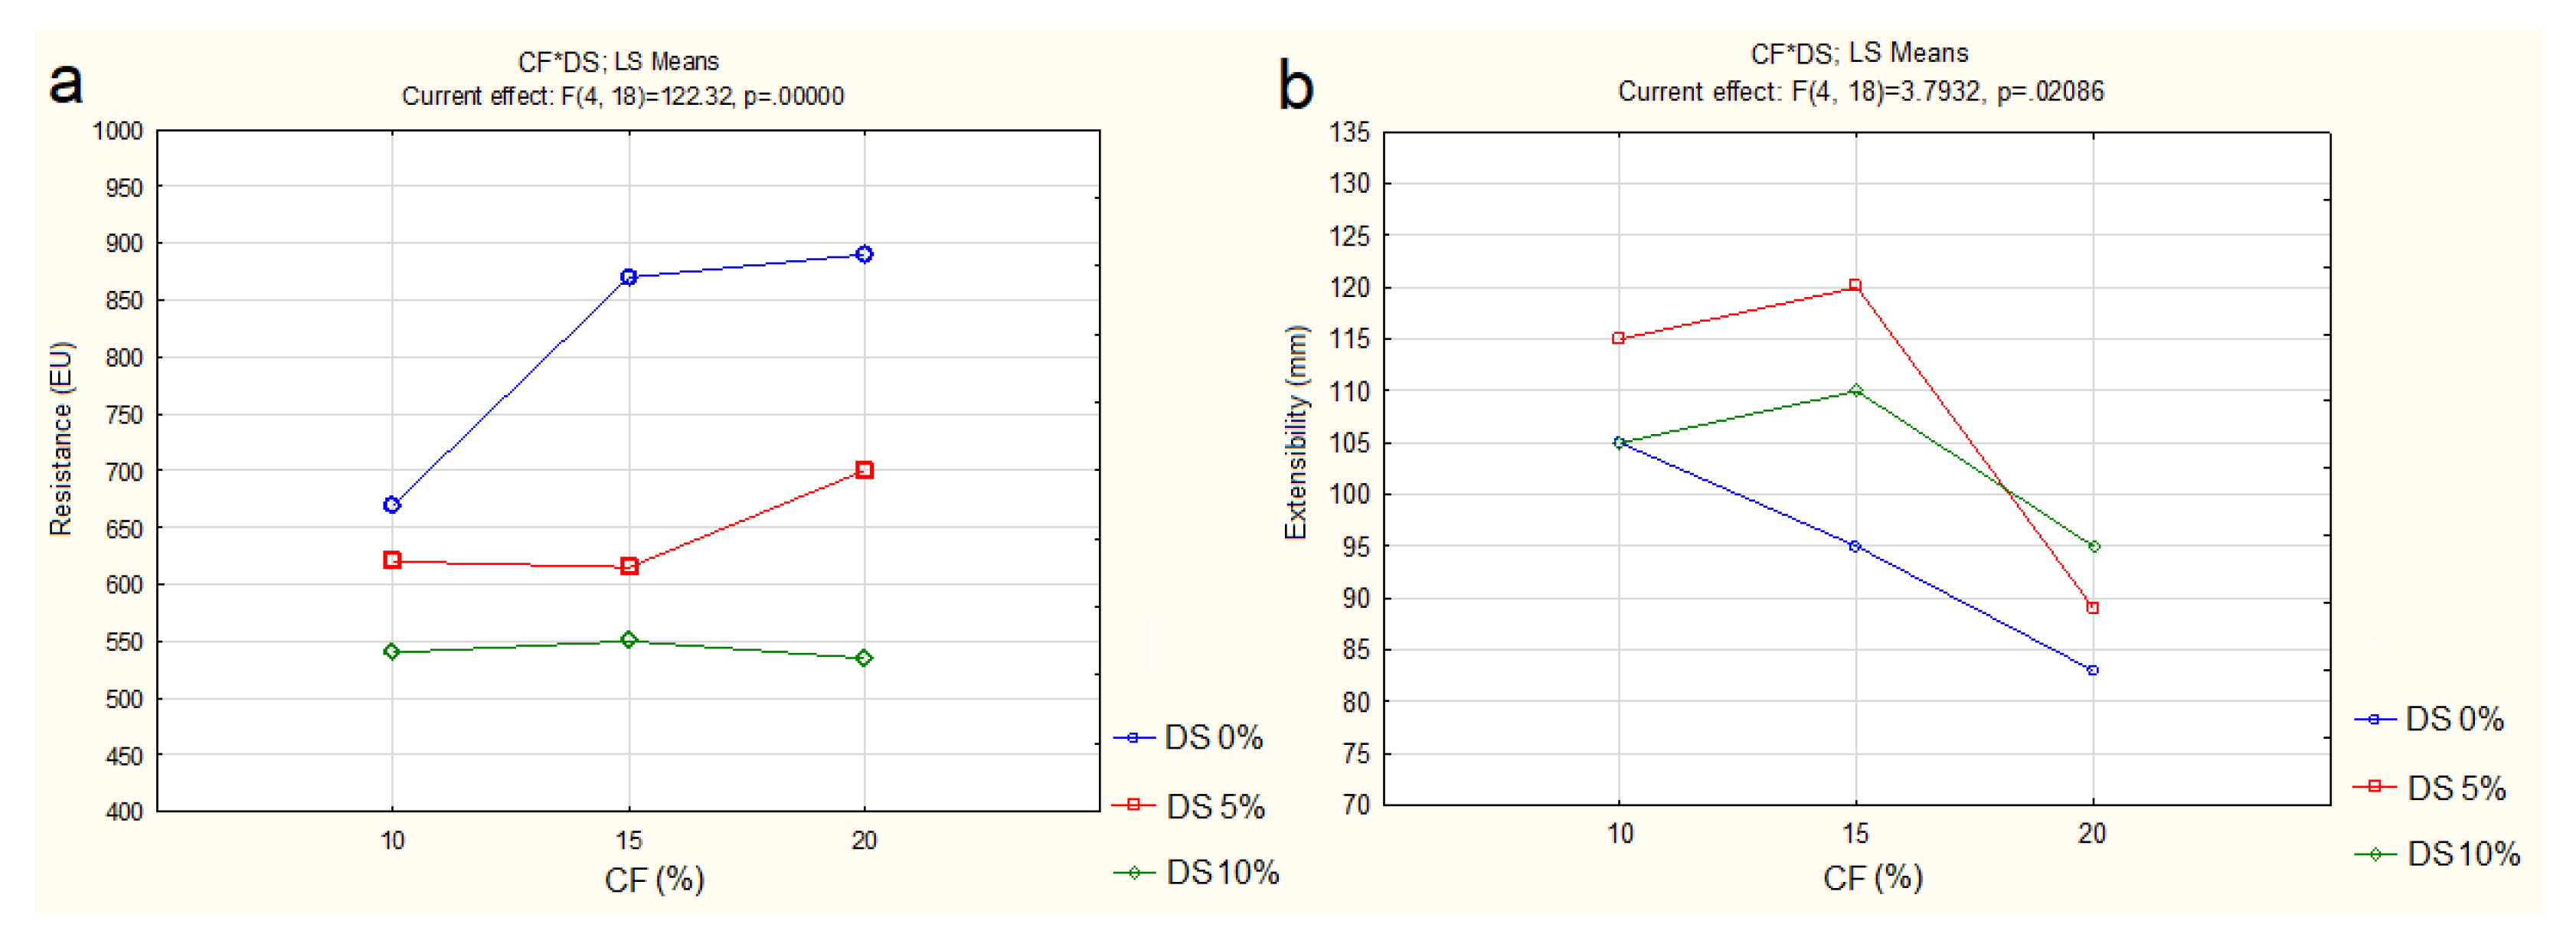
Figure 3.
Dough sample with 15% carob flour for extensographic testing after 45 min rest period: (a) with 0% of dry sourdough; (b) with 10% of dry sourdough.
Figure 3.
Dough sample with 15% carob flour for extensographic testing after 45 min rest period: (a) with 0% of dry sourdough; (b) with 10% of dry sourdough.
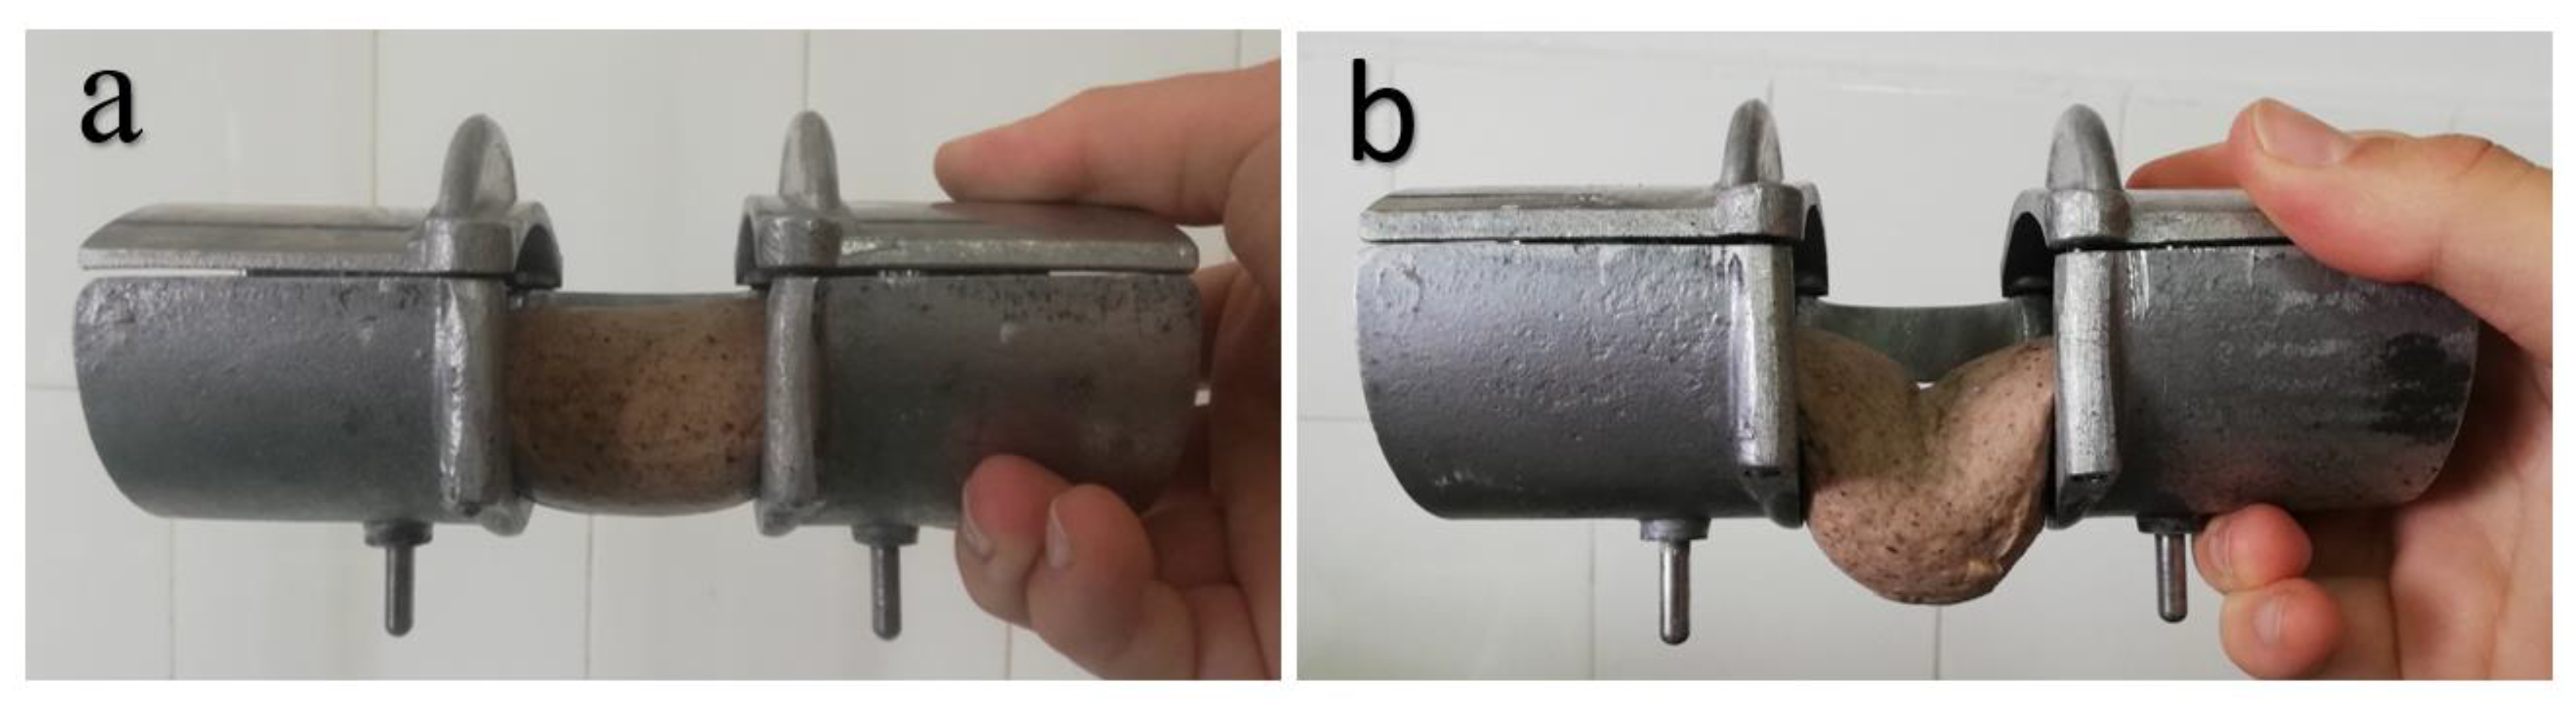
Figure 4.
Dough sample with 15% carob flour for extensographic testing after 45 min rest period: (a) with 0% of dry sourdough; (b) with 10% of dry sourdough.
Figure 4.
Dough sample with 15% carob flour for extensographic testing after 45 min rest period: (a) with 0% of dry sourdough; (b) with 10% of dry sourdough.
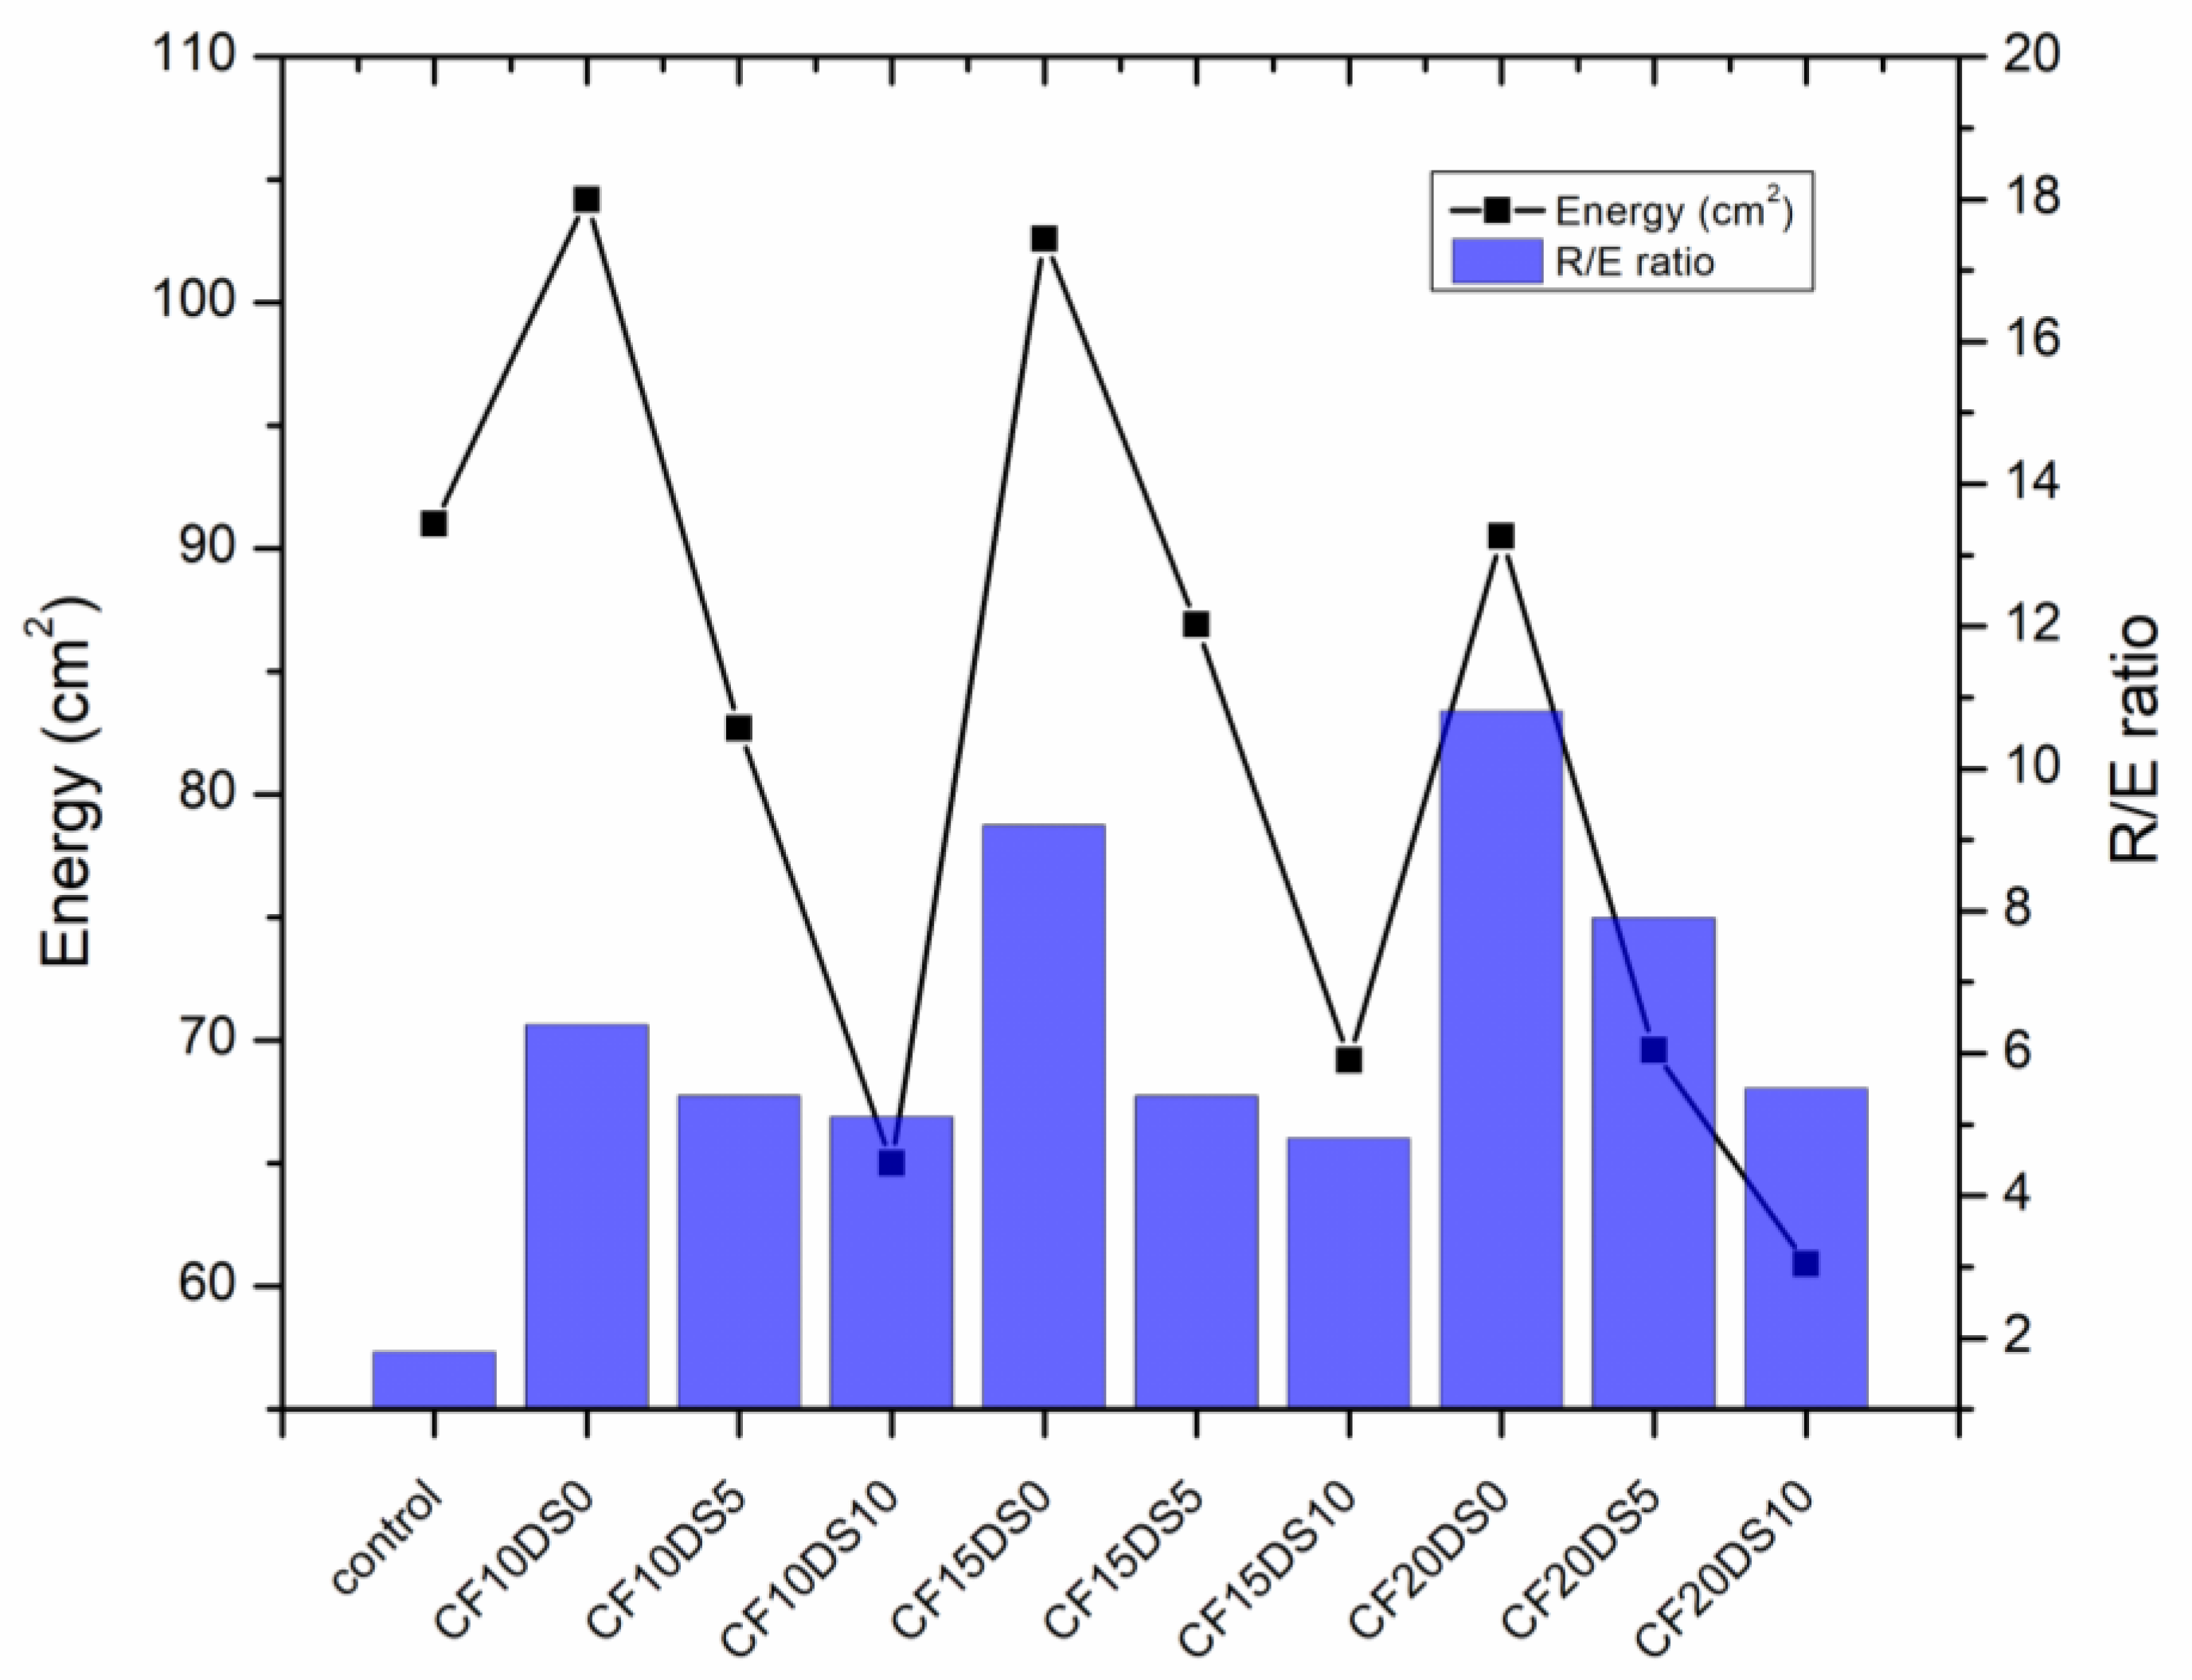
Figure 5.
Specific volume of bread as a function of the addition of carob flour (CF) and dry sourdough (DS).
Figure 5.
Specific volume of bread as a function of the addition of carob flour (CF) and dry sourdough (DS).
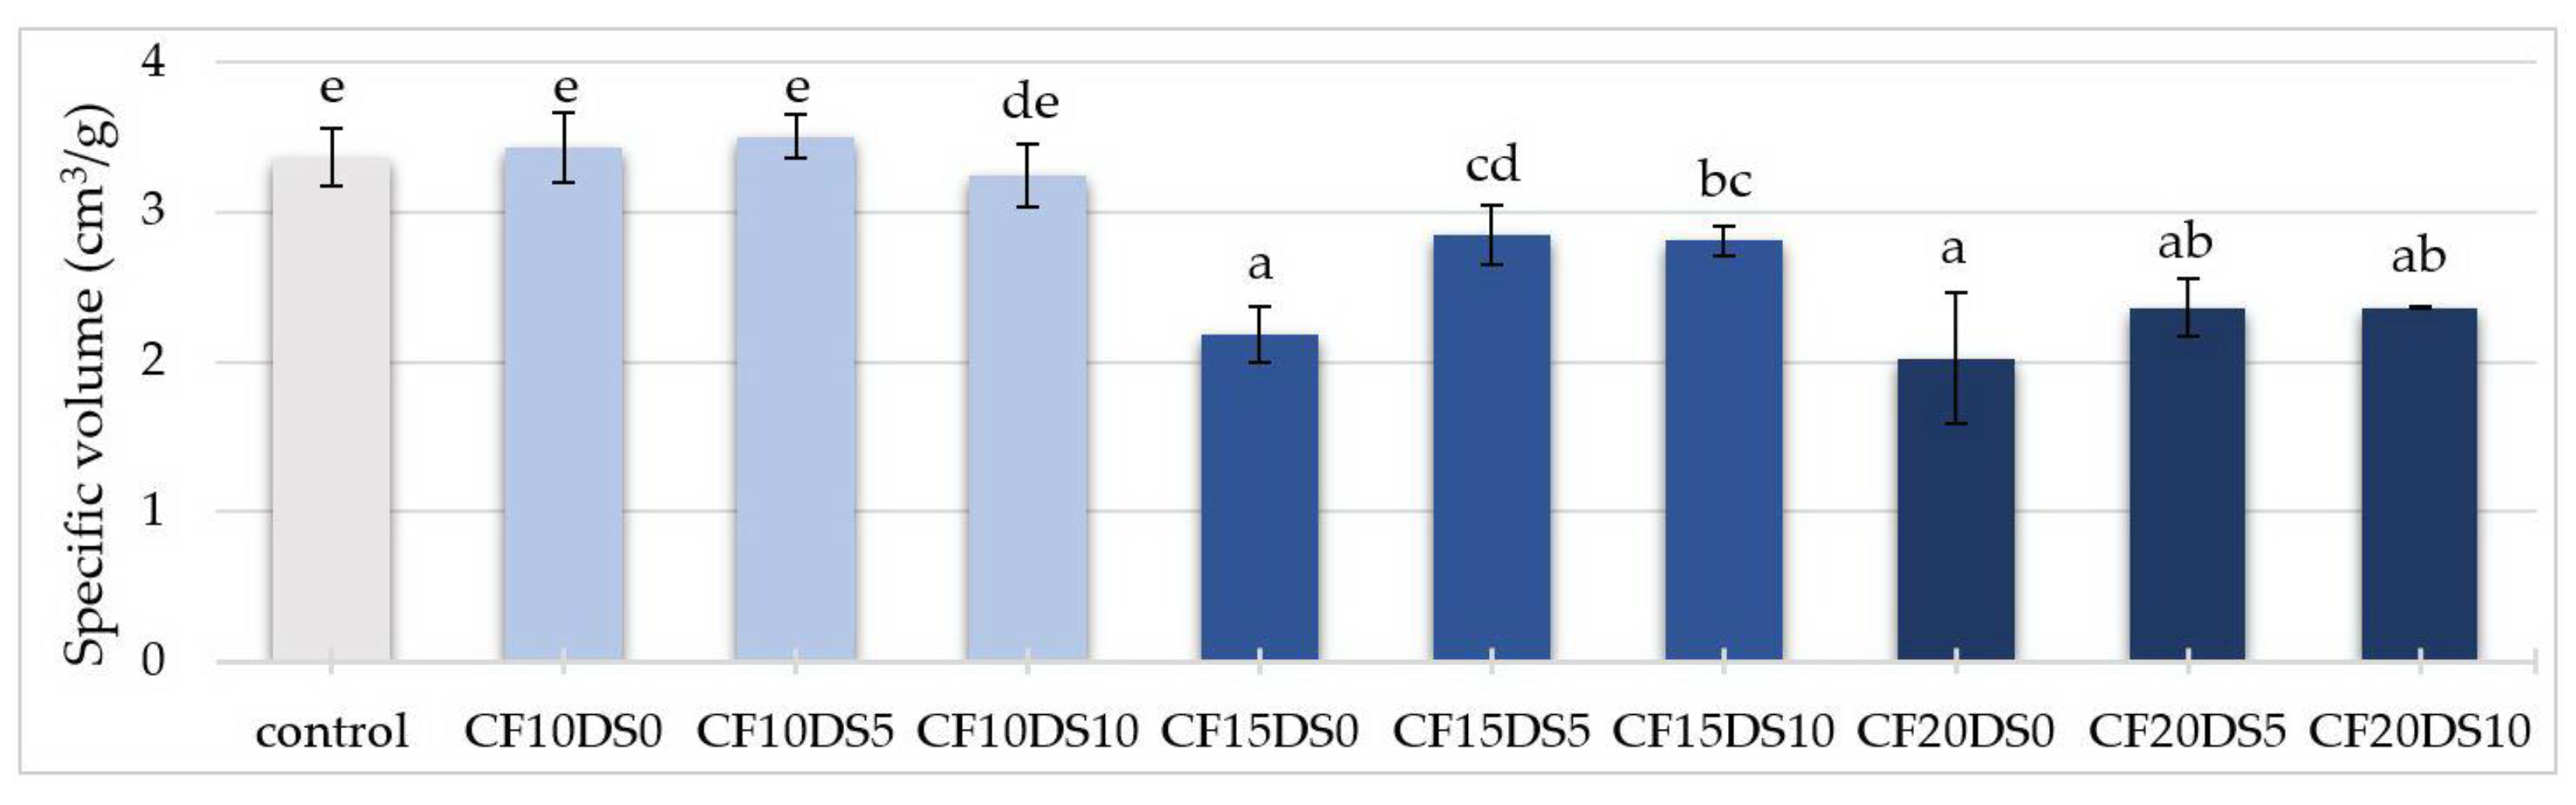
Figure 6.
Dependence of radial growth of Aspergillus flavus on bread composition.
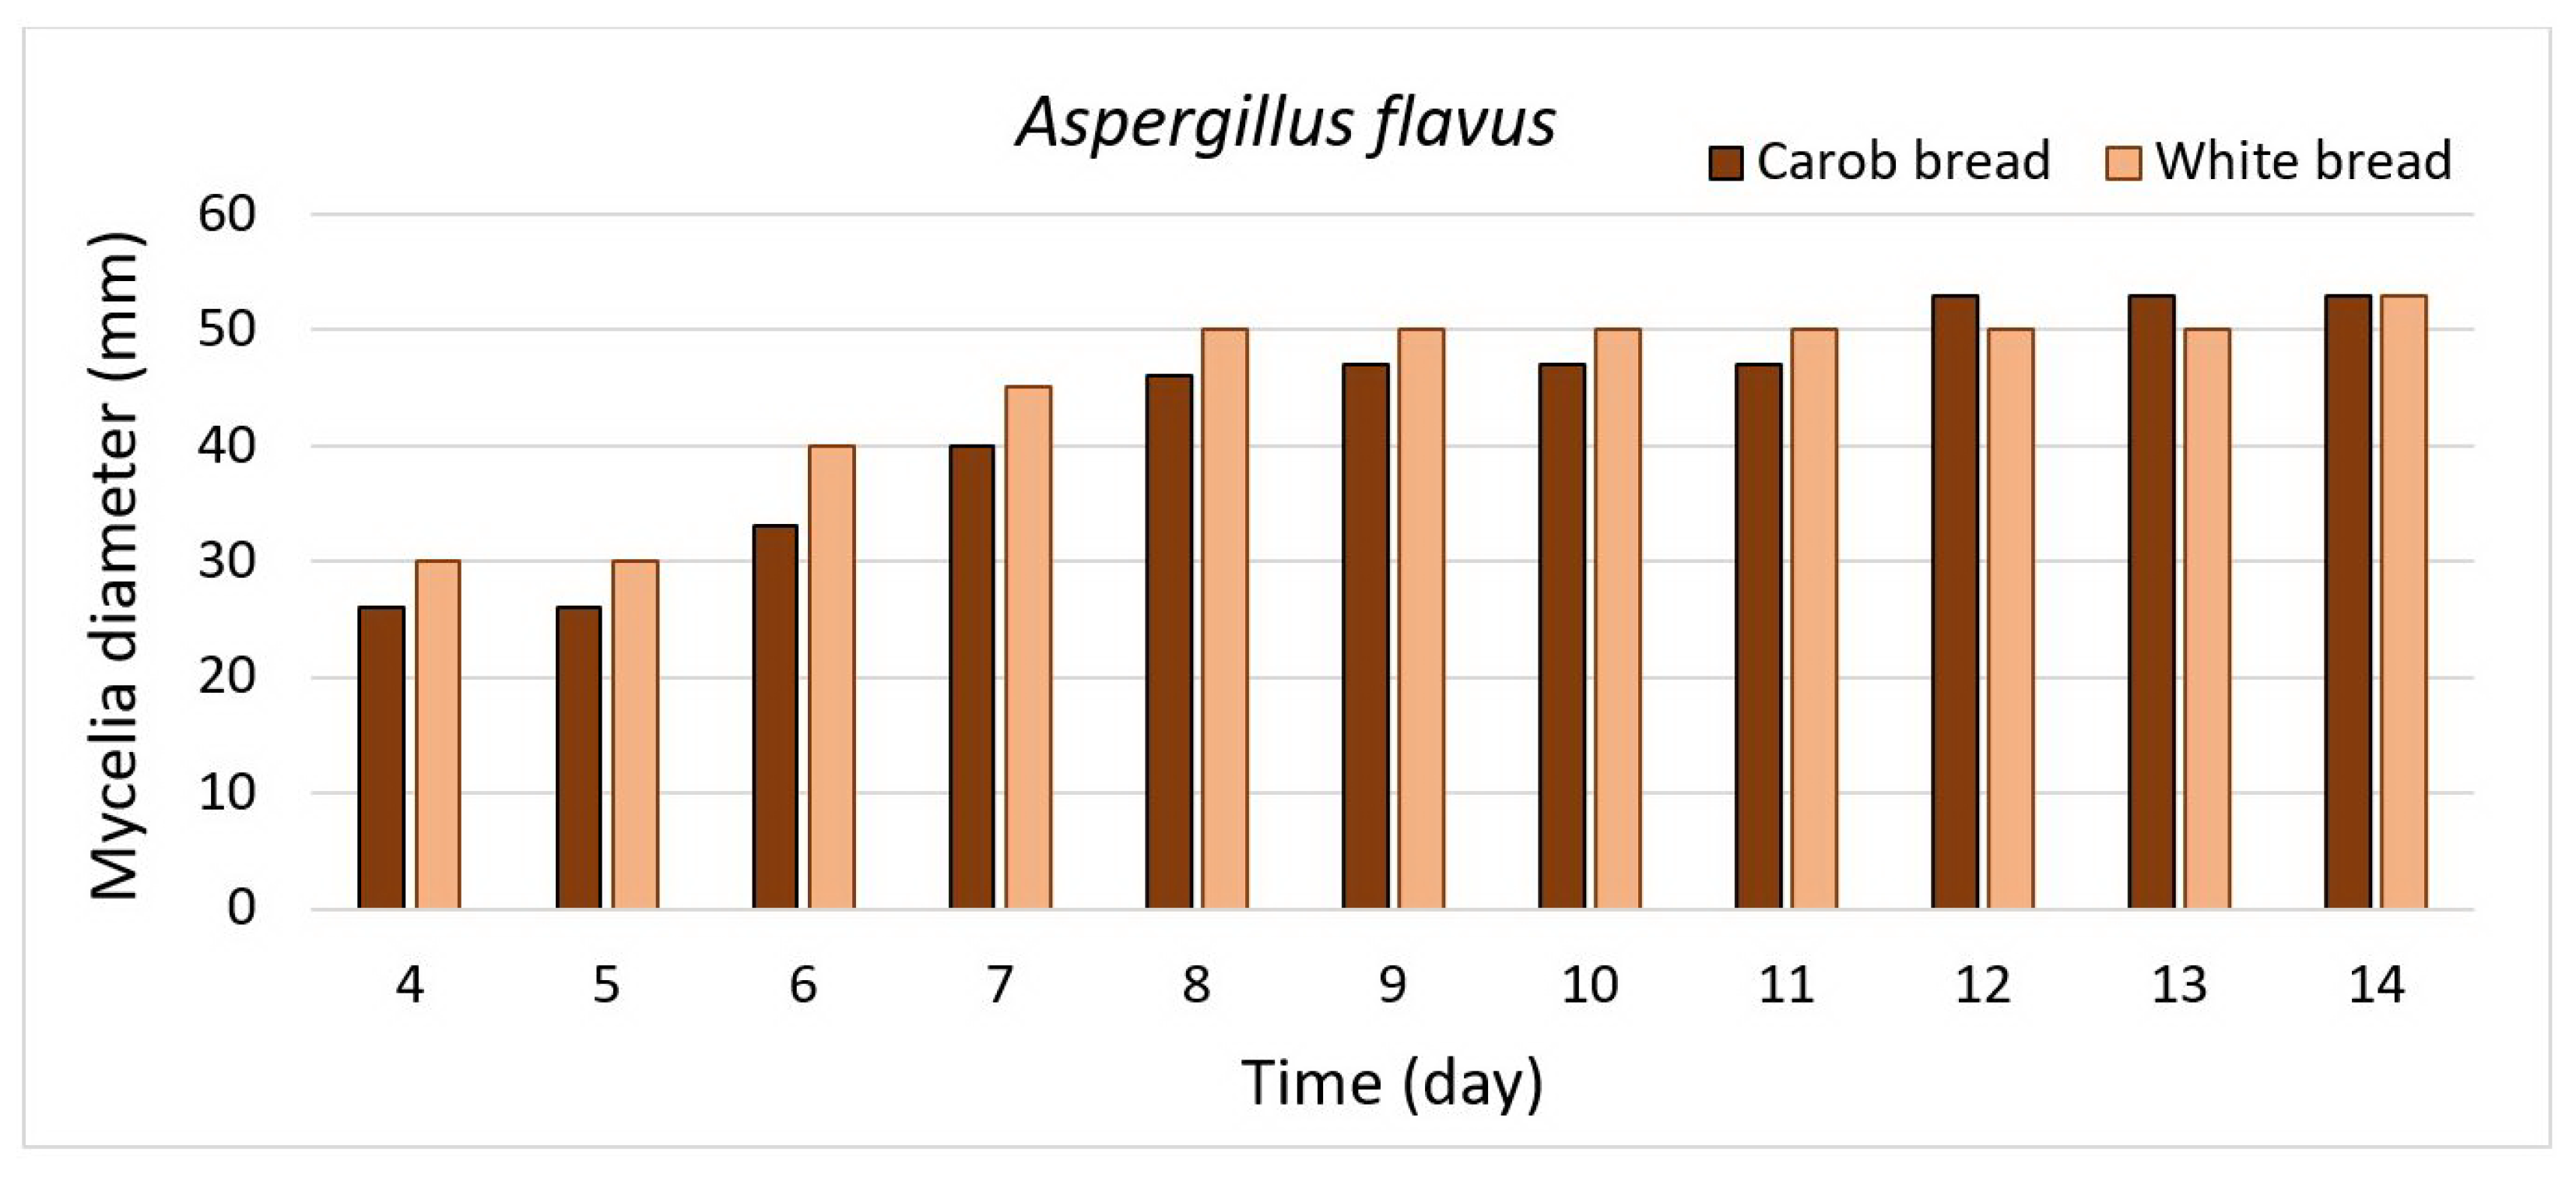
Figure 7.
Dependence of radial growth of Penicillium aurantiogriseum on bread composition.
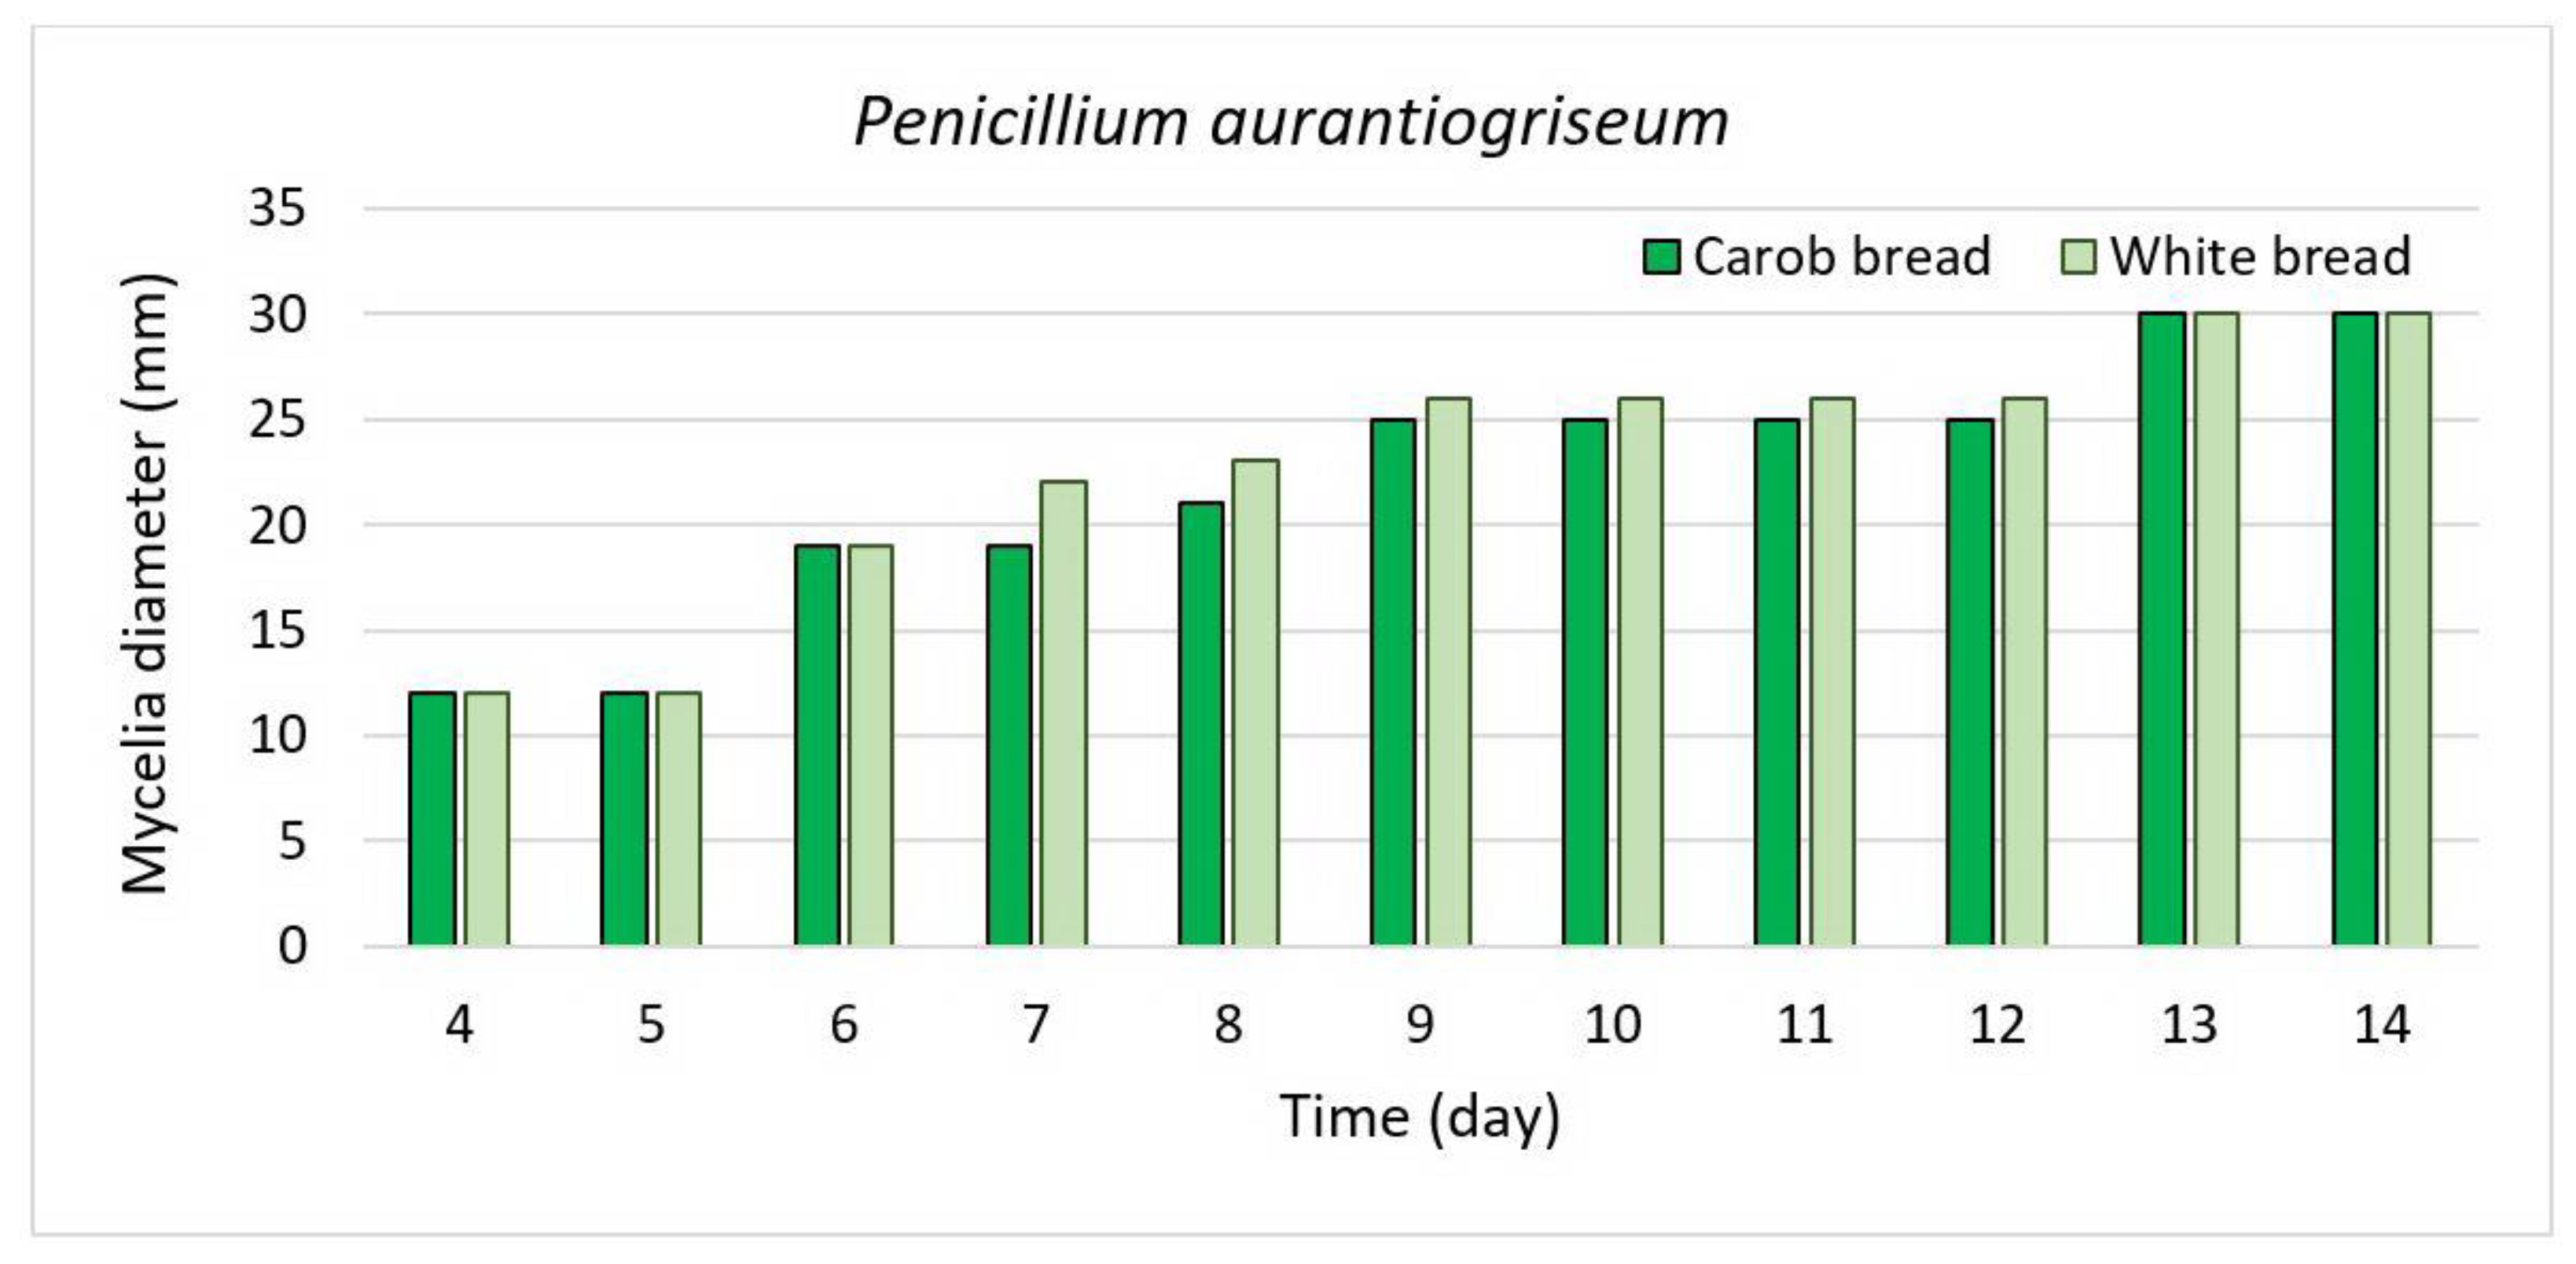

Table 1.
Experimental plan with two independent variables on three levels.
| Independent variables1 | Levels | ||
|---|---|---|---|
| -1 | 0 | 1 | |
| CF (%, g/100 g of wheat flour) | 10 | 15 | 20 |
| DS (%, g/100 g of wheat flour) | 0 | 5 | 10 |
1 CF – carob pulp flour; DS – dry sourdough.
Table 2.
The influence of independent variables on the farinographic parameters of dough.
| Sample1 | Water absorption (%) | Development time (min) | Stability (min) |
Degree of softening (FU) |
|---|---|---|---|---|
| control | 58.3±0.20a | 1.5±0.17a | 0.5±0.30a | 60±1.0e |
| CF10DS0 | 58.7±0.25a | 1.8±0.16a | 1.0±0.05b | 110±0.0g |
| CF10DS5 | 63.8±0.17b | 8.5±0.14c | 2.0±0.01d | 55±1.5d |
| CF10DS10 | 68.3±0.43d | 9.0±0.17d | 2.0±0.00d | 45±1.0b |
| CF15DS0 | 58.5±0.14a | 2.0±0.15a | 1.0±0.01b | 105±0.5f |
| CF15DS5 | 65.1±0.17c | 9.0±0.10d | 1.5±0.07c | 55±0.5d |
| CF15DS10 | 69.0±0.19d | 8.5±0.12c | 2.0±0.15d | 50±0.5c |
| CF20DS0 | 59.2±0.16a | 5.5±0.11b | 1.5±0.02c | 110±0.5g |
| CF20DS5 | 64.9±0.15b | 9.0±0.12d | 1.5±0.07c | 40±1.0a |
| CF20DS10 | 69.7±0.11e | 9.2±0.16d | 1.5±0.05c | 55±1.5d |
1 CF – carob flour; DS – dry sourdough. Results represent mean values of repeated measurements ± SD (n=3); values in columns marked with different letters are significantly different (p˂0.05).
Table 3.
Results of sensory analysis of bread with the addition of carob flour and dry sourdough.
| Sample1 | External appearence | Crumb structure | Smell | Taste | Total score | Quality category |
|---|---|---|---|---|---|---|
| control | 20.0 | 24.0 | 20.0 | 24.0 | 88.0 | Very good |
| CF10DS0 | 18.0 | 21.0 | 20.0 | 24.0 | 83.0 | Very good |
| CF10DS5 | 20.0 | 27.0 | 20.0 | 30.0 | 97.0 | Excellent |
| CF10DS10 | 18.0 | 24.0 | 20.0 | 30.0 | 92.0 | Excellent |
| CF15DS0 | 18.0 | 18.0 | 20.0 | 18.0 | 74.0 | Good |
| CF15DS5 | 18.0 | 21.0 | 20.0 | 24.0 | 83.0 | Very good |
| CF15DS10 | 18.0 | 21.0 | 20.0 | 27.0 | 86.0 | Very good |
| CF20DS0 | 12.0 | 15.0 | 20.0 | 12.0 | 59.0 | Acceptable |
| CF20DS5 | 12.0 | 18.0 | 20.0 | 18.0 | 68.0 | Good |
| CF20DS10 | 12.0 | 20.0 | 20.0 | 18.0 | 71.0 | Good |
1 CF – carob flour; DS – dry sourdough. External appearance and smell – max 20,0; Crumb structure and taste – max 30,0; total score – max 100,0.
Table 4.
Nutritional composition and mineral content of bread with 15% carob flour and 10% dry sourdough compared to the white bread.
Table 4.
Nutritional composition and mineral content of bread with 15% carob flour and 10% dry sourdough compared to the white bread.
| Nutrients (g/100 g) | White bread | Carob bread |
|---|---|---|
| Moisture | 34.60 | 33.80 |
| Ash | 0.51 | 0.76 |
| Fat | 0.25 | 0.18 |
| Proteins | 9.47 | 10.02 |
| Available carbohydrates | 53.90 | 48.76 |
| Total dietary fibers | 1.27 | 6.48 |
| Insoluble dietary fibers | 0.51 | 3.25 |
| Soluble dietary fibers | 0.76 | 3.23 |
| Energy value (kJ/100 g) (kcal/100 g) |
1096.70 258.27 |
1057.76 249.70 |
Table 5.
Mineral content of bread with 15% carob flour and 10% dry sourdough compared to the white bread.
Table 5.
Mineral content of bread with 15% carob flour and 10% dry sourdough compared to the white bread.
| Minerals | NRV (mg) | 15% NRV (mg/100 g) | White bread | Carob bread |
|---|---|---|---|---|
| K | 2000 | 300 | 130.63 | 247.44 |
| Ca | 800 | 120 | 26.54 | 62.17 |
| Mg | 375 | 53.25 | 17.04 | 32.83 |
| Fe | 14 | 2.10 | 1.43 | 1.95 |
| Zn | 10 | 1.50 | 1.67 | 1.39 |
| Mn | 2 | 0.30 | 0.33 | 0.76 |
| Cu | 1 | 0.15 | 0.18 | 0.21 |
1 NRV – Nutrient Reference Values; 15% NRV – Significant Amount of minerals (EU Regaluation 1169/2011).
Table 6.
Polyphenol content and antioxidant activity of bread with 15% carob flour and 10% dry sourdough compared to the white bread.
Table 6.
Polyphenol content and antioxidant activity of bread with 15% carob flour and 10% dry sourdough compared to the white bread.
| Sample1 | TP (mg GAE/100 g) |
TF (mg CE/100 g) |
DPPH (µM TE/100 g) |
FRAP (µM Fe2+/100 g) |
ABTS (µM TE/100 g) |
|---|---|---|---|---|---|
| White breadC | 11.52 ± 0.45a | 38.29 ± 1.76a | 32.92 ± 4.32a | 154.95 ± 6.69a | 17.09 ± 9.08a |
| White breadW | 12.67 ± 0.88a | 45.45 ± 1.09b | 40.85 ± 1.14b | 157.66 ± 4.71a | 27.40 ± 9.10a |
| Carob breadC | 117.77 ± 2.71b | 51.78 ± 0.99c | 402.69 ± 16.24c | 857.53 ± 35.37b | 450.04 ± 33.73b |
| Carob breadW | 140.55 ± 8.41c | 60.14 ± 2.93d | 498.15 ± 10.06d | 1260.40 ± 57.95c | 727.35 ± 80.57c |
1 C – crumb; W – whole bread. Results represent mean values of repeated measurements ± SD (n=3); values in columns marked with different letters are significantly different (p˂0.05).
Table 7.
Microbiological profile of bread with 15% carob flour and 10% dry sourdough and white bread during 14 days.
Table 7.
Microbiological profile of bread with 15% carob flour and 10% dry sourdough and white bread during 14 days.
| Day | TBC (log CFU/g) | TSC (log CFU/g) | TMC (log CFU/g) | |||
|---|---|---|---|---|---|---|
| WB | CB | WB | CB | WB | CB | |
| 1 | <1.0 | <1.0 | <1.0 | <1.0 | 1.00±0.00 | <1.0 |
| 4 | 5.30±0.09 | <1.0 | 2.34±0.00 | 1.30±0.00 | 2.57±0.11 | <1.0 |
| 7 | 5.21±0.03 | 2.45±0.18 | <1.0 | <1.0 | <1.0 | <1.0 |
| 11 | 5.73±0.09 | 4.66±0.04 | 2.98±0.02 | 3.22±0.53 | <1.0 | <1.0 |
| 14 | 5.80±0.00 | 5.50±0.00 | 2.59±0.00 | <1.0 | <1.0 | <1.0 |
* TBC – total bacterial count; TSC – total spore count; TMC – total mold count; WB – white bread; CB – carob bread.
Disclaimer/Publisher’s Note: The statements, opinions and data contained in all publications are solely those of the individual author(s) and contributor(s) and not of MDPI and/or the editor(s). MDPI and/or the editor(s) disclaim responsibility for any injury to people or property resulting from any ideas, methods, instructions or products referred to in the content. |
© 2024 by the authors. Licensee MDPI, Basel, Switzerland. This article is an open access article distributed under the terms and conditions of the Creative Commons Attribution (CC BY) license (https://creativecommons.org/licenses/by/4.0/).
Copyright: This open access article is published under a Creative Commons CC BY 4.0 license, which permit the free download, distribution, and reuse, provided that the author and preprint are cited in any reuse.


