
Submitted:
27 January 2025
Posted:
28 January 2025
You are already at the latest version
Abstract
This study evaluates the effects of fortifying bread with different concentrations (3%, 10%, and 30%) of Matricaria chamomilla L. (MC) infusion and powder, using the aerial parts (stem, leaf, and flower) of the plant. UPLC/MS-MS analysis of MC infusion and powder EtOH ex-tract confirmed the presence of polyphenolic compounds, including flavonoids, contributing to enhanced antioxidant and enzyme inhibitory properties. The physicochemical, antioxi-dant, and sensory properties of the enriched breads were assessed. Hierarchical cluster analysis revealed that breads enriched with 30% MC powder (BP-MC 30%) and infusion (BI-MC 30%) exhibited superior overall quality compared to other formulations. The enriched breads showed increased protein, fiber, and antioxidant content, with BP-MC 30% demonstrating the highest fiber content (10.6%) and antioxidant activity (IC50 = 4.05 µg/mL in DPPH assay). Sensory evaluation indicated differences in texture, with BP-MC 30% showing reduced crispness and higher hardness compared to control bread. These findings suggest that incorporating Matricaria chamomilla, particularly at 30%, improves the nutritional profile and antioxidant properties of bread while impacting sensory characteristics. This research highlights the potential of chamomile’s aerial parts for the valorization of plant-based by-products in functional bakery product development.
Keywords:
Matricaria chamomilla
; Fortified bread
; Antioxidant activity
; UPLC/MS-MS analysis
; Sensory evaluation
; Plant-based by-products
1. Introduction
Bread is a staple food consumed globally, providing a significant contribution to daily nutrient intake. It accounts for over 10% of the daily intake of several essential nutrients, such as proteins, thiamine, niacin, folate, iron, zinc, copper, and magnesium [1]. Furthermore, bread supplies approximately 32% of daily caloric intake and 36% of protein requirements in urban households [2]. Revered as the “staff of life,” bread holds deep cultural and social significance, symbolizing nourishment and community across diverse societies [3,4]. The World Health Organization (WHO) recommends a daily intake of 200–250 grams of bread, underscoring its importance as a key component of the human diet [5,6]. Despite its long history of over 10,000 years, bread consumption has declined in some regions worldwide, with average daily intake in certain areas now reduced to just 2–3 slices per person [1,7].
This decline, coupled with increasing consumer demand for healthier food options, has sparked interest in reformulating bread to enhance its nutritional profile. Consumers are increasingly seeking products with reduced fat, sugar, and sodium content, while also favoring those with added functional ingredients that provide health benefits [8,9,10]. Although bread is sometimes perceived negatively due to its association with weight gain and health concerns, its nutritional value is well-documented and continues to make it a valuable dietary staple [11,12]. Therefore, there is a growing need to innovate and fortify bread with natural, functional ingredients that improve both its nutritional composition and sensory characteristics.
In recent years, the incorporation of plant-based components into bread formulations has shown great promise in enhancing its nutritional content, particularly in terms of fiber, protein, and antioxidant activity. These functional ingredients not only address dietary deficiencies but also cater to the increasing demand for healthier, functional foods. One such promising ingredient is Matricaria chamomilla L. (chamomile), a well-known medicinal herb with a rich history of use in folk medicine, particularly in Algeria. Chamomile is a potent source of bioactive compounds, including polyphenols (coumarins and flavonoids), sesquiterpenes, and essential oils [13,14]. Chamomile contains high levels of both phenolic acids and flavonoids, which contribute to its notable antioxidant properties [15,16]. Given its antioxidant richness, chamomile is an ideal candidate for fortifying functional foods, including bread, to improve their nutritional value.
In addition to its nutritional benefits, chamomile presents an opportunity for the valorization of plant-based by-products. Traditionally, chamomile flower heads (capitula) are harvested to produce commercial infusions or teas, often leaving the rest of the plant—comprising stems, leaves, and flowers—underutilized. This study proposes a more sustainable approach by utilizing the entire aerial part of the plant, including the leaves, stems, and flowers, as a functional ingredient in bread. By doing so, we not only enhance the nutritional profile of bread but also reduce waste by giving a second life to these by-products, which would otherwise be discarded. A portion of chamomile crops could be specifically cultivated and harvested for bread production, employing both the flowers and the aerial parts, thus creating an integrated value chain that benefits both the food industry and the environment.
In this study, we aimed to develop an innovative bread product enriched with chamomile in two distinct forms: an infusion and a powder. The bread was prepared using a basic formulation of whole wheat flour, yeast, salt, and water, which was then fortified with chamomile at concentrations of 3%, 10%, and 30%. Two bread formulations were developed: one enriched with chamomile powder (BP-Mc) and the other with chamomile infusion (BI-Mc). To characterize the bioactive compounds, present in chamomile, we employed UPLC/MS-MS analysis to provide detailed profiling of the phytochemicals in the extracts. The prepared dough was fermented and baked according to standard procedures, with a control bread produced using the same methodology but without the addition of chamomile. The focus of this research was to evaluate the physicochemical properties, antioxidant capacity, and sensory qualities of the enriched bread, with the aim of assessing the potential of chamomile as a natural functional ingredient in improving bread’s nutritional profile and consumer acceptability.
2. Materials and Methods
2.1. Plant Material
Matricaria chamomilla L. (chamomile, babounj) was collected in 2019 from the Sétif region in the eastern part of Algeria. A voucher specimen has been deposited at the Herbarium of the VARENBIOMOL Research Unit, University of Constantine 1. The plant material, including the leaves and flowers, was air-dried at ambient temperature to preserve the bioactive compounds.
2.2. Reagents and Solvents
Analytical grade ethanol (EtOH), methanol (MeOH), chloroform, and MS grade formic acid (HCOOH) were obtained from Merck Chemicals (Milan, Italy). MS grade acetonitrile and water were purchased from Romil (Cambridge, UK). Ultrapure water (18 MΩ) was prepared using a Milli-Q purification system (Millipore, Bedford, TX, USA).
All chemicals and reagents used in this study were of analytical grade and were sourced from commercial suppliers. The Folin-Ciocalteu reagent, gallic acid (used for calibration), quercetin (used as the standard for flavonoid content), DPPH, ABTS, butylated hydroxytoluene (BHT), butylated hydroxyanisole (BHA), acarbose, and the copper(II) reduction assay (CUPAC) reagent were obtained from Sigma-Aldrich (St. Louis, MO, USA).
Ethanol (analytical grade) was used for the ethanolic extraction of Matricaria chamomilla, and distilled water was used for the preparation of solutions and infusions. All reagents were used without further purification and stored according to the manufacturer’s instructions. Glassware was cleaned and sterilized before use.
2.3. Extraction Procedure
The chamomile infusion was prepared by adding 250 g of air-dried leaves and flowers to 500 mL of boiling distilled water. The mixture was then steeped for 10 minutes. The infusion was subsequently filtered through filter paper (0.45 µm) to remove solid residues. The water content of the filtered infusion was then removed under vacuum at 40°C using a rotary evaporator (B690, BUCHI Italia srl, Milan, Italy) to yield the chamomile infusion extract (Mc-I), with a final weight of 4.14 g. The chamomile powder was prepared by grinding 50 g of air-dried leaves and flowers first in a mortar and then in a coffee grinder, yielding 44.07 g of fine chamomile powder (Mc-P). From this plant material, the ethanol extract was prepared by extracting 10 g of the aerial parts with a 7:3 ethanol-water solution. The mixture was filtered through a 0.45 µm filter paper, and the solvents were removed under vacuum at 40 °C using a rotary evaporator. This process resulted in 5.12 g of dry ethanolic extract (Mc-EtOH).
2.4. Total Phenolic Content
The total polyphenol content in the chamomile infusion, extract, and enriched bread sample formulations was determined using the Folin-Ciocalteu method [17]. To 1 mL of each sample, 1 mL of Folin-Ciocalteu reagent was added. After 3 minutes, 1 mL of 25% sodium carbonate solution was added. The mixture was incubated for 2 hours at room temperature. The samples were then centrifuged at 4000 rpm for 4 minutes, and the absorbance was measured at 670 nm using a spectrophotometer. The total phenolic content is expressed as milligrams of gallic acid equivalents per gram of dry extract (mg GAE/g) (Figure S1).
2.4. Total Flavonoid Content
The total flavonoid content in the chamomile infusion, extract, and enriched bread samples was quantified using a spectrophotometric method based on the formation of a flavonoid-aluminum complex [18]. To 1 mL of sample solution, 1 mL of 2% AlCl3 methanol solution was added and incubated for 30 minutes at room temperature. The absorbance was measured at 430 nm. Quercetin was used as the standard, and the total flavonoid content was expressed as quercetin equivalents (QE) per gram of dry extract (Figure S2).
2.6. UHPLC-PDA-ESI-HRMS characterization of Matricaria ingredients
The phytochemical profile of Matricaria chamomilla extract was analyzed using a Vanquish Flex UHPLC system coupled to a dual detector setup: a Diode Array Detector (DAD) and an Orbitrap Exploris 120 mass spectrometer with a heated electrospray ionization source (HESI-II, ThermoFisher Scientific, Milano, Italy). Chromatographic separation was achieved on a Kinetex C18 column (100 × 2.1 mm I.D., 2.6 μm; Phenomenex, Bologna, Italy) with a binary gradient of water (A) and acetonitrile (B), both containing 0.1% formic acid. The gradient program was as follows: 0–3 min, 2% B; 3–6.5 min, 2–9% B; 6.5–11.5 min, 9% B; 11.5–15 min, 9–30% B; 15–17 min, 30–98% B; 17–19 min, 98% B. UV spectra were collected between 200-600 nm, and high-resolution mass spectrometry (HRMS) data were acquired in both positive and negative ionization modes. MS data were obtained in Full MS/dd-MS2 acquisition mode with resolutions of 60,000 and 30,000 WHM, respectively. Fragmentation was induced by stepped collision energy (HCD: 20, 40, and 60). Compound identification was carried out by integrating UV spectra data and HRMS/MS, supplemented by literature references. This approach enabled the identification of 41 specialized metabolites in the Matricaria chamomilla infusion and 37 in the ethanolic extract, mainly phenolic acids and flavonoids.
2.7. Determination of Antioxidant Activity
ABTS assay: the antioxidant activity of the chamomile infusion, extract, and enriched bread samples was evaluated using the ABTS (2,2′-azino-bis(3-ethylbenzothiazoline-6-sulfonic acid)) radical cation decolorization assay. The ABTS radical was generated by reacting ABTS (7 mM) with potassium persulfate (2.45 mM) in water and allowing the reaction mixture to stand at room temperature for 12–16 hours. The radical solution was then diluted with ethanol to an absorbance of approximately 0.70 at 734 nm. A total of 10 µL of each sample was added to 990 µL of ABTS solution, and the absorbance was measured after 6 minutes at 734 nm. The antioxidant activity was quantified as the percentage of ABTS radical scavenging relative to a control. For the controls, BHT and BHA were used at concentrations of 0.1 mM and 0.5 mM, respectively, to compare the antioxidant efficacy [19].
DPPH Assay: The scavenging activity of free radicals in the chamomile infusion, extract, and enriched bread samples was evaluated using the 1,1-diphenyl-2-picrylhydrazyl (DPPH) radical, as described by Sharma & Bhat [20], with minor modifications. A methanolic solution of DPPH (0.11 mM mM) was prepared by dissolving 4 mg of DPPH in 100 mL of methanol. To 1 mL of each sample at a given concentration, 1 mL of the DPPH solution was added. The absorbance was measured at 517 nm after 30 minutes of incubation in the dark. Three replicates were performed for each sample concentration. Ascorbic acid was used as the standard antioxidant.
The antioxidant activity, related to the scavenging effect of the DPPH radical, is expressed as the percentage inhibition (PI), calculated using the following formula:
The results are expressed as the IC50 values (mg/mL), which correspond to the concentration required for 50% inhibition. BHT and BHA were included as positive controls at concentrations of 0.1 mM and 0.5 mM, respectively.
CUPRAC assay: The CUPRAC (CUPric Reducing Antioxidant Capacity) assay was used to measure the antioxidant activity of Matricaria chamomilla (MC) extracts and infusions. The assay was carried out according to established protocols with slight modifications. A 96-well microplate format was utilized to evaluate the antioxidant potential at various concentrations (3.125 µg/mL to 200 µg/mL) for both the MC ethanol extract (EtOH) and infusion. The method relies on measuring the absorbance of the Cu(I)-neocuproine (Nc) complex formed through the redox reaction between chain-breaking antioxidants and the CUPRAC reagent, Cu(II)-Nc, with absorbance recorded at the peak absorption wavelength of 450 nm [21]. The absorbance readings were compared to standard antioxidant compounds, such as BHA (Butylated Hydroxyanisole) and BHT (Butylated HydroxyToluene), which served as reference compounds. The antioxidant activity was quantified by calculating the absorbance at each concentration, and the results were used to determine the IC50 value, representing the concentration required to inhibit 50% of the CUPRAC reaction.
2.8. α-Amylase Inhibitory Activity
The α-amylase inhibitory activity was evaluated using the iodine/potassium iodide (IKI) method, based on Randhir & Shetty [22]with slight modifications. The assay was conducted in a 96-well microplate reader, with each well containing a volume of 250 µL. The reagents used included α-amylase (1 U/mL in phosphate buffer, pH 6.9, with 6 mM NaCl), a 0.1% starch solution (prepared by heating 0.1 g of starch in 100 mL of water with stirring), 1 M HCl (prepared by mixing 4.17 mL of concentrated HCl with 45.83 mL of distilled water), a 5 mM iodine-potassium iodide (IKI) solution (prepared by dissolving 3 g of KI and 0.125 g of iodine in 100 mL of distilled water), and phosphate buffer (pH 6.9 with 6 mM NaCl, made by dissolving 35 mg of NaCl in 100 mL of buffer solution). In the procedure, 25 µL of the sample (extract or infusion) were combined with 50 µL of α-amylase solution and incubated for 10 minutes at 37 °C. After this, 50 µL of the starch solution were added and the incubation continued for another 10 minutes at 37 °C. The reaction was stopped by adding 25 µL of 1 M HCl, followed by 100 µL of the IKI solution. The absorbance was measured at 630 nm. Acarbose was used as the standard. The percentage of inhibition was calculated by comparing the absorbance values for the sample, blank, and control.
2.9. Bread Production
Whole wheat flour (100% whole grain, non-GMO) used for bread preparation was procured from a local Algerian market. The flour had a moisture content of ≤ 15.5% and an ash content of ≥ 1.20%. Instant dry yeast (Saf-Instant, Marcq-en-Barœul, France) and salt were sourced locally as well.
2.10. Bread Enrichment and Formulation
The bread was prepared using a basic formulation consisting of 100 g of whole wheat flour, 2 g of salt, 4 g of yeast, and 60 mL of water. The dough was enriched with chamomile at concentrations of 3%, 10%, and 30% in two distinct formulations. The first formulation was enriched with chamomile powder (Mc-P), and the second formulation was enriched with chamomile infusion (Mc-I). The chamomile powder and infusion were added to the basic dough mixture at the concentrations to create the two experimental formulations.
The dough was thoroughly mixed until the ingredients were evenly distributed. The prepared dough was placed in designated molds and allowed to ferment at 40°C for 35 minutes. After fermentation, the dough was baked in a preheated electric oven (Memmert D39263/D39264, Schwabach, Germany) at 260°C ± 10°C for 25 minutes. The control bread was prepared following the same procedure, excluding the addition of Matricaria chamomilla.
2.11. Control Bread Preparation
A control bread was prepared without the addition of chamomile (neither powder nor infusion), using the same basic recipe and procedure described above, to serve as a baseline for comparison in subsequent analyses.
2.12. Analytical Composition
The analyses were conducted using standard methods as described in the AOAC guidelines [23]. Moisture content was determined by slicing and powdering the samples in a blender, followed by drying them in an oven at 130°C until a constant weight was achieved, according to the AOAC 934.06 method. The total protein content was determined by the Kjeldahl method using a Kjeldahl apparatus, with a conversion factor of 6.25. The total lipid content was determined by the Soxhlet extraction method, following the AOAC 991.43 method. The crude fiber content was quantified using the Weende method (AFNOR NF V03-40 1993). Carbohydrate content was determined using a differential calculation method. Ash content was determined by incinerating the sample at 550°C, following the AOAC 923.03 method.
2.13. Bread Quality Evaluation
The effects of the chamomile plant material and its extracts on bread quality were assessed by measuring specific volume, weight loss, pH, crust and crumb color, and crumb cell structure in the control bread and the BI-MC 30% and BI-MC 30% enriched breads. The weight and volume of the bread were measured 1 hour after baking. The volume was determined using the rapeseed displacement method (AACC 10.05, 2000) [24]. The specific volume (cm³/g) was calculated as the ratio of the bread volume to its weight. Weight loss was calculated as the percentage difference between the weight of the dough before fermentation and the weight of the baked bread, using the formula:
For pH measurement 10 g bread sample was ground and mixed with 100 mL of distilled water. After 30 minutes of shaking with an orbital shaker (Heidolph Polymax 1040, Schwabach, Germany), the pH of the supernatant was measured after 10 minutes of settling (Majzoobi et al., 2017). Crust and crumb color were measured using the Color Grab app (version 3.6.1, Loomatix Ltd., Germany) following the method of Djeghim et al. [25]. A controlled lighting environment was created using a polystyrene box with a 1.2 W 5 V white LED light to ensure uniform illumination. The CIE-Lab* color space model was employed to measure lightness (L*), chromaticity (a* for green to red, and b* for blue to yellow). The crumb structure was analyzed by slicing the bread into 1 cm thick sections, capturing images in TIFF format, and processing them using ImageJ software (version 1.43u, Wayne Rasband, NIH, Bethesda, MD, USA). The images were cropped to focus on the crumb, converted to 8-bit grayscale, and analyzed for cell number (cells/mm²), average cell size, area fraction, perimeter, circularity, and solidity.
2.14. Sensory Evaluation of the Bread
Sensory evaluation was conducted using a 7-point hedonic scale (1 = dislike extremely, 7 = like extremely (Figure S3), with ten trained panelists (five male and five females, aged 20-40 years). The panelists evaluated the bread for color, aroma, taste, volume, alveolation, texture (crispness and hardness), and overall acceptability. Samples were presented in a randomized order with a 3-digit code. The evaluation took place 2 hours post-baking, with panelists instructed to cleanse their palates with water between samples.
2.15. Statistical Analysis
Statistical analysis was conducted using JMP Pro 17.0.0 software (SAS Institute Inc., Cary, NC, USA, 2021). All measurements were performed in triplicate, and data were expressed as means ± standard deviation. One-way analysis of variance (ANOVA) was performed to determine significant differences between means for each variable. Pairwise comparisons were made using Tukey’s Honest Significant Difference (HSD) test, with significance set at p ≤ 0.05. To assess the relationships and groupings between bread samples based on their physicochemical composition, antioxidant activity, and sensory attributes, a heatmap was generated using hierarchical cluster analysis (HCA). Ward’s method and squared Euclidean distance were used to cluster the data. Control bread was not included in this cluster analysis. The HCA results were visualized graphically in the form of a dendrogram and heatmap to illustrate the similarities and differences among the bread formulations (BI-MC 3%, BI-MC 10%, BI-MC 30%, BP-MC 3%, BP-MC 10%, BP-MC 30%).
3. Results
The results of this study confirmed that fortifying bread with 30% Matricaria chamomilla (in either powder or infusion form) significantly improves both the physicochemical composition and sensory quality of the bread. The enriched breads exhibited increased nutritional value, enhanced antioxidant activity, and better sensory attributes, particularly in terms of taste and overall acceptability. These findings suggest that the incorporation of chamomile into bread could provide a sustainable way to improve the nutritional profile of this staple food, while also valorizing plant-based by-products, such as chamomile leaves, stems, and flowers, that are typically underutilized in food production.
3.1. Phytochemical Profiling of Matricaria chamomilla Infusion and Ethanolic Extract
The phytochemical profiles of the Matricaria chamomilla infusion and ethanolic extract were examined using UHPLC-HRMS, identifying several specialized metabolites, particularly phenolic acids and flavonoids. In total, 41 compounds were identified in the infusion, while 37 were detected in the ethanolic extract, suggesting subtle but meaningful differences between the two preparation methods. Figure 1 presents the UHPLC-HRMS chromatograms for both the chamomile infusion (A) and ethanolic extract (B), showcasing their distinct chemical compositions. The chromatogram of the infusion (A) reveals several distinct peaks with relatively short retention times, corresponding to hydrophilic polyphenolic compounds, such as caffeoylquinic acid derivatives. These peaks suggest the efficient extraction of water-soluble phenolic acids, known for their bioactive properties, including antioxidant effects. In contrast, the chromatogram for the ethanolic extract (B) displays a broader range of peaks with longer retention times, primarily representing other polyphenolic compounds, such as flavonoid glycosides and caffeic acid derivatives. The higher intensity and wider distribution of these peaks indicate that ethanol is more effective in extracting these polyphenols, which are less soluble in water and tend to elute later. These chromatographic differences,characterized by both peak intensity and retention time, highlight the distinct bioactive profiles of the two preparations, underscoring how the choice of solvent influences the extraction of polyphenolic compounds.. Table 1 and Table 2 report the main compounds identified in the infusion and ethanolic extract, respectively. One notable difference between the infusion and ethanolic extract is the presence of certain compounds in one sample over the other. For instance, in the infusion (Table 1), we identified several caffeoylquinic acid derivatives such as caffeoyl quinic acid (MC_1) and caffeoyl quinic hexoside (MC_4), which are key metabolites frequently found in Matricaria chamomilla [14,16]. These compounds were also present in the ethanolic extract but with differing intensities. Interestingly, some caffeic acid derivatives (MC_11 and MC_14) showed slightly higher concentrations in the ethanolic extract, which might be attributable to the solvent’s ability to extract more polar metabolites from the plant matrix compared to water.
Flavonoids, including luteolin (MC_35) and apigenin (MC_39), were identified in both the infusion and ethanolic extract, but certain flavonoid glycosides (e.g., apigenin O-diglucuronide, MC_23, and luteolin O-caffeoylhexoside, MC_29) were more prominent in the ethanolic extract (Table 2). This could indicate that the ethanolic extraction method is more efficient for isolating flavonoid derivatives, which are typically less water-soluble. On the other hand, the infusion seems to better retain certain hydrophilic compounds, such as hydroxyjasmonic acid (MC_19), which were identified at higher concentrations compared to the ethanolic extract. Polyphenolic compounds like dicaffeoylquinic acid (MC_22 and MC_23) were abundant in both samples. However, higher levels of these compounds were generally observed in the ethanolic extract. This is consistent with the known ability of ethanol to effectively extract polyphenols, especially those conjugated to sugars, phenolic acids, and other bioactive compounds. The infusion, however, contained a broader diversity of compounds overall, including some highly hydrophilic metabolites, suggesting that the water extraction method may favor a more diverse array of water-soluble, low-molecular-weight compounds [26].
For the purposes of our study on bread enrichment, the decision to use the chamomile infusion and plant powder, rather than the ethanolic extract, was made based on the goal of evaluating the practical application of these forms in the bread matrix. Both the infusion and plant powder are more accessible and could potentially provide the same bioactive effects observed with the ethanolic extract, but in a more convenient and cost-effective manner. The ethanolic extract was used primarily to confirm the composition of the plant powder, while the direct incorporation of the infusion and powder into the bread is aimed at reflecting a more natural or traditional use of chamomile in food processing. This approach is intended to explore how these readily available forms of chamomile can be used for bread enrichment without compromising bioactivity, aligning with natural food practices.
3.2. Antioxidant Activity, Total Polyphenols, and Flavonoids of Matricaria chamomilla Infusion and Ethanolic Extract
The antioxidant activities of both the chamomile infusion and ethanolic extract were evaluated using three distinct assays: the DPPH (2,2-diphenyl-1-picrylhydrazyl) assay, the ABTS (2,2′-azino-bis(3-ethylbenzothiazoline-6-sulfonic acid)) assay and and CUPRAC assay. BHT (butylated hydroxytoluene) and BHA (butylated hydroxyanisole) were used as positive controls for both assays.
3.2.1. DPPH Assay
The results of the DPPH assay showed a clear difference in the antioxidant activity between the two chamomile preparations. The ethanolic extract demonstrated a higher antioxidant potential, with the IC50 value calculated at 13.15 ± 0.95 µg/mL (Table 3), indicating a stronger ability to scavenge free radicals compared to the chamomile infusion. At the highest tested concentration of 800 µg/mL, the ethanolic extract achieved an inhibition of 88.42 ± 0.22% (Table S1), which is consistent with its higher polyphenol and flavonoid content. On the other hand, the chamomile infusion, with an IC50 of 24.46 ± 0.35 µg/mL, showed a slightly lower inhibition, with a maximum inhibition of 87.15 ± 0.30% at the same concentration of 800 µg/mL These results highlight the greater antioxidant activity of the ethanolic extract, likely due to its higher concentration of polyphenols and flavonoids. However, the chamomile infusion still provided substantial antioxidant effects, making it a viable option for enriching food products, such as bread, where ease of use and cost-effectiveness are key considerations.
3.2.2. ABTS Assay
The results from the ABTS assay further reinforce the superior antioxidant properties of the ethanolic extract compared to the chamomile infusion. At concentrations ranging from 12.5 to 800 µg/mL (Table S2), the ethanolic extract demonstrated an increasing inhibition percentage, reaching 78.87 ± 0.66% at the highest concentration, with an IC50 value of 81.04 ± 0.42 µg/mL. The chamomile infusion still offers substantial antioxidant potential, with a maximum inhibition of 79.88 ± 0.39% at 800 µg/mL and an IC50 of 93.91 ± 0.94 µg/mL (Table 3), The control substances, BHT and BHA, demonstrated superior antioxidant activities with inhibitions of 92% and 89%, respectively, highlighting the stronger free radical scavenging ability of synthetic antioxidants when compared to chamomile preparations. Overall, these results suggest that the infusion is a practical and more accessible alternative for food enrichment applications, such as in bread, where a simpler, cost-effective solution is preferred without compromising on antioxidant functionality.
3.2.3. CUPRAC Assay
The antioxidant activity of MC extracts and infusions was evaluated through the CUPRAC assay. For both the ethanol extract and infusion, there was a dose-dependent increase in absorbance with higher concentrations, indicating increased antioxidant activity. The MC ethanol extract showed absorbance values ranging from 0.33 ± 0.01 at 3.125 µg/mL to 3.02 ± 0.07 at 200 µg/mL (Table S3). The IC50 value for the MC ethanol extract was 4.95 ± 0.14 µg/mL. Similarly, the MC infusion displayed absorbance values from 0.37 ± 0.01 at 3.125 µg/mL to 3.29 ± 0.20 at 200 µg/mL, with an IC50 value of 4.54 ± 0.11 µg/mL (Table 3), These findings suggest that both the ethanol extract and infusion of Matricaria chamomilla exhibit significant antioxidant activity, with the ethanol extract showing a slightly higher inhibitory effect compared to the infusion. The data highlight the potential of MC as a bioactive ingredient with antioxidant properties that could be applied in functional food products.
3.2.4. Total Polyphenols and Flavonoids
The total polyphenol and flavonoid contents were quantified to evaluate the bioactive components of the chamomile infusion and ethanolic extract (Table 3). The total phenolic content (TPC) of the ethanolic extract was significantly higher at 110.32 ± 0.62 µg GAE/mg compared to the chamomile infusion, which showed a TPC of 82.82 ± 0.42 µg GAE/mg. This difference can be attributed to the greater solubility of polyphenolic compounds in ethanol, facilitating a more efficient extraction process. Similarly, the total flavonoid content (TFC), quantified through a colorimetric assay with aluminum chloride and expressed as quercetin equivalents (QE), was significantly higher in the ethanolic extract, which contained 89.79 ± 0.59 µg QE/mg, compared to the chamomile infusion, which had 47.92 ± 0.29 µg QE/mg of total flavonoids. However, despite the lower concentrations in the infusion, its functional properties, including antioxidant capacity, remain significant and may be more suitable for practical applications, such as enriching bread, where a simpler and more cost-effective approach is desired.
3.2.5. Correlation Between Antioxidant Activity and Bioactive Compounds:
A significant positive correlation was observed between the total polyphenol and flavonoid contents and the antioxidant activities measured by both the DPPH and ABTS assays. The ethanolic extract, which exhibited higher levels of both polyphenols and flavonoids, also showed superior antioxidant activity in both assays. This correlation underscores the important role of these bioactive compounds in the antioxidant mechanisms of chamomile. The ethanolic extract of chamomile offers higher antioxidant activity, but the infusion, being simpler and more practical for bread production, still provides effective antioxidant benefits.
3.3. α-Amylase Inhibitory Activity
The α-amylase inhibitory activity of both the ethanolic extract and infusion of chamomile was assessed at different concentrations (Tables S4 and S5). The ethanolic extract showed a dose-dependent inhibition of α-amylase, with an IC50 value of 21.32 ± 0.74 µg/mL. The inhibition ranged from 42.47 ± 0.23% at the lowest concentration (1.9531 µg/mL) to 58.11 ± 0.15% at the highest concentration (125 µg/mL). On the other hand, the chamomile infusion demonstrated an IC50 value of 11.27 ± 1.15 µg/mL, with inhibition varying from 44.41 ± 0.19% at 1.9531 µg/mL to 57.96 ± 0.27% at 125 µg/mL. The chamomile infusion exhibited stronger α-amylase inhibitory activity compared to the ethanolic extract, as indicated by a lower IC50 value (11.27 ± 1.15 µg/mL vs. 21.32 ± 0.74 µg/mL) (Table 3), suggesting that the infusion might offer a more effective approach for modulating carbohydrate metabolism. This could be due to the enhanced bioavailability and solubility of active compounds in the infusion, which may facilitate greater interaction with the enzyme.
3.4. Bread Production and Characteristics
The bread formulations were produced by fortifying a basic dough with Matricaria chamomilla L. (MC) in two forms: powder (BP-Mc) and infusion (BI-Mc) at concentrations of 3%, 10%, and 30%. The fortifying process resulted in significant differences in the physicochemical properties of the breads, with the enriched formulations generally exhibiting enhanced nutritional content compared to the control bread. The incorporation of chamomile, particularly at higher concentrations, influenced key characteristics such as protein, fiber, and antioxidant levels, as well as sensory attributes including texture, aroma, and overall acceptability.
Enriched breads had lower moisture content compared to the control bread, with BP-MC showing the lowest moisture level (30.74%), followed by BI-MC (12.55%) with BI-MC30% showing the lowest moisture level (12.55%), followed by BP-MC 30% (30.74%). The protein content was significantly higher in the MC-enriched breads, with BI-MC showing the highest value (14.78%), followed by BP-MC (12.06%). The lipid content was slightly lower in the enriched breads (0.8% for BI-MC and 1.2% for BP-MC) compared to the control bread (1.8%). BP-MC bread exhibited the highest fiber content (10.6%), reflecting the fiber-rich nature of chamomile. BI-MC showed the highest carbohydrate content (59.46%), while BP-MC and control breads had lower carbohydrate content (39.23% and 38.44%, respectively). Both BI-MC and BP-MC showed elevated ash content, with BI-MC at 8.48% and BP-MC at 6.17%, compared to the control bread (4.33%). These differences highlight how the incorporation of chamomile, especially at higher concentrations, modifies the composition of the bread, enhancing its nutritional profile (Table 4 and Table S6).
3.5. Bread Quality Evaluation
During the fermentation process, the different bread formulations, including those enriched with Matricaria chamomilla (MC), showed a significant increase in volume. This increase is visible in Figure 2, which shows the bread during the leavening phase before baking. However, after baking, marked differences were observed in the physicochemical and sensory characteristics of the breads, especially for those enriched with chamomile at 30% (both powder and infusion), which showed noticeable differences compared to the control bread (Table 5), as illustrated in Figure 3.
3.5.1. Specific Volume
Breads enriched with 30% chamomile (both powder and infusion forms) had significantly lower specific volumes compared to the control bread, with values of 2.19 ± 0.07 cm³/g for BI-MC 30% and 2.26 ± 0.20 cm³/g for BP-MC 30%, compared to the control’s 3.36 ± 0.001 cm³/g (p-value = 0.004). These results are consistent with previous findings showing that the addition of herbal ingredients reduces the bread’s specific volume, likely due to the altered gluten network formation and reduced hydration capacity in the dough [27,28]. This finding aligns with studies on non-glutinous flours, which similarly show a reduction in volume due to changes in dough structure [29,30]. Despite the reduced volume, the breads’ sensory quality was improved in terms of appearance and texture..
3.5.2. Weight Loss
There were no significant differences in weight loss among the bread formulations, with values ranging from 30.04 ± 0.84% (BI-MC) to 32.69 ± 1.32% (BP-MC), compared to the control (31.30 ± 0.95%). This suggests that chamomile incorporation did not influence moisture loss during baking [31]. These results are consistent with literature on bread with plant-based fortifications, where weight loss typically remains unaffected by such additions.
3.5.3. pH
The pH of the 30% chamomile infusion bread (BI-MC 30%) and chamomile powder bread (BP-MC 30%) was significantly lower than the control, with pH values of 5.30 ± 0.02 and 5.43 ± 0.02, respectively, compared to the control (5.74 ± 0.021, p-value = 0.01). The reduction in pH is likely due to the organic acids present in chamomile, similar to effects observed in other plant-based ingredients like Schizandra chinensis [32].
3.5.4. Crust and Crumb Color
Crust Color: Incorporation of chamomile powder resulted in significantly darker crusts compared to the control. The L* value decreased from 61.15 ± 2.47 in the control to 44.9 ± 4.67 for BI-MC and 11.55 ± 0.35 for BP-MC, indicating a darker color due to Maillard reactions and caramelization during baking. The a* value for BP-MC (5.85 ± 0.45) was significantly higher than the control (-0.75 ± 2.19), indicating more redness in the crust.
Crumb Color: The L* value of the crumb for BP-MC was significantly lower (17.7 ± 2.3) compared to BI-MC (37.55 ± 5.02) and the control (31.95 ± 0.49). The a* value for BP-MC was significantly higher (7.3 ± 0.4) than the control (4 ± 0.28), suggesting that BP-MC resulted in a redder crumb, likely due to the flavonoid content in chamomile.
3.5.5. Crumb Structure
BI-MC 30% exhibited a significantly higher number of cells per mm² (220 ± 41.01) compared to BP-MC 30% (104 ± 7.07), while BP-MC 30% had significantly larger cells and a higher cell perimeter (129.73 ± 6.54). This suggests that the infusion form contributed to a finer crumb structure, while the powder resulted in larger, more spaced-out cells. However, there were no significant differences in cell circularity or solidity between the bread types.
3.6. Sensory Evaluation of Enriched Breads
Sensory analysis showed that the inclusion of 30% chamomile powder (BP-MC 30%) had a notable impact on the texture and crispness of the bread (Figure 4). Specifically, crispness was significantly lower in BP-MC 30% (2.8 ± 1.62) compared to the control bread (5.4 ± 1.43). Additionally, the bread texture (hardness) was rated as more favorable in BP-MC 30% (4.7 ± 2.16) and BI-MC 30% (3.1 ± 1.73) compared to the control (5.2 ± 0.57). These results suggest that the addition of 30% chamomile powder led to a firmer and less crispy bread (Table 5 and Table S7). This change in texture may be attributed to alterations in crumb structure and moisture retention, which could be influenced by the higher fiber content and the moisture-binding capacity of chamomile. Such textural changes are consistent with findings from similar studies on plant-enriched breads, where varying ingredient levels have been shown to affect the sensory properties of the final product [33].
3.7. Total Phenolic and Flavonoid Content and Antioxidant Activity
The incorporation of Matricaria chamomilla into bread significantly enhanced the total phenolic and flavonoid contents compared to the control. The control bread exhibited 13.41 μg GAE/mg for phenolic content and 21.46 μg QE/mg for flavonoid content. Bread enriched with chamomile infusion (BI-MC) showed a substantial increase in both phenolic (68.41 μg GAE/mg) and flavonoid content (60.47 μg QE/mg), with a dose-dependent increase observed across the 3%, 10%, and 30% concentrations. Specifically, at 30%, the phenolic content in BI-MC reached 68.41 μg GAE/mg, which was comparable to that observed at the 10% concentration (69.29 μg GAE/mg). On the other hand, the bread enriched with chamomile powder (BP-MC) exhibited a lower phenolic content, ranging from 29.59 μg GAE/mg at 3% to 61.48 μg GAE/mg at 30%. Similarly, flavonoid content was higher in BI-MC, with the 30% infusion concentration achieving the highest value of 60.47 μg QE/mg, while BP-MC ranged from 30.63 μg QE/mg at 3% to 46.46 μg QE/mg at 10%, with a slight reduction to 41.67 μg QE/mg at 30%. These findings confirm the more efficient solubilization of bioactive compounds, such as phenolics and flavonoids, in chamomile infusion as compared to the powder form, which is in line with previous reports showing that liquid extracts often provide higher yields of bioactive compounds from plant materials [34]. (Table 6)
The antioxidant activity, measured through the DPPH assay, revealed that BI-MC-enriched breads had significantly higher antioxidant capacity than both the BP-MC-enriched and control breads. The IC50 value for BI-MC at 30% concentration was 0.86 µg/mL, which was notably lower than the control (6.1 µg/mL) and BP-MC (4.05 µg/mL) (Figures S4 and S4). This indicates a stronger ability to scavenge free radicals in BI-MC-enriched breads, further emphasizing the antioxidant potential of chamomile infusion. The results from the DPPH assay underscore the superior antioxidant activity of chamomile infusion when incorporated into bread, aligning with findings in the literature that indicate phenolic compounds and flavonoids are key contributors to the antioxidant properties of plants [15,16]. (Table 6 and Table S8)
3.8. Hierarchical Cluster Analysis of Bread Formulations
A hierarchical cluster analysis (HCA) was performed to categorize the breads based on their physicochemical, antioxidant, and sensory properties (Figure 5). The analysis revealed three distinct clusters based on similarities in composition and sensory characteristics.
Cluster 1: BI-MC 3%, BI-MC 10%, BP-MC 3%, BP-MC 10%
Cluster 2: BI-MC 30%
Cluster 3: BP-MC 30%
Breads in Cluster 1 (BI-MC 3%, BI-MC 10%, BP-MC 3%, BP-MC 10%) exhibited similar characteristics, including lower fiber, ash, polyphenol, and flavonoid content, as well as reduced sensory quality scores. Specifically, the bread samples in this cluster had the lowest levels of total polyphenols (e.g., 33.12 μg QE/mg for BI-MC 3%) and flavonoids (e.g., 31.88 μg EQ/mg for BP-MC 3%) compared to the higher concentration samples. These breads were also rated lower in sensory attributes, particularly in terms of taste and texture, with sensory scores for aroma and crispness being modest (e.g., 2.5 for taste in BI-MC 3%).
In contrast, Cluster 2 (BI-MC 30%) showed higher protein, carbohydrate, and ash content, along with elevated polyphenol and flavonoid levels. For example, the bread enriched with 30% chamomile infusion (BI-MC 30%) demonstrated a significant increase in polyphenol content (68.41 μg QE/mg) and flavonoids (60.47 μg EQ/mg) compared to Cluster 1 breads. Sensory evaluation for BI-MC 30% also indicated higher ratings for taste (3.9), hardness (5.7), and overall acceptability (4.7), making it a preferable choice in terms of both composition and sensory qualities.
Finally, Cluster 3 (BP-MC 30%) demonstrated the highest levels of water, lipids, and fiber, alongside superior sensory attributes such as enhanced volume (4.7), color (4.1), alveolation (5.6), and crispness (4.3). The total polyphenol (61.48 μg QE/mg) and flavonoid (41.67 μg EQ/mg) contents in BP-MC 30% were significantly higher than those in the other samples in Cluster 1, which contributed to its enhanced sensory quality. Breads in this cluster were rated highest for overall acceptability (3.2) and exhibited the most desirable qualities in terms of appearance and texture, highlighting the superior effect of 30% chamomile powder in enhancing both physicochemical and sensory attributes. These findings underscore the important role of the concentration of Matricaria chamomilla in influencing both the chemical composition and sensory quality of the bread. Breads enriched with 30% chamomile powder or infusion (BI-MC 30% and BP-MC 30%) showed the most desirable physicochemical and sensory characteristics, suggesting that higher concentrations of chamomile lead to improved quality in terms of both composition and consumer perception. Figure 5 shows heatmap of physicochemical, antioxidant, and sensory characteristics of six breads with different concentrations (3%, 10%, and 30%) of MC infusion and powder. This heatmap visually represents the concentration of key attributes such as protein, fiber, antioxidants (polyphenols and flavonoids), and sensory attributes (volume, color, taste, crispness). The grouping of bread samples based on these attributes is clearly demonstrated. Dendrogram showing the hierarchical clustering of bread samples based on their physicochemical, antioxidant, and sensory characteristics was reported in Figure 6 This dendrogram illustrates the clustering of the six bread samples into three distinct groups. The clustering analysis reveals that higher concentrations of chamomile infusion (BI-MC 30%) and powder (BP-MC 30%) result in improved bread quality compared to lower concentrations (3% and 10%).
4. Discussion
The results of this study provide new insights into the potential of chamomile (Matricaria chamomilla) as a functional ingredient in bread, both in powdered and infusion forms. The incorporation of chamomile into bread led to significant improvements in nutritional composition, antioxidant activity, and sensory characteristics. These findings not only confirm the initial hypotheses regarding the functionality of chamomile in enhancing bread quality but also suggest potentially useful applications in improving the nutritional value of baked goods and in the sustainable use of plant by-products, traditionally underutilized.
4.1. Phytochemical Profile of Chamomile Infusion and Ethanol Extract
The phytochemical analysis of Matricaria chamomilla infusion and ethanolic extract revealed distinct chemical profiles, with a notable difference in the types and concentrations of bioactive compounds depending on the extraction method. A total of 41 compounds were identified in the infusion, whereas 37 compounds were detected in the ethanolic extract, highlighting subtle yet significant differences between the two preparations (Figure 1). These results are consistent with previous studies that highlight the significant impact of extraction methods on the phytochemical composition of plant materials, with solvents like water and ethanol demonstrating varying extraction efficiencies for different compound classes. [15].
The infusion primarily contained hydrophilic metabolites, with caffeoylquinic acid derivatives like caffeoyl quinic acid (MC_1) and caffeoyl quinic hexoside (MC_4) being particularly abundant. These compounds, known for their strong antioxidant activity [35], are generally more soluble in water, reflecting the infusion’s capacity to extract such bioactive molecules efficiently. This is consistent with earlier studies, which also showed that water-based extraction methods tend to favor the recovery of smaller, hydrophilic phenolic acids that are often associated with antioxidant and anti-inflammatory properties [15,16]. Similarly, the presence of glucosyringic acid (MC_3), hydroxyjasmonic acid (MC_19), and esculetin (MC_6) exclusively in the infusion reinforces the idea that the infusion captures a broad spectrum of low-molecular-weight hydrophilic metabolites, which are more efficiently extracted in an aqueous medium compared to the ethanolic extract (Table 1).
In contrast, the ethanolic extract was richer in polyphenolic compounds, particularly flavonoid glycosides such as luteolin O-glucoside (MC_24) and apigenin O-diglucuronide (MC_23), which are typically less soluble in water. The enhanced extraction of these compounds by ethanol corroborates findings from previous research, which suggested that ethanol is a more effective solvent for isolating flavonoid derivatives, especially those conjugated with sugars [36,37]. Additionally, the presence of higher concentrations of caffeic acid derivatives (e.g., MC_11 and MC_14) in the ethanolic extract suggests that ethanol also has a stronger affinity for extracting more polar phenolic acids, which are less efficiently recovered by water-based methods (Table 2).
The distinct chromatographic profiles of the two extracts, with the infusion exhibiting a greater abundance of hydrophilic phenolic acids and the ethanolic extract showcasing higher concentrations of polyphenol glycosides, reflect the inherent solubility differences between these compound classes.
Additionally, both extracts contained significant levels of dicaffeoylquinic acid (MC_22 and MC_23), though the ethanolic extract consistently showed higher concentrations of this compound. This is in line with the general understanding that ethanol is more efficient in extracting polyphenolic compounds conjugated to sugars or other hydrophobic moieties. In contrast, compounds like hydroxyjasmonic acid (MC_19), which were identified at higher concentrations in the infusion, suggest that water-based extraction methods may favor the retention of certain smaller, hydrophilic metabolites that could contribute to different therapeutic benefits.
These results highlight the distinct bioactive profiles of chamomile infusion and ethanolic extract, both demonstrating antioxidant and anti-inflammatory properties. However, their different compositions make them more suitable for specific applications. The infusion, rich in caffeoylquinic acid derivatives and other hydrophilic metabolites, is particularly advantageous for food fortification, as aqueous extracts are simpler to integrate into food matrices, streamlining the overall process. In contrast, the ethanolic extract, with its higher levels of flavonoid glycosides and caffeic acid derivatives, is more suited to the dietary supplement market, where concentrated polyphenolic compounds are preferred. The preference for aqueous extracts in the food industry is largely due to the ease of preparation, processing, and incorporation into food products, making them a practical choice for functional food applications.
4.2. Antioxidant Activity and Bioactive Compounds
In terms of antioxidant activity, the results from the DPPH, ABTS, and CUPRAC assays revealed that the ethanol extract exhibited higher antioxidant capacity than the chamomile infusion. Specifically, the ethanol extract showed an inhibition of DPPH radicals by 82%, compared to 68% for the infusion (Table S1). Similarly, in the ABTS assay, the ethanol extract demonstrated a higher radical scavenging capacity than the infusion, which is consistent with the findings from the DPPH assay (Table S2). The CUPRAC assay also showed a dose-dependent increase in absorbance for both the ethanol extract and infusion, with the ethanol extract displaying a slightly higher IC50 value (4.95 ± 0.14 µg/mL) compared to the infusion (4.54 ± 0.11 µg/mL) (Table 3). These findings are consistent with previous studies, which have reported that ethanol extraction tends to yield higher antioxidant activity due to the increased solubility of phenolic compounds, especially flavonoids [37]. For instance, studies have highlighted that ethanol extracts of chamomile are particularly rich in flavonoids, which are well-known for their potent antioxidant properties [36]. Additionally, other research has observed that different extraction techniques significantly influence the antioxidant capacity of chamomile, with ethanol-based methods generally providing higher yields of bioactive compounds compared to water-based extracts like infusions [38]. However, while the ethanol extract exhibited higher antioxidant activity in these assays, the chamomile infusion, despite being slightly less potent, still represents a viable option for functional applications in food. The chamomile infusion offers notable advantages in terms of ease of preparation and cost-effectiveness, making it a sustainable and accessible option for functional food applications, especially in industrial settings like bakery products. Water-based extracts align with the growing demand for sustainable food production, as they are easy to incorporate into products while maintaining consumer appeal. Additionally, these extracts support the recovery of bioactive compounds from food waste through eco-friendly methods, promoting green chemistry and sustainability [39]. This approach not only contributes to reducing waste but also helps create functional foods with health benefits, such as antioxidant and anti-glycemic properties.
4.3. α-Amylase Inhibitory Activity
Our results demonstrate that both the ethanolic extract and infusion of chamomile exhibit significant α-amylase inhibitory activity, with the infusion showing slightly higher inhibitory effects across all concentrations, as reflected by its lower IC50 value (11.27 ± 1.15 µg/mL) compared to the ethanolic extract (21.32 ± 0.74 µg/mL) (Table 3). These findings are consistent with previous research indicating that chamomile extracts are rich in bioactive components such as flavonoids (e.g., apigenin and luteolin), which have been shown to modulate enzymatic activity. For example, Villa-Rodriguez et al. [40] reported that chamomile extracts, particularly those rich in apigenin, can inhibit α-amylase by interacting with the enzyme’s active site, likely through hydrogen bonding and hydrophobic interactions. Bayliak et al. [41] similarly highlighted the role of flavonoids and phenolic acids in chamomile extracts in modulating digestive enzymes, particularly α-amylase. These studies underscore the potential of chamomile as a natural inhibitor of starch digestion. Additionally, recent reviews have emphasized chamomile’s broader potential in managing metabolic disorders, such as diabetes and obesity, by not only modulating enzymatic activity but also influencing oxidative stress and metabolic profiles [42]. A systematic review by Hajizadeh-Sharafabad et al.[43] evaluated the effects of chamomile on diabetes and associated complications, highlighting improvements in glycemic control, lipid profiles, and markers of oxidative damage, such as malondialdehyde. These findings suggest that chamomile supplementation, whether as ethanolic extract, aqueous extract, or tea, can positively impact blood glucose levels, insulin sensitivity, and oxidative stress. For example, administration of ethanolic chamomile extract in diabetic rats resulted in a reduction of postprandial hyperglycemia, decreased oxidative stress, and enhanced antioxidant activity, reinforcing chamomile’s potential as a therapeutic agent for metabolic diseases [44]. Chamomile water extracts, such as chamomile tea, have also shown moderate suppression of hyperglycemia in both sucrose-loading and streptozotocin (STZ)-induced diabetic rat models [45]. Together, these results suggest that chamomile not only inhibits α-amylase activity but also offers broader metabolic benefits, such as improving glycemic control and reducing oxidative damage.
4.4. Role of Polyphenols in Starch Digestion and Glycemic Control
The α-amylase inhibitory activity described above is particularly relevant in the context of food production, especially in products like bread. During baking, starches in flour undergo gelatinization, and their digestion plays a pivotal role in the postprandial glycemic response. By incorporating chamomile extracts into bread, it may be possible to modulate starch digestion, potentially resulting in a product with a lower glycemic index. This aligns with recent research emphasizing the influence of food microstructure on digestion, particularly for carbohydrate-based foods [46]. Starch digestion is a complex process that requires an in-depth understanding of its kinetic behavior, as it plays a significant role in regulating postprandial blood glucose levels. Studies have highlighted the critical role of food structure in modulating starch digestibility and glycemic responses [47]. Specifically, the molecular structure of starch, whether in its native, gelatinized, or retrograded form, directly influences its digestibility and the subsequent glycemic impact [48]. Research on bread structure has shown that variations in crumb texture can significantly alter the rate at which starch is digested, suggesting that modifying food matrix microstructure can control the release of glucose [49]. Breads with different crumb structures demonstrated notable differences in digestion, reinforcing the idea that altering the physical structure of starch can impact its bioavailability. Moreover, polyphenolic compounds have been shown to further modulate starch digestibility [50]. Polyphenols, such as those found in chamomile, can either inhibit digestive enzymes directly (e.g., α-amylase) or form inclusion complexes with starch, thereby reducing its digestibility [51]. This process is particularly important when considering the dietary management of conditions like type II diabetes, where controlling postprandial glucose spikes is critical. For instance, chamomile’s aqueous extract, rich in flavonoids, reduced α-glucosidase activity by 60% at a concentration of 0.5 mg/mL [40], highlighting its role as a potent starch digestion inhibitor. In addition to enzyme inhibition, polyphenols can form non-covalent complexes with starch, which further limits the enzyme’s ability to hydrolyze starch. These interactions are typically driven by hydrogen bonds and hydrophobic interactions, reducing the accessibility of starch to digestive enzymes. For example, when phenolic compounds are incubated with the starch matrix, they can form complexes that reduce enzyme accessibility, further slowing the digestion process [51]. These complexes prevent enzymes from efficiently accessing the starch, slowing its breakdown during digestion. The combined effects of enzyme inhibition and polyphenol-starch interactions suggest that polyphenols could serve as an effective strategy for modulating glycemic responses, especially in functional foods designed for diabetes management. Our study suggests that chamomile extracts, rich in polyphenols, may provide a dual benefit: modifying the bread’s microstructure to limit enzyme access to starch and directly inhibiting α-amylase activity, which could slow down starch digestion and lower the glycemic index. This strategy could be especially beneficial for individuals with diabetes or those aiming to manage blood glucose levels.
4.4. Nutritional Composition of Chamomile-Enriched Bread
The incorporation of chamomile into bread formulations resulted in significant changes to its nutritional composition, notably in terms of protein, fiber, and micronutrient content. These alterations can enhance the functional properties of the bread, making it a potential vehicle for the delivery of bioactive compounds, which is of increasing interest within the food industry and for public health. The protein content of BI-MC (bread enriched with chamomile infusion) was significantly higher (14.78%) than both the control bread (12.07%) and BP-MC (bread enriched with chamomile powder), which had a protein content of 12.06%. This finding may be explained by the higher bioavailability of water-soluble proteins in the BI-MC formulation. Aqueous extraction of proteins is a commonly used extraction method for various protein sources [52]. In terms of dietary fiber, BP-MC (bread enriched with chamomile powder) exhibited the highest increase, reaching 10.6%, which was over a 20% improvement compared to the control bread (2.7%). The fiber content in BI-MC was also significantly higher (3.93%) compared to the control, though lower than BP-MC. This difference in fiber content between the two forms of chamomile highlights the potential benefits of using powdered chamomile as a source of dietary fiber in bakery products. The chamomile powder (CR) contains significant quantities of fiber (18.80 g/100 g) and protein (14.80 g/100 g), along with higher concentrations of sulfur amino acids [53]. Its incorporation into bread provides an effective strategy for boosting fiber intake, which is often inadequate in many populations [54]. Increasing fiber intake has been associated with numerous health benefits, including improved digestive health, weight management, and reduced risk of chronic diseases such as cardiovascular diseases and type 2 diabetes [55]. The increased fiber content in BP-MC can be particularly advantageous in promoting gut health and regulating blood sugar levels, as dietary fiber plays a key role in these processes [56,57]. Another important consideration is the moisture content of the enriched breads. Both BI-MC and BP-MC breads showed lower moisture content compared to the control, with BI-MC exhibiting the lowest moisture level (12.55%). BP-MC had a higher moisture content (30.74%), though still significantly lower than the control bread (40.67%). The reduction in moisture content in both chamomile-enriched breads can likely be attributed to the hygroscopic properties of fiber, which binds water in the dough [58]. Lower moisture content may result in a firmer and denser texture, which could influence the bread’s shelf-life and freshness [59]. While some consumers may prefer a firmer texture, this change could pose challenges in terms of sensory attributes such as softness and overall acceptability. This reduction in moisture may also limit the product’s shelf-life, as lower moisture levels typically reduce microbial growth but can also affect the freshness and palatability of the bread. To mitigate this issue, future studies could explore methods to enhance the texture and moisture retention of the enriched bread, perhaps through the addition of natural humectants or other ingredients that preserve moisture [60]. Furthermore, both BI-MC and BP-MC breads showed higher ash content (8.48% for BI-MC and 6.17% for BP-MC) compared to the control bread (4.33%). This increase in ash content indicates a higher mineral content, which is consistent with the known presence of various minerals in chamomile, such as calcium, magnesium, and potassium [61]. Minerals are essential for various physiological functions, including bone health, muscle function, and electrolyte balance. Therefore, the increased ash content of the enriched breads suggests that chamomile could be a beneficial source of bioavailable minerals, which could contribute to improved nutritional intake. Lipids were also affected by the incorporation of chamomile, with BI-MC having the lowest lipid content (0.8%), followed by BP-MC (1.2%) and the control bread (1.8%). This reduction in lipid content is likely due to the dilution effect of the chamomile and the lower fat content of the herb itself. While the decrease in lipid content is not necessarily problematic, it may impact the sensory profile of the bread, particularly in terms of its mouthfeel and richness. Lipids are crucial for the palatability of baked goods, as they contribute to the bread’s softness and moistness. Therefore, the reduction in fat may affect consumer acceptance, and future research could investigate ways to balance the nutritional benefits of reduced lipids with the sensory characteristics desired in bakery products. These findings suggest that chamomile-enriched breads could serve as a valuable functional food, addressing the growing demand for plant-based and health-promoting bakery products. The differences in nutritional composition between BI-MC and BP-MC breads highlight the distinct advantages of using chamomile in different forms, depending on the desired nutritional outcomes. The BI-MC bread, with its higher protein and lower lipid content, could appeal to consumers seeking plant-based protein, while BP-MC bread, with its elevated fiber content, may be particularly beneficial for individuals looking to increase their dietary fiber intake.
4.5. Bioactive Compound Content and Antioxidant Activity of Chamomile-Enriched Bread
The incorporation of Matricaria chamomilla into bread significantly influenced the bioactive compound profile, particularly in terms of phenolic compounds, flavonoids, and antioxidant activity, as reflected in the results presented in Table 6. The bread enriched with chamomile infusion (BI-MC) exhibited a substantial increase in both phenolic and flavonoid contents compared to the control. Specifically, the phenolic content in the bread samples enriched with chamomile infusion showed a dose-dependent increase. At 3% concentration, BI-MC bread contained 33.12 μg GAE/mg, while at 30%, the phenolic content reached 68.41 μg GAE/mg,. In contrast, bread enriched with chamomile powder (BP-MC) exhibited relatively lower phenolic content, with values ranging from 29.59 μg GAE/mg at 3% to 61.48 μg GAE/mg at 30%. These increases in phenolic compounds highlight the infusion’s superior ability to extract bioactive compounds compared to the powder form. Similarly, the flavonoid content was notably higher in the BI-MC-enriched breads. The 30% BI-MC bread exhibited the highest flavonoid content (60.47 μg QE/mg), followed by 10% BI-MC (30.18 μg QE/mg). In comparison, BP-MC samples showed a lower flavonoid content, with values ranging from 30.63 μg QE/mg at 3% to 46.46 μg QE/mg at 10%, and a slight reduction to 41.67 μg QE/mg at 30%. This pattern further supports the notion that chamomile infusion, as a liquid extract, is more efficient in solubilizing these bioactive compounds, which are integral to the bread’s antioxidant properties. The antioxidant activity, evaluated through the DPPH assay, followed a similar trend. The IC50 values demonstrated that BI-MC-enriched breads exhibited significantly stronger antioxidant activity than BP-MC-enriched or control breads. At 30% infusion concentration, the IC50 value reached 0.86 µg/mL, which was substantially lower than the control (6.1 µg/mL), indicating a higher antioxidant capacity. Similarly, the 10% BI-MC bread showed an IC50 value of 1.86 µg/mL, reflecting a pronounced antioxidant activity. Conversely, the antioxidant activity in BP-MC-enriched breads was less potent, with IC50 values ranging from 4.05 µg/mL at 30% to a notably higher 63.94 µg/mL at 3%, indicating that the powder form of chamomile did not extract as effectively as the infusion. These findings underline the significant role of chamomile as a functional ingredient in bread, particularly in enhancing its antioxidant profile. The higher phenolic and flavonoid contents, combined with the superior antioxidant activity in the BI-MC-enriched breads, suggest that chamomile infusion may be a more effective form for fortifying bread with bioactive compounds. This could offer a functional food product that not only improves the nutritional profile but also provides antioxidant protection, which is beneficial for reducing oxidative stress and mitigating the risk of chronic diseases, such as cardiovascular conditions and cancer [62].
4.6. Sensory Evaluation of Chamomile-Enriched Bread
Sensory evaluation was conducted using a 7-point hedonic scale (1 = dislike extremely, 7 = like extremely) with ten trained panelists (five male and five female, aged 20-40 years). The panelists assessed the bread for various sensory attributes including color, aroma, taste, volume, alveolation, texture (crispness and hardness), and overall acceptability. The samples were presented in a randomized order with a 3-digit code, and evaluations were conducted two hours post-baking with palate cleansing between samples. The sensory analysis revealed that chamomile infusion (30%) in bread created a light herbal aroma, which was generally well-received by the panelists. This pleasant, mild herbal note is consistent with findings [53] reporting that herbs impart delicate aromas to baked goods. On the other hand, bread enriched with chamomile powder, though richer in flavor, had a slightly bitter aftertaste, which some panelists found less appealing. This bitterness could be attributed to the higher concentration of bioactive compounds like flavonoids present in the powder, which are known to contribute to a bitter flavor profile [63]. The results suggest that while the chamomile infusion offers a more subtle, consumer-friendly aroma, the stronger, potentially bitter flavor of the chamomile powder may limit consumer acceptance, particularly among those unaccustomed to herbal flavors in bread. Additionally, the texture evaluation indicated an increase in bread firmness with the addition of chamomile, particularly with the higher concentrations. This increase in firmness is likely due to the fiber content in chamomile and hence the presence of hydrocolloids, which act as thickening, texturizing, stabilizing, and gelling agents [64].The denser, firmer texture of chamomile-enriched bread may appeal to consumers seeking a heartier product, but it may be a disadvantage for those who prefer softer, airier breads. These findings suggest a trade-off between the nutritional benefits of chamomile (e.g., higher fiber content) and the texture preferences of consumers
4.7. Hierarchical Cluster Analysis and Sensory Implications
The results of the hierarchical cluster analysis (HCA) further support the sensory observations. The analysis grouped the bread samples into three distinct clusters based on physicochemical, antioxidant, and sensory properties (Figure 5 and 6). Cluster 1 contained breads with lower concentrations of chamomile (3% and 10%) and exhibited modest sensory ratings, particularly in terms of taste and texture. These breads, which had lower levels of polyphenols and flavonoids, were rated lower in sensory attributes such as aroma and crispness, with a taste score of 2.5 for BI-MC 3%. In contrast, Cluster 2 (BI-MC 30%) demonstrated significant improvements in polyphenol and flavonoid content, with sensory scores also improving, particularly for taste and overall acceptability. This aligns with the findings from the sensory evaluation, where BI-MC 30% was rated higher for taste (3.9), hardness (5.7), and overall acceptability (4.7). The higher content of bioactive compounds, combined with the sensory evaluation results, supports the idea that 30% chamomile infusion can enhance both the nutritional profile and sensory characteristics of the bread. The Cluster 3 (BP-MC 30%), enriched with 30% chamomile powder, showed the highest levels of polyphenols, flavonoids, and antioxidant capacity, along with superior sensory ratings in terms of volume, color, alveolation, and crispness. These findings are consistent with the sensory evaluation results, where BP-MC 30% was rated highest for crispness (4.3) and overall acceptability (3.2). The bread’s improved sensory qualities, combined with its high antioxidant content, underscore the positive impact of 30% chamomile powder on both the physicochemical and sensory attributes of the bread. Together, the sensory evaluation and HCA results reinforce the critical role of chamomile concentration in shaping the sensory appeal and nutritional profile of bread. Higher concentrations of chamomile (both in infusion and powder form) contributed to the most desirable physicochemical and sensory characteristics, suggesting that optimal incorporation of chamomile can improve both the health benefits and consumer acceptance of bread.
5. Conclusions
In this study, the incorporation of chamomile into bread was shown to enhance both the nutritional composition and the sensory attributes of the final product. Chamomile-enriched bread exhibited a significant increase in protein and fiber content, making it a promising candidate for improving the nutritional value of bakery products. Specifically, the chamomile powder increased the protein content by 15% and total fiber by 20%, indicating that chamomile can be a valuable plant-based ingredient for improving the nutritional profile of bread. Despite these nutritional improvements, sensory evaluation revealed some challenges, particularly with respect to the bread’s texture and flavor. While the chamomile infusion provided a subtle herbal aroma and was generally well-received by the panelists, the use of chamomile powder led to a more intense, slightly bitter taste, which may limit consumer acceptance. Additionally, the increased fiber content contributed to a firmer texture, which may be appealing to some consumers but could pose challenges for those preferring softer bread. Overall, the findings highlight the potential of chamomile as a functional ingredient in bread, offering both health benefits and an opportunity to diversify the types of plant-based ingredients used in bakery products. However, further studies are needed to optimize the formulation, particularly to balance the nutritional advantages with sensory qualities, such as taste and texture. Future research could also explore the effects of different chamomile concentrations, processing methods, and storage conditions on the long-term stability and sensory characteristics of the bread. By addressing these challenges, chamomile-enriched bread could become a valuable addition to the growing market for functional foods. Finally, the results of this study have significant implications for the food industry, particularly in the development of functional bakery products with high nutritional value and antioxidant properties. The ability to use chamomile, an economical and readily available resource, to enrich bread could pave the way for a new generation of functional foods that combine tradition with innovation.
Supplementary Materials
The following supporting information can be downloaded at the website of this paper posted on Preprints.org, Table S1: Antioxidant Activity of Matricaria chamomilla Infusion and Ethanolic Extract in DPPH assay; Table S2: Antioxidant Activity of Matricaria chamomilla Infusion and Ethanolic Extract in ABTS assay; Table S3: Absorbance of Matricaria chamomilla Infusion and Ethanolic Extract in CUPRAC assay; Table S4: α-amylase inhibitory assay of Matricaria chamomilla Infusion and Ethanolic Extract; Table S5: α-amylase inhibitory assay of Acarbose used as standard; Table S6: Nutritional Composition of wheat bread samples enriched with Matricaria chamomilla at 3%, 10%, and 30% concentrations; Table S7: Technological and sensory characteristics of wheat bread samples enriched with Matricaria chamomilla at 3%, 10%, and 30% concentrations; Table S8: Total phenolic, flavonoid contents, and antioxidant activity of bread enriched with Matricaria chamomilla at 3%, 10%, and 30% concentrations; Figure S1: Calibration curve of Total Phenolic Content; Figure S2: Calibration curve of Total Flavonoid Content; Figure S3: Sensory Analysis Sheet for Bread Evaluation; Figure S4: Inhibition curve of BP-Mc (30%) by DPPH assay; Figure S5: Inhibition curve of BI-Mc (30%) by DPPH assay;
Author Contributions
For research articles with several authors, a short paragraph specifying their individual contributions must be provided. The following statements should be used “Conceptualization, K.K. and L.R.; methodology, K.K., S.I., D.F., B.N.,V.S., M.D.E. software, K.K., S.I., D.F., B.N.,V.S., validation, K.K., M.D.E. and L.R.; formal analysis, K.K., S.I., D.F., B.N.,V.S., M.D.E.; investigation, K.K., S.I., D.F., B.N.,V.S., M.D.E.; resources, K.K., L.R.; data curation, K.K., L.R.; writing—original draft preparation, K.K., M.D.E., L.R.; writing—review and editing, K.K., M.D.E., L.R.; visualization, K.K., M.D.E., L.R.; supervision, K.K., M.D.E., L.R.; project administration, K.K. and L.R; funding acquisition, K.K. and L.R. All authors have read and agreed to the published version of the manuscript.
Funding
This research was funded under the National Recovery and Resilience Plan (NRRP), Mission 4 Component 2 Investment 1.4—Call for tender No. 3138 of 16 December 2021, rectified by Decree n. 3175 of 18 December 2021 of Italian Ministry of University and Research funded by the European Union—NextGenerationEU; Award Number: Project code CN_00000033, Concession Decree No. 1034 of 17 June 2022 adopted by the Italian Ministry of University and Research, CUP: D43C22001260001, Project title “National Biodiversity Future Center—NBFC”.
Conflicts of Interest
The authors declare no conflicts of interest.
References
- O’connor, A. An overview of the role of bread in the UK diet. Nutr. Bull. 2012, 37 (3), 193-212. [CrossRef]
- Danesh, A. S.; Moradi, H.; Nojavan, F. Appropriate Patterns of Bread Preparation and Consumption According To Teachings of the Quran, Ahadith, and Persian Medicine. Health spiritual. med. ethics. 2017, 4 (4).
- Elsaban, S. M. S.; Abd Elrazek, G.; Anas, M. A. Unveiling The Hidden World: Bread Offerings In Sacred Art And Their Significance In Old Kingdom. Int. J. Tour. Hosp. Manag. 2024, 7 (1), 254-282.
- Nistor, E.; Sfetcu, E.-L.; Sfetcu, I. ’Our daily bread’: history... and stories. 2014, LVII, 432-440.
- Hussien, H.; Afify, M.; Rizk, A. Estimating the average Intake of bread and its contribution Recommended Daily Allowance for different Income Categories. Egypt J. Agric. Res 2013, 237-250.
- Lockyer, S.; Spiro, A. The role of bread in the UK diet: An update. Nutr. Bull. 2020, 45 (2), 133-164. [CrossRef]
- Sadowski, A.; Dobrowolska, B.; Dziugan, P.; Motyl, I.; Liszkowska, W.; Rydlewska-Liszkowska, I.; Berłowska, J. Bread consumption trends in Poland: A socio-economic perspective and factors affecting current intake. Food sci. nutr. 2024, 12 (10), 7776-7787. [CrossRef]
- Baker, M. T.; Lu, P.; Parrella, J. A.; Leggette, H. R. Consumer acceptance toward functional foods: A scoping review. Int. J. Environ. Res. Public Health 2022, 19 (3), 1217. [CrossRef]
- Guiné, R. P.; Florença, S. G.; Barroca, M. J.; Anjos, O. The link between the consumer and the innovations in food product development. Foods 2020, 9 (9), 1317. [CrossRef]
- Topolska, K.; Florkiewicz, A.; Filipiak-Florkiewicz, A. Functional food—consumer motivations and expectations. Int. J. Environ. Res. Public Health. 2021, 18 (10), 5327. [CrossRef]
- Dewettinck, K.; Van Bockstaele, F.; Kühne, B.; Van de Walle, D.; Courtens, T.; Gellynck, X. Nutritional value of bread: Influence of processing, food interaction and consumer perception. J. Cereal Sci. 2008, 48 (2), 243-257. [CrossRef]
- Mesta-Corral, M.; Gómez-García, R.; Balagurusamy, N.; Torres-León, C.; Hernández-Almanza, A. Y. Technological and Nutritional Aspects of Bread Production: An overview of current status and future challenges. Foods 2024, 13 (13), 2062. [CrossRef]
- Akram, W.; Ahmed, S.; Rihan, M.; Arora, S.; Khalid, M.; Ahmad, S.; Ahmad, F.; Haque, S.; Vashishth, R. An updated comprehensive review of the therapeutic properties of Chamomile (Matricaria chamomilla L.). Int. J. Food Prop. 2024, 27 (1), 133-164. [CrossRef]
- Dai, Y.-L.; Li, Y.; Wang, Q.; Niu, F.-J.; Li, K.-W.; Wang, Y.-Y.; Wang, J.; Zhou, C.-Z.; Gao, L.-N. Chamomile: a review of its traditional uses, chemical constituents, pharmacological activities and quality control studies. Molecules 2022, 28 (1), 133. [CrossRef]
- Foschi, M.; Marsili, L.; Luciani, I.; Gornati, G.; Scappaticci, C.; Ruggieri, F.; D’Archivio, A. A.; Biancolillo, A. Optimization of the Cold Water Extraction Method for High-Value Bioactive Compounds from Chamomile (Matricaria chamomilla L.) Flower Heads Through Chemometrics. Molecules 2024, 29 (20), 4925. [CrossRef]
- Guimarães, R.; Barros, L.; Dueñas, M.; Calhelha, R. C.; Carvalho, A. M.; Santos-Buelga, C.; Queiroz, M. J. R.; Ferreira, I. C. Infusion and decoction of wild German chamomile: Bioactivity and characterization of organic acids and phenolic compounds. Food Chem. 2013, 136 (2), 947-954. [CrossRef]
- Núñez Sellés, A. J.; Vélez Castro, H. T.; Agüero-Agüero, J.; González-González, J.; Naddeo, F.; De Simone, F.; Rastrelli, L. Isolation and quantitative analysis of phenolic antioxidants, free sugars, and polyols from mango (Mangifera indica L.) stem bark aqueous decoction used in Cuba as a nutritional supplement. J. Agric. Food Chem. 2002, 50 (4), 762-766. [CrossRef]
- Magalhães, L. M.; Almeida, M. I. G.; Barreiros, L.; Reis, S.; Segundo, M. A. Automatic aluminum chloride method for routine estimation of total flavonoids in red wines and teas. Food Anal. Methods. 2012, 5, 530-539. [CrossRef]
- Re, R.; Pellegrini, N.; Proteggente, A.; Pannala, A.; Yang, M.; Rice-Evans, C. Antioxidant activity applying an improved ABTS radical cation decolorization assay. Free Radic. Biol. Med. 1999, 26 (9-10), 1231-1237. [CrossRef]
- Sharma, O. P.; Bhat, T. K. DPPH antioxidant assay revisited. Food Chem. 2009, 113 (4), 1202-1205. [CrossRef]
- Apak, R.; Güçlü, K.; Özyürek, M.; Karademir, S. E. Novel total antioxidant capacity index for dietary polyphenols and vitamins C and E, using their cupric ion reducing capability in the presence of neocuproine: CUPRAC method. J. Agric. Food Chem. 2004, 52 (26), 7970-7981. [CrossRef]
- Randhir, R.; Shetty, K. Improved α-amylase and Helicobacter pylori inhibition by fenugreek extracts derived via solid-state bioconversion using Rhizopus oligosporus. Asia Pac. J. Clin. Nutr. 2007, 16 (3), 382-392.
- AOAC. Official Method of Analysis (18th Ed.). In William Horwitz. Ed. Washington, DC.Association of Official Analytical Chemists, 2005; Vol. 26, pp 56-132.
- 24. AACC. Approved methods of the AACC,10th edn, American Association of Cereal Chemists. In Methods 54.21, 54-10, 32.10, 10.05, 44.40, AACC, St. Paul: 2000.
- Djeghim, F.; Bourekoua, H.; Różyło, R.; Bieńczak, A.; Tanaś, W.; Zidoune, M. N. Effect of by-products from selected fruits and vegetables on gluten-free dough rheology and bread properties. Appl. Sci. 2021, 11 (10), 4605. [CrossRef]
- Alara, O. R.; Abdurahman, N. H.; Ukaegbu, C. I. Extraction of phenolic compounds: A review. Curr. Res. Food Sci. 2021, 4, 200-214. [CrossRef]
- de Mendonça, L. G.; Holanda, M. H.; Leão, M. V. d. S.; Galvão, A. M. M.; Carneiro, S. V.; Guimarães, D. J.; Zambelli, R. A. Assessing the impact of Plectranthus amboinicus (Lour) Spreng leaf extract on bread quality. Cereal Chem. 2024, 101 (5), 978-990. [CrossRef]
- Yadav, D.; Thakur, N.; Sunooj, K.; Singh, K. Effect of de-oiled peanut meal flour (DPMF) on the textural, organoleptic and physico chemical properties of bread. Int. Food Res. J. 2013, 20 (3), 1307. [CrossRef]
- Czubaszek, A.; Czaja, A.; Sokół-Łętowska, A.; Kolniak-Ostek, J.; Kucharska, A. Z. Changes in antioxidant properties and amounts of bioactive compounds during simulated in vitro digestion of wheat bread enriched with plant extracts. Molecules 2021, 26 (20), 6292. [CrossRef]
- Ma, J.; Ma, L.; Chen, X.; Zhou, H.; Wang, Z.; He, Y.; Fujita, K.; Luan, G. Rheological behavior of batter and quality of gluten-free bread based on nonglutinous rice flour and tartary buckwheat flour. Cereal Chem. 2022, 99 (3), 542-555. [CrossRef]
- Keetels, C.; Visser, K.; Van Vliet, T.; Jurgens, A.; Walstra, P. Structure and mechanics of starch bread. J. Cereal Sci. 1996, 24 (1), 15-26.
- Park, L.-Y.; Lee, S.-H.; Kim, S.-J. Preparation and sensory characteristics of bread containing Schizandra chinensis Baillon (a traditional Korean medicinal plant). Korean J. Food Preserv. 2010, 17 (5), 637-643.
- Al-Saleh, A.; Brennan, C. S. Bread wheat quality: some physical, chemical and rheological characteristics of Syrian and English bread wheat samples. Foods 2012, 1 (1), 3-17. [CrossRef]
- Haghi, G.; Hatami, A.; Safaei, A.; Mehran, M. Analysis of phenolic compounds in Matricaria chamomilla and its extracts by UPLC-UV. Res. Pharm. Sci. 2014, 9 (1), 31-37.
- Tajner-Czopek, A.; Gertchen, M.; Rytel, E.; Kita, A.; Kucharska, A. Z.; Sokół-Łętowska, A. Study of antioxidant activity of some medicinal plants having high content of caffeic acid derivatives. Antioxidants 2020, 9 (5), 412. [CrossRef]
- Catani, M. V.; Rinaldi, F.; Tullio, V.; Gasperi, V.; Savini, I. Comparative analysis of phenolic composition of six commercially available chamomile (Matricaria chamomilla L.) extracts: Potential biological implications. Int. J. Mol. Sci. 2021, 22 (19), 10601. [CrossRef]
- Lohvina, H.; Sándor, M.; Wink, M. Effect of Ethanol Solvents on Total Phenolic Content and Antioxidant Properties of Seed Extracts of Fenugreek (Trigonella foenum-graecum L.) varieties and determination of phenolic Composition by HPLC-ESI-MS. Diversity 2021, 14 (1), 7. [CrossRef]
- Cvetanović, A.; Švarc-Gajić, J.; Mašković, P.; Savić, S.; Nikolić, L. Antioxidant and biological activity of chamomile extracts obtained by different techniques: perspective of using superheated water for isolation of biologically active compounds. Ind. Crop. Prod. 2015, 65, 582-591. [CrossRef]
- Basile, G.; De Luca, L.; Sorrentino, G.; Calabrese, M.; Esposito, M.; Pizzolongo, F.; Romano, R. Green technologies for extracting plant waste functional ingredients and new food formulation: A review. J. Food Sci. 2024. [CrossRef]
- Villa-Rodriguez, J. A.; Kerimi, A.; Abranko, L.; Tumova, S.; Ford, L.; Blackburn, R. S.; Rayner, C.; Williamson, G. Acute metabolic actions of the major polyphenols in chamomile: An in vitro mechanistic study on their potential to attenuate postprandial hyperglycaemia. Sci. Rep. 2018, 8 (1), 5471. [CrossRef]
- Bayliak, M. M.; Dmytriv, T. R.; Melnychuk, A. V.; Strilets, N. V.; Storey, K. B.; Lushchak, V. I. Chamomile as a potential remedy for obesity and metabolic syndrome. EXCLI J. 2021, 20, 1261. [CrossRef]
- Akhgarjand, C.; Moludi, J.; Ebrahimi-Mousavi, S.; Bagheri, A.; Bavani, N. G.; Beigmohammadi, M. T.; Malekahmadi, M. The effect of chamomile consumption on glycemic markers in humans and animals: a systematic review and meta-analysis. J. diabetes metab. disord. 2024, 23 (1), 189-198. [CrossRef]
- Hajizadeh-Sharafabad, F.; Varshosaz, P.; Jafari-Vayghan, H.; Alizadeh, M.; Maleki, V. Chamomile (Matricaria recutita L.) and diabetes mellitus, current knowledge and the way forward: A systematic review. Complement Ther. Med. 2020, 48, 102284. [CrossRef]
- Cemek, M.; Kağa, S.; Şimşek, N.; Büyükokuroğlu, M. E.; Konuk, M. Antihyperglycemic and antioxidative potential of Matricaria chamomilla L. in streptozotocin-induced diabetic rats. J. Nat. Med. 2008, 62, 284-293. [CrossRef]
- Kato, A.; Minoshima, Y.; Yamamoto, J.; Adachi, I.; Watson, A. A.; Nash, R. J. Protective effects of dietary chamomile tea on diabetic complications. J. Agric. Food Chem. 2008, 56 (17), 8206-8211. [CrossRef]
- Wee, M. S.; Henry, C. J. Reducing the glycemic impact of carbohydrates on foods and meals: Strategies for the food industry and consumers with special focus on Asia. Compr. Rev. Food Sci. Food Saf. 2020, 19 (2), 670-702. [CrossRef]
- Korompokis, K.; Verbeke, K.; Delcour, J. A. Structural factors governing starch digestion and glycemic responses and how they can be modified by enzymatic approaches: A review and a guide. Compr. Rev. Food Sci. Food Saf. 2021, 20 (6), 5965-5991. [CrossRef]
- Åkerberg, A.; Liljeberg, H.; Björck, I. Effects of amylose/amylopectin ratio and baking conditions on resistant starch formation and glycaemic indices. J. Cereal Sci. 1998, 28 (1), 71-80.
- Goesaert, H.; Leman, P.; Bijttebier, A.; Delcour, J. A. Antifirming effects of starch degrading enzymes in bread crumb. J. Agric. Food Chem. 2009, 57 (6), 2346-2355. [CrossRef]
- Ngo, T. V.; Kusumawardani, S.; Kunyanee, K.; Luangsakul, N. Polyphenol-modified starches and their applications in the food industry: recent updates and future directions. Foods 2022, 11 (21), 3384. [CrossRef]
- Kan, L.; Oliviero, T.; Verkerk, R.; Fogliano, V.; Capuano, E. Interaction of bread and berry polyphenols affects starch digestibility and polyphenols bio-accessibility. J. Funct. Foods 2020, 68, 103924. [CrossRef]
- Giuberti, G.; Rocchetti, G.; Lucini, L. Interactions between phenolic compounds, amylolytic enzymes and starch: An updated overview. Curr. Opin. Food Sci. 2020, 31, 102-113. [CrossRef]
- Chen, R.; Wang, X.-J.; Zhang, Y.-Y.; Xing, Y.; Yang, L.; Ni, H.; Li, H.-H. Simultaneous extraction and separation of oil, proteins, and glucosinolates from Moringa oleifera seeds. Food Chem. 2019, 300, 125162. [CrossRef]
- Pathania, V.; Bora, B.; Kumar, R.; Sharma, K.; Neha, Y.; Kumar, A.; Singh, S.; Kumar, D.; Srivatsan, V. Valorization of German Chamomile Agri-Waste as a Source of High-Value Products: Characterization of Nutrients and Phytochemicals Towards Functional Food Development. Waste biomass valori. 2024, 1-21. [CrossRef]
- El-Hadidy, E. M.; Abd-Elhak, N. A.; Rizk, A. E. Partial Replacement of the Meat in Beefburgers by Chamomile Wastes Powder After Harvesting as a Rich Source of Dietary Fiber and Antioxidants. Egypt. J. Agric. Res. 2014, 92 (2), 655-707. [CrossRef]
- Anderson, J. W.; Baird, P.; Davis Jr, R. H.; Ferreri, S.; Knudtson, M.; Koraym, A.; Waters, V.; Williams, C. L. Health benefits of dietary fiber. Nutr. Rev. 2009, 67 (4), 188-205. [CrossRef]
- Zhang, G.; Wang, D.; Ding, Y.; Zhang, J.; Ding, Y.; Lyu, F. Effect and mechanism of insoluble dietary fiber on postprandial blood sugar regulation. Trends Food Sci. Technol. 2024, 104354. [CrossRef]
- Myhrstad, M. C.; Tunsjø, H.; Charnock, C.; Telle-Hansen, V. H. Dietary fiber, gut microbiota, and metabolic regulation—Current status in human randomized trials. Nutr. 2020, 12 (3), 859. [CrossRef]
- Renzetti, S.; Theunissen, M.; Horrevorts, K. A systematic comparison of the intrinsic properties of wheat and oat bran fractions and their effects on dough and bread properties: Elucidation of chemical mechanisms, water binding, and steric hindrance. Foods 2021, 10 (10), 2311. [CrossRef]
- Scanlon, M.; Zghal, M. Bread properties and crumb structure. Food Res. Int. 2001, 34 (10), 841-864. [CrossRef]
- Ammar, A.-F.; Siddeeg, A.; Aqlan, F. M.; Howladar, S. M.; Refai, M. Y.; Afifi, M.; Ali, H. A.; Hajjar, D.; Sulamain, M. G.; Chamba, M. V. Shelf life extension of wheat bread by alhydwan flour and Carboxymethylcellulose and improvement of their quality characteristics, dough rheological and microstructure. Int. J. Biol. Macromol. 2020, 156, 851-857. [CrossRef]
- Mladenov, M.; Lubomirov, L.; Grisk, O.; Avtanski, D.; Mitrokhin, V.; Sazdova, I.; Keremidarska-Markova, M.; Danailova, Y.; Nikolaev, G.; Konakchieva, R. Oxidative stress, reductive stress and antioxidants in vascular pathogenesis and aging. Antioxidants 2023, 12 (5), 1126. [CrossRef]
- Liu, S.; Grierson, D.; Xi, W. Biosynthesis, distribution, nutritional and organoleptic properties of bitter compounds in fruit and vegetables. Crit. Rev. Food Sci. Nutr. 2024, 64 (7), 1934-1953. [CrossRef]
- Bölek, S.; Tosya, F.; Göksu, F. Effects of Artemisia dracunculus powder on dough rheology and quality properties as a novel ingredient in bread formulation. Food Sci. Technol. Int. 2024, 10820132241248483. [CrossRef]
Figure 1.
Profile of Matricaria chamomilla extract: UHPLC-HRMS chromatogram of infusion (A) and ethanolic extract (B).
Figure 1.
Profile of Matricaria chamomilla extract: UHPLC-HRMS chromatogram of infusion (A) and ethanolic extract (B).
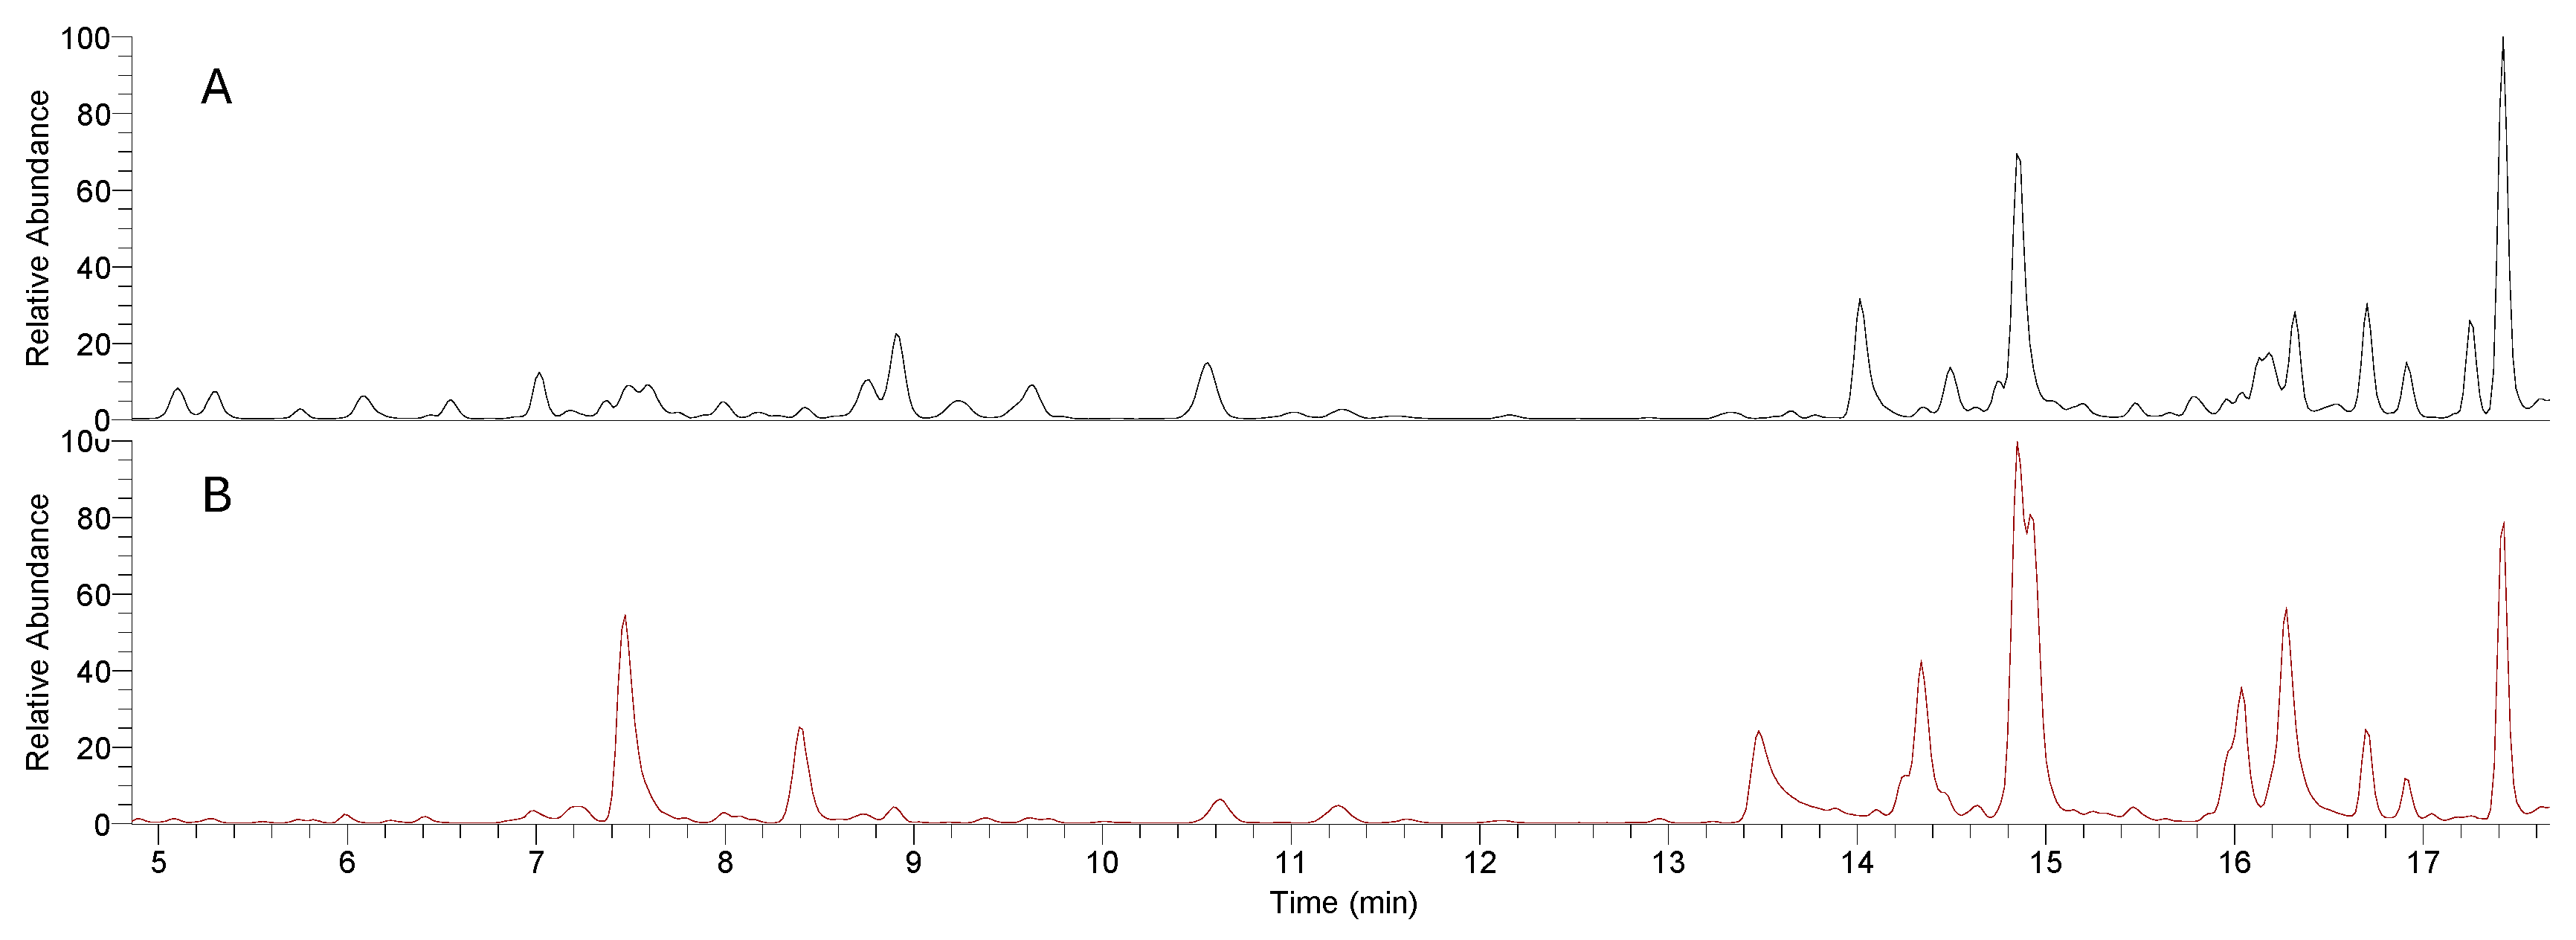
Figure 2.
Bread during fermentation, showing significant volume increase.
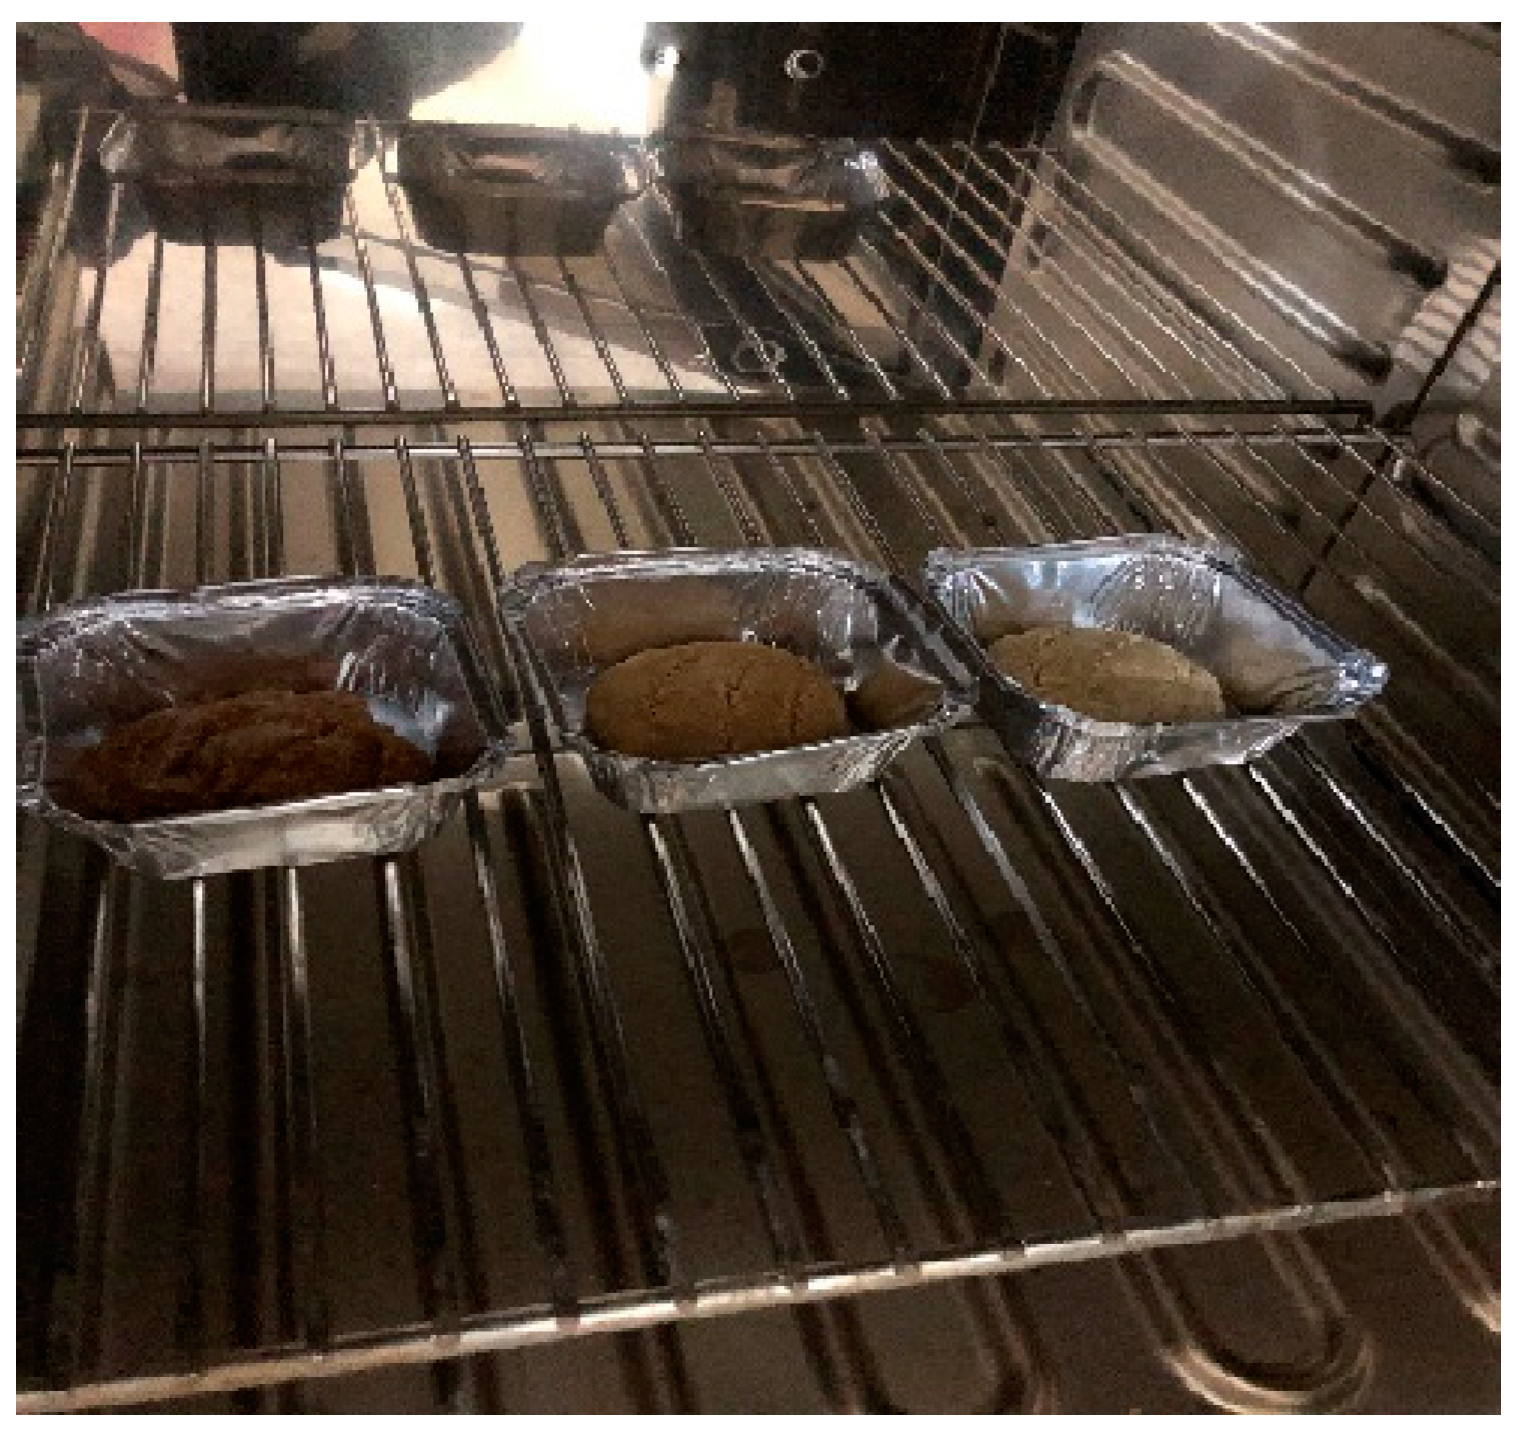
Figure 3.
Final bread product with 30% chamomile powder after baking, showing visible differences in physicochemical and sensory characteristics.
Figure 3.
Final bread product with 30% chamomile powder after baking, showing visible differences in physicochemical and sensory characteristics.
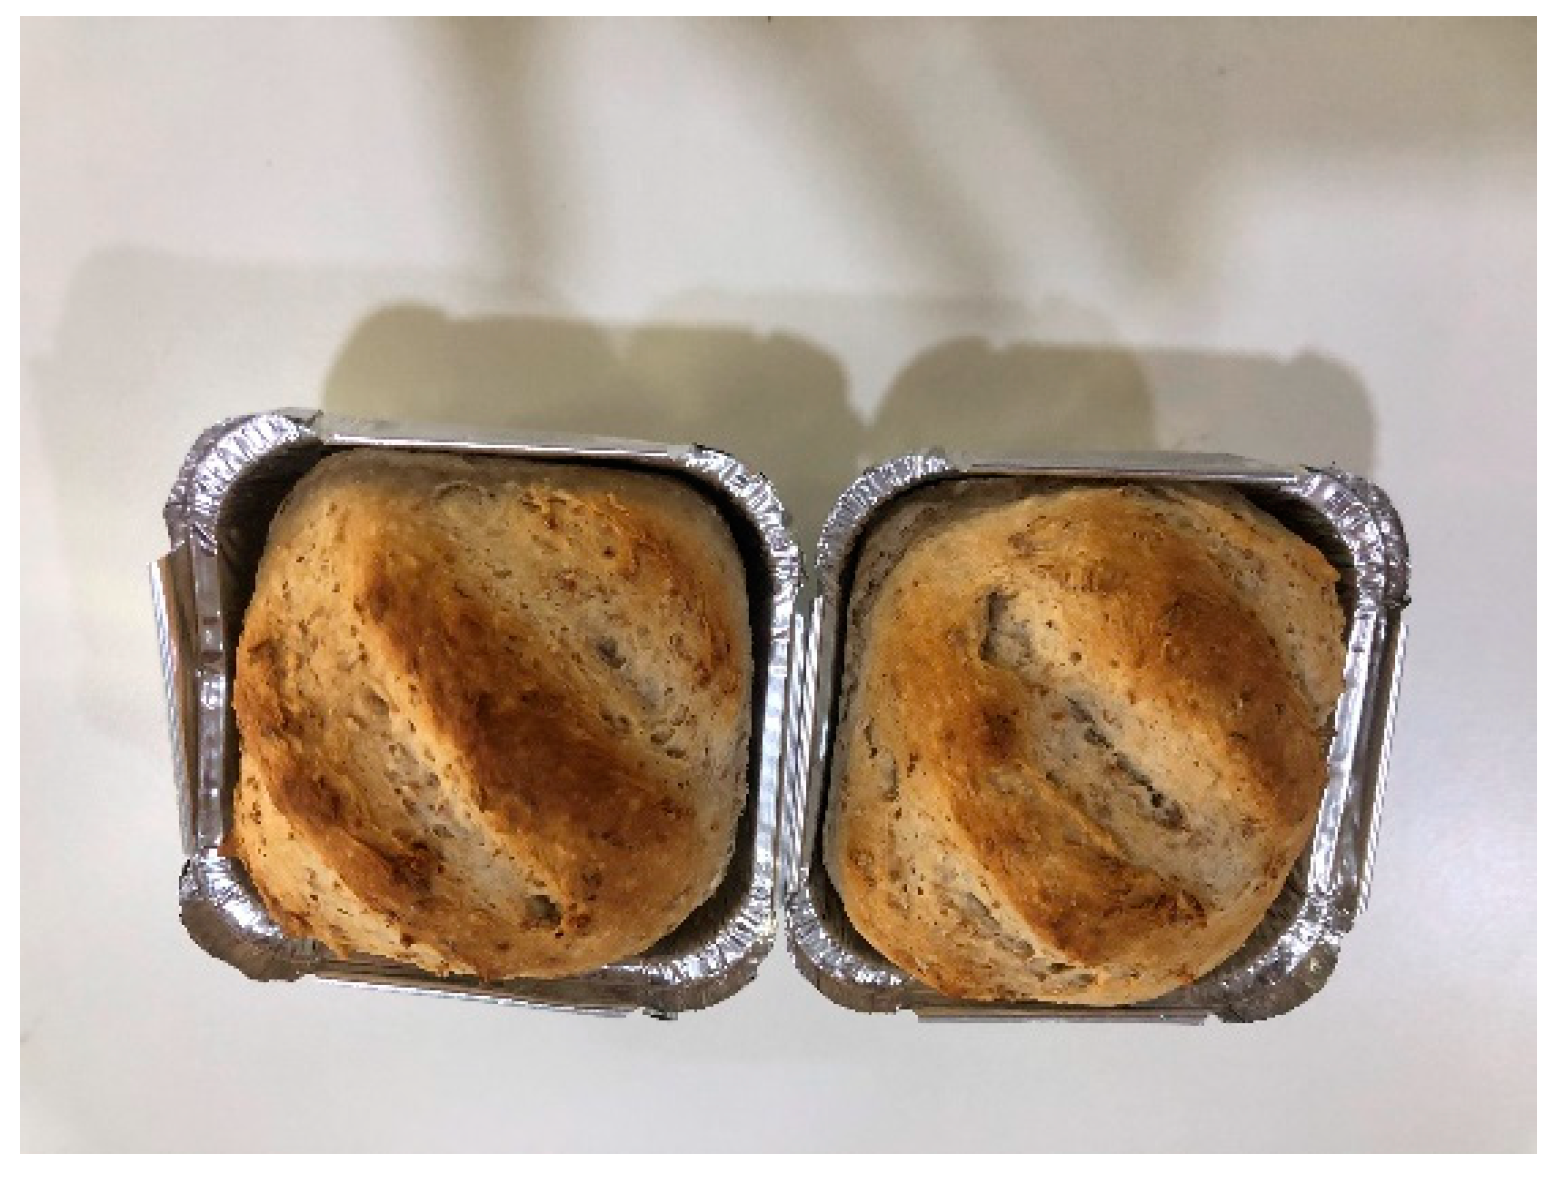
Figure 4.
Sensory quality traits of bread samples enriched with 30% Matricaria chamomilla in powder and infusion forms. The sensory attributes evaluated include color, taste, texture, aroma, crispness, and overall acceptability.
Figure 4.
Sensory quality traits of bread samples enriched with 30% Matricaria chamomilla in powder and infusion forms. The sensory attributes evaluated include color, taste, texture, aroma, crispness, and overall acceptability.
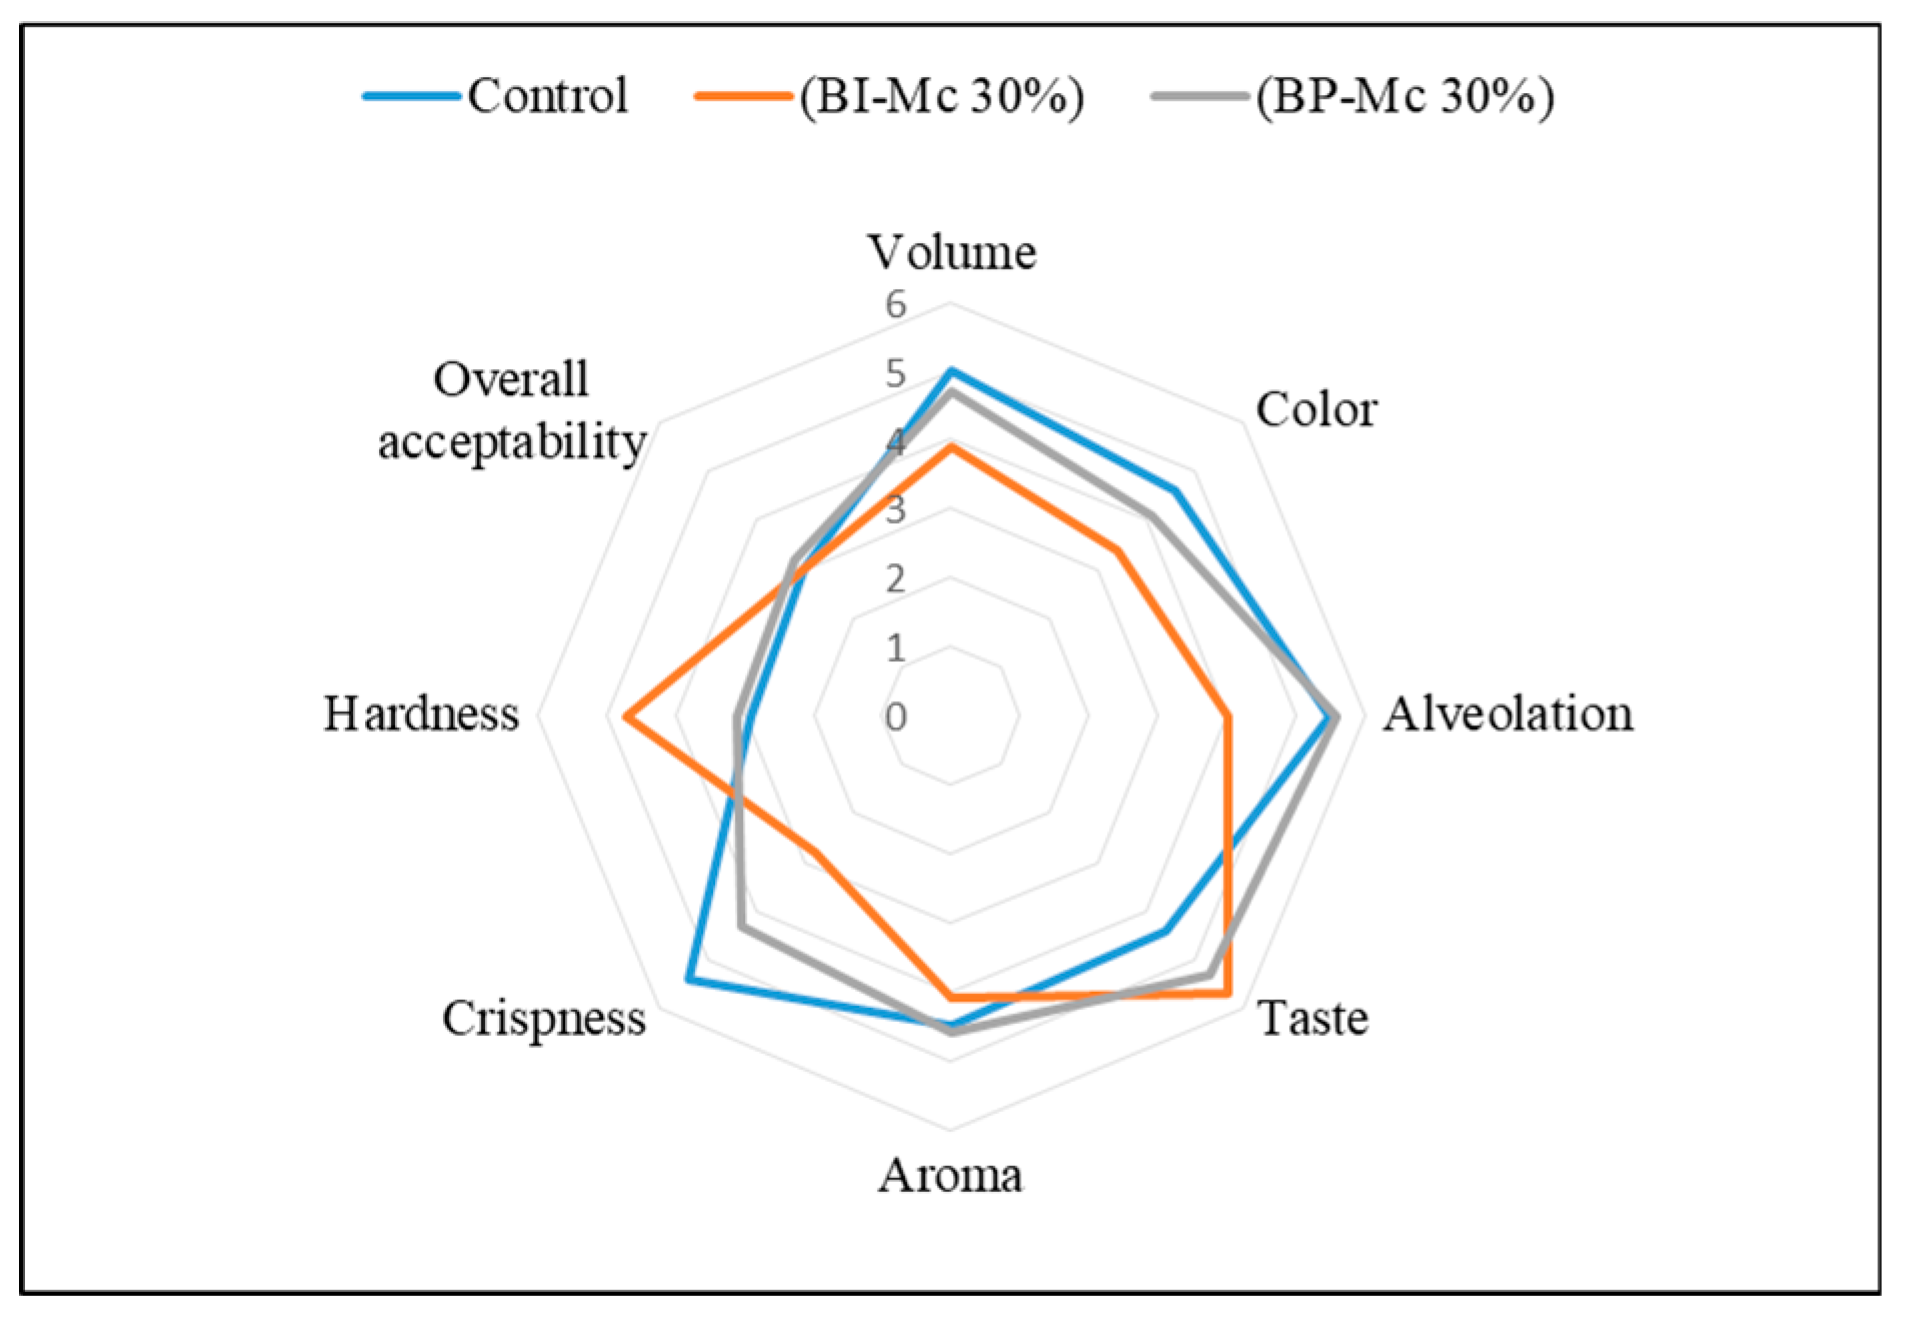
Figure 5.
Hierarchical Clustering Visualization of bread samples enriched with different concentrations of Matricaria chamomilla (3%, 10%, and 30%) in powder (BP-MC) and infusion (BI-MC) forms. The clustering is based on the physicochemical, antioxidant, and sensory characteristics of the breads.
Figure 5.
Hierarchical Clustering Visualization of bread samples enriched with different concentrations of Matricaria chamomilla (3%, 10%, and 30%) in powder (BP-MC) and infusion (BI-MC) forms. The clustering is based on the physicochemical, antioxidant, and sensory characteristics of the breads.
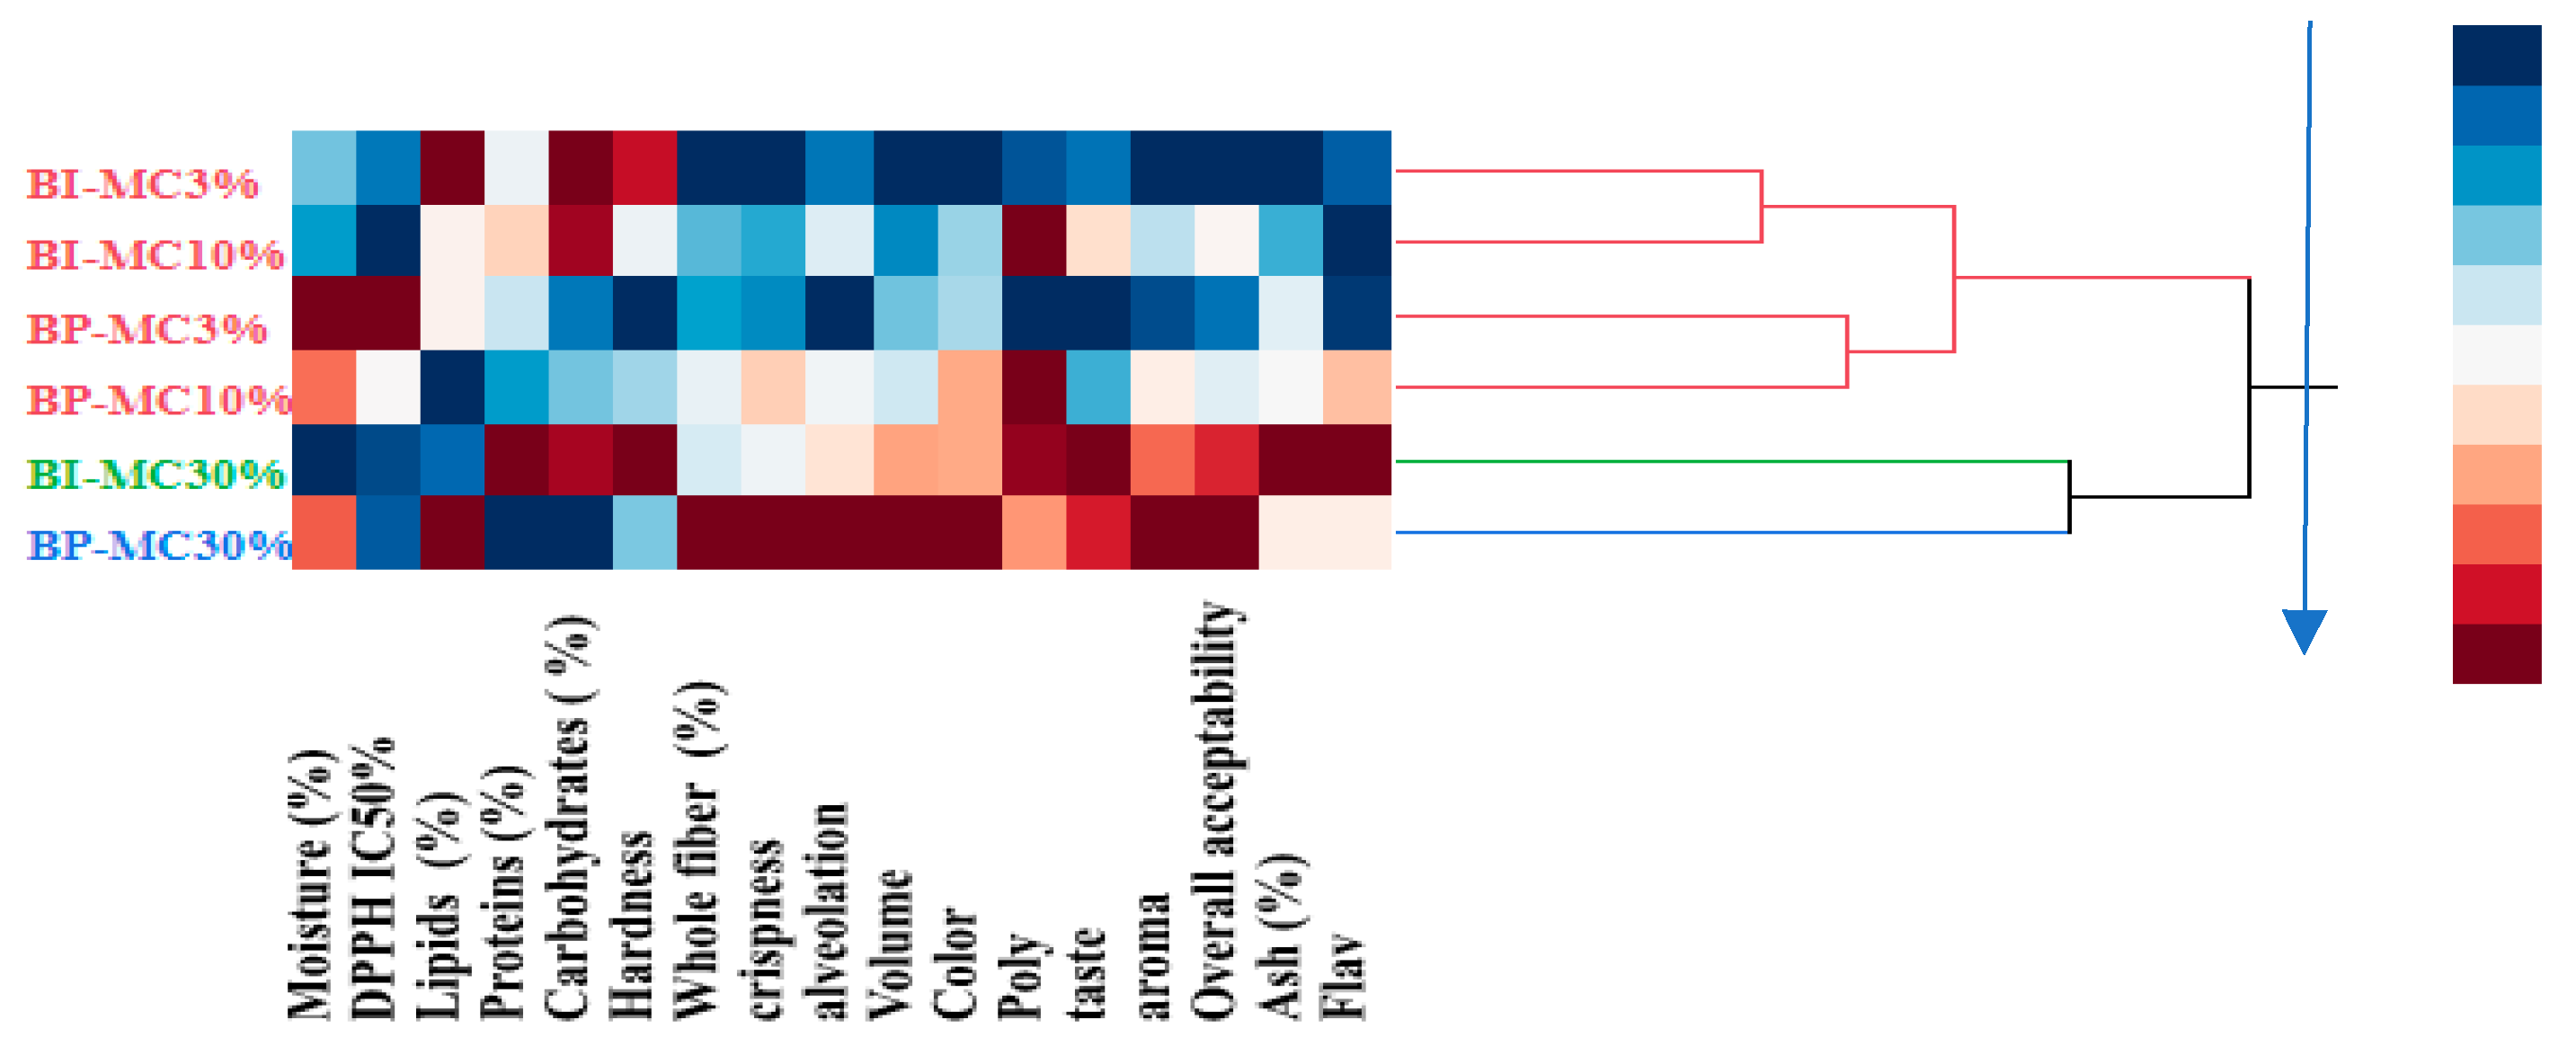
Figure 6.
Dendrogram showing the hierarchical clustering of bread samples based on their physicochemical, antioxidant, and sensory characteristics. The analysis groups the bread formulations into three distinct clusters according to the concentration and form of Matricaria chamomilla used (infusion or powder).
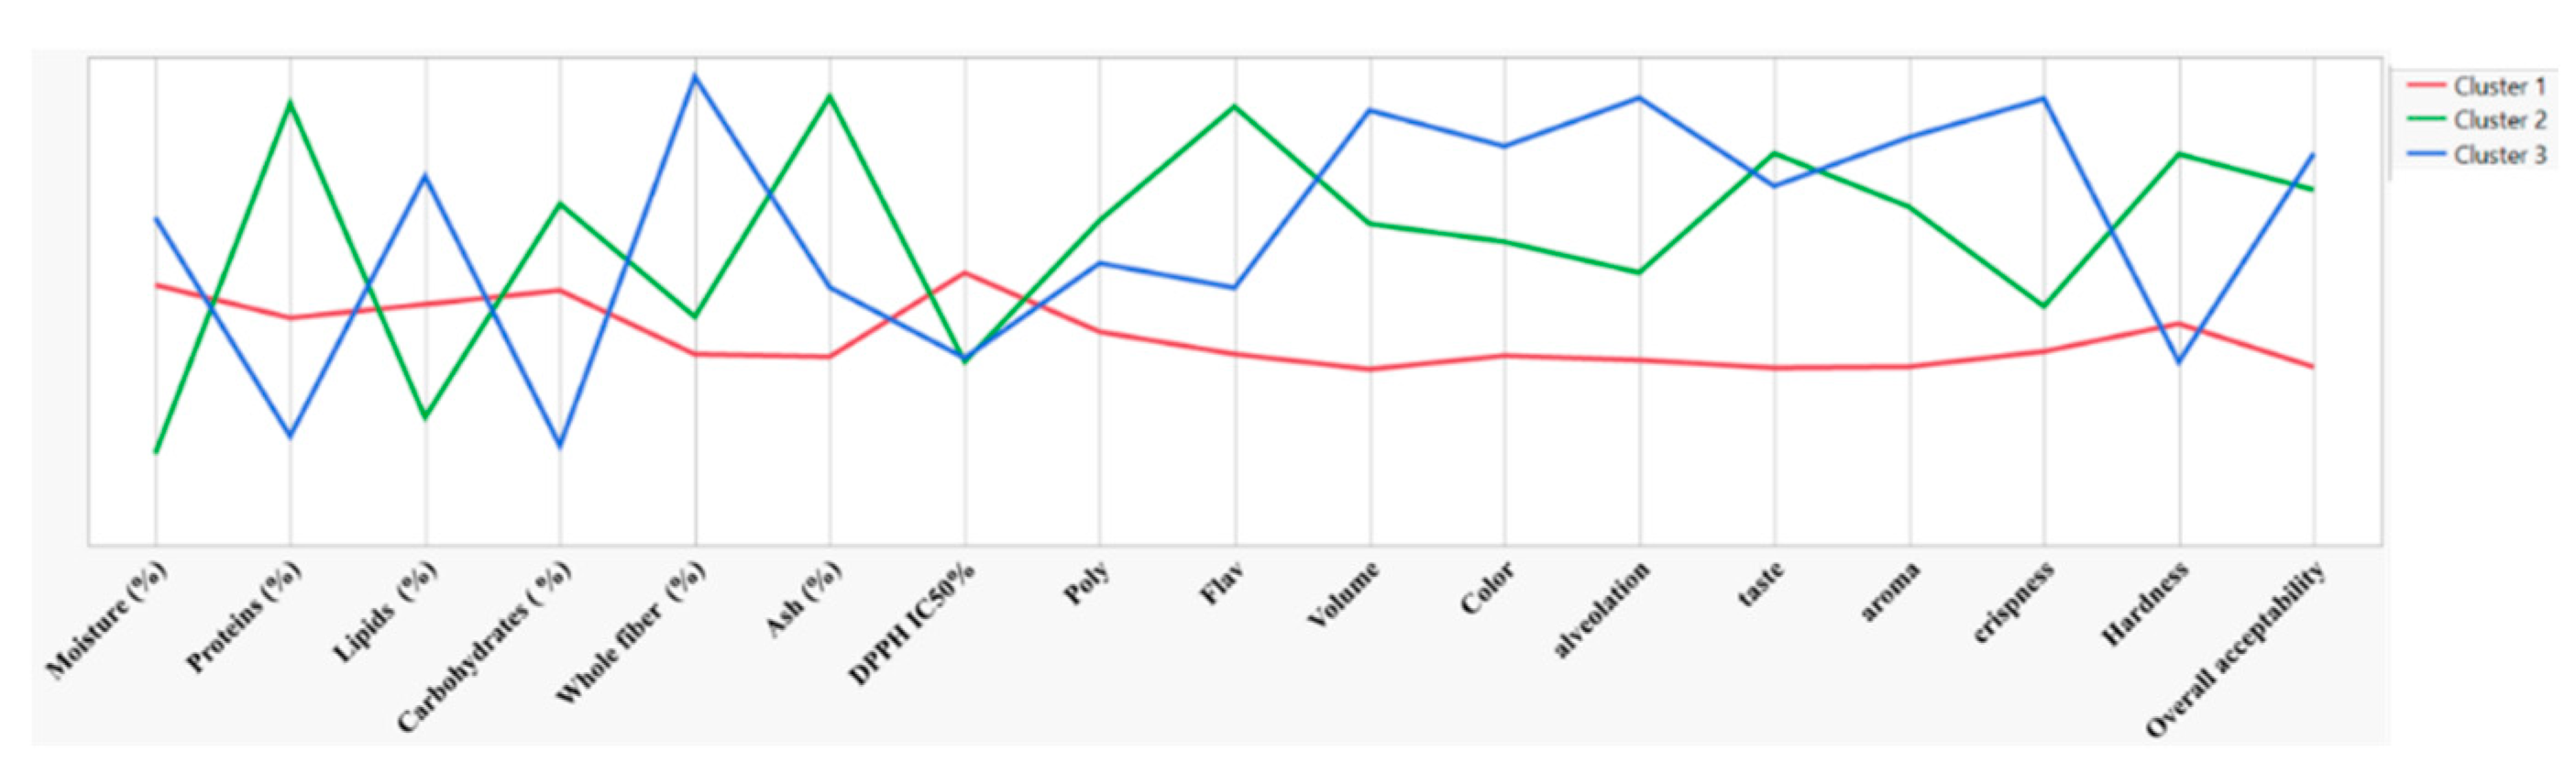

Table 1.
UHPLC-(-)HRMS data of compounds detected in infusion of Matricaria chamomilla.
| ID | Name | Molecular Formula |
RT [min] |
Precursor m/z [M-H]- |
NEG ppm | Confirming fragment | MSI level* |
| MC_1 | Caffeoyl quinic acid | C16H18O9 | 5.28 | 353.0886 | 2.04 | 191.0553, 179.0341, 135.0440 | 2 |
| MC_2 | Caffeoyl hexoside | C15H18O9 | 5.55 | 341.0877 | 1.24 | 179.0341, 161.0246, 135.0443 | 2 |
| MC_3 | Glucosyringic acid | C15H20O10 | 5.75 | 359.0982 | 1.16 | 197.0457 | 2 |
| MC_4 | Caffeoyl quinic hexoside | C22H28O14 | 5.76 | 515.1411 | 0.97 | 323.0777, 353.0882, 191.0553 | 2 |
| MC_5 | Eucomic acid | C11H12O6 | 6.02 | 239.0561 | 0.12 | 177.0559, 133.0661, 149.0609 | 2 |
| MC_6 | Caffeoyl hexoside | C15H18O9 | 6.23 | 341.0877 | 1.24 | 179.0341, 135.0443 | 2 |
| MC_7 | Coumaroylquinic acid | C16H18O8 | 6.55 | 337.0931 | 0.53 | 163.0403, 191.0550 | 2 |
| MC_8 | Esculetin | C22H28O14 | 6.99 | 177.0194 | 0.33 | 133.0297, 105.0347 | 2 |
| MC_9 | Dihydroxybenzoic acid di-pentoside | C17H22O12 | 7.02 | 417.1036 | -0.57 | 285.0617, 241.0718, 152.0117, 108.0218 | 2 |
| MC_10 | Caffeoyl quinic hexoside | C9H6O4 | 7.18 | 515.1411 | 0.97 | 323.0777, 353.0882, 191.0553, 161.0246 | 2 |
| MC_11 | Caffeic acid | C9H8O4 | 7.3 | 179.035 | 0.04 | 135.0453 | 2 |
| MC_12 | Caffeoyl quinic acid | C16H18O9 | 7.47 | 353.0878 | -0.25 | 191.0553 | 2 |
| MC_13 | Caffeoyl quinic acid | C16H18O9 | 7.58 | 353.0877 | -0.31 | 191.0553, 173.0457, 135.0454 | 2 |
| MC_14 | Caffeic acid derivative | C17H18O10 | 8.39 | 381.0825 | -0.52 | 251.0562, 179.0341, 161.0234 | 3 |
| MC_15 | Feruloyl hexoside | C16H20O9 | 8.43 | 355.1034 | -0.18 | 193.0508, 149.0610 | 2 |
| MC_16 | Vanillic acid | C8H8O4 | 8.60 | 167.0350 | 0.05 | 152.0117, 108.0218 | 2 |
| MC_17 | Tuberonic acid | C18H28O9 | 8.91 | 387.1657 | -0.35 | 207.1028 | 2 |
| MC_18 | Coumaroylquinic acid | C16H18O8 | 9.55 | 337.0931 | 0.53 | 163.0403, 191.0550 | 2 |
| MC_19 | Hydroxyjasmonic acid | C12H18O4 | 9.63 | 225.1133 | 0.21 | 97.0259, 59.0139 | 2 |
| MC_20 | Verbasoside | C20H30O12 | 10.59 | 461.1667 | -0.48 | 191.0563, 149.0457, 131.0351 | 2 |
| MC_21 | Feruloylquinic acid | C17H20O9 | 11.52 | 367.1035 | -0.5 | 191.0563, 173.0457 | 2 |
| MC_22 | Apigenin-di C-hexoside | C17H30O15 | 12.16 | 593.1517 | 1.72 | 473.1095, 383.0772,353.0666 | 2 |
| MC_23 | Apigenin O-diglucuronide | C27H26O17 | 14.02 | 621.1094 | -0.26 | 351.0567, 269.0455 | 2 |
| MC_24 | Luteolin O-glucoside | C21H20O11 | 14.34 | 447.0931 | -0.82 | 285.0402, 151.0038,133.0293 | 2 |
| MC_25 | Patuletin O-hexoside | C22H22O13 | 14.38 | 493.0991 | 0.25 | 331.0459, 316.0220 | 2 |
| MC_26 | Dicaffeoylquinic acid | C25H24O12 | 14.62 | 515.1191 | -0.67 | 353.0878, 191.0553,135.0439 | 2 |
| MC_27 | Dicaffeoylquinic acid | C25H24O12 | 14.78 | 515.1191 | -0.67 | 353.0878, 191.0553,135.0439 | 2 |
| MC_28 | Methylquercetin O-uronide | C22H20O13 | 13.48 | 491.0837 | 0.46 | 315.0506, 300.0274 | 2 |
| MC_29 | Apigenin O-uronide | C21H18O11 | 14.51 | 445.0774 | -1.21 | 269.0455 | 2 |
| MC_30 | Apigenin O-hexoside | C21H20O10 | 14.85 | 431.0979 | -1.73 | 268.0378 | 2 |
| MC_31 | Caffeic acid derivative | C26H24O13 | 14.91 | 543.1141 | -0.83 | 381.0821, 161.0233 | 3 |
| MC_32 | Dicaffeoylquinic acid | C25H24O12 | 15.07 | 515.1191 | -0.67 | 353.0878, 191.0553,135.0439 | 2 |
| MC_33 | Luteolin O-caffeoylhexoside | C30H26O14 | 15.46 | 609.1261 | 1.64 | 285.0403, 161.0233 | 2 |
| MC_34 | Apigenin O-caffeoylhexoside | C30H26O13 | 15.86 | 593.1307 | 0.9 | 323.0771, 269.0455, 161.0234 | 2 |
| MC_35 | Luteolin | C150H10O6 | 15.95 | 285.0406 | 0.14 | 151.0038, 133.0296 | 2 |
| MC_36 | Methylquercetin | C16H12O7 | 16.00 | 315.0515 | 0.97 | 300.0274 | 2 |
| MC_37 | Caffeic acid derivative | C35H30O16 | 16.03 | 705.1466 | -1.25 | 543.1141, 381.0821, 161.0233 | 3 |
| MC_38 | Trihydroxyoctadecadienoic acid | C18H32O5 | 16.20 | 327.2174 | -0.88 | 229.1439, 211.133 | 2 |
| MC_39 | Apigenin | C15H10O5 | 16.27 | 269.0453 | -1.45 | 227.0352, 151.0026, 117.0347 | 2 |
| MC_40 | Hispidulin | C16H12O6 | 16.30 | 299.0559 | -0.84 | 284.0325 | 2 |
| MC_41 | Trihydroxyoctadecenoic acid | C18H34O5 | 16.32 | 329.2335 | 0.34 | 229.1439, 211.133 | 2 |
Table 2.
UHPLC-(-)HRMS data of compounds detected in ethanolic extract of Matricaria chamomilla.
| ID | Name | Molecular Formula |
RT [min] |
Precursor m/z [M-H]- |
NEG ppm | Confirming fragment | MSI level* |
| MC_1 | Caffeoyl quinic acid | C16H18O9 | 5.28 | 353.0886 | 2.04 | 191.0553, 179.0341, 135.0440 | 2 |
| MC_2 | Caffeoyl hexoside | C15H18O9 | 5.55 | 341.0877 | 1.24 | 179.0341, 161.0246, 135.0443 | 2 |
| MC_3 | Glucosyringic acid | C15H20O10 | 5.75 | 359.0982 | 1.16 | 197.0457 | 2 |
| MC_4 | Caffeoyl quinic hexoside | C22H28O14 | 5.76 | 515.1411 | 0.97 | 323.0777, 353.0882, 191.0553 | 2 |
| MC_5 | Caffeoyl hexoside | C15H18O9 | 6.23 | 341.0877 | 1.24 | 179.0341, 135.0443 | 2 |
| MC_6 | Esculetin | C22H28O14 | 6.99 | 177.0194 | 0.33 | 133.0297, 105.0347 | 2 |
| MC_7 | Caffeoyl quinic hexoside | C9H6O4 | 7.18 | 515.1411 | 0.97 | 323.0777, 353.0882, 191.0553, 161.0246 | 2 |
| MC_8 | Caffeic acid | C9H8O4 | 7.3 | 179.035 | 0.04 | 135.0453 | 2 |
| MC_9 | Caffeoyl quinic acid | C16H18O9 | 7.47 | 353.0878 | -0.25 | 191.0553 | 2 |
| MC_10 | Caffeoyl quinic acid | C16H18O9 | 7.58 | 353.0877 | -0.31 | 191.0553, 173.0457, 135.0454 | 2 |
| MC_11 | Caffeic acid derivative | C17H18O10 | 8.39 | 381.0825 | -0.52 | 251.0562, 179.0341, 161.0234 | 3 |
| MC_12 | Vanillic acid | C8H8O4 | 8.60 | 167.0350 | 0.05 | 152.0117, 108.0218 | 2 |
| MC_13 | Tuberonic acid | C18H28O9 | 8.91 | 387.1657 | -0.35 | 207.1028 | 2 |
| MC_14 | Coumaroylquinic acid | C16H18O8 | 9.55 | 337.0931 | 0.53 | 163.0403, 191.0550 | 2 |
| MC_15 | Verbasoside | C20H30O12 | 10.59 | 461.1667 | -0.48 | 191.0563, 149.0457, 131.0351 | 2 |
| MC_16 | Feruloylquinic acid | C17H20O9 | 11.52 | 367.1035 | -0.5 | 191.0563, 173.0457 | 2 |
| MC_17 | Apigenin-di C-hexoside | C17H30O15 | 12.16 | 593.1517 | 1.72 | 473.1095, 383.0772,353.0666 | 2 |
| MC_18 | Myricetin O-hexoside | C21H20O13 | 13.48 | 479.0829 | -0.83 | 317.0301 | 2 |
| MC_19 | Quercetin O-hexoside | C21H20 O12 | 14.25 | 463.0889 | 0.86 | 301.0353 | 2 |
| MC_20 | Luteolin O-glucoside | C21H20O11 | 14.34 | 447.0931 | -0.82 | 285.0402, 151.0038,133.0293 | 2 |
| MC_21 | Patuletin O-hexoside | C22H22O13 | 14.38 | 493.0991 | 0.25 | 331.0459, 316.0220 | 2 |
| MC_22 | Dicaffeoylquinic acid | C25H24O12 | 14.62 | 515.1191 | -0.67 | 353.0878, 191.0553,135.0439 | 2 |
| MC_23 | Dicaffeoylquinic acid | C25H24O12 | 14.78 | 515.1191 | -0.67 | 353.0878, 191.0553,135.0439 | 2 |
| MC_24 | Methylquercetin O-uronide | C22H20O13 | 13.48 | 491.0837 | 0.46 | 315.0506, 300.0274 | 2 |
| MC_25 | Apigenin O-uronide | C21H18O11 | 14.51 | 445.0774 | -1.21 | 269.0455 | 2 |
| MC_26 | Apigenin O-hexoside | C21H20O10 | 14.85 | 431.0979 | -1.73 | 268.0378 | 2 |
| MC_27 | Caffeic acid derivative | C26H24O13 | 14.91 | 543.1141 | -0.83 | 381.0821, 161.0233 | 3 |
| MC_28 | Dicaffeoylquinic acid | C25H24O12 | 15.07 | 515.1191 | -0.67 | 353.0878, 191.0553,135.0439 | 2 |
| MC_29 | Luteolin O-caffeoylhexoside | C30H26O14 | 15.46 | 609.1261 | 1.64 | 285.0403, 161.0233 | 2 |
| MC_30 | Apigenin O-caffeoylhexoside | C30H26O13 | 15.86 | 593.1307 | 0.9 | 323.0771, 269.0455, 161.0234 | 2 |
| MC_31 | Luteolin | C150H10O6 | 15.95 | 285.0406 | 0.14 | 151.0038, 133.0296 | 2 |
| MC_32 | Methylquercetin | C16H12O7 | 16.00 | 315.0515 | 0.97 | 300.0274 | 2 |
| MC_33 | Caffeic acid derivative | C35H30O16 | 16.03 | 705.1466 | -1.25 | 543.1141, 381.0821, 161.0233 | 3 |
| MC_34 | Trihydroxyoctadecadienoic acid | C18H32O5 | 16.20 | 327.2174 | -0.88 | 229.1439, 211.133 | 2 |
| MC_35 | Apigenin | C15H10O5 | 16.27 | 269.0453 | -1.45 | 227.0352, 151.0026, 117.0347 | 2 |
| MC_36 | Hispidulin | C16H12O6 | 16.30 | 299.0559 | -0.84 | 284.0325 | 2 |
| MC_37 | Trihydroxyoctadecenoic acid | C18H34O5 | 16.32 | 329.2335 | 0.34 | 229.1439, 211.133 | 2 |
Table 3.
Total Phenolic and Flavonoid Contents, Antioxidant, and Antidiabetic Activity of Matricaria chamomilla Infusion (Mc-I) and Ethanolic Extract (Mc-EtOH).
Table 3.
Total Phenolic and Flavonoid Contents, Antioxidant, and Antidiabetic Activity of Matricaria chamomilla Infusion (Mc-I) and Ethanolic Extract (Mc-EtOH).
| Extracts/Standards | Total Phenolic Content (µg GAE/mg) | Total Flavonoid Content (µg QE/mg) | Antioxidant Activity (IC50 µg/mL) | Antidiabetic Activity (IC50 µg/mL) |
| DPPH Assay | ABTS Assay | CUPAC Assay | Acarbose (A50 µg/mL) | |
| Mc-EtOH | 110.32 ± 0.62 | 89.79 ± 0.58 | 13.15 ± 0.95 | 81.04 ± 0.42 |
| Mc- | 82.82 ± 0.41 | 47.91 ± 0.29 | 24.46 ± 0.35 | 93.91 ± 0.94 |
| BHT | NT | NT | 12.99 ± 0.41 | 1.29 ± 0.30 |
| BHA | NT | NT | 6.14 ± 0.41 | 1.81 ± 0.10 |
| Acarbose | NT | NT | NT | NT |
NT = Not tested: The values represent means ± standard deviations from triplicate measurements.
Table 4.
Nutritional composition of control bread and bread enriched with two different Matricaria chamomilla extracts: BI-Mc 30% (infusion-based extract) and BP-Mc 30% (ethanolic extract).
Table 4.
Nutritional composition of control bread and bread enriched with two different Matricaria chamomilla extracts: BI-Mc 30% (infusion-based extract) and BP-Mc 30% (ethanolic extract).
| Bread Traits (%) |
Control (Mean ± SD) |
Bread (BI-Mc 30%) (Mean ± SD) |
Bread (BP-Mc 30%) (Mean ± SD) | p-value | Significance |
| Moisture | 40.67 ± 0.58a | 12.55 ± 0.69c | 30.74 ± 0.81b | 0.0001 | *** |
| Proteins | 12.07 ± 0.92b | 14.78 ± 0.66a | 12.06 ± 0.17b | 0.003 | ** |
| Lipids | 1.80 ± 0.01a | 0.80 ± 0.10c | 1.20 ± 0.20b | 0.0002 | *** |
| Carbohydrates | 38.44 ± 0.57b | 59.46 ± 0.61a | 39.23 ± 0.80b | 0.0001 | *** |
| Whole Fiber | 2.70 ± 0.50b | 3.93 ± 0.53b | 10.6 ± 0.54a | 0.0001 | *** |
| Ash | 4.33 ± 0.58c | 8.48 ± 0.75a | 6.17 ± 0.76b | 0.001 | ** |
Values are presented as mean ± standard deviation (SD). Different letters within the same row indicate significant differences (p < 0.05). • p-value: Values below 0.05 indicate statistical significance. • Significance: *** p < 0.001, ** p < 0.01, * p < 0.05.
Table 5.
Bread Traits and Sensory Evaluation of Chamomile-Enriched Breads.
| Bread Traits | Control | BI-MC 30 % | BP-MC 30% | p-value | Significance |
| Specific Volume (cm³/g) | 3.36 ± 0.001 | 2.19 ± 0.07 | 2.26 ± 0.20 | 0.004 | ** |
| Weight Loss (%) | 31.30 ± 0.95 | 30.04 ± 0.84 | 32.69 ± 1.32 | 0.18 | ns |
| pH-Value | 5.74 ± 0.021 | 5.30 ± 0.02 | 5.43 ± 0.02 | 0.01 | * |
| Crust Color (L)* | 61.15 ± 2.47 | 44.9 ± 4.67 | 11.55 ± 0.35 | 0.001 | ** |
| Crust Color (a)* | -0.75 ± 2.19 | 4 ± 0.99 | 5.85 ± 0.45 | 0.04 | * |
| Crust Color (b)* | 26.9 ± 3.68 | 30.65 ± 0.92 | 7.25 ± 0.55 | 0.003 | ** |
| Crumb Color (L)* | 31.95 ± 0.49 | 37.55 ± 5.02 | 17.7 ± 2.3 | 0.02 | * |
| Crumb Color (a)* | 4 ± 0.28 | -0.65 ± 2.76 | 7.3 ± 0.4 | 0.03 | * |
| Crumb Color (b)* | 24.1 ± 0.99 | 27.05 ± 0.92 | 16.8 ± 0.5 | 0.002 | ** |
| Crumb Structure (Cells/mm²) | 153 ± 18.38 | 220 ± 41.01 | 104 ± 7.07 | 0.04 | * |
| Crumb Structure (Cell size) | 500.96 ± 70.71 | 485.86 ± 152.28 | 1162.06 ± 243.03 | 0.04 | * |
| Crispness | 5.4 ± 1.43 | 2.8 ± 1.62 | 4.3 ± 1.42 | 0.002 | ** |
| Hardness | 2.9 ± 0.57 | 4.7 ± 2.16 | 3.1 ± 1.73 | 0.03 | * |
| Overall Acceptability | 3 ± 0.82 | 3 ± 0.67 | 3.2 ± 0.79 | 0.79 | ns |
Data are presented as mean ± standard deviation (SD). Statistical significance was determined using ANOVA followed by Tukey’s post-hoc test. Significant differences between bread samples are indicated by different superscript letters (a, b, c) within the same row (p < 0.05).
Table 6.
Total Phenolic and Flavonoid Contents, and Antioxidant Activity of Chamo mile-Enriched Bread.
Table 6.
Total Phenolic and Flavonoid Contents, and Antioxidant Activity of Chamo mile-Enriched Bread.
| Bread Samples | Phenolic Contents (μg GAE/mg)a | Flavonoid Contents (μg QE/mg) b |
DPPH Assayc (IC50, µg/mL) |
| Control | 13.41 ± 0.28 | 21.46 ± 0.44 | 6.1 ± 0.21 |
| BI-MC 3% | 33.12 ± 0.37 | 31.88 ± 0.41 | 5.71 ± 0.18 |
| BI-MC 10% | 69.29 ± 0.61 | 30.18 ± 0.39 | 1.86 ± 0.17 |
| BI-MC 30% | 68.41 ± 0.75 | 60.47 ± 0.31 | 0.86 ± 0.13 |
| BP-MC 3% | 29.59 ± 0.53 | 30.63 ± 0.22 | 63.94 ± 0.12 |
| BP-MC 10% | 69.29 ± 0.62 | 46.46 ± 0.31 | 16.04 ± 0.21 |
| BP-MC 30% | 61.48 ± 0.76 | 41.67 ± 0.22 | 4.05 ± 0.14 |
The values represent means ± standard deviations from triplicate measurements.; aGAE: Gallic Acid Equivalents, bQE: Quercetin Equivalent; cVitamin C was used as a reference in the DPPH assay.
Disclaimer/Publisher’s Note: The statements, opinions and data contained in all publications are solely those of the individual author(s) and contributor(s) and not of MDPI and/or the editor(s). MDPI and/or the editor(s) disclaim responsibility for any injury to people or property resulting from any ideas, methods, instructions or products referred to in the content. |
© 2025 by the authors. Licensee MDPI, Basel, Switzerland. This article is an open access article distributed under the terms and conditions of the Creative Commons Attribution (CC BY) license (http://creativecommons.org/licenses/by/4.0/).
Copyright: This open access article is published under a Creative Commons CC BY 4.0 license, which permit the free download, distribution, and reuse, provided that the author and preprint are cited in any reuse.


