
Submitted:
25 July 2025
Posted:
28 July 2025
You are already at the latest version
Abstract
In response to the growing demand for organic novel bakery products, this study primarily assessed the effect of incorporating fresh germinated seeds into sourdough bread on nutritional, technological, and sensory properties. The study envisaged assessment of type of water (water vs. “grape water”) on traditional sourdough and selection of seeds, based on germination percentage. Although numbers of yeasts and lactic acid bacteria differed between the two types of water, boosted sourdough (i.e., produced with “grape water”) showed similar performances as control sourdough (i.e., produced with water). Germinated seeds were singly used at 5% as fresh paste in bread containing boosted sourdough. Lentil bread (GL), wheat bread (GW), and control bread (without seeds) were compared. Germination did not affect specific volume, although GL and GW showed a higher percentage of gas cells area than the control. In addition, GL and GW received higher scores for taste and softness, respectively. GW and control bread could be labelled as “rich in fiber”, whereas GL as “source of fiber”. Additionally, GL contained more proteins and less lipids than the two other bread theses. Ongoing research is scaling-up the process to launch organic bread with higher nutritional value and peculiar sensory traits in the market.
Keywords:
sourdough
; organic bread
; germinated seeds
1. Introduction
Bread consumption dates back thousands of years, making it one of the world’s oldest and most widespread staple foods [1]. It provides substantial energy in the form of carbohydrates as well as dietary fiber, proteins, B vitamins and minerals. People around the globe consume on average 70 kg of bread per year per capita [2]. Leavening is a very frequently applied process during bread-making and two main biological agents are added to carry out this process: baker’s yeast and sourdough. Baker’s yeast, consisting of a biomass of Saccharomyces cerevisiae, is a commercial starter that, added to dough, during 1–2 h converts starch to CO₂ (responsible for dough leavening, provided that a good structural network has been formed) and other metabolites [3]. The obtainment of a mild-flavored loaf in a short time suits industrial baking.
Sourdough typically is a natural starter, although different commercial preparations are available. Generally, sourdough harbor yeasts and lactic acid bacteria (LAB) populating at high cell densities a fermented dough based on water and flour from grain of different cereal plants (Poaceae), mostly wheat and rye [4]. The mixed microbiota produces mainly organic acids and other metabolites which are responsible for an aromatic profile that is more complex than that of bread leavened just with baker’s yeast. Although currently most bread-making practices rely on the use of baker’s yeast, because of its easy management, short leavening time, and high reproducibility of quality, sourdough remains valued for its unique flavor and potential nutritional effects. Moreover, sourdough contributes to reinforced dough structure and extended shelf life [5,6]. In Europe, at least 30% of bread production incorporates sourdough [7].
Traditional sourdough (also known as type I sourdough) is usually obtained upon an initial “spontaneous” fermentation of flour and water, relying on LAB and yeasts contaminating flour and environment of production. After this first fermentation, typically lasting up to 48 h, a back-slopping process is applied: a portion of the fermented dough is used to inoculate a fresh batch of flour and water (“refreshment”), which undergoes a second fermentation. Repeating daily these refreshment-fermentation steps, keeping the conditions of fermentation as constant as possible [8], the microbial community evolves, mainly due to dough acidification (mainly attributed to lactic acid fermentation), to give a relatively stable ecosystem, dominated by LAB and yeasts, that is able to acidify and leaven bread dough [9]. During production of traditional sourdough, bakers often supplement early fermentation steps with additional ingredients (e.g., fresh or dried fruits, milk, whey, malt) to enrich the ecosystem with pro-technological microorganisms (e.g., yeasts) and nutrients that are readily available to LAB and yeasts [10]. In particular, raisins (dried grapes) have long been used, because they harbor yeasts that could contribute to vigorous fermentation. Some studies suggested that grape water, namely water that has been in contact with water for some hours, can serve as a microbial booster during early sourdough fermentation [11]. Minervini et al. [12] found increased LAB populations in sourdoughs fermented with grape must. Additionally, Gordún et al. [13] identified in grape-based sourdough multiple LAB species, such as Lactiplantibacillus plantarum, Levilactobacillus brevis, Latilactobacillus sakei, and Weissella cibaria.
Organic sourdoughs are based on raw materials originating from organic farming, following EU regulations for organic food processing. Research evidence has indicated that wheat varieties originating from organic farming impart positive effects on the chemical, nutritional, and technological characteristics of flours. This influence extends to the overall quality of flour-based products, including sourdough bread [14,15]. Demand for organic food is increasing due to rising awareness of people about sustainability, environment, and human health [16]. Health-centric attributes are the second most significant factor, after taste, considered by consumers when choosing plant-based food items (https://www.mintel.com/press-centre/taste-is-the-top-reason-us-consumers-eat-plant-based-proteins/).
In the last decade, the incorporation of germinated/sprouted grains, also known as germinated seeds, into cereal-based food products has garnered attention due to their potential to enhance minerals and vitamins bioavailability, while reducing anti-nutritional factors [17]. Numerous studies have shown that the incorporation of flour from germinated seeds (sorghum, quinoa, chickpea, wheat) in sourdough bread enhanced its nutritional content, flavor, and texture of [18,19,20,21]. Recently, Bresciani et al. [22] compared germinated chickpea flour and grits (coarsely ground hulled seeds), to evaluate their effect in bread containing 25% of these additional ingredients. They found that, compared to the use of flour from germinated chickpeas, use of grits led to increase of dough development time and stability; at the same time, bread enriched with grits had higher specific volume and softer crumb than bread enriched with chickpeas flour [22]. Incorporation of germinated seeds (not milled to flour) could emerge as a viable strategy for improving the nutritional and functional attributes of sourdough bread. To our knowledge, no study so far has investigated the effects of incorporating germinated seeds on sourdough bread quality.
This study aimed to: (i) scout the effect of using water that had been in contact with raisins in the production of traditional sourdough; (ii) select seeds to be used in manufacturing, at laboratory scale, sourdough bread; and (iii) assess the effect of incorporating fresh germinated seeds into recipe of sourdough bread on nutritional, technological, and sensory properties. All ingredients used in this study were from organic farming.
2. Materials and Methods
2.1. Materials
Seeds from lentils (Lens culinaris ssp. culinaris), einkorn wheat (Triticum monococcum), barley (Hordeum vulgare), soft wheat (cultivar Gentil rosso) were provided by Perniola Alimenti (Rutigliano, Bari, Italy). Soft wheat (Triticum aestivum L., cultivar Maiorca) wholemeal flour was produced by Perniola Alimenti. Dried Corinthian raisins and commercial baker’s yeast were purchased from local market. All raw materials originated from organic farming. Seeds and dried grapes were vacuum-packaged and stored at 25 °C.
2.2. Sourdough Preparation
Two kinds of type-I (traditional) sourdough (classified according to De Vuyst et al. [23] were prepared starting from soft wheat flour (150 g): (i) control (CSD), produced by hand-kneading flour with tap water (150 ml); (ii) “boosted” (BSD), produced by hand-kneading flour with 150 ml of “grape water”. Dough Yield (DY) was 200. Grape water had been previously obtained upon soaking 50 g of dried grapes in 250 ml of tap water and discarding grapes after incubation (at room temperature, 48 h). Both doughs were incubated at 25 °C, for 24 h. Subsequently, they were back-slopped, inoculating 50 g of the spontaneously fermented dough into a fresh dough, composed of 50 g of flour and 50 ml of tap water, (inoculum ratio: about 33%) and then incubated (25 °C, 24 h) (Figure 1).
This back-slopping-and-fermentation step was repeated for at least nine days. BSD corresponded to the protocol usually adopted by Perniola Alimenti. pH of doughs was measured every day (except for the first spontaneous fermentation) after incubation by direct insertion of a Foodtrode electrode (Denver Instrument, USA). Acidification rate (AR) was calculated using the following formula: ΔpH/ΔT, wherein ΔpH represents the difference between the pH value measured after one day and the pH value measured after 10 days of fermentation (pH1- pH10), and ΔT represents the different times of fermentation (T10-T1). Microbiological analyses were performed on fermented doughs, as detailed below, after one, three, five, seven and ten days.
2.3. Seeds Germination
Germination protocol was adapted from that described by Yang et al. [24], with modifications tailored to optimize sprouting. The seeds were first thoroughly washed under tap water at approximately 15 °C for 20 to 30 min to remove impurities. Afterwards, seeds were inserted in a jar with plenty of tap water and soaked separately for 2 h at 25 °C. After soaking, excess water was drained, and seeds were collected and put on tissue paper. Seeds were incubated in dark, humid conditions at 25 °C. They were regularly sprinkled with tap water at 12-h intervals to maintain moisture. Germination was terminated when primary roots reached ~5 mm to limit exposure to warm, humid conditions that can significantly increase pathogenic bacteria and to align with EFSA guidelines recommending collecting sprouts before the development of leaves [25].
The percentage of germination (% G) was calculated using the Equation: % G = germinated seeds ∙ 100/total seeds.
2.4. Bread Making
Sourdough bread was made using the boosted sourdough (BSD) and germinated wheat and lentils, according to the recipe provided by Perniola Alimenti with some modifications. Before bread making, germinated seeds were transferred into a meat blender machine (Trita Express) to form a homogenous paste. The blending process commenced by starting at a low speed and gradually increasing speed. Seeds paste was used fresh in bread making. To prepare one loaf of 500 g, 246.7 g of soft wheat flour (49.34%), 5.05 g of sodium chloride (1.01%), and 25 g (5%) of germinated (lentils or wheat) paste were mixed in a clean and sterilized bowl of a planetary mixer (Electrolux Orbital stand mixer, model EKM4000). Subsequently, 74.1 g (14.82%) of BSD, 0.95 g (0.19%) of baker's yeast, and 148.2 ml of water were added to the bowl, and the mixture was kneaded (5 min) to create dough. In parallel, a control sourdough bread was prepared, using 271.7 g of flour and the other ingredients listed above, except for germinated seeds paste, which was not added. Each dough was then divided into four loaves and carefully placed onto baking trays lined with parchment paper. Following this, the trays were allowed to undergo a 2-hour fermentation at 38 °C. The fermented loaves were baked in a preheated (to 220°C) oven for 20 min. Upon completion of the baking process, the bread samples were taken out of the oven and permitted them to cool for a period of 3 h. In total 12 loaves were prepared corresponding to four loaves per each type of bread (control, lentils and wheat).
2.5. Microbiological Analyses
Viable populations of lactic acid bacteria (LAB) and yeasts were estimated on tap water, grape water and dough/sourdough, using plate count with selective culture media. Before inoculating plates, 10 grams of dough/sourdough samples were homogenized with 90 mL of sterile saline solution (0.9% NaCl) using a stomacher for 3 minutes. Homogenized samples, as well as tap water and grape water, were serially diluted, and aliquots (1 ml) were pour-plated in Sabouraud Dextrose Agar (SDA), supplemented with chloramphenicol (0.1 g/l) for enumeration of yeasts and molds, M17 agar supplemented with glucose (5 g/l w/v), for coccus-shaped LAB, and modified de Man, Rogosa, and Sharpe (mMRS) agar, supplemented with maltose (5 g/l), fresh yeast extract (50 ml/l), adjusted to pH 5.6, for rod-shaped LAB. M17 and mMRS had been also supplemented with 0.1 g/l cycloheximide after sterilization. Colonies of presumptive yeasts and LAB were counted after incubation at 30 °C for 48 h [26].
In addition, yeast extract agar (YE agar: yeast extract 3 g/L, tryptone 6 g/L, agar 15 g/L, pH 7.2) was employed to enumerate psycrophilic and mesophilic heterotrophic microorganisms in both tap water and grape water, after incubation at 22 °C for 72 h (psychrophilic) and at 37 °C for 48 h (mesophilic) [26].
Germinated seeds and bread underwent microbiological analyses, after homogenization and serial dilution, as described for doughs/sourdough samples. Total aerobic mesophilic microorganisms were enumerated on Plate Count Agar (PCA), incubated at 30 °C for 48 h. Total coliforms were estimated using Violet Red Bile Glucose (VRBG) agar, incubated at 37 °C for 24 h [19].
2.6. Descriptive Sensorial Analysis of Bread
A panel test was conducted at the Department of Plant, Soil, and Food Sciences at the University of Bari Aldo Moro to qualitatively describe sensory traits of bread samples. The panel consisted of 10 assessors (6 females and 4 males), comprising professors, PhD students, and researchers, with age spanning from 27 to 47 years. The panelists underwent training, which encompassed familiarization with sourdough bread enriched with germinated seeds, aimed at establishing a standardized sensory vocabulary. A total of 22 sensory attributes, covering aspects such as appearance (crumb and crust color, crust thickness, crust appearance, and crumb structure), odor (yeasty, fermentation, toasted, vegetables, nutty, off-odor), texture (elasticity, dryness, hardness, softness, graininess, compactness, and crust crunchiness), and taste (bitter, salty, legume-like, acidic and overall taste) were considered [27]. Furthermore, panelists were encouraged to suggest novel descriptive terms to augment the existing attributes. During the assessment, the bread samples were sliced to 1.5 cm thickness, and they were served at a temperature of 22 °C under standard lighting conditions. To mitigate any potential bias, samples were coded with unique 3-digit identifiers and presented in a randomized sequence [28]. Each assessor had three different samples and rated the sensory attributes on a non-structured 15 cm line scale using sheets describing the vocabulary for each attribute, with scores ranging from 0 (not detected) to 15 (extremely strong), adhering to ISO 13299:2010 standard for sensory analysis.
2.7. Specific Volume, Image and Color Analysis of Bread Samples
After 24 h of storage, specific volume of bread samples was measured through the rapeseed displacement method AACC 10-05.01 [29]. In addition, bread crumb was examined utilizing image analysis technology. Pictures of the sliced bread were scanned (at 300 dpi) through an Image Scanner (Amersham Pharmacia Biotech, Uppsala, Sweden). Full-scale images were gray-scaled, and two sub-images (1,001 1,393 pixels, field of view) were analyzed using the UTHSCSA ImageTool application (version 2.0, University of Texas Health Science Centre, San Antonio, Texas, United States). Gas cells and non-cells were distinguished using a threshold approach, using a threshold value of 130 [30]. Gas cells area in bread crumb was calculated by the software as percentage ratio between area filled by gas cells (black pixels) and the total area. A Minolta CR-10 camera was used to assess color in three separate locations on the bread crust and crumb [31]. It was done using the L, a, and b color space analysis approach, where L stands for lightness (white to black) and a (red-green), and b (yellow-blue), for chromaticity coordinates.
2.8. Nutritional Analysis of Bread
Nutritional analysis of breads included determination of proteins (total nitrogen ∙ 6.25), lipids, ashes, and water content, according to the AOAC methods 978.04, 2003.06, 930.05, and 930.04, respectively. Total available carbohydrates were calculated as the difference [100 – (proteins + ashes + lipids + water)]. Total dietary fibers were determined using Total Dietary Fiber Kit (Megazyme-Irland), following the AACC 32-05.01 method. Energy value was calculated following the method described by the United States Department of Agriculture method (Institute of Medicine of the National Academies, 2002).
2.9. Statistical Analyses
All experiments were conducted in triplicate, and results are expressed as mean ± standard deviation. Statistical analyses were performed using SPSS version 28. Data were subjected to one-way analysis of variance (ANOVA) to assess significant differences among samples. When ANOVA indicated significant effects (p <0.05), means were compared using Tukey’s Honestly Significant Difference (HSD) post hoc test.
3. Results
3.1. Microbial Cell Densities Differed Between Tap Water and Grape Water
The microbiological analysis revealed that grape water exhibited significantly higher (P <0.05) counts of all the targeted microbial groups, except for heterotrophic mesophilic microorganisms. The latter were found at higher (P <0.05) cell density in tap water (Figure 2). Grape water was dominated (at an order of magnitude of 6 log CFU/ml) by heterotrophic psychrophilic microorganisms, presumptive yeasts and presumptive coccus-shaped lactic acid bacteria (LAB).
3.2. Boosted Sourdough Gave Similar Performances as Control Sourdough
The pH of both control (CSD) and boosted (BSD) sourdoughs steadily declined throughout the 10-day fermentation period (Figure 3), with both falling below 4.5 at day 3. pH reached about 3.8 at day 7 in both sourdough samples and then it remained constant. The acidification rate was slightly higher in the CSD (0.24 pH units/day) than in the boosted sourdough (0.22 pH units/day).
From the beginning of fermentation until day 3, BSD exhibited significantly (P < 0.05) higher counts of presumptive coccus-shaped and rod-shaped LAB than the control (Figure 4). After the first fermentation, presumptive yeasts were detected at very low cell density in both sourdough samples, with no significant (P > 0.05) between BSD and CSD. At day 3, CSD harbored higher (P < 0.05) cell density of yeast than BSD, although in both sourdough samples yeasts were in the order of magnitude of 2 log cfu/g. Yeasts increased in both sourdough samples after 7 and 10 days to 5 and 6 log cfu/g, respectively, with CSD characterized by higher (P < 0.05) cell density than BSD (Figure 4). Presumptive LAB increased until day 7 up to 9 log cfu/g; afterwards they did not increase. Both at day 7 and 10, no significant (P > 0.05) difference in cell densities of LAB was found between BSD and CSD.
3.3. Germinated Lentil and Soft Wheat Seeds Selected as Bread Additional Ingredients
Germination tests showed that, after 24 h at 25 °C, lentils and soft wheat exhibited the highest germination percentages (Figure 5, Figure S1). Einkorn wheat and barley, showing germination percentages lower than 20% were discarded from further experiments. Microbiological analyses showed that germinated lentils and soft wheat harbored total coliforms at an order of magnitude of 8 log cfu/g, with no significant difference between them (data not shown). Total mesophilic aerobic bacteria were found at higher (P < 0.05) cell density in germinated lentils (8.2 log cfu/g) than in germinated soft wheat (7.8 log cfu/g).
3.4. Sourdough Bread Was Free from Total Coliforms
Preliminary results of specific volume (data not shown) suggested to use, besides sourdough, baker’s yeast as main leavening agent for bread making. Three types of bread were manufactured using BSD: (i) with paste from germinated lentils (GL); (ii) with paste from germinated soft wheat (GW); (iii) control. Microbiological analyses performed on bread with paste from either germinated lentils or wheat showed that baking reduced total aerobic mesophilic microorganisms and total coliforms to undetectable levels (<1.0 log cfu/g).
3.5. Bread Theses Differed in Terms of Specific Sensory Attributes
The descriptive sensory analysis showed that some attributes received very low scores, with no significant difference between the three types of bread. For instance, no off-odors were reported in any bread and this attribute, as well as legume-like taste were not graphically shown. Control bread showed the highest values for elasticity (3.4±0.5), crust crunchiness (11.2±0.6), and compactness (11.7±0.4). GL received the highest average scores for crumb color (11.5±0.7), crust color (10.4±0.9), and overall taste (8.6±0.8), while also exhibiting higher bitterness (4.5±0.3) and legume-like flavor (3.9±0.2) (Figure 6). GW was characterized by the highest softness score (5.6±0.5) and the lowest bitterness score (3.5±0.2).
3.6. Image Analysis and Color Indexes Differed Among the Bread Theses
The use of germinated lentils and wheat did not affect the specific volume of sourdough bread (Table 1 and Figure 7). The highest gas cells area was found for GL, whereas control bread was characterized by the lowest values of this crumb parameter. The color analysis of the crumb of the lentils bread was less bright (P≤0.05) than control bread, but not significantly different from GW bread. The lowest value for L index was found for crust of GL bread. In addition, this bread showed the highest a value (Table 1).
3.7. Nutritional Analysis of Bread
GL bread was characterized by the lowest and highest values of lipids and proteins, respectively (Table 2). In addition, this bread showed the lowest concentration of carbohydrates. GW showed lipids and proteins content that were not significantly different (P > 0.05) from control. GW and control showed the highest concentration in total carbohydrates. Total dietary fibers, as well as water content and energy values were not significantly (P>0.05) different among the three types of bread (Table 2).
4. Discussion
In collaboration with a small-medium food enterprise, we ideated a novel organic sourdough bread, enriched with fresh germinated seeds in form of paste, aiming to enlarge the array of bread items that could attract consumers for their higher nutritional value and peculiar sensory traits. Two important steps of selection focused on the type of sourdough to be used (produced using either tap water or “grape water”) and on the type of seeds. We found that “grape water”, i.e. water that had been previously in contact with raisins, was enriched in psychrophilic heterotrophic microorganisms. Values of yeast cell density in grape water suggest that those psychrophilic microorganisms could be represented by yeasts, originating from raisins and transferred into water. In accordance with this finding, grapes putatively transferred quite high cell density of yeasts to dough [13]. When analyzing tap water used for producing sourdough, we found that cell density of mesophilic heterotrophic microorganisms fell in the range (0.8 – 3.5 log cfu/ml) previously reported [26]. On the contrary, psychrophilic heterotrophic microorganisms in the tap water was lower than the range previously reported [26], although in that study three out of ten water samples collected in different Italian regions showed counts of psychrophilic heterotrophic microorganisms below the detection level. While we expected that the use of grape water could have boosted sourdough during its early steps of production, we did not find any difference in yeast cell density between boosted sourdough (BSD, i.e., with use of grape water in the first fermentation) and control sourdough (CSD). On the contrary, BSD was characterized by higher cell density of LAB in the early production steps, compared to CSD. This result could be explained hypothesizing that in the sourdough samples subjected to study, yeasts transferred from raisins to water could be less competitive than LAB. It is well known that competitiveness of microorganisms in sourdough is an important driver during its preparation [4]. Furthermore, we speculate that the increased LAB cell density in BSD might result from the increased content of fermentable carbohydrates derived from raisins during maceration in water, which might have promoted LAB growth over yeasts. Oshiro et al. [32] also hypothesized that different affinity to different carbohydrates shown by strains of LAB and Saccharomyces cerevisiae could be one of the basis for competition between LAB and yeasts in early steps of sourdough preparation. After 10 fermentation steps, we found that use of grape water instead of tap water did not affect LAB cell density and their main metabolic activity, resulting in dough acidification. On the contrary, we found slightly (although significantly different) higher yeast cell density in CSD than in BSD, which could be due to different composition (in terms of species and strains) of microbial community, driven by using two different water types in the first fermentation. Both sourdough theses showed values of pH, cell densities of LAB and yeasts, falling in the typical range for traditional sourdough [4]. Further experiments focused just on the use of BSD for bread-making, because this kind of sourdough had been produced according to the protocol commonly used by the food enterprise that participated in this study.
Use of germinated seeds in food offers enhanced nutrition, such as increased bioavailability of vitamins and better digestibility [33,34]. In our study we discarded barley and einkorn wheat as potential ingredients for bread making, because they showed very low germination percentages, possibly due to seeds that had been stored for too long time. Germinated lentils and soft wheat grains harbored high microbial loads, in accordance with previous studies [35,36,37]. Notwithstanding the high cell density of presumptive Enterobacteriaceae, incorporation of paste from germinated lentils/wheat as ingredient in bread dough did not raise any concern from the safety point of view. Indeed, after baking, Enterobacteriaceae were not detected, possibly because of the high temperature reached by bread during baking, in agreement with previous studies [38,39]. Seeds subjected to germination for being used as ready-to-eat food are usually contaminated, especially by Salmonella spp. and Shiga-toxin producing Escherichia coli, that may survive for long periods during seed storage. In addition, these bacterial pathogens may as well increase their number during germination [25]. In this study, we showed bread making as a feasible option to eat germinated seeds, while guaranteeing that food is free from microbiological hazards.
The three sourdough bread theses (germinated lentils GL, germinated wheat GW, control without germinated seeds) considered in this study were subjected to panel test, since the food enterprise collaborating with researchers was interested in understanding the potential of bread with germinated seeds in view of scaling-up the process. Indeed, previous studies reported that use of flour from germinated seeds was able to alter the sensory attributes of bread. Atudorei et al. [40] found that adding 5–7.5% germinated lentil flour improved bread porosity, crumb color, and sensory appeal. Badawy et al. [41] reported that 6–9% germinated wheat flour enhanced aroma and crumb color. In the current study, we found that, compared to control, sourdough bread incorporating 5% of germinated lentils/wheat grains received higher score for overall taste and softness, respectively. In addition, panelists perceived crumb and especially crust of sourdough bread with germinated lentils more colored than the two other bread theses. This result was partly reflected by the color analysis, which showed that bread with germinated lentils had lower values of L-index (brightness) and higher values of a-index (meaning color of crust approaching red).
Use of germinated lentils/wheat grains did not affect specific volume of bread. Yet, image analysis showed that sourdough bread with paste from germinated wheat and, especially, lentils, was characterized by a higher percentage of gas cells area than the control. These results are in agreement with a previous study that reported that the addition of 5% flour from 48-72 h germinated soft wheat did not affect the specific volume, although the resulting bread appeared with different size and distribution of gas cells, with respect to the control bread [42].
From a nutritional perspective, control bread and GW could be labelled as “rich in fiber” (at least 6% of fiber), whereas GL could be labelled as “source of fiber” (at least 3% of fiber) [43]. However, use of germinated lentils as additional ingredients in sourdough bread resulted in providing more proteins and less lipids than the two other bread theses. The findings are consistent with those reported by Hernández-Aguilar et al. [44], who developed wheat breads with 0%, 5%, and 10% germinated lentil flour. They observed that incorporating 5% lentil flour increased the protein content to approximately 11.8% compared to 10.5% in the control, while the lipid content decreased from 12.16% to 10.3%. Another study also found that addition of 5–10% roasted-sprouted lentil flour to gluten-free bread (corn/rice based) had 77–90% higher protein than the control bread [45].
5. Conclusions
This study showed that addition of paste from germinated lentils into organic sourdough bread enhanced nutritional quality and overall taste, while maintaining desirable technological characteristics. The protocol (sourdough production, seeds germination and blending, bread-making) could be easily adapted to other germinated seeds, and scaled-up, to launch in the market organic sourdough bread items that could attract consumers for their higher nutritional value and peculiar sensory traits.
Supplementary Materials
The following supporting information can be downloaded at the website of this paper posted on Preprints.org, Figure S1: Lentil (A), soft wheat (B), einkorn wheat (C), and barley (D) seeds after germination (24 h at 25 °C).
Author Contributions
Conceptualization, A.A. and I.C.; methodology, F.M.; investigation, A.A. and Y.M.; resources, F.M.; writing—original draft preparation, A.A. and Y.M.; writing—review and editing, F.M. and I.C.. All authors have read and agreed to the published version of the manuscript.
Funding
This research received no external funding.
Data Availability Statement
Data is contained within this article and related supplementary materials.
Acknowledgments
The Authors acknowledge Perniola Alimenti (Rutigliano, BA, Italy) for collaborating during the ideation step and implementation of research.
Conflicts of Interest
The authors declare no conflicts of interest.
Abbreviations
The following abbreviations are used in this manuscript:
| GL | Bread made with addition of germinated lentils paste |
| GW | Bread made with addition of germinated wheat paste |
| LAB | Lactic acid bacteria |
| CSD | Control sourdough |
| BSD | Boosted sourdough |
| DY | Dough yield |
| G% | Germination percentage |
| CFU | Colony forming unit |
References
- Ribet, L.; Kassis, A.; Jacquier, E.; Monnet, C.; Durand-Dubief, M.; Bosco, N. The nutritional contribution and relationship with health of bread consumption: a narrative review. Crit. Rev. Food Sci. Nutr. 2024, 1–28. [CrossRef]
- De Boni, A.; Pasqualone, A.; Roma, R.; Acciani, C. Traditions, health and environment as bread purchase drivers: A choice experiment on high-quality artisanal Italian bread. J. Clean. Prod. 2019, 221, 249–260. [CrossRef]
- Carocho, M.; Morales, P.; Ciudad-Mulero, M.; Fernández-Ruiz, V.; Ferreira, E.; Heleno, S.; Rodrigues, P.; Barros, L.; Ferreira, I.C.F.R. Comparison of different bread types: Chemical and physical parameters. Food Chem. 2020, 310, 125954. [CrossRef]
- De Vuyst, L.; Comasio, A.; Van Kerrebroeck, S. Sourdough production: fermentation strategies, microbial ecology, and use of non-flour ingredients. Crit. Rev. Food Sci. Nutr. 2023, 63, 2447–2479. [CrossRef]
- Poutanen, K.; Flander, L.; Katina, K. Sourdough and cereal fermentation in a nutritional perspective. Food Microbiol. 2009, 26, 693–699. [CrossRef]
- De Bondt, Y.; Verdonck, C.; Brandt, M.J.; De Vuyst, L.; Gänzle, M.G.; Gobbetti, M.; Zannini, E.; Courtin, C.M. Wheat Sourdough Breadmaking: A Scoping Review. Annu. Rev. Food Sci. Technol. 2024, 15, 265–282. [CrossRef]
- Cappelle, S.; Guylaine, L.; Gänzle, M.; Gobbetti, M. History and Social Aspects of Sourdough. In: Gobbetti, M.; Gänzle, M. (Eds.) Handbook on Sourdough Biotechnology; Springer: Cham, 2023; pp. 1–13. [CrossRef]
- Pontonio, E.; Perri, G.; Calasso, M.; Celano, G.; Verni, M.; Rizzello, C.G. Unveiling the impact of traditional sourdough propagation methods on the microbiological, biochemical, sensory, and technological properties of sourdough and bread: a comprehensive first study. Appl. Food Res. 2025, 101037. [CrossRef]
- Calvert, M.D.; Madden, A.A.; Nichols, L.M.; Haddad, N.M.; Lahne, J.; Dunn, R.R.; McKenney, E.A. A review of sourdough starters: Ecology, practices, and sensory quality with applications for baking and recommendations for future research. PeerJ 2021, 9, e11389. [CrossRef]
- Liu, Y.-C.; Wu, P.-S.; Teng, S.-H.; Wu, M.-J. Identification of Dominant Microbes and Functional Analysis of Sourdough Starters Made of Dried Longan and Raisin. Eng. Proc. 2023, 55, 17. [CrossRef]
- Fessard, A.; Remize, F. Genetic and technological characterization of lactic acid bacteria isolated from tropically grown fruits and vegetables. Int. J. Food Microbiol. 2019, 301, 61–72. [CrossRef]
- Minervini, F.; De Angelis, M.; Di Cagno, R.; Gobbetti, M. Ecological parameters influencing microbial diversity and stability of traditional sourdough. Int. J. Food Microbiol. 2014, 171, 136–146. [CrossRef]
- Gordún, E.; del Valle, L.J.; Ginovart, M.; Carbó, R. Comparison of the microbial dynamics and biochemistry of laboratory sourdoughs prepared with grape, apple and yogurt. Food Sci. Technol. Int. 2015, 21, 428–439. [CrossRef]
- Vrček, I.V.; Čepo, D.V.; Rašić, D.; Peraica, M.; Žuntar, I.; Bojić, M.; Mendaš, G.; Medić-Šarić, M. A comparison of the nutritional value and food safety of organically and conventionally produced wheat flours. Food Chem. 2014, 143, 522–529. [CrossRef]
- Wang, J.; Chatzidimitriou, E.; Wood, L.; Hasanalieva, G.; Markellou, E.; Iversen, P.O.; Seal, C.; Baranski, M.; Vigar, V.; Ernst, L.; Willson, A. Effect of wheat species (Triticum aestivum vs T. spelta), farming system (organic vs conventional) and flour type (wholegrain vs white) on composition of wheat flour–Results of a retail survey in the UK and Germany–2. Antioxidant activity, and phenolic and mineral content. Food Chem. X 2020, 6, 100091. [CrossRef]
- Photcharoen, C.; Chung, R.; Sann, R. Modelling theory of planned behaviour on health concern and health knowledge towards purchase intention on organic products. Int. Bus. Res. 2020, 13, 100–116. [CrossRef]
- Mäkinen, O.E.; Arendt, E.K. Nonbrewing applications of malted cereals, pseudocereals, and legumes: A review. J. Am. Soc. Brew. Chem. 2015, 73, 223–227. [CrossRef]
- Ogunsakin, O.A.; Banwo, K.; Ogunremi, O.R.; Sanni, A.I. Microbiological and physicochemical properties of sourdough bread from sorghum flour. Int. Food Res. J. 2015, 22, 2610–2618.
- Montemurro, M.; Pontonio, E.; Gobbetti, M.; Rizzello, C.G. Investigation of the nutritional, functional and technological effects of the sourdough fermentation of sprouted flours. Int. J. Food Microbiol. 2019, 302, 47–58. [CrossRef]
- Franco, W.; Evert, K.; Van Nieuwenhove, C. Quinoa flour, the germinated grain flour, and sourdough as alternative sources for gluten-free bread formulation: impact on chemical, textural and sensorial characteristics. Fermentation 2021, 7, 115. [CrossRef]
- Stern, A.L.; Berstein, J.; Jones, S.S.; Blumberg, J.B.; Griffin, T.S. The impacts of germinating organic wheat: Effects on phytic acid, resistant starch, and functional properties of flour, and sensory attributes of sourdough bread. Int. J. Food Sci. Technol. 2021, 56, 3858–3865. [CrossRef]
- Bresciani, A.; Sergiacomo, A.; De Stefani, A.; Marti, A. Impact of Sprouted Chickpea Grits and Flour on Dough Rheology and Bread Features. Foods 2024, 13, 2698. [CrossRef]
- De Vuyst, L.; Van Kerrebroeck, S.; Leroy, F. Microbial ecology and process technology of sourdough fermentation. Adv. Appl. Microbiol. 2017, 100, 49–160. [CrossRef]
- Yang, T.K.; Basu, B.; Ooraikul, F. Studies on germination conditions and antioxidant contents of wheat grain. Int. J. Food Sci. Nutr. 2001, 52, 319–330. [CrossRef]
- EFSA Panel on Biological Hazards (BIOHAZ). Scientific Opinion on the risk posed by Shiga toxin-producing Escherichia coli (STEC) and other pathogenic bacteria in seeds and sprouted seeds. EFSA J. 2011, 9, 2424. [CrossRef]
- Minervini, F.; Dinardo, F.R.; De Angelis, M.; Gobbetti, M. Tap water is one of the drivers that establish and assemble the lactic acid bacterium biota during sourdough preparation. Sci. Rep. 2019, 9, 570. [CrossRef]
- Heiniö, R.L. Sensory attributes of bakery products. In Bakery Products Science and Technology; 2014; pp. 391–407. [CrossRef]
- Wieczyńska, J.; Cavoski, I. Antimicrobial, antioxidant and sensory features of eugenol, carvacrol and trans-anethole in active packaging for organic ready-to-eat iceberg lettuce. Food Chem. 2018, 259, 251–260. [CrossRef]
- AACC International. Approved Methods of Analysis, 11th ed.; Method 10-05.01. Guidelines for Measurement of Volume by Rapeseed Displacement. AACCI: St. Paul, MN, 2001. [CrossRef]
- Crowley, P.; Grau, H.; Arendt, E.K. Influence of additives and mixing time on crumb grain characteristics of wheat bread. Cereal Chem. 2000, 77, 370–375. [CrossRef]
- Ahrné, L.; Andersson, C.G.; Floberg, P.; Rosén, J.; Lingnert, H. Effect of crust temperature and water content on acrylamide formation during baking of white bread: Steam and falling temperature baking. LWT-Food Sci. Technol. 2007, 40, 1708–1715. [CrossRef]
- Oshiro, M.; Tanaka, M.; Momoda, R.; Zendo, T.; Nakayama, J. Mechanistic insight into yeast bloom in a lactic acid bacteria relaying-community in the start of sourdough microbiota evolution. Microbiol. Spectr. 2021, 9, e00662-21. [CrossRef]
- Liu, S.; Wang, W.; Lu, H.; Shu, Q.; Zhang, Y.; Chen, Q. New perspectives on physiological, biochemical and bioactive components during germination of edible seeds: A review. Trends Food Sci. Technol. 2022, 123, 187–197. [CrossRef]
- Zhang, Y.; Ma, Z.; Cao, H.; Huang, K.; Guan, X. Effect of germinating quinoa flour on wheat noodle quality and changes in blood glucose. Food Biosci. 2022, 48, 101809. [CrossRef]
- Cui, Y.; Walcott, R.; Chen, J. Differential attachment of Salmonella enterica and enterohemorrhagic Escherichia coli to alfalfa, fenugreek, lettuce, and tomato seeds. Appl. Environ. Microbiol. 2017, 83, e03170-16. [CrossRef]
- Abadias, M.; Usall, J.; Anguera, M.; Solsona, C.; Viñas, I. Microbiological quality of fresh, minimally-processed fruit and vegetables, and sprouts from retail establishments. Int. J. Food Microbiol. 2008, 123, 121–129. [CrossRef]
- Liu, D.; Cui, Y.; Walcott, R.; Chen, J. Fate of Salmonella enterica and enterohemorrhagic Escherichia coli cells artificially internalized into vegetable seeds during germination. Appl. Environ. Microbiol. 2018, 84, e01888-17. [CrossRef]
- Vermelho, A.B.; Moreira, J.V.; Junior, A.N.; da Silva, C.R.; Cardoso, V.d.S.; Akamine, I.T. Microbial Preservation and Contamination Control in the Baking Industry. Fermentation 2024, 10, 231. [CrossRef]
- György, É.; Laslo, É. Microbiological quality assessment of some commercially available breads. Foods 2024, 13, 3271. https://www.mdpi.com/2304-8158/13/20/3271.
- Atudorei, D.; Mironeasa, S.; Codină, G.G. Effects of germinated lentil flour on dough rheological behavior and bread quality. Foods 2022, 11, 2982. [CrossRef]
- Badawy, W.; et al. Sprouted wheat flour for improving physical, chemical, rheological, microbial load, and quality properties of fino bread. Open Chem. 2024, 22, 20240030. [CrossRef]
- Cauduro, T.; D'Almeida, C.T.; Biduski, B.; dos Santos, A.; Santos, M.C.B.; Lima, L.R.D.S.; Cameron, L.C.; Bertolin, T.E.; Ferreira, M.S.; Gutkoski, L.C. Whole wheat flour replaced by sprouted wheat improves phenolic compounds profile, rheological and bread-making properties. J. Cereal Sci. 2023, 114, 103778. [CrossRef]
- European Union. Regulation (EU) No 1169/2011 of the European Parliament and of the Council of 25 October 2011 on the Provision of Food Information to Consumers. Off. J. Eur. Union 2011, 304, 18–63. http://data.europa.eu/eli/reg/2011/1169/oj.
- Hernandez-Aguilar, C.; Dominguez-Pacheco, A.; Palma Tenango, M.; Valderrama-Bravo, C.; Soto Hernández, M.; Cruz-Orea, A.; Ordonez-Miranda, J. Lentil sprouts: a nutraceutical alternative for the elaboration of bread. J. Food Sci. Technol. 2020, 57, 1817–1829. [CrossRef]
- Papagianni, E.; Kotsiou, K.; Biliaderis, C.G.; Lazaridou, A. Flaxseed and sprouted lentil seeds as functional ingredients in the development of nutritionally fortified “clean-label” gluten-free breads. Food Hydrocoll. Health 2023, 4, 100165. [CrossRef]
Figure 1.
Production of control and boosted sourdough.
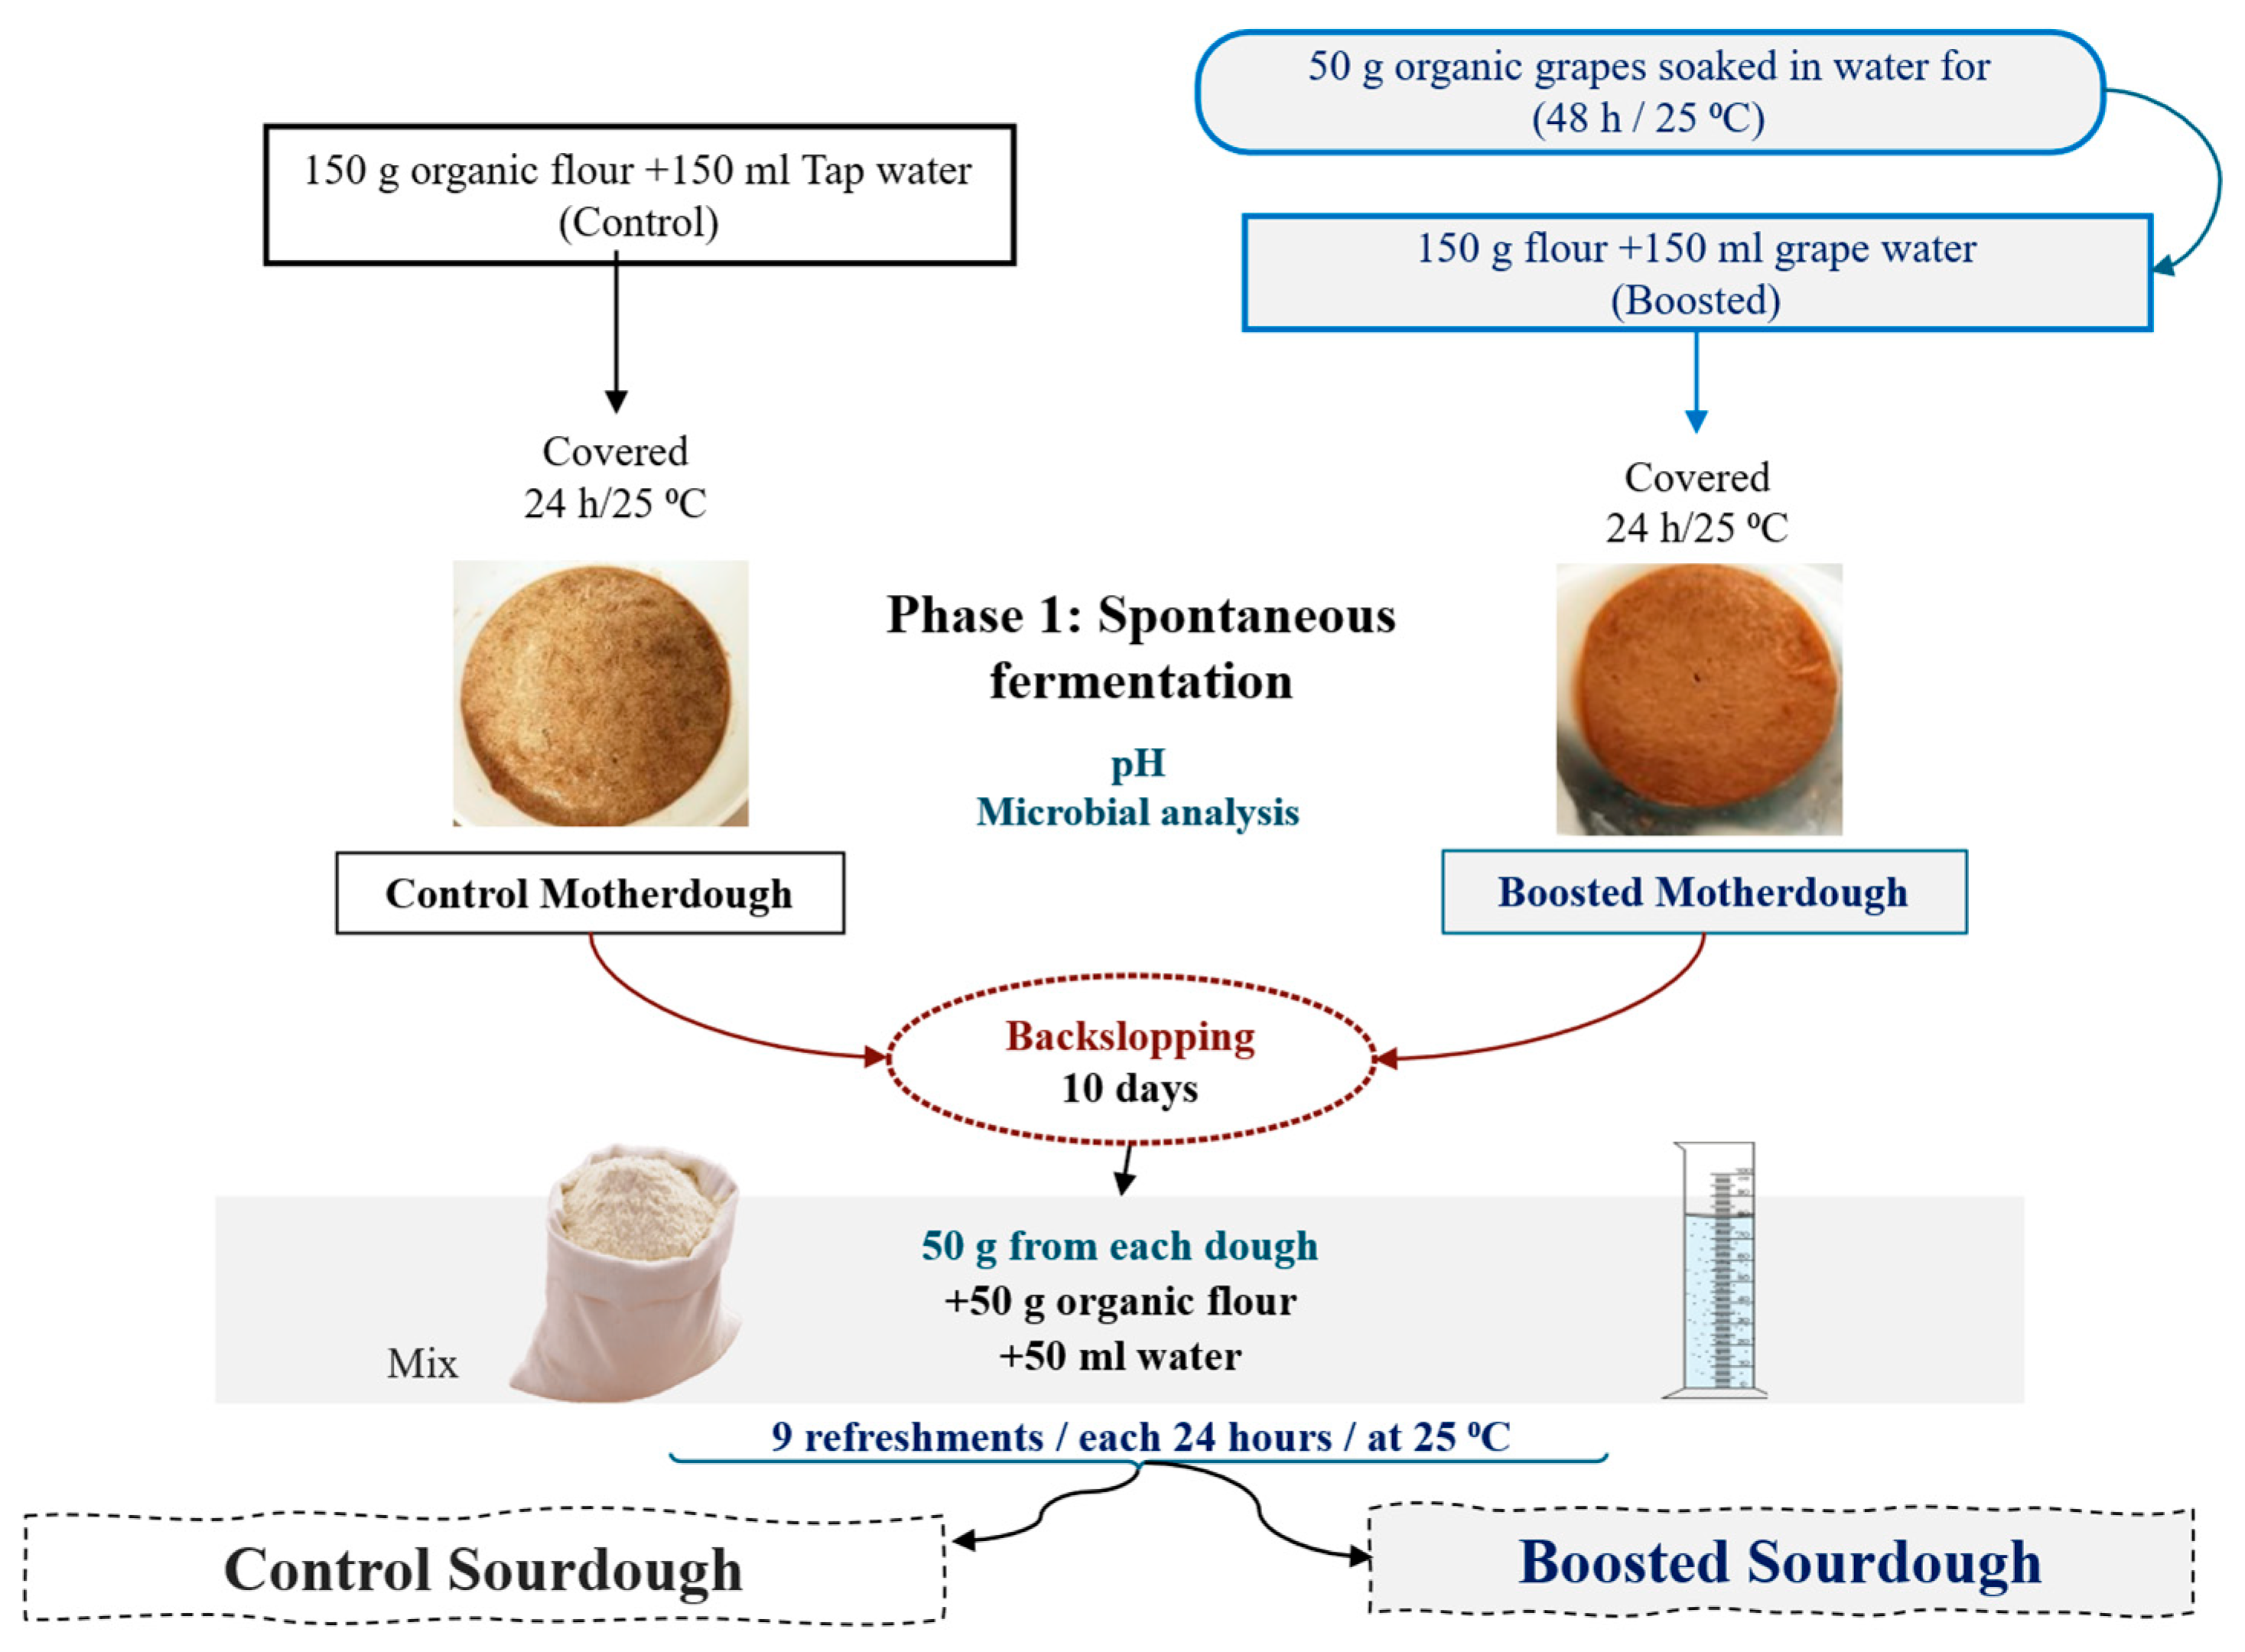
Figure 2.
Cell densities (expressed in log CFU/ml) of presumptive Lacic Acid Bacteria (LAB), yeasts, psychrophilic and mesophilic heterotrophic microorganisms found in tap water and grape water used in the first sourdough fermentation. For a given microbial group, bars showing different letters are significantly different (P<0.05).
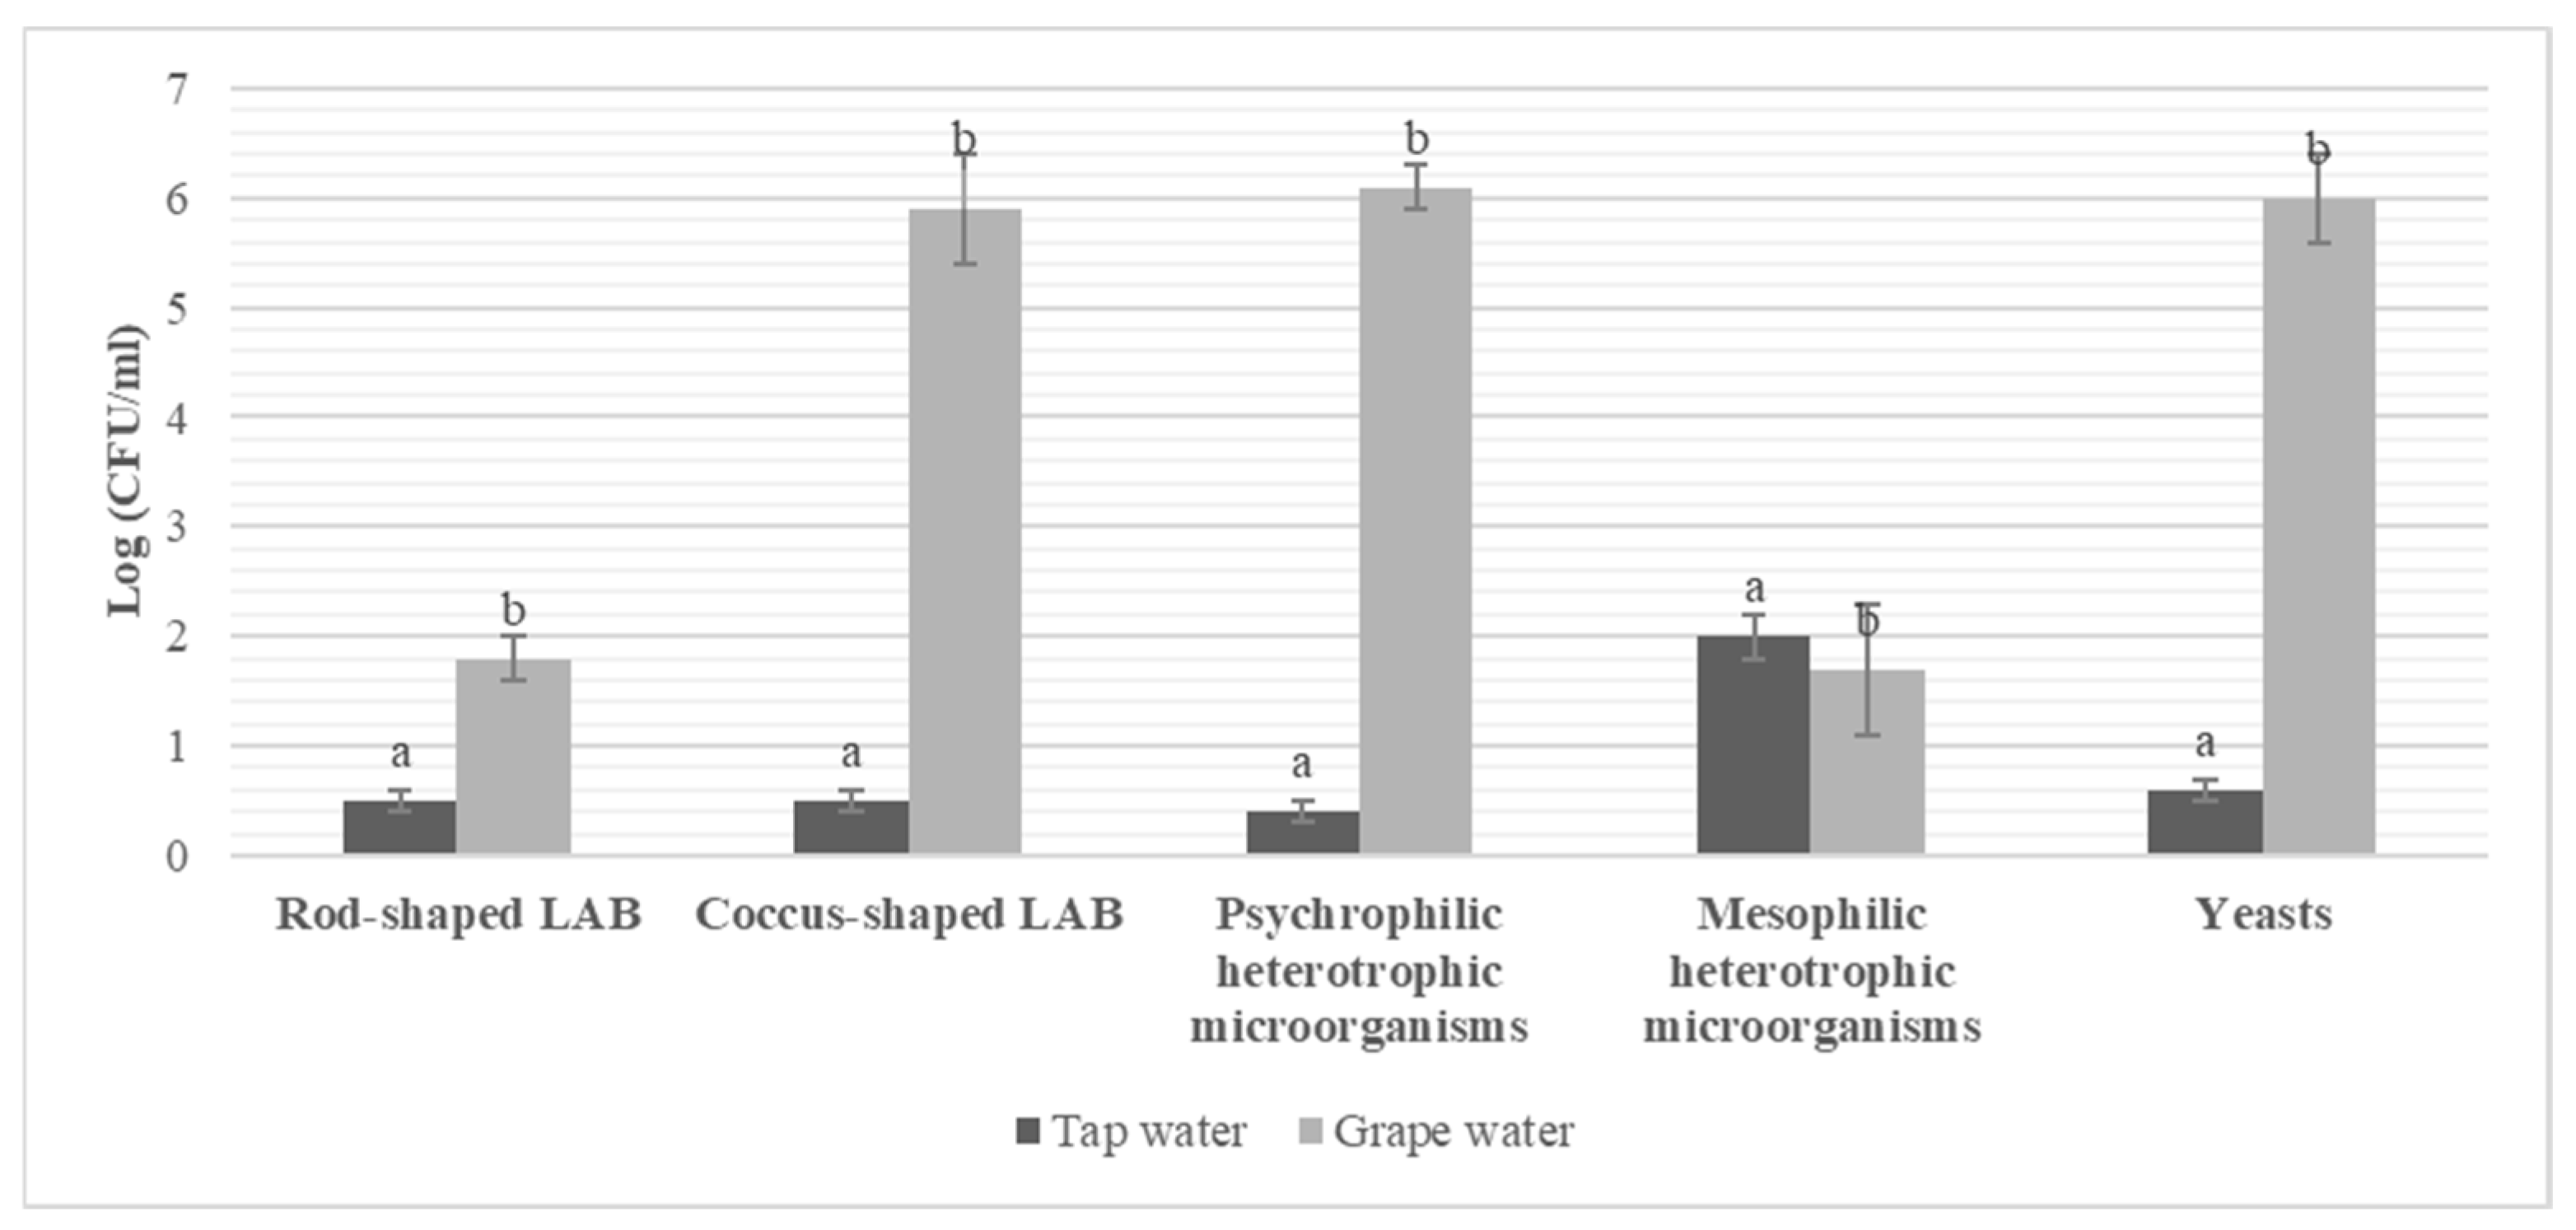
Figure 3.
Values of pH of sourdoughs after each daily fermentation.
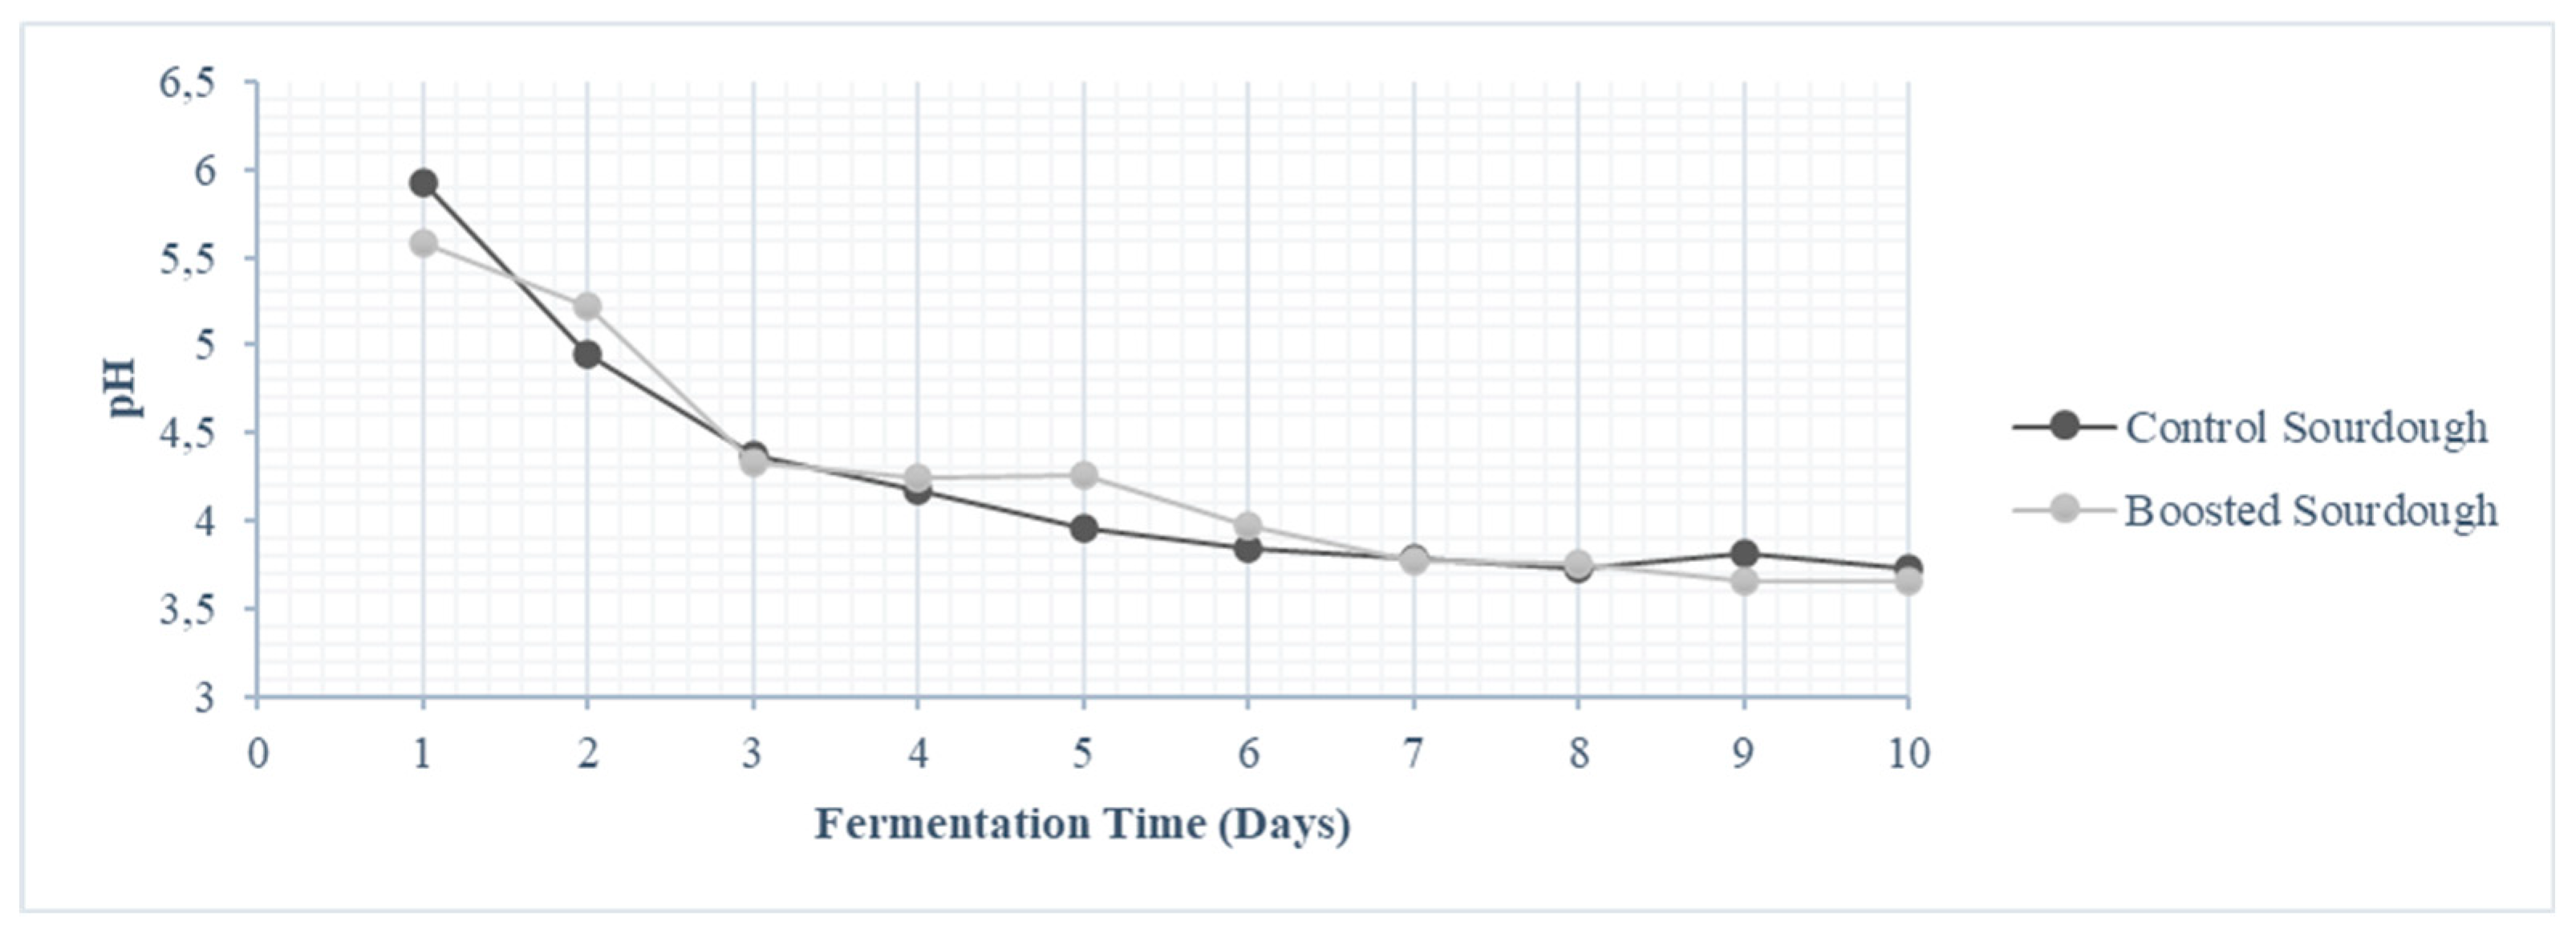
Figure 4.
Cell densities (log cfu/g) of presumptive yeasts, mesophilic rod-shaped Lactic Acid Bacteria (LAB), and mesophilic coccus-shaped LAB in the control sourdough (CSD) and boosted sourdough (BSD) after each daily fermentation.
Figure 4.
Cell densities (log cfu/g) of presumptive yeasts, mesophilic rod-shaped Lactic Acid Bacteria (LAB), and mesophilic coccus-shaped LAB in the control sourdough (CSD) and boosted sourdough (BSD) after each daily fermentation.
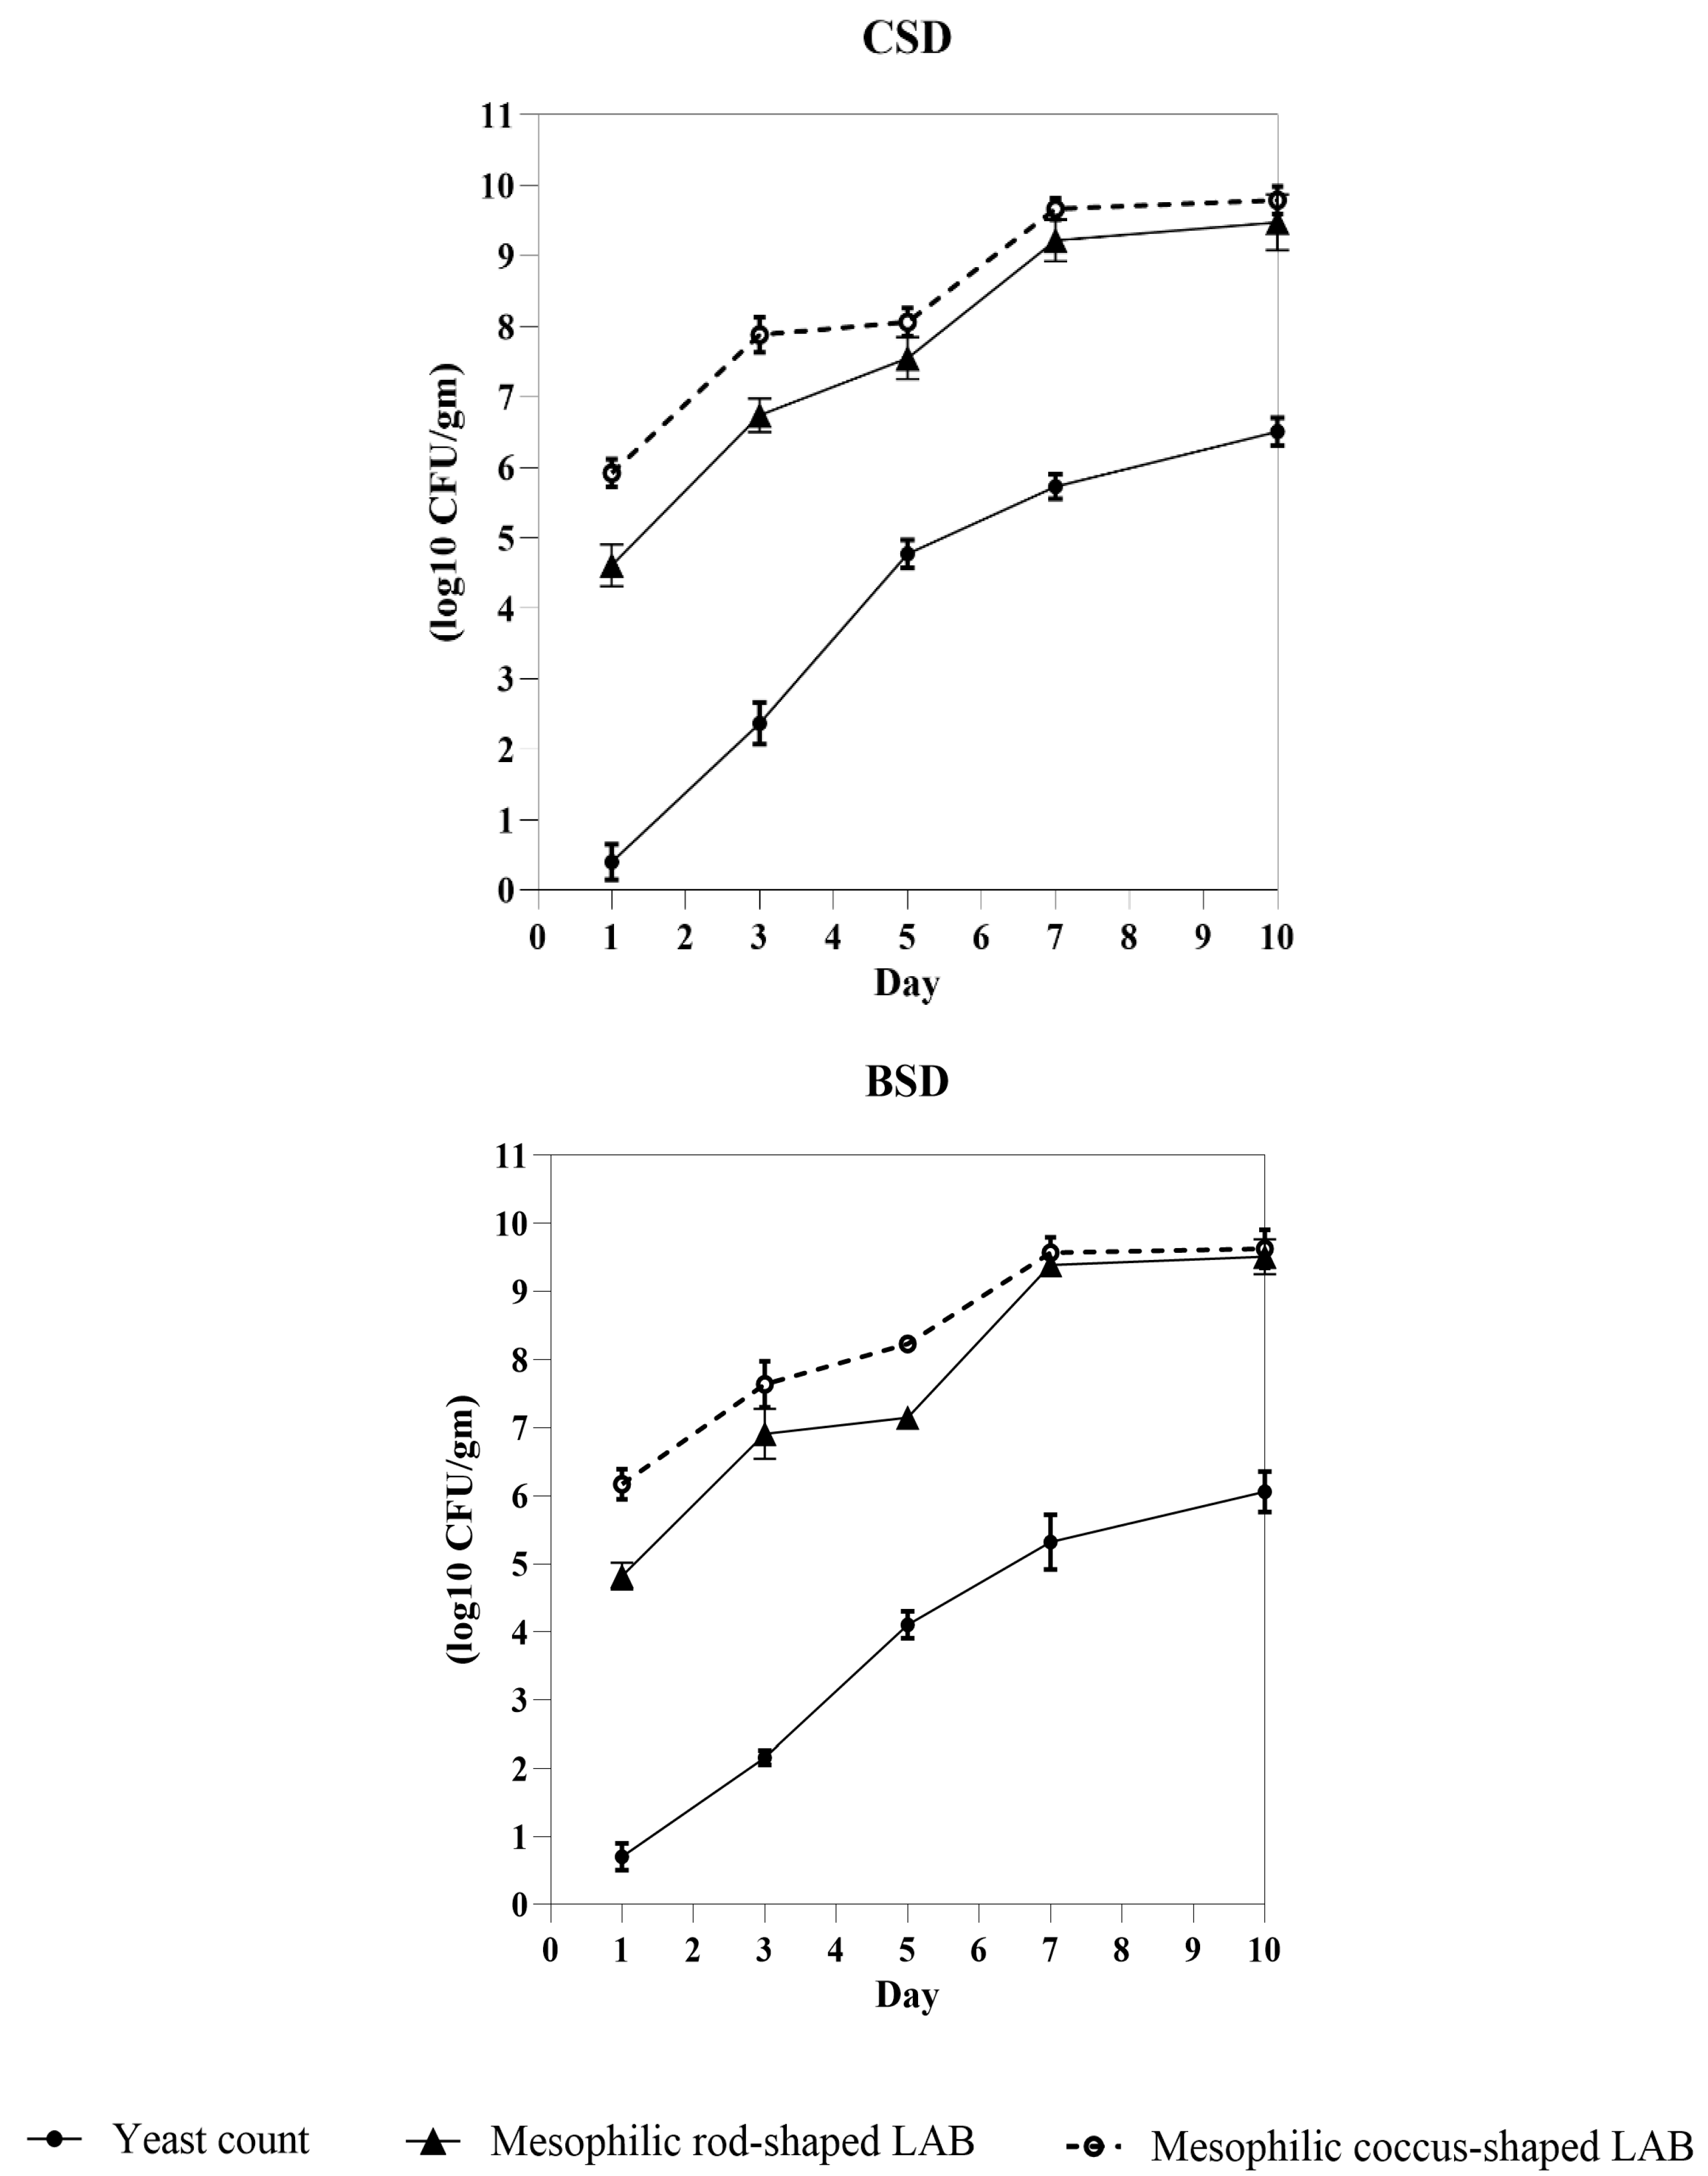
Figure 5.
Percentage of germination, determined after 24 h at 25 °C, of lentil, soft wheat, einkorn wheat, and barley seeds.
Figure 5.
Percentage of germination, determined after 24 h at 25 °C, of lentil, soft wheat, einkorn wheat, and barley seeds.
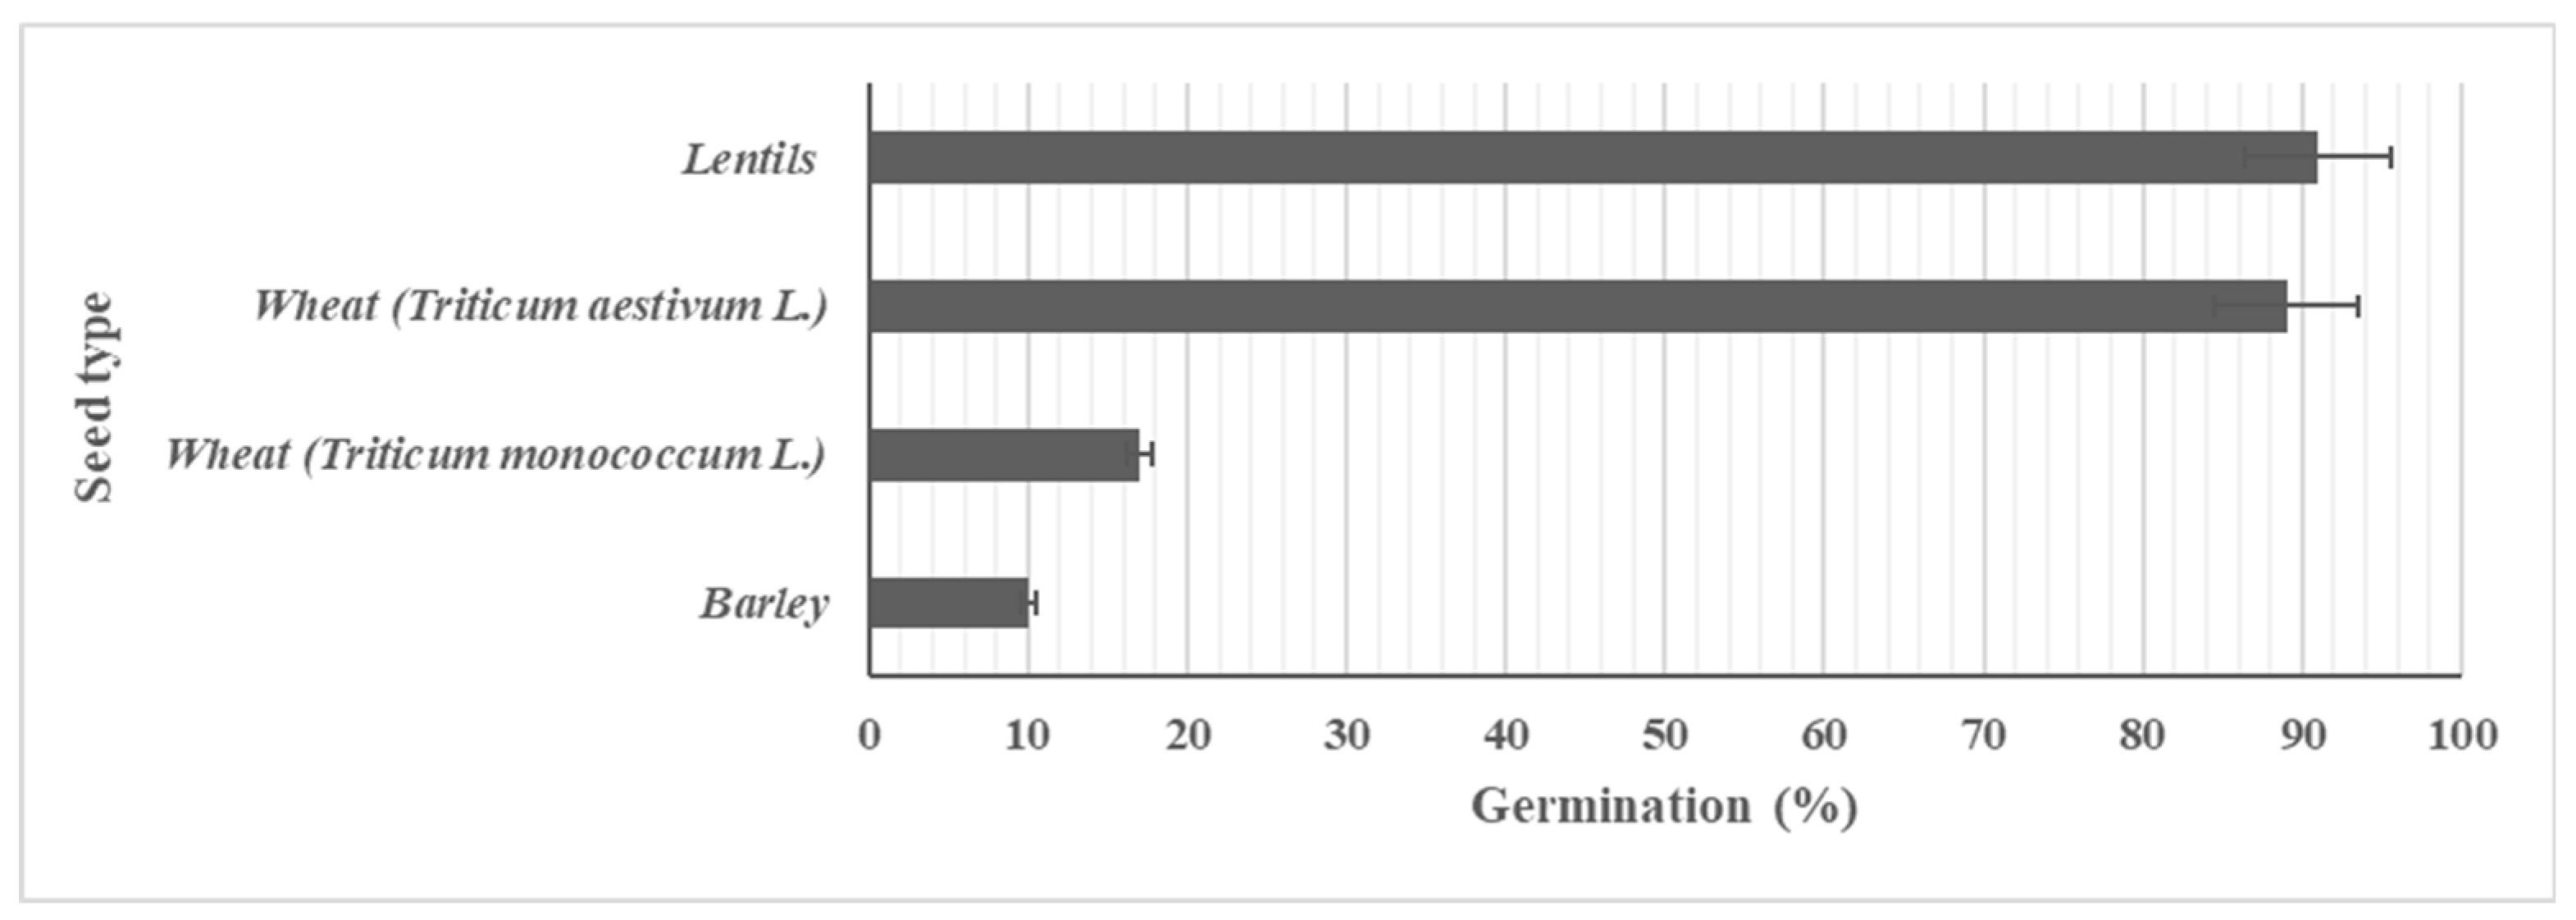
Figure 6.
Descriptive sensory analysis of organic sourdough bread, manufactured with germinated lentils (GL) or germinated wheat (GW) or without addition of germinated seeds (Control). Data are the means of scores attributed by nine trained panelists.
Figure 6.
Descriptive sensory analysis of organic sourdough bread, manufactured with germinated lentils (GL) or germinated wheat (GW) or without addition of germinated seeds (Control). Data are the means of scores attributed by nine trained panelists.
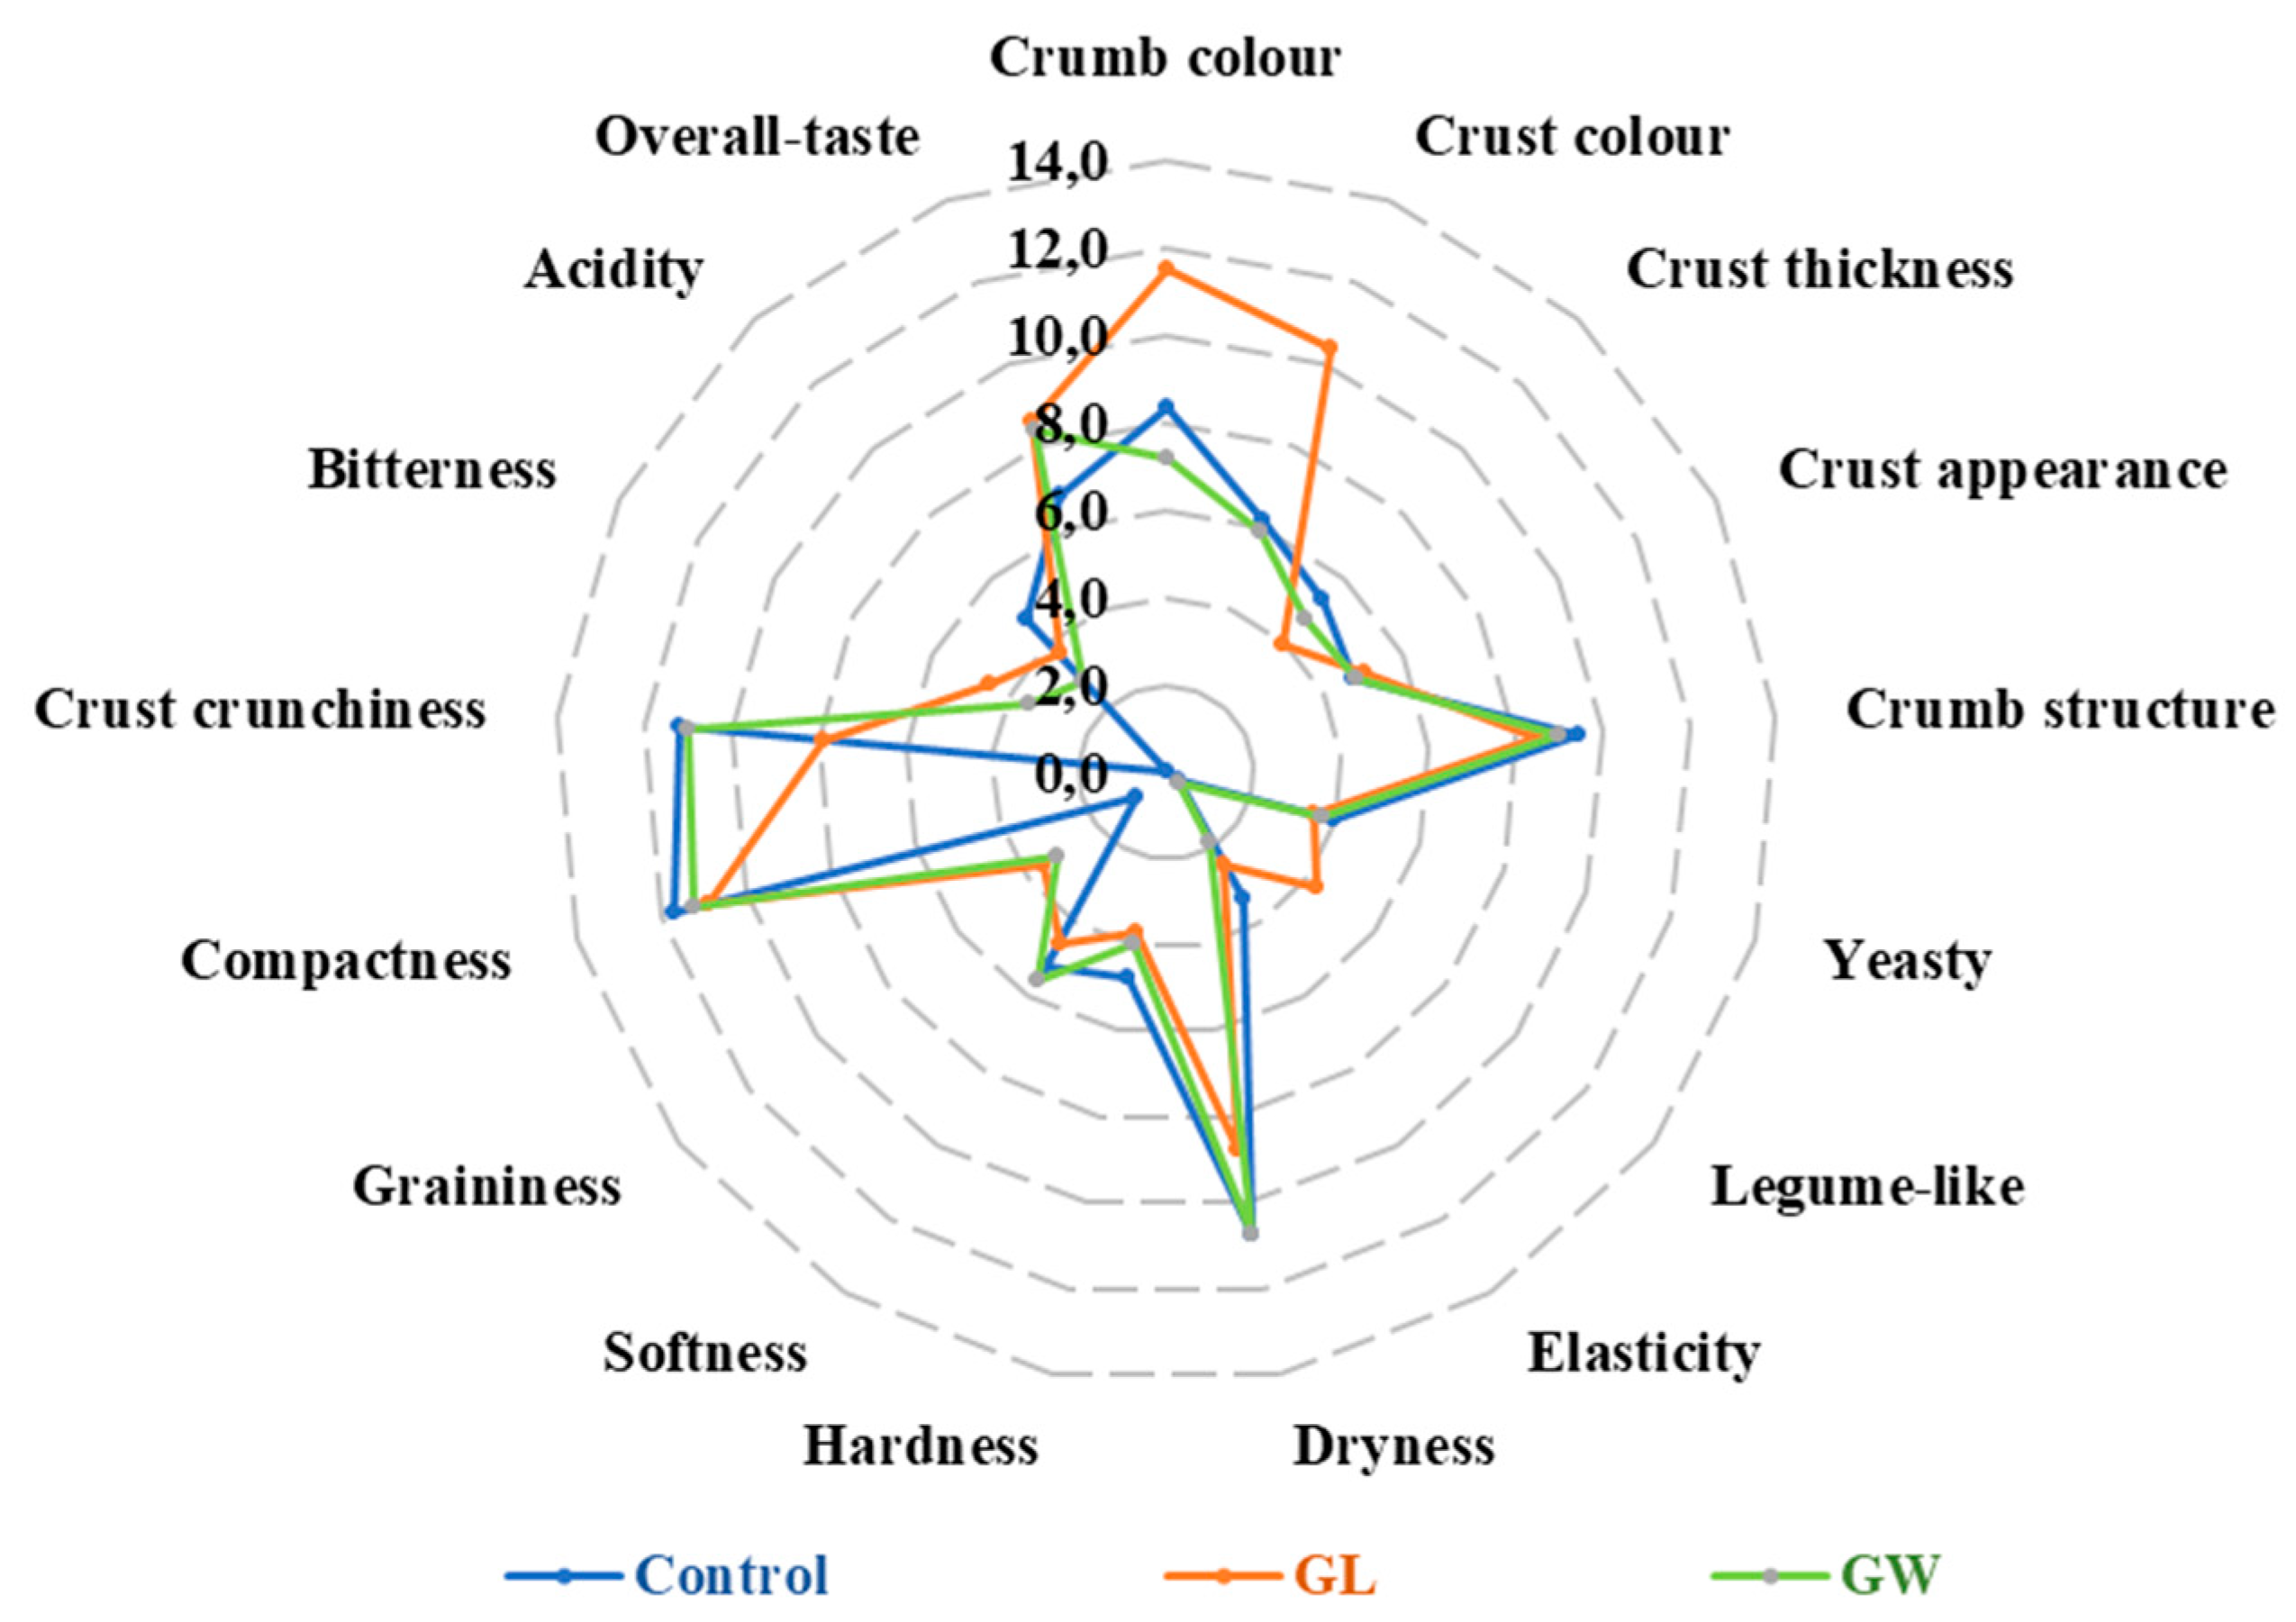
Figure 7.
Sections of organic sourdough bread, manufactured without germinated seeds (control, A1), or with germinated lentils (GL, B1) or germinated wheat (GW, C1). A2, B2, and C2 show crumb subsections, after being gray-scaled to calculate the black pixel area, of control, GL, and GW bread, respectively.
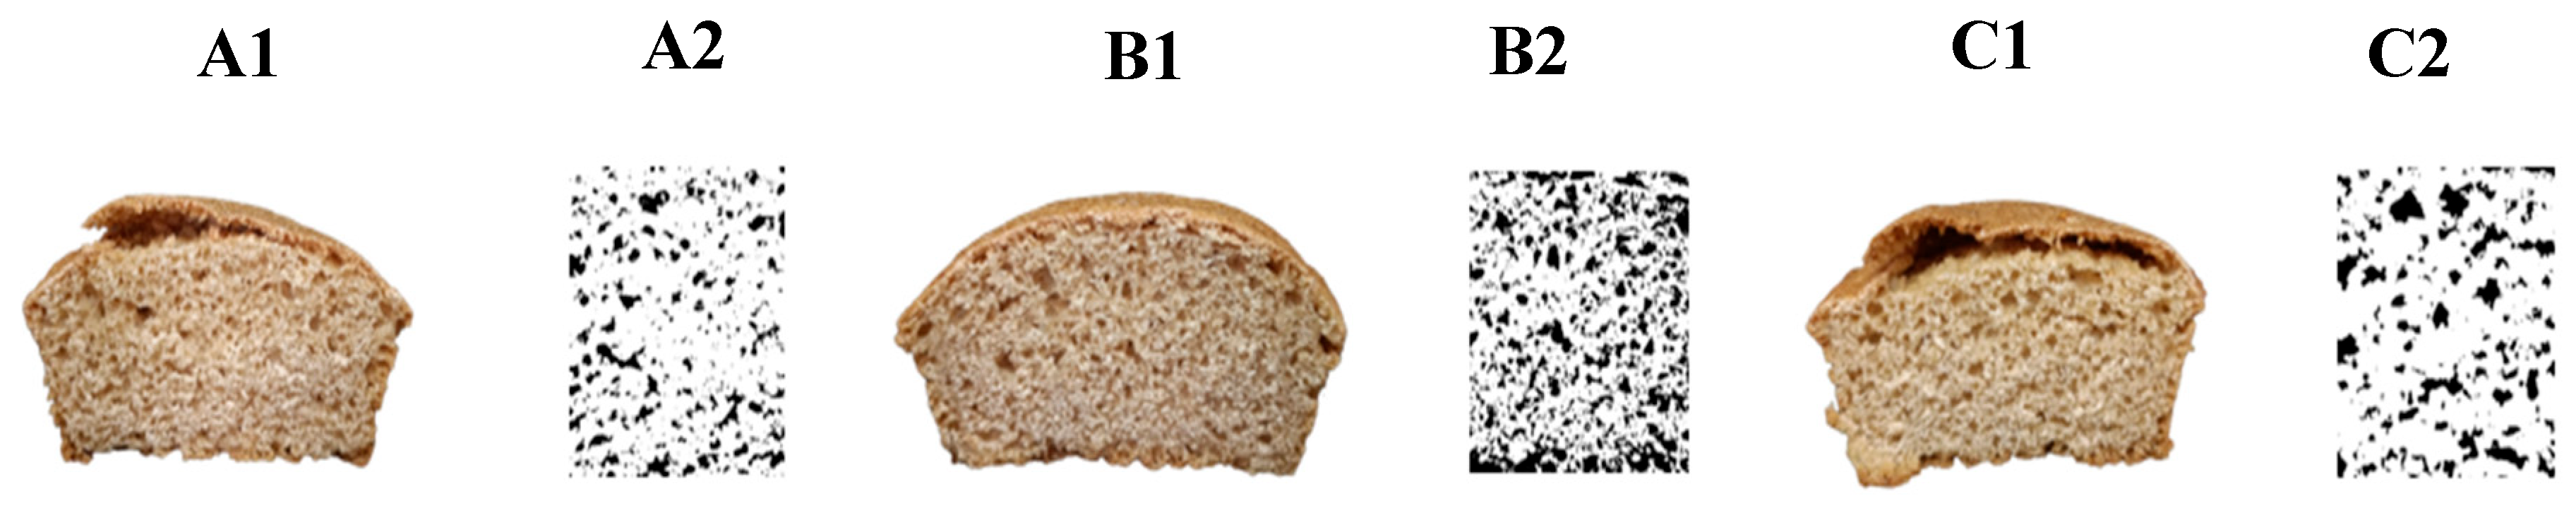

Table 1.
Specific volume, gas cell areas, and values of color indexes of organic sourdough bread, manufactured with germinated lentils (GL), or germinated wheat (GW), or without addition of germinated seeds (Control).
Table 1.
Specific volume, gas cell areas, and values of color indexes of organic sourdough bread, manufactured with germinated lentils (GL), or germinated wheat (GW), or without addition of germinated seeds (Control).
| Bread | Specific volume (cm3/g) | Gas cells area (%) | Crust color | Crumb color | ||||
| L | a | b | L | a | b | |||
| Control | 2.2±0.2a | 14.1 ±0.5c | 59.6 ±1.0a | 9 ±0.5b | 23.7 ±0.8a | 62.3 ±0.1a | 4.4 ±0.2a | 16.9 ±0.2a |
| GL | 2.2±0.1a | 28.6 ±0.8a | 52.1 ±0.4b | 11.0 ±0.6a | 24.2 ±0.5a | 56.4 ±1.4b | 4.5 ±0.1a | 17±0.4a |
| GW | 2.2±0.1a | 18.1 ±0.8b | 58.4 ±0.9a | 8.5 ±0.5b | 22.5 ±0.9a | 58.9 ±2.1ab | 4.5 ±0.4a | 18 ±1a |
a-c Values in the same column with the different superscript letters are significantly different (P<0.05).
Table 2.
Nutritional analysis of organic sourdough bread, manufactured without germinated seeds (control), with germinated lentils (GL), or germinated wheat (GW).
Table 2.
Nutritional analysis of organic sourdough bread, manufactured without germinated seeds (control), with germinated lentils (GL), or germinated wheat (GW).
| Bread | Lipids (%) | Proteins (%) | Water (%) | Total carbohydrates (%) | Dietary Fibers (%) | Energy value (kcal/100 g) |
| Control | 2.2±0.2a | 14.1 ±0.5c | 59.6 ±1.0a | 62.3 ±0.1a | 4.4 ±0.2a | 16.9 ±0.2a |
| GL | 2.2±0.1a | 28.6 ±0.8a | 52.1 ±0.4b | 56.4 ±1.4b | 4.5 ±0.1a | 17±0.4a |
| GW | 2.2±0.1a | 18.1 ±0.8b | 58.4 ±0.9a | 58.9 ±2.1ab | 4.5 ±0.4a | 18 ±1a |
a-c Values in the same column with the different superscript letters are significantly different (P<0.05).
Disclaimer/Publisher’s Note: The statements, opinions and data contained in all publications are solely those of the individual author(s) and contributor(s) and not of MDPI and/or the editor(s). MDPI and/or the editor(s) disclaim responsibility for any injury to people or property resulting from any ideas, methods, instructions or products referred to in the content. |
© 2025 by the authors. Licensee MDPI, Basel, Switzerland. This article is an open access article distributed under the terms and conditions of the Creative Commons Attribution (CC BY) license (http://creativecommons.org/licenses/by/4.0/).
Copyright: This open access article is published under a Creative Commons CC BY 4.0 license, which permit the free download, distribution, and reuse, provided that the author and preprint are cited in any reuse.


