
Submitted:
02 January 2024
Posted:
03 January 2024
You are already at the latest version
Abstract
The incidence of celiac disease and gluten intolerance has been significantly rising globally. Gluten-free product consumption registered a sudden rise also among tolerant people, due to psychosocial factors. Biscuits are popular, low-cost bakery foods, consumed by nearly everyone worldwide. The removal of gluten from the baked product causes some undesirable traits and different textures and tastes. The main goal consists of creating a food product with the same taste and texture as a product with gluten. Moreover, gluten-free bakery products are usually low-grade sources of protein and poor in dietary fiber. Quinoa is a source of TDF and valuable protein. In this study, quinoa flour was used as the main constituent in the formulation of gluten-free c to improve their nutritional properties. Six different recipes with different percentages of quinoa flour have been realized. The formulations were compared, by rheological analysis, of each other and with a wheat flour control shortbread. The recipes with rheological features more similar to control shortbread were subjected to a discrimination analysis and the preferred was characterized from a chemical-physical and sensorial point of view. The experimental shortbreads constituted a good compromise to exploit the good nutritional composition of quinoa maintaining an acceptable sensory profile.
Keywords:
gluten-free
; shortbread
; quinoa flour
; rice flour
; amino acids
; antioxidant activitiy
; fiber
1. Introduction
Quinoa (Chenopodium quinoa Willd.) is an ancient pseudocereal belonging to the family Amaranthaceae, mainly grown in the Andean region but actually cultivated on all continents. Quinoa plants can resist freezing temperatures as well as drought [1], so they can adapt to different agro-environmental conditions and can be cultivated almost everywhere. Quinoa is an annual herbaceous plant that has different colors, such as yellow, purple, red, or green, according to its variety, characterized by the presence of protein with high biological value, rich in both essential and non-essential amino acids and dietary fiber. Quinoa is considered a valuable source of vegetal protein, one of the best sources, and its protein levels are similar to those of milk and higher than protein levels of other cereals such as wheat, rice, and maize [2].
Additionally, quinoa contains a high amount of essential fatty acids, minerals, and vitamins, and it is a gluten-free (GF) raw material suitable for celiac consumers [2]. The interest in quinoa has been increasing in the last few years and this pseudoceral has been called as the "golden grain" due to its high nutritional value [3]. The FAO recognizes quinoa for its nutritional properties and its genetic diversity, as well as the cultural and socio-economic benefits it has on the local environment [4]. Furthermore, NASA selected quinoa as an ideal diet for its astronauts on board space missions [5]. Additionally, the cultivation and consumption of quinoa have steadily increased worldwide thanks not only to its nutritional properties but also to its ability to withstand adverse conditions and its capacity to adapt to very different environmental situations [3].
Since 2015, ISTAT has included GF biscuits and pasta in the basket implying regular consumption of these products even among tolerant consumers, and, gradually, the interest in GF products, with proper characteristics similar to conventional products, is growing [3]. Globally, in the Western area, the incidence of celiac disease and gluten intolerance has been significantly rising during the latter half of the 20th century and into the 21st century. In other countries, such as Africa, Asia, and Latin America, more studies are needed to provide a real picture of the incidence of this kind of disease [6]. Thereafter, GF products registered a sudden rise in the global market and this increase was observed even among tolerant people. The reasons for this phenomenon appear complex, and the aspects differ concurring with consumers’ choices, product characteristics, consumers’ preferences, and psychosocial factors. Moreover, the general belief that GF bakery products are healthier than traditional ones because are known to have a low glycemic index, low-calorie content, and help to control weight and fight obesity, has driven a further rise in demand [6,7].
In this global context, the need for new valuable GF products has increased, and nowadays the main goal consists of creating a food product with the same texture and taste as a product with gluten so that the consumer cannot tell the difference [7]. The removal of gluten from the baked product causes some undesirable traits in the final product such as grittiness, low volume, and reduced shelf life. Nevertheless, by using the right grain and granulation, it is possible to solve the grittiness issue and provide an appealing visual element to the product. Anyway, the primary dare is texture; it is very challenging to create the right one without gluten [7].
Biscuits are one of the most popular, low-cost bakery foods, widely consumed by nearly everyone worldwide; appealing to all ages consumers (including the elderly ones). These products are ready-to-eat, easily available in a wide variety of shapes, sizes, tastes, and packs, prepared through baking into a low moisture content (< 5%), which assures them a long shelf-life. Moreover, they serve as a source of energy for many people [8,9]. Several attempts have been made to improve biscuits’ nutritive value by modifying their composition. Usually, this objective is achieved by increasing the content of dietary fiber and protein in the final product, to attend to improved and more functional food market demand [10]. Furthermore, GF bakery products are usually poor in dietary fiber, due to the use of pure refined flour or starch as primary raw materials for their formulation, and low-grade sources of protein. This gives rise to the need to improve not only the quality but also the nutritional profile of GF products. This need has been stimulating researchers to explore new raw materials and technologies to be applied to GF bakery products. Rice flour (RF) is the most suitable ingredient for GF bakery formulations due to its neutral taste, white color, high digestibility, and hypoallergenic properties [10].
In this research, a shortbread with quinoa flour (QF) as the main constituent was formulated. RF was added to give a more neutral flavor, keeping the product naturally GF. Chemical-physical analyses (moisture, ash, aw, pH, carbohydrates, simple sugars, fats, fatty acids, proteins, amino acids, fiber, polyphenols, and antioxidant assays) were carried out on both QF and RF. After that, six different recipes with different percentages of QF (from 10 to 100%) and RF were realized. The formulations were compared, by rheological analysis, of each other and with a conventional shortbread (CS) made up of 100% wheat flour (WF). The recipes technologically more similar to CS were selected and tested with a difference/preference analysis. In the next step, the quinoa shortbread preferred by the panelists and the CS were characterized by a chemical-physical and sensorial point of view. From the obtained results, the biscuit with 60% quinoa was selected being the more similar to CS, the most appreciated by the sensory analysis. The experimental shortbread, from the nutritional point of view, was rich in essential amino acids, with a good composition in unsaturated fatty acids, and a good content in fiber and antioxidants. Moreover, the sensory analysis was overall positively assessed by the panelists.
2. Materials and Methods
2.1. Materials
2.1.1. Shortbreads ingredients
WF (“00,” with ash, protein, and moisture values of 0.57%, 9%, and 11%, respectively, and strength of W= 146) was acquired from Molini Popolari Riuniti di Ellera-Umbertide S.a.c.r.l., (Perugia, Italy). White QF (variety Qhaslala) with reduced saponin content and white biological RF were purchased from Molino Agostini S.r.l (Perugia, Italy). The other shortbread ingredients were sucrose (21.2%, Eridania Italia S.p.A, Bologna, Italy), butter (15.2%, Grifolatte, Perugia, Italy), water (4.5%), class A eggs (9.2%, Ovito, Perugia, Italy), salt (0.2%, Italkali, Palermo, Italy), sodium bicarbonate (0.2%, E 500; Solvay, Milano, Italy), and ammonium bicarbonate (0.2%, E 503; Bertolini, Brescia, Italy).
2.1.2. Reagents
Sulfuric acid 96%, 0.1 N sulfuric acid solution (Fluka, Steinhem, Germany). Sodium hydroxide solution 40%, sodium hydroxide solution 0.02 N, potassium sulfate anhydrous, selenium, hydrogen peroxide 35%, petroleum ether, pumice stone, potassium hydroxide, methanol, sodium sulfate anhydrous (J. T. Baker, Deventer, Holland). 1,3-diethyl-2-thiobarbituric acid, butyl hydroxyl toluene, sodium dodecyl sulfate, ethyl acetate, acetonitrile, boric acid solution 4% (Sigma Aldrich, St. Louis, Mo., U.S.A.). Kjeldahl tablet and sodium chloride solution 2.5% (Carlo Erba, Milano, Italia). Hexane anhydrous (Panreac Quimica, Barcelona, Spain). All reagents were of analytical grade and had the highest purity available.
2.2. Methods
2.2.1. Experimental design
The WF, QF, and RF were analyzed for the following parameters: water activity (aw), moisture, ash, total nitrogen and proteins, fat, carbohydrates, total dietary fiber (TDF), free amino acids (AAs), fatty acids (FAs), polyphenols content, and antioxidant capacity. Then, seven different shortbreads were prepared: the CS made up of WF and six experimental shortbreads formulated with QF and RF at different percentages (from 0 to 100% of quinoa flour, named Q0S, Q10S, Q20S, Q40S, Q60S, and Q100S). The different formulations of shortbreads were evaluated for their rheological properties, and in particular for hardness. In the next step, the recipes technologically most similar to the conventional one were selected and subjected to a discrimination analysis. Finally, the experimental shortbread that the panelists preferred was characterized from a chemical-physical and sensorial point of view and compared with the CS.
For the biscuit evaluation, the following parameters were considered: aw, moisture, ash, proteins, fat, carbohydrates, TDF, phenols content and antioxidant capacity, free AAs, and FAs profile, spread factor, and weight loss.
Sensory evaluation, in particular quantitative descriptive analysis, was conducted to evaluate the palatability of the preferred shortbreads and to evaluate the statistically significant difference between the CS and the preferred experimental shortbread.
2.2.2. Shortbread preparation on the laboratory scale
The amounts of ingredients used to produce CS and shortbreads with different percentages of QF and RF are reported in Table 1. The replacement involved only the WF fraction of butter (30%). To prepare the shortbreads studied in this research, the “doughing up” method was employed, as reported by Sileoni et al. [11]. Briefly, in the first step, the butter and flour were mixed in a laboratory mixer for 5 min at 120 rpm and 25 °C. Meanwhile, the sugar and the liquid ingredients were mixed separately. In the second step, the two mixtures were combined and the baking powder, (NH4)HCO3 and NaHCO3, was added. The dough was allowed to rest at 4 °C for 1 h, sheeted, and shaped into pieces of 40 mm in diameter × 4 mm in thickness. The biscuits were baked in a professional oven (Combimaster plus 061, Rational AG, Landsberg Am Lech, Germany) at 180 °C for 15 min. After cooling, the biscuits were packaged and stored in polypropylene bags [12].
2.2.3. Analytical determination
All the samples were analyzed in duplicate.
2.2.3.1. Moisture, pH, total nitrogen, protein, and ash contents were determined according to their respective Association of Official Analytical Chemists methods [13]. Protein content was calculated using the nitrogen conversion factors: 5.7 (for flour samples) and 6.25 (for shortbread samples) [11].
2.2.3.2. The aw was determined using an Aqualab® series 3 (Decagon, Pullman, Wash., U.S.A.) calibrated with lithium chloride solution (aw = 0.250 ± 0.003).
2.2.3.3. TDF was determined via a Megazyme assay kit (Megazyme International Ireland) following the AOAC method 985.29 [14].
2.2.3.4. Carbohydrates were calculated as the percentage difference with moisture, proteins, ashes, fats, And TDF [15].
2.2.3.5. An HPLC-ELSD system was used for the determination of free sugar content as reported by Sileoni et al. [11].
2.2.3.6. According to the conversion factors approved by the Food and Agriculture Organization of the United Nations (FAO) (4.0 kcal/g for protein, 9.0 kcal/g for fat, and 4.0 kcal/g for carbohydrates) [16], the shortbreads composition was used for the calculation of the energy values.
2.2.3.7. The total polyphenols content and antioxidant capacity were determined on flour and shortbreads’ extracts obtained by homogenizing 1 g of sample in 5 mL solution of methanol: water: hydrochloric acid (70:28:2; v/v/v) using an Ultra-Turrax homogenizer T25 (Ika Works Inc., USA) until uniform consistency (2 min). The homogenates were centrifuged at 3000 rpm for 10 min and the supernatants were recovered. The extraction was repeated two times and the extracts were collected into a 10 mL volumetric flask and taken to the final volume. The total polyphenols content was determined by using the Folin–Ciocalteau method [15], 2 mL of Folin-Ciocalteu reagent and 1.6 mL of Na2CO3 were added to 0.4 mL of sample. The obtained solution was incubated at room temperature, in the dark, for 120 min. The absorbance of the mixture was measured at 760 nm. The results were expressed as mg of GA equivalent (GAE) per g of sample dry matter (mg GAE g-1 dm) [15].
FRAP, ABTS, and DPPH tests were used to measure the antioxidant ability of flour and shortbread samples following the same procedures used by Bravi et al. [15], Trolox was used as standard for the calibration curves, and the results of all tests were expressed as Trolox equivalents (TE) g (dm).
2.2.3.8. Free AAs determination was achieved by HPLC-FLD, 10 ml of 5% trichloroacetic acid was added to 1 g of flour or ground shortbread and extracted for 30 min under magnetic stirring. The sample, diluted ten times was filtered with a syringe filter (0.45 μm), derivatized with O-phtaldialdehyde (5 g/L in a ratio of 1 to 2 with the sample), and injected into an HPLC system consisting of a Kinetex EVO C18 column (5μ, 150x4.6 mm). The separation was carried out at 30 °C with a flow rate of 1 mL/min. Mobile phase A was potassium hydrogen phosphate (0.05 M, pH 7.5) and mobile phase B was methanol. The chromatographic separation was achieved in 45 min using the following elution gradient: mobile phase A 81% (0 min), 78% (6 min), 67% (7 min), 56% (30 min), 45% (32 min), 35% (40 min), 81% (42), 81% (45 min). The detector was an Agilent 1200 fluorescence detector (FLD), with excitation/emission wavelengths at 338/420 nm. The external standard method was used for the calibration and the calibration plots were constructed for standard compounds with a linearity between 0.1 and 1.7 µg ml-1. The AAs detected were aspartic acid, glutamic acid, asparagine, serine, glutamine, histidine, arginine, glycine, threonine, alanine, tyrosine, methionine, tryptophan, valine, phenylalanine, isoleucine, leucine, and lysine.
2.2.3.9. The fat extract was used for the determination of FA profiles by gas chromatography. The lipid extracts were trans-esterified by treatment with methanol/KOH solution, and the resulting fatty acid methyl esters were injected into the HRGC-FID system. The FAs were identified by comparing their retention times with those of commercial standards [17].
2.2.3.10. Shortbreads texture
The hardness was determined on all formulations of shortbread; all the samples were analyzed ten times. The shortbread hardness was recorded, as the force required to cut/break the biscuit using a Texture analyzer (model TVT 6700, Perten) equipped with the P-BP70A probe. The shortbread hardness was recorded, as the force required for breaking the biscuit, and this peak force (N) at the breaking point represented the hardness of the shortbread. The biscuits were rearranged and restacked to obtain the average measurements. Ten measurements per replication were taken and average values are reported.
2.2.3.11. According to the AACC, method 10–50.05 [18], the spread factor was calculated as the ratio between the diameter and thickness of baked biscuits. Ten shortbreads were analyzed for each parameter. A caliper determined the width (W) and thickness (T) after baking and the spread factor was calculated. The weight loss of shortbreads was calculated by the difference between the initial uncooked shortbreads’ weight and that of the same after the baking process. One hundred samples per shortbread group were used for the weight loss calculation [11].
2.2.4. Sensory analysis
In total two sensory trials were carried out, discrimination and quantitative descriptive analysis. For each test, panelists were presented with two biscuits in polyethylene bags, a glass of water to cleanse the palate, and the scorecard.
2.2.4.1. Sensory discrimination and preference test
Thirty untrained panelists, aged from 20 to 50 of which 14 were female and 16 were male, performed the triangle-discriminating test. Two tests were carried out, one comparing Q60S with Q100S and the other comparing Q60S with Q40S.
2.2.4.2. Quantitative descriptive analysis
The sensory evaluation was carried out over 2 days in 2 sessions in which the CS was compared with Q60S. Each panelist performed one replication of each treatment. Sixteen trained panelists aged from 20 to 50 consisting of eight males and eight females evaluated the biscuits using the quantitative descriptive analysis technique. The panelists were previously trained to identify and determine descriptors relating to smell, taste, and texture. The descriptors and their corresponding definitions were available to the panelists during all sessions. Each panelist performed one replication of each treatment. A 10-point intensity scale was used wherein appearance was scored for surface appearance (uniformity), color, and global appearance; odor was scored for sweetness, vanilla, toasted, buttery, and overall odor; the taste was scored for bitter, buttery, vanilla, floury, sweetness, saltiness, eggy, and overall taste; consistency was scored for crispness, hardness, dryness, and pastiness.
2.2.5. Statistical analysis
The statistical analysis was performed with SigmaPlot software (SPSS Inc., Chicago, IL) version 12.5. Significant variations between the different samples were discriminated against using a one-way analysis of variance (ANOVA) test based on the F-test (p ≤ 0.05).
3. Results and discussions
3.1. Chemical quality parameters of flour
The quality parameters of WF, QF, and RF are compared in Table 2. WF was used for the formulation of traditional shortbreads, used as a control sample, and QF and RF were used, at different percentages, for the production of GF experimental shortbreads. The comparison underlines the different composition and quality parameters of the flours, as reported in the literature [19,20]. The QF had ash, proteins, fat, and TDF higher than WF and RF. In particular if compared with WF, QF had about 5, 1.5, 7, and 4 times higher content of hash, proteins, fat, and TDF respectively. The content of carbohydrates, because of the higher amount of other parameters, in QF was lower than in WF. If compared with RF, QF had about 7, 1.7, 17.5, and 2 times higher content of hash, proteins, fat, and TDF respectively. WF and RF had comparable compositions; with similar carbohydrates, slightly higher proteins, higher fat, and slightly higher ash content in WF; RF, on the other hand, showed higher TDF content. The higher fat and sugars content of QF it was not expected as a problem in the formulation of shortbreads and in their final composition, because in the recipe the fat fraction was represented mainly by butter and the sugar fraction by sucrose.
Concerning antioxidant compounds and antioxidant capacity, QF has a level of total polyphenols twice higher compared with RF and 10 times when compared with WF; the antioxidant activity, measured by the mean of the chosen three different assays, is the highest in QF, intermediate values are measured for RF, and the lower values are verified for WF. The preliminary results on different flours underlined and confirmed the interesting composition and nutritional properties of QF, which is rich in valuable compounds such as proteins (providing energy, essential for many biological activities, good health maintenance, and for the growth of the body), TDF, and polyphenols (with beneficial effects to human health) [15,21]. Moreover, QF showed the highest antioxidant activity for all the three different assays.
Flour is the most important raw material for bakery products. Despite the poor technological properties of their proteins, GF flours have a main advantage in their nutritional properties and the well-balanced composition of the AAs profile. AAs are key compounds, indispensable for many biochemical reactions. Free AAs, in particular, are the building blocks of protein molecules, and in food, these compounds contribute to flavor and taste [21]. They take part in the Maillard reaction (non-enzymatic browning) reacting with reducing sugars under high-temperature conditions, developing flavor and taste active compounds [10,11]. However, the Maillard reaction also gives rise to some negative molecules such as acrylamide; mainly asparagine, but also other free AAs, produce acrylamide reacting with glucose and fructose at high temperatures [21]. Table 3 shows the AAs composition of WF, QF, and RF. QF showed the highest content of free AAs, which was 8 and 13 times higher than that of WF and RF, respectively. Moreover, QF had higher content of all essential AAs if compared with RF and WF.
Finally, for those concerned about the impact on the flavor and taste, QF had the highest content of bitterness AAs: arginine, histidine, tyrosine, leucine, valine, methionine, isoleucine, phenylalanine, and lysine, accounting the 46% of the total, and the lowest amount of sweetness AAs: serine, alanine, glycine, and threonine, accounting the 11%. Both, WF and QF had neutral AAs as the most representative fraction, the least represented was the bitterness fraction in RF and the sweetness fraction in WF. Finally, if compared with WF, QF had a 1.7 times lower amount of asparagine, which is the main amino acid responsible for acrylamide production [21]. Regarding the fatty acids (FAs) profile of different flours (Table 4), QF had the higher content of unsaturated FAs (88.8%) characterized by high amounts of linoleic, oleic, γ-linolenic, and α-linolenic acids, the last two in higher concentration than in WF and RF.
From the obtained results, from a nutritional point of view, QF was found to be an excellent flour for the production of GF biscuits due to its high TDF and protein content, interesting polyphenols content, and antioxidant activity. Moreover, QF had a high content of free AAs, with an excellent presence of essential ones, and its fatty matrix is characterized by the presence of unsaturated fatty acids. It is also necessary to consider the presence of bitterness AAs and the possibility of related bitterness flavor problems in finished shortbreads. Anyway, the experimental GF shortbreads formulated with the highest QF content theoretically could present the best nutritional quality. Nevertheless, considering the poor rheological properties of GF flours, particular attention was paid to the evaluation of the rheological characteristics of the GF shortbreads, formulated according to the recipes reported in Table 1, that were analyzed for what concerns the hardness. In addition, the shortbreads with QF had a high amount of AAs related to bitterness and this can cause flavor problems in the panelists’ compliance of finished shortbreads, as well as greater hardness as highlighted by the rheological analysis.
3.2. Control and experimental shortbreads texture
The results of the hardness determination on control and experimental shortbreads are reported in Figure 1 and are the mean of ten replications. The shortbreads more similar to the conventional ones (made up of 100% WF) were those formulated with 60% and 100% QF. The Q40S showed the intermediate value of hardness. The shortbreads with the same hardness as the CS were selected and subjected to a discrimination test to verify the real differences between the biscuits and which the preferred ones by the panelists was.
3.2.1. Sensory discrimination and preference.
In the first trial, the Q60S and Q100S were compared, to verify the real differences and the preferred between the two samples evaluated as the ones with the same hardness as the CS. The difference was underlined by 100% of panelists and 90% of them expressed their preference for the Q60S. Moreover, considering the potentially negative impact of the presence of QF on the flavor, it was checked whether the Q40S (resulted in an intermediate value of hardness) could be preferred in comparison to the Q60S, the results showed that the difference was underlined by 70% of panelist and 71% of them preferred the Q60S. The Q60S was selected as the experimental GF shortbread with the best rheological and sensorial characteristics among the different formulations evaluated. These experimental shortbreads were evaluated for physicochemical parameters and sensorial attributes and were compared with the CS.
3.2.2. Quality parameters of shortbreads.
Table 5 shows the composition of the selected formulation of experimental GF shortbreads and CS. The values of moisture and aw, which influence the shelf life of shortbreads and their rheological properties, were similar for the two samples [11]. The significantly slightly higher value of moisture found for Q60S could be explained by considering the higher TDF content in quinoa shortbreads in comparison with the CS, in fact, it is well known the entity of retention capacity of TDF [22]. The values of aw for both samples were below the threshold which assures microbiological stability and preservability [11]. Because of different formulations and different quality parameters of the flours, GF shortbreads made up of QF and RF showed higher nutritional qualities than the CS, particularly about 5 times higher content of TDF and polyphenols, and higher antioxidant activities, for all the three different assays. According to Regulation (EC) No. 1924/2006, a food can be labeled as a “source of fiber” if contains at least 3g of fiber per 100g of food [23]. Q60S fully accomplished the required level. Moreover, the GF experimental shortbreads had a fiber content very close to the claim “high in fiber”, which needs 6g per 100g. No significant differences were observed in the fat content of different shortbreads. The higher fat content of QF (7.0% vs 1.01% of WF) did not influence the fat content of shortbreads, because of the presence of butter in both the recipes. Moreover, a significantly lower content of carbohydrates was observed in Q60S. The lower carbohydrate content of Q60S causes an energy value definitively lower than the CS.
The ratio between the width and the thickness of the shortbreads allows us to calculate the spread factor, so higher values of this parameter indicate the lower thickness of the shortbreads with the same length and, therefore, worst leavening. Q60S had a spread factor of 62.50, statistically higher than CS (48.89), making it evident the worst leavening of Q60S, because of the absence of gluten. Furthermore, the weight loss is due to the lowering of water content, which happens during the cooking phase by evaporation. The analyzed samples showed similar values of weight loss.
Table 6 shows the AA composition of CS and Q60S; we can see how the GF shortbreads had a higher amount of total free AAs (three times higher) and higher amount of essential ones too (two times higher) if compared with CS. Moreover, the fraction of bitterness AAs was higher in Q60S and was the highest among the different flavor active fractions, together with the neutral one, while the sweetness fraction appeared to be the least abundant. This peculiar composition could probably influence the flavor of the quinoa GF shortbreads for the perception of bitterness typical of QF. In CS, the neutral fraction is the most represented.
Table 7 shows the FA composition of the two different shortbread samples. Q60S showed a higher percentage of unsaturated FAs and in particular, polyunsaturated ones, compared with CS. Despite the presence of butter, quinoa seems to influence the FA composition of GF shortbreads.
GF bakery products are usually nutritionally poor and are characterized by high amounts of fat, and carbohydrates (due to the starchy ingredients), low content of protein, and high-energy value, with a poor intake of TDF [24]. In-depth clinical studies have highlighted the unbalanced intake of protein, carbohydrates, and fat along with the inadequate intake of the limiting nutrients TDF in coeliacs as compared to people with a normal diet. In recent years, several studies have developed to ensure the nutritional quality, besides the technological quality, of GF bakery products [24,25]. The experimental GF shortbreads formulated in this research study are nutritionally valuable products, with an interesting intake of TDF, an interesting amount of essential AAs, and a balanced FA composition, despite the presence of butter in the recipe.
3.3. Sensory analysis of shortbreads
The obtained rheological and analytical results underline the overall acceptable texture, comparable to that of CS, and the nutritional value of GF experimental (Q60S). The use of QF as the main ingredient enables the improvement of the nutritional quality of GF biscuits. The results of the sensory analysis (shown in Figure 2) allow for verifying if the consumers could appreciate the experimental shortbreads. Considering the overall component of the visual and taste points of view, the Q60S reached slightly lower scores compared to CS. The overall odor obtained a similar score in both shortbread samples. In detail, for what concerns the appearance, as regards surface uniformity and color, no significant differences (p < 0.05) were underlined. The scores related to the odor, of both CS and Q60S, showed no significant differences (p < 0.05).
Considering the taste, a significantly higher (p < 0.05) bitter taste was observed in quinoa shortbreads; while vanilla, floury, and overall taste obtained scores significantly lower (p < 0.05) if compared with those of CS.
Probably, the higher amount of bitterness AAs and phenolic compounds in QF caused the increased perception of bitter taste in experimental GF shortbreads, together with the saponins that remainesd after the specific flour treatments [26,27]. Interestingly, concerning consistency (one of the main goals to reach in the formulation of GF shortbreads), the Q60S and the CS have comparable scores in all the considered descriptors, namely crispness, hardness, and pastiness, except for statistically higher dryness (p < 0.05) in CS. The value of sensory hardness confirms the rheological hardness value measured during the analysis of texture.
4. Conclusions
In conclusion, the study clearly shows that the use of QF (at the amount of 60%) together with RF, in the formulation of GF shortbreads can be a valid tool for the production of nutritionally- improved GF shortbreads. The use of QF and RF enables the enhancement of the nutritional value of shortbreads, with a significant decrement in carbohydrate content and, as a direct consequence, in energy value and a significant increase in TDF content.
QF in the recipe allows the increment of TDF of about five times, and agrees to label the experimental GF shortbreads as a “source of fiber”. Moreover, the presence of QF in the formulation increases by about five times the polyphenols content, which contributes to an increase in the antioxidant capacity of shortbreads. Additionally, the experimental GF biscuits were also rich in AAs and essential ones too.
Finally, the experimental shortbreads could meet consumer compliance because of their high nutritional value and acceptable sensory characteristics and could attract consumers who want to purchase products with allergy/intolerance or social/ethical claims to make healthier and more sustainable food choices [28,29]. Furthermore, in future studies, the sensory characteristics could be further improved through the use, in recipes, of adjuvants such as hydrocolloids, broadly used in the food industry as functional ingredients because of their capacity to affect the rheological and sensory properties of a foodstuff. Moreover, the recipe can be optimized, in health terms, by partially substituting the butter with a fat fraction characterized by a low content of saturated fatty acids (e.g., high-oleic sunflower oil and rice bran oil).
Author Contributions
Elisabetta Bravi: Data curation, Formal analysis, Investigation, Methodology, Writing - original draft, Software, Supervision; Valeria Sileoni: Data curation, Formal analysis, Investigation, Methodology, Writing - review & editing, Software, Supervision; Ombretta Marconi: Conceptualization, Funding acquisition, Project administration, Writing - review & editing, Supervision. All authors have read and agreed to the published version of the manuscript.”.
Funding
This research was funded by European Union-NextGeneratonEU – under the Italian Ministry of University and Research (MUR) - National Innovation Ecosystem grant ECS00000041-VITALITY- CUP J97G22000170005.
Data Availability Statement
“Not applicable”.
Acknowledgments
Dr. Giorgia Mallia for analytical support.
Conflicts of Interest
The authors declare no conflicts of interest.
References
- Malik, R.A.; Srivastava, S.; Shahi, N.C. Formulation of quinoa incorporated protein-rich biscuits and numerical optimization of its process parameters. J Food Process Preserv 2022, 46, e16209. [Google Scholar] [CrossRef]
- Gordillo-Bastidas, E.; Díaz-Rizzolo, D.A.; Roura, E.; Massanés, T.; Gomis, R. Quinoa (Chenopodium quinoa Willd) from Nutritional Value to Potential Health Benefits: An Integrative Review. J Nutr Food Sci 2016, 6(3), 1000497. [Google Scholar]
- Angeli, V.; Silva, P.M.; Crispim Massuela, D.; Khan, M.W.; Hamar, A.; Khajehei, F.; Graeff-Hönninger, S.; Piatti, C. Quinoa (Chenopodium quinoa Willd.): An overview of the potentials of the “Golden Grain” and socio-economic and environmental aspects of its cultivation and marketization. Foods 2020, 9(2), 216. [Google Scholar]
- Bazile, D.; Pulvento, C.; Verniau, A.; Al-Nusairi, M.S.; Ba, D.; Breidy, J.; Hassan, L.; Mohammed, M.I.; Mambetov, O.; Otambekova, M.; Sepahvand, N.A.; Shams, A.; Souici, D.; Miri, K.; Padulosi, S. Worldwide Evaluations of Quinoa: Preliminary Results from Post International Year of Quinoa FAO Projects in Nine Countries. Front Plant Sci 2016, 7, 850. [Google Scholar]
- Lazíková, J.; Takáč, I.; Schneir, E.R.; Rumanovská, L. Legal Aspects of the Quinoa Imports Into the EU. EU agrarian Law 2022, 11(1), 13–21. [Google Scholar] [CrossRef]
- King, J.A.; Jeong, J.; Underwood, F.E.; Quan, J.; Panaccione, N.; Windsor, J.W.; Coward, S.; deBruyn, J.; Ronksley, P.E.; Shaheen, A.A.; Quan, H.; Godley, J.; Veldhuyzen van Zanten, S.; Lebwohl, B.; Ng, S.C.; Ludvigsson, J.F.; Kaplan, G.G. Incidence of Celiac Disease Is Increasing Over Time: A Systematic Review and Meta-analysis. Am J Gastroenterol 2020, 115(4), 507–525. [Google Scholar] [CrossRef]
- Savarese, M.; Wismer, W.; Graffign, G. Conceptualizing “free-from” food consumption determinants: A systematic integrative literature review focused on gluten and lactose. Food Qual Prefer 2021, 90, 104170. [Google Scholar] [CrossRef]
- Ahmad, S.; Ahmed, M. A review on biscuit, a largest consumed processed product in India, its fortification and nutritional improvement. IJSIT 2014, 3(2), 169–186. [Google Scholar]
- Agrahar-Murugkar, D.; Gulati, P.; Kotwaliwale, N.; Gupta, C. Evaluation of nutritional, textural and particle size characteristics of dough and biscuits made from composite flours containing sprouted and malted ingredients. J Food Sci Technol 2015, 52(8), 5129–5137. [Google Scholar] [CrossRef] [PubMed]
- Cayres, C.A.; Ascheri, J.L.R.; Peixoto-Gimenes Couto, M.A. Evaluation of nutritional characteristics and consumers’ acceptance of gluten-free sweet biscuits made from rice-based pregelatinized composite flours containing orange pomace and soy protein isolate. SN Appl Sci 2021, 3, 183. [Google Scholar] [CrossRef]
- Sileoni, V.; Alfeo, V.; Bravi, E.; Belardi, I.; Marconi, O. Upcycling of a by-product of the brewing production chain as an ingredient in the formulation of functional shortbreads. J. Funct. Foods 2022, 98, 105292. [Google Scholar] [CrossRef]
- Marconi, O.; Martini, R.; Mangione, A.; Falconi, C.; Pepe, C.; Perretti, G. Palatability and stability of shortbread made with low saturated fat content. J Food Sci 2014, 79(4), 469–475. [Google Scholar] [CrossRef]
- AOAC, Official Methods of Analysis. Association of Official Analytical Chemists. 14th ed., Arlington, VA, USA, 1984.
- AOAC, Official Methods of Analysis. Association of Official Analytical Chemists, 14th ed., Washington, WA, USA, 1986.
- Bravi, E.; Francesco, G.D.; Sileoni, V.; Perretti, G.; Galgano, F.; Marconi, O. Brewing by-product upcycling potential: Nutritionally valuable compounds and antioxidant activity evaluation. Antioxidants 2021, 10, 165. [Google Scholar] [CrossRef] [PubMed]
- Food and Agriculture Organization of the United Nations (FAO), Food energy - methods of analysis and conversion factors, Food and Nutrition paper 77, Rome, 2003.
- Bravi, E.; Perretti, G.; Buzzini, P.; Della Sera, R.; Fantozzi, P. Technological Steps and Yeast Biomass as Factors Affecting the Lipid Content of Beer during the Brewing Process. J Agric Food Chem 2009, 57, 6279–6284. [Google Scholar] [CrossRef] [PubMed]
- ACC, Approved Methods of the American Association of Cereal Chemists, 11th ed., AACC International, St. Paul, MN, U.S.A, 2000.
- Moawad, E.M.M.; Rizk, I.R.S.; Kishk, Y.F.M.; Youssif, M.R.G. Effect of substitution of wheat flour with quinoa flour on quality of pan bread and biscuit. Arab Univ J Agric Sci 2019, 26(7D), 2387–2400. [Google Scholar] [CrossRef]
- Jan, N.; Naik, H.R.; Gani, G.; Bashir, O.; Amin, T.; Wani, S.M.; Soi, S.A. Influence of replacement of wheat flour by rice flour on rheo-structural changes, in vitro starch digestibility and consumer acceptability of low-gluten pretzels. Food Prod Process Nutr 2022, 4, 9. [Google Scholar] [CrossRef]
- Kowalska, S.; Szłyk, E.; Jastrzębsk, A. Simple extraction procedure for free amino acids determination in selected gluten-free flour samples. Eur Food Res Technol 2022, 248, 507–517. [Google Scholar] [CrossRef]
- Bravi, E.; Sileoni, V.; Perretti, G.; Marconi, O. Accelerated shelf-life model of gluten-free rusks by using oxidation indices. Food Chem 2020, 326, 126971. [Google Scholar] [CrossRef] [PubMed]
- Regulation European Commission No 1924, of the European Parliament and the Council of 20 December 2006 on nutrition and health claims made on foods.
- Arslan, M.; Rakha, A.; Xiaobo, Z.; Arsalan Mahmood, M. Complimenting Gluten Free Bakery Products with Dietary Fiber: Opportunities and Constraints. Trends Food Sci Technol 2018, 83, 194–202. [Google Scholar] [CrossRef]
- Gasparre, N.; Pasqualone, A.; Mefleh, M.; Boukid, F. Nutritional Quality of Gluten-Free Bakery Products Labeled Ketogenic and/or Low-Carb Sold in the Global Market. Foods 2022, 11, 4095. [Google Scholar] [CrossRef]
- Beniwal, S.K.; Devi, A.; Sindhu, R. Effect of grain processing on nutritional and physicochemical, functional and pasting properties of amaranth and quinoa flours. IJTK 2019, 18(3), 500–507. [Google Scholar]
- Suárez-Estrella, D.; Marti, A.; Torri, L.; Pagani, M.A. Quinoa bitterness: causes and solutions for improving product acceptability. J Sci Food Agric 2018, 98, 4033–4041. [Google Scholar] [CrossRef]
- Melini, F.; Melini, V.; Galfo, M. A Cross-Sectional Survey of the Nutritional Quality of Quinoa Food Products Available in the Italian Market. Foods 2023, 12(8), 1562. [Google Scholar] [CrossRef] [PubMed]
- Ruiz, K.B.; Biondi, S.; Oses, R.; Acuna-Rodriguez, I.S.; Antognoni, F.; Martinez-Mosqueira, E.A.; Coulibaly, A.; Canahua-Murillo, A.; Pinto, M.; Zurita-Silva, A.; Bazile, D.; Jacobsen, S.E.; Molina-Montenegro, M.A. Quinoa biodiversity and sustainability for food security under climate change. A review. Agron Sustain Dev 2014, 34, 349–359. [Google Scholar] [CrossRef]
Figure 1.
Rheological properties of experimental and traditional shortbreads. n = 10; p ≤ 0.05; CS= control wheat shortbread; QnS: n= 0, 10, 20, 40, 60, 100% of quinoa flour, N = Newton. Bars with different letters are significantly different (p ≤ 0.05).
Figure 1.
Rheological properties of experimental and traditional shortbreads. n = 10; p ≤ 0.05; CS= control wheat shortbread; QnS: n= 0, 10, 20, 40, 60, 100% of quinoa flour, N = Newton. Bars with different letters are significantly different (p ≤ 0.05).
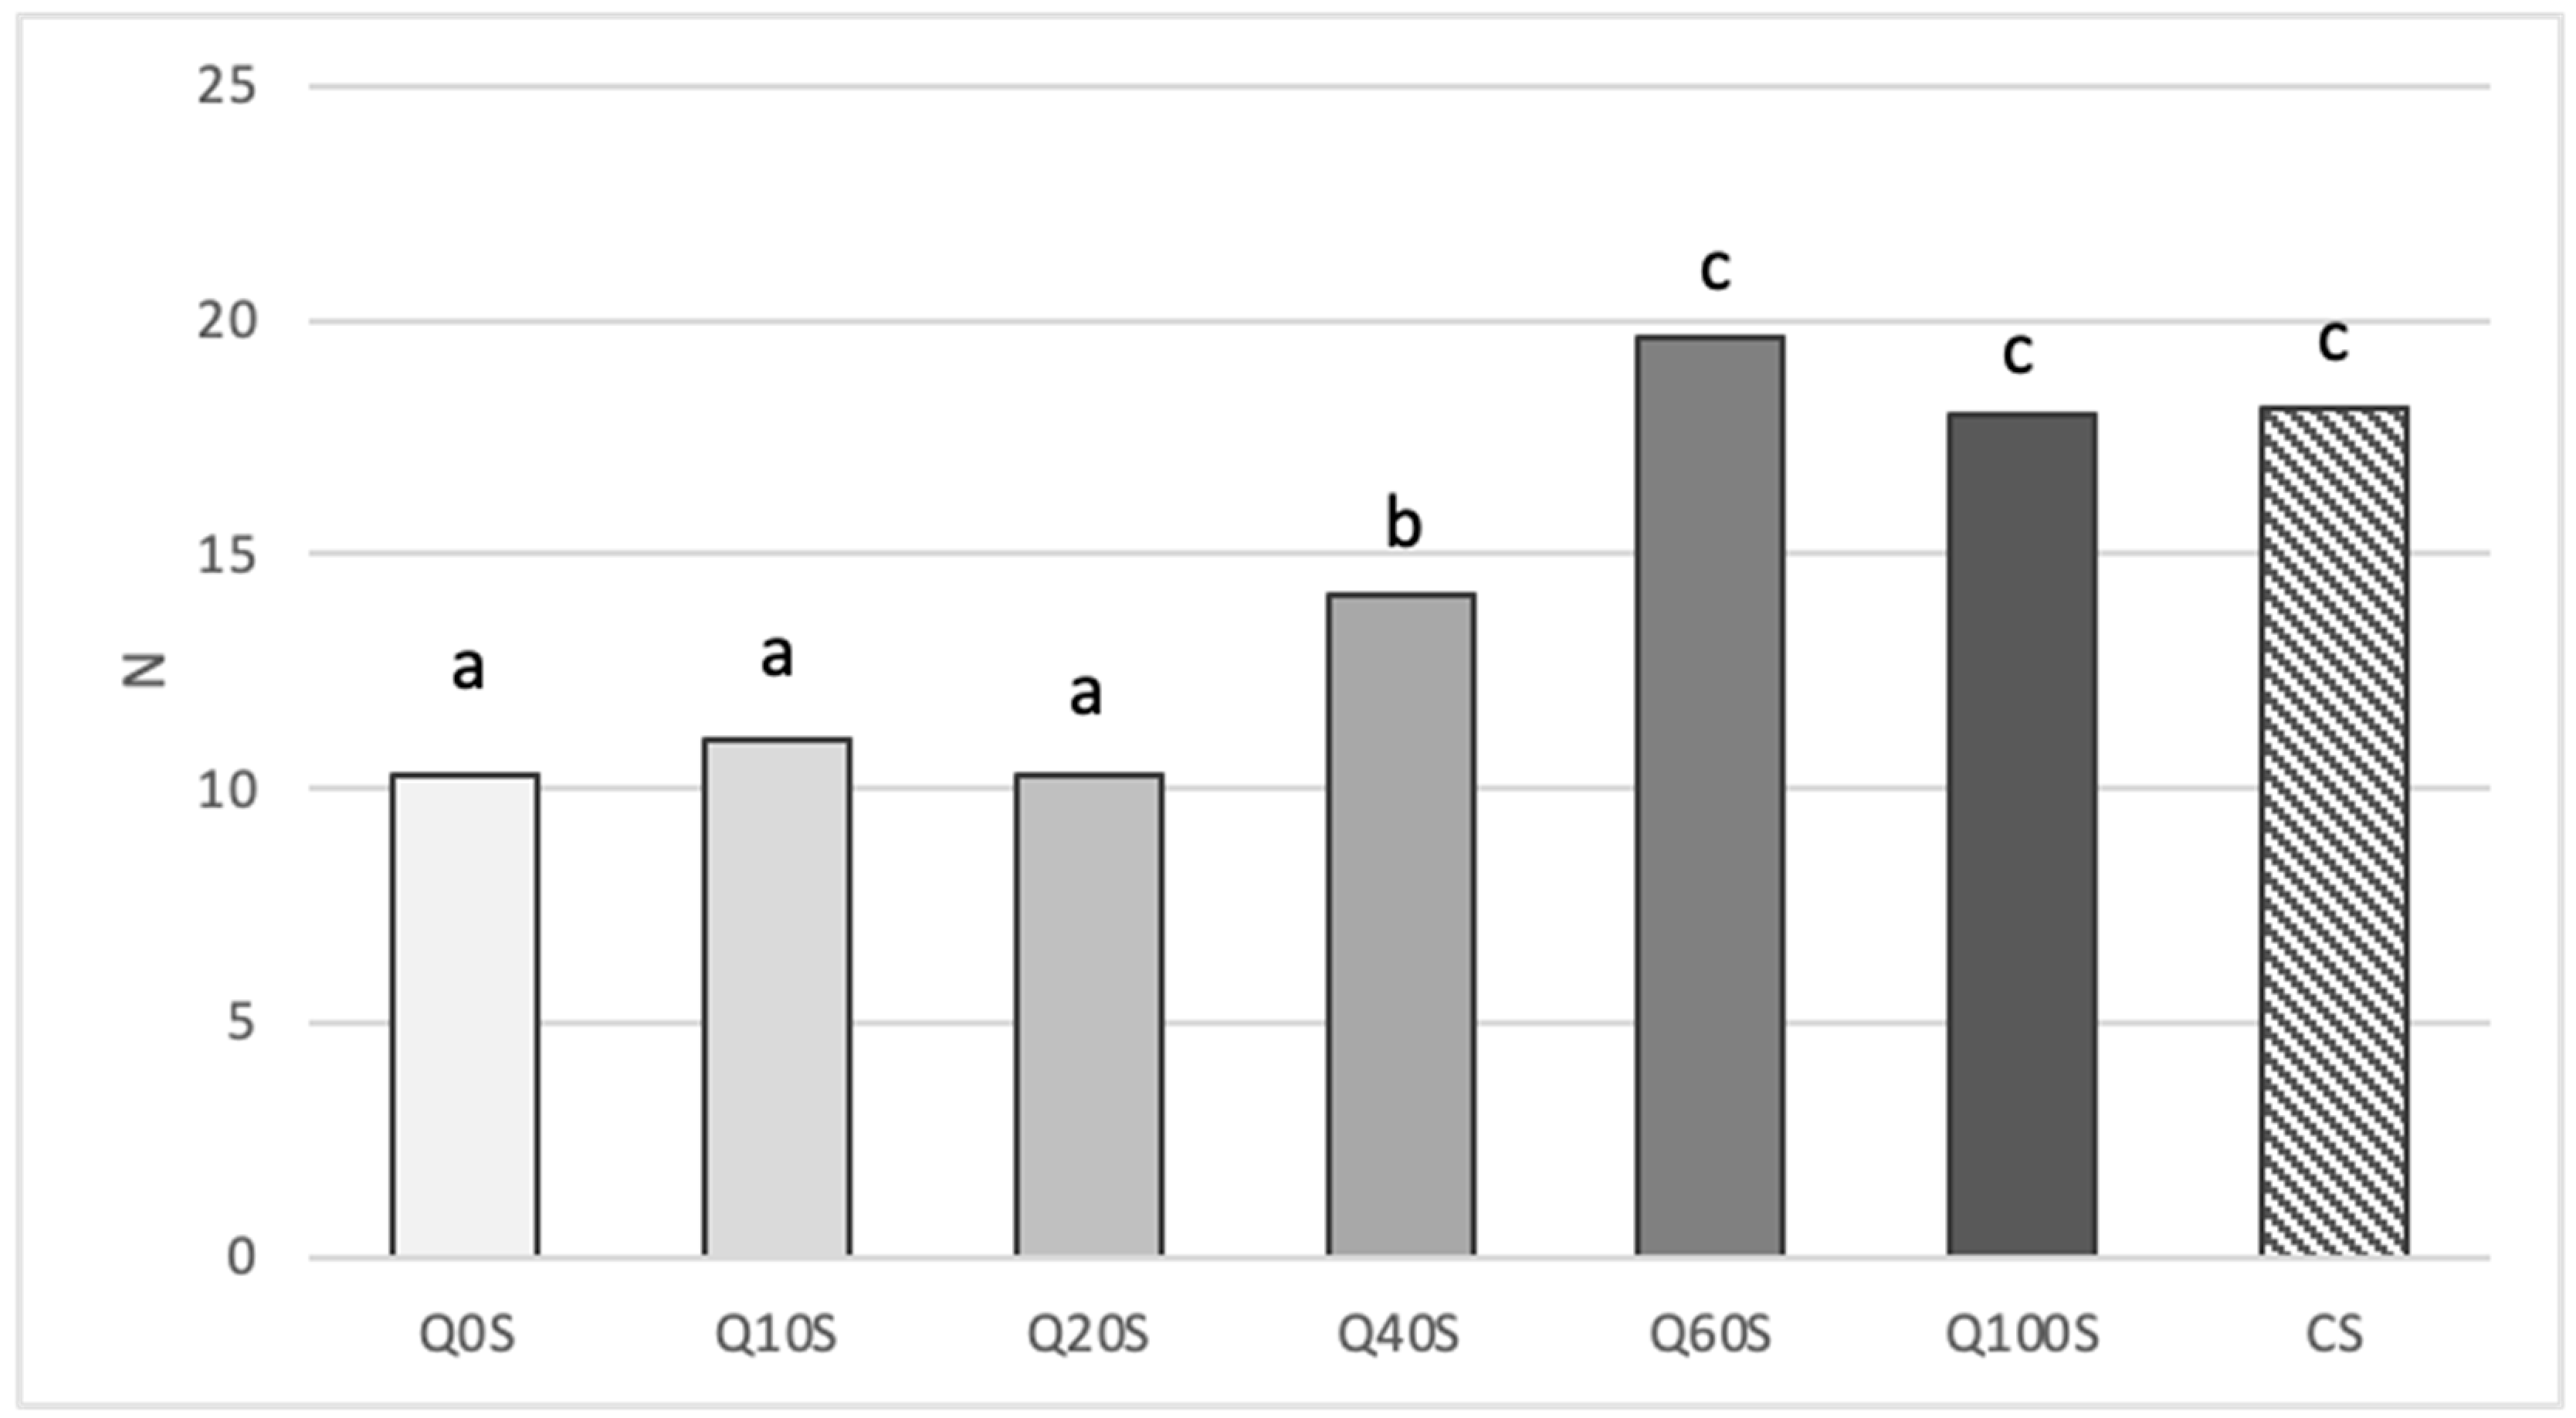
Figure 2.
Sensory analysis of shortbreads. CS: traditional shortbread, Q60S: 60% of quinoa flour shortbreads. O: odor, F: flavor. Descriptors for which score values are significantly different (p ≤ 0.05) are labeled with different letters between brackets referring to samples CS and Q60S respectively.
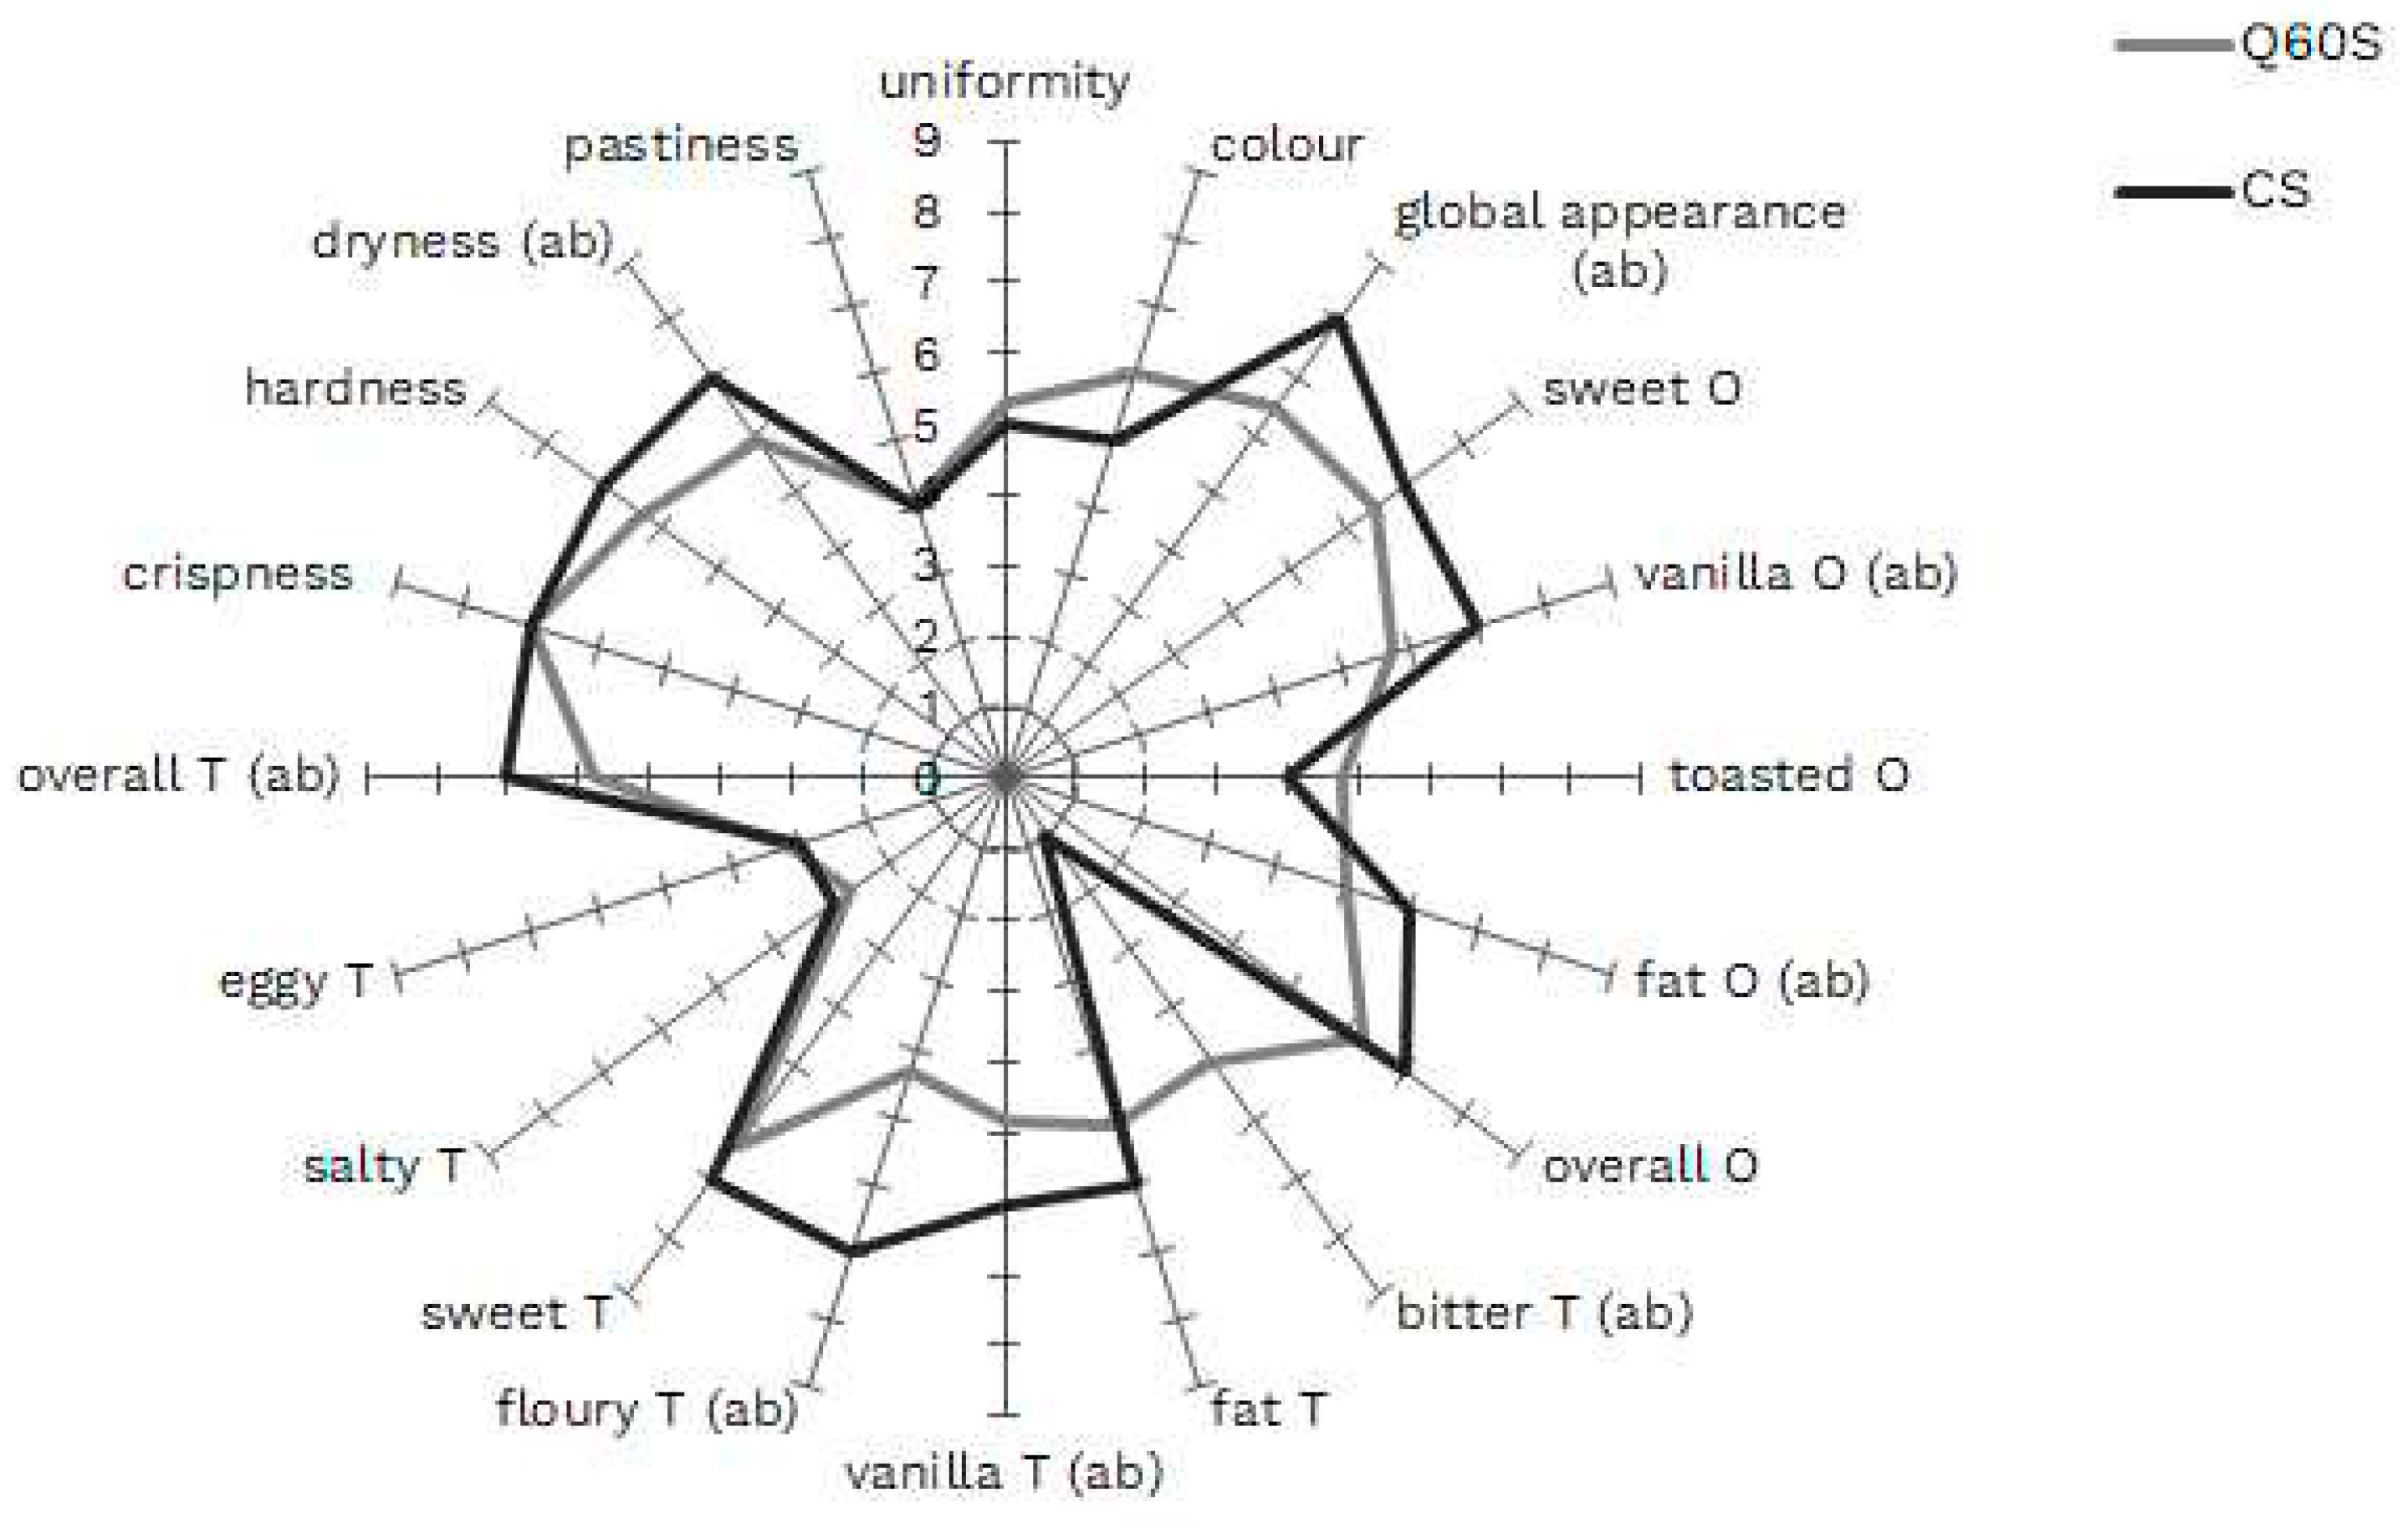

Table 1.
Shortbreads recipes.
| Ingredients (g) | CS | Q0S | Q10S | Q20S | Q40S | Q60S | Q100S |
| Wheat flour | 325 | - | - | 180 | - | - | - |
| Quinoa flour | - | - | 34,5 | 1,25 | 138 | 207 | 345 |
| Rice flour | - | 345 | 310,5 | 69 | 207 | 138 | - |
| Sucrose | 180 | 180 | 180 | 276 | 180 | 180 | 180 |
| NaCl | 1.25 | 1,25 | 1,25 | 180 | 1,25 | 1,25 | 1,25 |
| (NH4)HCO3 | - | 1 | 1 | 1 | 1 | 1 | 1 |
| NaHCO3 | 1 | 1,50 | 1,50 | 1,50 | 1,50 | 1,50 | 1,50 |
| Butter | 1.50 | 100 | 100 | 100 | 100 | 100 | 100 |
| Yolk | 100 | 24 | 24 | 24 | 24 | 24 | 24 |
| Egg white | 24 | 37 | 37 | 37 | 37 | 37 | 37 |
| Water | 37 | 30 | 30 | 30 | 30 | 30 | 30 |
CS: control shortbread, Q0S, Q10S, Q20S, Q40S, Q60S, Q100S: shortbreads with 0, 10, 20, 40, 60, and 100% of quinoa flour, respectively.
Table 2.
Chemical quality parameters of flour samples.
| Quality parameter | WF | QF | RF |
|---|---|---|---|
| Moisture % | 10.60±0.25a | 9.22±0.11b | 2.59 ± 0.02c |
| Carbohydrates (% dm) | 87.26±0.38a | 68.9 ± 1.3b | 87.5 ± 0.5a |
| Sugars (% dm) | 1.00±0.01b | 3.5 ± 0.3a | nd |
| Ash (% dm) | 0.57±0.01b | 2.69 ± 0.01a | 0.40 ± 0.01c |
| Proteins (% dm) | 9.41±0.08b | 13.8 ± 0.1a | 8.1 ± 0.1c |
| Fat (% dm) | 1.01±0.01b | 7.0 ± 0.1a | 0.4 ± 0.1c |
| TDF (% dm) | 1.76±0.33c | 7.7 ± 1.4a | 3.6 ± 0.5b |
| aw | 0.57±0.01a | 0.44 ± 0.01a | 0.50 ± 0.01a |
| Total-Polyphenols (GA mg/g) | 0.16 ± 0.01c | 1.64 ± 0.08a | 0.76 ± 0.04b |
| ABTS (TE/g) | 0.15 ± 0.03c | 0.69 ± 0.08a | 0.29 ± 0.01b |
| DPPH (TE/g) | 10.68 ± 1.00c | 75.77 ± 0.80a | 70.10 ± 0.91b |
| FRAP (TE/g) | 0.98 ± 0.03c | 3.58 ± 0.05a | 1.12 ± 0.04b |
n = 2 technological replicates, data are shown as mean ± standard deviation, WF= wheat flour, QF= quinoa flour, RF= rice flour, dm = dry matter, TDF = total dietary fiber, values on the same row with different superscript letters are significantly different (p ≤ 0.05).
Table 3.
Amino acids composition of flours.
| AAs (mg/Kg dm) |
WF | QF | RF |
|---|---|---|---|
| Aspartic Acid | 105.8 ± 7.9b | 228.7 ± 15.9a | 17.6 ± 0.2c |
| Glutammic Acid | 60.9 ± 0.9b | 692.7 ± 0.7a | 43.6 ± 1.2c |
| Asparagine | 87.2 ± 0.3a | 50.0 ± 3.2b | 52.8 ± 1.1b |
| Serine | 11.8 ± 3.0b | 64.9 ± 11.4a | 8.7 ± 0.2b |
| Glutamine | 44.5 ± 0.1b | 163.1 ± 7.1a | 6.9 ± 0.4c |
| Histidine | 8.3 ± 0.6b | 254.1 ± 0.8a | 4.5 ± 0.1c |
| Arginine | 25.4 ± 0.2b | 736.1 ± 0.5a | 6.3 ± 0.5c |
| Glycine | 13.1 ± 0.9b | 69.4 ± 8.2a | 13.9 ± 0.2b |
| Alanine | 29.0 ± 1.1b | 146.4 ± 5.9a | 26.2 ± 1.5b |
| Tyrosine | 12.3 ± 0.5b | 56.1 ± 3.7a | 4.1 ± 0.4b |
| Threonine | 8.4 ± 0.7b | 37.6 ± 4.6a | 4.8 ± 0.1c |
| Methionine | 4.8 ± 0.5b | 27.6 ± 0.1a | 3.3 ± 0.2c |
| Tryptophan | 63.8 ± 0.7b | 74.4 ± 0.3a | 2.8 ± 0.1c |
| Valine | 13.8 ± 1.2b | 85.5 ± 0.3a | 6.7 ± 0.1c |
| Phenylalanine | 11.3 ± 0.5b | 45.2 ± 4.0a | 2.9 ± 0.2c |
| Isoleucine | 6.3 ± 0.3b | 28.8 ± 2.0a | 1.4 ± 0.1c |
| Leucine | 10.3 ± 0.3b | 32.6 ± 2.4a | 2.6 ± 0.2c |
| Lysine | 10.6 ± 1.0b | 42.9 ± 4.4a | 4.1 ± 0.3c |
| Ʃ AAs | 527.6 ± 16.3b | 2836.1 ± 40.7a | 213.1 ± 2.9c |
| Ʃ sweetness AAs | 62.2 ± 5.7b | 318.3 ± 30.1a | 53.6 ± 2.0c |
| Ʃ bitterness AAs | 103.2 ± 5.1b | 1308.9 ± 18.2a | 35.8 ± 2.1c |
| Ʃ neutral AAs | 365.2 ± 9.9b | 1208.9 ± 27.2a | 123.8 ± 3.9c |
n = 2 technological replicates, data are shown as mean ± standard deviation, AAs = amino acids, QF= quinoa flour, RF= rice flour, dm = dry matter, TDF = total dietary fiber, the names of essential amino acids are written in italics. Values on the same row with different letters and values on the same column with different superscript letters are significantly different (p ≤ 0.05).
Table 4.
Fatty acids composition of gluten-free flours.
| Fatty acids (% dm) |
WF | QF | RF |
|---|---|---|---|
| Butyric C4:0 | 0.21 ± 0.02a | nd | nd |
| Myristic C14:0 | 0.13 ± 0.01b | 0.12 ± 0.01b | 0.58 ± 0.01a |
| Palmitic C16:0 | 17.14 ± 0.01a | 8.72 ± 0.02b | 16.72 ± 0.01a |
| Palmitoleic C16:1 ω7 | 0.14 ± 0.01c | 0.05 ± 0.01a | 0.22± 0.01b |
| Stearic C18:0 | 1.17 ± 0.01b | 0.79 ± 0.01a | 2.25± 0.01b |
| Oleic C18:1 ω9 | 15.83 ± 0.01c | 29.75 ± 0.02b | 41.16 ± 0.01a |
| Linoleic C18:2 ω6 | 60.72 ± 0.08a | 47.65 ± 0.03b | 34.88 ± 0.01c |
| γ-linolenic C18:3 ω6 | 3.30 ± 0.02b | 7.57 ± 0.01b | 1.29 ± 0.01c |
| Eicosenoic C20:1 ω9 | 0.19 ± 0.01c | 0.59 ± 0.01b | 0.89 ± 0.02a |
| α-linolenic C18:3 ω3 | 0.74 ± 0.01b | 1.80 ± 0.01a | 0.70 ± 0.01b |
| Arachidonic C20:4 ω6 | 0.21 ± 0.01c | 0.78 ± 0.01a | 0.42 ± 0.01b |
| Trycosilic C23:0 | nd | 1.58 ± 0.05a | nd |
| Eicosapentaenoic C20:5 ω3 | 0.22 ± 0.01b | 0.30 ± 0.01b | 0.89 ± 0.01a |
| Nervonic C24:1 ω9 | nd | 0.30 ± 0.01a | nd |
| Ʃ Saturated | 18.65 ± 0.05a | 11,21 ± 0,09b | 19,55 ± 0,08a |
| Ʃ Unsaturated | 81.35 ± 0.16b | 88,79± 0,12a | 80,45 ± 0,01b |
| Ʃ Monounsaturated | 16.16 ± 0.03c | 30,69 ± 0,05b | 42,27 ± 0,03a |
| Ʃ Polyunsaturated | 65.19 ± 0.13a | 58,10 ± 0,07b | 38,18 ± 0,05c |
n = 2 technological replicates, data are shown as mean ± standard deviation, QF= quinoa flour, RF= rice flour, dm = dry matter, TDF = total dietary fiber, nd = not detectable. Values on the same row with different letters and values on the same column with different superscript letters are significantly different (p ≤ 0.05).
Table 5.
Chemical quality parameters of the different shortbread samples.
| Quality parameter | CS | Q60S | |
|---|---|---|---|
| Energy value | (kcal/100g) | 466 | 446 |
| (kJ/100g) | 1975 | 1866 | |
| Moisture (% dm) | 1.56 ± 0.02b | 2.51 ± 0.09a | |
| Carbohydrates (% dm) | 73.28 ± 0.13a | 67.3 ± 1.3b | |
| Sugars (% dm) | 24.77 ± 0.22a | 25.1 ± 0.1a | |
| Ash (% dm) | 1.01 ± 0.05a | 1.09 ± 0.03a | |
| Proteins (% dm) | 7.13 ± 0.19a | 7.6 ± 0.1a | |
| Fat (% dm) | 15.99 ± 0.17a | 16.3 ± 0.6a | |
| TDF (% dm) | 1.03 ± 0.02b | 5.2 ± 0.5a | |
| aw | 0.28 ±0.01a | 0.36 ± 0.05a | |
| Spread factor | 48.89 ±0.82b | 62.50 ± 1.08a | |
| Weight loss | 1.67 ± 0.03a | 1.33 ± 0.03b | |
| Weight loss (%) | 16.06 ± 0,23a | 13.4 ± 0.2b | |
| T-Polyphenols (GA mg/g) | 1.25 ± 0.01b | 5.73 ± 0.01a | |
| ABTS (TE/g) | 0.10 ± 0.01b | 0.37 ± 0.06a | |
| DPPH (TE/g) | 25.07 ± 0.12b | 70.03 ± 0.24a | |
| FRAP (TE/g) | 2.77 ± 0.03b | 8.37 ± 0.09 | |
n = 2; data shown as mean ± standard deviation; GA = gallic acid; TE = trolox equivalents; CS = control wheat shortbread; Q60S= 60% of quinoa shortbreads, dm = dry matter, aw = water activity, TDF = total dietary fiber, values on the same row with different letters are significantly different (p ≤ 0.05).
Table 6.
Amino acids composition of control and 60% quinoa flour shortbreads.
|
AAs (mg/Kg dm) |
CS | Q60S |
| Aspartic Acid | 44.8 ± 0.1bO | 82.3 ± 6.0aL |
| Glutammic Acid | 32.5 ± 0.6bM | 239.0 ± 11.9aN |
| Asparagine | 40.0 ± 0.3aN | 31.7 ± 1.7bEFG |
| Serine | 9.6 ± 0.5bF | 30.0 ± 3.4aDEF |
| Glutamine | 22.1 ± 0.2bH | 40.2 ± 1.8aG |
| Histidine | 5.1 ± 0.3bC | 72.0 ± 3.4aI |
| Arginine | 26.9 ± 0.1bI | 217.8 ± 12.2aM |
| Glycine | 7.3 ± 0.1bD | 29.7 ± 0.9aDEF |
| Alanine | 28.0 ± 0.5bL | 59.6 ± 3.9aH |
| Tyrosine | 9.1 ± 0.5bF | 28.6 ± 1.8aCDEF |
| Threonine | 5.3 ± 0.2bC | 23.7 ± 2.6aBCDE |
| Methionine | 2.7 ± 0.1bA | 10.5 ± 0.1aA |
| Tryptophan | 21.6 ± 0.2aH | 21.0 ± 0.9aBCD |
| Valine | 13.7 ± 0.3bG | 35.4 ± 1.9aFG |
| Phenylalanine | 8.2 ± 0.3bE | 19.0 ± 0.6aABC |
| Isoleucine | 7.1 ± 0.2bD | 14.5 ± 0.7aAB |
| Leucine | 9.7 ± 0.3bF | 21.9 ± 1.3aBCD |
| Lysine | 4.0 ± 0.2bB | 23.4 ± 0.7aBCDE |
| Ʃ AAs | 297.7 ± 5.0b | 1000.3 ± 55.8a |
| Ʃ sweetness AAs | 50.2 ± 1.3bA | 143.0 ± 10.8aA |
| Ʃ bitterness AAs | 86.5 ± 2.3bB | 443.1 ± 22.7aB |
| Ʃ neutral AAs | 161.0 ± 1.4bC | 414.2 ± 22.3aB |
n = 2 technological replicates, data are shown as mean ± standard deviation, AAs = amino acids, CS = control wheat shortbread; Q60S= 60% of quinoa shortbreads, dm = dry matter, the names of essential amino acids are written in italics. Values on the same row with different letters and values on the same column with different superscript letters are significantly different (p ≤ 0.05).
Table 7.
Fatty acids composition of control and 60% quinoa flour shortbreads.
|
Fatty acids (% dm) |
CS | Q60S |
| Butyric C4:0 | 2.13 ± 0.03aI | 2.01 ± 0.05aH |
| Caproic C6:0 | 1.66 ± 0.01aG | 1.64 ± 0.01aG |
| Caprylic C8:0 | 1.13 ± 0.01aF | 1.10 ± 0.01aF |
| Capric C10:0 | 2.69 ± 0.01aL | 2.62 ± 0.01aI |
| Lauric C12:0 | 3.27 ± 0.01aM | 3.17 ± 0.02bL |
| Myristic C14:0 | 12.01 ± 0.04aP | 10.12 ± 0.08bO |
| Myristoleic C14:1 ω9 | 0.85 ± 0.01bE | 0.94 ± 0.01aE |
| Pentadecanoic C15:0 | 0.08 ± 0.01bA | 1.15 ± 0.01aF |
| Palmitic C16:0 | 31.08 ± 0.02aR | 29.51 ± 0.01bQ |
| Palmitoleic C16:1 ω7 | 1.79 ± 0.01aH | 1.57 ± 0.02bG |
| Heptadecanoic C17:0 | 0.1 ± 0.01bA | 0.58 ± 0.01aC |
| Heptadecenoic C17:1 | 0.1 ± 0.01bA | 0.24 ± 0.01aB |
| Stearic C18:0 | 10.37 ± 0.03aO | 9.16 ± 0.04bN |
| Oleic C18:1 ω9 | 25.55 ± 0.04aQ | 25.15 ± 0.13aP |
| Linoleic C18:2 ω6 | 5.14 ± 0.03bN | 8.36 ± 0.02aM |
| γ-linolenic C18:3 ω6 | 0.1 ± 0.01bA | 1.17 ± 0.01aF |
| Eicosenoic C20:1 ω9 | 0.65 ± 0.01aC | 0.12 ± 0.01bA |
| α-linolenic C18:3 ω3 | 0.77 ± 0.01bD | 0.85 ± 0.01aD |
| Behenic C22:0 | 0.10 ± 0.01aA | 0.11 ± 0.01aA |
| Eicosatrienoic C20:3 ω6 | nd | 0.11 ± 0.01A |
| Arachidonic C20:4 ω6 | 0.2 ± 0.01aB | 0.13 ± 0.01bA |
| Trycosilic C23:0 | 0.23 ± 0.01aB | 0.22 ± 0.04aB |
| Ʃ Saturated | 64.95 ± 0,20aA | 61.36 ± 0,30bD |
| Ʃ Unsaturated | 35.15± 0,14bB | 38.64 ± 0,23aC |
| Ʃ Monounsaturated | 28.94 ± 0,08aC | 28.02 ± 0,17bB |
| Ʃ Polyunsaturated | 6.21 ± 0.06bD | 10.62 ± 0.06aA |
n = 2 technological replicates, data are shown as mean ± standard deviation, CS = control wheat shortbread; Q60S= 60% of quinoa shortbreads, dm = dry matter. Values on the same row with different letters and values on the same column with different superscript letters are significantly different (p ≤ 0.05).
Disclaimer/Publisher’s Note: The statements, opinions and data contained in all publications are solely those of the individual author(s) and contributor(s) and not of MDPI and/or the editor(s). MDPI and/or the editor(s) disclaim responsibility for any injury to people or property resulting from any ideas, methods, instructions or products referred to in the content. |
© 2024 by the authors. Licensee MDPI, Basel, Switzerland. This article is an open access article distributed under the terms and conditions of the Creative Commons Attribution (CC BY) license (http://creativecommons.org/licenses/by/4.0/).
Copyright: This open access article is published under a Creative Commons CC BY 4.0 license, which permit the free download, distribution, and reuse, provided that the author and preprint are cited in any reuse.


