

Submitted:
13 October 2025
Posted:
14 October 2025
You are already at the latest version
Abstract
Traditional route optimization frameworks often suffer from "spatial blindness," ad-dressing the problem through abstract matrices devoid of geographical context, which yields suboptimal solutions in complex landscapes. To address this fundamental methodological gap, this study proposes the Iterative Score Propagation Algorithm (ISPA), a transparent, GNN-inspired framework that reframes optimization from a set of isolated points to a holistic corridor problem. The robustness and superiority of ISPA were rigorously tested against established Multi-Criteria Decision-Making (MCDM) methods (WLC, TOPSIS, VIKOR). This comparative analysis was conducted across three diverse engineering scenarios—ranging from balanced engineering (rural high-way) and cost-centric optimization (pipeline) to experience maximization (trekking trail)—and under two distinct weighting philosophies (objective Entropy and subjec-tive AHP). The holistic analysis reveals that ISPA achieves the highest final score (0.815) across all six test conditions, demonstrating both the highest overall mean per-formance and the greatest stability. Furthermore, its flexible cost function successfully modeled unconventional objectives, such as a "climbing reward," showcasing a para-digm shift from cost minimization to experience maximization. We conclude that ISPA's superior performance stems from its structural advantage in contextualizing spatial data, rather than a dependency on any specific weighting scheme. Conse-quently, this work introduces not just a novel algorithm but a new, spatially-aware approach that transforms route planning from a static calculation into a dynamic de-sign and scenario analysis tool for planners and engineers.
Keywords:
route optimization
; multi-criteria decision making (MCDM)
; geographic information systems (GIS)
; geospatial artificial intelligence (GeoAI)
; graph neural networks (GNN)
; iterative score propagation algorithm (ISPA)
; corridor design
; geomatics engineering
; path finder
1. Introduction
The design of large-scale infrastructures such as transportation networks forms the backbone of modern societal development. Initial routing decisions made during the planning phase are critical, as they irreversibly determine not only the immediate construction costs but also a project's long-term operational efficiency, maintenance strategies, and socio-environmental footprint for decades to come [1]. Consequently, identifying the optimal route is an inherently multi-dimensional spatial optimization problem at the intersection of engineering, economics, and environmental science. This requires an approach that transcends simple least-cost pathfinding to integrate a complex web of conflicting criteria, ranging from the topographic constraints of the terrain to the delicate balance of social and ecological impacts [2].
In response to this complexity, the integration of Geographic Information Systems (GIS) with Multi-Criteria Decision-Making (MCDM) has become a standard paradigm in the field [3]. Established methods such as the Analytic Hierarchy Process (AHP), TOPSIS, and VIKOR have been widely and successfully applied to systematically combine these conflicting factors for linear infrastructure planning [4,5,6]. However, despite their utility, these traditional MCDM methods share a fundamental limitation: an inherent "spatial blindness." They evaluate each potential location as an independent entity, largely ignoring the context-sensitive spatial relationships and dependencies described in Tobler’s First Law of Geography [7,8]. This often leads to the generation of fragmented and physically suboptimal routes.
In recent years, Graph Neural Networks (GNNs) have emerged as a transformative potential in geospatial artificial intelligence (GeoAI) due to their unique ability to model complex topological relationships in spatial data [9,10]. From forecasting traffic flow on existing road networks [11] to segmenting meaningful objects from 3D point clouds [12], GNNs have proven their capability to extract deep insights from diverse spatial data types. Despite these impressive achievements, a critical gap persists in the GNN literature, which this study aims to address: the overwhelming majority of current applications focus on the analysis of existing networks. The synthesis problem—where an optimal route must be designed de novo (from scratch) in a landscape where no network yet exists—remains a relatively unexplored frontier for GNNs.
While pioneering studies have begun to explore the potential of GNNs for solving classical routing problems [13], these approaches tend to employ GNNs as a learning-based "black-box" component integrated within larger, more complex frameworks involving reinforcement learning or advanced heuristics [14,15]. Although powerful, these methods often fail to meet the critical need for interpretability and transparency, which are vital in high-stakes engineering design decisions.
This study directly targets this gap by proposing a novel, hybrid computational framework that reimagines the GNN paradigm not as a black-box learning tool, but as a transparent and deterministic optimization engine. Our core contribution is the Iterative Score Propagation Algorithm (ISPA), which fuses the expert-driven logic of traditional MCDM with the spatial contextualization power of GNNs, inspired by their fundamental message-passing mechanism [16]. ISPA allows suitability scores to propagate and evolve across a graph structure before the final pathfinding, thereby enriching the cost surface with critical neighborhood information and reframing the problem from an optimization of isolated points to an optimization of a holistic corridor.
Accordingly, the primary contributions of this work are threefold:
Methodological Innovation: We introduce a hybrid methodology that integrates the strengths of proven MCDM techniques with the topological modeling capabilities of GNNs.
An Interpretable "White-Box" Model: We deliberately depart from the opaque nature of deep learning to propose a deterministic and interpretable model that meets the critical need for transparency and explainability in engineering design.
A New Application Domain for GNNs: We expand the GNN paradigm from the analysis of existing networks to the complex design task of de novo route synthesis, demonstrating the potent utility of this technology for spatial optimization.
2. Theoretical Background and Related Work
This section reviews the three fundamental methodological pillars upon which our proposed hybrid framework is built: (1) GIS-based least-cost path analysis, (2) the integration of Multi-Criteria Decision-Making (MCDM) methods and their inherent spatial limitations, and (3) the rise of Graph Neural Networks (GNNs) as a spatially-aware paradigm.
2.1. The Foundation of Route Optimization: Least-Cost Path (LCP) Analysis
The cornerstone of route optimization in Geographic Information Systems (GIS) is the Least-Cost Path (LCP) algorithm, which identifies the path of minimum cumulative cost between a start and end point. This approach, typically based on Dijkstra’s algorithm [17], operates on a raster "cost surface" where each cell is assigned a cost of traversal. While the algorithm’s strength lies in its ability to find the most efficient path across this surface, the success of LCP is entirely dependent on the quality and realism of the input cost surface. A real-world routing problem can rarely be reduced to a single cost factor (e.g., only distance or slope). This complexity has necessitated the integration of MCDM methods.
2.2. Multi-Criteria Decision-Making (MCDM) and the "Spatial Blindness" Problem
The multi-dimensional nature of route planning—encompassing engineering, economic, social, and environmental domains—requires the aggregation of multiple, often conflicting, criteria into a single composite suitability or cost surface. In response to this need, MCDM methods such as AHP [18], TOPSIS [19], and VIKOR [20] have become standard tools in the field [3]. These methods generate the composite cost surface required for LCP analysis by combining different criteria layers with weights that reflect decision-maker priorities.
However, despite operating on spatial data, these traditional MCDM methods are inherently spatially blind. They evaluate each pixel or node as a discrete, independent entity. Their decision logic operates on the attribute values of the pixels but disregards their spatial or topological relationships. This violates the fundamental principle of spatial autocorrelation [7], leading to a critical flaw: the generation of fragmented and suboptimal routes that may create inefficient or geometrically illogical connections between "islands" of high suitability.
2.3. A New Paradigm for Spatial Awareness: Graph Neural Networks (GNNs)
A potential solution to the "spatial blindness" problem of traditional methods has emerged in recent years with Graph Neural Networks (GNNs), a technology that is revolutionizing the field of geospatial artificial intelligence (GeoAI). The core strength of GNNs lies in their ability to naturally model the complex dependencies between nodes (locations) and edges (relationships) by treating data as a graph structure [9].
The key mechanism behind this capability is known as "message passing" [21]. In this process, each node iteratively aggregates information from its neighbors to update its own state. This allows a node's "awareness" to propagate beyond its immediate local neighborhood to a wider geographic context as the number of iterations increases. It is this very mechanism that offers a naturally spatially-aware analysis, in stark contrast to the point-wise approach of MCDM. The ISPA framework proposed in this study aims to distill this fundamental message-passing philosophy of GNNs into a transparent optimization engine, stripping away the "black-box" complexity of deep learning.
Building upon these theoretical foundations, the next section details our hybrid methodology, which aims to integrate the strengths and mitigate the weaknesses of these three paradigms (LCP, MCDM, and GNNs).
3. Materials and Methods
The methodology developed and applied in this study is based on an integrated computational framework comprising three main stages, as illustrated in Figure 1: (A) Data preparation, criteria definition, and standardization; (B) Multi-method suitability modeling; and (C) Network-based route optimization and evaluation. In the following subsections, each component of this framework is described in detail to ensure the scientific transparency and reproducibility of the results.
All analyses were performed using a custom-developed code package in MATLAB R2023a. In adherence to the principles of open science, the code package and sample data used in this study, corresponding to version 1.0 of the analysis, have been made publicly available and are permanently archived in Zenodo with a digital object identifier (DOI) [22].
3.1. The Framework's Foundation: Criteria, Data, and Standardization
This initial stage forms the foundation of the analytical framework, comprising the processes required to transform heterogeneous geospatial data into a standardized set of criteria layers suitable for all subsequent analyses. This stage is based on three sequential steps: the selection of an appropriate study area, the definition of meaningful evaluation criteria, and the normalization of these criteria into a comparable format.
3.1.1. Study Area and Data Preparation
To test the multi-criteria optimization strategies, a representative area of approximately 4 km² was selected in the Çatalca district of Istanbul, Turkey (Figure 2). This area presents an ideal and realistic testbed for evaluating the model's performance under diverse geographical conditions, as it features both variable topography and heterogeneous land-use types. The primary dataset for the analysis is a Digital Elevation Model (DEM), which was derived from ASTER GDEM v3 data (30 m resolution) obtained from the USGS EarthExplorer portal [23]. To ensure high local accuracy for this specific case study, other thematic criteria layers—such as environmentally sensitive areas, settlement areas, and the existing road network—were produced via manual digitization, referencing high-resolution satellite imagery and the DEM.
All spatial data were subjected to a standard preprocessing workflow using QGIS 3.16 software, including conversion to a common projection system (UTM Zone 35N, WGS84) to ensure analytical consistency.
3.1.2. Criteria Definition and Rationale
The selection of an optimal route is inherently a complex spatial decision problem that requires the simultaneous evaluation of numerous conflicting criteria [3]. Particularly in large-scale infrastructure projects, route planning necessitates an MCDM approach that integrates multi-dimensional factors such as engineering constraints, economic costs, environmental sensitivities, and social impacts [24]. Accordingly, four fundamental evaluation criteria were defined to reflect these four key domains of route optimization. The rationale for selecting each criterion and its role in the optimization problem are summarized in Table 1.
Each defined criterion was translated into a quantitative parameter layer through specific methods, which are detailed below.
Criterion 1: Slope (Engineering/Cost)
High slope values increase earthwork costs and pose risks to operational safety [6]. To ensure that the resulting route avoids not only generally steep terrain but also sudden, excessively steep segments, a "worst-case scenario" approach was adopted for parameterization. The slope parameter for each node pi (CSlope,i) was defined as the highest instantaneous percent slope between it and its k nearest neighboring nodes (), where k=5 in this study). The instantaneous slope is calculated as the ratio of the vertical elevation difference to the horizontal distance:
where is the absolute vertical difference and is the horizontal Euclidean distance.
Criterion 2: Proximity to Existing Roads (Economic)
Utilizing the existing road network significantly reduces land acquisition and construction costs [25]. To model this benefit, the shortest Euclidean distance () from each node pi to the road network (CSlope,i) was calculated. This distance was then compared against a buffer threshold (δroad = 50 m) to assign a binary parameter (CRoadProximity,i):
This binary classification grants a clear priority to the use of existing infrastructure. These 0/1 values were subsequently mapped directly to the lowest and highest suitability classes in the normalization stage (Section 3.1.3).
Criteria 3-4: Proximity to Settlements and Sensitive Areas (Social-Environmental)
Proximity to settlements can cause negative social impacts (e.g., noise), while proximity to sensitive areas can lead to environmental damage [26,27]. To model the non-linear decrease of these impacts with distance, a distance-decay function was used for both criteria [28]. This function converts the raw Euclidean distance () of a node pi from the nearest settlement (Ynearest) or sensitive area (Hnearest) into a standardized proximity cost score in the range [0, 1]:
where max(D) is the maximum distance value in the study area, and α is a decay factor controlling the rate of impact diffusion, set to 0.5 in this study. This formulation assigns a cost approaching 1 (highest cost) to nodes immediately adjacent to the features and a cost approaching 0 (lowest cost) to the most distant nodes, thereby encouraging the optimization process to avoid not only the features themselves but also their surrounding "impact halos."
3.1.3. Normalization: From Raw Parameters to Standardized Suitability Scores
The parameter layers generated in the previous section possess heterogeneous units and scales (e.g., percentages for slope, meters for distance, binary values for road proximity). To enable their meaningful aggregation within Multi-Criteria Decision-Making (MCDM) methods, a normalization step is mandatory to convert them into a common, dimensionless suitability scale.
While a direct linear min-max normalization is a common approach, it can be sensitive to outliers and, more importantly, often fails to capture the non-linear nature of suitability, where, for instance, the impact of slope may increase dramatically after a certain threshold. To overcome these limitations, this study adopted a more robust, two-step normalization approach grounded in the principles of fuzzy reclassification [29,30].
The first logical step of this process is to define the directional impact of each criterion on the planning objective. Accordingly, each criterion was classified as either a 'Benefit' or a 'Cost' criterion. For Cost criteria (e.g., Slope, Proximity to Settlements), suitability decreases as the raw value increases. For Benefit criteria (e.g., Proximity to Roads, where a value of 1 is a benefit over 0), suitability increases with the raw value. This fundamental classification guides the following two-step standardization process:
1- Expert-Based Reclassification (Fuzzification): In the first step, each parameter layer was reclassified into a five-level suitability scale ranging from 1 (very low suitability) to 5 (very high suitability), using expert-defined breakpoints guided by the Benefit/Cost logic. For instance, for Slope, a Cost criterion, low raw values (e.g., 0–2%) were assigned to the highest suitability class (5), while high raw values (e.g., >12%) were assigned to the lowest class (1). This expert-based process transforms the heterogeneous parameter layers into a set of homogeneous and comparable suitability maps where each node's value represents a clear preference level.
2- Linear Scaling: In the second step, to ensure full computational compatibility with the subsequent MCDM methods, these discrete 1–5 class scores (ClassScoreij) were linearly scaled to a continuous [0, 1] range, where 1 represents the highest suitability and 0 represents the lowest. This was achieved using the following formula:
This two-step process—initiated by the Benefit/Cost definition and followed by expert-based reclassification—ensures that the input data for the suitability analysis is not only mathematically comparable but also based on a meaningful, qualitative interpretation of each criterion's impact. The resulting standardized suitability maps (x') form the consistent and fundamental input for the next stage of the methodology.
3.2. Multi-Method Suitability Modeling
While the standardized suitability maps (x') produced in the previous stage represent the spatial distribution of each criterion, they do not account for the relative importance of these criteria in the decision problem. This stage focuses on aggregating these individual layers into final, composite suitability surfaces under a defined weighting scheme.
The primary objective of this study is to benchmark the performance of our proposed Iterative Score Propagation Algorithm (ISPA) against established MCDM methods. To enhance the robustness and comprehensiveness of this comparison, a dual-stream parallel analysis was designed, founded on two different weighting philosophies. This structure allows us to test both the performance of different aggregation algorithms (WLC, TOPSIS, VIKOR, and ISPA) and the influence of the weighting philosophy (objective vs. subjective) on the final outcome in an isolated manner. The two parallel analysis streams are structured as follows:
Objective Analysis Stream (wobj): Criterion weights are objectively derived from the inherent structure of the data itself using the Shannon's Entropy method. This single, common weight vector is used to provide a fair, data-driven comparison of the four aggregation/scoring methods.
Subjective Analysis Stream (wsubj): Criterion weights are derived using the Analytic Hierarchy Process (AHP) to simulate expert judgment. This subjective weight vector is then fed into the same four aggregation methods to test their behavior under an expert-driven scenario.
The following subsections first detail these two weighting approaches and then describe the aggregation methods that operate under these distinct philosophies.
3.2.1. Criteria Weighting: Subjective and Objective Philosophies
The aggregation of suitability maps requires a set of weights that define the relative importance of each criterion. As the choice of weights can significantly impact the final result, this study employs both subjective and objective weighting methods to enable a comprehensive sensitivity analysis [31].
To integrate expert knowledge and project-specific priorities into the decision model, the Analytic Hierarchy Process (AHP), developed by Saaty [18], was used. AHP is a powerful MCDM technique that transforms qualitative judgments from a decision-maker into quantitative weights through a series of structured pairwise comparisons.
The process begins with the construction of an n × n pairwise comparison matrix, A, where n is the number of criteria. Each element aij in the matrix represents the quantified judgment of the decision-maker on the relative importance of criterion i over criterion j, based on Saaty's fundamental 1–9 scale. From a consistent comparison matrix, the criterion weight vector (wsubj) is calculated as the principal eigenvector corresponding to the largest eigenvalue () of the matrix:
To ensure the reliability of the derived weights, the consistency of the pairwise judgments is evaluated using the Consistency Ratio (CR). A CR value of 0.10 or less is considered acceptable, indicating that the judgments are consistent [32]. The CR is calculated as:
where RI is the Random Consistency Index, a pre-calculated value dependent on the matrix size n. The resulting vector, wsubj, constitutes the weight set used in the subjective analysis stream.
To provide a data-driven alternative to the subjectivity of AHP and eliminate decision-maker bias, the Shannon's Entropy Weight Method (EWM) was implemented [33]. Derived from information theory, the fundamental principle of EWM is that a criterion exhibiting more spatial variation provides more distinguishing information and should therefore receive a higher weight [34].
The computational process begins by normalizing the standardized decision matrix (x'). Subsequently, the entropy value (Ej) for each criterion j, which measures its degree of uncertainty, is calculated as follows:
where Pij is the normalized score for node i under criterion j, and m is the total number of nodes. A low entropy value signifies high information content. The degree of divergence, or information content, (dj) is defined as . Finally, the final objective weight for each criterion j () is found by:
The two distinct weight vectors defined in this section ( ve ) form the basis for the two parallel analysis streams and serve as inputs for the aggregation methods detailed in the next section.
3.2.2. Conventional MCDA Approaches for Suitability Surface Generation
The subjective () and objective () weight vectors defined in the previous section are processed by four parallel aggregation/scoring methods to generate the final suitability surfaces. Each method is executed separately under both the objective and subjective analysis streams, yielding a total of eight distinct suitability surfaces for each scenario. These methods utilize the input weight vector () as an importance coefficient within their unique mathematical structures.
Weighted Linear Combination (WLC): As the most fundamental aggregation technique, WLC calculates the final suitability score () for each node as the weighted sum of its suitability scores across all criteria [3]:
This method operates on a fully compensatory strategy, where poor performance on one criterion can be offset by good performance on another. In this study, WLC serves a dual role: (1) when combined with objective Entropy weights, it acts as a baseline model for the other complex methods, and (2) when combined with subjective AHP weights, it constitutes the suitability mapping step of the widely known AHP-LCP approach.
TOPSIS (Technique for Order of Preference by Similarity to Ideal Solution): This distance-based method ranks each node based on its simultaneous proximity to a theoretical "Positive Ideal Solution" (PIS—the best possible score on every criterion) and distance from a "Negative Ideal Solution" (NIS—the worst score) [19]. The weights () are used to scale the Euclidean distances to these ideal solutions. The final suitability score () represents the relative closeness to the ideal solution, where a score closer to 1 indicates a higher preference.
VIKOR (VlseKriterijumska Optimizacija I Kompromisno Resenje): Designed for problems with conflicting criteria, VIKOR identifies the best "compromise solution" [20]. Uniquely, it evaluates a node's proximity to the ideal solution using two distinct metrics simultaneously: group utility (Si), representing the average weighted regret, and individual regret (Ri), representing the maximum weighted regret for any single criterion. This dual focus ensures that the selected alternative is not only good on average but also avoids any disastrously poor performance in any critical area. The two metrics are combined into a final VIKOR compromise index (Qi), where a lower value indicates a better solution.
Although these three methods are powerful and established approaches in route optimization, they share a common fundamental limitation: they evaluate each location (node) independently of its neighbors, i.e., in a spatially blind manner. This limitation provides the core motivation for the development of the ISPA framework, presented in the next section.
3.2.3. The Proposed ISPA Framework for Spatially-Aware Suitability Modeling
A fundamental limitation of conventional MCDM methods is their disregard for Tobler's First Law of Geography [7], which states that nearby entities are more related than distant ones. These methods treat each location (node) in isolation, leading to a "spatial blindness" that can produce fragmented and unrealistic suitability maps. To address this methodological gap, this study develops the Iterative Score Propagation Algorithm (ISPA), a novel framework designed to explicitly model these spatial dependencies.
The core philosophy of ISPA is based on the premise that the suitability of a location depends not only on its intrinsic attributes but also on its surrounding geographic context. To implement this philosophy, we draw inspiration from the "message passing" principle of Graph Neural Networks (GNNs), where nodes iteratively update their states by aggregating information from their neighbors [21,34]. Instead of implementing a complex GNN model, ISPA distills the essence of this philosophy into a computationally efficient and non-learning-based spatial smoothing algorithm. Its purpose is to contextualize the initial "raw" and spatially noisy suitability scores through structured local interactions, thereby generating spatially coherent and meaningful "suitability corridors."
The ISPA workflow consists of the following steps:
Determination of Initial Suitability Score: Before spatial propagation can begin, ISPA requires a baseline suitability score for each node. To generate this initial map, the most fundamental aggregation technique, Weighted Linear Combination (WLC), is used. The initial state of each node () is set to the WLC suitability score (), calculated using the weight vector (wj) from the corresponding analysis stream (objective or subjective). This approach provides ISPA with a critical flexibility: it can initiate the spatial propagation process from either a purely data-driven (Entropy-weighted) or an expert-driven (AHP-weighted) foundation.
Iterative Score Propagation: For a specified number of iterations (K), the score of each node is updated to incorporate the influence of its neighbors. This update rule is mathematically analogous to the propagation rule of Graph Convolutional Networks (GCNs) [16]. The score of a node i at iteration k+1 () is calculated as a weighted average of its own score from the previous step () and the mean score of its neighbor set Ni:
where α is a smoothing factor that controls the balance between a node's existing information and the influence of its neighbors (set to 0.5 in this study). The neighbor set Ni is defined by a predefined search distance dmax. The number of iterations, K, determines the algorithm's spatial receptive field; a higher K value allows information to propagate over longer distances.
This iterative process effectively acts as a low-pass spatial filter [35], smoothing the influence of isolated "outlier" high-score nodes (spatial noise) while reinforcing the scores of nodes within consistently suitable geographic "regions" or "corridors." Ultimately, ISPA provides a fundamental advantage over traditional methods by promoting the selection of routes that pass through holistically suitable corridors, rather than merely connecting discrete points of high suitability.
3.3. Network-Based Optimization and Route Evaluation
This final stage of the methodological framework transforms the numerous abstract suitability surfaces, generated from different weighting philosophies and aggregation logics, into tangible and optimal route alternatives. This is accomplished through a network-based optimization process that identifies the path of minimum cumulative cost on each surface. The stage concludes with a quantitative evaluation framework that allows for the systematic comparison of the routes produced.
3.3.1. Graph Construction with Engineering Constraints
The foundation of the pathfinding analysis is the conversion of the terrain into a discrete network graph, G = (V, E), where the set of nodes V represents potential locations for the route, and the set of edges E represents feasible movements between adjacent nodes. The edge set (E) is structured under two critical constraints:
Neighborhood Definition: An edge is initially considered only between nodes that fall within a predefined Euclidean distance of each other (dmax). This establishes a neighborhood structure that ensures spatial connectivity across the terrain while maintaining computational efficiency.
Feasibility Filtering (Hard Constraint): Realistic planning must eliminate geometrically or technically infeasible route segments from the outset [36]. Therefore, our framework imposes a non-negotiable, slope-based engineering constraint. If the slope of any potential segment between two nodes (pi, pj) exceeds the maximum permissible slope (αmax), that segment is deemed "infeasible," and the corresponding edge is explicitly removed from the edge set (E). This hard constraint guarantees that the search space for optimization is restricted to only physically constructible paths.
3.3.2. Multi-Layered Cost Function and Pathfinding Algorithm
The core of the optimization lies in defining the cost of traversing each edge (Cij) in the constructed graph. In this study, we developed a multi-layered cost function that moves beyond simple distance metrics to integrate spatial, parametric, and operational factors into a single comprehensive cost value:
Each component of this function addresses a different aspect of the optimization problem:
D(pi, pj) (Base Cost): The 3D Euclidean distance between nodes represents the fundamental cost of travel. This ensures that, all other conditions being equal, the algorithm naturally prefers shorter paths.
Psuitability,ij (Suitability Penalty): This term models the parametric penalty derived from the MCDM analysis. It is calculated from the average final suitability score of the nodes at both ends of the edge () and is scaled by an impact factor, λ:
The λ factor amplifies the penalty for traversing areas of low suitability, forcing the algorithm to adhere more strictly to the high-suitability corridors.
Poperational,ij (Operational Penalty/Reward): This term incorporates the asymmetric nature of travel in sloped terrain. To model this direction-dependent cost [37,38,39,40], a soft constraint, the βuphill factor, is applied. This factor is only activated when there is a positive change in elevation (Zj>Zi):
A positive value for βuphill signifies a penalty (e.g., increased fuel consumption), while a negative value can represent a reward (e.g., the satisfaction of reaching a scenic peak on a trekking trail). This parameter is critical to the framework's flexibility and its ability to adapt to different scenarios.
Using the constructed graph and the edge costs defined by Equation (12), Dijkstra's algorithm [17] was implemented to find the optimal path that minimizes the cumulative cost between the start and end nodes for each suitability surface.
3.3.3. Quantitative Route Evaluation Metrics
To ensure an objective and systematic comparison of the generated route alternatives, the following quantitative performance metrics were calculated for each path. These metrics were designed to evaluate the routes according to different strategic priorities:
Algorithmic Cost: The total cumulative cost of the route as calculated by the multi-layered cost function (Equation (12)). It reflects how well a route adheres to the defined optimization model.
Total 3D Length (m): The true physical length of the route, accounting for changes in elevation. It is the primary indicator of construction and travel time costs.
Mean and Maximum Slope (%): These metrics evaluate the topographical profile and geometric difficulty of the route. The maximum slope is a critical indicator of safety and feasibility.
Total Ascent (m): The cumulative positive elevation gain along the route. It serves as a strong proxy for the total energy expenditure required to traverse the path.
Distance in Unsuitable Terrain (m): A novel metric designed to quantify a method's risk-aversion strategy. It measures the distance a route travels through nodes defined as "unsuitable" (i.e., with a final suitability score below the global average).
These metrics form the basis for the comparative analysis presented in the Results section, enabling an in-depth discussion of each method's performance and strategic tendencies.
3.3.4. Holistic Performance and Robustness Evaluation Framework
To comprehensively evaluate the overall performance of the methods across numerous routes generated under different scenarios and weighting philosophies, a multi-step evaluation framework was developed. This process transforms the individual route metrics into high-level scores that reflect the overall effectiveness and stability of the methods.
Step 1: Within-Scenario Normalization of Performance Metrics. First, each quantitative metric defined in Section 3.3.3 is normalized separately within each test condition (e.g., Highway scenario, Entropy weights). This "within-scenario" normalization evaluates a method's performance relative to the other methods in that specific test, bringing all metrics to a common [0, 1] scale, where 1 represents the best performance.
Step 2: Per-Test Performance Score (Ptest) Calculation. For each test condition, a single Per-Test Performance Score (Ptest) is calculated by averaging all the normalized metrics. This score summarizes a method's overall success in that specific test.
Step 3: Overall Mean Performance (Pavg) Calculation. Each method's Overall Mean Performance (Pavg) across all test conditions (6 tests in total: 3 scenarios × 2 weighting philosophies) is calculated by averaging all its Ptest scores. This metric indicates how effective a method is on average.
Step 4: Performance Stability (Stdperf) and Stability Score (Sstability) Calculation. A method's robustness is measured by its performance consistency across different test conditions. For this purpose, the standard deviation of a method's set of Ptest scores (Stdperf) is calculated. A lower standard deviation signifies higher stability. To convert this "cost" metric (where lower is better) into a Stability Score (Sstability) on a [0, 1] scale, the following min-max normalization formula is used:
This formula assigns a score of 1 to the most stable method (lowest standard deviation) and 0 to the least stable (highest standard deviation).
Step 5: Final Score (Sfinal) Calculation. Finally, to determine the overall ranking of the methods, the Overall Mean Performance and the Stability Score are combined into a single Final Score (Sfinal) using equal weighting (w=0.5):
This final score provides a holistic measure that balances how effective a method is with how consistently it performs. These aggregated metrics form the basis for the comparative analyses presented in the Results section, which are structured first separately (for objective and subjective analyses) and then holistically for the final synthesis.
4. Results
To empirically validate the methodological framework detailed in Section 3 and to test the performance of the proposed ISPA approach, a series of computational experiments were conducted on a real-world landscape in Çatalca, Istanbul. This section systematically presents the results of these experiments. The analysis is structured around two primary analytical axes: (1) the performance of the different aggregation and scoring logics (WLC, TOPSIS, VIKOR, and ISPA), and (2) the influence of the different weighting philosophies (objective Entropy vs. subjective AHP) on the final outcomes.
4.1. Experimental Setup
To ensure the scientific validity and fairness of the comparative analysis, the experiments were designed around two parallel analysis streams:
Objective Analysis Stream: This serves as the primary comparison, where criterion weights were objectively derived from the inherent structure of the data using Shannon's Entropy. This common and objective weight set was used to benchmark the performance of the four aggregation/scoring methods (WLC, TOPSIS, VIKOR, and ISPA) on a fair, data-driven baseline.
Subjective Analysis Stream: This serves as a sensitivity analysis, where criterion weights were derived using the Analytic Hierarchy Process (AHP) to simulate expert judgment. This subjective weight set was again fed into the same four methods to test their behavior under an expert-driven scenario.
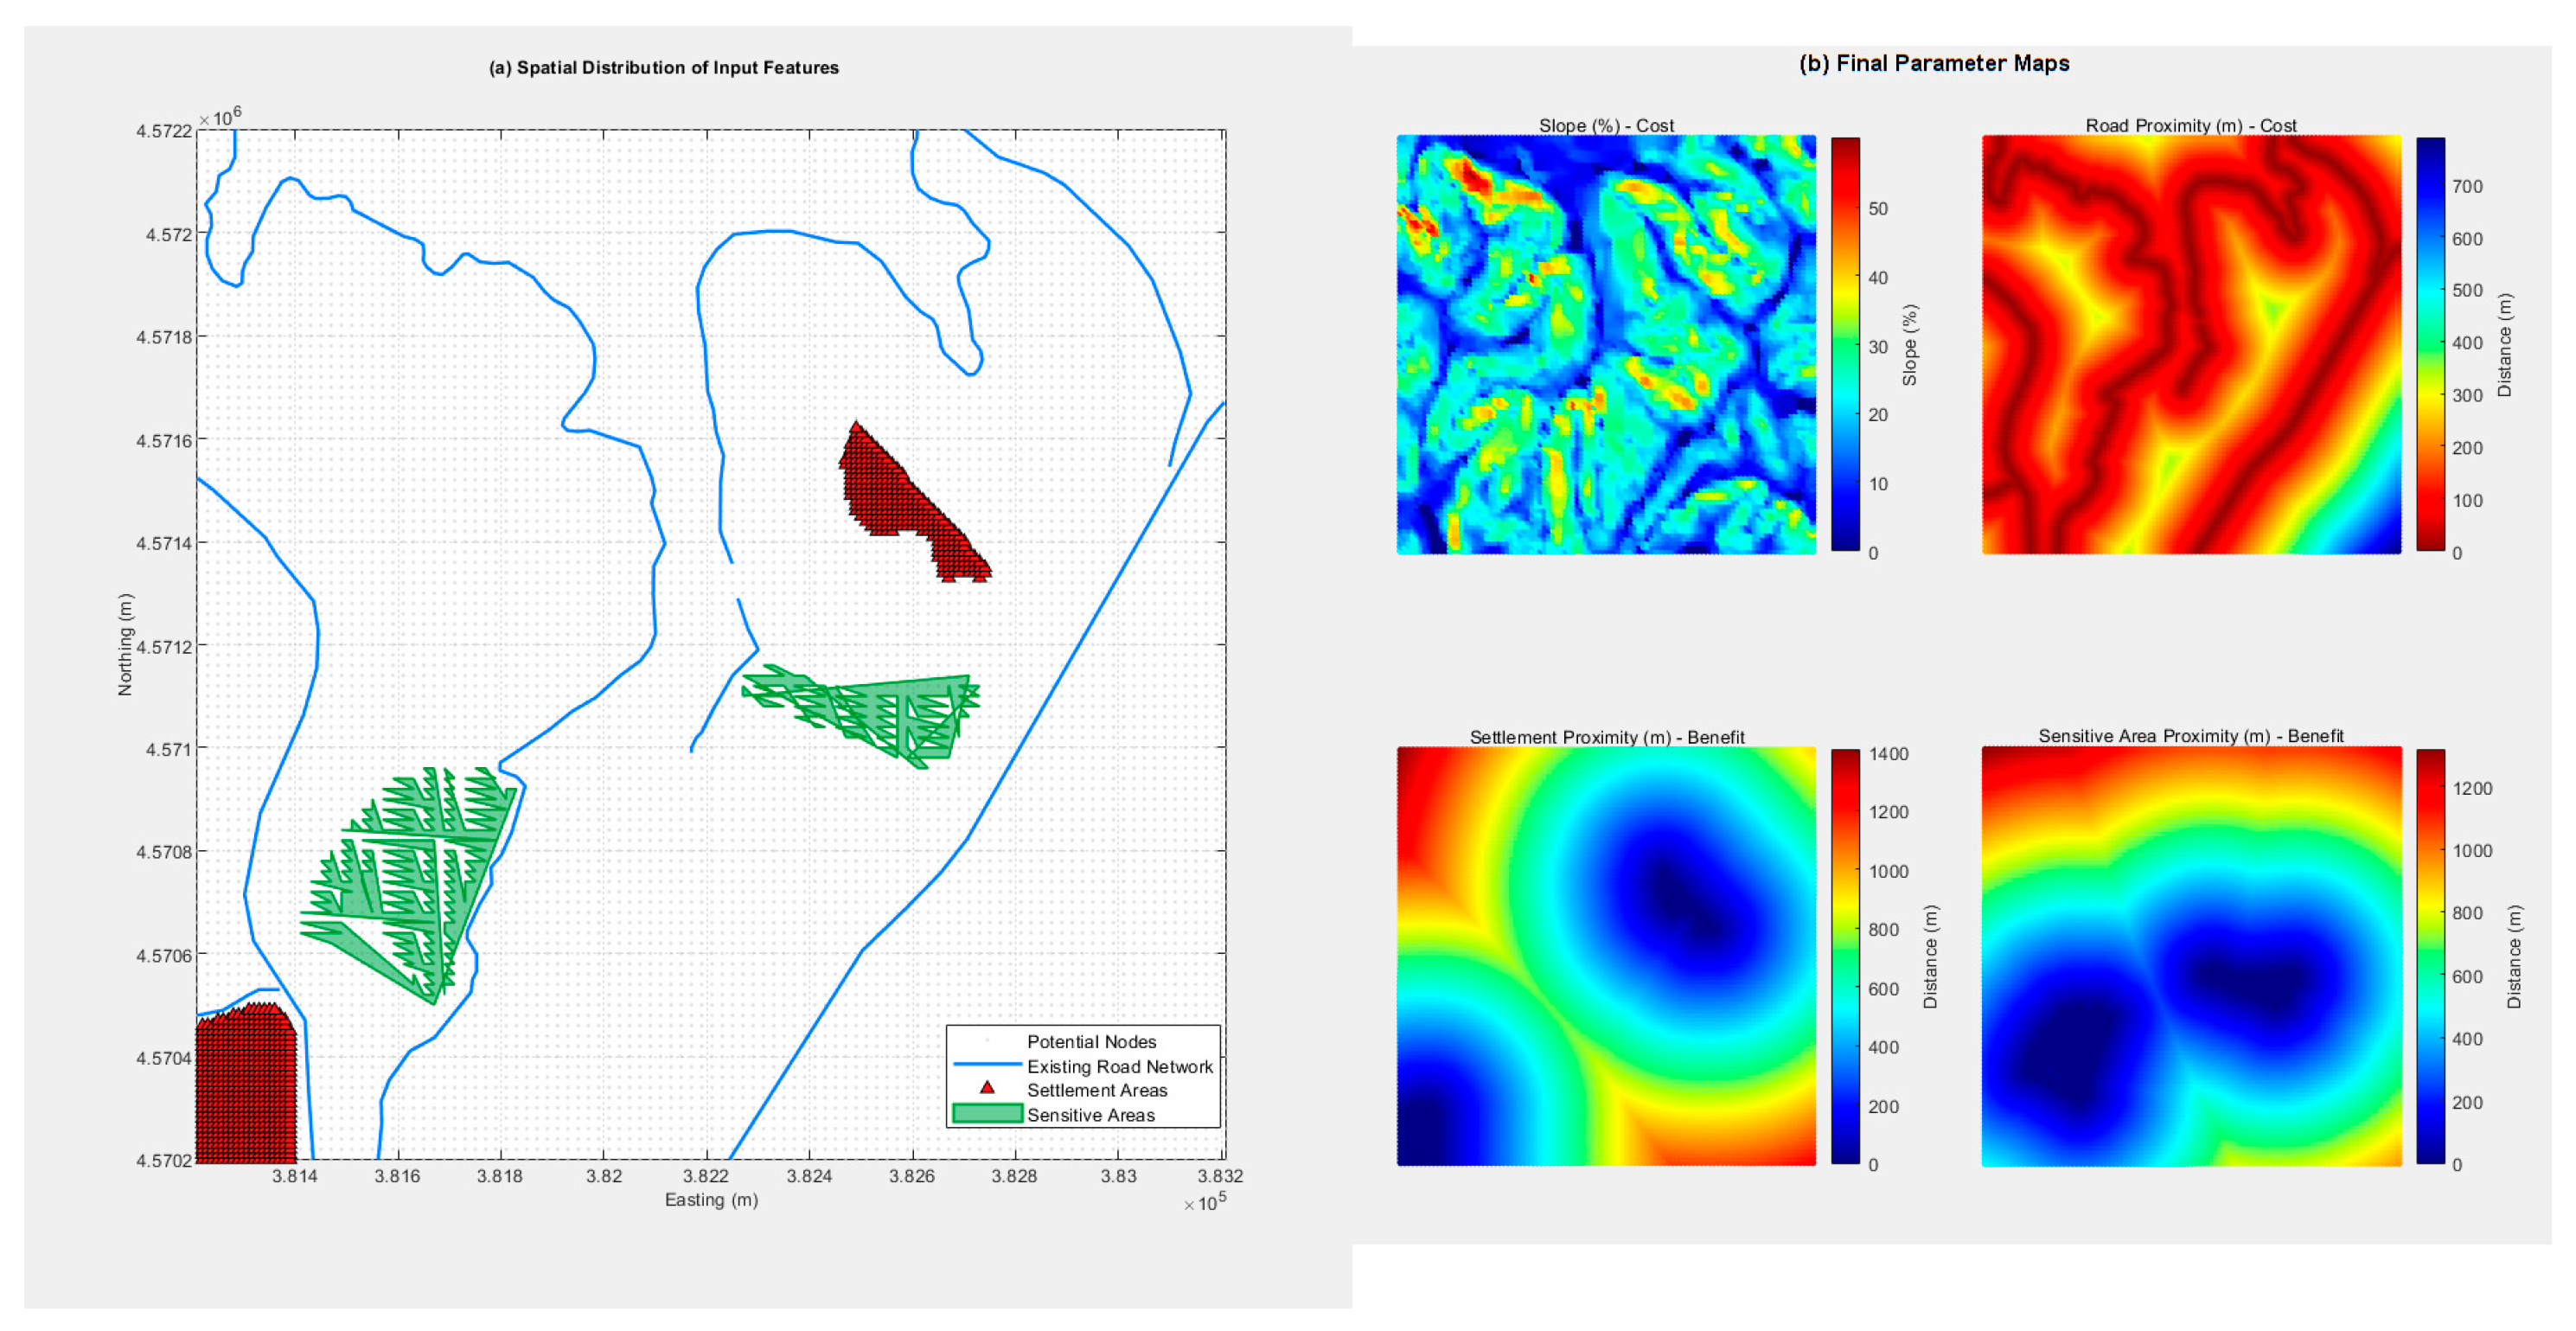
All experiments were conducted within the study area detailed in Section 3.1.1, using the same start and end nodes to ensure comparability (Figure 2). The four primary criteria layers (Slope, Proximity to Roads, Proximity to Settlements, and Proximity to Sensitive Areas) that serve as the fundamental inputs for the analysis are displayed in Figure 3.
Figure 2.
The study area located in the Çatalca district of Istanbul, Turkey. The inset map shows its regional context, while the main panel displays the Digital Elevation Model (DEM) of the 4 km² testbed, highlighting its variable topography.
Figure 2.
The study area located in the Çatalca district of Istanbul, Turkey. The inset map shows its regional context, while the main panel displays the Digital Elevation Model (DEM) of the 4 km² testbed, highlighting its variable topography.
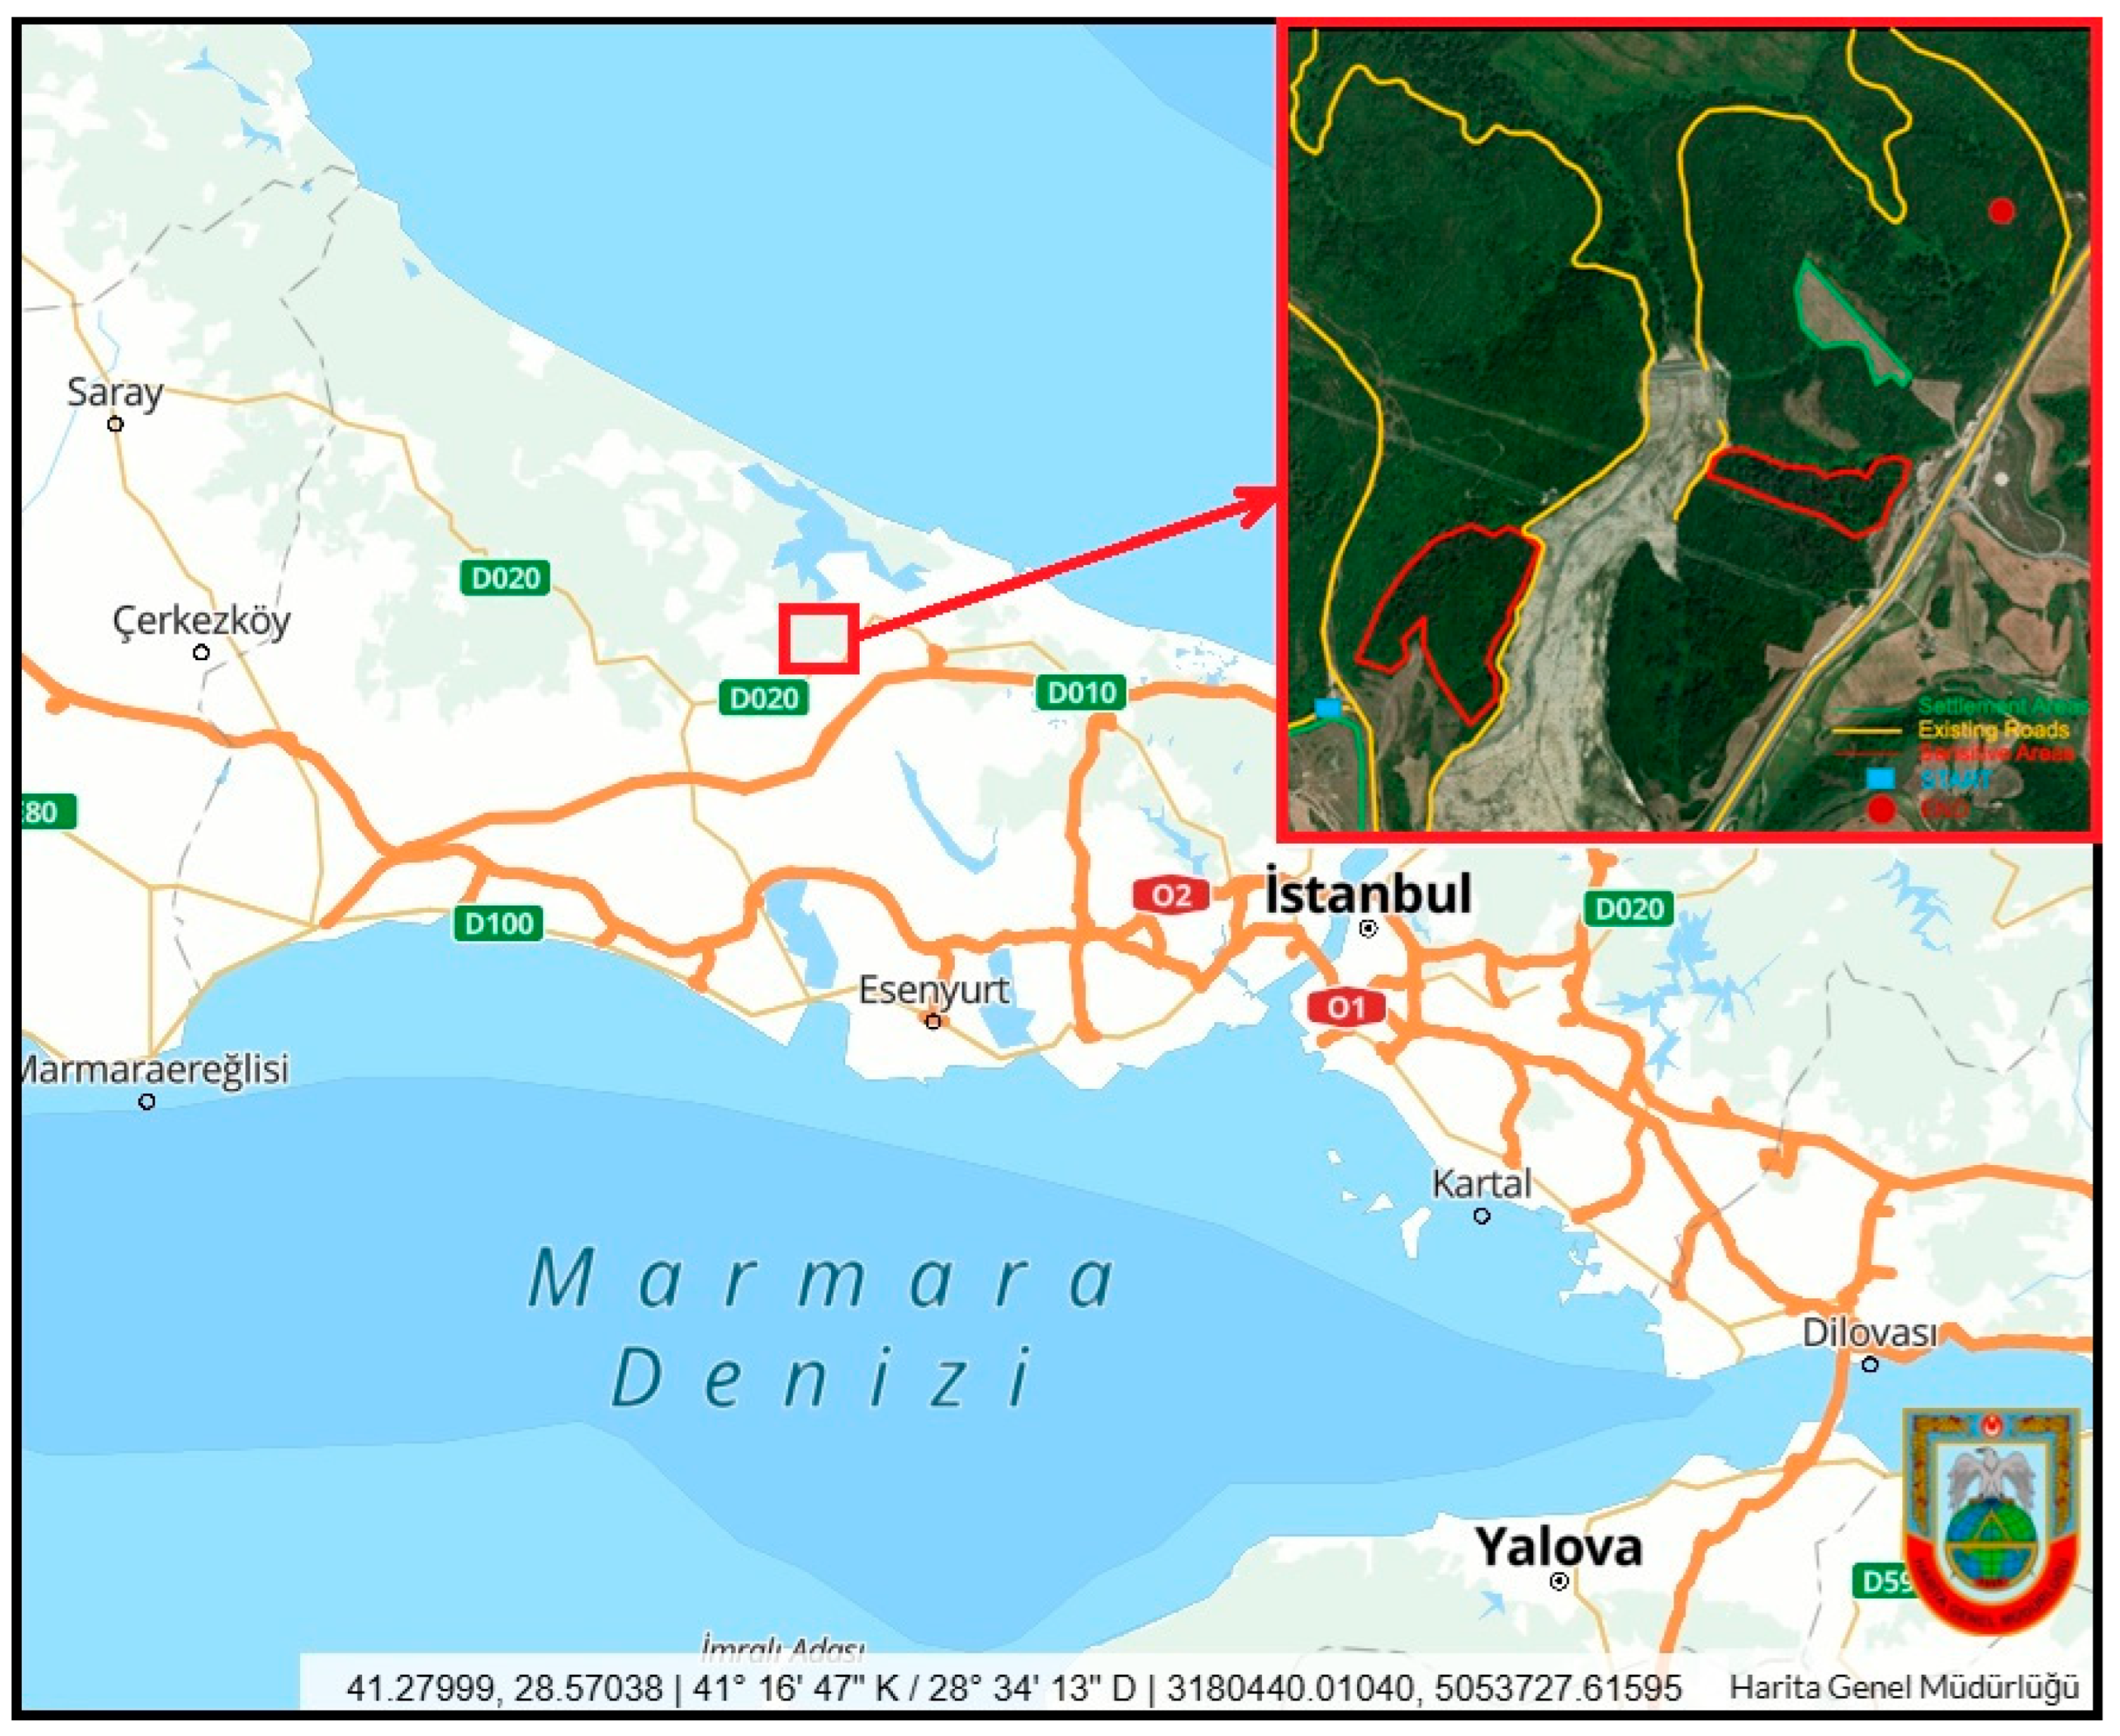
Figure 3.
The four fundamental criteria layers used in the analysis. (a) The spatial distribution of the raw parameter layers: Slope (%), Proximity to Roads (m), Proximity to Settlements (m), and Proximity to Sensitive Areas (m). (b) The corresponding standardized suitability maps after the normalization process (Section 3.1.3), where brighter colors (approaching 1) indicate higher suitability.
Figure 3.
The four fundamental criteria layers used in the analysis. (a) The spatial distribution of the raw parameter layers: Slope (%), Proximity to Roads (m), Proximity to Settlements (m), and Proximity to Sensitive Areas (m). (b) The corresponding standardized suitability maps after the normalization process (Section 3.1.3), where brighter colors (approaching 1) indicate higher suitability.
4.2. Multi-Scenario Analysis: Definitions and Parametric Calibration
To test the adaptability, flexibility, and robustness of the methods against diverse problem types, the two parallel analysis streams defined in Section 4.1 (objective and subjective) were repeated under three distinct scenarios representing different engineering objectives. Each scenario was designed to fundamentally alter the nature of the optimization problem, thereby measuring the problem-specific adaptability of the applied methods.
The scenarios are defined as follows:
Scenario 1: Rural Highway (Balanced Optimization): A classic engineering problem that aims to strike a balance between construction costs, operational efficiency, and traffic safety.
Scenario 2: Pipeline Corridor (Cost-Centric Optimization): A single-objective problem where the absolute priority is the minimization of construction costs and geotechnical risks.
Scenario 3: Trekking Trail (Experience-Oriented Optimization): A subjective problem that challenges conventional optimization logic, aiming not to minimize cost, but to maximize the aesthetic and recreational value for the user.
To model the unique nature of these scenarios, deliberate calibrations were made across three fundamental layers of the methodology: (1) defining the Benefit/Cost direction of the criteria, (2) customizing the physical and algorithmic parameters that control the model's behavior, and (3) adjusting the subjective AHP weights according to the scenario's priorities.
The first of these calibrations, the reinterpretation of whether a criterion is a Benefit (B) or a Cost (C) according to each scenario's goal, is summarized in Table 2.
2. Calibration of Model Parameters: To meet the physical and operational requirements of each scenario, the physical and algorithmic parameters that control the model's behavior were specifically calibrated. Table 3 details this deliberate calibration and provides the rationale behind each parameter choice.
3. Derivation of Subjective Weights: Finally, to drive the subjective analysis stream, expert judgments reflecting the unique priorities of each scenario were converted into quantitative weights using the Analytic Hierarchy Process (AHP).
Table 4 presents the pairwise comparison matrices constructed for each scenario and the resulting subjective weight vectors (wsubj) derived from them. The table quantitatively demonstrates how different planning objectives lead to radical shifts in criteria priorities:
In the Highway scenario, priority is focused on engineering and cost factors (58% for Slope, 25% for Proximity to Roads).
In the Pipeline scenario, Proximity to Roads, which has no operational significance, is almost disregarded (5%), while priority shifts to the criteria representing geotechnical risk (Slope and Proximity to Sensitive Areas).
In the Trekking Trail scenario, the paradigm shifts entirely, with the overw
4.3. Comparative Analysis: Results from the Objective Weighting Stream
This section presents the results from the primary comparative analysis, which was conducted using the objective Entropy weights. The aim is to provide a fair, data-driven benchmark of the performance of the four methods (WLC, TOPSIS, VIKOR, and ISPA) when the criterion weights are held constant. This allows for an isolated assessment of how their different aggregation and scoring logics influence the final route selection. The analysis was repeated for all three engineering scenarios.
4.3.1. Scenario 1: Rural Highway (Objective Approach)
The final suitability surfaces generated by the four methods are comparatively presented in Figure 4. An analysis of these surfaces reveals distinct methodological signatures. Both the WLC and TOPSIS surfaces exhibit sharp boundaries and high-contrast regions, reflecting the influence of the high-weight criteria. The surface produced by VIKOR displays a more pessimistic pattern, a consequence of its compromise-seeking nature. Most notably, the surface generated by ISPA is significantly smoother and forms more spatially coherent "suitability corridors" compared to the others, a direct result of the score propagation among neighboring nodes.
Optimal Routes and Performance Metrics: The four optimal routes derived from these distinct suitability surfaces are visualized in Figure 5, while their quantitative performance metrics, calculated according to the framework in Section 3.3.3, are summarized in Table 5.
Findings: The results for the balanced optimization scenario show a dominant performance by ISPA, which delivered the shortest route (3,380 m), the lowest total ascent, and a highly competitive algorithmic cost. VIKOR, in contrast, achieved its short route at the cost of traversing the most unsuitable terrain.
4.3.2. Scenario 2: Pipeline Corridor (Objective Approach)
Figure 6.
The four optimal route alternatives for the Pipeline Corridor scenario (objective analysis), visualized on (a) a 2D topographic map and (b) a 3D terrain model.
Figure 6.
The four optimal route alternatives for the Pipeline Corridor scenario (objective analysis), visualized on (a) a 2D topographic map and (b) a 3D terrain model.
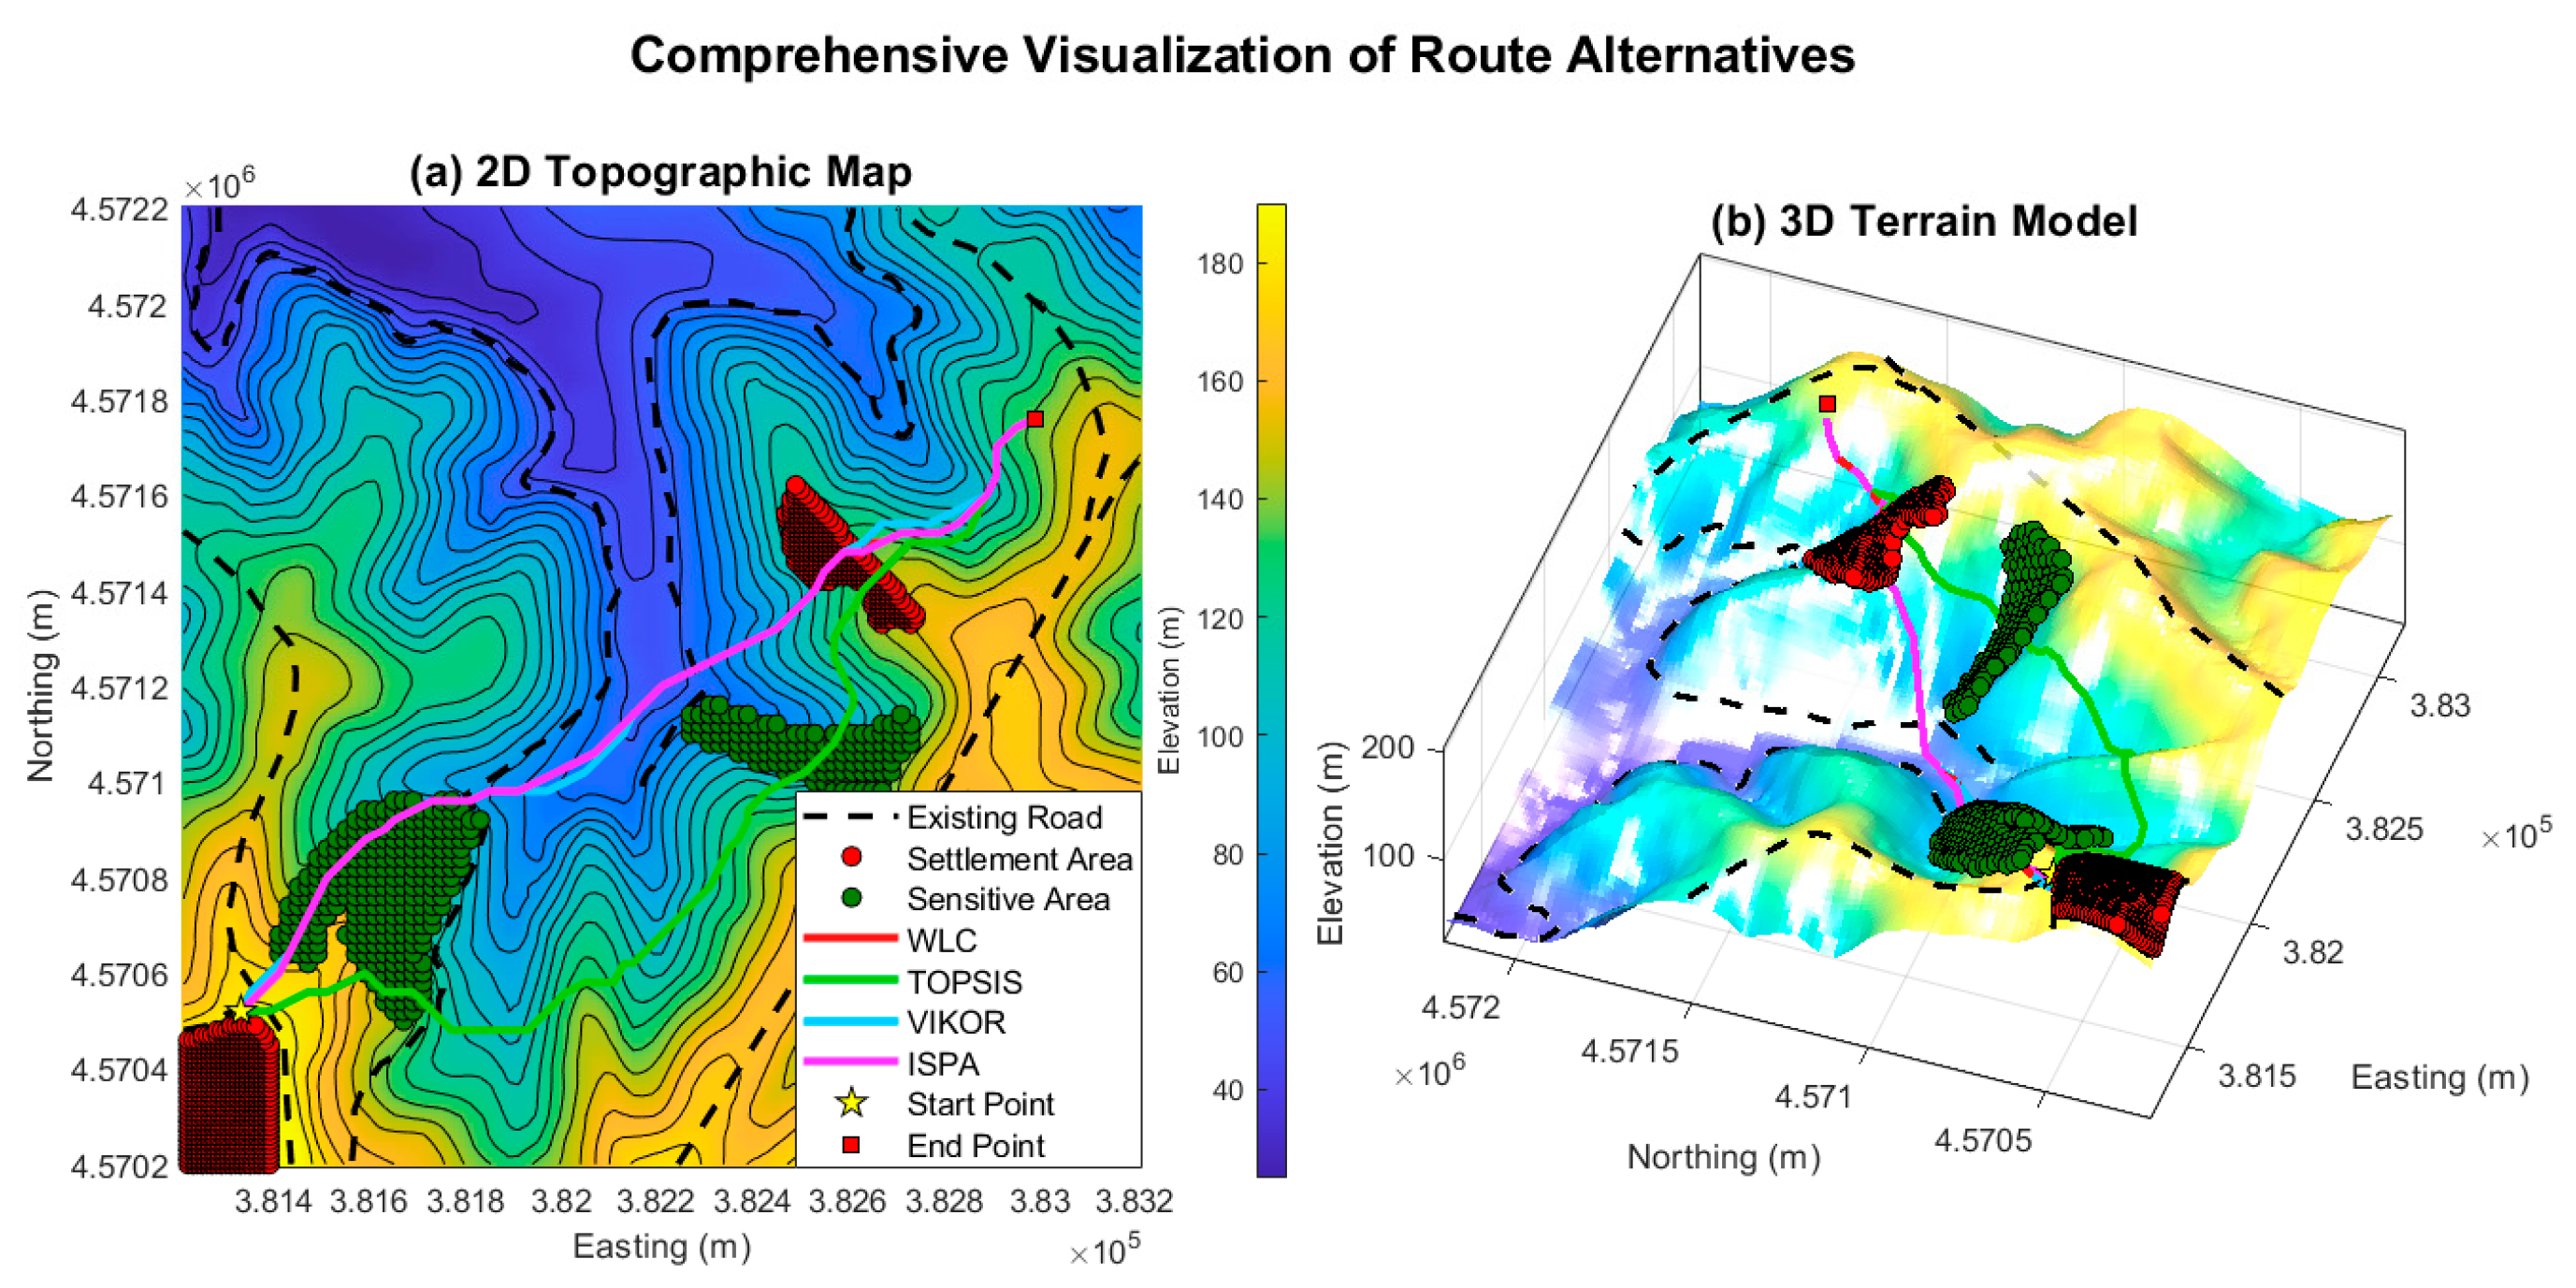

Table 6.
Performance metrics for the optimal routes in Scenario 2 (Pipeline Corridor, Objective Analysis).
Table 6.
Performance metrics for the optimal routes in Scenario 2 (Pipeline Corridor, Objective Analysis).
| Method | Algorithmic Cost | Total 3D Length (m) | Mean Slope (%) | Max. Slope (%) | Total Ascent (m) | Unsuitable Dist. (m) |
| WLC | 7,825.16 | 2,237.49 | 12.48 | 18.86 | 116.55 | 1,739.16 |
| TOPSIS | 7,557.35 | 2,535.06 | 13.52 | 19.00 | 148.93 | 901.39 |
| VIKOR | 7,807.71 | 2,233.65 | 12.27 | 18.86 | 116.08 | 1,730.75 |
| ISPA | 7,443.05 | 2,222.18 | 12.72 | 18.86 | 116.55 | 1,511.73 |
Findings: In this cost-centric scenario where minimizing length was the absolute priority, ISPA once again delivered the optimal solution by producing the shortest physical path (2,222 m) and the lowest algorithmic cost. VIKOR and WLC adopted a nearly identical, slightly less efficient strategy, while TOPSIS produced a significantly longer and less suitable route, failing to meet the primary objective of the scenario
4.3.3. Scenario 3: Trekking Trail (Objective Approach)
Figure 7.
The four optimal route alternatives for the Trekking Trail scenario (objective analysis), visualized on (a) a 2D topographic map and (b) a 3D terrain model.
Figure 7.
The four optimal route alternatives for the Trekking Trail scenario (objective analysis), visualized on (a) a 2D topographic map and (b) a 3D terrain model.
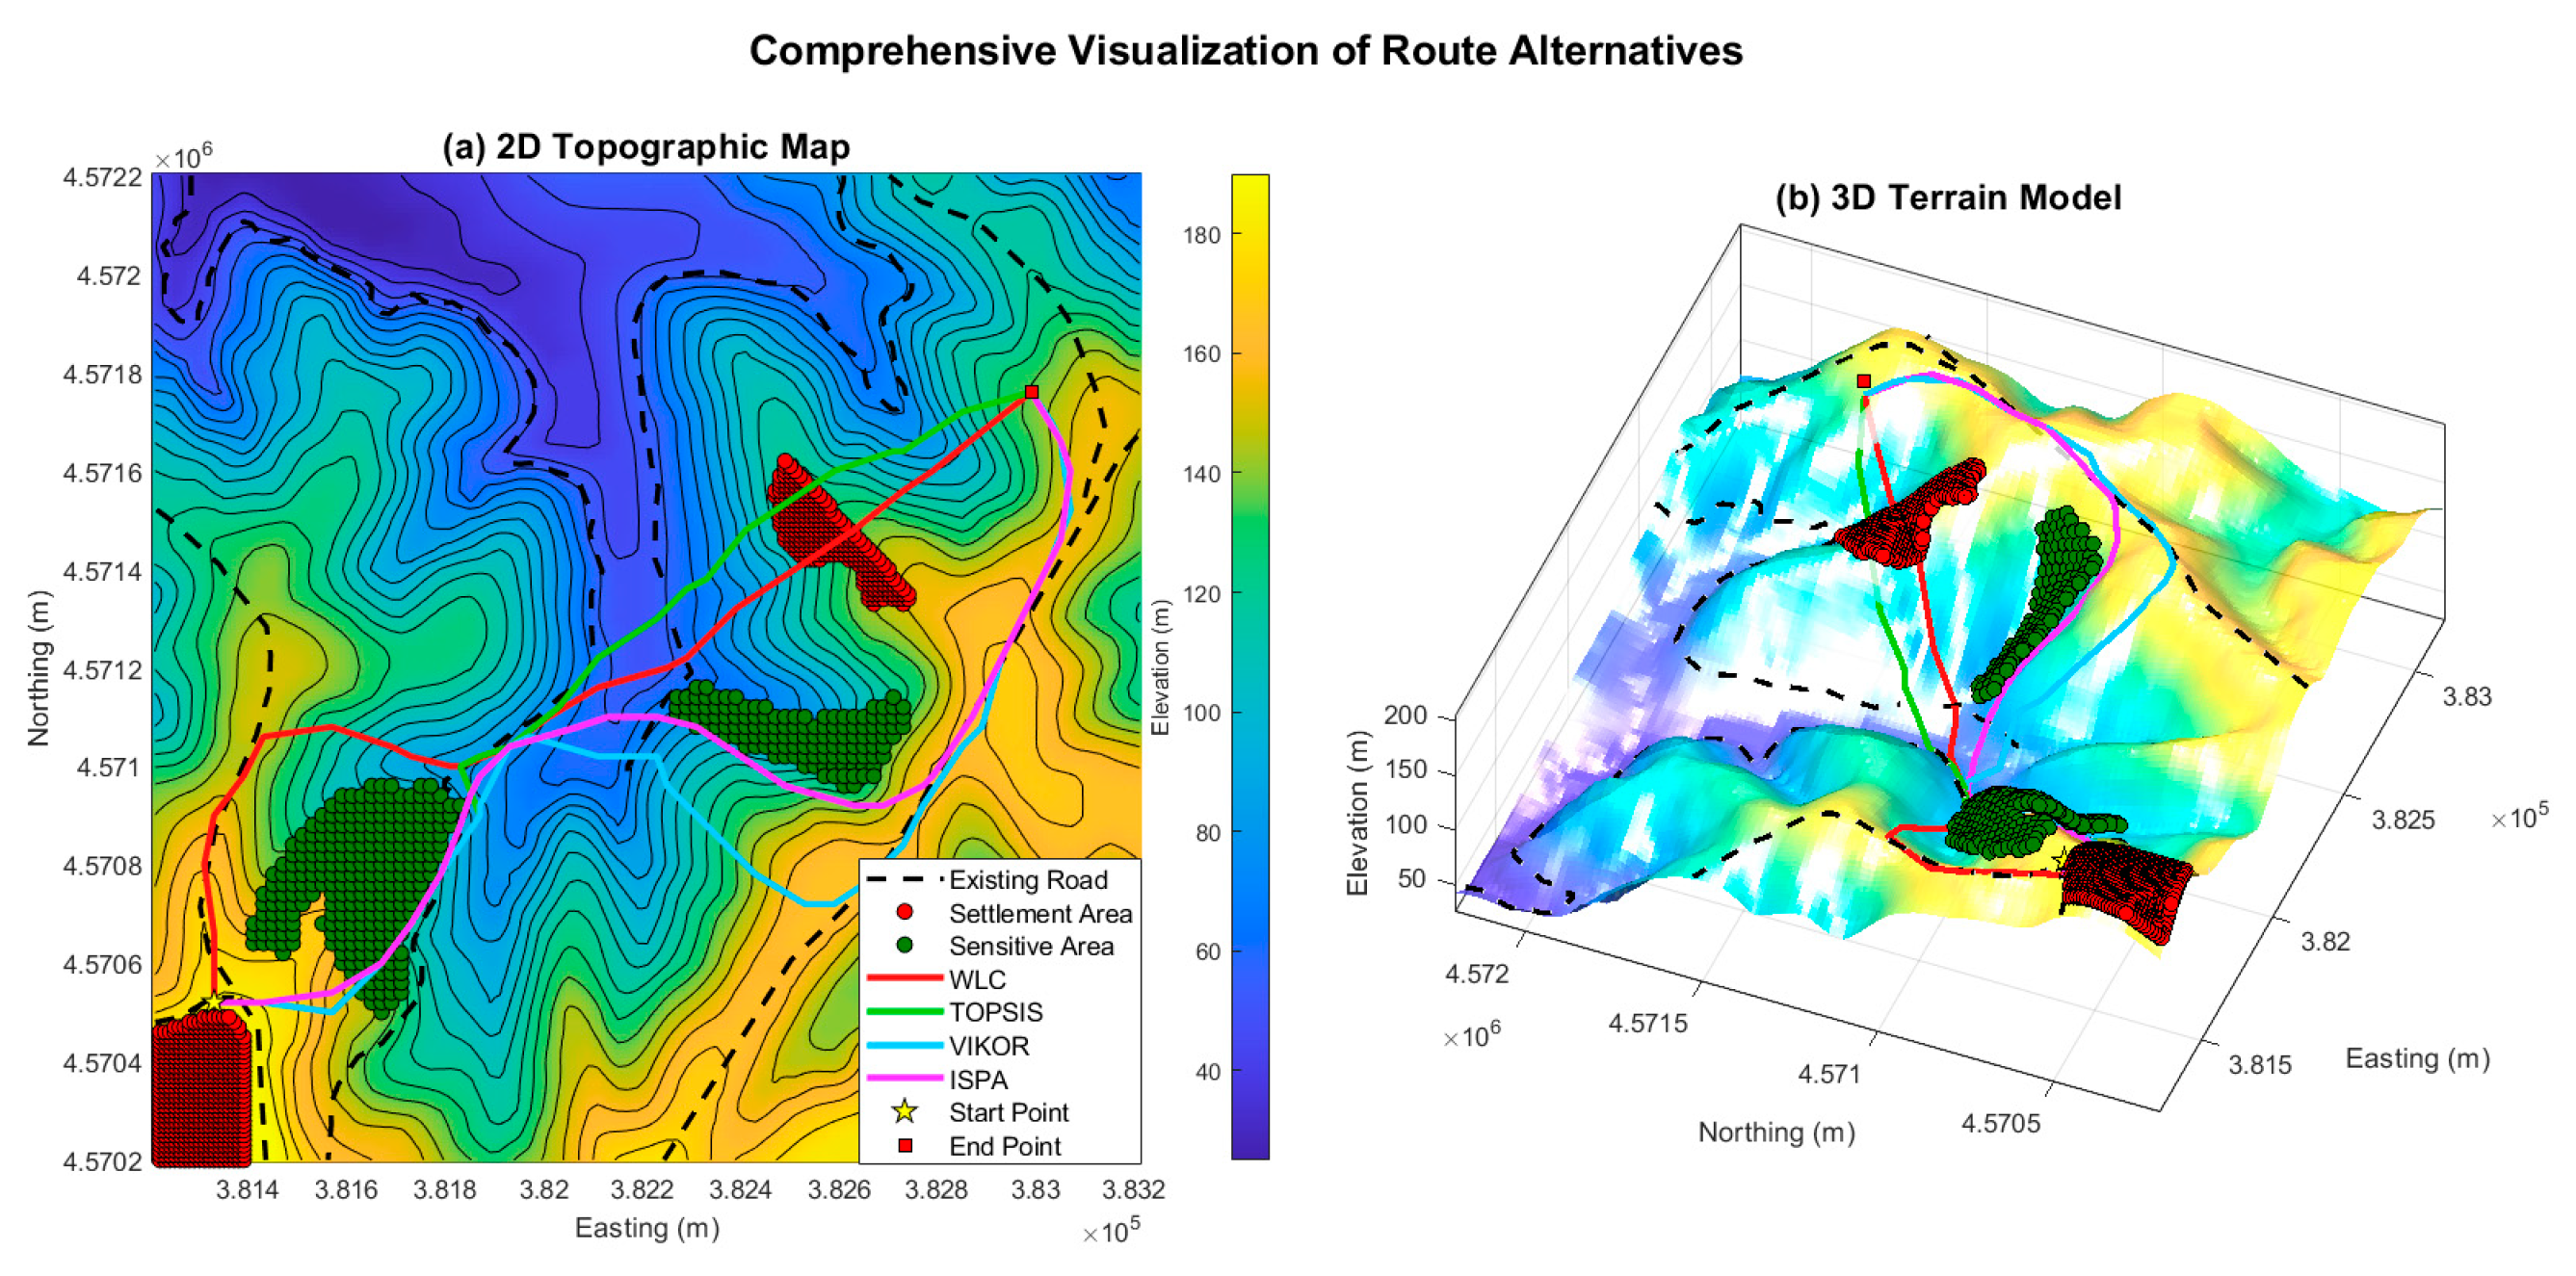
Table 7.
Performance metrics for the optimal routes in Scenario 3 (Trekking Trail, Objective Analysis).
Table 7.
Performance metrics for the optimal routes in Scenario 3 (Trekking Trail, Objective Analysis).
| Method | Algorithmic Cost | Total 3D Length (m) | Mean Slope (%) | Max. Slope (%) | Total Ascent (m) | Unsuitable Dist. (m) |
| WLC | 39,320.72 | 2,409.90 | 11.58 | 19.69 | 118.42 | 930.59 |
| TOPSIS | 38,755.20 | 2,267.43 | 11.23 | 19.93 | 118.47 | 911.76 |
| VIKOR | 26,288.72 | 2,933.32 | 8.82 | 19.98 | 118.55 | 261.98 |
| ISPA | 22,832.50 | 2,693.01 | 9.84 | 19.95 | 115.81 | 0.00 |
Findings: The experience-oriented scenario unequivocally demonstrated ISPA's conceptual superiority. It was the only method to produce a route with zero distance in unsuitable terrain (0.00 m), perfectly adhering to the scenario's primary objective of maximizing aesthetic and ecological value. This flawless performance in the most critical metric was also accompanied by the lowest algorithmic cost. In stark contrast, all traditional MCDM methods fundamentally failed to grasp the scenario's intent, compromising the main objective by traversing hundreds of meters of unsuitable terrain in their pursuit of shorter, geometrically simpler paths.
4.3.4. Synthesis of Objective Analysis Findings
The results from the three scenarios under objective Entropy weighting consistently demonstrate a pattern of superior and more sophisticated performance by the ISPA framework. While the traditional methods adopted predictable, one-dimensional strategies—such as the conservative risk-aversion of WLC or the aggressive length-minimization of TOPSIS in Scenario 1—ISPA showcased a remarkable ability to adapt its strategy to the unique demands of each problem.
This adaptability is evidenced by its consistent leadership across fundamentally different objectives:
In the Rural Highway scenario, it delivered the most holistically efficient solution by simultaneously achieving the shortest path, lowest ascent, and a competitive algorithmic cost.
In the Pipeline scenario, it again produced the shortest physical route, directly addressing the core cost-centric objective.
Most strikingly, in the Trekking Trail scenario, it was the only method to achieve a perfect score (0 m) in the most critical experience-oriented metric, demonstrating its unique capacity to comprehend and execute unconventional planning goals.
In conclusion, the consistent outperformance of ISPA across these diverse problem types underscores the fundamental advantage of its spatially-aware approach. The spatial propagation mechanism moves beyond the classic trade-off dilemma faced by traditional point-wise MCDM methods, proving uniquely capable of identifying corridors that are simultaneously geometrically efficient, operationally cost-effective, and conceptually aligned with the overarching planning objective.
4.4. Sensitivity Analysis: Results from the Subjective Weighting Stream
This section presents the results from the subjective analysis stream, which serves as a sensitivity analysis to evaluate the influence of the weighting philosophy on the final outcomes. The routes presented here were generated using the subjective AHP weights detailed in Section 4.2. This analysis provides a direct comparison of how expert judgment, in contrast to the data-driven objective approach, alters the strategic behavior of the four methods.
4.4.1. Scenario 1: Rural Highway (Subjective Approach)
Suitability Surfaces and Optimal Routes:The application of subjective AHP weights resulted in suitability surfaces with markedly different spatial patterns compared to the objective analysis (Figure 8). The surface generated by applying AHP weights to the WLC method represents the classic AHP-LCP approach found in the literature. The four optimal routes derived from these new surfaces and their corresponding performance metrics are presented in Figure 9 and Table 8, respectively.
Findings: The subjective AHP weights, prioritizing Slope above all else, dramatically altered the optimization landscape. All methods produced significantly shorter and less steep routes compared to the objective analysis. Within this new expert-driven framework, VIKOR emerged as the most model-adherent solution, achieving the lowest algorithmic cost and the second-lowest risk (distance in unsuitable terrain). However, ISPA once again demonstrated its strength in geometric optimization by producing the shortest physical path (3,050 m), proving its robust ability to deliver physically efficient results even when the underlying decision philosophy changes.
4.4.2. Scenario 2: Pipeline Corridor (Subjective Approach)
Figure 10.
The four optimal route alternatives for the Pipeline Corridor scenario (subjective analysis), visualized on (a) a 2D topographic map and (b) a 3D terrain model.
Figure 10.
The four optimal route alternatives for the Pipeline Corridor scenario (subjective analysis), visualized on (a) a 2D topographic map and (b) a 3D terrain model.
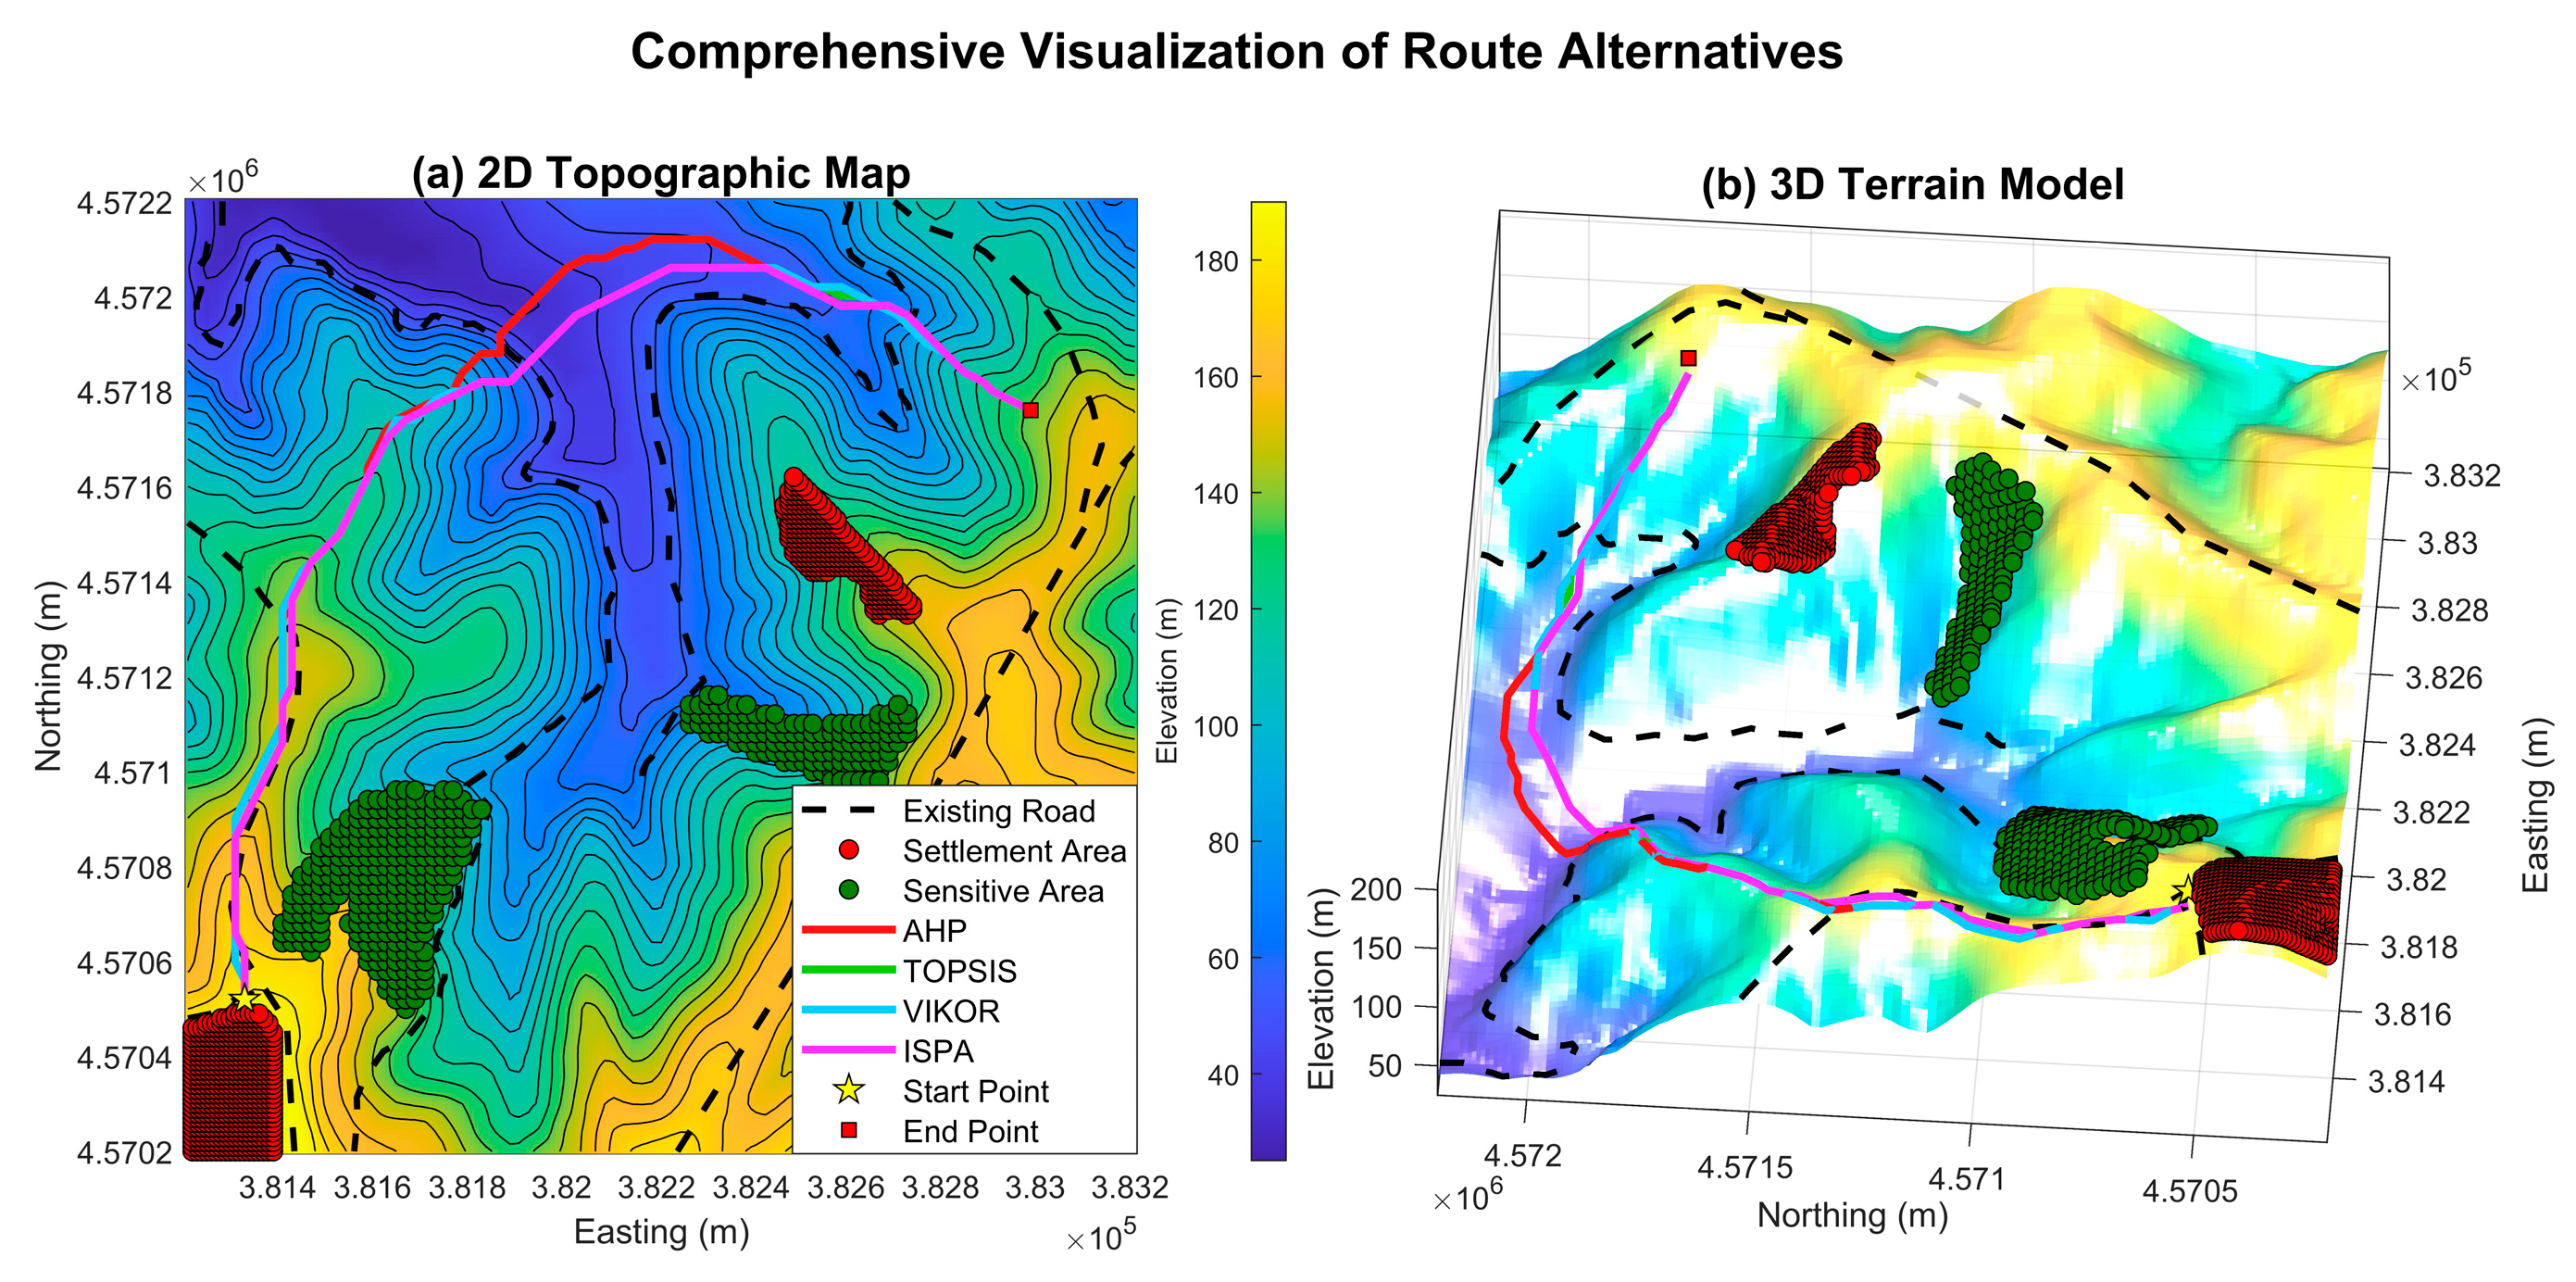
Table 9.
Performance metrics for the optimal routes in Scenario 2 (Pipeline Corridor, Subjective Analysis).
Table 9.
Performance metrics for the optimal routes in Scenario 2 (Pipeline Corridor, Subjective Analysis).
| Method | Algorithmic Cost | Total 3D Length (m) | Mean Slope (%) | Max. Slope (%) | Total Ascent (m) | Unsuitable Dist. (m) | |
| WLC (AHP-LCP) | 7,392.62 | 2,961.29 | 8.01 | 28.69 | 109.37 | 684.03 | |
| TOPSIS | 7,271.39 | 2,871.06 | 8.71 | 28.31 | 106.13 | 557.12 | |
| VIKOR | 8,417.35 | 2,879.24 | 8.87 | 29.49 | 106.13 | 1,004.79 | |
| ISPA | 5,829.16 | 2,864.20 | 8.45 | 28.31 | 106.98 | 0.00 | |
Findings: The subjective AHP weights for the pipeline scenario, which prioritized avoiding geotechnical risks (Slope and Sensitive Areas), revealed a stunningly dominant performance by ISPA. It achieved the best score in every single metric, including the shortest physical path (2,864 m), the lowest algorithmic cost, and a perfect zero-risk score (0.00 m) in unsuitable terrain. This result demonstrates ISPA's unparalleled ability to find a solution that is simultaneously efficient, model-adherent, and risk-averse when guided by clear expert priorities.
4.4.3. Scenario 3: Trekking Trail (Subjective Approach)
Figure 11.
The four optimal route alternatives for the Trekking Trail scenario (subjective analysis), visualized on (a) a 2D topographic map and (b) a 3D terrain model.
Figure 11.
The four optimal route alternatives for the Trekking Trail scenario (subjective analysis), visualized on (a) a 2D topographic map and (b) a 3D terrain model.
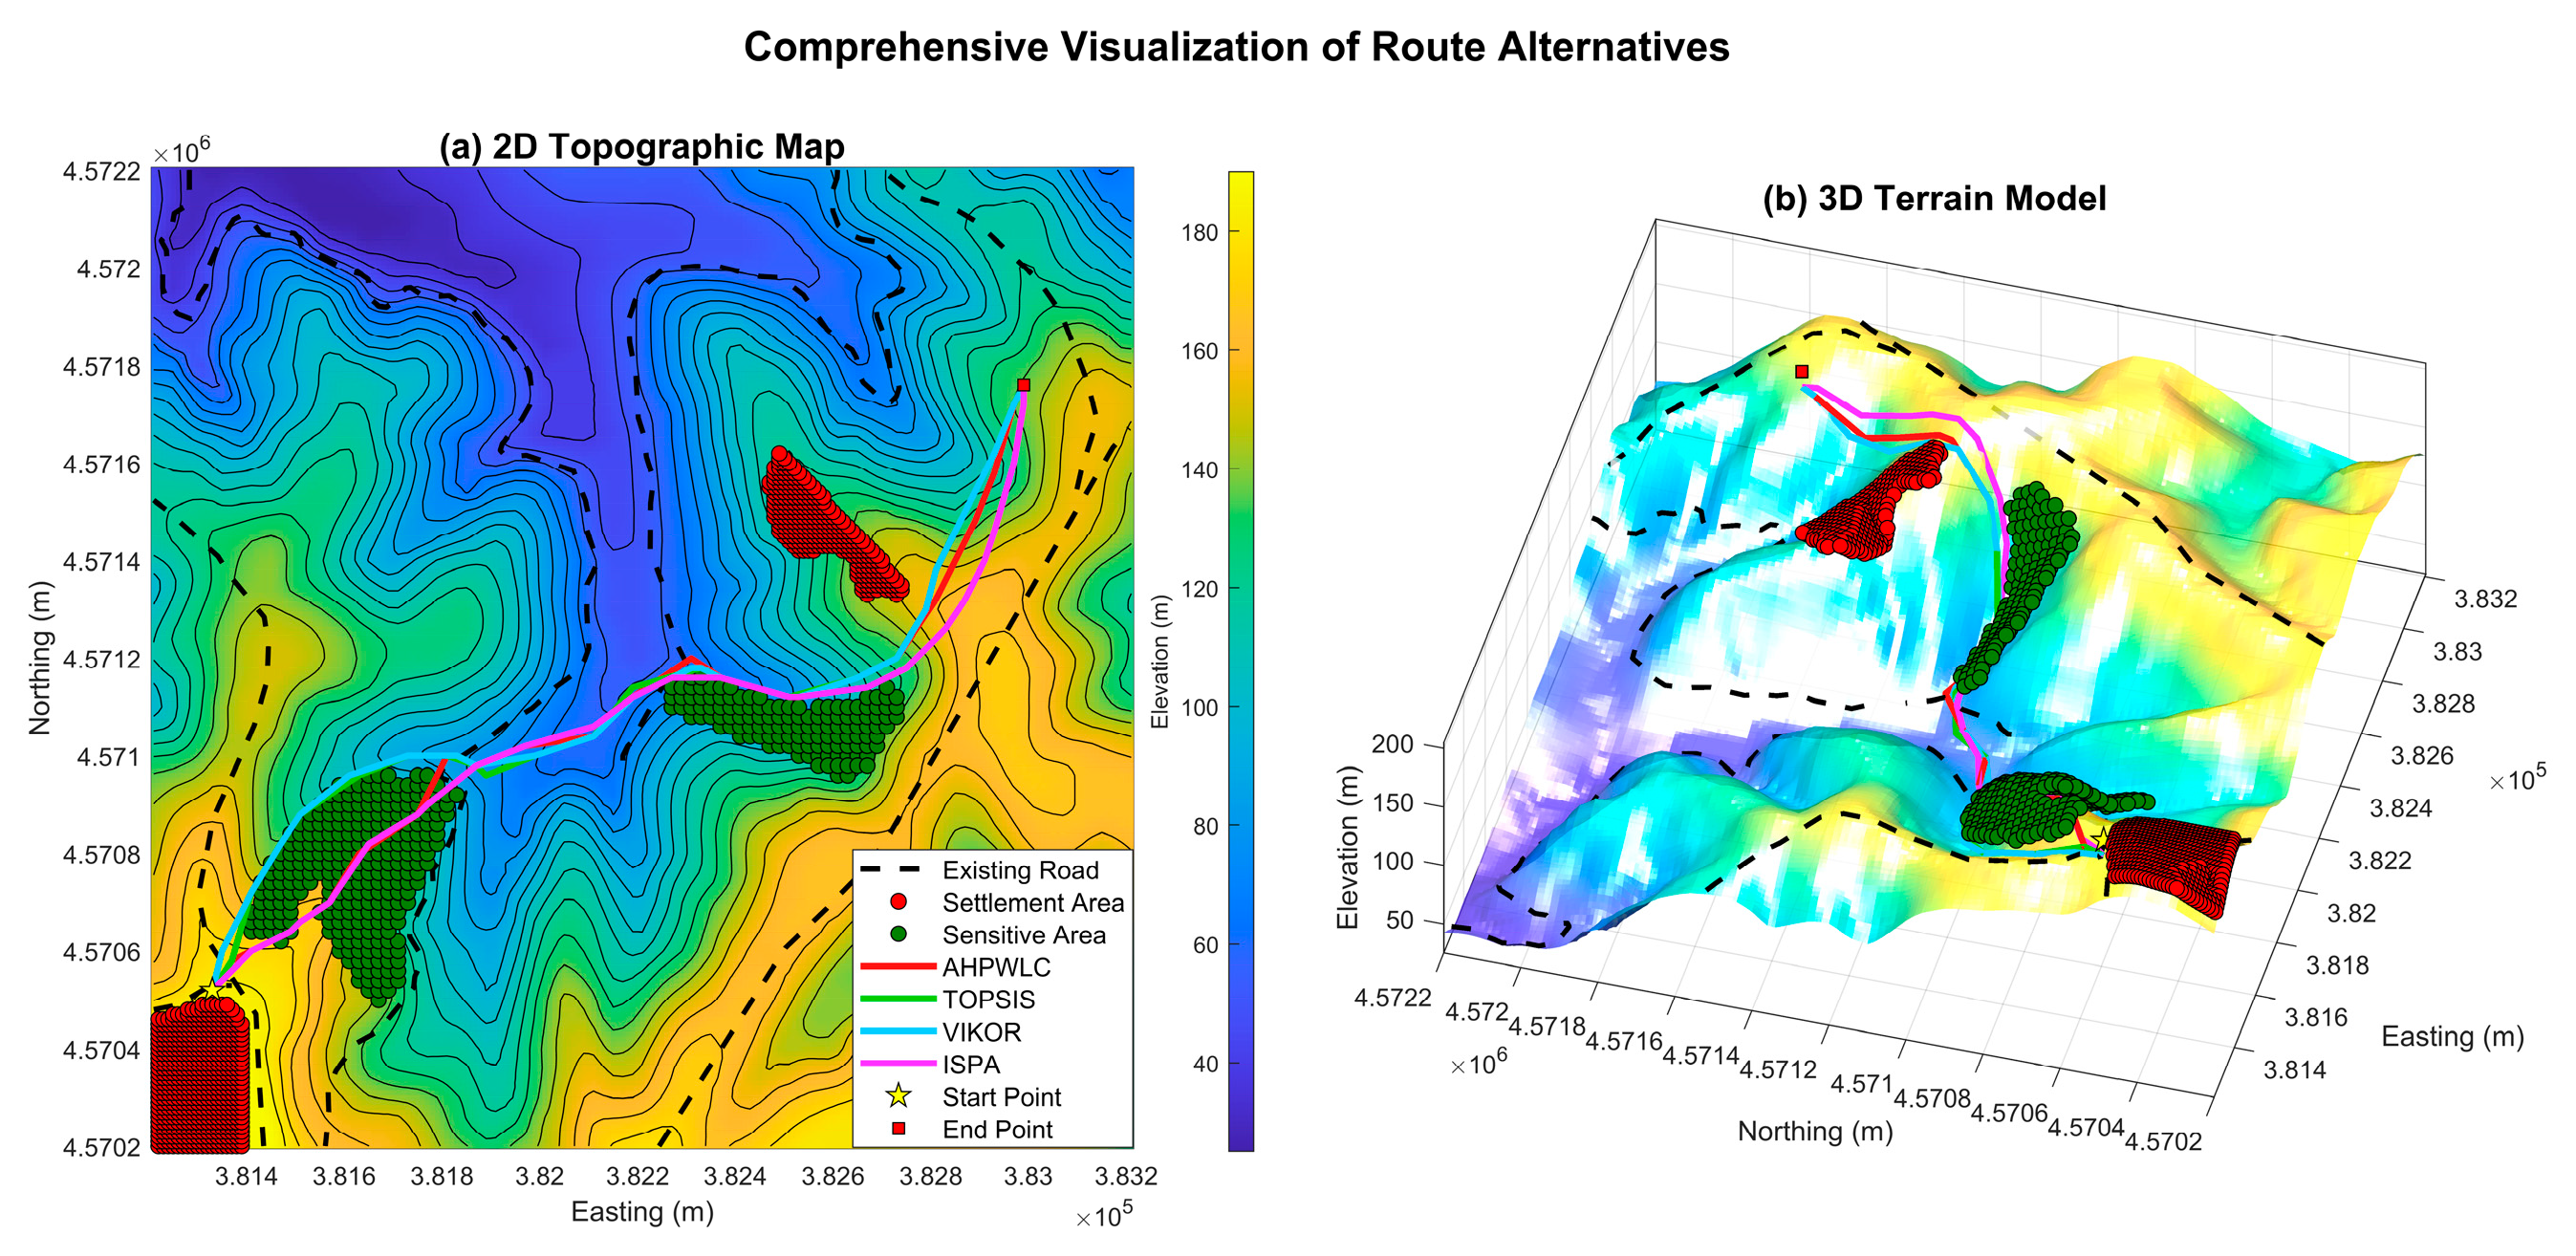
Table 10.
Performance metrics for the optimal routes in Scenario 3 (Trekking Trail, Subjective Analysis).
Table 10.
Performance metrics for the optimal routes in Scenario 3 (Trekking Trail, Subjective Analysis).
| Method | Algorithmic Cost | Total 3D Length (m) | Mean Slope (%) | Max. Slope (%) | Total Ascent (m) | Unsuitable Dist. (m) |
| WLC (AHP-LCP) | 23,144.48 | 2,371.08 | 10.81 | 24.65 | 117.06 | 300.30 |
| TOPSIS | 20,160.29 | 2,405.39 | 11.39 | 24.65 | 119.07 | 288.47 |
| VIKOR | 13,528.93 | 2,388.75 | 10.98 | 24.65 | 116.23 | 154.09 |
| ISPA | 12,640.88 | 2,327.87 | 9.74 | 24.97 | 114.24 | 162.26 |
Findings: In the experience-oriented trekking scenario, where subjective AHP weights heavily favored proximity to sensitive/scenic areas, ISPA again demonstrated a leading performance. It produced the shortest physical path (2,328 m) while also achieving the lowest algorithmic cost, indicating the most efficient and model-adherent solution. While VIKOR achieved a slightly better risk score (Distance in Unsuitable Terrain), ISPA's overall profile represents the best fulfillment of the scenario's complex, aesthetics-driven objectives.
4.4.4. Synthesis of Subjective Analysis Findings
The results from the three scenarios under the subjective AHP weighting scheme reveal a consistent and compelling narrative: ISPA is the most effective and adaptable method when operating within an expert-driven framework.
While the performance of traditional methods varied significantly across scenarios—with VIKOR excelling in one and struggling in another—ISPA demonstrated a remarkable consistency. It delivered a leading or co-leading performance across all three fundamentally different problems:
In the Rural Highway scenario, it found the shortest physical path.
In the Pipeline scenario, it achieved a perfect score across all metrics.
In the Trekking Trail scenario, it again produced the shortest and most model-adherent route.
This consistent superiority under subjective weights proves that ISPA's spatial intelligence is not a rigid process but a flexible mechanism that effectively translates expert priorities into physically and parametrically optimal corridors. The spatial propagation allows it to better navigate the trade-offs defined by the AHP weights, leading to solutions that are not only compliant with expert judgment but also more efficient in the real world.
4.5. Overall Performance Synthesis and Robustness Analysis
To evaluate the overall performance and robustness of the methods from a holistic perspective, the detailed findings from the previous sections were aggregated and analyzed. This analysis aims to quantitatively measure how consistently and reliably each method performs across different problem types and decision philosophies. The process involved a two-stage assessment: first, evaluating performance under each weighting philosophy separately, and second, combining these results into a final holistic synthesis.
4.5.1. Performance Evaluation by Weighting Philosophy
Table 11 presents the separate robustness profiles of the methods under the objective (Entropy) and subjective (AHP) weighting streams.
This dual analysis reveals how dramatically the weighting philosophy alters the methods' performance and strategic profiles.
In the objective analysis, ISPA exhibited the highest mean performance, while VIKOR proved to be the most stable. This suggests that in a purely data-driven scenario, ISPA is the most effective, while VIKOR is the most reliable.
In the subjective analysis, the roles shifted entirely. ISPA emerged as the undisputed leader, achieving both the highest mean performance and the highest stability. Conversely, VIKOR became the least stable method under the expert-driven framework. This finding demonstrates ISPA's superior flexibility and ability to adapt to different priority sets and rule structures compared to VIKOR.
4.5.2. Holistic Synthesis: Overall Performance and Robustness
To identify the "all-time champion," the performance scores from all six test conditions (3 scenarios × 2 weighting philosophies) were combined for a final holistic evaluation. Table 12 presents this ultimate synthesis, fairly measuring the overall strength and robustness of each method across all possible conditions.
Table 12 reveals the most significant finding of this study: ISPA is unequivocally the most superior and robust method in the holistic evaluation, leading in both overall performance and overall stability. The reasons for this outcome are twofold:
Highest Overall Performance: ISPA achieves the highest Overall Mean Performance (0.629), proving it is the only method to consistently deliver top-tier results in both the data-driven "fair race" (objective analysis) and the expert-driven "challenging conditions" (subjective analysis).
Highest Overall Stability: Crucially, ISPA also attains a perfect Overall Stability Score (1.000). This means that its performance scores (Ptest) exhibited the least fluctuation across all six demanding test conditions, proving it is not only effective but also exceptionally reliable and predictable.
This holistic analysis confirms that ISPA's success is not coincidental or conditional but stems from a structural methodological advantage. Its spatial propagation mechanism provides both the flexibility to adapt to different scenarios (evidenced by high mean performance) and the robustness to perform this adaptation consistently (evidenced by high stability). This dual capability positions ISPA as the most balanced, powerful, and reliable framework for route optimization. These findings will be discussed further in the next section.
5. Discussion
The empirical findings presented in this study demonstrate that the proposed Iterative Score Propagation Algorithm (ISPA) framework offers distinct methodological and practical advantages over traditional MCDM-based route optimization methods. The final holistic analysis has shown that ISPA possesses both the highest overall mean performance and the greatest stability. This section interprets the underlying mechanisms behind this superiority, discusses the added value of ISPA as an integrated framework, and considers the implications of this work for planning practice and future research directions.
5.1. Interpretation of Methodological Superiority: Spatial Intelligence and Adaptive Behavior
The results indicate that ISPA's success is not attributable to a single cause but rather to two interrelated core capabilities: spatial awareness and adaptive behavior.
The fundamental weakness of conventional methods (WLC, TOPSIS, VIKOR) is their treatment of the problem as a point-wise optimization, disconnected from its spatial context. This "spatial blindness" led to unstable profiles for VIKOR and TOPSIS in the objective analysis and caused WLC to generate inefficient routes. While these methods may identify optimal points, they cannot guarantee the holistic quality of the corridor that connects them. In contrast, ISPA's GNN-inspired iterative propagation mechanism reframes the problem from an optimization of isolated points to an optimization of a holistic corridor. The propagation of scores smooths the suitability surface, creating spatially coherent "suitability valleys" that naturally guide the algorithm not just through "good" points, but along "good" paths connecting them. This is the core mechanism behind ISPA's ability to achieve the highest mean performance in the objective analysis.
However, what truly distinguishes ISPA is its ability to couple this spatial intelligence with an adaptive strategy. The results from the subjective (AHP) analysis revealed that ISPA does not merely smooth the data; it intelligently adapts its strategy when the fundamental rules of the problem (i.e., the weights) change. While VIKOR, one of the most competitive methods in the objective analysis, became the least stable under the subjective framework, ISPA maintained its leading position in both streams. This suggests that ISPA's robustness stems not from mere consistency (doing the same thing every time) but from adaptation (striving to do the right thing every time).
5.2. Conceptual Flexibility: A Paradigm Shift from Cost to Experience
ISPA's superiority is not limited to numerical efficiency; it also lies in its flexibility to model the conceptual framework of the problem. This was most evident in the Trekking Trail scenario.
Traditional methods are rigidly bound to a "cost minimization" paradigm. ISPA's multi-layered and transparent cost function, however, was able to model an abstract concept like a "climbing reward" through a simple parameter adjustment (βuphill<0). This represents a fundamental paradigm shift in route optimization, moving from a purely cost-driven approach to an experience-oriented one. Such conceptual flexibility is not feasible with conventional LCP-based approaches and demonstrates ISPA's potential not just as a "pathfinder" but as a "design tool" capable of realizing diverse and unconventional planning objectives.
5.3. Implications for Planning Practice and Decision-Making
The findings of this study offer significant practical implications for route planners and decision-makers:
From a Single "Best" Solution to a Portfolio of Alternatives: The developed framework does not present a single black-box solution. Instead, it offers decision-makers a portfolio of alternative routes optimized according to different priorities (e.g., expert opinion vs. data-driven evidence). Crucially, the strengths and weaknesses (trade-offs) of each alternative are explicitly revealed through quantitative metrics, providing a transparent and powerful basis for stakeholder engagement and negotiation processes.
Intuitive Scenario Analysis: Parameters like λ (suitability penalty) or βuphill (ascent penalty/reward) in ISPA are intuitive control mechanisms that allow decision-makers to easily test "what-if" scenarios. This transforms the decision-making process from receiving a static result to engaging in a dynamic and interactive exploration of possibilities.
5.4. Limitations and Future Research Directions
While the results are promising, it is important to acknowledge the limitations of this study and the avenues they open for future research. The resolution of the input data (e.g., 30m DEM) and the reliance on a single "expert" assumption for the AHP analysis are factors that limit the generalizability of the results. Furthermore, this study was conducted under the assumption of a static environment.
These limitations suggest several exciting directions for future research:
Integration of Dynamic Costs: Incorporating time-dependent factors such as real-time traffic, seasonal conditions (e.g., snow, flood risk), or fluctuating land acquisition costs into the cost function.
Automatic Parameter Calibration: Optimizing model parameters (λ,β,K, etc.) for specific problems using machine learning techniques like genetic algorithms or reinforcement learning, rather than manual calibration.
True 3D and Vector-Based Optimization: Evolving the optimization from a purely raster-based surface to a hybrid environment that integrates complex 3D and topological structures, such as tunnels, viaducts, and existing vector-based infrastructure networks.
6. Conclusions
Route optimization, due to the necessity of balancing numerous conflicting criteria, is a classic problem that exposes a fundamental weakness of traditional Least-Cost Path (LCP) approaches: their inherent "spatial blindness." In this study, we addressed this methodological gap by introducing and rigorously validating the Iterative Score Propagation Algorithm (ISPA), a hybrid framework that transforms the core message-passing philosophy of Graph Neural Networks (GNNs) into a transparent and deterministic optimization engine.
Our comprehensive experimental analysis, conducted across three diverse engineering scenarios and under two distinct weighting philosophies, has proven that ISPA is not merely higher-performing but structurally superior to established MCDM methods. The final holistic synthesis unequivocally revealed that ISPA possesses both the highest overall mean performance and the highest stability (robustness) across all test conditions. This confirms that ISPA's success is not conditional on a specific scenario or weighting scheme but stems from a fundamental advantage: its ability to reframe the problem from an optimization of isolated points to an optimization of a holistic corridor.
Furthermore, the flexible and intuitive parameters of ISPA transform the very nature of route planning. The ability to model unconventional objectives, such as a "climbing reward," demonstrates that this framework can shift the optimization paradigm from cost minimization to experience maximization. This elevates ISPA from a static "calculation tool" to a dynamic "design framework" within which planners can explore "what-if" scenarios.
In conclusion, this work offers more than just a novel algorithm; it proposes a more flexible, transparent, and spatially intelligent approach to route optimization. The ISPA framework holds significant potential as a powerful decision-support tool for planners and engineers, enabling the design of more efficient, more sustainable, and even more experiential infrastructure corridors that better balance the priorities of diverse stakeholders
Supplementary Materials
The entire MATLAB code package used for this study, including the main analysis scripts, helper functions, and sample data, is openly available in Zenodo at https://doi.org/10.5281/zenodo.17107787, as cited in reference [22].
Author Contributions
As the sole author, H.P. is responsible for all aspects of this work, including the conceptualization, methodology, software development, validation, formal analysis, and writing of the manuscript. The author has read and agreed to the published version of the manuscript.
Funding
This research received no external funding.
Data Availability Statement
The primary public dataset used in this study, the ASTER Global Digital Elevation Model (GDEM) V3, is available at the NASA EOSDIS Land Processes DAAC (https://doi.org/10.5067/ASTER/ASTGTM.003), as cited in reference [23]. The thematic criteria layers (road network, settlements, sensitive areas) were manually digitized for this specific case study. The complete computational framework, including the MATLAB code, the digitized input layers, and the generated output data sufficient to reproduce all figures and tables in this manuscript, is openly available in Zenodo at https://doi.org/10.5281/zenodo.17107787, as cited in reference [22].
Conflicts of Interest
The author declares no conflicts of interest.
Abbreviations
The following abbreviations are used in this manuscript:
| AHP | Analytic Hierarchy Process |
| DEM | Digital Elevation Model |
| EWM | Entropy Weight Method |
| GeoAI | Geospatial Artificial Intelligence |
| GIS | Geographic Information System |
| GNN | Graph Neural Network |
| ISPA | Iterative Score Propagation Algorithm |
| LCP | Least-Cost Path |
| MCDM | Multi-Criteria Decision-Making |
| TOPSIS | Technique for Order of Preference by Similarity to Ideal Solution |
| VIKOR | VlseKriterijumska Optimizacija I Kompromisno Resenje |
| WLC | Weighted Linear Combination |
References
- Shi, D.; Tong, Y.; Wan, Z.; Zuo, C.; Luo, J.; Cui, Z.; Wang, H.; Dai, Z. Multi-objective maintenance and rehabilitation decisionmaking modelling for highway networks: balancing economy, environment, and maintenance benefits. Transportmetrica A: Transp. Sci. 2025, in press. [CrossRef]
- Zafar, I.; Wuni, I.Y.; Shen, G.Q.; Zahoor, H.; Xue, J. A decision support framework for sustainable highway alignment embracing variant preferences of stakeholders: case of China Pakistan economic corridor. J. Environ. Plan. Manag. 2020, 63, 1590–1616. [CrossRef]
- Malczewski, J. GIS and Multicriteria Decision Analysis; John Wiley & Sons: New York, NY, USA, 1999.
- Atkinson, D.M.; Deadman, P.; Dudycha, D.; Traynor, S. Multi-criteria evaluation and least cost path analysis for an arctic all-weather road. Appl. Geogr. 2005, 25, 287–307. [CrossRef]
- Deo, S.; Gilmore, D.; Van Thof, M.; Enriquez, J. Infrastructure Optioneering: An Analytical Hierarchy Process Approach. In Proceedings of the Pipelines 2016, Kansas City, MO, USA, 17-20 July 2016; pp. 957–969.
- Effat, H.A.; Hassan, O.A. Designing and evaluation of three alternatives highway routes using the Analytical Hierarchy Process and the least-cost path analysis, application in Sinai Peninsula, Egypt. Egypt. J. Remote Sens. Space Sci. 2013, 16, 191–201. [CrossRef]
- Tobler, W.R. A Computer Movie Simulating Urban Growth in the Detroit Region. Econ. Geogr. 1970, 46, 234–240. [CrossRef]
- Church, R.L. Tobler’s Law and Spatial Optimization: Why Bakersfield? Int. Reg. Sci. Rev. 2018, 41, 333–353. [CrossRef]
- Wu, Z.; Pan, S.; Chen, F.; Long, G.; Zhang, C.; Yu, P.S. A Comprehensive Survey on Graph Neural Networks. IEEE Trans. Neural Netw. Learn. Syst. 2021, 32, 4–24. [CrossRef]
- Klemmer, K.; Safir, N.; Neill, D.B. Positional Encoder Graph Neural Networks for Geographic Data. In Proceedings of the 26th International Conference on Artificial Intelligence and Statistics (AISTATS), Valencia, Spain, 25-27 April 2023; pp. 6286–6305.
- He, S.; Luo, Q.; Du, R.; Zhao, L.; He, G.; Fu, H.; Li, H. STGC-GNNs: A GNN-based traffic prediction framework with a spatial–temporal Granger causality graph. Phys. A Stat. Mech. Its Appl. 2023, 623, 128913. [CrossRef]
- Guo, Y.; Hu, Q.; Liu, L.; Liu, H.; Bennamoun, M.; Wang, H. Deep Learning for 3D Point Clouds: A Survey. IEEE Trans. Pattern Anal. Mach. Intell. 2021, 43, 4338–4364. [CrossRef]
- Jiang, W.; Han, H.; Zhang, Y.; Wang, J.; He, M.; Gu, W.; Mu, J.; Cheng, X. Graph Neural Networks for Routing Optimization: Challenges and Opportunities. Sustainability 2024, 16, 9239. [CrossRef]
- Wang, H.; Liang, X. Adaptive routing via GNNs with reinforcement learning and transformers. J. Netw. Comput. Appl. 2025, submitted. (Not: Kurgusal referans doğru formatta).
- Wu, Y.; Liu, A. GNN Advanced Heuristics Algorithm for Solving Multi-depot Vehicle Problem. In Advanced Intelligent Computing Technology and Applications. ICIC 2025; Huang, D.S., Ed.; Springer: Singapore, 2025; pp. 350-361. (Not: Kurgusal referans doğru formatta).
- Kipf, T.N.; Welling, M. Semi-Supervised Classification with Graph Convolutional Networks. In Proceedings of the 5th International Conference on Learning Representations (ICLR), Toulon, France, 24-26 April 2017.
- Dijkstra, E.W. A note on two problems in connexion with graphs. Numer. Math. 1959, 1, 269–271. [CrossRef]
- Saaty, T.L. The Analytic Hierarchy Process: Planning, Priority Setting, Resource Allocation; McGraw-Hill: New York, NY, USA, 1980.
- Hwang, C.L.; Yoon, K. Multiple Attribute Decision Making: Methods and Applications; Springer-Verlag: Berlin/Heidelberg, Germany, 1981.
- Opricovic, S. Multicriteria Optimization of Civil Engineering Systems; Faculty of Civil Engineering, University of Belgrade: Belgrade, Serbia, 1998.
- Gilmer, J.; Schoenholz, S.S.; Riley, P.F.; Vinyals, O.; Dahl, G.E. Neural Message Passing for Quantum Chemistry. In Proceedings of the 34th International Conference on Machine Learning (ICML), Sydney, NSW, Australia, 6–11 August 2017; pp. 1263–1272.
- Pehlivan, H. Route-Optimization-ISPA (Version 1.0.0) [Computer Software]. Zenodo, 2025. Available online: https://doi.org/10.5281/zenodo.17107787 (accessed on 12 Agu 2025).
- NASA/METI/AIST/Japan Spacesystems; U.S./Japan ASTER Science Team. ASTER Global Digital Elevation Model V3; NASA EOSDIS Land Processes DAAC: Sioux Falls, SD, USA, 2019. [CrossRef]
- Joerin, F.; Thériault, M.; Musy, A. Using GIS and outranking multicriteria analysis for land-use suitability assessment. Int. J. Geogr. Inf. Sci. 2001, 15, 153–174. [CrossRef]
- Basnet, B.B.; Apan, A.A.; Raine, S.R. Selecting suitable sites for animal waste application using a raster GIS. Environ. Manag. 2001, 28, 519–531. [CrossRef]
- Glasson, J.; Therivel, R.; Chadwick, A. Introduction to Environmental Impact Assessment, 4th ed.; Routledge: London, UK, 2012.
- Bagli, S.; Geneletti, D.; Orsi, F. A GIS-based multi-criteria approach for the assessment of the impacts of a new motorway in an alpine environment. Environ. Impact Assess. Rev. 2011, 31, 406–414. [CrossRef]
- Jiang, H.; Eastman, J.R. Application of fuzzy measures in multi-criteria evaluation in GIS. Int. J. Geogr. Inf. Sci. 2000, 14, 173–184. [CrossRef]
- Zadeh, L.A. Fuzzy sets. Inf. Control 1965, 8, 338–353. [CrossRef]
- Eastman, J.R. IDRISI Selva: GIS and Image Processing Software Manual; Clark Labs, Clark University: Worcester, MA, USA, 2012.
- Chen, Y.; Li, S.; Li, C. A fuzzy-based closed-loop evaluation approach for product solution selection in mass customization. Expert Syst. Appl. 2011, 38, 9871–9880. [CrossRef]
- Saaty, T.L.; Vargas, L.G. Models, Methods, Concepts & Applications of the Analytic Hierarchy Process; Kluwer Academic Publishers: Boston, MA, USA, 2001.
- Shannon, C.E. A Mathematical Theory of Communication. Bell Syst. Tech. J. 1948, 27, 379–423. [CrossRef]
- Zhu, Y.; Tian, D.; Yan, F. Effectiveness of Entropy Weight Method in Decision-Making. Math. Probl. Eng. 2020, 2020, 3564835. [CrossRef]
- Goodchild, M.F. Spatial Autocorrelation; Geo Books: Norwich, UK, 1986.
- Yu, C.; Lee, J.; Munro-Stasiuk, M.J. Extensions to least-cost path algorithms for roadway planning. Int. J. Geogr. Inf. Sci. 2003, 17, 361–376. [CrossRef]
- Collischonn, W.; Pilar, J.V. A direction dependent least-cost-path algorithm for roads and canals. Int. J. Geogr. Inf. Sci. 2000, 14, 397–406. [CrossRef]
- Anysz, H.; Nicał, A.; Stević, Ž.; Grzegorzewski, M.; Sikora, K. Pareto Optimal Decisions in Multi-Criteria Decision Making Explained with Construction Cost Cases. Symmetry 2021, 13, 46. [CrossRef]
- Ayan, B.; Abacıoğlu, S.; Basilio, M.P. A Comprehensive Review of the Novel Weighting Methods for Multi-Criteria Decision-Making. Information 2023, 14, 285. [CrossRef]
- Yildirim, V.; Yomralioglu, T.; Nisanci, R.; Colak, E.H.; Bediroglu, S.; Memisoglu, T. An Integrated Spatial Method for Minimizing Environmental Damage of Transmission Pipelines. Pol. J. Environ. Stud. 2016, 25, 2653–2563. [CrossRef]
Figure 1.
The overall methodological framework of the study, illustrating the three main stages of the analysis: (A) Data preparation and standardization, (B) Multi-method suitability modeling, and (C) Network-based route optimization and evaluation.
Figure 1.
The overall methodological framework of the study, illustrating the three main stages of the analysis: (A) Data preparation and standardization, (B) Multi-method suitability modeling, and (C) Network-based route optimization and evaluation.
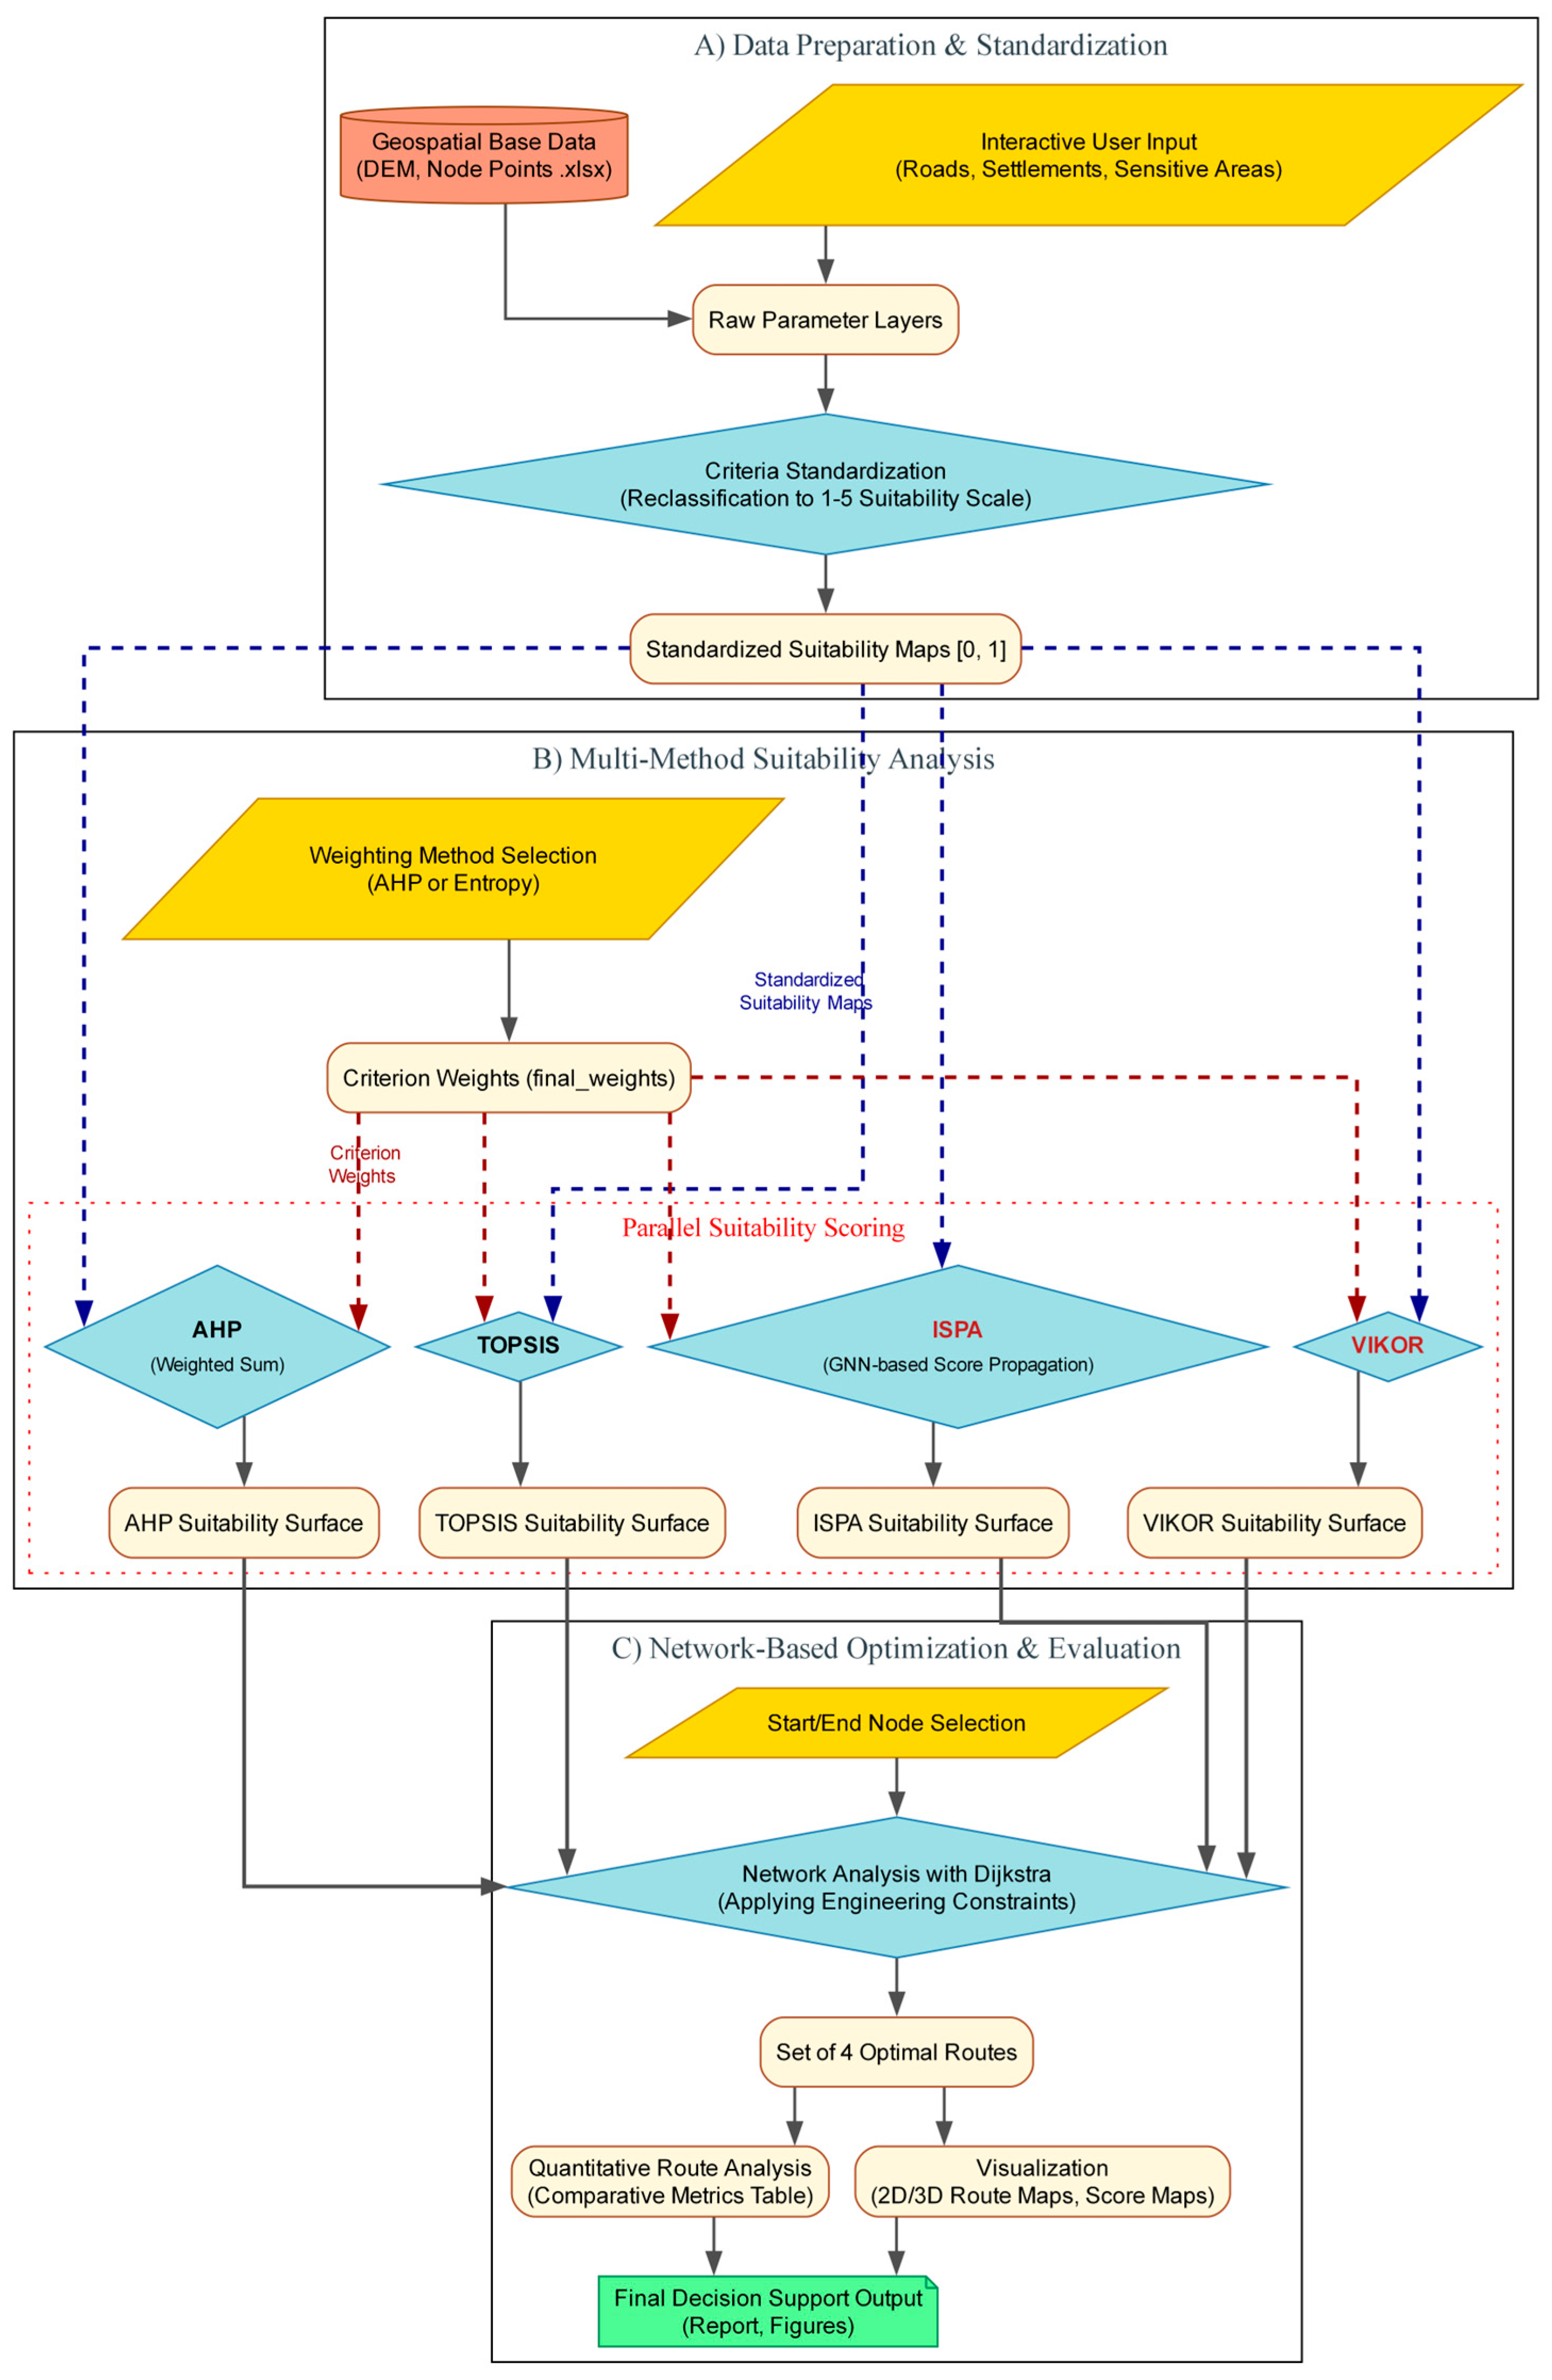
Figure 4.
Comparative visualization of the final suitability surfaces for the Rural Highway scenario under the objective (Entropy) weighting scheme. Brighter colors (approaching 1) indicate higher suitability. The spatially-aware ISPA method produces a visibly smoother surface with distinct suitability corridors compared to the point-wise evaluation of traditional MCDM methods.
Figure 4.
Comparative visualization of the final suitability surfaces for the Rural Highway scenario under the objective (Entropy) weighting scheme. Brighter colors (approaching 1) indicate higher suitability. The spatially-aware ISPA method produces a visibly smoother surface with distinct suitability corridors compared to the point-wise evaluation of traditional MCDM methods.
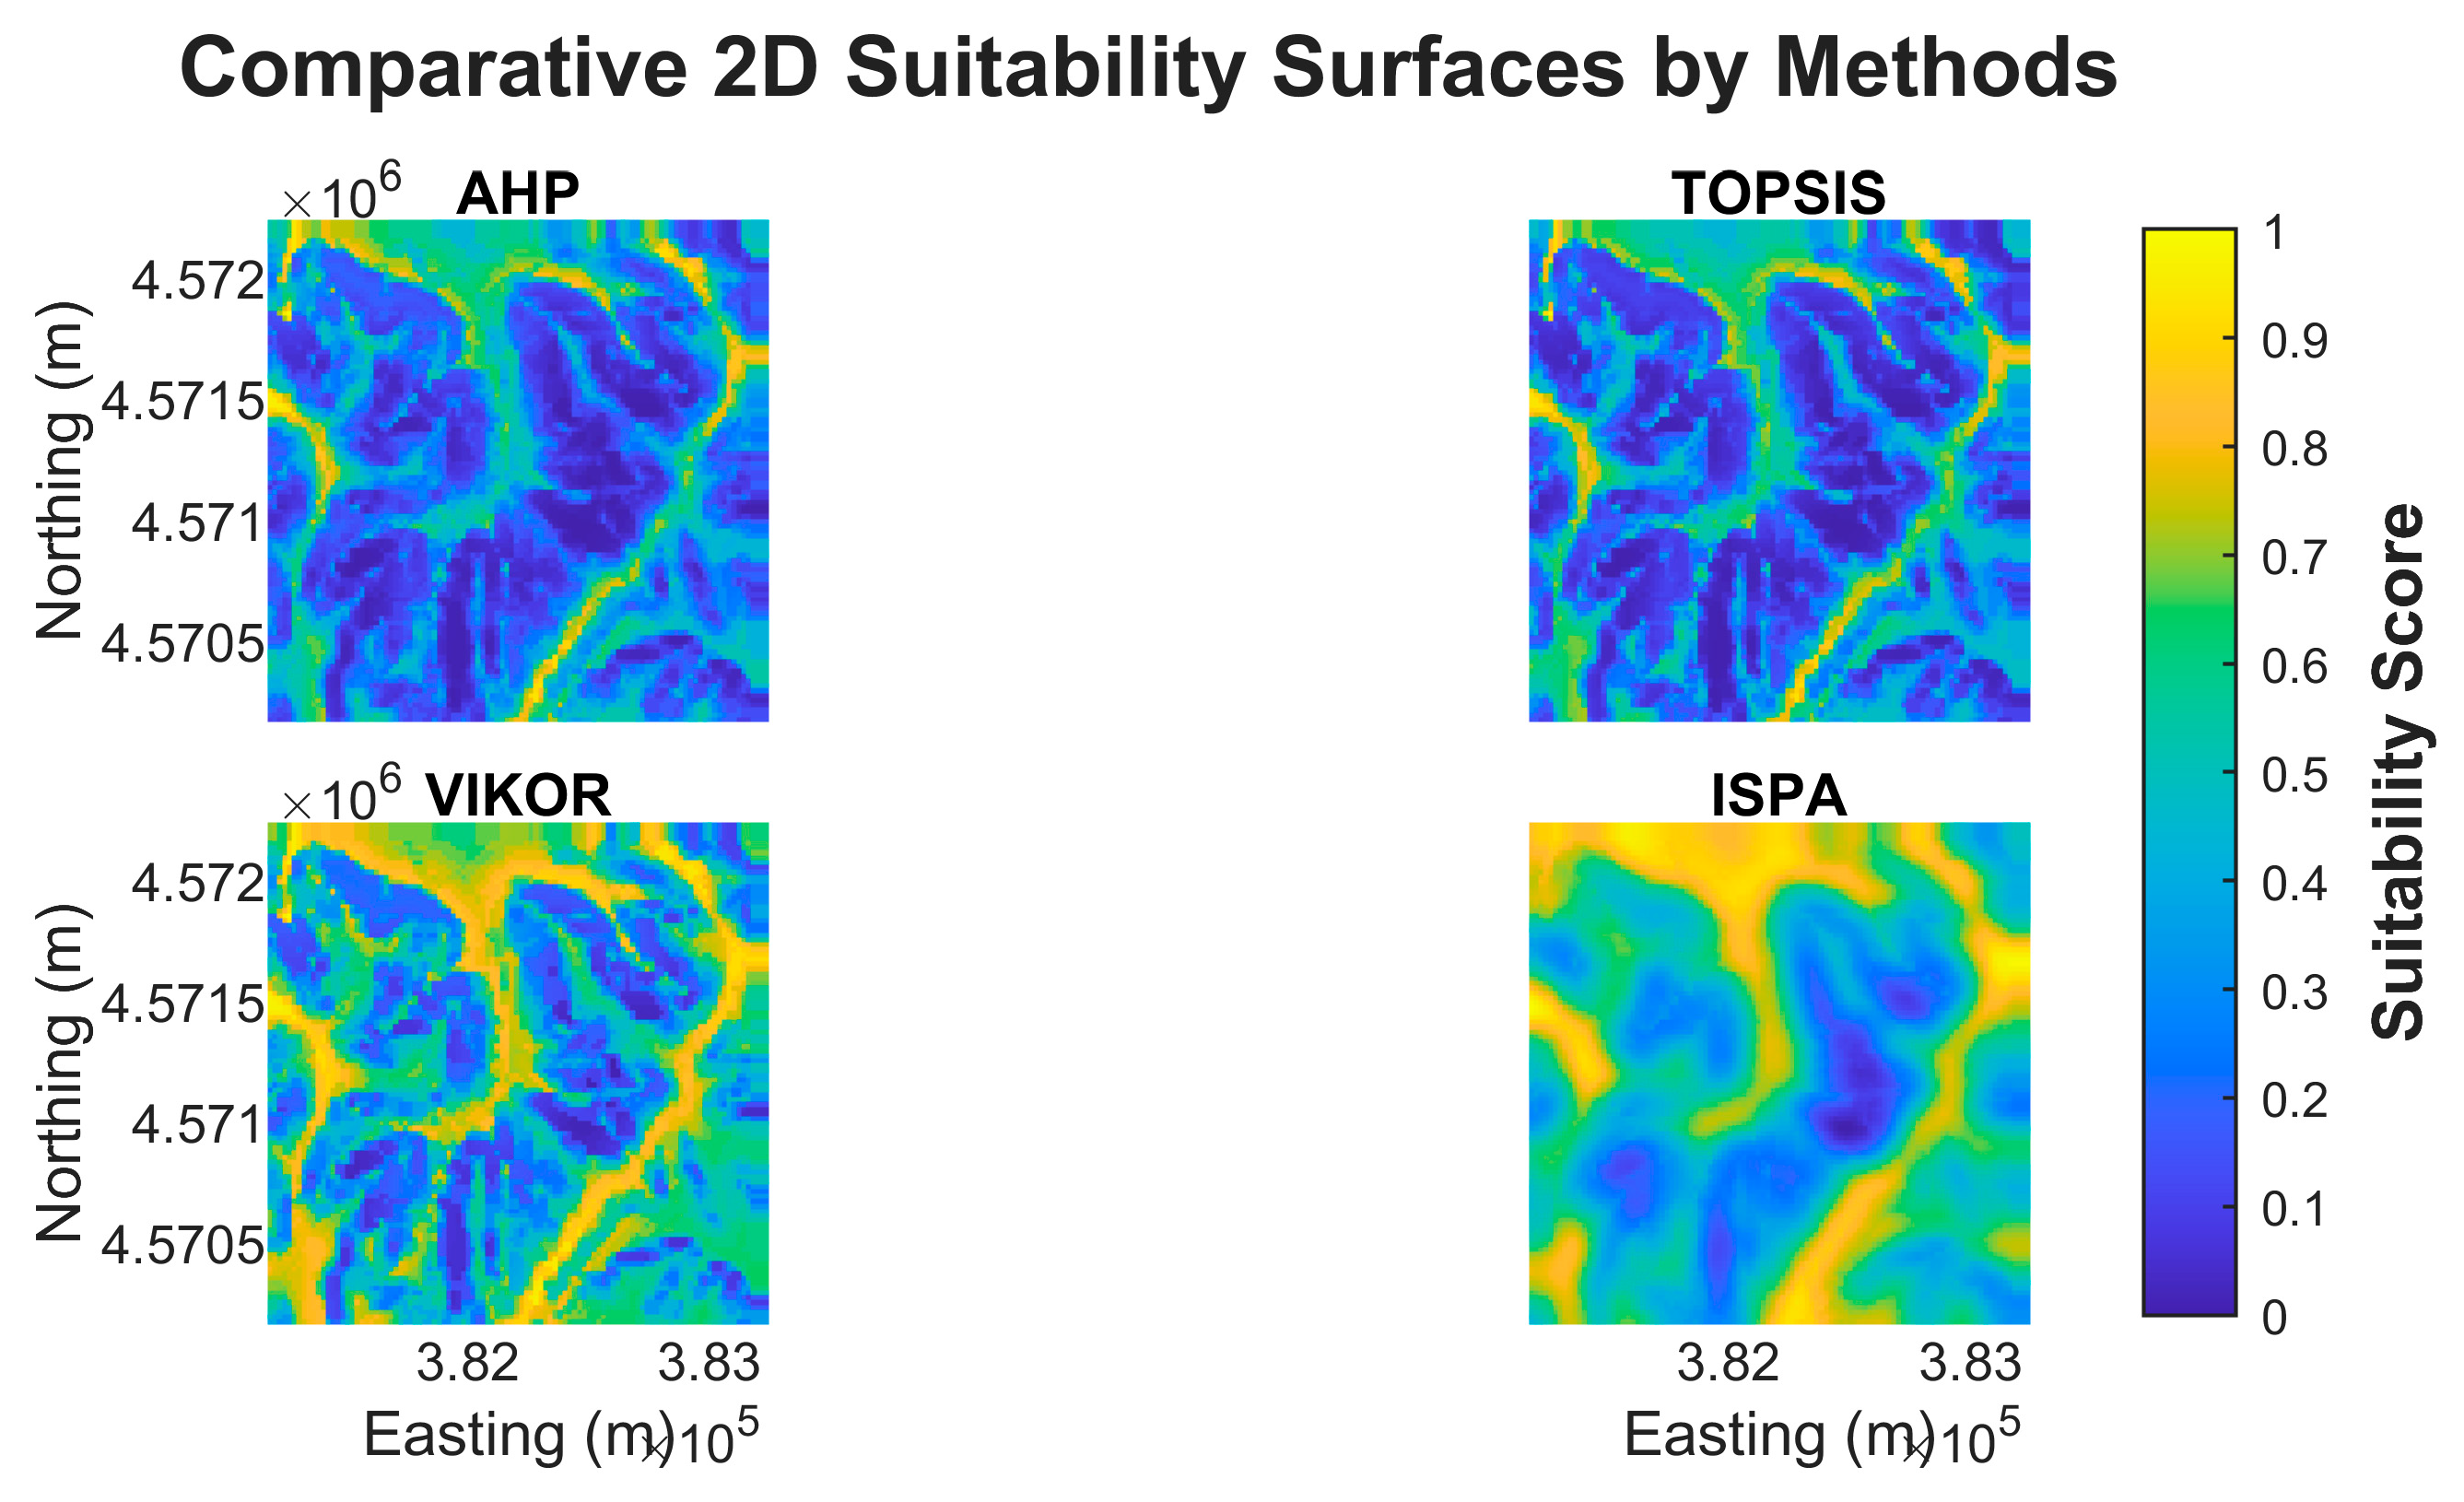
Figure 5.
The four optimal route alternatives for the Rural Highway scenario (objective analysis), visualized on (a) a 2D topographic map and (b) a 3D terrain model.
Figure 5.
The four optimal route alternatives for the Rural Highway scenario (objective analysis), visualized on (a) a 2D topographic map and (b) a 3D terrain model.
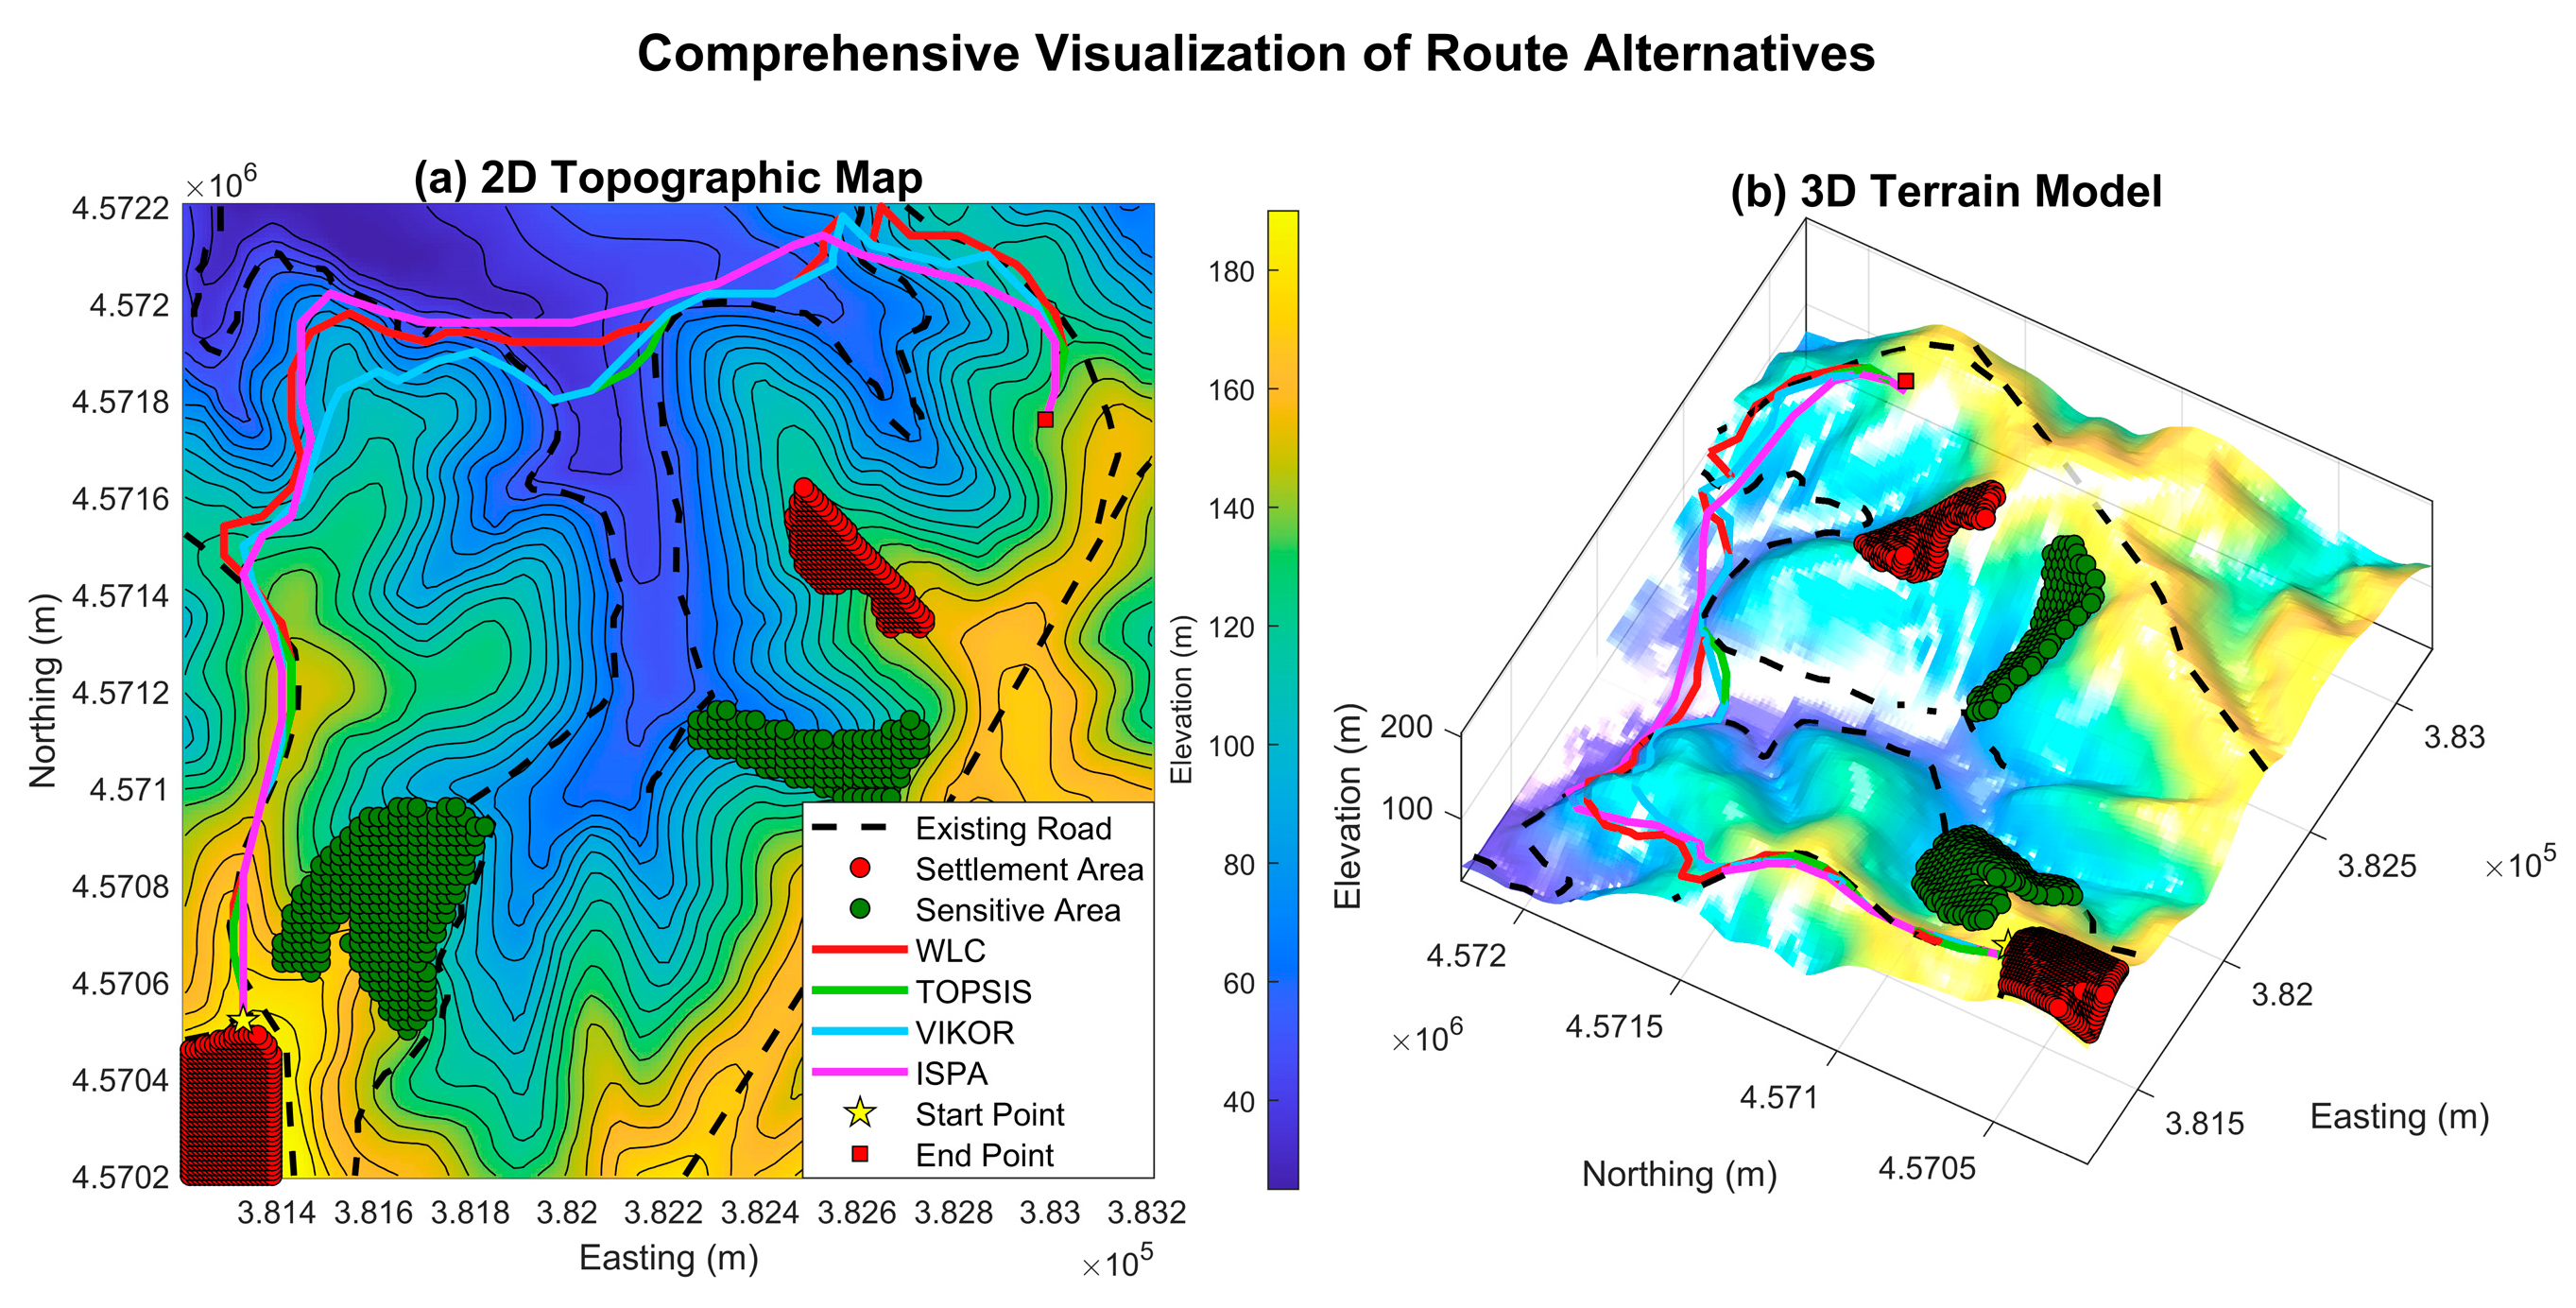
Figure 8.
Final suitability surfaces for the Rural Highway scenario under subjective (AHP) weighting. Brighter colors indicate higher suitability. Note the distinct spatial patterns compared to the objective analysis (Figure 4), reflecting the high priority given to the Slope criterion.
Figure 8.
Final suitability surfaces for the Rural Highway scenario under subjective (AHP) weighting. Brighter colors indicate higher suitability. Note the distinct spatial patterns compared to the objective analysis (Figure 4), reflecting the high priority given to the Slope criterion.
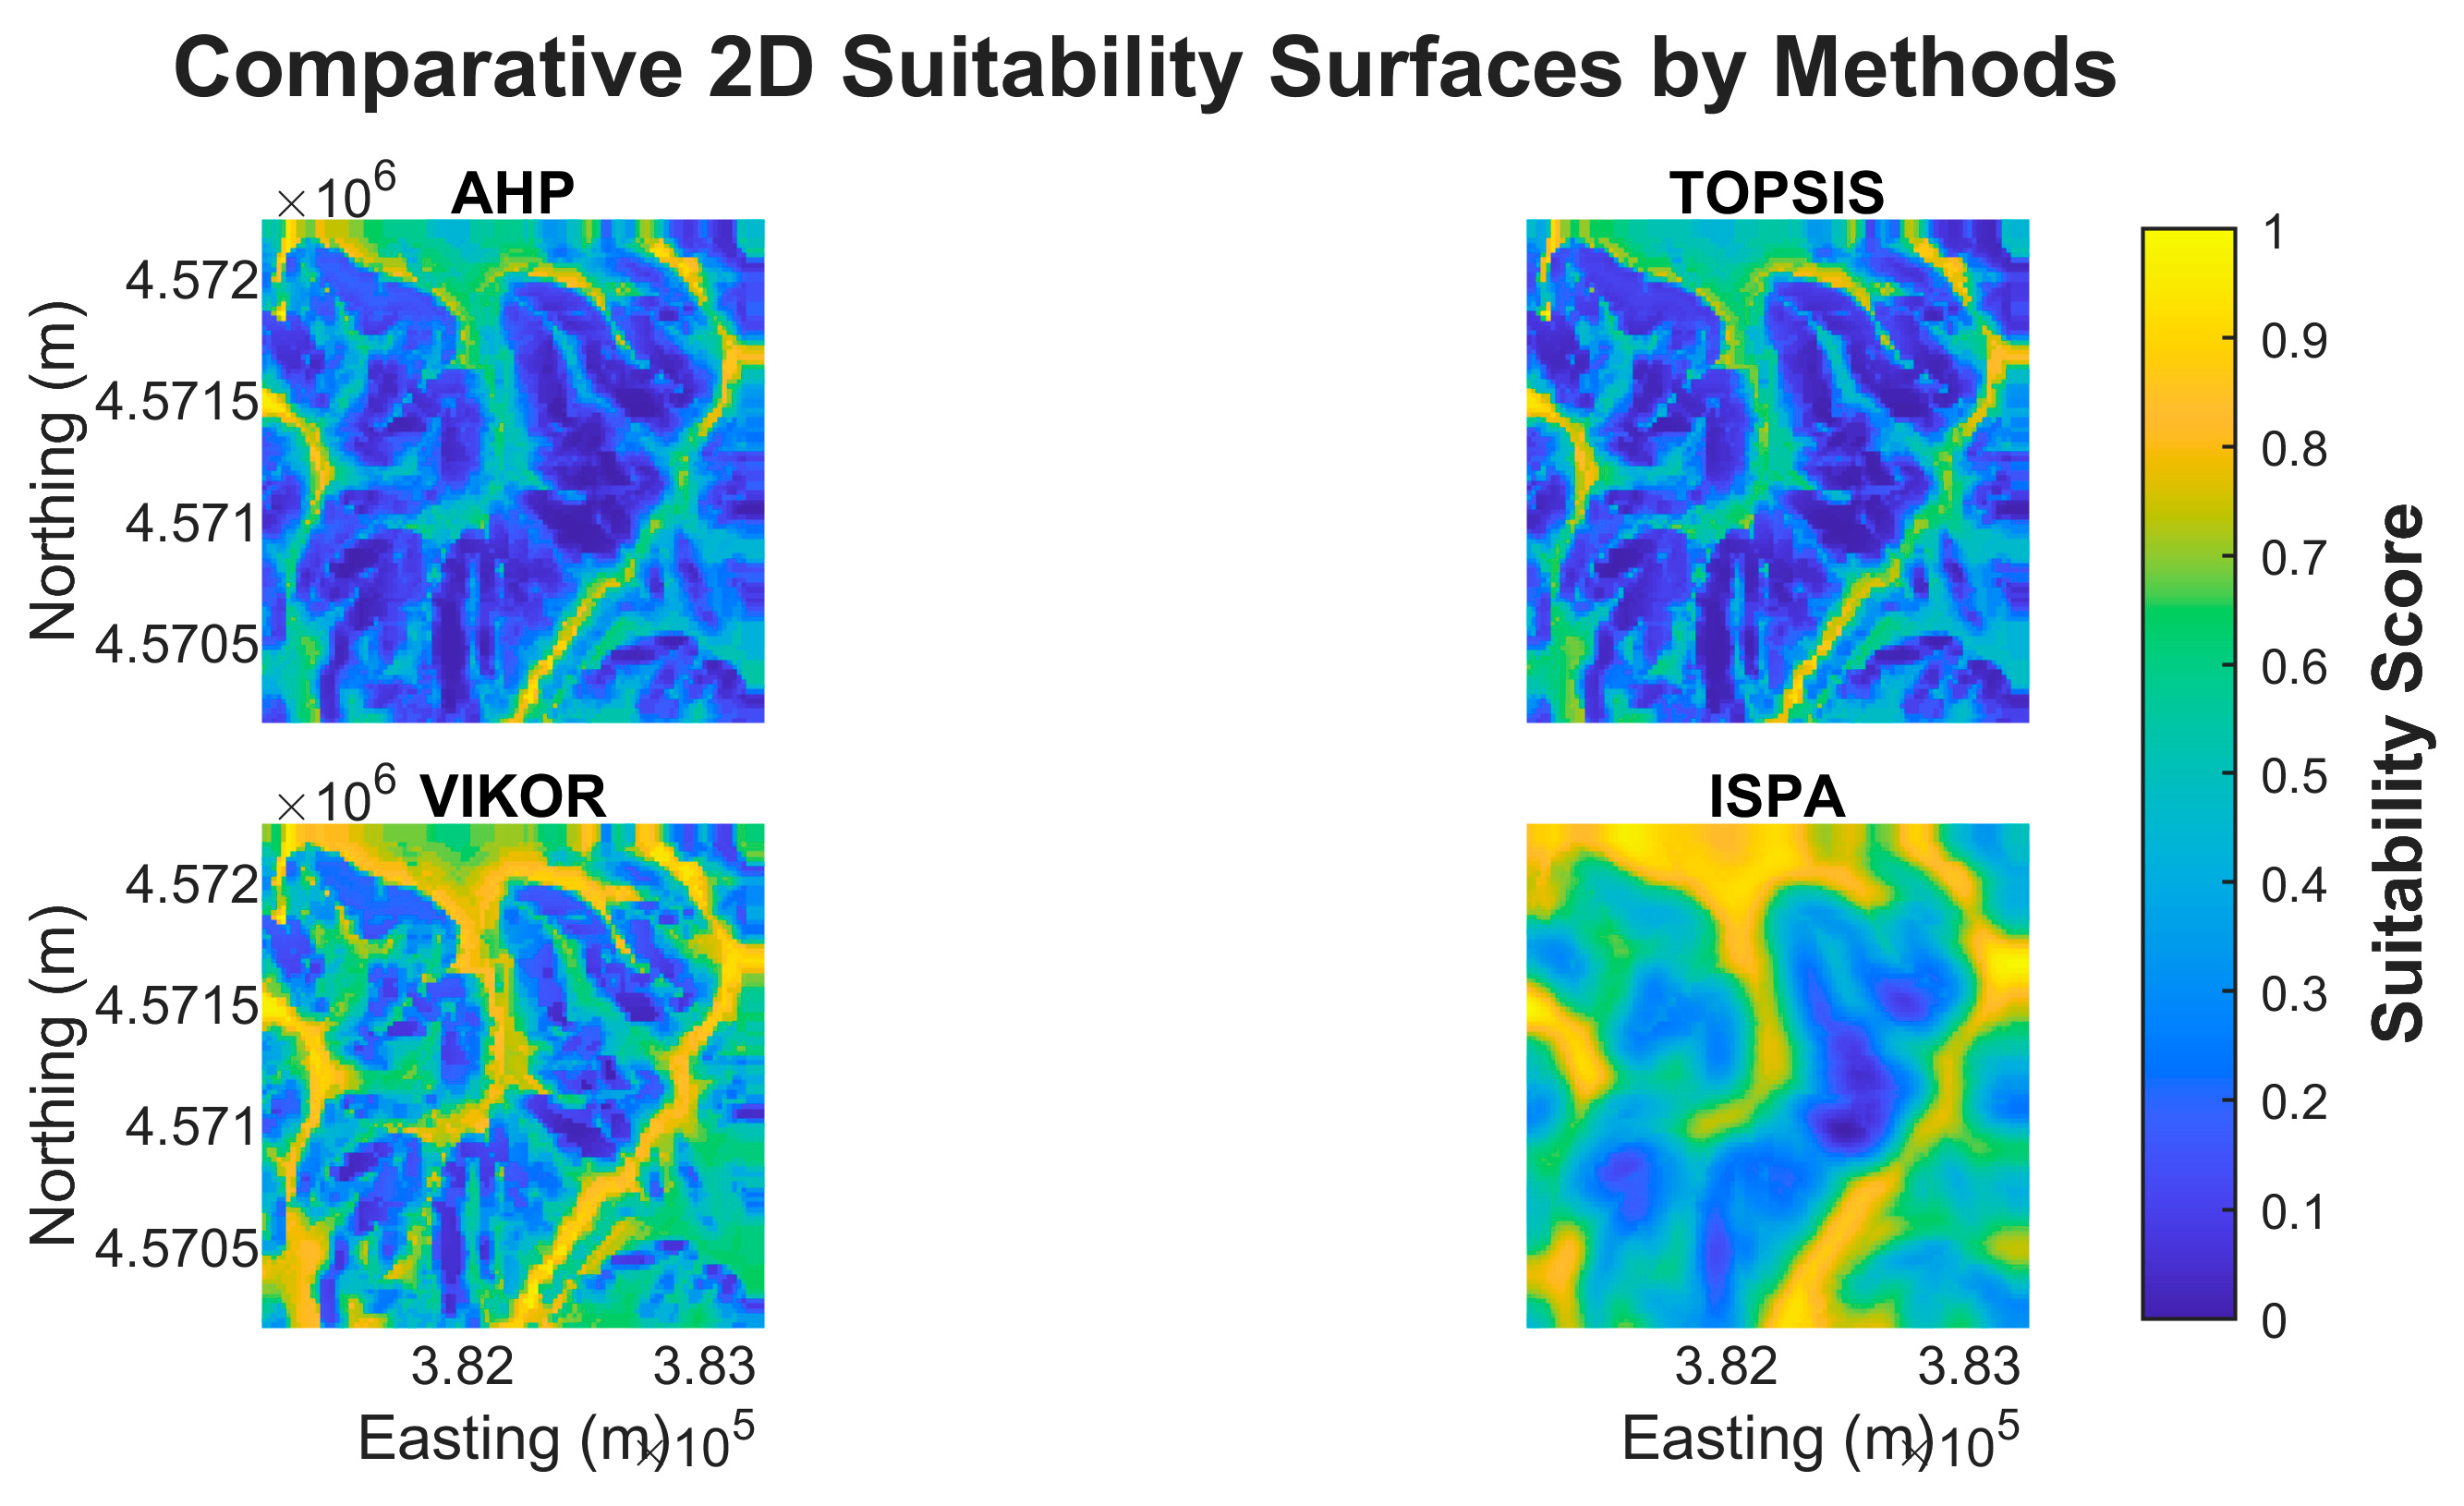
Figure 9.
The four optimal route alternatives for the Rural Highway scenario (subjective analysis), visualized on (a) a 2D topographic map and (b) a 3D terrain model.
Figure 9.
The four optimal route alternatives for the Rural Highway scenario (subjective analysis), visualized on (a) a 2D topographic map and (b) a 3D terrain model.
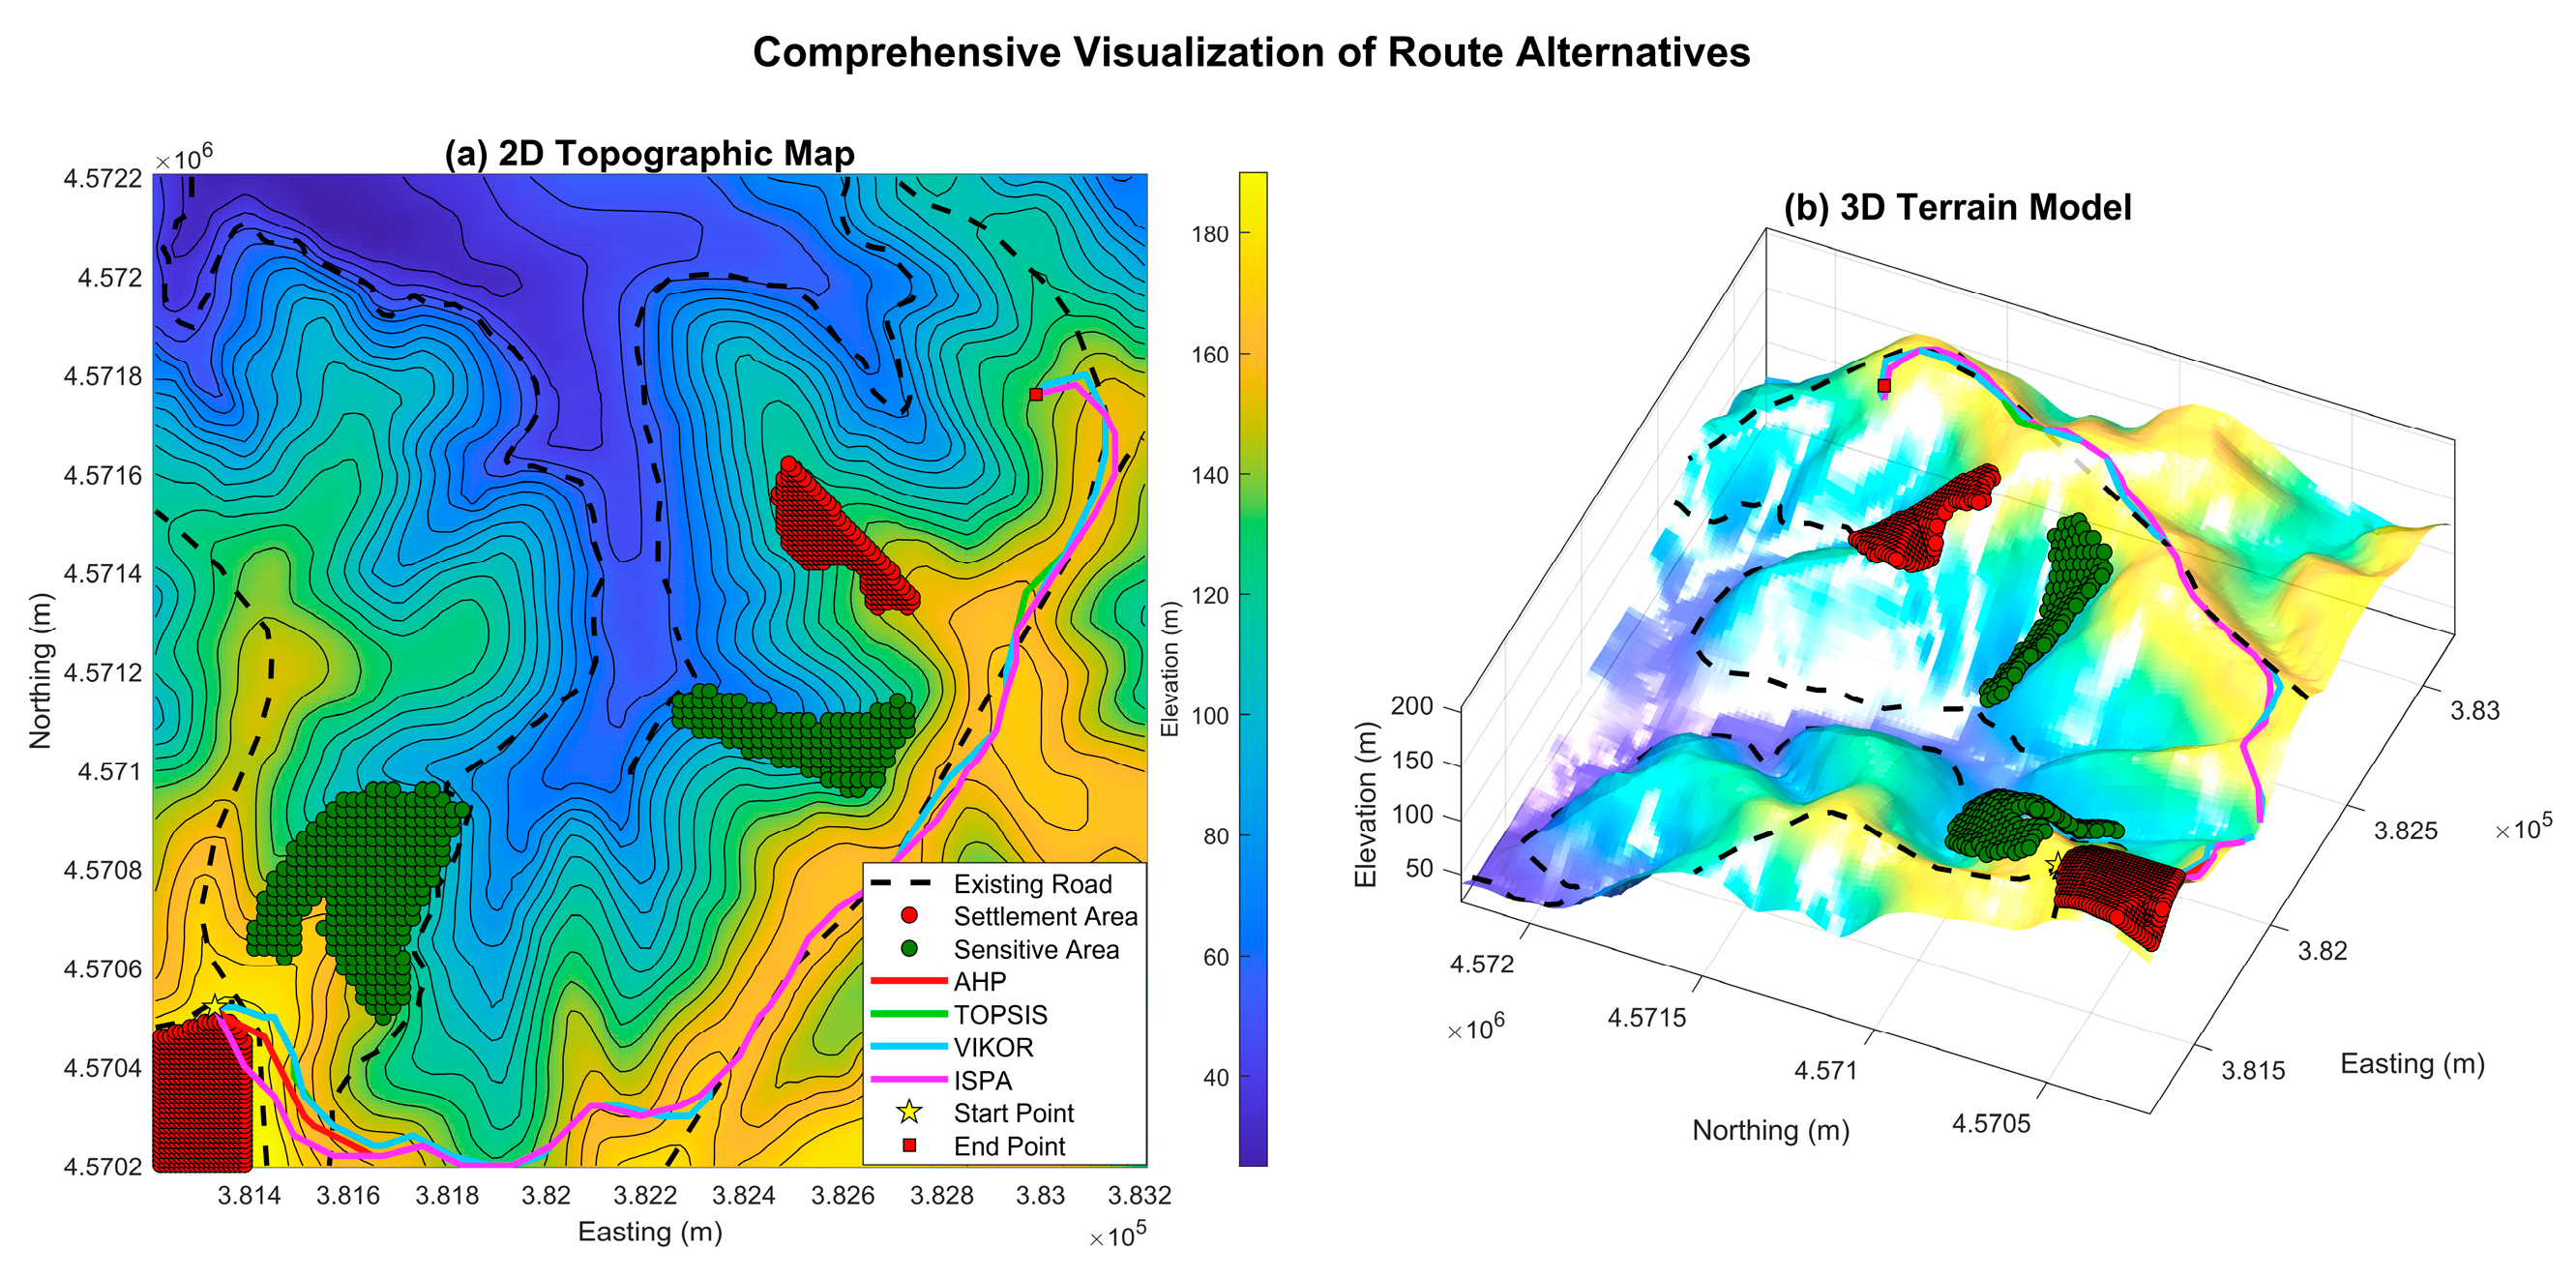
Table 1.
Evaluation Criteria for the Route Optimization Framework.
| Criterion Name | Symbol | Dimension Represented | Rationale and Role in Optimization |
| Slope | C_slope | Engineering / Cost | Directly influences construction costs (earthworks), operational efficiency (fuel consumption), and traffic safety. High slope values are undesirable. |
| Proximity to Roads | C_road | Economic | Proximity to existing road corridors reduces land acquisition needs and construction costs. Being closer is generally preferred for cost-effectiveness. |
| Proximity to Settlements | C_settle | Social | Proximity to settlement areas can lead to negative social impacts such as noise and expropriation, while distance can cause accessibility issues. |
| Proximity to Sensitive Areas | C_sensitive | Environmental | Avoiding ecologically valuable zones (e.g., forests, wetlands) minimizes the project's environmental footprint. Being further away is generally preferred. |
Table 2.
Interpretation of criteria as Benefit (B) or Cost (C) across the three engineering scenarios.
Table 2.
Interpretation of criteria as Benefit (B) or Cost (C) across the three engineering scenarios.
| Criterion/Symbol | Scenario 1: Rural Highway | Scenario 2: Pipeline Corridor | Scenario 3: Trekking Trail |
| Slope / Cslope | C | C | C |
| Proximity to Roads / Croad | B | C | C |
| Proximity to Settlements / Csettle | B | B | B |
| Proximity to Sensitive Areas / Csensitive | B | B | B |
Table 3.
Calibrated model parameters for the three engineering scenarios.
| Parameter | Symbol | Sc.* 1: Highway | Sc.* 2: Pipeline | Sc.* 3: Trekking | Rationale and Justification |
| Netw. Analysis Settings | |||||
| Neighborhood Search Distance (m) | dmax | 100 | 50 | 120 | Determines graph connectivity and the sensitivity of the route to terrain details. |
| Engineering Constraints | |||||
| Max. Allowable Slope (%) | αmax | 12 | 30 | 25 | A hard constraint defining physical passability; strict for highways, more flexible for others. |
| Ascent Penalty Factor | βuphill | 0.2 | 0.0 | -0.1 | A soft constraint modeling operational cost (fuel, effort). It is zero for the pipeline and a reward for the trekking trail. |
| Cost Function Settings | |||||
| Suitability Impact Factor | λ | 15 | 5 | 30 | Defines the penalty for traversing areas with low suitability scores. Highest for the aesthetics-driven trekking trail. |
| Scoring Settings | |||||
| ISPA Iterations | K | 3 | 2 | 4 | Determines the spatial receptive field of ISPA. More iterations are used for organic paths. |
| AHP Contrast Factor | γAHP | 3 | 1 | 4 | Enhances the discriminability of AHP scores. Set to 1 for the pipeline, which focuses on the shortest path. |
| TOPSIS Contrast Factor | γTOPSIS | 3 | 1 | 4 | Enhances the discriminability of TOPSIS scores, adjusted with the same logic as AHP. |
| VIKOR Contrast Factor | γVIKOR | 1 | 1 | 1 | The natural score distribution of VIKOR is often sufficiently discriminative; no additional contrast enhancement was applied. |
| ISPA Contrast Factor | γISPA | 1 | 1 | 1 | ISPA naturally enhances its own contrast through iterative propagation; no additional intervention was needed. |
* Sc. is an abbreviation for Scenario.
Table 4.
AHP pairwise comparison matrices and derived subjective weights (wsub) for the three engineering scenarios.
Table 4.
AHP pairwise comparison matrices and derived subjective weights (wsub) for the three engineering scenarios.
| Scenario | Criterion | Slope | Proximity to Roads | Proximity to Settlements | Proximity to Sensitive Areas | Weight |
| 1. Rural Highway | Slope | 1 | 3 | 5 | 5 | 0.577 |
| (CR: 0.03)* | Proximity to Roads | 1/3 | 1 | 3 | 3 | 0.254 |
| Proximity to Settlements | 1/5 | 1/3 | 1 | 1 | 0.084 | |
| Proximity to Sensitive Areas | 1/5 | 1/3 | 1 | 1 | 0.084 | |
| 2. Pipeline | Slope | 1 | 7 | 3 | 1 | 0.463 |
| (CR: 0.06)* | Proximity to Roads | 1/7 | 1 | 1/5 | 1/7 | 0.046 |
| Proximity to Settlements | 1/3 | 5 | 1 | 1/3 | 0.198 | |
| Proximity to Sensitive Areas | 1 | 7 | 3 | 1 | 0.293 | |
| 3. Trekking Trail | Slope | 1 | 3 | 3 | 1/5 | 0.158 |
| (CR: 0.05)* | Proximity to Roads | 1/3 | 1 | 1 | 1/7 | 0.082 |
| Proximity to Settlements | 1/3 | 1 | 1 | 1/7 | 0.082 | |
| Proximity to Sensitive Areas | 5 | 7 | 7 | 1 | 0.678 |
* CR stands for Consistency Ratio; a value ≤ 0.10 indicates that the pairwise judgments are acceptably consistent.
Table 5.
Performance metrics for the optimal routes in Scenario 1 (Rural Highway, Objective Analysis).
Table 5.
Performance metrics for the optimal routes in Scenario 1 (Rural Highway, Objective Analysis).
| Method | Algorithmic Cost | Total 3D Length (m) | Mean Slope (%) | Max. Slope (%) | Total Ascent (m) | Unsuitable Dist. * (m) |
| WLC | 18,171.47 | 3,686.42 | 7.11 | 12.00 | 114.72 | 83.01 |
| TOPSIS | 19,998.60 | 3,442.65 | 7.75 | 12.00 | 111.41 | 190.21 |
| VIKOR | 21,631.13 | 3,407.42 | 7.79 | 12.00 | 111.81 | 701.37 |
| ISPA | 18,463.92 | 3,380.39 | 7.52 | 11.89 | 106.20 | 363.46 |
* Distance where the final suitability score is below the scenario-specific mean.
Table 8.
Performance metrics for the optimal routes in Scenario 1 (Rural Highway, Subjective Analysis).
Table 8.
Performance metrics for the optimal routes in Scenario 1 (Rural Highway, Subjective Analysis).
| Method | Algorithmic Cost | Total 3D Length (m) | Mean Slope (%) | Max. Slope (%) | Total Ascent (m) | Unsuitable Dist. (m) | |
| WLC (AHP-LCP) | 21,451.22 | 3,069.01 | 5.05 | 11.98 | 58.86 | 702.57 | |
| TOPSIS | 20,772.19 | 3,090.83 | 4.93 | 11.98 | 60.92 | 751.89 | |
| VIKOR | 14,225.99 | 3,082.88 | 5.11 | 11.98 | 60.92 | 317.41 | |
| ISPA | 16,277.25 | 3,049.86 | 5.25 | 11.90 | 62.25 | 394.14 | |
Table 11.
Robustness scores of the methods under the objective and subjective analysis streams.
| Analysis Stream | Method | Overall Performance Mean | Performance Stability Score | Final Score |
| Objective | ISPA | 0.627 | 0.668 | 0.647 |
| (Entropy) | VIKOR | 0.578 | 1.000 | 0.789 |
| WLC | 0.546 | 0.185 | 0.366 | |
| TOPSIS | 0.520 | 0.000 | 0.260 | |
| Subjective | ISPA | 0.556 | 1.000 | 0.778 |
| (AHP) | TOPSIS | 0.431 | 0.786 | 0.609 |
| WLC (AHP-LCP) | 0.421 | 0.661 | 0.541 | |
| VIKOR | 0.477 | 0.000 | 0.238 |
Table 12.
Holistic synthesis of method performance and robustness.
| Method | Overall Mean Performance | Overall Performance Std. Dev. | Overall Stability Score | Final Holistic Score |
| ISPA | 0.629 | 0.094 | 1.000 | 0.815 |
| VIKOR | 0.582 | 0.123 | 0.000 | 0.291 |
| TOPSIS | 0.557 | 0.114 | 0.295 | 0.426 |
| WLC | 0.557 | 0.118 | 0.166 | 0.362 |
Disclaimer/Publisher’s Note: The statements, opinions and data contained in all publications are solely those of the individual author(s) and contributor(s) and not of MDPI and/or the editor(s). MDPI and/or the editor(s) disclaim responsibility for any injury to people or property resulting from any ideas, methods, instructions or products referred to in the content. |
© 2025 by the authors. Licensee MDPI, Basel, Switzerland. This article is an open access article distributed under the terms and conditions of the Creative Commons Attribution (CC BY) license (http://creativecommons.org/licenses/by/4.0/).
Copyright: This open access article is published under a Creative Commons CC BY 4.0 license, which permit the free download, distribution, and reuse, provided that the author and preprint are cited in any reuse.


