
Submitted:
11 October 2025
Posted:
11 October 2025
You are already at the latest version
Abstract
Modern automotive design has increasingly embraced plastics for bumper construction, however it can lead to material degradation. To overcome these limitations, the automotive industry is turning to fiber‑resin material, namely carbon-epoxy composites. Our research focuses on knowing layer thickness and orientation angles effect into structural stress of car bumper, examining the combinations of material into the impact strength, and performing impact tests in various speeds. To build research gaps, machine learning (ML) has an important position to predict the certain value of parameters and measure data normality through various algorithms. By combining ML and FEA simulations, the result shows strong data performance. Bridging from 3 mm mesh sizing of 100% carbon-epoxy woven laminate in 6 mm thickness at 0° orientation shows the most distributed von Mises stresses which converged toward stable values. The elevated impact velocities improve stress magnitudes at 10.247 MPa, 16.857 MPa, and 23.438 MPa in 11.11 m/s, 15.61 m/s, and 22.22 m/s, respectively. For comprehensive research, total deformation was included in ML analysis as second targets to build multivariate analysis. Overall, Random Forest (RF) shows as the best model which indicates MSE (0.18) and R² (0.79), indicating superior robustness when modeling equivalent stress and total deformation.
Keywords:
car bumper
; carbon-epoxy composite
; explicit dynamics
; machine learning
; static structural
1. Introduction
Road traffic accidents remain one of the leading causes of injury and mortality worldwide [1]. With rapid urbanization and a growing global population, personal and commercial transportation has become increasingly indispensable, leading to an exponential rise in the number of vehicles on our roads. Technological advancements have enabled drivers to cover greater distances in less time, yet this very capability, when coupled with lapses in attention and habitual speeding, has dramatically elevated the risk of collisions. As cars cruise at ever-higher speeds, the likelihood of severe and often fatal crashes intensifies, driving road-traffic fatalities to alarming levels. Based on the data from the World Health Organization through Chang et al., (2020) research, fatalities from road traffic collisions have climbed markedly over the past two decades, rising from approximately 1.15 million in 2000 to around 1.35 million by 2018 [2]. These figures mean that of the roughly 56.9 million people who die each year, nearly 2.4% succumb to injuries sustained in vehicle crashes making traffic accidents the eighth leading cause of death worldwide. Beyond the human toll, these losses carry significant economic and social costs, disproportionately affecting young adults and low- and middle-income countries [3] [4]. The growing magnitude of this public-health crisis underscores the imperative for enhanced vehicle safety technologies, more rigorous enforcement of traffic regulations, and coordinated global efforts such as the UN’s Decade of Action for Road Safety [5]. By focusing on vehicle safety technologies to support safety regulation, the most impacted component in such incidents is the car bumper, which plays a vital role in absorbing and dissipating kinetic energy during crashes for better safety and improving car’s performance [6]. As the first line of defense in frontal and rear-end collisions, the bumper is crucial not only in minimizing damage to the vehicle’s body but also in reducing the force transmitted to passengers, thereby lowering the risk of severe injury or death. However, the increasing frequency of high-impact accidents highlights the need for more resilient and efficient bumper designs.
Modern automotive design has increasingly embraced plastics for bumper construction, leveraging their unique blend of functional and aesthetic benefits. Unlike traditional metal counterparts, plastic bumpers can be engineered from recyclable polymers, aligning with environmental sustainability goals and facilitating end-of-life material recovery [7]. Their inherent flexibility allows for cost-effective repairs minor dents and scratches can often be remedied with simple heat treatments or plastic fillers rather than full panel replacements [8], thereby reducing maintenance expenses for vehicle owners. Furthermore, advanced plastic composites now match or even surpass the energy-absorbing performance of steel as carried out in research which conducted by Tsirogiannis, et al., (2024) [9], dissipating collision forces effectively to protect both the vehicle’s structure and its occupants. Beyond these practical merits, plastics offer designers a broader palette of textures, colors, and form factors [10], enabling sleek, aerodynamic profiles that enhance a vehicle’s visual appeal without compromising safety.
Over time, repeated exposure to ultraviolet light and temperature fluctuations can lead to material degradation, causing discoloration, surface cracking, and embrittlement that compromise both appearance and structural integrity [11]. Additionally, conventional thermoplastic, like polypropylene bumpers, may lack sufficient stiffness and strength for high-energy impacts [12], sometimes transferring more force to underlying vehicle structures and occupants. To overcome these limitations, the automotive industry is increasingly turning to fiber-resin reinforced composites [13], such as carbon fiber laminates which combine a polymer matrix with high-compatibility with fibers [14]. These hybrid materials not only retain the lightweight, form-flexible advantages of plastics but also deliver superior specific stiffness and strength, enhanced fatigue resistance, and improved crashworthiness through tailored layups that dissipate energy more efficiently. By adopting composite bumpers, manufacturers can achieve a harmonious balance of aesthetics, sustainability, and safety which may provide vehicles with bumpers that remain durable under harsh environmental conditions and offer enhanced protection in severe collisions.
Relevant researches were conducted by Abrar et al., (2024); Rajan et al., (2024); Yeshanew et al., (2023), which give insight into leveraging virtual testing via ANSYS to examine the crash testing on composite bumper, especially providing various results in different material with simple simulations through explicit dynamics or LS-DYNA [15], [16], [17]. This research employs ANSYS simulations to investigate frontal collision dynamics and the structural response of vehicle components under complex crash conditions. While these efforts have focused on bumper assemblies in two different orientations: epoxy carbon UD (unidirectional) and woven prepreg with MAT 54, material choice remains pivotal. The potential of hybrid multi-material bumper beams warrants further exploration.
To build unique outcomes, this study aims to address the research gap by: (1) predicting the stress and deformation of materials on assigned bumper design in different layer amounts, (2) examining the effect of single and double layer into the material performance, (3) assessing how the resulting materials combination affects the impact strength of car bumper, and (4) performing impact tests on car bumper in various speed controls with selected material and mass fraction. All investigations were carried out under static structural testing conditions. Additionally, this research is reinforced by machine learning (ML) that it is important to assess the influence of each parameter and identify the most significant ones, as well as predict the certain value of parameters through various algorithms. ML has emerged as a powerful approach to this problem, offering feature selection, enhanced predictive performance, validating the results, and greater computational efficiency, while also improving model interpretability and data quality. In this study, the authors integrate multiple features identifying techniques to predict the target parameters via bivariate analysis.
Based on our purpose, an optimally selected bumper material was evaluated into explicit dynamics simulations for low-high speed impacts to assess frontal impact. Using finely meshed finite-element models and realistic boundary conditions, each crash scenario was modeled to capture the nonlinear material behavior, large deformations, and contact interactions that occur during collision events. Key performance metrics, including peak impact force, energy dissipated, and maximum displacement, were recorded for comparison across speed regimes. By analyzing how the chosen material’s stress-strain response evolves under varying impact velocities, we were able to verify its suitability for real-world crashworthiness applications and identify any thresholds beyond which additional reinforcement or hybridization might be necessary. This comprehensive simulation framework thus provides critical insight into material performance under dynamic loading and guides the development of safer, lighter bumper systems.
2. Materials and Methods
2.1. Bumper Design Overview
The car bumper is the very front of the vehicle designed to absorb impact energy during a low-speed collision, thereby protecting internal components such as the engine bay and vehicle safety systems from physical damage [18]. In addition, the front bumper also serves to reduce damage to the vehicle and improve pedestrian safety in some modern designs [19]. Front bumper design involves several aspects. The bumper design should be able to effectively absorb impact energy through plastic deformation of the bumper beam and energy absorber, so that the impact force is not directly transmitted to the main structure of the vehicle. Bumpers consist of energy absorber and bumper reinforcement. The materials used vary from steel, aluminum, ABS plastic, to composite materials such as glass fiber or natural fiber to reduce weight and increase energy absorption [20].
The cross-sectional geometry model greatly affects crashworthiness, the ability to absorb energy and resist deformation in a crash. In addition, the front bumper has a significant function in protecting passengers, as well as minimizing pedestrian injuries [21]. In this study, the simulated front bumper geometry is in the form of a hollow cross section. Closed Hollow models are used to increase strength and ease of integration of towing devices. Through Figure 1, car bumper design shows the geometry dimensions of low bumper type that depict bumper height and bumper width resulting in safer pedestrian foot protection. The dominant value of low bumper dimensions in the clearance between the car and the ground reduces the risk of foot injuries [22]. Front Profile front bumpers have a low and sloped profile model. This profile was chosen because it significantly reduces the risk of pedestrian fatalities compared to the high profile. The optimal thickness of the front bumper in this study varied from 2 6 mm according to the thickness of the composite ply.
The process of creating a 3D geometry of the Front Bumper using Autodesk Inventor with a surface model. The geometry is exported and then the thickness is defined according to the number of composite laminates using ANSYS ACP. Furthermore, the Static Structural analysis process is carried out to measure the Equivalent Stress and Total Deformation reliability of the model.
2.2. Assigned Materials
To evaluate the performance of each parameter, the material selected for constructing the car bumper was identified. Similar conducted material was evaluated by Lotfy, et al., (2020) who examine the dynamic behavior of transverse eccentric moving load from carbon UD and woven with epoxy resin matrix via ANSYS simulation [23]. They conclude that carbon-epoxy composite possesses significantly lower densities compared to structural steel, leading to a substantial reduction in the overall mass of the bumper and, consequently, the vehicle. By replacing it with composite materials significantly reduces weight due to their inherently lower densities. This reduction in mass not only lessens the overall burden on the vehicle but also contributes to improved fuel efficiency, better handling, and enhanced crash energy management without compromising structural integrity. Through this study, the selection of bumper materials was critically evaluated to carbon fiber with reinforced epoxy matrix that demonstrated superior performance (see Table 1). By integrating these lightweight yet durable composites, the study highlights their potential as a promising alternative to conventional metals, promoting not only improved impact resistance but also contributing to sustainable and high-performance automotive design.
Table 1 presents a comparative property of two types of carbon–epoxy composite materials in different orientation, unidirectional and woven. The unidirectional composite exhibits a significantly higher Young’s modulus in the X-direction (121,000 MPa), which highlights its superior stiffness along the fiber direction, compared to the woven composite’s 61,340 MPa. In contrast, both materials show similar stiffness values in the Y-direction (8,600 MPa for unidirectional, 61,340 MPa for woven) and slightly lower moduli in the Z-direction. The compressive strength follows a similar trend: the unidirectional type offers much greater load resistance in the fiber direction (−1,082 MPa in X) relative to the woven counterpart (−509 MPa). However, in the Y and Z directions, the woven material maintains slightly higher compressive strength, suggesting better isotropic behavior under multi-axial stress states.
In terms of shear and Poisson properties, the unidirectional material again demonstrates stronger mechanical characteristics in the X and Z shear directions (4,700 MPa), while the woven material has lower values across all directions. Poisson ratios for the unidirectional composite are considerably higher in Y (0.40), reflecting more transverse strain under axial load, while the woven composite shows a more balanced response with ratios close to 0.3. Lastly, the unidirectional composite has a slightly higher density (1,490 kg/m³) than the woven type (1,420 kg/m³), likely due to its more aligned fiber structure. Overall, the unidirectional composite is more mechanically efficient along the primary fiber direction, whereas the woven type provides a more balanced but lower-performance alternative across multiple directions.
2.3. Mesh Convergence
Meshing in 3D modeling refers to the creation and analysis of a network composed of small, interconnected elements used to simulate and evaluate system behavior [24]. The mesh modeling process begins with importing a 3D CAD model into a mesh reconstruction network, which produces a deformation map. This map is used to reshape a predefined template mesh to fit the desired geometry, while also generating a preliminary low-resolution texture. Following this, the CAD model, deformation map, and low-resolution texture are fed into a texture reconstruction network, which synthesizes a detailed, high-resolution texture. During the training phase, the mesh reconstruction network is refined by comparing its rendered outputs with the ground-truth meshes. The reconstruction loss calculated by evaluating differences among the rendered object, predicted mesh, and annotated ground truth serves as feedback to enhance both the geometric precision and texture quality of the resulting mesh.
In this study, the frame structure was discretized using a in different body sizing (3 – 5 mm) at linear element order, resulting in various element amount. Initially, a default mesh configuration was applied, producing approximately 4166 elements. To ensure that the simulation results were not significantly affected by mesh density or overly high computational costs, a mesh independence study was conducted. This validation involved generating three different mesh configurations with element counts. As shown in Figure 2, the maximum stress values were evaluated for each mesh density.
Figure 2 illustrates the inverse relationship between the body sizing element size (mm) and the number of generated mesh features in a mesh or finite element model. As the body sizing element size increases from 3.0 mm to 5.0 mm, the number of generated nodes and elements significantly decreases from approximately 38,000 to 14,000. The mesh size directly influences both the accuracy of the simulation results and the total number of generated mesh features during the meshing process [25]. This trend reflects a typical meshing behavior in computational modeling, where smaller element sizes lead to a finer mesh and consequently a higher number of nodes and elements, improving accuracy but increasing computational cost. Conversely, larger element sizes reduce the mesh density, lowering computational demand but potentially compromising result precision.
Through Figure 3, a full mesh of elements is seen covering the bumper geometry, revealing a uniformly distributed grid of quadrilateral elements. At a body sizing element size of 3 mm, the mesh is sufficiently fine to capture even subtle curvature and cut-out features, resulting in a high total element count and smooth approximation of the surface. Notice how the element edges conform closely to the geometry with minimal distortion, ensuring that critical load paths and stress-concentration zones will be resolved accurately in subsequent analyses. Meanwhile, the bottom views zoom in on a localized region: on the left, the magnified mesh illustrates the consistent element sizing and clean, orthogonal pattern around a complex cut-out profile, while on the right, the red ellipse highlights a typical quadrilateral patch. Here, each quad element displays nearly equal edge lengths and interior angles close to 90°, a hallmark of good mesh quality that helps avoid numerical stiffness and solution artifacts. The smooth gradation from smaller quads around geometric details to slightly larger quads on flatter areas also demonstrates a well-implemented mesh-sizing strategy that balances accuracy with computational efficiency.
2.4. Defining Composite Layers
Through this study, five different stacking layers composed of carbon epoxy composites were examined, as illustrated in Figure 4. Each configuration was subjected to two types of orientations and five angles to enable a consistent comparison of static structural features and specific energy absorption (internal and kinetics). The different layer thickness was examined from 2 – 6 mm was chosen based to examine the significance of the target parameters by defining each layer of composite defined as 1 mm. This configuration relevant with prior finding was conducted by Ren et al., (2025) who provided the insight of research at same configuration in bumper for spacecraft shield application [26].
Figure 4 shows the full range of laminate architectures evaluated in this study, highlighting both the effect of ply count from two to six layers and the influence of fiber orientation and stacking angle. For each layer count, alternating plies were sequentially stacked using either unidirectional or woven reinforcement; single-angle layups (0°, 45°, or 90°) and symmetric, double-angle configurations (45°/-45° and 0°/90°) were employed to capture variations in in-plane stiffness and interlaminar behavior. By systematically varying the total number of interfaces alongside the fiber architecture, we achieved a matrix of specimens enabling a comprehensive assessment of how layer count, ply orientation, and angle selection govern mechanical performance, damage initiation, and failure progression.
All simulations were conducted in the ANSYS ACP environment within Mechanical APDL following a structured workflow. Constituent material properties for fiber and matrix phases, such as elastic moduli, poisson’s ratios, and strengths, were entered into the engineering data module and combined to create orthotropic laminate definitions. The specimen geometry was then imported and assigned a composite section. In ACP Layup, a new layup was created for each test configuration: the total ply count was specified, and each ply was defined by its material, thickness, orientation angle (0°, ±45°, 90°) and fiber architecture (unidirectional or woven). After confirming the stacking sequence in the layup viewer, the model was discretized using SHELL281 elements (composite option enabled) with mesh controls set to capture expected stress gradients. Boundary conditions were applied to simulate grip and symmetrical constraints, and mechanical loads (tensile force or pressure) were imposed on the appropriate faces. A static structural analysis was specified, and output requests were configured to report ply-level stresses, interlaminar shear, and failure indices (Tsai–Wu and Hashin criteria). The analysis was executed, and post-processing in ACP Failure provided a ply-by-ply map of failure initiation, while global response metrics (displacement curves, stress distributions) were extracted in Mechanical APDL to evaluate the effects of stacking sequence and fiber orientation on laminate performance.
As shown in Figure 5, the outlines a three-stage, parameter-driven workflow in which the ACP (Pre) system defines the composite layup, material properties and detailed mesh, then passes that exact ply-resolved model into a Static Structural analysis to impose pre-loads and establish the service-state stress field, and finally transfers the pre-stressed configuration into an Explicit Dynamics simulation to capture the high-rate impact response. All three stages draw from a common Parameter Set, by leveraging a unified Parameter Set, users can batch-sweep any range of laminate, loading or boundary-condition variables in a single run automating hundreds of cases, slashing manual setup and overall turnaround time while guaranteeing consistent geometry, mesh and material definitions across all stages.
2.5. Bumper Impact Test
Impact testing is a test method used to assess the resistance and performance of a structure or component to impact loads. The test procedure typically involves applying an impact load of a specified energy, velocity, or force to the test object, and then measuring the response such as deformation, stress, or damage that occurs, to ensure that the component meets safety and functionality requirements [27]. Explicit Dynamic simulation can be used to predict design failures using impact test schemes. Explicit Dynamic is a finite element-based numerical method used to analyze the response of structures to very fast dynamic loads, such as impact or explosion, considering material nonlinearity, contact, and large deformations. In these simulations, time is divided into small steps and solutions are calculated explicitly at each step, making them particularly suitable for short-duration events and extreme changes in conditions [28]. These simulations allow detailed prediction of structural behavior without the need to conduct repeated physical tests, thus speeding up the design and optimization process, and reducing development costs. Simulation validation is usually performed by comparing numerical results with experimental data to ensure model accuracy.
Impact simulation using Explicit Dynamics for a car front bumper starts by modeling the geometry of the bumper and related components using Autodesk Inventor software and then importing them into ANSYS for pre-processing. Next, the contact between the bumper and the collision object is defined as seen in Figure 6. The contact surface is defined as a rigid wall by defining the relevant materials. The main boundary conditions that need to be set include fixation of the bumper mounting points by locking translation and rotation in the area and defining the velocity or impact force on the bumper surface according to the Frontal Impact scenario [29]. Velocity varies in three speeds based on NHTSA Tests [30]. Code TC 1.1.3 with a velocity of 80 km/h = 22.222 m/sec, code TC 1.1.2 with a velocity of 56.2 km/h = 15.611 m/sec, and code TC 1.1.1 with a velocity of 40 km/h = 11.111 m/sec. After that, mesh with element sizes varying from 6 mm to 10 and then calculating the mesh convergence rate to obtain accurate results with optimum time. The selection of a mesh size of 6-11 mm is recommended for structural analysis that requires a balance between detailed results and computation time, with further customization based on the specific needs of the geometry [31].
The analysis of Explicit Dynamic simulation results of automobile front bumpers focuses on several key parameters, such as deformation, energy absorption, stress distribution, and acceleration due to impact. This simulation allows real-time visualization of the deformation of the structure during the impact process, so that the most severely damaged areas can be identified and how the impact energy is absorbed by the bumper material. The simulation results show the maximum deflection value and von Mises stress distribution, which are crucial for assessing the effectiveness of the design in protecting the components behind it [32]. In addition, the analysis of internal energy and kinetic energy helps to evaluate how much impact energy is successfully absorbed by the bumper, which is directly related to crashworthiness. The simulation results also compare the design performance at various speeds, supporting the design performance. Thus, the analysis of Explicit Dynamic simulation results provides a comprehensive picture of the structural behavior during impact and becomes an important tool in the development of vehicle safety systems.
The analysis of Explicit Dynamic simulation results of automobile front bumpers focuses on several key parameters, such as deformation, energy absorption, stress distribution, and acceleration due to impact. This simulation allows real-time visualization of the deformation of the structure during the impact process, so that the most severely damaged areas can be identified and how the impact energy is absorbed by the bumper material. The simulation results show the maximum deflection value and von Mises stress distribution, which are crucial for assessing the effectiveness of the design in protecting the components behind it [32]. In addition, the analysis of internal energy and kinetic energy helps to evaluate how much impact energy is successfully absorbed by the bumper, which is directly related to crashworthiness. The simulation results also compare the design performance at various speeds, supporting the design performance. Thus, the analysis of Explicit Dynamic simulation results provides a comprehensive picture of the structural behavior during impact and becomes an important tool in the development of vehicle safety systems.
2.6. Machine-Learning Driven Analysis
A supervised machine-learning approach was employed to forecast and assess the normal distribution of ANSYS simulation results. The model was trained on a dataset consisting of 12 variables, which were designated as input features, and five parameters as prediction targets with the size of 17 x 1450. Here, features consist of standardized data points sharing a common coordinate framework and serving to inform the model, while targets represent the specific outcomes the research aims to predict. The workflow followed a typical machine learning pipeline beginning with data preprocessing and exploratory data analysis, proceeding through model training and model evaluation with concluding in results visualization. Since our dataset consists of multiple targets, we performed multivariate analysis for more than one performance target.
2.6.1. Data Pre-Processing
Data preprocessing is a critical step that readies the dataset for effective learning by removing irrelevant variables, converting data types, and handling missing values, as well as performing column and row cleaning, feature coding, and data normalization [33]. In our dataset, load and safety factor each had 18 missing entries, while speed, internal energy, and kinetic energy were missing in 1,430 out of 1,450 cases. Because the latter three variables exceeded 98 % missingness and only applied in specialized scenarios, we dropped them entirely. For load and safety factors under 1.3 %, we applied median imputation. After these actions, we performed multivariate validation by inspecting pairwise correlations to uncover unexpected dependencies, applying outlier detection to flag anomalous observations, and checking distributional consistency across subgroups. These steps ensure that the remaining features are complete, coherent, and representative before model training.
2.6.2. Exploratory Data Analysis
EDA is an important step in the data analysis process that uses statistical and visualization techniques to examine datasets, discover patterns, find anomalies, test hypotheses, and check assumptions [34]. Features and targets constitute the core elements of the dataset, which captures how multiple variables influence the average temperature. This dataset, generated from experimental studies conducted in all ANSYS simulations, includes 12 input features (material types, mesh convergence, ply amount, angle, load, speed, density, volume fraction, mass, volume, mesh nodes, mesh element) and five response variables (equivalent stress, total deformation, safety factor, internal energy, kinetics energy). Exploratory data analysis (EDA) plays a critical role, employing statistical summaries and graphical techniques to reveal underlying patterns, detect outliers, validate assumptions, and guide hypothesis testing.
The statistical profile of our data set is 1,450 number, reporting for each variable its meaning, standard deviation and key percentiles (0 %, 5 %, 50 %, 95 % and 100 %). The first six entries (material type, mesh convergence, ply count, fiber angle, applied load and density) characterize the composite geometry and boundary conditions. Volume fraction, mass, and overall component volume follow, alongside mesh resolution metrics (total nodes and elements). Furthermore, equivalent stress and total deformation quantify the primary structural responses under quasi-static loading. We have excluded additional response variables, namely safety factors, internal energy and kinetic energy, from further analysis because each exhibited over 50 % missing values and only appeared in specific experimental subsets rather than consistently across all simulation scenarios.
2.6.3. Multivariate Analysis
Multivariate analysis refers to a statistical technique that simultaneously evaluates several outcome measures, such as various adverse events while accounting for multiple predictors in one comprehensive model, enabling unbiased and precise estimation of each parameter [35]. Multivariate analysis refers to a statistical technique that simultaneously evaluates several outcome measures such as various adverse events while accounting for multiple predictors in a single comprehensive model, enabling unbiased and precise estimation of each parameter. To verify the assumptions underlying this approach, we examine the distribution of each response variable using histograms and quantile quantile (Q–Q) plots: histograms reveal the empirical frequency distribution of each outcome, while Q–Q plots compare observed quantiles against those of a theoretical normal distribution. Together, these graphical diagnostics confirm whether the multivariate targets satisfy the normality assumption required for valid inference and guide any necessary transformations prior to model fitting.
2.6.4. Train-Test & Model Evaluation
The model’s performance was evaluated using mean squared error (MSE), and the coefficient of determination (R²). This research demonstrated various regression techniques and their associated metrics with employing MSE, and R² to gauge regression accuracy. In this concise report, we focus solely on R² to measure predictive quality. MSE represents quantifies the average squared difference between predicted and actual values that is accounted for by the independent variables, as defined in Equation (1).
In essence, R² quantifies the fraction of variability in the dependent variable that is accounted for by the independent variables, as defined in Equation (2).
(Desired value: 1, closer is better)
In this expression, Xi and Yi represent the observed and predicted values of the response variable for the i-th sample, respectively. It is common practice to allocate 80 % of the data for model training and reserve the remaining 20 % for testing, which aids in both visualizing and evaluating model performance.
Python scripts were implemented to facilitate rapid prediction and assessment across a broad suite of regression algorithms. These techniques, which extrapolate from experimental observations, encompass six primary models (1) Linear Regression, (2) Random Forest, (3) Support Vector Regressor (SVR), and (4) K-Nearest Neighbors each selected for its distinct strengths and applicability to time-series forecasting. Moreover, stochastic noise generators were embedded throughout the code to simulate real-world variability, ensuring that each model is trained and evaluated under diverse conditions and thereby bolstering the robustness of our machine-learning framework.
3. Results and Discussion
3.1. Effect of Ply Number to Equivalent Stress in Various Mesh Convergence
As preliminary result, we investigate how varying the number of composite plies influences the equivalent von Mises stress distributions under different mesh densities to ensure solution convergence. Specimens with 2 – 6 plies were modeled using a sequence of quadrilateral meshes from coarse (5 mm in 13754 elements) to fine (3 mm in 37739 elements) and subjected to identical loading and boundary conditions. As mesh refinement progressed, peak von Mises stresses converged toward stable values, revealing that specimens with fewer plies exhibited higher stress concentrations, while those with increased ply counts demonstrated more uniform stress fields due to enhanced through-thickness stiffness.
Figure 7 shows the variation of equivalent von Mises stress with increasing ply number (from 2 to 6 plies) for three mesh densities (3 mm, 4 mm, and 5 mm element size) under two loading conditions in carbon epoxy composite with UD and woven. In the unidirectional (UD) layup under 100 N (see Figure 7a), all three meshes agree closely beyond three plies, but at three plies the 4 mm mesh noticeably overpredicts the peak von Mises stress of 4.9 MPa versus 2.4 MPa for the 3 mm and 5 mm meshes. This occurs because the three-ply UD laminate is quite thin and exhibits steep through-thickness stress gradients: the intermediate mesh size happens to place element boundaries right at locations of high gradient, artificially amplifying the computed stress. The finest mesh can resolve the gradient more evenly, while the coarsest mesh smears out just enough to bring its prediction back in line, explaining why the 5 mm mesh under and the 4 mm mesh over-predict in this case.
Under the doubled load of 200 N (see Figure 7b), the same UD trend intensifies: the 5 mm mesh overestimates by more than 20 % at two plies (10.1 MPa vs. 8.2 MPa for the finer meshes), while at three plies all meshes converge around 4.7 MPa. The larger load magnifies stress peaks and thus the sensitivity to mesh placement. In thin UD laminates, the load path is carried almost entirely along the fiber direction, producing sharp local concentrations. Finer meshes capture these peaks accurately; coarser meshes that accidentally align element faces with high gradient zones either exaggerate or underplay those concentrations depending on their spacing.
Switching to the woven layup at 100 N (see Figure 7c), similar behavior appears but generally lower sensitivity: at two plies the 4 mm mesh overpredicts by roughly 15 % (4.8 MPa vs. 4.1 MPa), while the 5 mm mesh underpredicts by about 5 %. Woven architectures distribute load in two in-plane directions, giving inherently smoother stress fields than UD plies. As a result, the stress gradients in thin woven laminates are less severe, reducing but not eliminating the mesh-sensitivity. By three plies, all meshes fall within a 3 % band of each other, showing that the woven texture accelerates mesh convergence.
Under 200 N (see Figure 7d), the woven layup again smooths out mesh discrepancies even more: differences at two plies shrink to under 8 % between the finest and coarsest meshes, and by three plies all meshes are nearly indistinguishable. The higher stiffness contributed by the crisscross fiber arrangement, plus the increased ply count, further dampens localized stress peaks so much so that even a 5 mm mesh resolves the stress field well. In practice, this means analysts modeling woven composites can often use moderately coarse meshes once a minimum ply threshold is reached, whereas UD laminates demand finer meshes to achieve comparable accuracy.
These findings underscore the critical interplay between ply number and mesh resolution in accurately capturing stress magnitudes, suggesting that a minimum mesh sizing leads to refinement level which is essential, especially for low-ply laminates to avoid misleading assessments of structural performance. Lower mesh sizing demonstrates that low-ply laminates demand much finer meshes to accurately capture steep stress gradients, whereas higher ply counts inherently smooth the stress field and markedly reduce mesh-dependence.
Considering these convergence studies, the configuration meshed at 3 mm with 6 layers emerges as the optimal compromise between accuracy and computational efficiency. The 3 mm mesh reliably captures the steep stress gradients inherent to low-ply laminates especially under higher loads while avoiding the over or under-predictions seen with coarser meshes. By selecting 6 layers with a 3 mm element size for all subsequent investigations, the authors ensure that peak von Mises stresses are resolved with high fidelity without incurring the excessive solve times associated with even finer discretization. This choice provides a robust foundation for deeper parametric studies and design optimizations of composite structures.
3.2. Comparison of Single and Double Angle Layer
Building on our selection of six composite layers with 3 mm mesh as the baseline for its proven convergence and computational efficiency, we now extend our investigation to off-axis fiber orientations. In this section, we conduct a systematic comparison between single-angle (0°, 45°, or 90°) and double-angle (45°/-45° and 0°/90°) laminate sequences. Although our primary focus shifts to angle-ply configurations, we continue to include the UD and woven layups, both meshed at 3 mm with six layers to provide direct performance comparisons against the single and double-angle specimens. By retaining these baseline composites, we can more clearly quantify the benefits of off-axis fiber orientations in redistributing loads and reducing peak von Mises stresses relative to established UD and woven architectures. Also, we aim to quantify how ply orientation complexity influences stress gradients, and overall structural resilience into crash test. This analysis will inform the design trade-offs between manufacturing simplicity and mechanical performance, guiding the choice of optimal laminate architectures for applications demanding balanced strength and stiffness. Furthermore, it is visualized in Figure 8 as follows.
In Figure 8a (100 N load), UD laminates exhibit their lowest von Mises stresses at the 90° orientation for 0.645 MPa, reflecting the lowest axial stiffness of fibers oriented perpendicular to the load. Meanwhile, the lowest stress in woven was shown at 0° orientation accounting for 0.528 MPa. As the fiber angle moves toward 45°, stress initially goes down slightly (to 0.676 MPa for UD) and shows peak at 0.689 MPa for same angle, before peaking at the balanced 45°/-45° stacking (0.806 MPa for UD, 0.687 MPa for woven), where the combination of tensile and shear loads yields the highest stress concentration. The UD laminate shows a more pronounced peak than the woven due to its unidirectional nature, which accentuates shear-driven stress peaks at off-axis angles, whereas the woven fabric’s crisscross architecture moderates these spikes. As a result, the 0°/90° quasi-isotropic laminate returns to intermediate stress levels (0.663 MPa UD, 0.645 MPa woven), as the alternating fiber directions distribute load more evenly through the thickness.
Under the increased 200 N load (see Figure 8b), the same trends amplify: the UD 45°/-45° laminate again reaches the highest stress (1.677 MPa), an 18 % jump over its 0° value, while the woven 45°/-45° stack peaks at a more modest 1.424 MPa. The pure transverse (90°) case remains the lowest for UD materials (1.369 MPa), and the 0° orientation shows a 1.459 MPa stress in UD versus only 1.062 MPa in the woven. The larger load accentuates the UD laminate’s sensitivity to off-axis shear, driving its stress further above the woven counterpart, whose bidirectional fiber paths continue to smooth stress gradients. This comparison underscores how fiber orientation complexity and fabric architecture jointly influence stress magnitudes under higher loading.
Focusing on the comparative stress evaluations, the carbon-epoxy woven composite at 0° clearly offers the most balanced performance combining low von Mises stress, stable mesh convergence, and enhanced damage tolerance, so this layup will be adopted for all subsequent investigations. Its bidirectional fiber architecture not only moderates off-axis shear peaks evident in both the 100 N and 200 N cases but also enhanced damage tolerance, the authors therefore elect to proceed with the carbon-epoxy woven composite oriented at 0° for all subsequent analyses and design optimizations in next section.
3.3. Optimum Volume Fraction in Carbon Composite Combination
Having established the 0° carbon-epoxy woven laminate as our baseline material, we now turn to optimizing its fiber–matrix ratio to maximize mechanical performance. In this section, we investigate how varying the carbon-fiber volume fraction, from 20 % up to 100 %, affects key composite properties such as stiffness, strength, and weight. Through a combination of micromechanical modeling and finite-element simulations at each volume fraction, we aim to identify the optimal balance between load-bearing capacity and material efficiency, ensuring the chosen configuration meets both structural and manufacturing constraints for advanced composite applications. To elucidate the influence of woven reinforcement on the mechanical response of hybrid composites, this study combines a 6 mm carbon-epoxy woven fabric with a unidirectional (UD) carbon-epoxy layup in varying proportions. 100 % designation corresponds to a pure woven laminate, whereas 80 % level represents four-fifth of the total reinforcement plies as woven fabric and the remaining only 20 % as UD material. Lower percentages thus reflect a decreasing volume fraction of the woven component and a compensatory increase in the UD fraction. By systematically varying the relative amounts of these two architectures, we aim to characterize how the interplay between fiber orientation and the effect of wrinkles on fabric equivalent stress under normal loading.
Figure 9 illustrates how the von Mises stress in the composite varies with reinforcement content for normal loads between 100 N and 200 N. In every case, stress rises steeply from 20 % volume fraction () to a maximum at approximately 40 %, then declines steadily through to full reinforcement. Under a 100 N load, equivalent stress climbs from 0.65 MPa at 20 % to 0.78 MPa at 40 % before dropping back to 0.63 MPa at 100 %. At the upper bound of 200 N, the peak reaches 1.58 MPa at the same intermediate composition, decreasing to 1.45 MPa at 60 %, 1.35 MPa at 80 %, and 1.30 MPa at 100 %. Intermediate loading levels exhibit the same characteristic trend, with the peak stress scaling roughly in proportion to the applied force.
The pronounced maximum in equivalent stress at = 40 % suggests an optimal reinforcement content where load transfer between the matrix and inclusions is most efficient. Below this threshold, increasing φ enhances stiffness and stress-bearing capacity by providing additional load-bearing paths. Further addition of reinforcement likely promotes particle clustering and impedes effective matrix continuity, reducing the uniformity of stress distribution and leading to a gradual decline in equivalent stress. The near-linear increase of the peak stress with applied load indicates that the composite’s load-transfer mechanisms remain consistent across the investigated loading range, and that failure-initiating stress concentrations are governed primarily by microstructural architecture rather than nonlinear matrix yielding. These findings point to a trade-off between reinforcement volume and stress homogeneity that must be balanced when designing particulate-reinforced composites for optimal mechanical performance.
Ultimately, based on our findings, the authors elect to investigate the one reinforcement levels 100 % volume fraction, in the 6 mm carbon-epoxy woven composite, since the former offers a low-content baseline that facilitates processing and characterization, while the latter fully exploits the composite’s stiffness and strength potential; this focused approach will yield clear, contrasting data sets to validate the stress–volume relationship and guide future design optimization. In this context, a 100 % volume fraction refers to a laminate composed entirely of the 6 mm carbon-epoxy woven fabric, with no unidirectional (UD) plies, thus providing a rich concentration baseline for processing and characterization.
3.4. Frontal Impact Test through Explicit Dynamics Analysis
Bridging from 100 % fractional volume levels in 6 mm thickness of carbon-epoxy woven as critical baselines for quasi-static equivalent-stress behavior, we now extend our investigation to dynamic loading by subjecting these hybrid laminates to frontal impact simulations via explicit dynamics at three distinct speeds, 11.11 m/s, 15.61 m/s, and 22.22 m/s. To identify an optimal discretization, we evaluated element sizes ranging from 6 mm to 11 mm, which produced a convergence error of just 3 – 5 mm while avoiding excessive computational time. This setup captures stress-wave propagation and energy absorption (both internal and kinetic), revealing how the woven in 100% ratios govern impact resistance and failure progression. For a detailed view of the resulting energy characteristics, refer to Figure 10.
Figure 10a presents the mesh-refinement study of internal energy for frontal impact simulations at 11.11 m/s, 15.61 m/s, and 22.22 m/s. For all three speeds, the computed internal energy rises sharply as the mesh is refined from 25000 to 55000 elements, reaching a plateau or slight decline beyond 80 000 elements. Specifically, the lowest speed (11.11 m/s) converges to 34 – 48 J of internal energy, while the mid-range speed (15.61 m/s) levels off near 80–110 J and the highest speed (22.22 m/s) around 150–230 J. This non-monotonic behavior highlights an optimal mesh density (50 000 elements) that captures the bulk of damage and energy absorption without over-stiffening the response at extreme refinement.
Meanwhile, the next figures compare internal versus kinetic energy for each impact speed across the same mesh range. At 11.11 m/s (see Figure 10b), the internal energy peak (48 J) corresponds to a complementary dip in kinetic energy (180 J), after which both energies stabilize within ±0.5 J above 60000 elements. The 15.61 m/s case (see Figure 10c) shows a broader internal energy maximum (110 J) and kinetic energy trough (356 J), indicating efficient conversion and dissipation at mid-mesh refinement. At 22.22 m/s (see Figure 10d), the energy exchange is most pronounced: internal energy climbs to 230 J as kinetic energy drops from 722 J, then both metrics reach a near-constant value past 70000 elements. These convergence trends confirm that a mesh of 60000 – 80000 elements adequately resolve impact dynamics and energy partitioning for all tested speeds.
Based on the convergence trends by reviewing all in Figure 12 where internal and kinetic energies stabilize (within a 3–5 % band). Once move beyond roughly 60000 elements, that is the best to target a mesh of about 60000. In practice, this corresponds to an element size of 7 mm. The intermediate-coarse element enough to keep runtimes reasonable but fine enough to capture the bulk of stress-wave propagation and damage evolution with minimal error. For further visualization, bumper crash tests were performed via explicit dynamics feature in Figure 11 as follows.
Figure 11 and Table 2 together demonstrate a clear velocity-dependent intensification of stress, deformation, and energy absorption in the tested composite specimen. At the lowest impact speed (11.11 m/s), the equivalent von Mises stress field (see Figure 11a) remains largely below 105 MPa, with a peak of 189.71 MPa localized near the frontal region; this condition corresponds to a max stress of 10.25 MPa in the static analogue, 5.80 mm of deformation, and internal and kinetic energies of 39.11 J and 180.54 J, respectively. Increasing the speed to 15.61 m/s (see Figure 11b) elevates both the stress contours now reaching 132.4 – 211.84 MPa and static stress to 16.86 MPa, with deformation growing to 7.68 mm and energies rising to 105.95 J (internal) and 356.39 J (kinetic). At the highest velocity of 22.22 m/s (see Figure 11c), the specimen exhibits widespread high-stress regions up to 396.99 MPa, a static stress of 23.44 MPa, and maximal deformation of 10.44 mm; correspondingly, energy absorption nearly doubles again, with internal and kinetic energies of 218.73 J and 722.16 J. These results confirm that elevated impact velocities markedly amplify stress magnitudes, structural deflection, and energy dissipation in the composite. Building on the explicit dynamics results and the observed velocity-dependent trends in stress, deformation, and energy absorption, the present section employs a machine-learning framework to quantitatively assess and refine the fidelity of finite-element simulations.
3.5. Validation of Numerical Simulation via Machine-Learning
Building on the previous results, the present section employs a machine-learning framework to quantitatively assess and refine the fidelity of our finite-element impact simulations. By training, supervised algorithms on a curated dataset of simulation outputs encompassing two targets by observing data normality in 12 features. We aim to cover correlations, identify predictive model parameters, and validate the normality of numerical simulation. Q-Q plots below indicate the normality of data features by showing the distribution of targets.
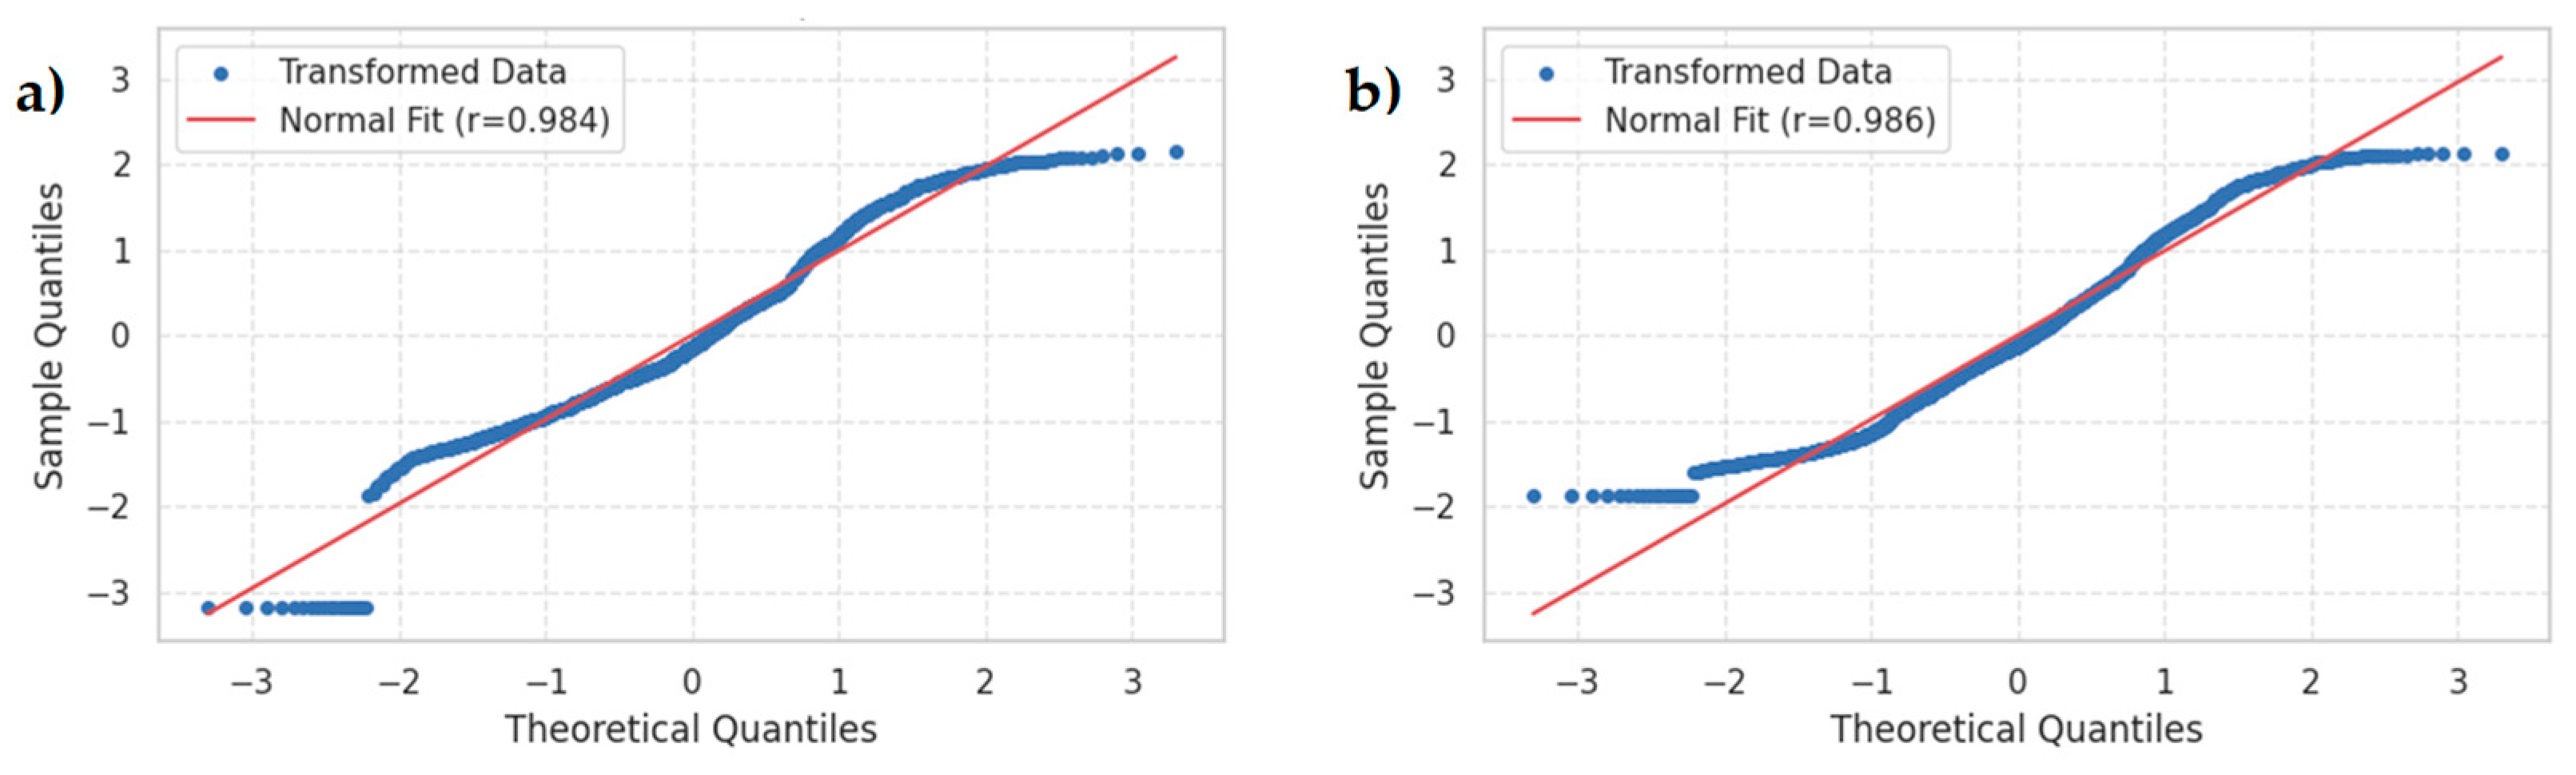
Figure 12 presents Q–Q plots of the transformed target variables against a theoretical normal distribution. In both plots, the blue dots closely follow the red reference line across the central range of quantiles, with only minor deviations in the tails, indicating that the transformed data conform well to normality. The Pearson correlation coefficients of 0.984 (see Figure 12a) for stress and 0.986 (see Figure 12b) for deformation further confirm that the transformations have effectively normalized the distributions, justifying the use of parametric techniques in subsequent machine-learning validation.
Figure 12.
Q-Q plots of target (a) equivalent stress, (b) total deformation.
The residual-analysis histograms (see Figure 13) reveal that, across all four regression algorithms, predictions of total deformation exhibit markedly tighter error distributions than those for equivalent stress. In particular, the Random Forest (RF) and k-nearest neighbors (KNR) models concentrate nearly all residuals within ±1 unit for both responses especially for total deformation, where RF residuals are almost exclusively within ±0.5 indicative of minimal bias and low variance. In contrast, linear regression (LR) yields broader, heavy-tailed residuals (up to ±8 for stress and ±3.5 for deformation), betraying systematic under- and over-predictions at the extremes, while support vector regression (SVR) shows moderate skew and a few large positive stress residuals.
Further visualization across the target predictions via train and test through several models (see Figure 14). Random -forest (RF) regressor clearly outperforms the other algorithms: it achieves the lowest mean squared error (0.18) and the highest R² (0.79), indicating both high accuracy and strong variance explanation on unseen data. Linear regression (LR) comes next with moderate error (MSE of 0.35) and R² at 0.59, suggesting a reasonable but ultimately limited linear fit. Support-vector regression (SVR) shows the poorest performance for stress, with an MSE exceeding 0.6 and an R² below 0.30, implying underfitting or sensitivity to outliers. K-nearest neighbors (KNN) lies between LR and RF, delivering a lower error than LR (MSE = 0.26) and a solid R² of 0.70, but still falling short of RF’s ensemble learning advantage.
For total -deformation predictions, a similar hierarchy emerges: RF again yields the best results (MSE = 0.23, R² = 0.51), confirming its robustness across both targets. SVR remains the weakest for deformation (MSE = 0.38, R² = 0.20), reinforcing that its kernel-based approach may struggle with this dataset’s complexity. Linear regression and KNR perform comparably in the midrange: LR gives an MSE of 0.30 with R² at 0.37, while KNR slightly improves on error (MSE at 0.33) but with a similar R² of 0.33. Overall, these findings demonstrate that the RF model generalizes most effectively new simulation data, whereas SVR is the least reliable for both stress and deformation predictions. Overall, RF outperforms all models in terms of compactness and residual symmetry, indicating superior generalization and robustness when modeling equivalent stress and total deformation on our finite element dataset.
4. Conclusions
In this work, we successfully integrate finite-element simulations, controlled impact testing, and multivariate machine-learning to optimize multi-layered automotive bumper designs. The increase of ply number illustrates the better stress distribution following with improving layer thickness. Based on our observations, the 3 mm mesh sizing of 100 % carbon-epoxy woven layup at 6 mm thickness in 0o orientation shows best uniformity in von Mises stresses that observed to converge toward stable values, validating the suitability of this configuration for further analysis. These results confirm that elevated impact velocities improve stress magnitudes, with structural stress at 10.247 MPa, 16.857 MPa, and 23.438 MPa in 11.11 m/s, 15.61 m/s, and 22.22 m/s, respectively. To capture coupled mechanical behavior, total deformation was incorporated alongside stress as a secondary target in our ML framework. Across a suite of regression algorithms, Random Forest (RF) model emerged as the most reliable predictor, achieving a mean squared error of 0.18 and an R² of 0.79 for the joint prediction of equivalent stress and deformation metrics that underscore its superior generalization and robustness. Collectively, these findings demonstrate a rapid pathway for data-driven design and the way for broader applications of ML-enhanced multivariate analyses in engineering applications.
Author Contributions
Conceptualization, funding acquisition, resources, S.S.; methodology, data curation, and supervision, M.B.T.; visualization, software, and writing – review & editing, YB; writing – original draft, Y.A.F.; project administration, R.J.S; project administration and software, M.R.M. All authors have read and agreed to the published version of the manuscript.
Funding
This research received no external funding.
Data Availability Statement
Not applicable.
Acknowledgments
The authors would like to thank the editor and reviewers for providing valuable review comments.
Conflicts of Interest
The authors declare no conflicts of interest.
References
- “Road traffic injuries.” Accessed: Jul. 22, 2025. [Online]. Available: https://www.who.int/news-room/fact-sheets/detail/road-traffic-injuries.
- F. R. Chang, H. L. Huang, D. C. Schwebel, A. H. S. Chan, and G. Q. Hu, “Global road traffic injury statistics: Challenges, mechanisms and solutions,” Chinese Journal of Traumatology, vol. 23, no. 4, pp. 216–218, Aug. 2020. [CrossRef]
- T. H. Le, M. T. Bui, and G. S. Uddin, “Economic and social impacts of conflict: A cross-country analysis,” Econ Model, vol. 115, p. 105980, Oct. 2022. [CrossRef]
- W. M. Schultz et al., “Socioeconomic Status and Cardiovascular Outcomes: Challenges and Interventions,” Circulation, vol. 137, no. 20, p. 2166, 2018. [CrossRef]
- T. Bliss and J. Breen, Road Safety Management Capacity Reviews and Safe System Projects. Washington DC: Global Road Safety Facility, 2013.
- M. S. Ul Abrar, K. F. Nadim Ezaz, M. J. Hasan, R. I. Pranto, T. A. Alvy, and M. Z. Hossain, “Speed-dependent impact analysis on a car bumper structure using various materials,” Results in Engineering, vol. 21, p. 101927, Mar. 2024. [CrossRef]
- F. Khan et al., “Advances of composite materials in automobile applications – A review,” Journal of Engineering Research, vol. 13, no. 2, pp. 1001–1023, Jun. 2025. [CrossRef]
- E. Kılıç, P. Fullana-i-Palmer, M. Fullana, M. Delgado-Aguilar, and R. Puig, “Circularity of new composites from recycled high density polyethylene and leather waste for automotive bumpers. Testing performance and environmental impact,” Science of The Total Environment, vol. 919, p. 170413, Apr. 2024. [CrossRef]
- E. C. Tsirogiannis, E. Daskalakis, C. Vogiatzis, F. Psarommatis, and P. Bartolo, “Advanced composite armor protection systems for military vehicles: Design methodology, ballistic testing, and comparison,” Compos Sci Technol, vol. 251, p. 110486, May 2024. [CrossRef]
- G. Isaac, J. Adams, S. Dr, and S. Lie, “Design for the environmental emergency: Plastic chairs and the transition to low-carbon product design,” University of Technology Sydney, Sydney, 2022. Accessed: Jul. 22, 2025. [Online]. Available: http://hdl.handle.net/10453/161828.
- A. L. Andrady et al., “Effects of UV radiation on natural and synthetic materials,” Photochemical & Photobiological Sciences 2023 22:5, vol. 22, no. 5, pp. 1177–1202, Apr. 2023. [CrossRef]
- O. Osokoya, “An evaluation of polymer composites for car bumper beam,” International Journal of Automotive Composites, vol. 3, no. 1, p. 44, 2017. [CrossRef]
- H. Sharma et al., “Critical review on advancements on the fiber-reinforced composites: Role of fiber/matrix modification on the performance of the fibrous composites,” Journal of Materials Research and Technology, vol. 26, pp. 2975–3002, Sep. 2023. [CrossRef]
- M. A. Khoshmardan, T. J. Behbahani, C. Ghotbi, A. Hassanpouryouzband, and A. Nasiri, “Experimental study of polymeric composite reinforced with carbon fiber for mud lost control application,” Sci Rep, vol. 14, no. 1, pp. 1–12, Dec. 2024. [CrossRef]
- M. S. Ul Abrar, K. F. Nadim Ezaz, M. J. Hasan, R. I. Pranto, T. A. Alvy, and M. Z. Hossain, “Speed-dependent impact analysis on a car bumper structure using various materials,” Results in Engineering, vol. 21, p. 101927, Mar. 2024. [CrossRef]
- M. V. A. R. Bahubalendruni et al., “An Investigation into the Design and Analysis of the Front Frame Bumper with Dynamic Load Impact,” Engineering Proceedings 2024, Vol. 66, Page 6, vol. 66, no. 1, p. 6, Jun. 2024. [CrossRef]
- E. S. Yeshanew et al., “Experimental investigation and crashworthiness analysis of 3D printed carbon PA automobile bumper to improve energy absorption by using LS-DYNA,” Advances in Mechanical Engineering, vol. 15, no. 6, Jun. 2023. [CrossRef]
- S. J. Joo, M. H. Yu, W. Seock Kim, J. W. Lee, and H. S. Kim, “Design and manufacture of automotive composite front bumper assemble component considering interfacial bond characteristics between over-molded chopped glass fiber polypropylene and continuous glass fiber polypropylene composite,” Compos Struct, vol. 236, Mar. 2020. [CrossRef]
- S. P. Dhamone and A. Padmakumar, “ANALYSIS OF A CRASH ON A VEHICLE SYSTEM BY ADJUSTING APPROPRIATE INPUT PARAMETERS TO MANAGE ENERGY ABSORPTION CAPACITY FOR ENHANCING PASSENGER SAFETY,” Acta Innovations, vol. 2023, no. 50 Special Issue, pp. 5–17, Dec. 2023. [CrossRef]
- N. Nawawithan, P. Kittisakpairach, S. Nithiboonyapun, K. Ruangjirakit, and P. Jongpradist, “Design and performance simulation of hybrid hemp/glass fiber composites for automotive front bumper beams,” Compos Struct, vol. 335, May 2024. [CrossRef]
- E. S. Yeshanew and R. B. Nallamothu, “Numerical Simulation and Design Modification of an Automotive Bumper to Enhance Energy Absorption by Using LS-DYNA,” Modelling and Simulation in Engineering, vol. 2025, no. 1, 2025. [CrossRef]
- G. Li, M. Lyons, B. Wang, J. Yang, D. Otte, and C. Simms, “The influence of passenger car front shape on pedestrian injury risk observed from German in-depth accident data,” Accid Anal Prev, vol. 101, pp. 11–21, Apr. 2017. [CrossRef]
- M. N. Lotfy, Y. A. Khalifa, A. K. Dessouki, and E. Fathallah, “Dynamic Behavior of Steel and Composite Ferry Subjected to Transverse Eccentric Moving Load Using Finite Element Analysis,” Applied Sciences 2020, Vol. 10, Page 5367, vol. 10, no. 15, p. 5367, Aug. 2020. [CrossRef]
- Gunadi et al., “Comparison of Brake Cooling System on Bus: Simulation and Evaluation of Natural vs Forced Air through Machine Learning Processing,” Journal of Advanced Research in Fluid Mechanics and Thermal Sciences, vol. 126, no. 2, pp. 178–200, Jan. 2025. [CrossRef]
- A. Dutt, “Effect of Mesh Size on Finite Element Analysis of Beam,” International Journal of Mechanical Engineering, vol. Volume 2, no. 12, pp. 8–10, Jan. 2019. [CrossRef]
- S. Ren et al., “Review of bumper materials for spacecraft shield against orbital debris hypervelocity impact,” Defence Technology, vol. 45, pp. 137–177, Mar. 2025. [CrossRef]
- H. Zhao et al., “Full-Scale Train-to-Train Impact Test and Multi-Body Dynamic Simulation Analysis,” Machines 2021, Vol. 9, Page 297, vol. 9, no. 11, p. 297, Nov. 2021. [CrossRef]
- A. Mallikarjuna, D. Marghitu, and P. K. Raju, “SIMULATION OF DYNAMIC EVENT OF IMPACT USING EXPLICIT 3D FEM MODEL AND VALIDATION BY EXPERIMENT AND CONTACT MODELS,” 2021. [Online]. Available: http://www.ijeast.com.
- M. Karthikeyan, M. P. Jenarthanan, R. Giridharan, and K. Shunmugesh, “Investigation on Crash Analysis of a Frontal Car Bumper,” Transactions of the Indian Institute of Metals, vol. 72, no. 10, pp. 2699–2709, Oct. 2019. [CrossRef]
- U. Idrees et al., “Finite element analysis of car frame frontal crash using lightweight materials,” Journal of Engineering Research (Kuwait), vol. 11, no. 1, Mar. 2023. [CrossRef]
- H. Patil and P. V. Jeyakarthikeyan, “Mesh convergence study and estimation of discretization error of hub in clutch disc with integration of ANSYS,” in IOP Conference Series: Materials Science and Engineering, Institute of Physics Publishing, 2018. [CrossRef]
- E. S. Yeshanew and R. B. Nallamothu, “Numerical Simulation and Design Modification of an Automotive Bumper to Enhance Energy Absorption by Using LS-DYNA,” Modelling and Simulation in Engineering, vol. 2025, no. 1, 2025. [CrossRef]
- O. W. Samuel, G. M. Asogbon, A. K. Sangaiah, and G. Li, “Computational Intelligence Enabling the Development of Efficient Clinical Decision Support Systems: Case Study of Heart Failure,” Computational Intelligence for Multimedia Big Data on the Cloud with Engineering Applications, pp. 123–133, Jan. 2018. [CrossRef]
- K. A. Monsen, “Intervention Effectiveness Research: Quality Improvement and Program Evaluation in Healthcare: A Practical Guide to Real-World Implementation,” Intervention Effectiveness Research: Quality Improvement and Program Evaluation in Healthcare: A Practical Guide to Real-World Implementation, pp. 1–254, Jan. 2024. [CrossRef]
- W. Xu, S. H. Huang, J. Su, S. Gudi, and B. O’Sullivan, “Statistical fundamentals on cancer research for clinicians: Working with your statisticians,” Clin Transl Radiat Oncol, vol. 27, pp. 75–84, Mar. 2021. [CrossRef]
Figure 1.
Car bumper design with detailed dimensions (mm).
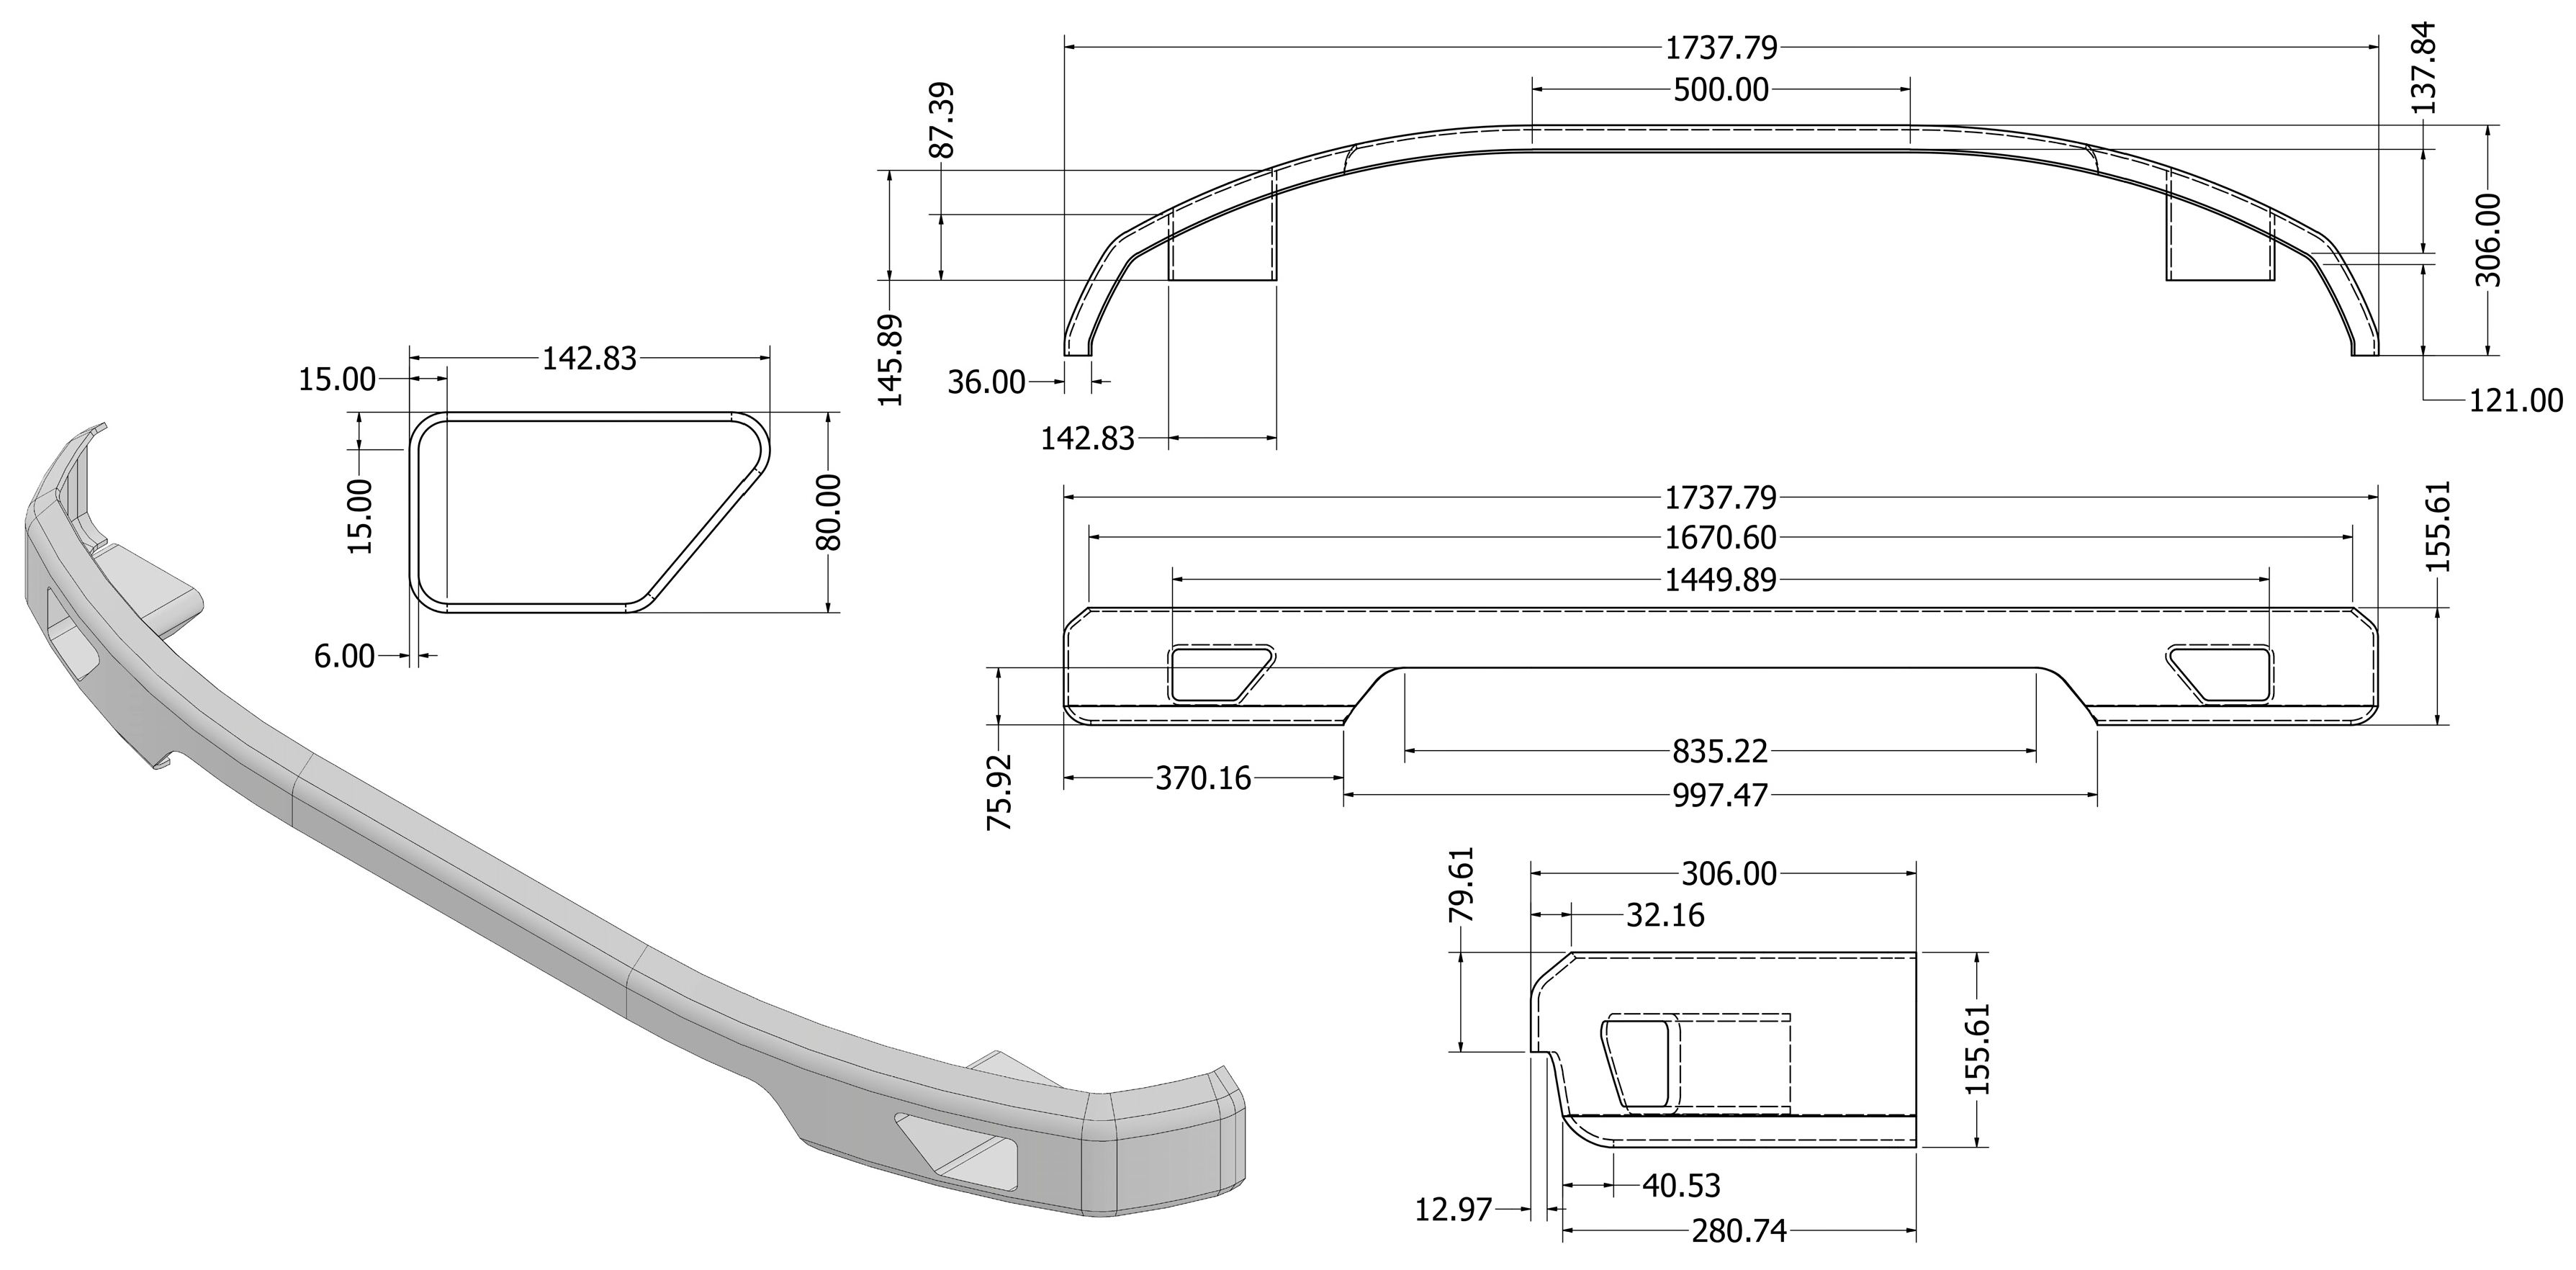
Figure 2.
Mesh convergence in various body sizing.
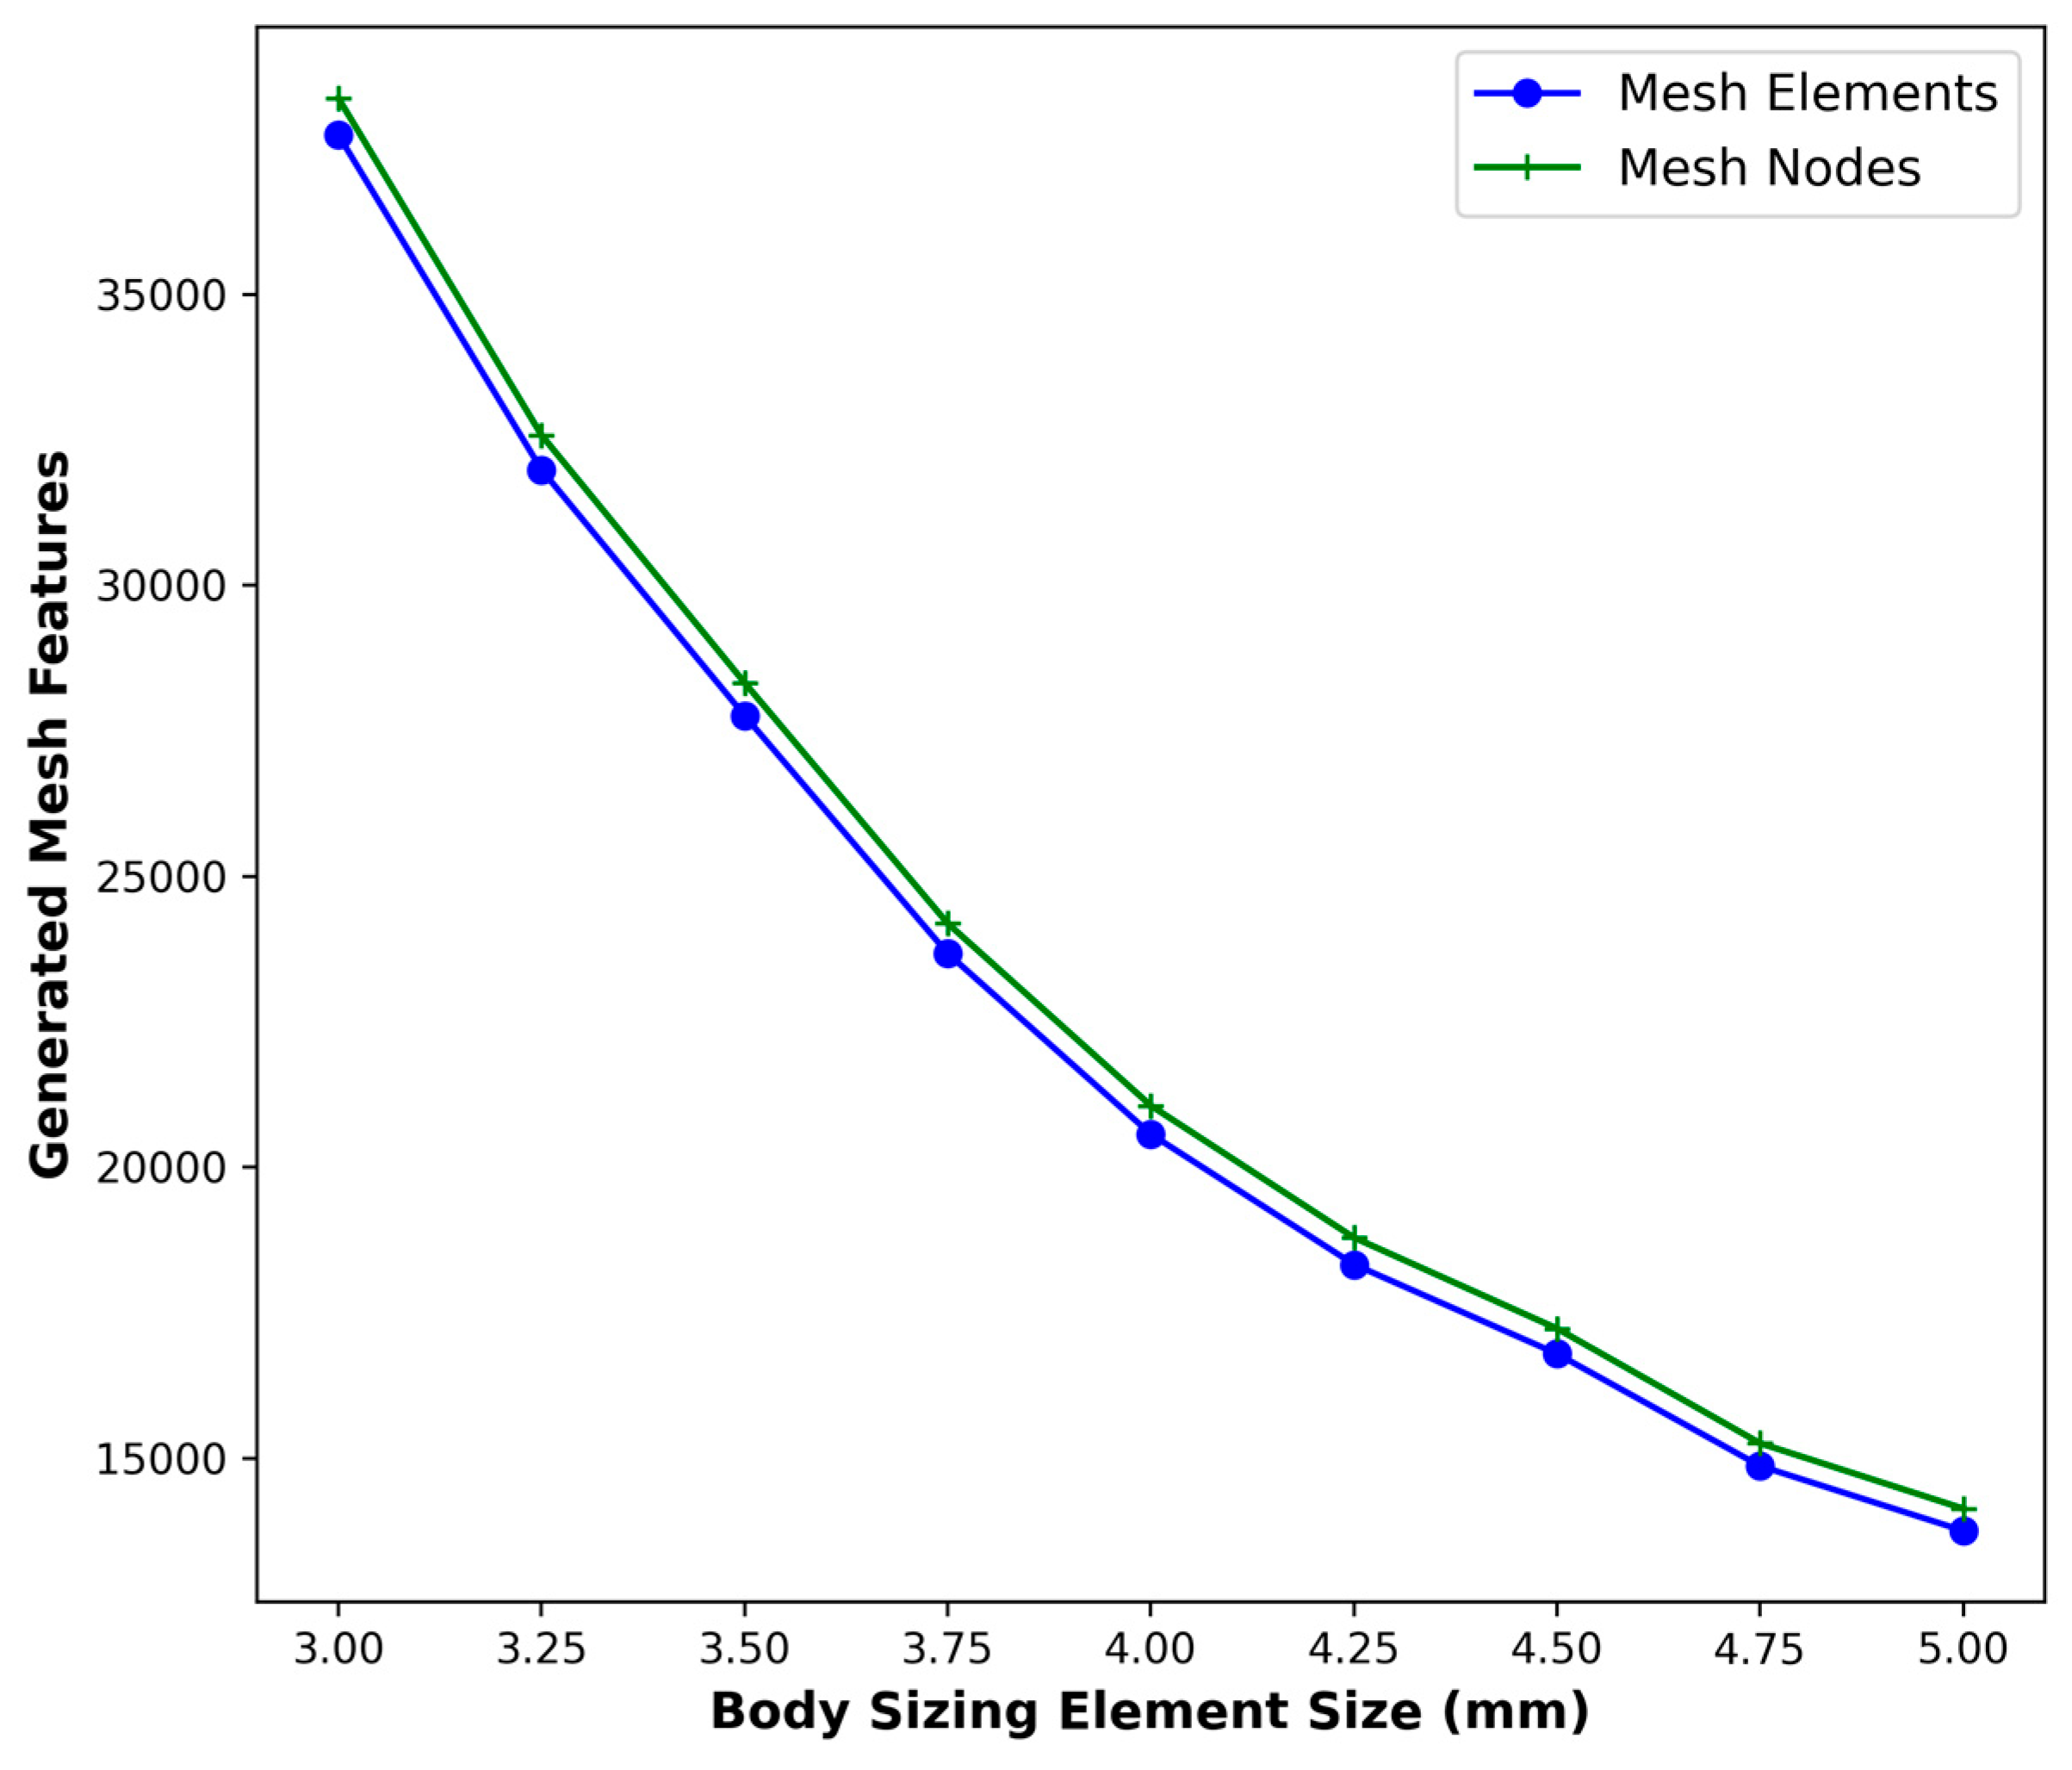
Figure 3.
Generated mesh strategy.
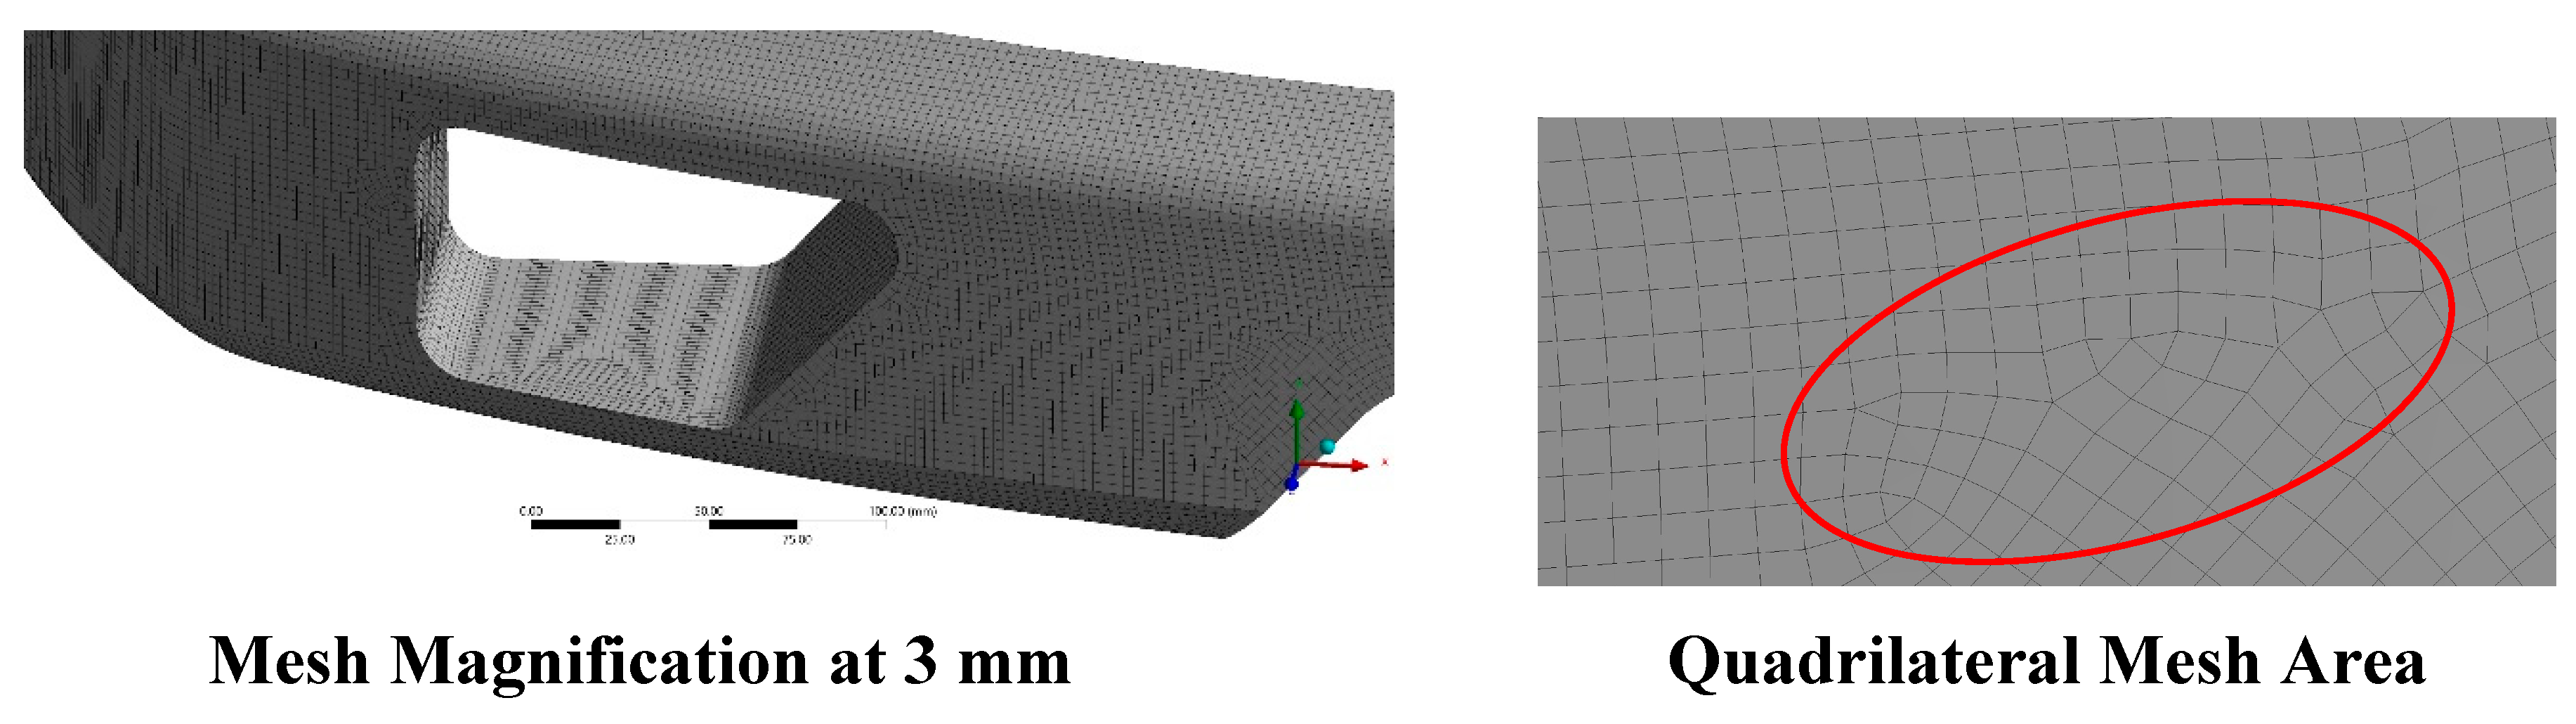
Figure 4.
Configuration of carbon-epoxy composite specimens in simulation testing.
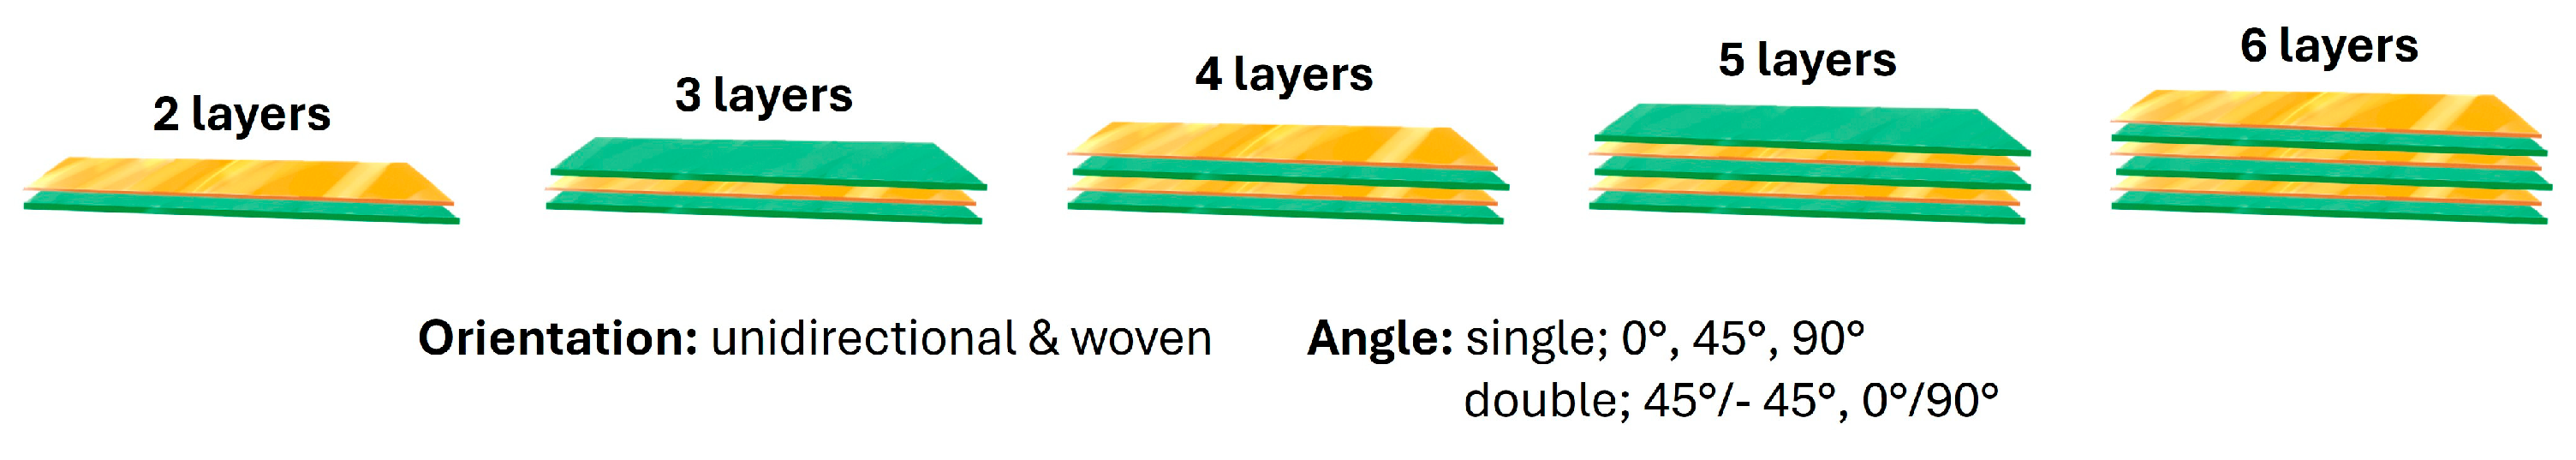
Figure 5.
Ansys workbench simulation flow.
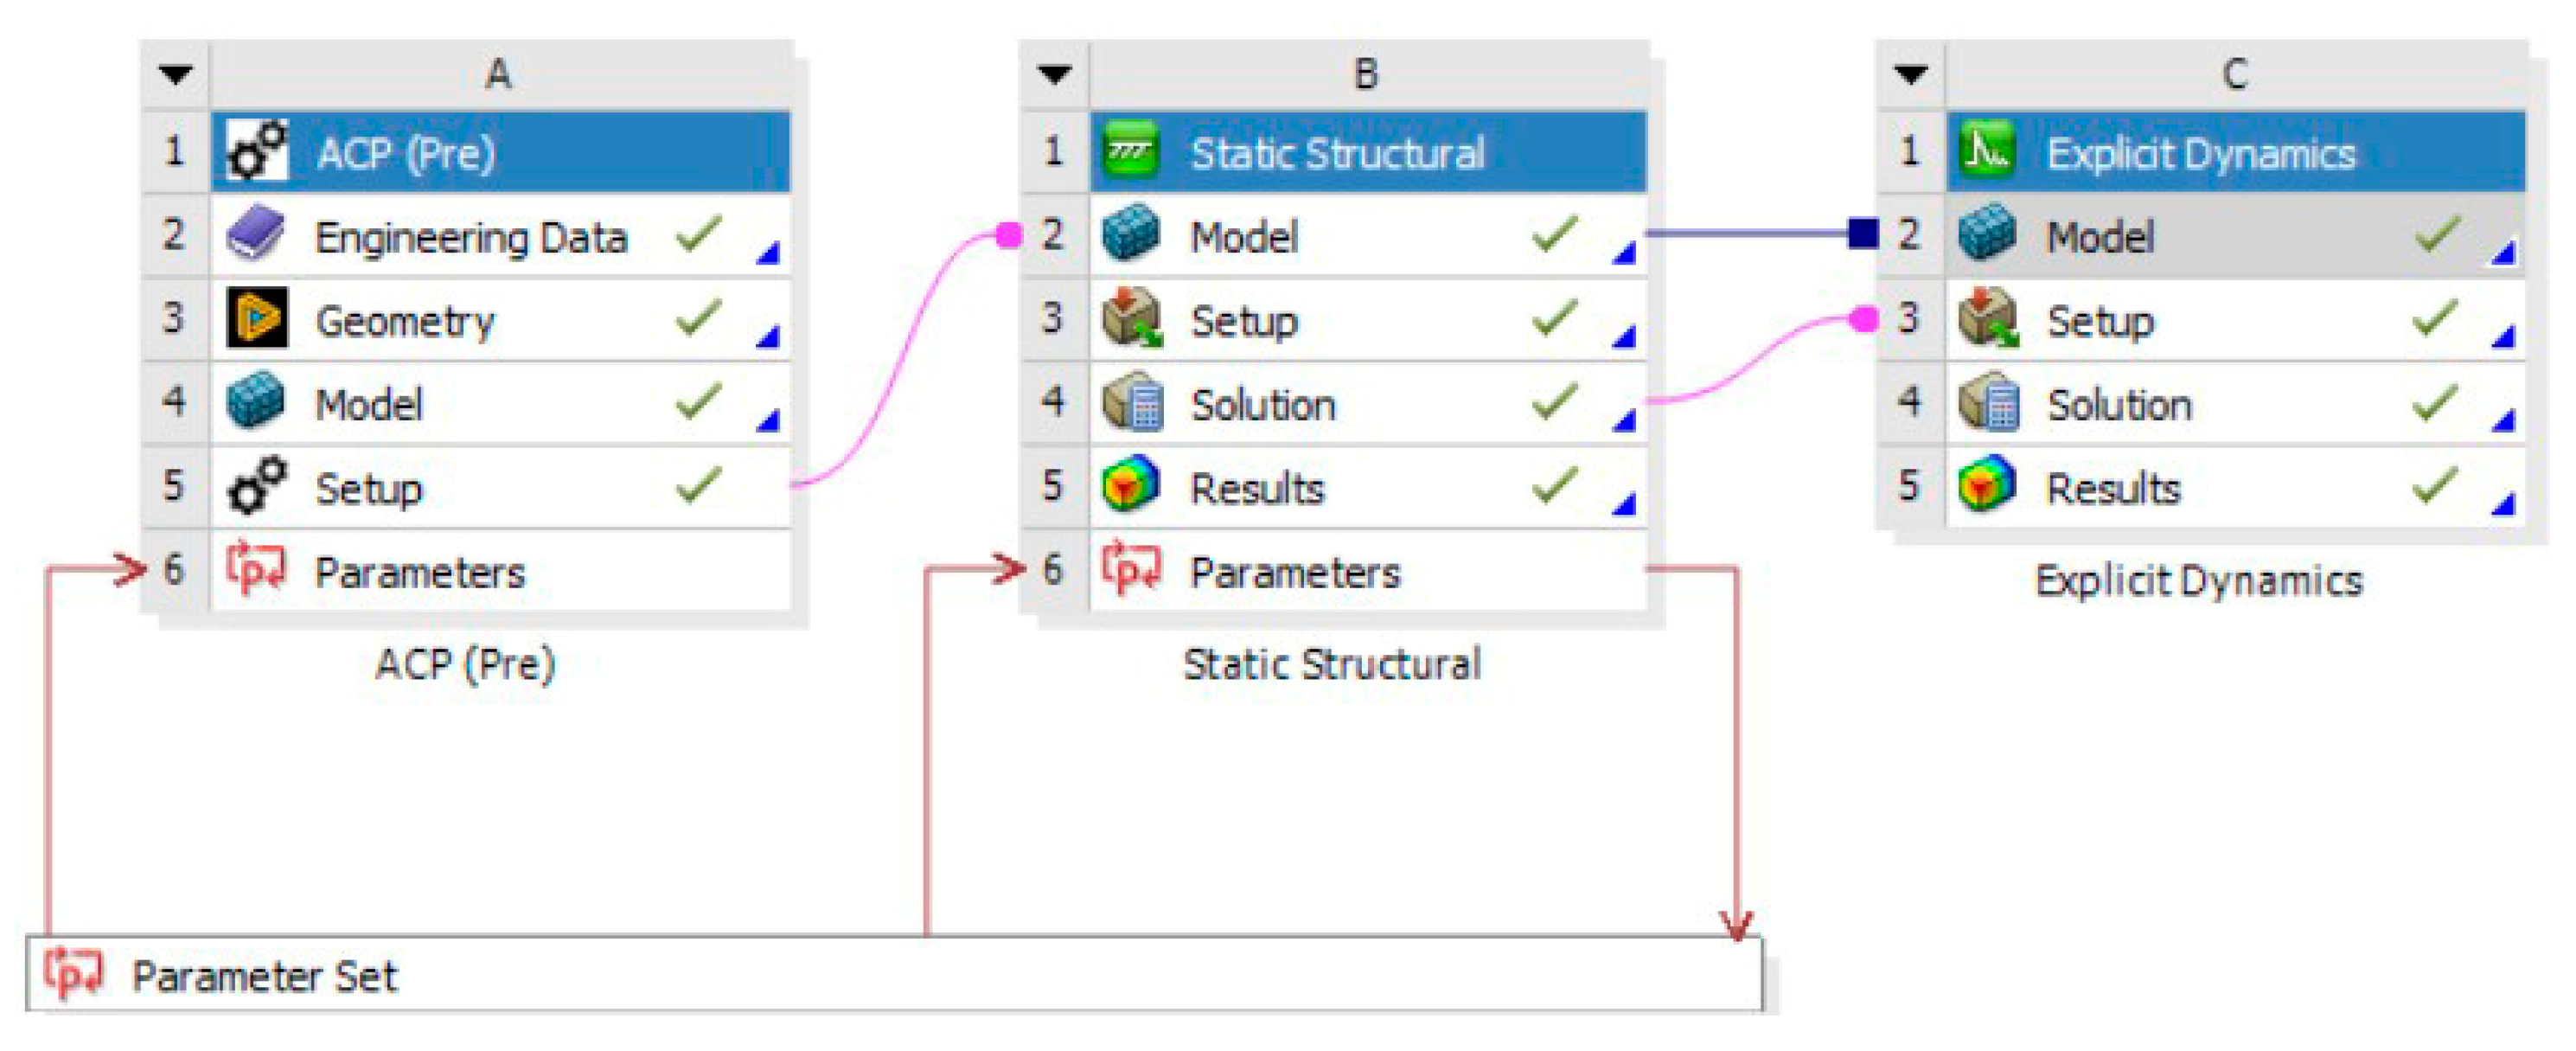
Figure 6.
Boundary condition of explicit dynamics test.
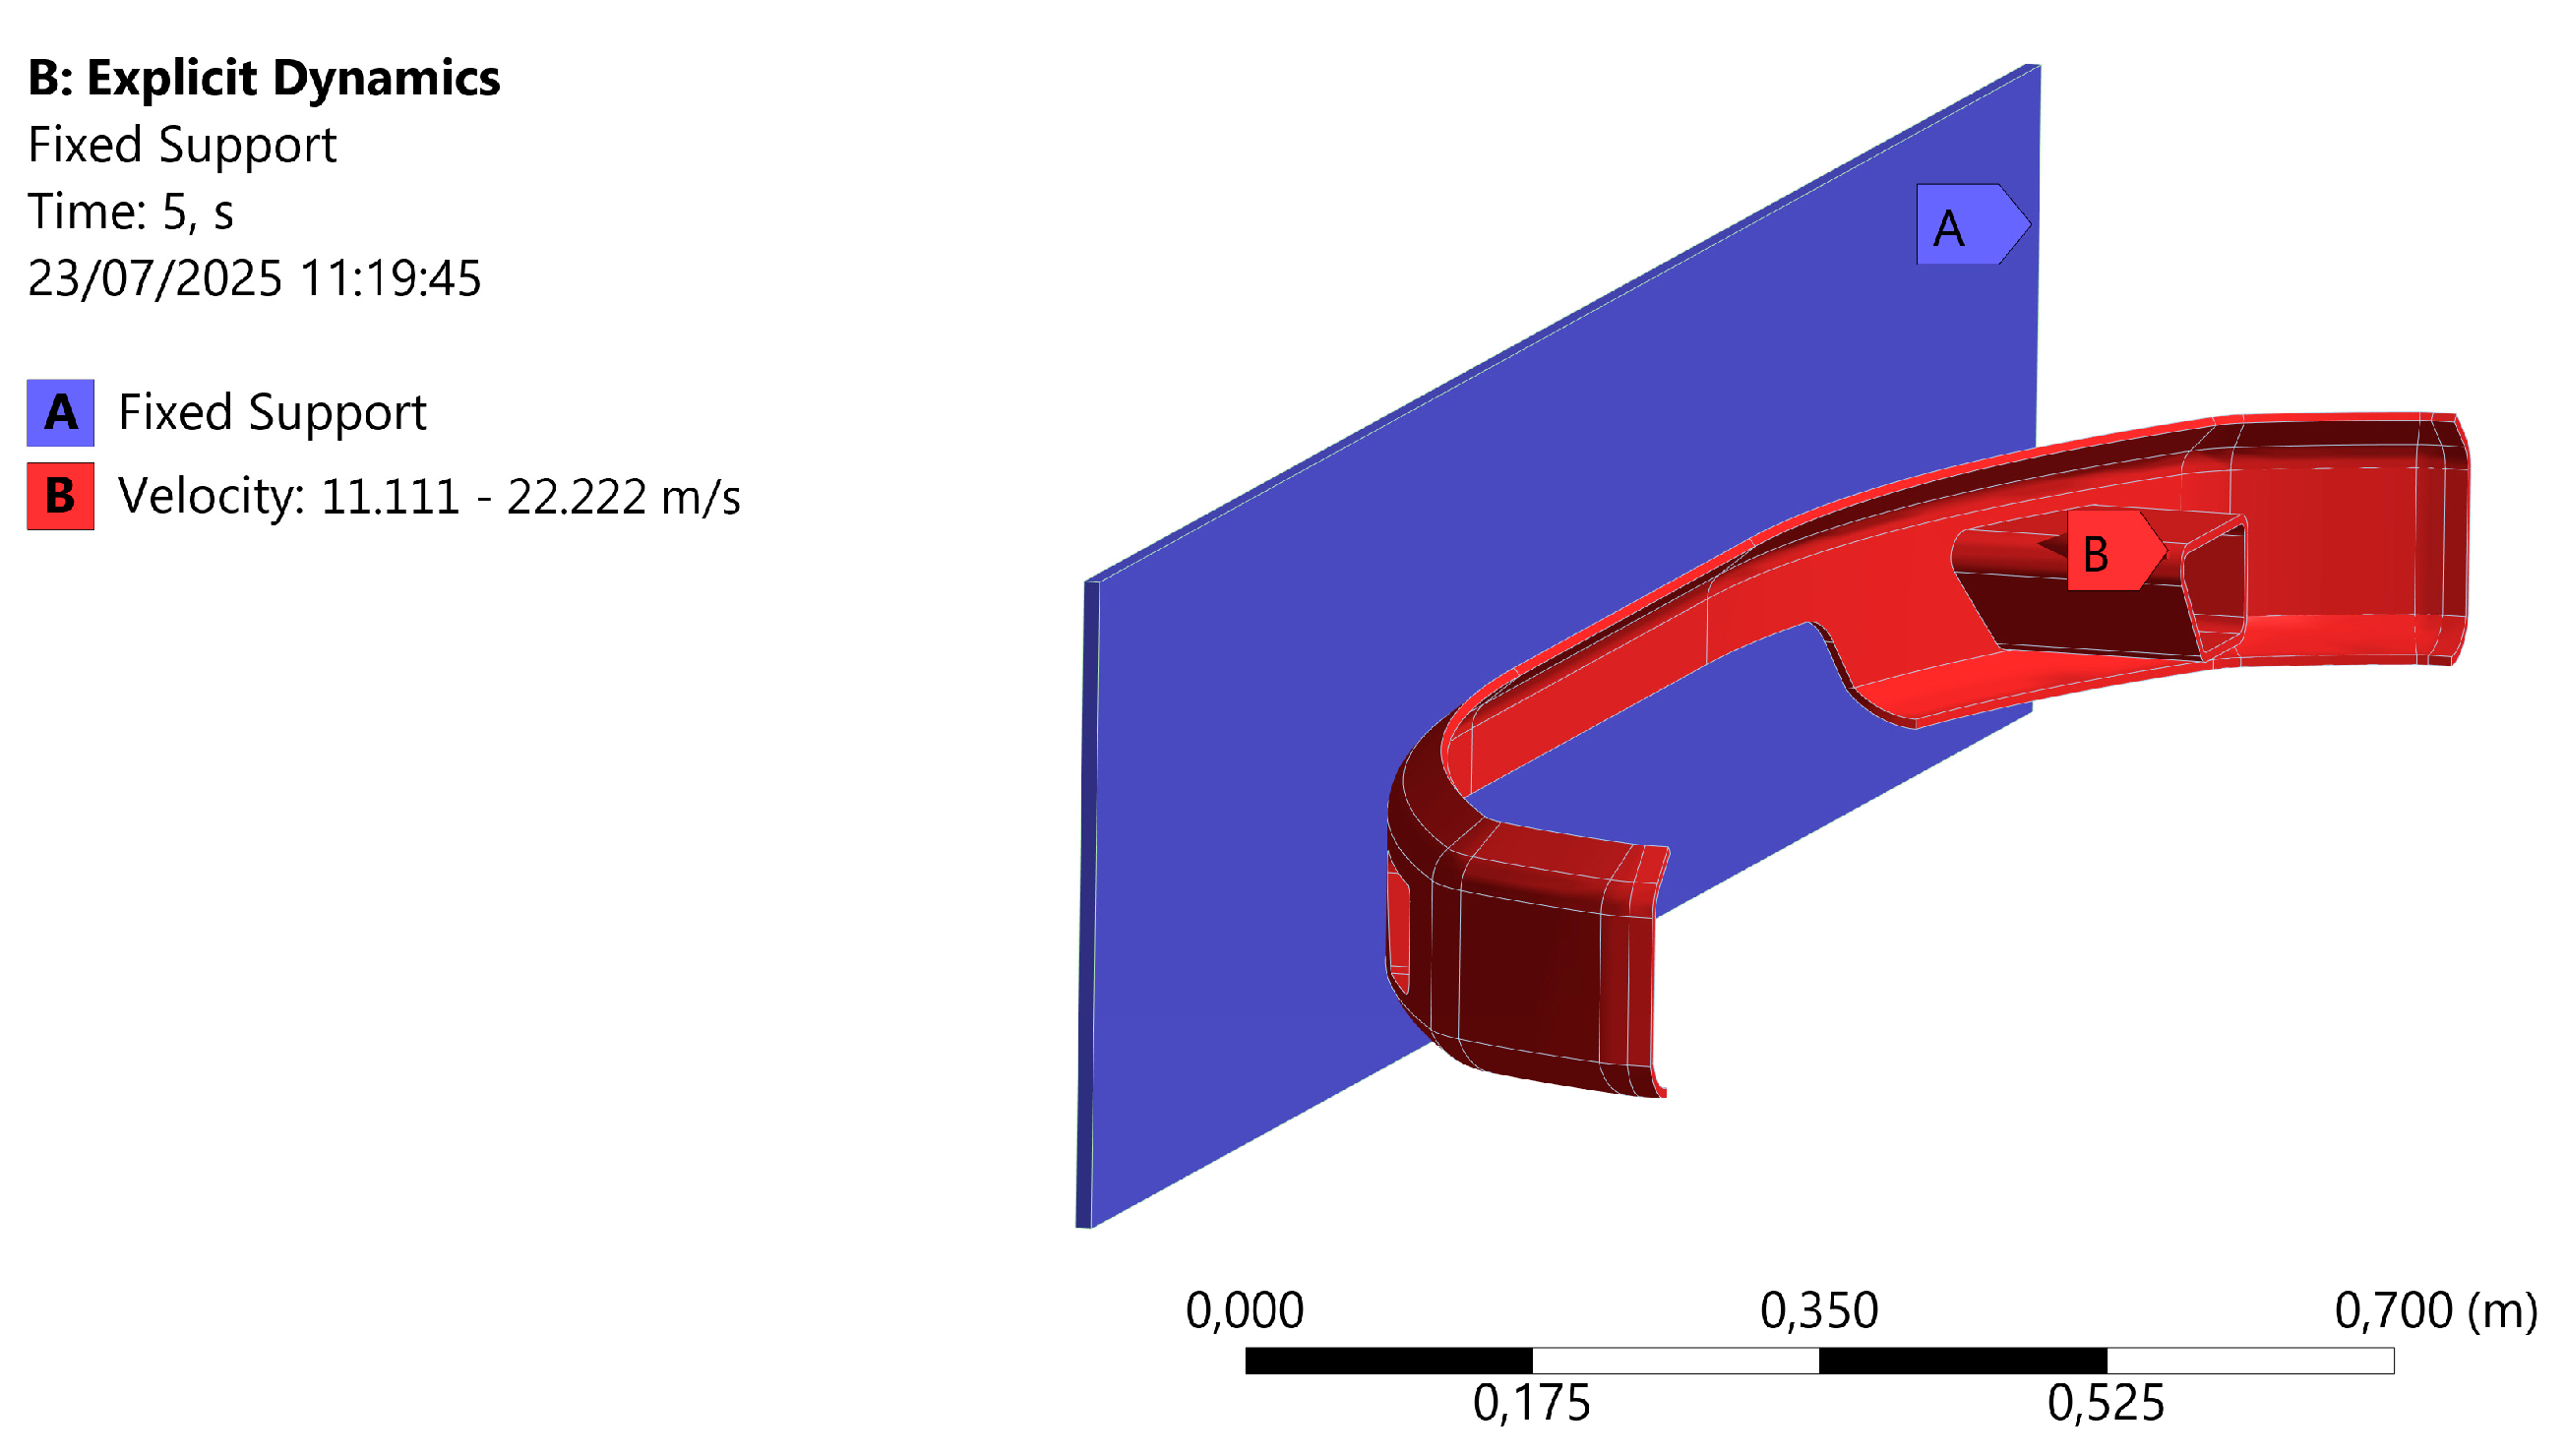
Figure 7.
Von mises stress between different ply number in various mesh sizing configurations through two loads (a) 100 N and (b) 200 N for Carbon-Epoxy UD, (c) 100 N and (b) 200 N for Carbon-Epoxy Woven.
Figure 7.
Von mises stress between different ply number in various mesh sizing configurations through two loads (a) 100 N and (b) 200 N for Carbon-Epoxy UD, (c) 100 N and (b) 200 N for Carbon-Epoxy Woven.
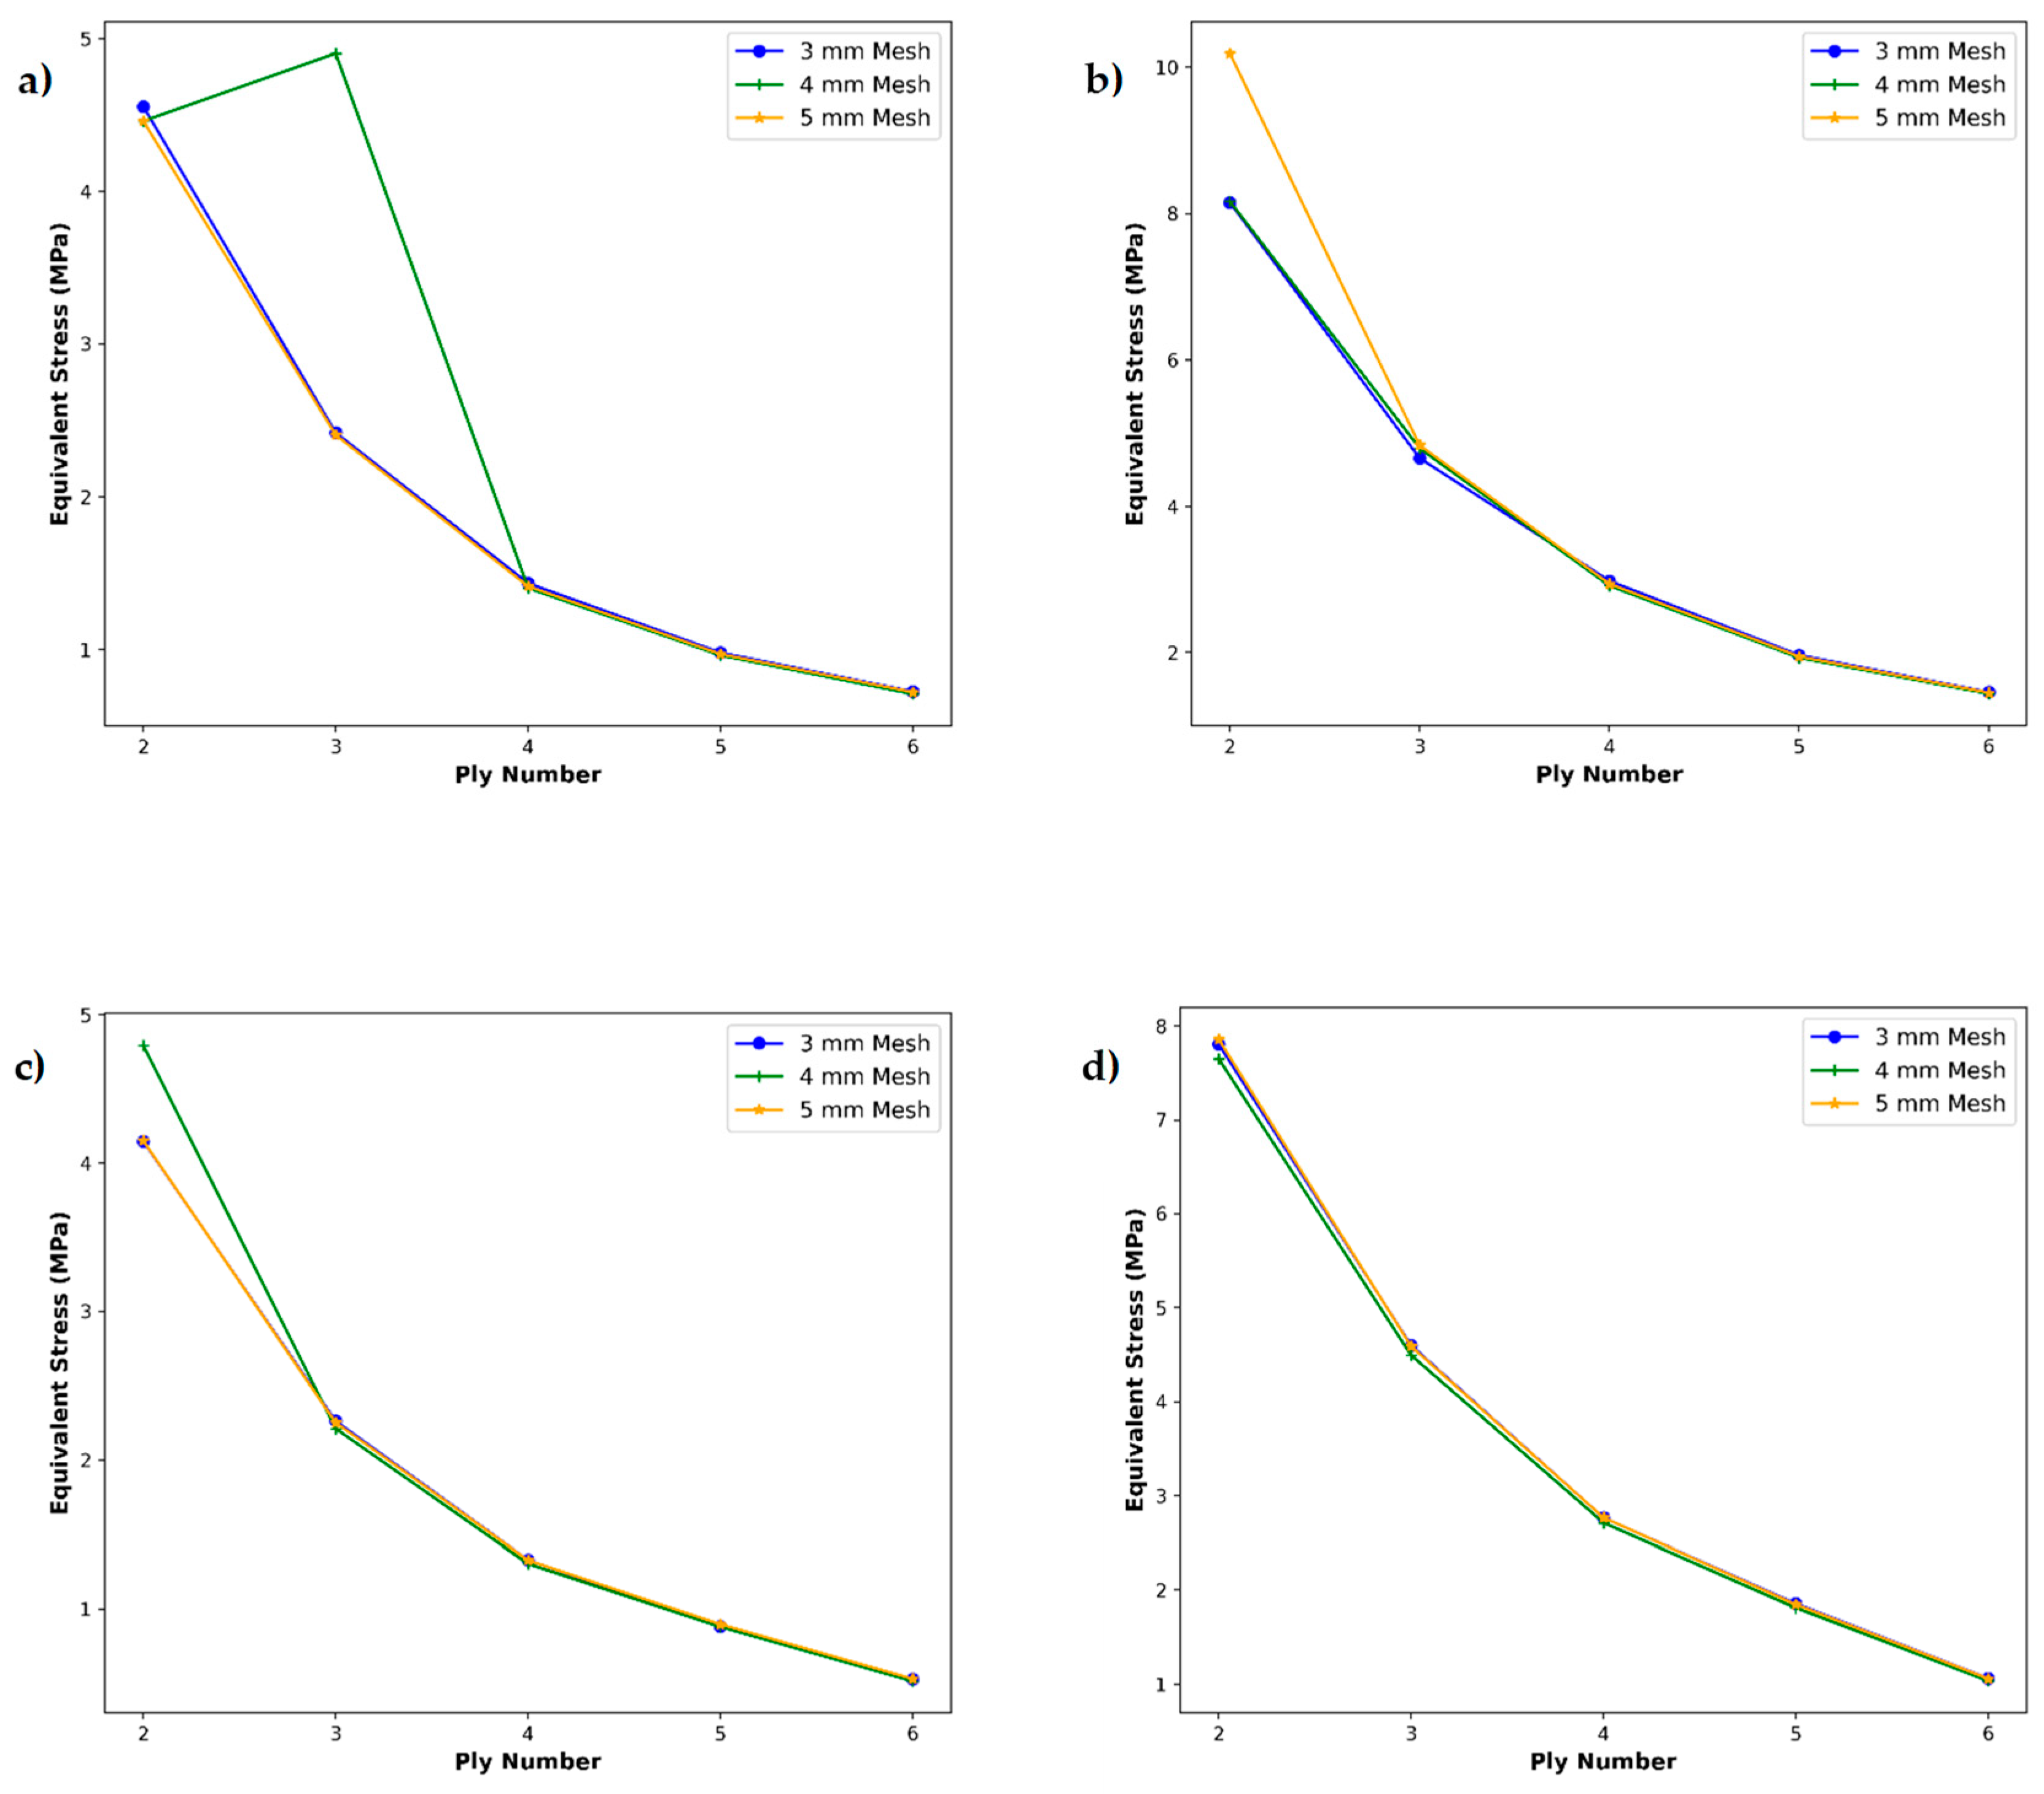
Figure 8.
Von mises stress between various angle-ply configurations in different materials by applying two loads (a) 100 N and (b) 200 N.
Figure 8.
Von mises stress between various angle-ply configurations in different materials by applying two loads (a) 100 N and (b) 200 N.
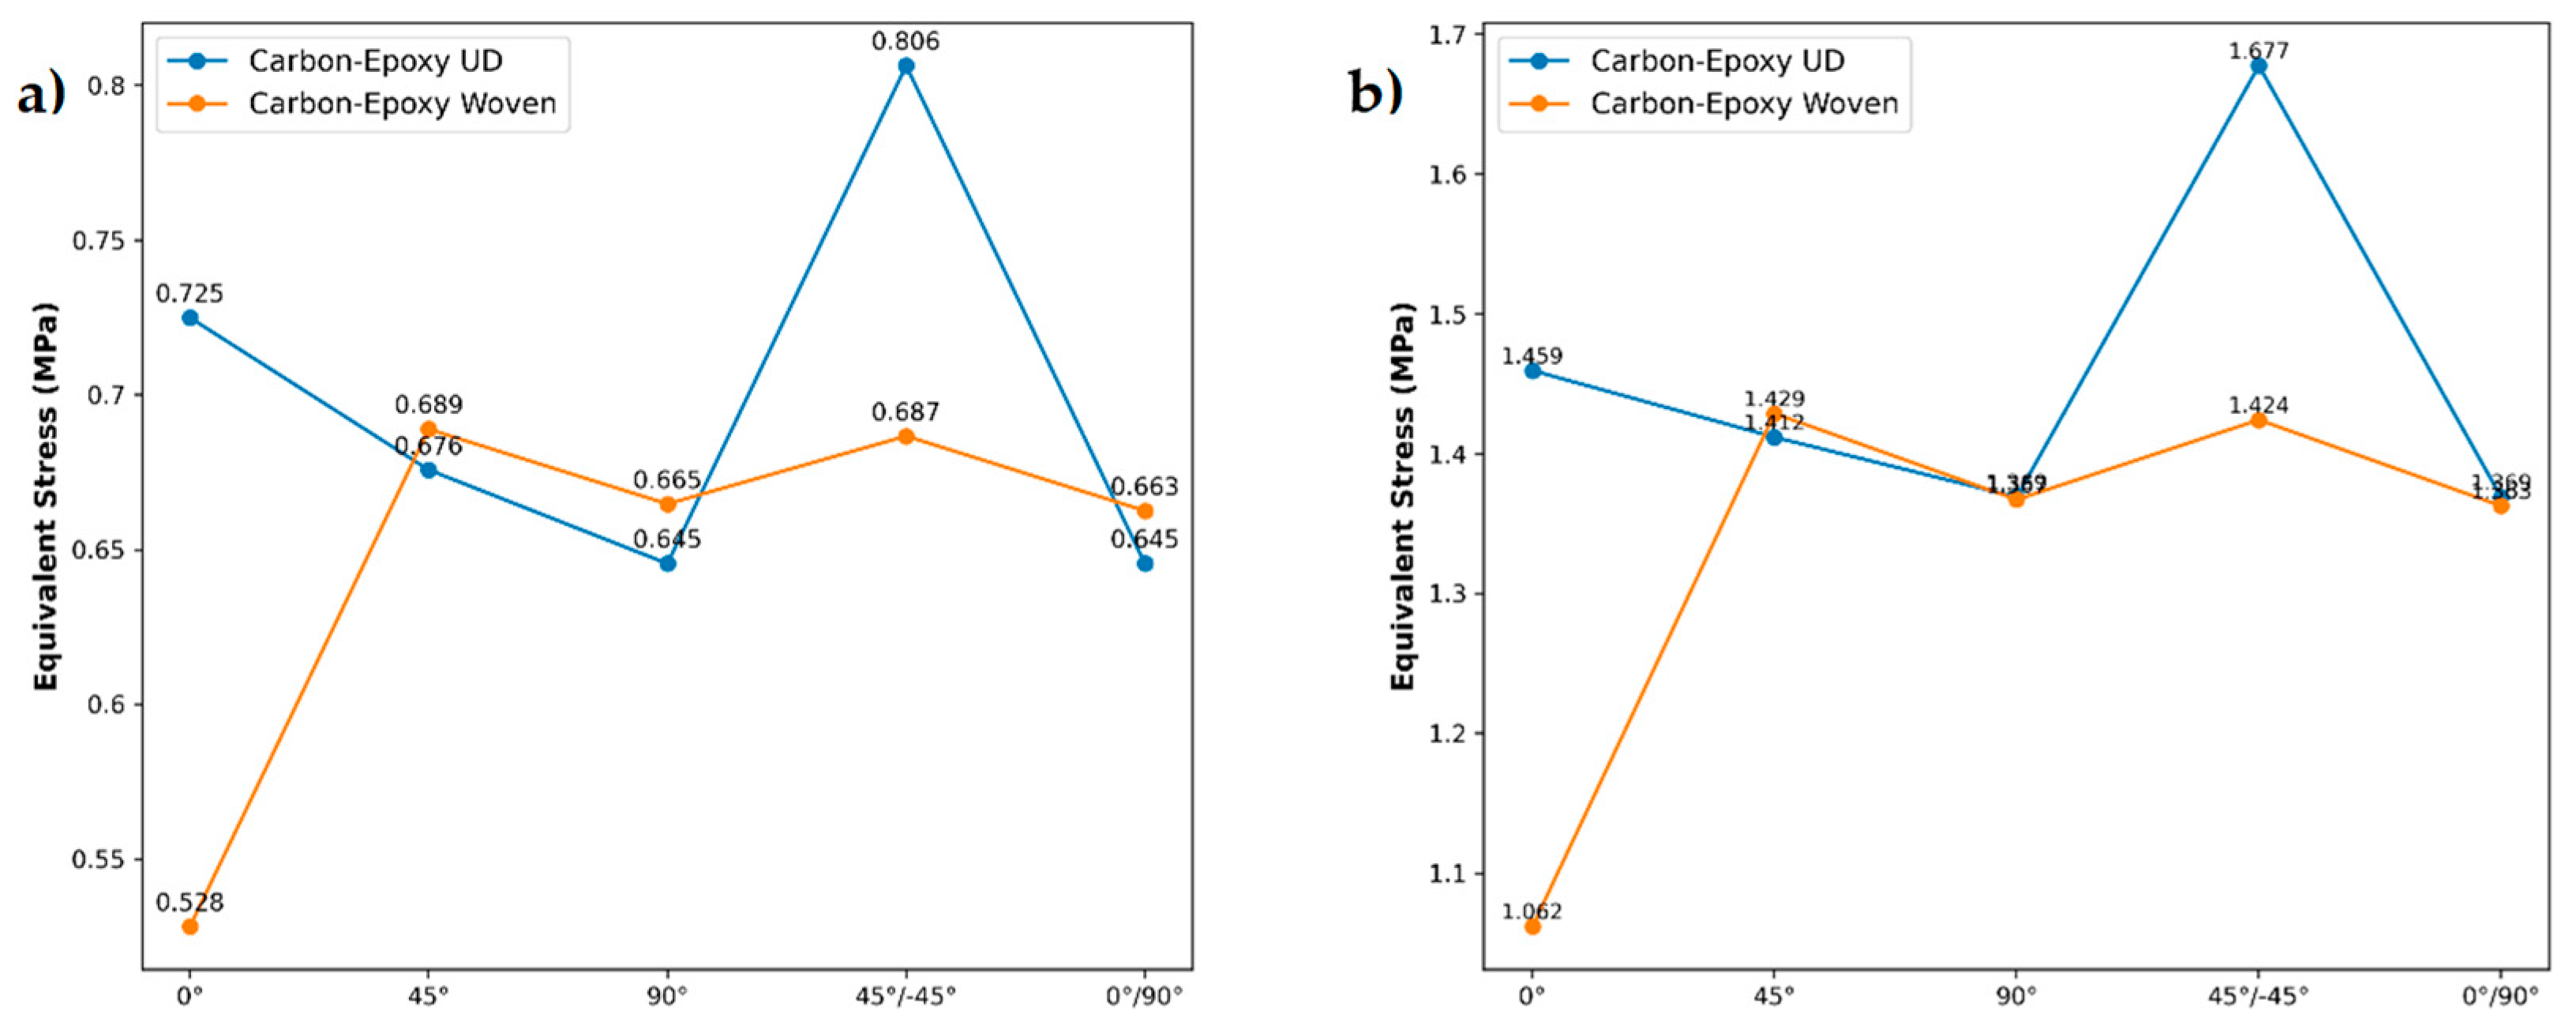
Figure 9.
Volume fraction effect to equivalent stress in various testing of loads.
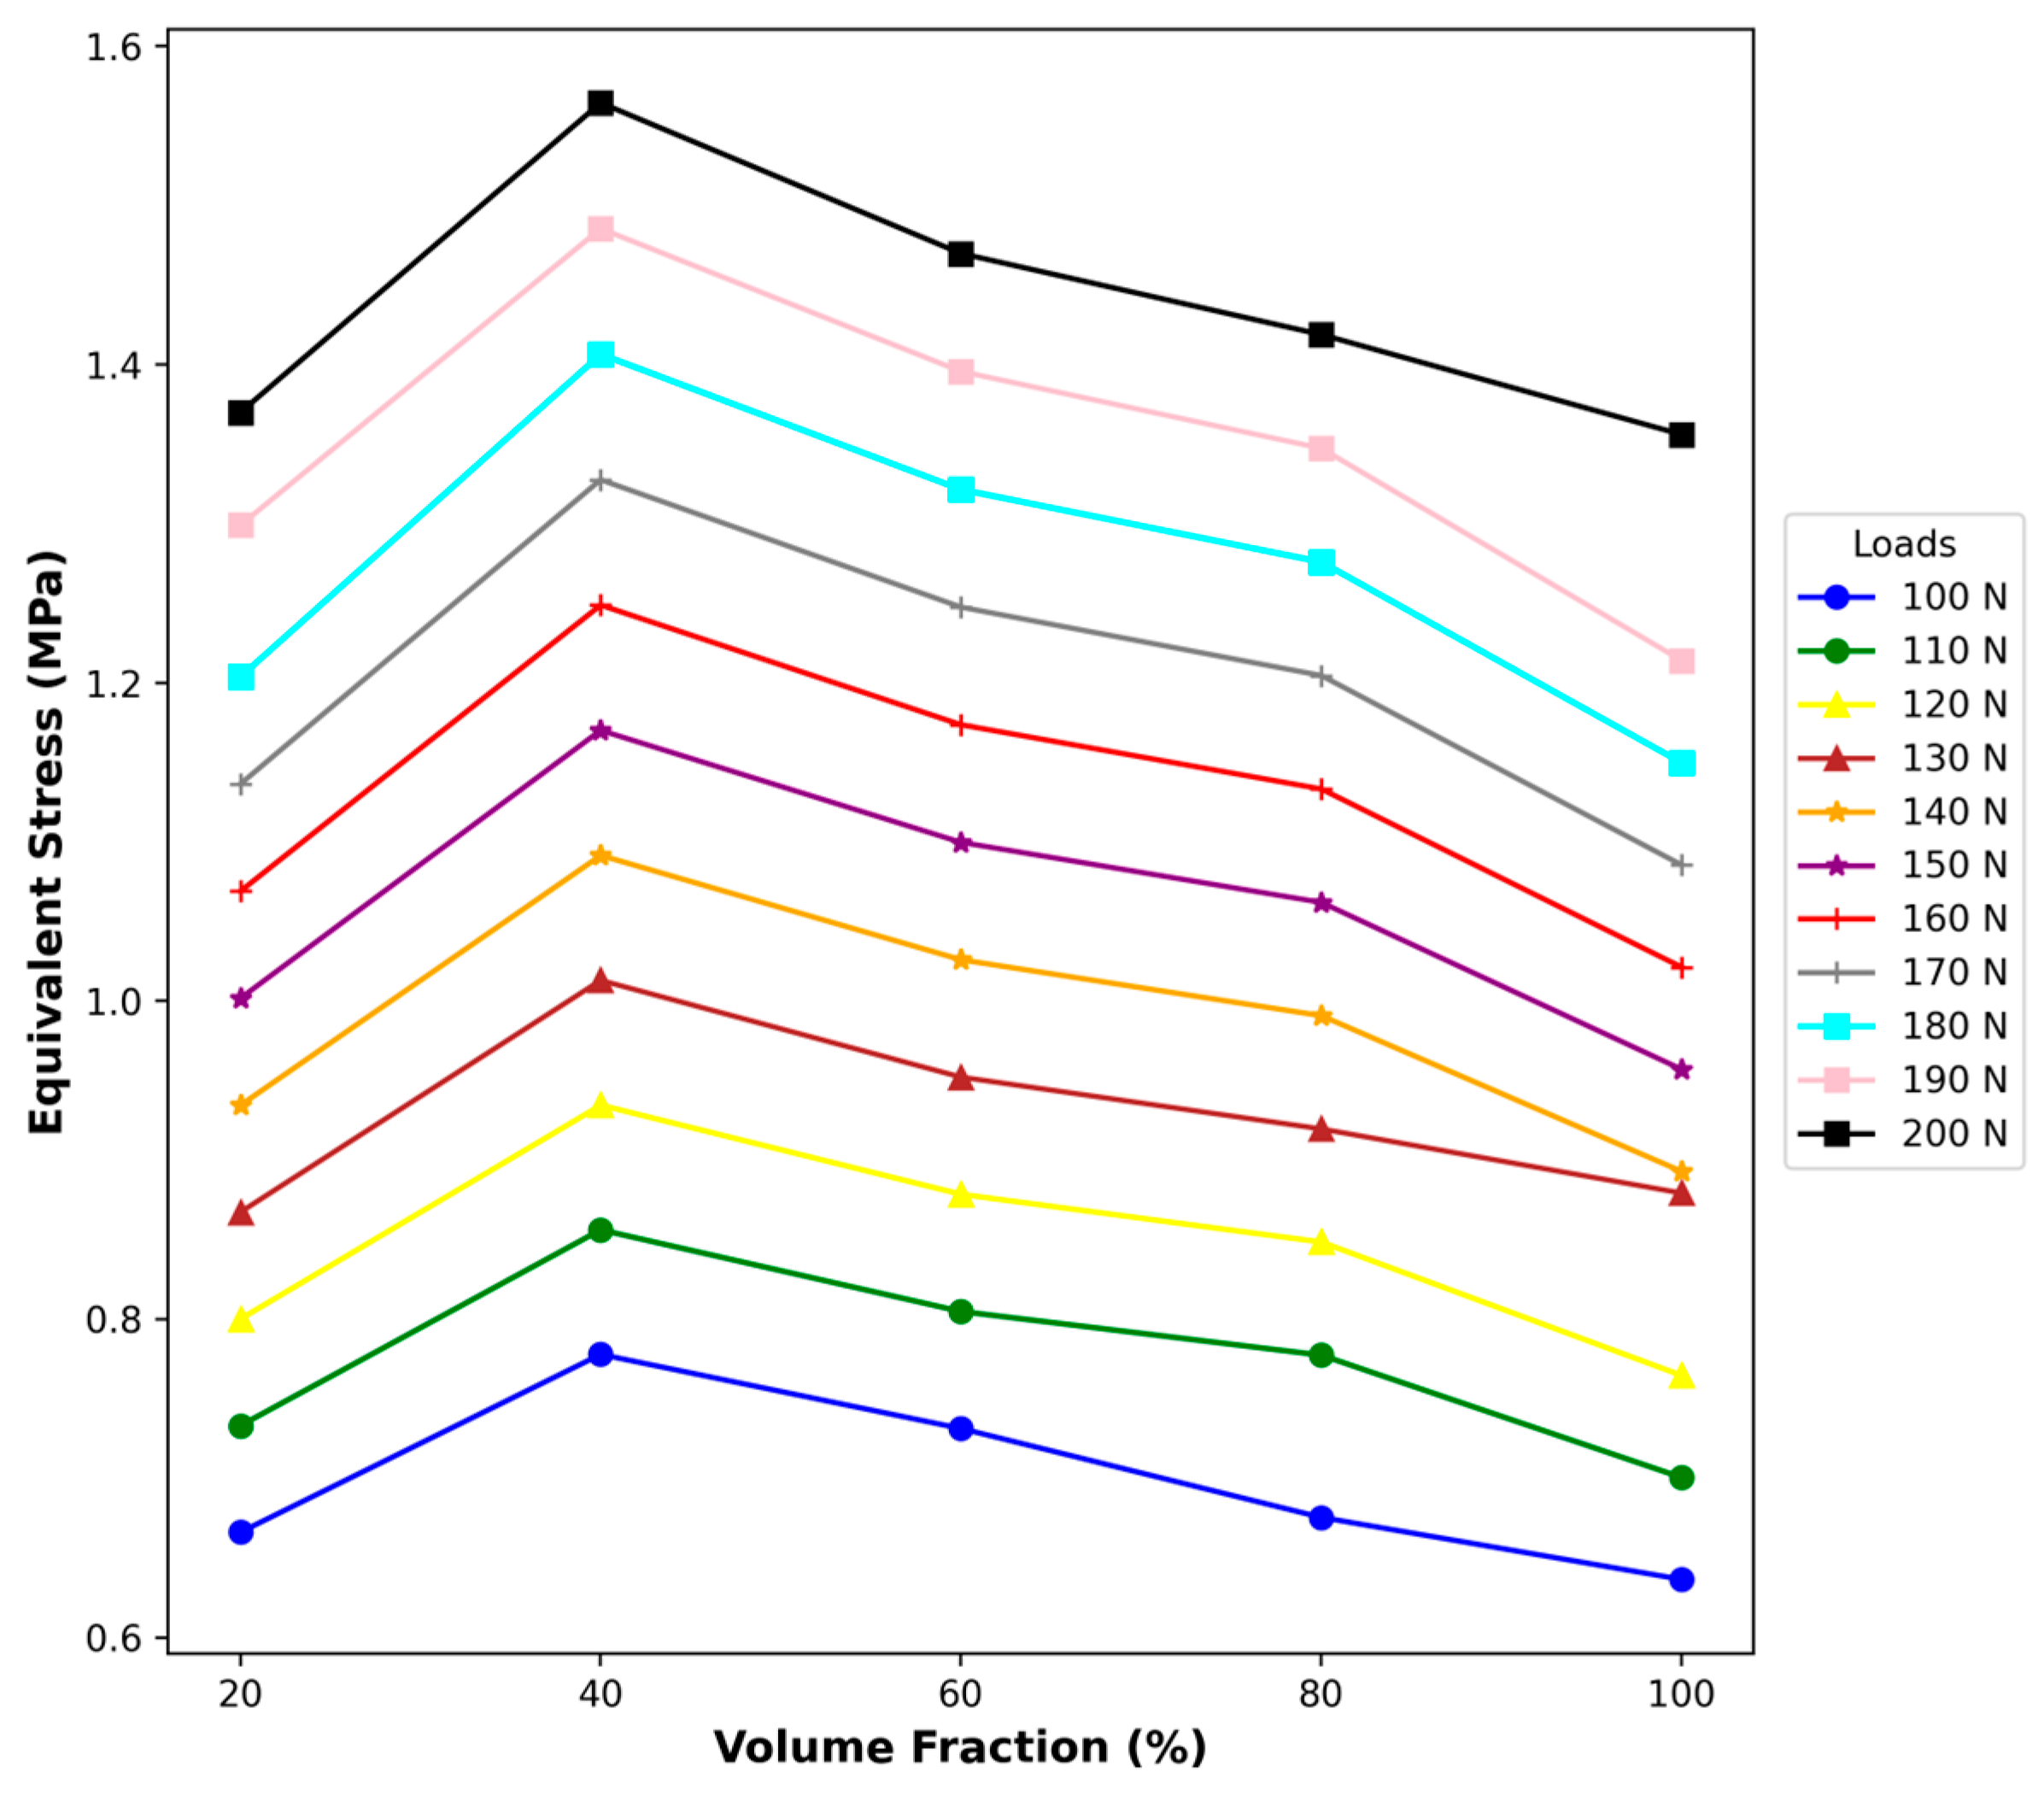
Figure 10.
Energy absorption of bumper impact test (a) internal energy in each speed test, and internal vs kinetics energy correspond to mesh convergence in every speed test (b) 11.11 m/s, (c) 15.61 m/s, (d) 22.22 m/s.
Figure 10.
Energy absorption of bumper impact test (a) internal energy in each speed test, and internal vs kinetics energy correspond to mesh convergence in every speed test (b) 11.11 m/s, (c) 15.61 m/s, (d) 22.22 m/s.
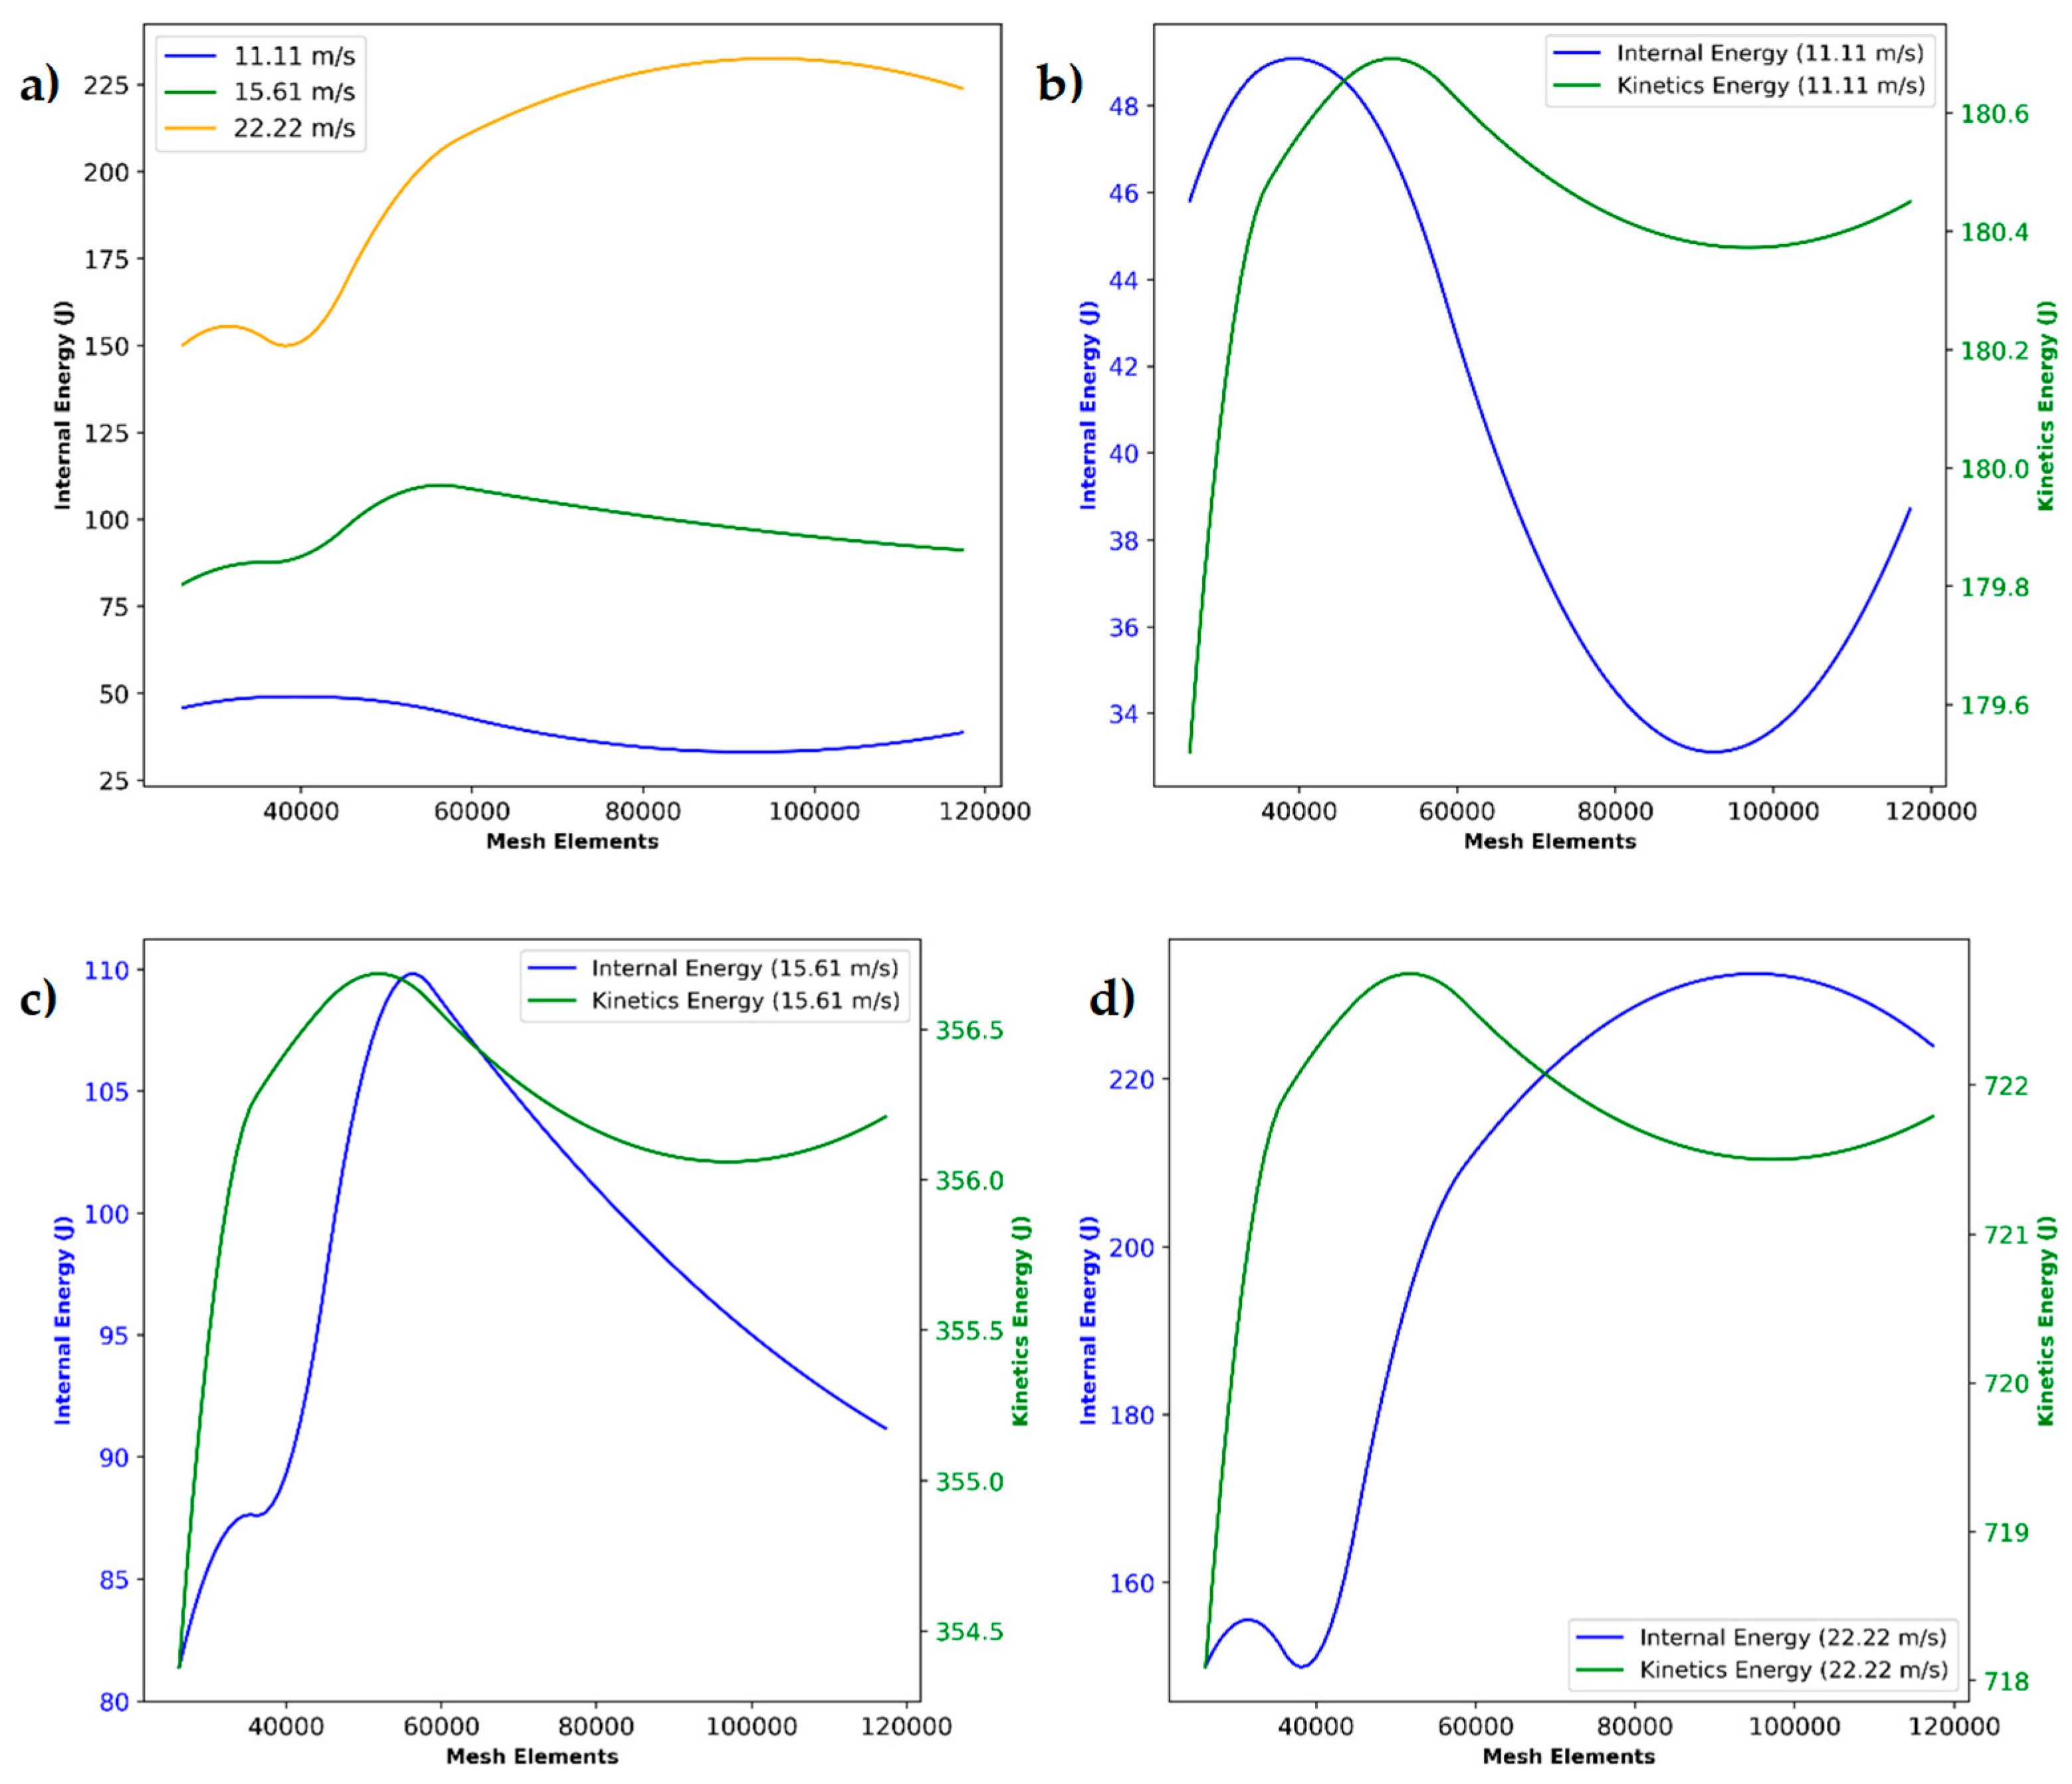
Figure 11.
Equivalent stress at different speed tests (a) 11.11 m/s, (b) 15.61 m/s, and (c) 22.22 m/s.
Figure 11.
Equivalent stress at different speed tests (a) 11.11 m/s, (b) 15.61 m/s, and (c) 22.22 m/s.
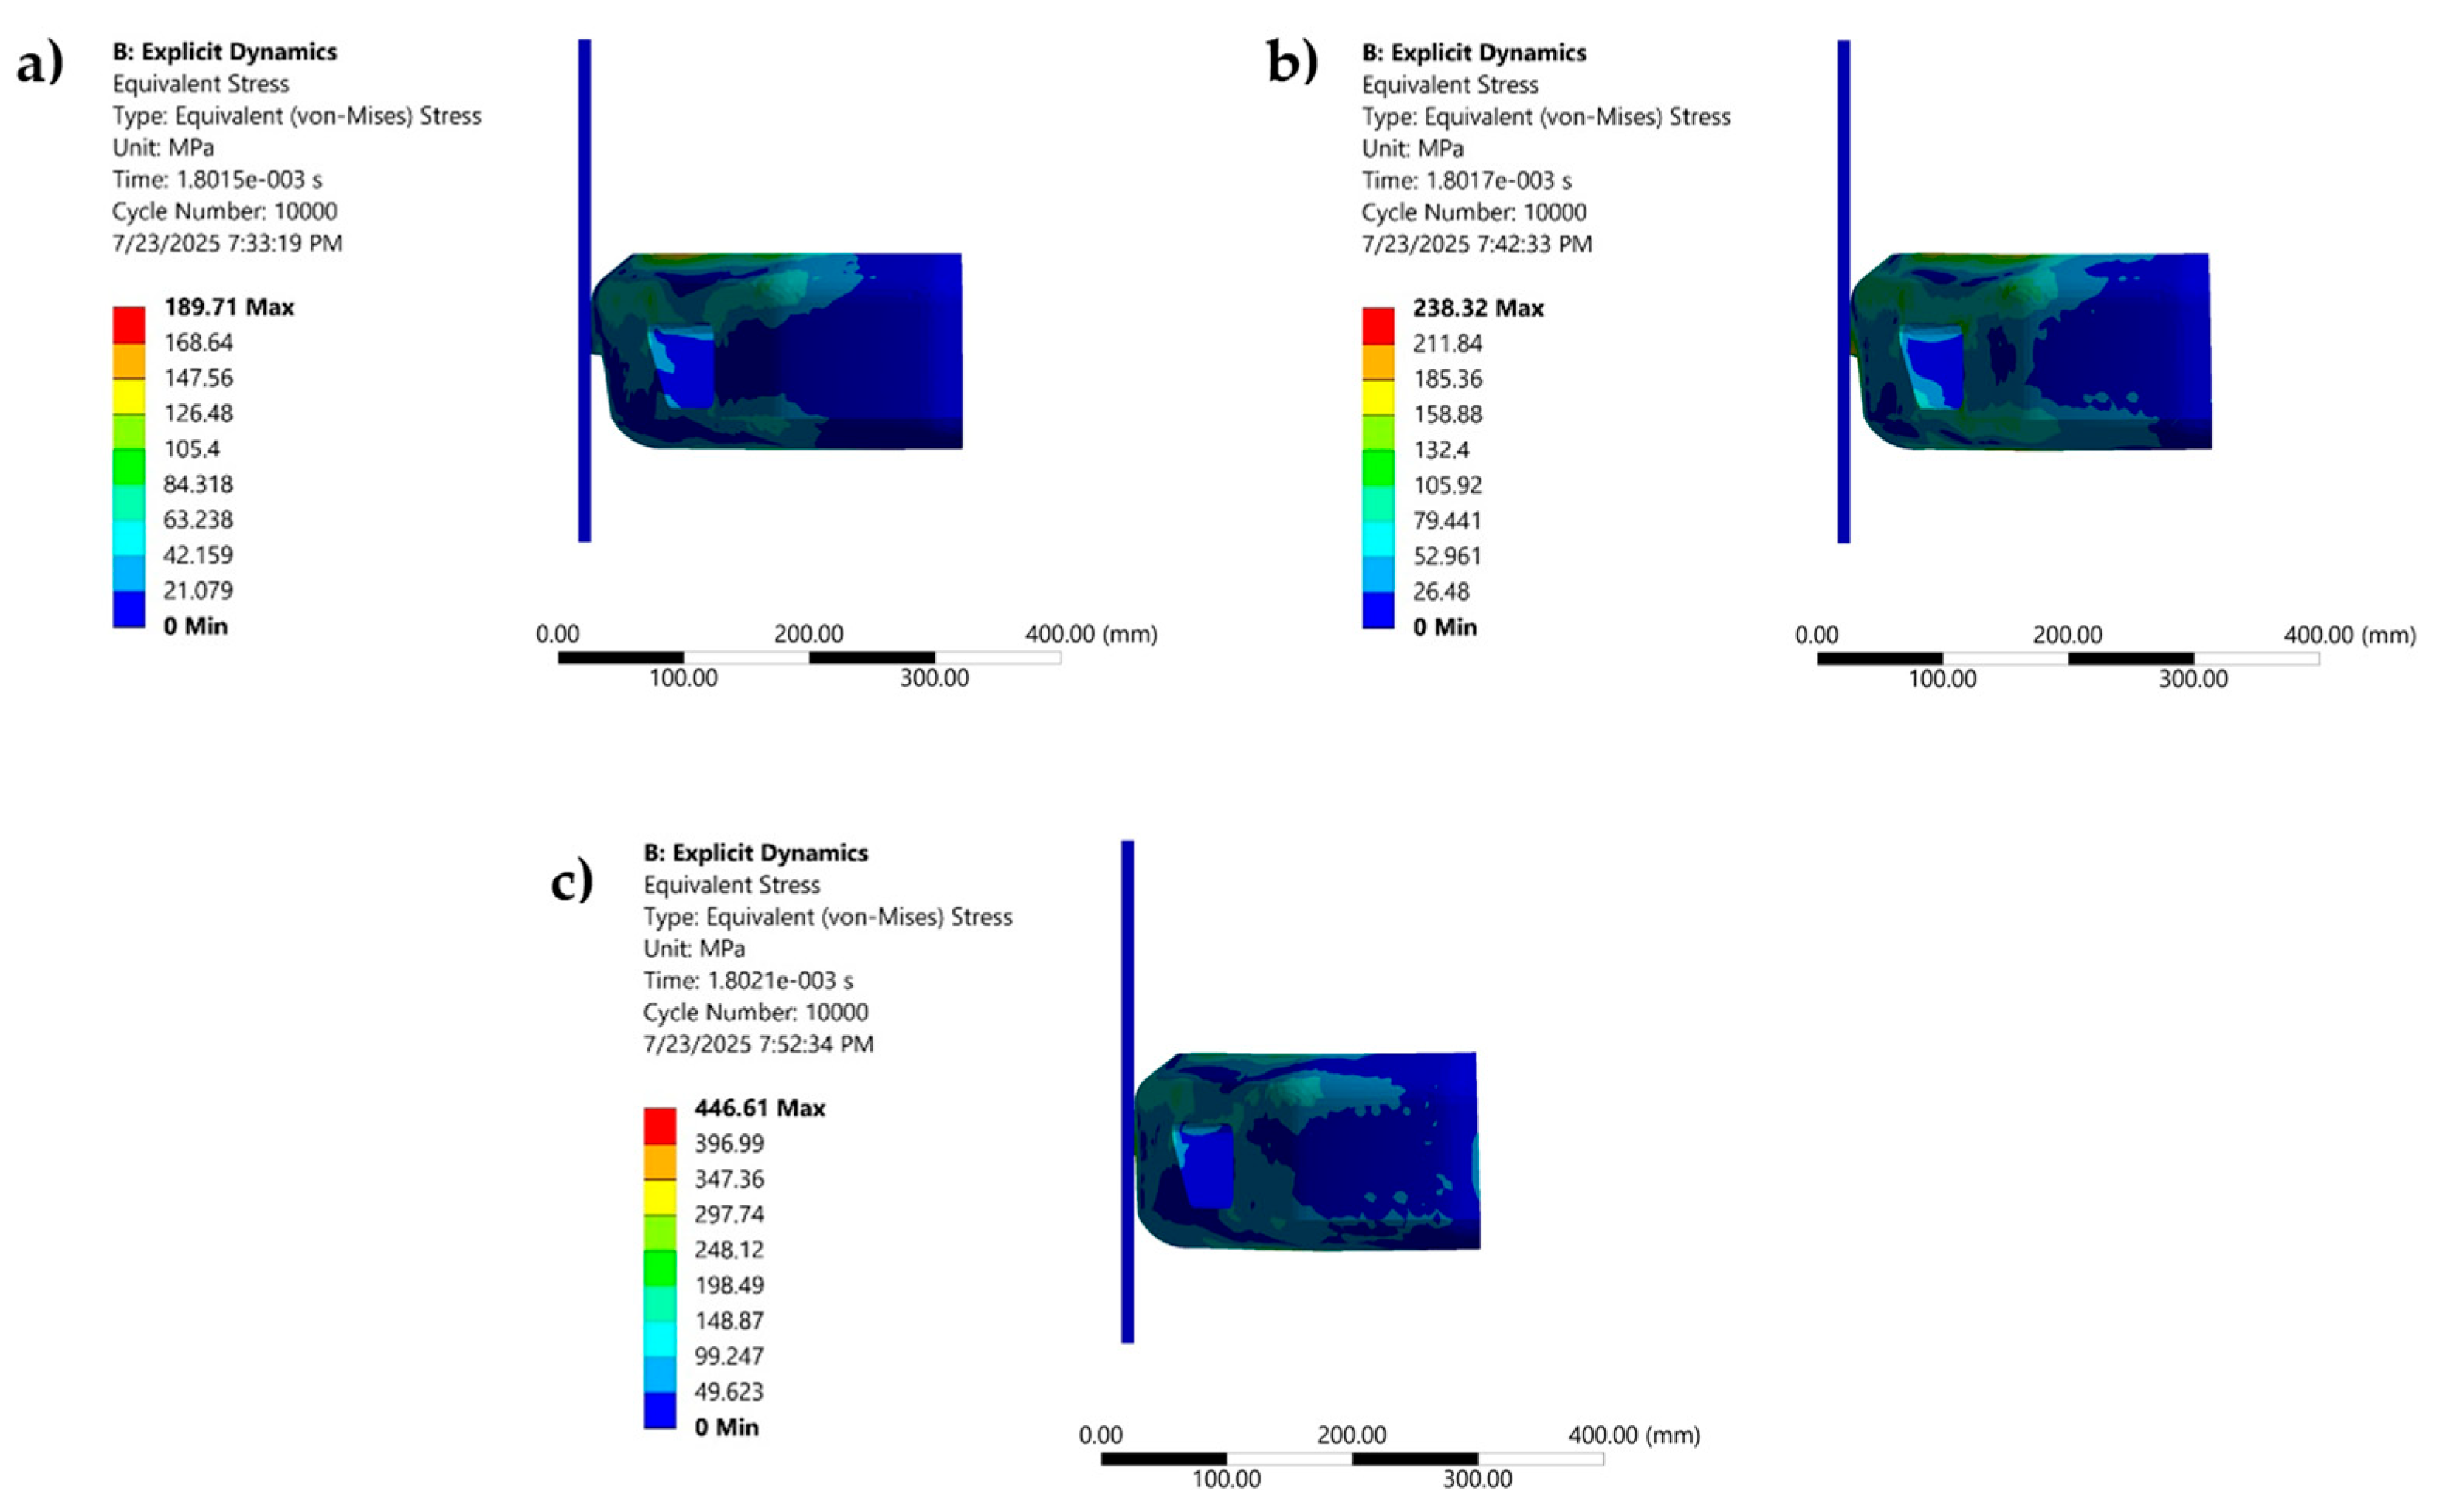
Figure 13.
Residual histogram plot of targets based on model performance.
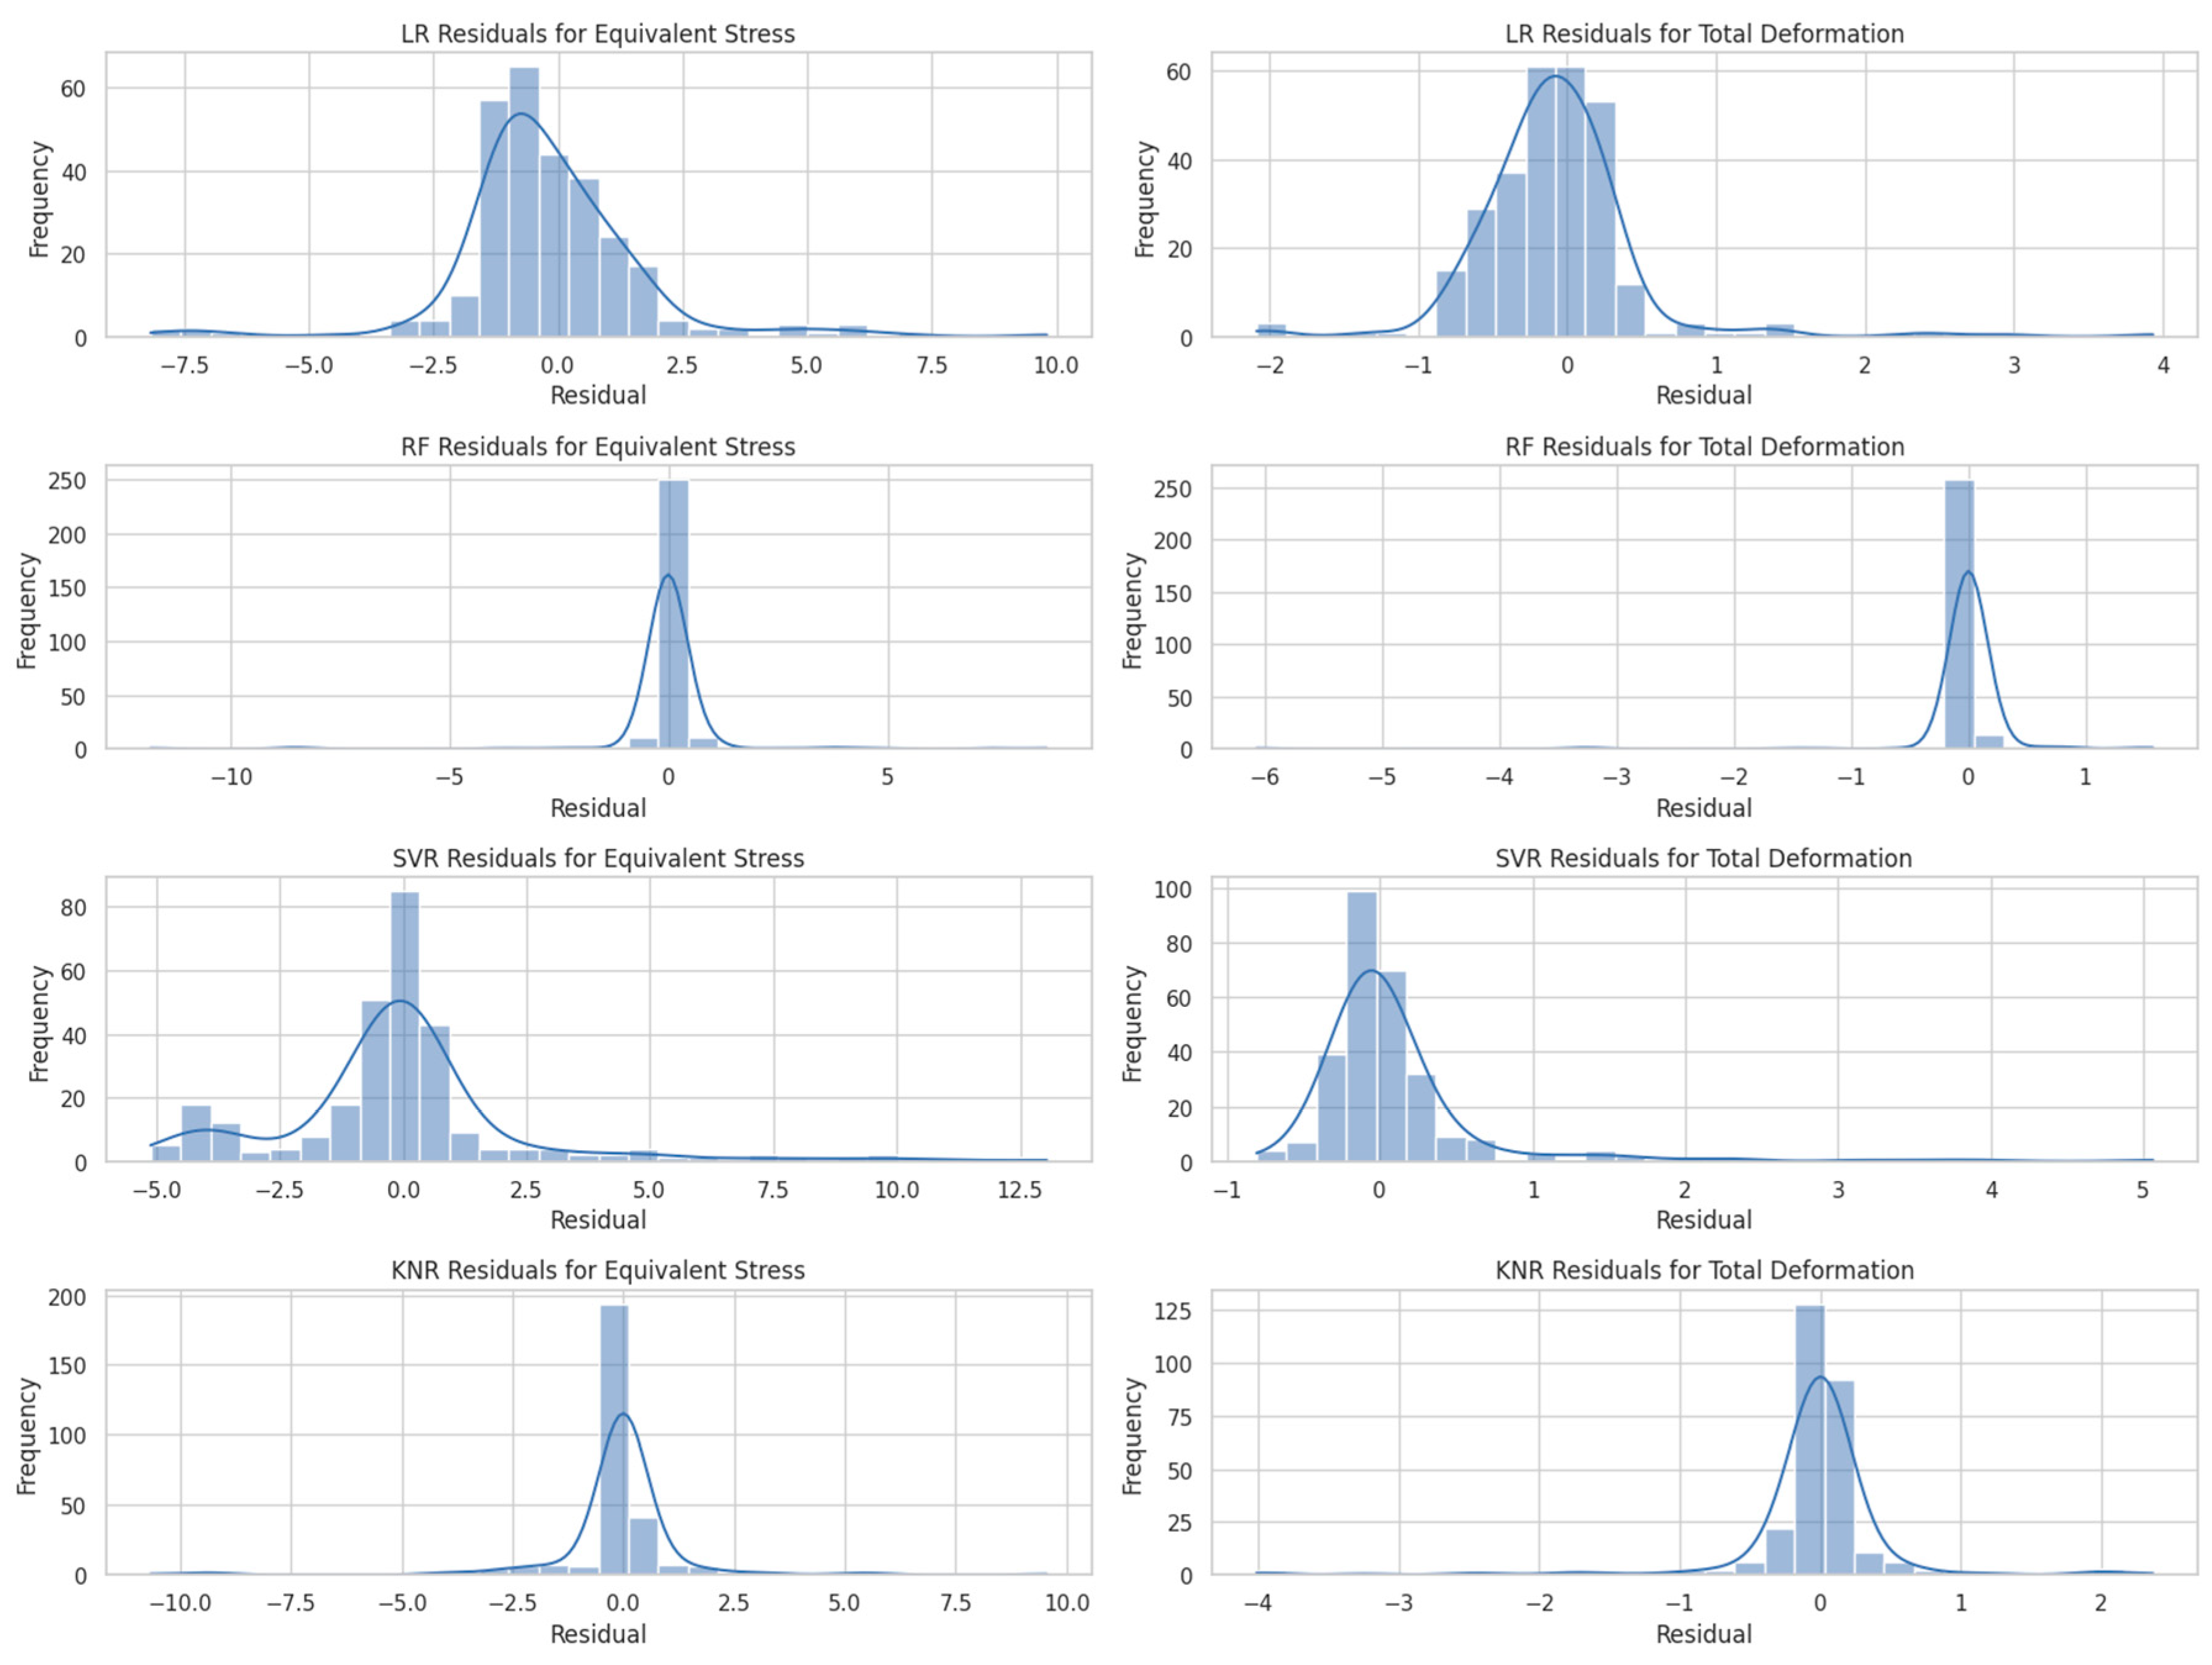
Figure 14.
Model performance evaluation (a) R2 Score, (b) mean square error.
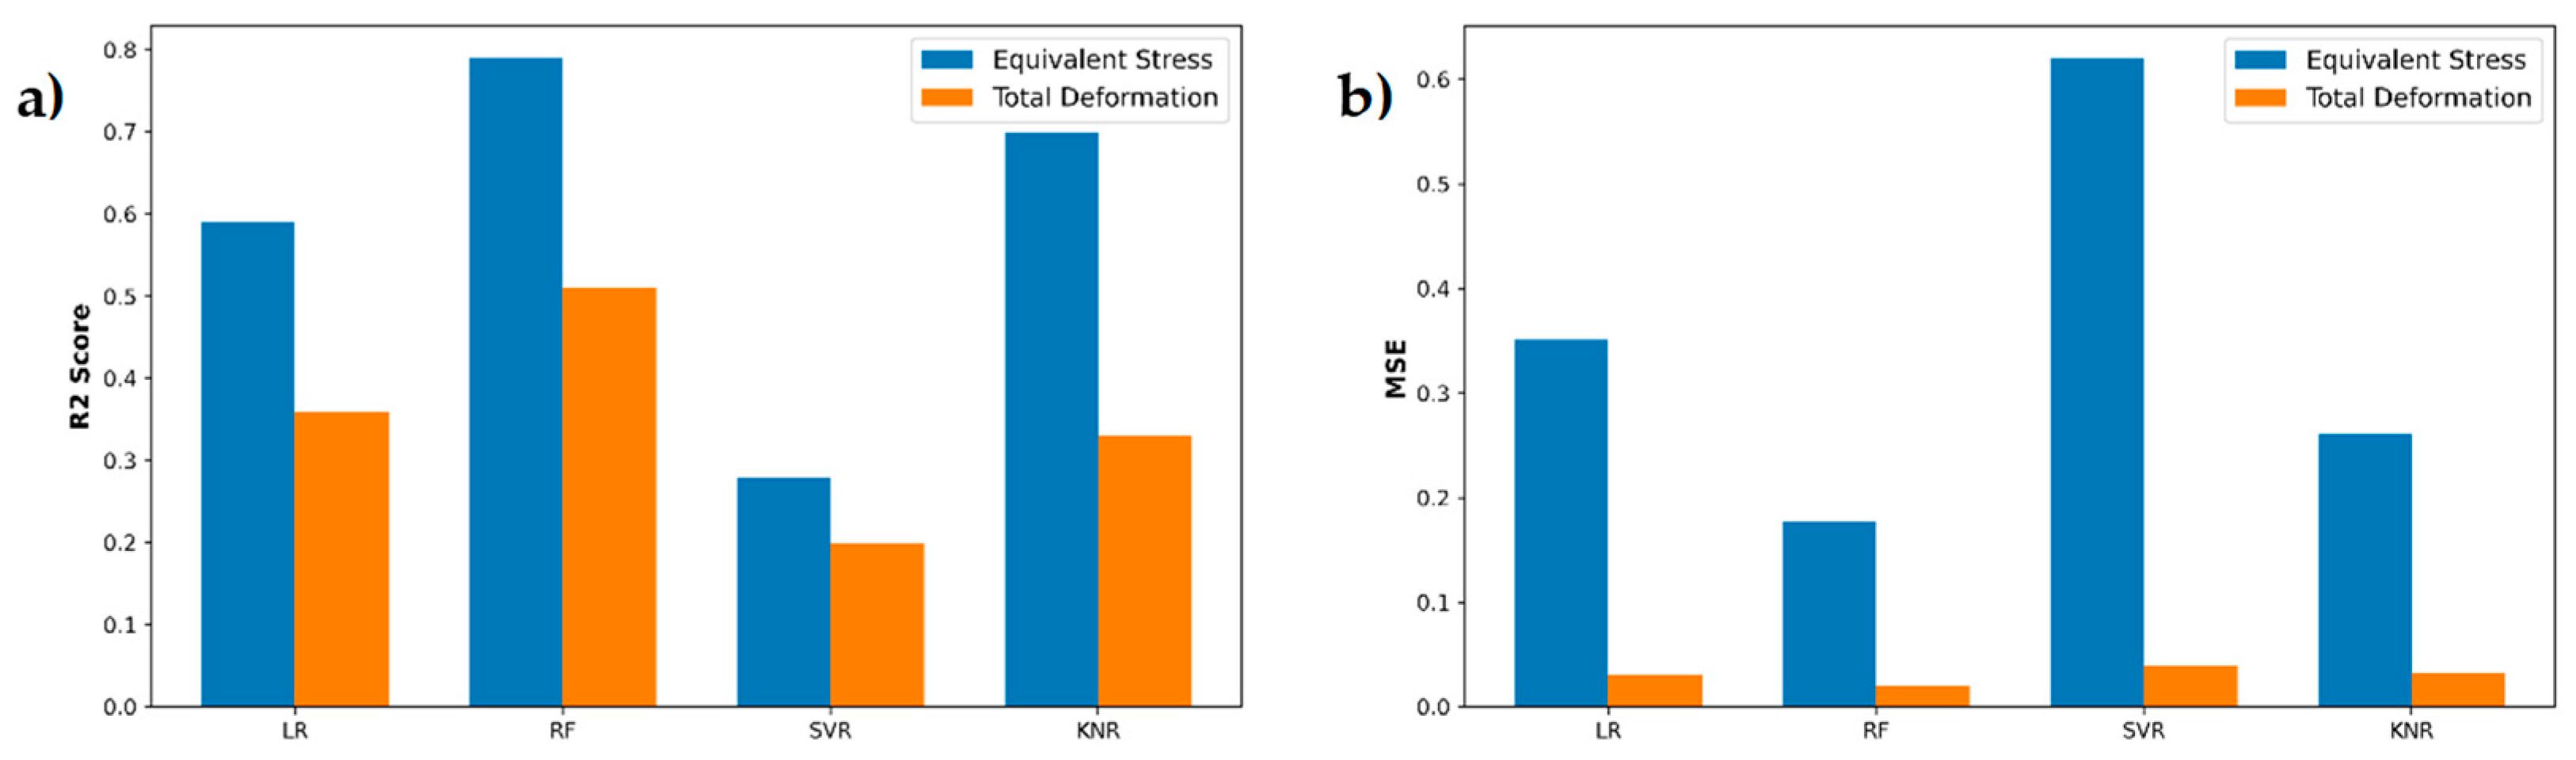

Table 1.
Comparison of different types of carbon-epoxy composite material.
| Properties | Unidirectional | Woven | Unit |
| Density | 1,490 | 1,420 | kg/m3 |
| Young modulus in X | 121,000 | 61,340 | MPa |
| Young modulus in Y | 8,600 | 61,340 | MPa |
| Young modulus in Z | 8,600 | 6,900 | MPa |
| Compressive strength in X | -1,082 | -509 | MPa |
| Compressive strength in Y | -100 | -509 | MPa |
| Compressive strength in Z | -100 | -170 | MPa |
| Poisson Ratio in X | 0.27 | 0.04 | - |
| Poisson Ratio in Y | 0.4 | 0.3 | - |
| Poisson Ratio in Z | 0.27 | 0.3 | - |
| Shear Modulus in X | 4,700 | 3300 | MPa |
| Shear Modulus in Y | 3,100 | 2700 | MPa |
| Shear Modulus in Z | 4,700 | 2700 | MPa |
Table 2.
Explicit dynamics test results in various speeds.
| Speed (m/s) | Stress (MPa) | Deformation (mm) | Internal Energy (J) | Kinetics Energy (J) |
| 11.11 | 10.247 | 5.7971 | 39.114 | 180.54 |
| 15.61 | 16.857 | 7.6752 | 105.95 | 356.39 |
| 22.22 | 23.438 | 10.436 | 218.73 | 722.16 |
Disclaimer/Publisher’s Note: The statements, opinions and data contained in all publications are solely those of the individual author(s) and contributor(s) and not of MDPI and/or the editor(s). MDPI and/or the editor(s) disclaim responsibility for any injury to people or property resulting from any ideas, methods, instructions or products referred to in the content. |
© 2025 by the authors. Licensee MDPI, Basel, Switzerland. This article is an open access article distributed under the terms and conditions of the Creative Commons Attribution (CC BY) license (http://creativecommons.org/licenses/by/4.0/).
Copyright: This open access article is published under a Creative Commons CC BY 4.0 license, which permit the free download, distribution, and reuse, provided that the author and preprint are cited in any reuse.


