
Submitted:
08 October 2025
Posted:
09 October 2025
You are already at the latest version
Abstract
The ABCB subfamily, a subset transporter of the ATP-binding cassette (ABC) superfamily, is vital for various plant life processes, especially in the transport of polar auxin and brassinosteroids. Although ABCB transporters have been characterized in diverse plant species, their specific functions in wheat remain largely unexplored. In this study, we identified 99 TaABCB members in wheat and categorized them into four groups based on their conserved domains and phylogenetic relationships. These members were found to be unevenly distributed across all 21 wheat chromosomes. We conducted a comprehensive genome-wide analysis encompassing gene structure, protein motifs, gene duplication events, collinearity, and cis-acting elements. Transcriptome analysis revealed that different TaABCB members displayed distinct expression patterns under phosphate starvation stress. Notably, we discovered that TaABCB7 might play a role in regulating wheat's phosphate starvation. Crucially, we pinpointed an elite haplotype, H001, of the candidate gene TaABCB7, which has been progressively selected and employed in wheat breeding improvement programs. Overall, this study enhances our comprehensive understanding of TaABCB members and offers a potential gene resource for molecular marker-assisted selection breeding in wheat.
Keywords:
wheat
; genome-wide
; ABCB
; gene family
; phosphate starvation response
1. Introduction
The ATP-binding cassette (ABC) protein superfamily is one of the largest transmembrane transport protein families, widely present in living organisms, including plants, animals, and microorganisms [1,2]. ABC transporters can be classified into three distinct types: full-sized transporters, half-sized transporters, and soluble carriers [3]. The full-size transporters primarily consist of two highly conserved nucleotide-binding domains (NBDs) and two highly variable transmembrane domains (TMDs). Half-size ABC transporters comprise merely one NBD and one TMD, necessitating the formation of either a homodimer or a heterodimer to execute their functional roles. In contrast, soluble transporters exhibit greater specificity as they encode solely two NBDs without any TMDs [4,5]. NBDs are capable of harnessing energy through the binding and hydrolysis of ATP, thereby facilitating the translocation of diverse substrates across cellular membranes. TMDs are responsible for substrate identification and participate in substrate transmembrane transport [6]. Due to its diversity and complexity, ABC transporters participate in multiple aspects of biological processes in plants, encompassing the maintenance of cellular osmotic balance, the uptake and distribution of plant nutrients, the transport of plant hormones, and signal transduction pathways [7,8].
Based on the phylogenetic analysis of ABC transporter proteins, along with the sequence similarity of nucleotide-binding domains and the structural organization of these domains, the plant ABC transporter protein family can be classified into eight distinct subfamilies: ABCA, ABCB, ABCC, ABCD, ABCE, ABCF, ABCG, and ABCI [9]. Among these subfamilies, ABCB is the second largest subfamily only to the ABCG subfamily. In Arabidopsis thaliana, a total of 29 ABCB transporters have been identified [5], with many of them demonstrated to participate in diverse biological processes, including the transport of phytohormones such as auxin and brassinosteroids [10], stomatal regulation, Fe/S biogenesis and resistance to heavy metal stress (cadmium, lead and aluminum). The most extensive analysis of ABCB function has focused on AtABCB1 (or AtPGP1) and AtABCB19 (or AtMDR1/AtPGP19). AtABCB1 and AtABCB19 are the best characterized members known to function as auxin efflux transporters, which are shared high sequence similarity and clustered together in the phylogenetic tree [11,12]. AtABCB1 is expressed in both the root and shoot apex, and it colocalizes as well as interacts with TWD1 at specific lateral plasma membrane (PM) domains of epidermal cell layers, thereby facilitating the regulated influx of auxin from the root apoplast into the cytoplasm [13]. AtABCB19 is predominantly localized within the vascular tissues of the hypocotyl and the stelar region of the root. The loss-of-function mutant of abcb19 displays a range of auxin-associated phenotypic alterations, while atabcb1/atabcb19 double knockout plants exhibit even more dramatic phenotypes, encompassing dwarfism, diminished apical dominance in mature plants, a shortened hypocotyl under both light and dark conditions, as well as abbreviated stamens [14,15,16]. Interestingly, the latest research has found that ABCB19 also could act as a brassinosteroid exporter and positively regulates brassinosteroid signaling together with ABCB1 [17]. However, AtABCB4, homolog to AtABCB21 [18,19], exhibited auxin concentration-dependent influx/efflux transporter activity from the root tip to the root elongation zone, when the level of auxin in cells is low, it promotes auxin input, and when it is high, it promotes auxin output [20]. Loss-of-function mutants of AtABCB4 exhibited an abnormal gravitropic response, irregular lateral root development, and increased root hair elongation [12]. When ABCB4 is overexpressed under the regulation of a root hair-specific promoter, it leads to shorter root hairs, a phenotype reminiscent of that observed with the overexpression of PIN efflux transporters [21]. Additionally, AtABCB14 regulates stomatal movement in response to CO2 by facilitating the transport of malate from the apoplast into guard cells, which subsequently elevates their osmotic pressure [22]. Meanwhile, OsABCB14 functions as an auxin influx transporter that plays a role in iron (Fe) homeostasis [23]. ABCB8 is crucial for maintaining mitochondrial iron homeostasis and the maturation of cytosolic Fe/S proteins, while the mitochondrial ABC transporter AtABCB25 contributes to Fe/S cluster formation by exporting glutathione polysulfide from the mitochondria to facilitate cytosolic Fe/S cluster assembly [24,25]. Moreover, ABCB25 also confers tolerance to heavy metals such as cadmium, lead, and aluminum [26,27]. Furthermore, AtABCB27 (AtTAP2/ALS1) and OsABCB27 have been implicated in aluminum tolerance [28,29,30].
However, a comprehensive analysis regarding the identification and functional characterization of the TaABCB gene family in wheat has not been reported. In this study, we conducted a genome-wide bioinformatics analysis to identify the numbers, physicochemical properties of proteins, and subcellular localization of TaABCB gene family members. Subsequently, we delved into the phylogenetic relationships, gene structure, conserved motifs, chromosomal distribution, gene duplication events, collinearity patterns, and cis-acting elements associated with these family members. We also performed transcriptome analysis to investigate the potential roles of TaABCB members in response to phosphate starvation. By integrating low-phosphorus transcriptome data with RT-qPCR analysis of candidate genes, we identified TaABCB7 as a potential key gene involved in the response to phosphorus deficiency stress. Besides, we discovered an elite haplotype of TaABCB7. These findings offer valuable insights for further research into the molecular functions of TaABCB gene family members and provide a potentially useful gene for molecular marker-assisted selection breeding in wheat.
2. Materials and Methods
2.1. Identification and Physicochemical Properties Analysis of TaABCB Members
The genomic data of wheat, encompassing the reference genome sequence, protein sequences, and gff3 files, were sourced from the Ensembl Plants database (https://plants.ensembl.org/index.html, accessed on 10 June 2024). Protein sequences of 29 AtABCB members in Arabidopsis thaliana (Supplementary Table S1) were retrieved from the National Center for Biotechnology Information database (https://www.ncbi.nlm.nih.gov/, accessed on 10 June 2024) and utilized as query templates in the BLASTP tool within TBtools-II (version 2.313) software [31] to identify all potential TaABCB members. Hidden Markov Models (HMMs) for the conserved domains (PF00005 and PF00664) of AtABCB were downloaded from the Pfam database (http://pfam.xfam.org/, accessed on 11 June 2024). The HMMER tool [32] was then employed to search and compare the entire genome’s protein sequences against these two AtABCB transporter HMMs. Additionally, TaABCB members were validated using the NCBI-CDD tool (https://www.ncbi.nlm.nih.gov/Structure/bwrpsb/bwrpsb.cgi, accessed on 11 June 2024) [33,34,35]. By integrating the results from BLASTP, HMMER, and NCBI-CDD, the members of the TaABCB gene family in wheat were further confirmed using the Triticeae-GeneTribe (http://wheat.cau.edu.cn/TGT/, accessed on 12 June 2024) with functional annotations [36].
Subsequently, the protein sequences of the selected members were submitted to the protein parameter calculator in TBtools-II (version 2.313) to predict the following physicochemical properties: amino acid count, molecular weight (MW), theoretical isoelectric point (pI), instability index, aliphatic index, and grand average of hydropathicity (GRAVY) values. The subcellular localization of TaABCBs was predicted using WOLF PSORT (http://wolfpsort.hgc.jp/, accessed on 15 June 2024), Busca (http://busca.biocomp.unibo.it/, accessed on 15 June 2024) [37], and Plant-mPLoc (http://www.csbio.sjtu.edu.cn/bioinf/plant-multi/, accessed on 15 June 2024) [38].
2.2. Multiple Sequence Alignment and Phylogenetic Tree Construction
To elucidate the evolutionary relationships among the members, a total of 99 identified TaABCBs, along with 27 OsABCBs [39] and 29 AtABCBs protein sequences, were aligned using ClustalW in MEGA 12 (version 12.0.11) software [40]. The maximum likelihood (ML) method was employed to construct a phylogenetic tree. The online iTOL (http://itol.embl.de/, accessed on 12 May 2025) tool [41] was utilized to further refine and visualize the phylogenetic tree.
2.3. Conserved Motifs and Domains Analysis of TaABCB Members
The conserved motifs of TaABCB members were identified using the Multiple Expectation maximization for Motif Elicitation (MEME) database (https://meme-suite.org/meme/tools/meme, accessed on 20 June 2024). The maximum number of motifs was set to 10, and other parameters were set at the default values. The conserved domains of TaABCB members were predicted using the Batch CD Search tool on NCBI (https://www.ncbi.nlm.nih.gov/Structure/bwrpsb/bwrpsb.cgi, accessed on 8 May 2025). TBtools-II (version 2.313) was employed for visualizing both the gene structure and motifs composition.
2.4. Chromosomal Mapping, Gene Duplication, and Collinearity Analysis of TaABCB Members
The chromosome mapping of TaABCB members were constructed using TBtools-II (version 2.313) according to the positional information of these members retrieved from the reference gff3 files. Gene duplication events of TaABCB members were analyzed using MCScanX tool, and then visualised using Advanced Circos tool in TBtools-II (version 2.313). To investigate the selection pressure of TaABCB members during evolution, the KaKs Calculator tool was employed to calculate the non synymous substitution (Ka) and synymous substitution (Ks) rates of duplicated genes in the TaABCBs gene family [42]. Besides, collinearity analysis of TaABCB members was performed using MCScanX tool in wheat and other species (Z. mays, O. sativa and A. thaliana). The genome gff3 files, genome sequences, and protein sequence files of maize, rice, and Arabidopsis thaliana were downloaded from the Ensembl Plants database (https://plants.ensembl.org/index.html, accessed on 10 June 2024), and then use the Dual Systeny Plot tool in TBtools-II (version 2.313) for plotting.
2.5. Cis-acting Elements Prediction and Gene Structure Analysis
For the analysis of cis-acting elements, promoter sequences of TaABCB gene family members, encompassing the 2,000 bp region upstream of the initiation codon “ATG,” were extracted from the wheat reference genome sequences. Subsequently, the cis-acting elements within these promoter regions were predicted using the PlantCARE database (https://bioinformatics.psb.ugent.be/webtools/plantcare/html/, accessed on 30 June 2024). Elements associated with plant growth and development, phytohormone responsiveness, as well as biotic and abiotic stress responses, were selected for detailed analysis. Distribution maps illustrating the cis-acting elements of TaABCB members were generated utilizing TBtools-II (version 2.313). Additionally, the gene structure of TaABCB members, including the positions and numbers of exons and introns, was analyzed based on gff3 files using the Gene Structure View (Advanced) feature within TBtools-II (version 2.313) software.
2.6. RNA-seq Analysis
For RNA-seq analysis, the study focused on an elite bread wheat cultivar, Kenong199 (KN199). KN199 seeds were germinated and cultivated in nutrient solutions composed of 1.5 mM CaCl2, 1 mM MgSO4, 10 μM H3BO3, 1 μM ZnSO4·7H2O, 0.5 μM CuSO4·5H2O, 2 mM Ca(NO3)2·4H2O, 0.1 mM FeNaEDTA, 1 μM MnSO4·H2O , 1.5 mM KCl, 0.05 μM (NH4)6Mo7O24·4H2O, 0.2 mM NaH2PO4. The pH of the nutrient solution was adjusted to 6.0 using HCl or NaOH, and the solution was refreshed every three days. Two-week-old wheat seedlings, which had developed three leaves and were at the autotrophic stage with heightened sensitivity to abiotic stresses (Li et al., 2017), were subjected to either phosphorus-sufficient (0.2 mM, PS) or phosphorus-deficient (0 mM, PD) conditions, while maintaining identical concentrations of all other nutrients in both growth media. All seedlings were grown in a controlled growth chamber at 25℃ with a 16-hour light and 18℃ with 8-hour dark cycle, and a relative humidity of approximately 70%.
Root samples (three biological replicates) were collected after one day of treatment. Total RNAs were extracted using ethanol precipitation and CTAB-PBIOZOL methods. The quality and quantity of total RNA were assessed using a Qubit 4.0 fluorescence quantifier and a Qsep400 high-throughput biofragment analyzer, respectively. The preparation of RNA-seq libraries and subsequent sequencing were carried out by Metware Biotechnology Co., Ltd. (Wuhan, China). Briefly, transcriptome libraries were constructed by enriching mRNA with polyA tails using Oligo (dT) magnetic beads, followed by sequencing on the Illumina Hiseq platform after passing library quality checks.
After filtering out low-quality reads from the raw sequence data using fastp [43], the clean reads were aligned to the wheat reference genome (International Wheat Genome Sequencing Consortium, RefSeq v2.0) using HISAT2 [44]. Gene expression levels were quantified by calculating gene alignment statistics with feature counts. Subsequently, FPKM (fragments per kilobase of transcript per million fragments mapped) values were computed for each gene based on gene length to measure transcript or gene expression levels. Differentially expressed genes (DEGs) were identified using DESeq2 [45,46], with a false discovery rate (FDR) threshold of <0.05 and |log2 Fold Change| ≥ 0.6.
2.7. RNA Extraction and RT-qPCR Analysis
For RT-qPCR analysis, total RNA was extracted from the young roots of 1-, 3-, and 5-day-old KN199 seedlings treated with Pi-sufficient (0.2 mM, PS) and Pi-deficient (0 mM, PD) conditions using TRIzol reagent (Invitrogen) according to the manufacturer’s instructions. Full-length cDNA was synthesized using the 5×All-In-One RT Master Mix system (Abm Inc.). RT-qPCR analysis was performed using a LIGHTCYCLER 96 (Roche), with each assay replicated at least three times using three independent RNA preparations. TaActin transcripts were used as an internal reference for normalization. Gene expression levels were calculated using the 2−ΔΔCT method, where CT represents the threshold cycle. Primer sequences are provided in Supplementary Table S6.
2.8. Computational Analysis of AlphaFold 3
To predicte the conjunction of TaPHR2 and the promoter of TaABCB7, AlphaFold 3 was employed for conformational prediction analysis, and yielded a PDB file with a pTM and ipTM value. The value of pTM+ipTM ≥ 0.75 indicates a good docking effect and reliable results.
For the purpose of molecular docking analysis, the PDB file of TaPHR2 was input as the ligand, while the PDB file of the TaABCB7 promoter served as the receptor into the HDOCK server. The docking conformations were generated using HDOCK with a grid spacing parameter set to 1.2 and an angle parameter set to 15. The docking score was calculated using the formula: Confidence score (CS) = 1.0/[1.0+e0.02*(Docking_Score+150)]. The confidence score, based on a docking score of -200 (where a score less than -200 indicates a high probability of protein interaction), is approximately 0.7. CS≥0.7, it indicates that there is a high probability of binding between the two molecules; 0.7>CS≥0.5, it indicates that the two molecules may be bound; 0.5>CS, it indicates that the two molecules are unlikely to combine.
2.9. Dual-Luciferase Reporter Assays
The promoter region of TaABCB7 (approximately 2000 bp in length) was amplified from the genomic DNA of KN199 and subsequently inserted into the pGreenII0800 vector to create the reporter construct 35S::proTaABCB7-LUC-35S::REN. Simultaneously, the full-length coding sequence of TaPHR2 was amplified from the cDNA of KN199 and inserted into the pGreenII 62-SK overexpression vector to generate the effector construct 35S::TaPHR2. Both constructs were co-transfected into Nicotiana benthamiana leaf protoplasts using PEG-mediated transformation. After transfection (16–18 hours later), the activities of firefly luciferase (LUC) and Renilla luciferase (REN) were measured using the Dual-Luciferase® Reporter Assay System (Promega, E1960) on a microplate reader. The LUC activity was normalized to the REN activity to account for variations in transfection efficiency. The data are presented as mean ± SD (n = 4). Statistical significance was assessed using Student’s t-test (*p ≤ 0.05, **p ≤ 0.01, ***p ≤ 0.001). Primer sequences are listed in Supplementary Table S6.
2.10. The Haplotype Analysis of TaABCB7
To investigate the selection of the TaABCB7 in breeding and improvement processes, the TaABCB7 gene resequencing data were extracted from 406 wheat genotypes in the Wheat Genotype and Phenotype Database (http://resource.iwheat.net/WGPD/) [47] for haplotype classification, and the geneHapR package was used for haplotype analysis. Then, significant differences in plant height (PH), productive tiller number (PTN), thousand kernel weight (TKW) and total root length (TRL) were analyzed among different haplotypes.
3. Results
3.1. Identification of TaABCB Gene Family Members in Wheat
In this study, a total of 99 TaABCB members were identified from wheat genome (Triticum aestivum L.) and systematically named according to their chromosomal locations (detailed characteristics of these members were listed in Supplementary Table S2). The encoded proteins exhibited notable variability in length, ranging from 488 amino acids (aa) in TaABCB11 to 1,500 aa in TaABCB68, with corresponding molecular weights spanning 53,286.86 Da (TaABCB11) to 160,898.77 Da (TaABCB68). The predicted isoelectric points (pI) varied from 5.71 (TaABCB89) to 9.38 (TaABCB91). Further analysis of physicochemical properties revealed instability indices ranging from 26.22 to 46.32, aliphatic indices between 89.34 and 107.95, and grand average of hydropathicity (GRAVY) scores from -0.056 to 0.206. Subcellular localization predictions indicated that all TaABCB proteins are membrane-bound, suggesting their potential regulatory functions in cellular membrane processes.
3.2. Phylogenetic Analysis of TaABCB Members
To explore the evolutionary relationships among TaABCB family members, a phylogenetic tree was constructed using full-length protein sequences from Arabidopsis thaliana, rice, and wheat as reference datasets. Based on the AtABCB subfamily has been divided into two major classes: full-size transporters (only include PGP/MDR type) and half-size transporters (include LLP, HMT/ATM, and TAP types). Using subpopulation division of Arabidopsis thaliana as a reference, 99 TaABCB members were divided into four branches. Among them, 78 TaABCB members were clustered into the MDR type transporters, 3 TaABCB members belong to the LLP type transporters, 6 TaABCB members belong to the ATM type transporters, and 12 TaABCB members belong to the TAP type transporters (Figure 1).
3.3. Conserved Motifs and Domains Analysis of TaABCB Members
To elucidate the structural diversity among TaABCB family members, conserved motifs and functional domains were systematically mapped based on genomic annotation data. Firstly, an evolutionary tree was constructed for the TaABCB members using MEGA software, and categorized them into four types: PGP/MDR, HMT/ATM, TAP, and LLP (Figure 3A). We then analyzed the motif patterns in TaABCB members to further elucidate the evolutionary relationships. A total of 10 conserved motifs were detected across the 99 TaABCB members, designated as motif 1 to motif 10 (Figure 2). According to the structural features of ABCB proteins, the 78 full-size TaABCB proteins in Group MDR included 7 to 13 motifs, of which 8 motifs (2, 3, 4, 5, 6, 7, 9 and 10) being highly prevalent and constituting core components of their sequences. The 21 half-size TaABCB proteins contained 5 to 8 motifs and 6 motifs (1, 3, 5, 7, 8 and 9) were highly conserved, for instance, 6 ATM type of half-size transporters possessed 6 or 7 motifs, 12 TAP type transporters contained 5-8 motifs, and 3 LLP type transporters contained 6 motifs, respectively (Figure 3B). All TaABCB family members share the ABC_STABC3_SDL1_MDL2 domains, with members of the same subgroup displaying similar domain architectures and motif counts (Figure 3C). Conserved motifs and domains analysis showed that most TaABCB proteins tended to have similar conserved motifs and domains compositions in separate subgroups. These results are consistent with the evolutionary pattern presented by the phylogenetic tree, indicating that functional divergence likely occurred among subgroup members during TaABCB evolution.
3.4. Chromosomal Mapping, Gene Duplication, and Collinearity Analysis
To determine the distribution of the TaABCB members, we analyzed their distribution across the wheat chromosomes. Chromosome mapping analysis showed that the 99 TaABCB members had an unevenly distribution on all 21 chromosomes (Figure 4). Among these chromosomes, Chr3 (with 29 TaABCBs) and Chr2 (with 23 TaABCBs) harbored the highest density of TaABCB members. 3A and 3B each contain 10, 3D contains 9, 2A and 2B each contain 8, and 2D contains 7, followed by Chr7 with 13 TaABCBs, Chr 6 with 11 TaABCBs, and Chr4 with 10 TaABCBs, respectively. Chr5 with 7 TaABCBs and Chr1 with 6 TaABCBs possessed the least.
Gene duplication serves as the primary driver of gene family evolution, facilitating the rapid expansion of member numbers and functional diversification. This process has been critical for wheat’s adaptation to diverse environmental conditions during polyploidization, primarily through segmental and tandem duplication mechanisms. To gain deeper insights into the dynamics of gene duplication events in wheat, we analyzed the segmental and tandem duplications that occurred among 99 TaABCB members. Herein, a total of 79 segmental duplication gene pairs were identified across the TaABCB family, distributed on distinct chromosomes, with no tandem duplication events detected. Meanwhile, 9 segmental duplication pairs were found between homologous chromosome groups 1A/1B/1D and 3A/3B/3D. These results indicated that segmental duplication has been the dominant mechanism driving TaABCB gene family expansion, particularly during wheat polyploidization (Figure 5). Furthermore, Ka/Ks ratio analysis revealed that all collinear gene pairs exhibited values less than 1, indicating that these genes have undergone purifying selection throughout their evolutionary process (Supplementary Table S3).
To investigate the evolutionary origin and homology of 99 TaABCB members, a collinearity analysis was performed through comparing wheat with three species, including two monocotyledons (O. sativa and Z. mays) and a dicotyledons A. thaliana. The results showed that 7, 56 and 66 pairs of homologous genes from Arabidopsis thaliana, rice and maize, respectively.
This suggests that TaABCB genes exhibit a closer evolutionary relationship with their orthologs in monocotyledonous species such as rice and maize. Compared to other species, wheat undergoes rapid gene expansion during the process of polyploidization, and the TaABCBs may have played a critical role in shaping wheat’s evolutionary trajectory (Figure 6).
3.5. Cis-acting Elements and Gene Structure Analysis of TaABCB Members
Gene expression is predominantly regulated by cis-acting elements in promoter regions located upstream of the transcription start site. To elucidate the expression patterns and potential regulatory roles of TaABCB genes, we analyzed the promoter sequences of 99 TaABCB members using the PlantCARE database. This revealed diverse functional cis-elements associated with plant growth and development, phytohormone signaling, and biotic/abiotic stress responses (Figure 7A,B). Key growth-related elements included the circadian element (circadian regulation), RY-element (seed-specific expression), CAT-box (meristem activity), motif I (root-specific expression), and light-responsive motifs (ACE, G-Box, Sp1, GT1-motif, TCCC-motif), suggesting multifaceted roles for TaABCBs in plant. Promoters also contained multiple phytohormone-responsive elements, such as auxin-related (TGA-element, AuxRR-core), gibberellin-related (TATC-box, P-box, GARE-motif), abscisic acid-responsive (ABRE), methyl jasmonate-responsive (CGTCA-motif, TGACG-motif), and salicylic acid-responsive (TCA-element, SARE), indicating that TaABCB expression may be modulated by these hormones to influence growth and development. Additionally, stress-related elements like TC-rich repeats (defense signaling) and LTR (low-temperature response) were identified, implying roles in biotic and abiotic stress adaptation. Interestingly, we also discovered four MYB binding related components, including MBS, MBSI, MRE and CCAAT-box. The past studies have shown that MYB transcription factors (AtPHR1 or OsPHR2) can participate in phosphorus starvation response, suggesting that TaABCB members may also participate in phosphate deficiency signaling.
Regarding gene structure, TaABCB members exhibited exon counts ranging from 4 to 20, in which 78 MDR type of full-size transporters contained 4-13 exons, while half-size transporters had similar exon numbers, of which 6 ATM type of half-size transporters possessed 20 exons, 12 TAP type transporters contained 16-18 exons, and 3 LLP type transporters contained 10 and 11 exons. This structural diversity underscores a complex evolutionary process for the TaABCB family in wheat (Figure 7C).
3.6. Phosphorus Starvation Transcriptome Analysis
To assess how TaABCB proteins function in the early phase of phosphate starvation response, we sequenced the transcriptome of the root under Pi-sufficient (PS) and Pi-deficiency (PD). The transcriptome sequencing generated 596,956,818 raw reads. Following rigorous quality control to filter low-quality and adapter-contaminated sequences, a total of 563,793,202 high-quality clean reads were retained across six samples, yielding 84.57 Gb of transcriptomic data. Quality metrics showed exceptional consistency, with Q30 bases ranging from 95.99% to 96.13% and an average GC content of 52.75%. Alignment analysis using a sliding window density approach demonstrated high genomic mapping efficiency, with 87.13% of the generated reads were accurately aligned to the wheat (Triticum aestivum L.) reference genome. Notably, over 81% of transcripts exhibited unique mappings, underscoring the robustness and specificity of the alignment process (Supplementary Table S4). Principal component analysis (PCA) demonstrated that PC1 and PC2 accounted for 28.73% and 23.98% of the total variance, respectively, enabling clear differentiation between treatment conditions. Biological replicates clustered tightly in the ordination space, indicating high reproducibility (Figure 8A). Transcriptomic profiling under PS and PD conditions revealed 1,050 differentially expressed genes (DEGs) in root tissues, with 257 genes upregulated and 793 downregulated (Figure 8B, Supplementary Table S4).
To investigate biological pathway dynamics, we performed KEGG enrichment analysis, which revealed that DEGs were predominantly enriched in cellular processes, environmental information processing, metabolism, and organismal systems. Most of the DEGs were involved in metabolic pathways. Interestingly, we found that 4 down-regulated TaABCB genes (TaABCB7, TaABCB16, TaABCB31, TaABCB50) associated with environmental information processing (Figure 8C, Supplementary Table S4). GO enrichment analysis was subsequently performed to functionally annotate DEGs into two major categories: biological process (BP) and molecular function (MF) (Figure S1, Supplementary Table S4). This analysis identified 39 highly enriched GO terms under BP and 11 under MF. Notably, the GO term GO:0140359 (ABC-type transporter activity) within the MF category was enriched. Specifically, 5 TaABCB members (TaABCB7, TaABCB16, TaABCB31, TaABCB35, TaABCB50) were functionally associated with this functional annotation. This finding underscores their critical roles in phosphate starvation response, suggesting potential involvement in nutrient transport and metabolic adaptation under stress conditions.
3.7. Expression Profile of TaABCB Members in Response to Phosphate Starvation and the Analysis of Candidate Gene
To understand the expression profile of the TaABCB members in phosphorus starvation response, we visualized the expression of TaABCB members using phosphorus starvation transcriptome data (Figure 9A). Through colocalization of differentially expressed genes and TaABCB members in transcriptome data, five differentially expressed genes were identified (Figure 9B), indicating that these candidate genes are functionally involved in the phosphorus pathway. By using the STRING online tool to predict protein interactions, it was found that there is a certain degree interaction of differentially expressed genes (Figure 9C, Supplementary Table S5). Our transcriptomic analysis under low phosphorus conditions showed that four candidate genes were repressed while one was induced. Among these, TaABCB7 displayed a significantly higher expression fold change during phosphorus starvation versus Pi-replete conditions, indicating its potential involvement in phosphorus homeostasis (Figure 9D–H).
To further validate the accuracy of transcriptome results and identify key candidate genes, we analyzed TaABCB7 expression under low phosphorus (LP) stress across multiple time points, and further validated our findings using the LP stress marker gene TaIPS1. RT-qPCR analysis revealed that TaIPS1 expression was markedly induced under LP stress compared to normal phosphorus levels, showing a time-dependent accumulation pattern (Figure 9I). These results align with prior studies, supporting our experimental conclusions. Interestingly, TaABCB7 expression exhibited a slight downregulation after 1 day of LP stress relative to controls. But with the increase of stress time, compared to normal conditions, the expression level of TaABCB7 gradually upregulated, and the upregulation amplitude gradually increased. At 3 days, the expression level reached its peak (Figure 9J). Based on the above results, it is suggested that TaABCB7 may act as a key candidate gene which play a more important role in participating in the phosphorus pathway.
Therefore, AlphaFold 3 was employed for predicting the conjunction between the transcription factor TaPHR2 and the promoter region of TaABCB7, while HDOCK was leveraged for conducting a docking analysis of the TaPHR2-TaABCB7 interaction. The pTM+ipTM value, as computed by AlphaFold3 for both proteins and nucleic acids, amounted to 0.54, falling below the threshold of 0.75. Upon inspecting the AlphaFold3 model, it became evident that extensive flexible zones are present within both protein and nucleic acid components, accounting for the resultant low ipTM value. The docking score from HDOCK revealed an optimal conformation with a binding energy of -328.16 kcal/mol (surpassing the threshold of -200 kcal/mol) and a confidence score exceeding 0.7, indicating that a strong binding ability between TaPHR2 and the promoter of TaABCB7. Subsequently, the optimal conformation was visualized using Pymol software to analysis the binding interface between the TaPHR2 and the promoter of TaABCB7. At this interface, hydrogen bonding interactions were identified between the 222nd guanine deoxyribonucleotide (dG) of the TaABCB7 promoter and the 297th tyrosine residue (Tyr297) of the TaPHR2, as well as between the 1782nd cytosine deoxyribonucleotide (dC) of the TaABCB7 promoter and the 307th arginine residue (Arg307) of the TaPHR2. These molecular interactions may serve as key determinants in stabilizing the complex structure (Figure 9K).
To further elucidate the transcriptional regulatory relationship between TaABCB7 and TaPHR2, we conducted Dual-Luciferase reporter assays in protoplasts derived from Nicotiana benthamiana leaves (Figure 9L). As expected, TaABCB7 expression was significantly enhanced when cotrasfommed with TaPHR2, which was drastically higher than those of the negative controls (Figure 9M). These results indicate that TaPHR2 as a transcriptional activator of TaABCB7 could modulate phosphate starvation responses in wheat.
3.8. Haplotype Analysis of TaABCB7
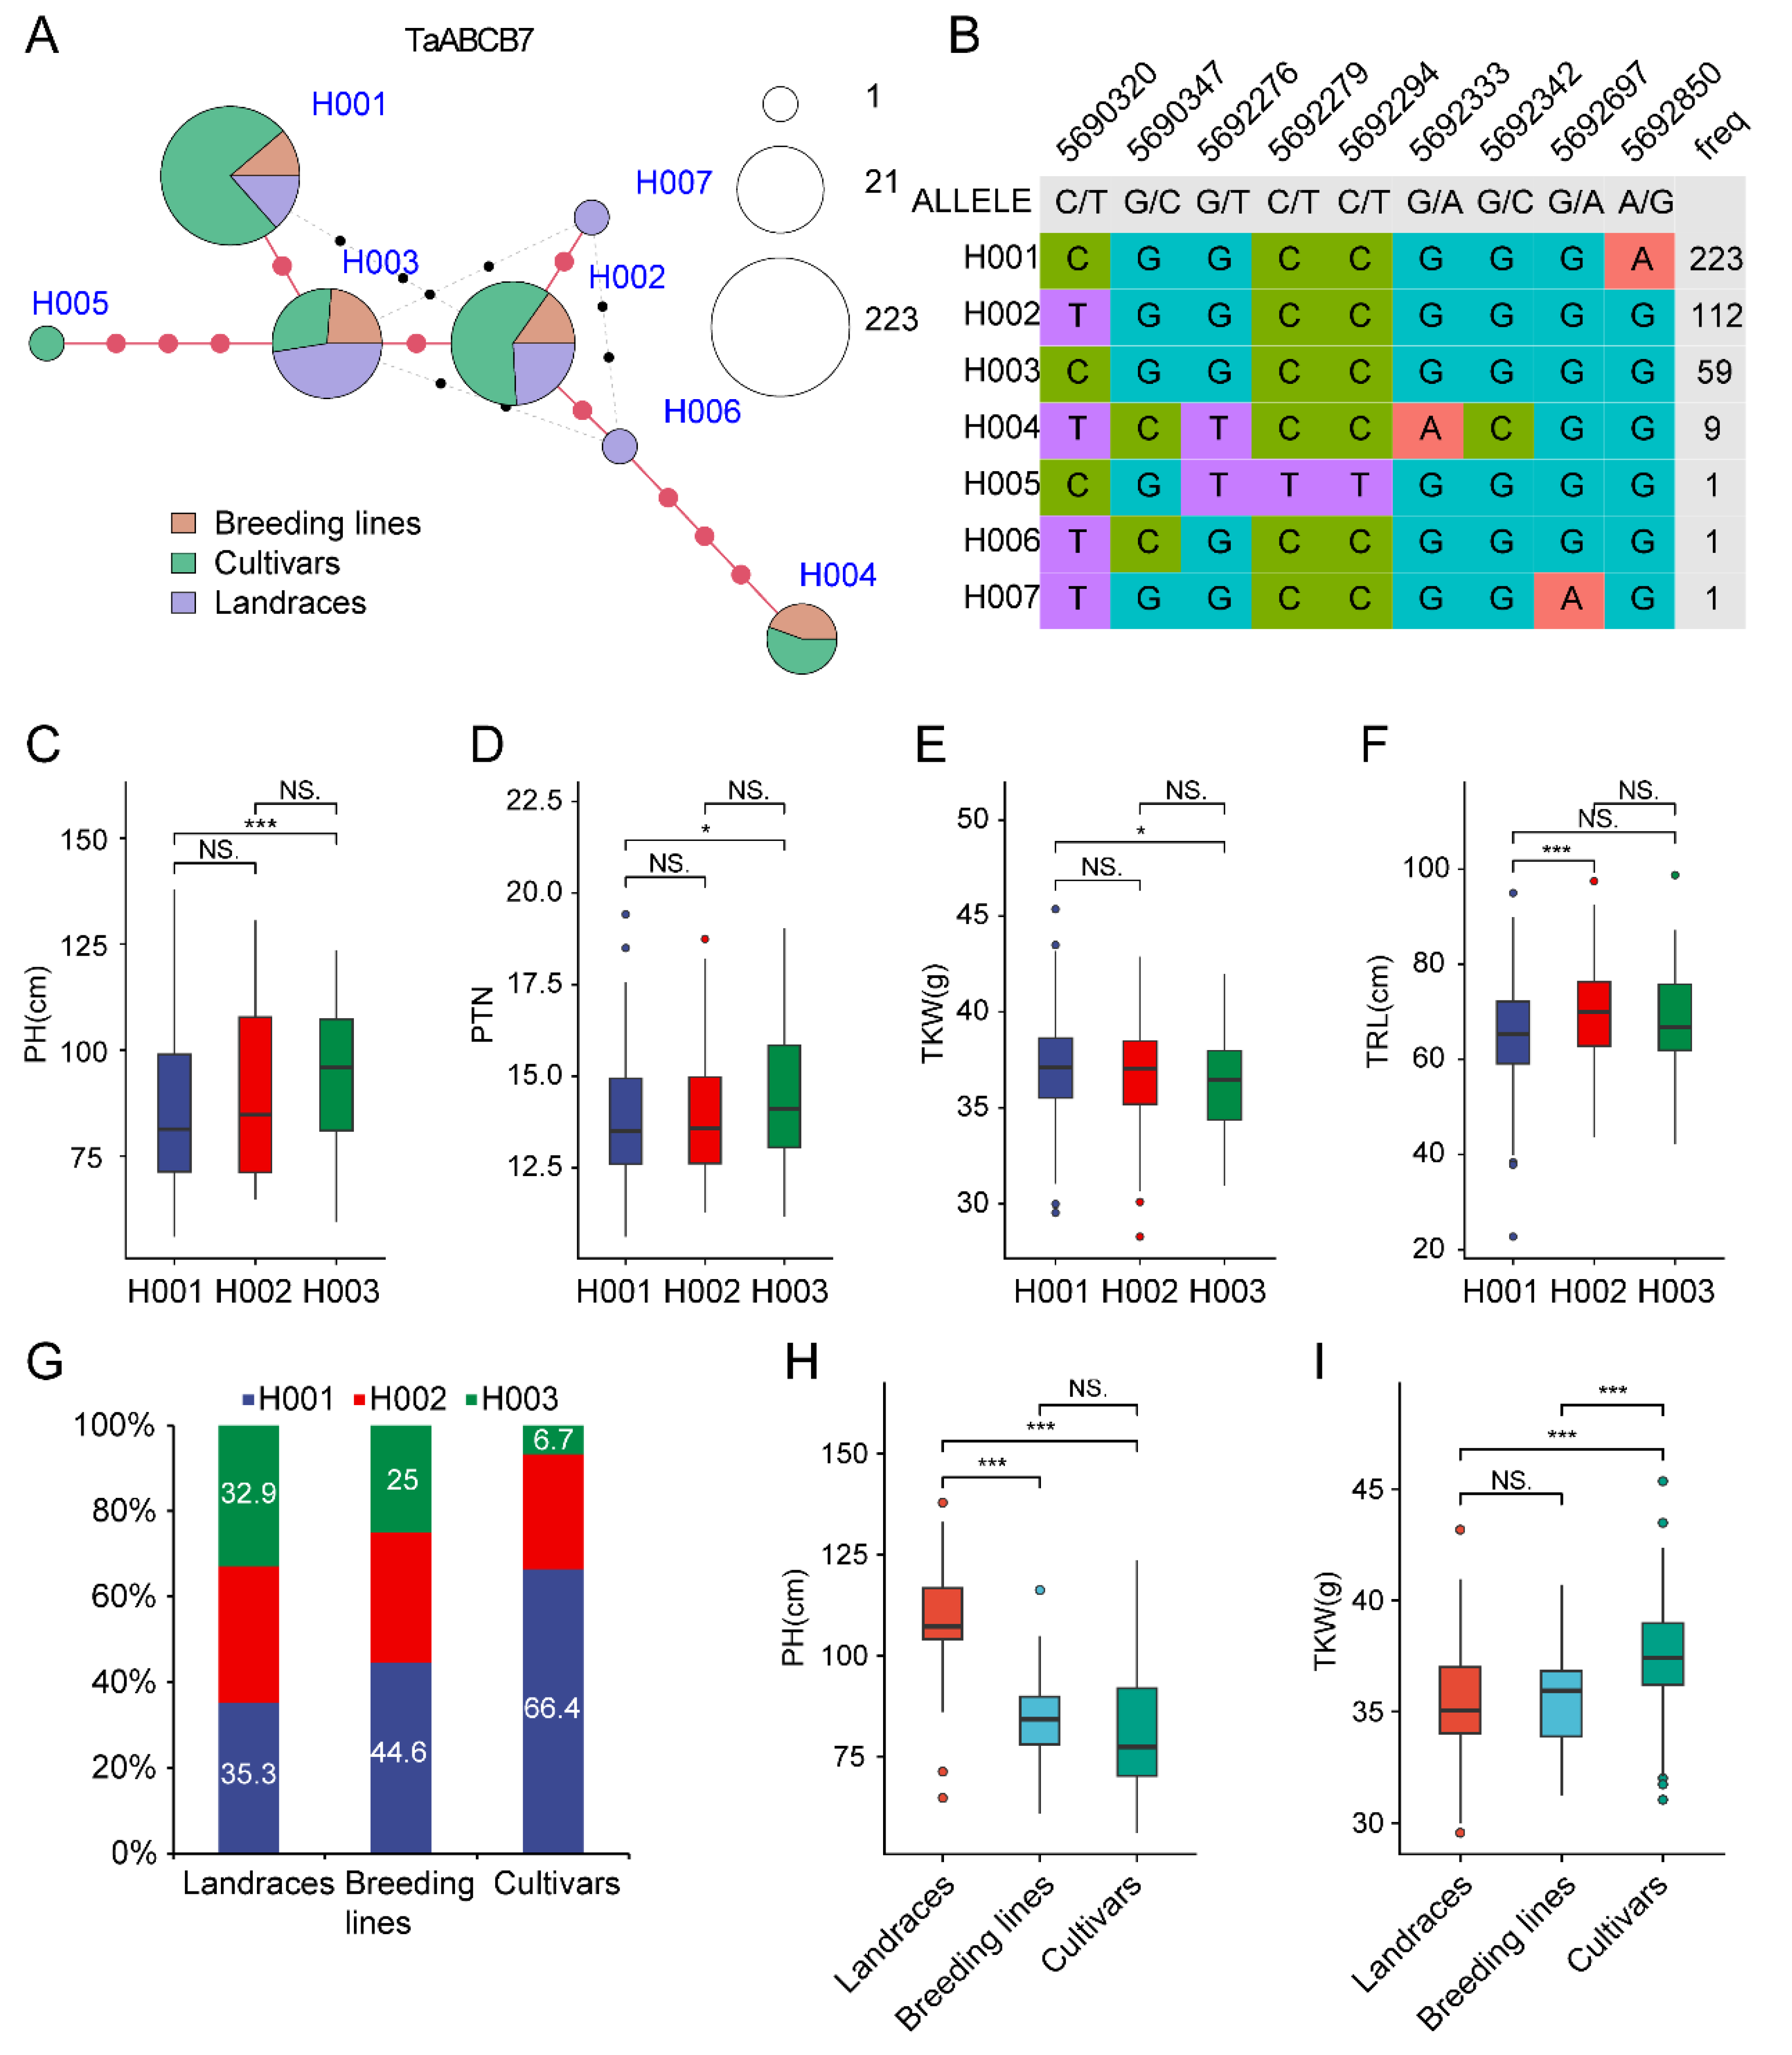
To further understand the selection of TaABCB7 in wheat breeding process,we extracted SNP markers of TaABCB7 gene from 406 wheat germplasms. The results showed that there were 7 haplotypes, with H001 haplotype containing 223 wheat germplasms, H002 haplotype containing 112 wheat germplasms, H003 haplotype containing 59 wheat germplasms, H004 haplotype containing 9 wheat germplasms, and all other haplotypes containing 1 wheat germplasms. There were little genetic differences between H001, H002, and H003 (Figure 10A,B). To meet with the requirements of data statistics, we mainly selected H001, H002, and H003 haplotypes for subsequent analysis, and excluded the remaining haplotypes with few materials. Subsequently, significant analysis was conducted on plant height (PH), productive tiller number (PTN), thousand kernel weight (TKW) and total root length (TRL) among different haplotypes. The results showed that H002 did not exhibit significant differences when compared to H001 or H003, but H001 and H003 shows significant differences in three traits (PH, PTN and TKW). There are significant differences in RL traits between H001 and H002. Wheat varities with H001 show lower plant height, fewer tiller number, higher thousand kernel weight and shorter root length, indicating that H001 is an elite haplotype (Figure 10C–E). Interestingly, we found that the proportion of H001 gradually increased during the breeding improvement process, from 35.3% in local varieties to 66.4% in modern cultivated varieties, while the proportion of H003 gradually decreased, from 32.9% in local varieties to 6.7% in modern cultivated varieties, indicating that the elite haplotype H001 was selected during the breeding improvement process (Figure 10F). Furthermore, we observed that during the improvement process from local varieties to modern cultivated varieties, PH was significantly decreased, while TKW significantly increased (Figure 10H,I).
4. Discussion
The ABCB transporters are important multiple functional proteins mainly involved in material transport and metabolic regulation, and have profound effects on plant developmental processes and environmental adaptation. Therefore, the related research on ABCB transporters is of great significance.
4.1. The Characteristics of TaABCB Members in Wheat
To date, extensive research has identified and characterized numerous ABCB gene family members across multiple plant species, including Arabidopsis thaliana, rice, and maize. There are 29 AtABCB members in Arabidopsis thaliana, of which 22 multidrug resistance (MDR) proteins are full molecular transporters, while the rest are semi molecular transporters, including 3 ABC transporter of the mitochondria (ATM), 3 transporters associated with antigen processing (TAP), and 1 prokaryotic lipid A-like exporters (LLP) [48]. The rice genome contains 27 confirmed members of the OsABCB gene family, and the number of MDR, TAP and LLP is the same as that of Arabidopsis thaliana, with only one ATM. The ABCB subfamily of maize consists of 31 members, including 18 full molecular transporters, 12 half molecular transporters, and 1 member encoding an incomplete NBD (ZmABCB19) [49].
Through genome-wide mining, we identified 99 TaABCB genes in common wheat, representing a notable increase compared to Arabidopsis thaliana, rice, and maize. This gene family expansion is likely attributed to wheat’s hexaploid genome structure, which facilitates both whole-genome duplication-driven proliferation and segmental duplication-mediated amplification of ABCB genes. Subsequently, we further analyzed the physicochemical properties of all identified TaABCB proteins. Subcellular localization showed that the TaABCB family is located on the cell membrane, indicating its important role in signal perception and transmission. We used AtABCB subgroups as a reference [50], TaABCB members were divided into four large evolutionary branches, including 78 MDR type transporters, 6 ATM type transporters, 12 TAP type transporters and 3 LLP type transporters, indicating that genes with the same protein structure tend to cluster together and may exhibit similarities in their functional functions. The different subgroups have different ABCB protein structural types, indicating functional differentiation of the TaABCB members during evolution. The investigation of conserved motifs and gene structures uncovered that members within the same subgroups exhibit similar motif distributions and gene architectures, whereas distinct differences exist between subgroups. These findings align with the constructed evolutionary tree.
Gene duplication events, particularly segmental and tandem duplications, play pivotal roles in gene family expansion and functional diversification. To further investigate the distribution and evolutionary mechanism of the TaABCB members, we conducted chromosome localization and collinearity analysis. Our results revealed an uneven distribution of TaABCB members across 21 wheat chromosomes, with 79 segmental duplication pairs identified but no tandem duplications. Interestingly, we found that these fragment duplication phenomena mainly occur on the same chromosome of the A, B, and D genomes, while only 9 pairs of fragment duplication genes were found between 1A, 1B, 1D and 3A, 3B, 3D. These findings imply that segmental duplication during wheat chromosome polyploidization was the dominant driver of TaABCB family expansion, accompanied by purifying selection. Meanwhile, synteny comparisons with Arabidopsis thaliana, rice, and maize revealed stronger collinearity between wheat and the grass species (rice/maize), supporting their closer phylogenetic relationship.
4.2. The Function and Regulatory Mechanism of TaABCB Members in Wheat
ABCB transporters, a highly conserved protein family in plants, participate in critical physiological pathways, including auxin and brassinosteroid transport, phototaxis, geotropism, organ development, and heavy metal transport in Arabidopsis thaliana. Previous study has reported that a MDR type ABCB transporter, TaMDR1, is upregulated by aluminum toxicity and calcium flux inhibition in wheat [51]. Despite these findings, systematic functional characterizations of other TaABCB subfamily genes in wheat are still rare.
The composition of cis-acting elements within promoter regions is critical for determining gene regulatory networks and functional pathways. Our analysis identified numerous cis-acting elements in TaABCB promoters, with enrichment in motifs linked to plant development, phytohormone responses, light perception, and stress tolerance. These findings imply that TaABCB members may be regulated by different pathways, thereby involved in different pathways. For example, AtABCB21 can modulate auxin distribution in Arabidopsis thaliana and play an important role in auxin transport [19], while AtABCB19 overexpression alters hypocotyl elongation under red/blue light [52] and promotes the development of adventitious roots [53,54]. Additionally, AtABCB4 can affect the development of lateral roots and root hair formation [55], and OsABCB6 is induced under salt stress conditions [56]. Promoter analysis identified the presence of MYB-binding cis-elements in the regulatory regions of TaABCB genes, and MYB transcription factor, AtPHR1 or OsPHR2, is the core regulatory factors that regulate Pi starvation induction (PSI) gene. Therefore, we intend to explore the potential roles of TaABCB members in phosphate starvation response by RNA-seq analysis. Using phosphorus starvation transcriptome data and TaABCB gene family colocalization, 6 candidate differentially expressed genes were identified. STRING-based protein interaction predictions revealed protein-protein interactions among them, corroborating similar observations reported by McFarlane et al. [57]. The TaABCB7 gene showed the most significant differential expression under phosphorus starvation conditions, indicating that it is a key candidate gene in participating in phosphorus starvation response. AlphaFold3 analysis showed that TaPHR2 can bind to the promoter region of TaABCB7, and Dual-Luciferase reporter assays revealed that TaPHR2 could promote the expression of TaABCB7. These results indicate that TaPHR2 likely functions as a transcriptional activator of TaABCB7, plays a key role in the adaptation to low phosphorus availability by potentially modifying nutrient transport mechanisms.
4.3. The Haplotype of TaABCB7 in Wheat
As a globally vital food crop, wheat significantly contributes to global food security through enhanced productivity [58,59,60]. Identifying the elite haplotype of TaABCB7 could improve the genetic improvement efficiency. Haplotype analysis revealed that the high allele frequency elite haplotype H001 with the characteristics of lower plant height, fewer effective tiller numbers, higher thousand kernel weight and shorter root length, was subjected to natural selection and utilized during the breeding and improvement process. The proportion of H003 gradually diminishes during the transition from local planting practices to modern breeding techniques. There is a notable decrease in plant height accompanied by a significant increase in TKW. This indicated that breeders prioritize selecting varieties with lower plant height and higher thousand grain weight, and the decrease in effective tiller number of the haplotype H001 may be due to an antagonistic relationship between this trait and the thousand grain weight trait. Although the elite haplotype H001 has been utilized by breeders in the improvement process, further enhancement of its application in future breeding is still necessary. At the same time, attention should be paid to the aggregation of this superior haplotype with other favorable traits, in order to construct ideal plant types and increase yield.
5. Conclusions
Overall, we carried out an integrative genome-wide analysis of the wheat TaABCB gene family, covering investigations into fundamental gene properties, evolutionary relationships, exon-intron architectures, conserved functional domains, chromosomal distribution, gene duplication events, collinearity patterns, and cis-acting regulatory elements within promoter regions. By analyzing the transcriptome of wheat roots under phosphorus-sufficient (PS) and phosphorus-deficient (PD) conditions, we investigated the response mechanism of TaABCB members to phosphorus deficiency stress. Using RT-qPCR and AlphaFold3 analysis, we identified a key candidate gene, TaABCB7, and discovered that the core transcriptional regulator TaPHR2 could directly bind to the TaABCB7 promoter to regulate its expression, thereby influencing the wheat’s adaptive response to phosphorus deficiency conditions. Furthermore, we also characterized an elite haplotype of the candidate gene TaABCB7 and investigated its evolutionary selection during breeding. These findings advance our knowledge of TaABCB gene family functions and mechanisms, and may lead to valuable insights into phosphorus efficiency utilizing in wheat.
Supplementary Materials
The following supporting information can be downloaded at the website of this paper posted on Preprints.org, Figure S1: GO enrichment analysis of DEGs. Table S1: AtABCB and OsABCB transporters. Table S2: Physicochemical properties of TaABCB members. Table S3: KaKs analysis of TaABCB members. Table S4: Transcriptome sequencing data. Table S5: Prediction of protein interactions. Table S6: Primer sequences used in this study.
Author Contributions
G.C.: Funding acquisition, Methodology, Investigation, Writing—original draft. H.W.: Methodology, Investigation. Y.W.: Visualization. X.L.: Methodology. M.L.: Methodology. H.Q.: Investigation. R.H.: Data curation. J.L., Z.M. and Y.B.: Data curation, Validation, Supervision, Writing—review and editing. All authors have read and agreed to the published version of the manuscript.
Funding
This work was funded by the Outstanding Doctoral program of Shanxi Agricultural University (2023BQ94), Youth Fund of Basic Scientific Research of Shanxi Province (202403021222089), National Key Research and Development Program of China (2024YFD1200101), and Scientific Research Projects of Doctoral Graduates and Postdoctoral Researchers in Shanxi Province (SXBYKY2024039).
Institutional Review Board Statement
Not applicable.
Informed Consent Statement
Not applicable.
Data Availability Statement
Data are contained within the article. The datasets presented in this study can be found in online repositories. The names of the repository/repositories and accession number(s) can be found below: https://submit.ncbi.nlm.nih.gov/subs/sra/, PRJNA1314374.
Conflicts of Interest
The author declares no conflicts of interest.
References
- Hwang, J.U.; Song, W.; Hong, D.; Ko, D.; Yamaoka, Y.; Jang, S.; Yim, S.; Lee, E.; Khare, D.; Kim, K.; et al. Plant ABC transporters enable many unique aspects of a terrestrial plant’s lifestyle. Mol. Plant 2016, 9, 338–355. [Google Scholar] [CrossRef] [PubMed]
- George, A.M. ABC transporters 45 years on. Int. J. Mol. Sci. 2023, 24, 16789. [Google Scholar] [CrossRef] [PubMed]
- Banasiak, J.; Jasinski, M. ATP-binding cassette transporters in nonmodel plants. New Phytol. 2022, 233, 1597–1612. [Google Scholar] [CrossRef]
- Lopez-Ortiz, C.; Dutta, S.K.; Natarajan, P.; Peña-Garcia, Y.; Abburi, V.; Saminathan, T.; Nimmakayala, P.; Reddy, U.K. Genome-wide identification and gene expression pattern of ABC transporter gene family in spp. PloS One 2019, 14, e0215901. [Google Scholar] [CrossRef]
- Do, T.H.T.; Martinoia, E.; Lee, Y.; Hwang, J.U. 2021 update on ATP-binding cassette (ABC) transporters: how they meet the needs of plants. Plant Physiol. 2021, 187, 1876–1892. [Google Scholar] [CrossRef]
- Gräfe, K.; Schmitt, L. The ABC transporter G subfamily in Arabidopsis thaliana. J. Exp. Bot. 2021, 72, 92–106. [Google Scholar] [CrossRef]
- Do, T.H.T.; Martinoia, E.; Lee, Y. Functions of ABC transporters in plant growth and development. Curr. Opin. Plant Biol. 2018, 41, 32–38. [Google Scholar] [CrossRef]
- Dahuja, A.; Kumar, R.R.; Sakhare, A.; Watts, A.; Singh, B.; Goswami, S.; Sachdev, A.; Praveen, S. Role of ATP-binding cassette transporters in maintaining plant homeostasis under abiotic and biotic stresses. Physiol. Plant 2021, 171, 785–801. [Google Scholar] [CrossRef] [PubMed]
- Lane, T.S.; Rempe, C.S.; Davitt, J.; Staton, M.E.; Peng, Y.H.; Soltis, D.E.; Melkonian, M.; Deyholos, M.; Leebens-Mack, J.H.; Chase, M.; et al. Diversity of ABC transporter genes across the plant kingdom and their potential utility in biotechnology. BMC Biotechnol. 2016, 16, 47. [Google Scholar] [CrossRef]
- Cho, M.; Cho, H.T. The function of ABCB transporters in auxin transport. Plant Signal Behav. 2013, 8, e22990. [Google Scholar] [CrossRef] [PubMed]
- Wang, B.; Bailly, A.; Zwiewka, M.; Henrichs, S.; Azzarello, E.; Mancuso, S.; Maeshima, M.; Friml, J.; Schulz, A.; Geisler, M. Arabidopsis TWISTED DWARF1 functionally interacts with auxin exporter ABCB1 on the root plasma membrane. Plant Cell 2013, 25, 202–214. [Google Scholar] [CrossRef]
- Cecchetti, V.; Brunetti, P.; Napoli, N.; Fattorini, L.; Altamura, M.M.; Costantino, P.; Cardarelli, M. ABCB1 and ABCB19 auxin transporters have synergistic effects on early and late Arabidopsis anther development. J. Integr. Plant Biol. 2015, 57, 1089–1098. [Google Scholar] [CrossRef]
- Henrichs, S.; Wang, B.J.; Fukao, Y.; Zhu, J.S.; Charrier, L.; Bailly, A; Oehring, S.C.; Linnert, M.; Weiwad, M.; Endler, A.; et al. Regulation of ABCB1/PGP1-catalysed auxin transport by linker phosphorylation. EMBO J. 2012, 31, 2965–2980.
- Noh, B.; Murphy, A.S.; Spalding, E.P. Multidrug resistance-like genes of Arabidopsis required for auxin transport and auxin-mediated development. Plant Cell 2001, 13, 2441–2454. [Google Scholar] [PubMed]
- Noh, B.; Bandyopadhyay, A.; Peer, W.A.; Spalding, E.P.; Murphy, A.S. Enhanced gravi- and phototropism in plant mdr mutants mislocalizing the auxin efflux protein PIN1. Nature 2003, 423, 999–1002. [Google Scholar] [CrossRef]
- Lin, R.C.; Wang, H.Y. Two homologous ATP-binding cassette transporter proteins, AtMDR1 and AtPGP1, regulate Arabidopsis photomorphogenesis and root development by mediating polar auxin transport. Plant Physiol. 2005, 138, 949–964. [Google Scholar] [CrossRef]
- Ying, W.; Wang, Y.W.; Wei, H.; Luo, Y.M.; Ma, Q.; Zhu, H.Y.; Janssens, H.; Vukašinović, N.; Kvasnica, M.; Winne, J.M.; et al. Structure and function of the Arabidopsis ABC transporter ABCB19 in brassinosteroid export. Science 2024, 383, eadj4591. [Google Scholar] [CrossRef]
- Kamimoto, Y.; Terasaka, K.; Hamamoto, M.; Takanashi, K.; Fukuda, S.; Shitan, N.; Sugiyama, A; Suzuki, H.; Shibata, D.; Wang, B.J.; et al. Arabidopsis ABCB21 is a facultative auxin importer/exporter regulated by cytoplasmic auxin concentration. Plant Cell Physiol. 2012, 53, 2090–2100. [Google Scholar] [CrossRef]
- Jenness, M.K.; Carraro, N.; Pritchard, C.A.; Murphy, A.S. The Arabidopsis ATP-binding cassette transporter ABCB21 regulates auxin levels in cotyledons, the root pericycle, and leaves. Front. Plant Sci. 2019, 10, 806. [Google Scholar] [CrossRef]
- Kubes, M.; Yang, H.B.; Richter, G.L.; Cheng, Y.; Mlodzinska, E.; Wang, X.; Blakeslee, J.J.; Carraro, N.; Petrásek, J.; Zazímalová, E.; et al. The Arabidopsis concentration-dependent influx/efflux transporter ABCB4 regulates cellular auxin levels in the root epidermis. Plant J. 2012, 69, 640–654. [Google Scholar] [CrossRef] [PubMed]
- Cho, M.; Lee, S.H.; Cho, H.T. P-glycoprotein4 displays auxin efflux transporter-like action in Arabidopsis root hair cells and tobacco cells. Plant Cell 2007, 19, 3930–3943. [Google Scholar] [CrossRef]
- Lee, M.; Choi, Y.; Burla, B.; Kim, Y.Y.; Jeon, B.; Maeshima, M.; Yoo, J.Y.; Martinoia, E.; Lee, Y. The ABC transporter AtABCB14 is a malate importer and modulates stomatal response to CO2. Nat. Cell Biol. 2008, 10, 1217–1223. [Google Scholar] [CrossRef]
- Xu, Y.X.; Zhang, S.N.; Guo, H.P.; Wang, S.K.; Xu, L.G.; Li, C.Y.; Qian, Q.; Chen, F.; Geisler, M.; Qi, Y.; et al. OsABCB14 functions in auxin transport and iron homeostasis in rice (Oryza sativa L.). Plant J. 2014, 79, 106–117. [Google Scholar] [CrossRef] [PubMed]
- Ichikawa, Y.; Bayeva, M.; Ghanefar, M.; Potini, V.; Sun, L.; Mutharasan, R.K.; Wu, R.; Khechaduri, A.; Jairaj Naik, T.; Ardehali, H. Disruption of ATP-binding cassette B8 in mice leads to cardiomyopathy through a decrease in mitochondrial iron export. Proc, Natl, Acad, Sci, U, S, A. 2012, 109, 4152–4157. [Google Scholar] [CrossRef]
- Schaedler, T.A.; Thornton, J.D.; Kruse, I.; Schwarzländer, M.; Meyer, A.J.; Van Veen, H.W.; Balk, J. A conserved mitochondrial ATP-binding cassette transporter exports glutathione polysulfide for cytosolic metal cofactor assembly. J. Biol. Chem. 2014, 289, 23264–23274. [Google Scholar] [CrossRef]
- Kim, D.Y.; Bovet, L.; Kushnir, S.; Noh, E.W.; Martinoia, E.; Lee, Y. AtATM3 is involved in heavy metal resistance in Arabidopsis. Plant Physiol. 2006, 140, 922–932. [Google Scholar] [CrossRef]
- Liu, W.X.; Feng, X.; Cao, F.B.; Wu, D.Z.; Zhang, G.P.; Vincze, E.; Wang, Y.Z.; Chen, Z.H.; Wu, F.B. An ATP binding cassette transporter HvABCB25 confers aluminum detoxification in wild barley. J. Hazard Mater 2021, 401, 123371. [Google Scholar] [CrossRef]
- Larsen, P.B.; Cancel, J.; Rounds, M.; Ochoa, V. Arabidopsis ALS1 encodes a root tip and stele localized half type ABC transporter required for root growth in an aluminum toxic environment. Planta 2007, 225, 1447–1458. [Google Scholar] [CrossRef]
- Huang, C.F.; Yamaji, N.; Mitani, N.; Yano, M.; Nagamura, Y.; Ma, J.F. A bacterial-type ABC transporter is involved in aluminum tolerance in rice. Plant Cell 2009, 21, 655–667. [Google Scholar] [CrossRef] [PubMed]
- Zhu, X.F.; Lei, G.J.; Wang, Z.W.; Shi, Y.Z.; Braam, J.; Li, G.X.; Zheng, S.J. Coordination between apoplastic and symplastic detoxification confers plant aluminum resistance. Plant Physiol. 2013, 162, 1947–1955. [Google Scholar] [CrossRef] [PubMed]
- Chen, C.J.; Chen, H.; Zhang, Y.; Thomas, H.R.; Frank, M.H.; He, Y.H.; Xia, R. TBtools: an integrative toolkit developed for interactive analyses of big biological data. Mol. Plant 2020, 13, 1194–1202. [Google Scholar] [CrossRef]
- Potter, S.C.; Luciani, A.; Eddy, S.R.; Park, Y.; Lopez, R.; Finn, R.D. HMMER web server: 2018 update. Nucleic Acids Res. 2018, 46, 200–204. [Google Scholar] [CrossRef]
- Wang, J.Y.; Chitsaz, F.; Derbyshire, M.K.; Gonzales, N.R.; Gwadz, M.; Lu, S.N.; Marchler, G.H.; Song, J.S.; Thanki, N.; Yamashita, R.A.; et al. The conserved domain database in 2023. Nucleic Acids Res. 2023, 51, 384–388. [Google Scholar] [CrossRef]
- Lu, S.N.; Wang, J.Y.; Chitsaz, F.; Derbyshire, M.K.; Geer, R.C.; Gonzales, N.R.; Gwadz, M.; Hurwitz, D.I.; Marchler, G.H.; Song, J.S.; et al. CDD/SPARCLE: The conserved domain database in 2020. Nucleic Acids Res. 2020, 48, 265–268. [Google Scholar] [CrossRef] [PubMed]
- Marchler-Bauer, A.; Bo, Y.; Han, L.Y.; He, J.E.; Lanczycki, C.J.; Lu, S.N.; Chitsaz, F.; Derbyshire, M.K.; Geer, R.C.; Gonzales, N.R.; et al. CDD/SPARCLE: functional classification of proteins via subfamily domain architectures. Nucleic Acids Res. 2017, 45, 200–203. [Google Scholar] [CrossRef]
- Chen, Y.M.; Song, W.J.; Xie, X.M.; Wang, Z.H.; Guan, P.F.; Peng, H.R.; Jiao, Y.N.; Ni, Z.F.; Sun, Q.X.; Guo, W.L. A collineari-ty-incorporating homology inference strategy for connecting emerging assemblies in the triticeae tribe as a pilot practice in the plant pangenomic era. Mol. Plant 2020, 13, 1694–1708. [Google Scholar] [CrossRef] [PubMed]
- Savojardo, C.; Martelli, P.L.; Fariselli, P.; Profiti, G.; Casadio, R. BUSCA: an integrative web server to predict subcellular localization of proteins. Nucleic Acids Res. 2018, 46, 459–466. [Google Scholar] [CrossRef]
- Chou, K.C.; Shen, H. Cell-PLoc: a package of Web servers for predicting subcellular localization of proteins in various organisms. Nat. Protoc. 2008, 3, 153–162. [Google Scholar] [CrossRef] [PubMed]
- Nguyen, V.N.T.; Moon, S.; Jung, K.H. Genome-wide expression analysis of rice ABC transporter family across spatio-temporal samples and in response to abiotic stresses. J. Plant Physiol. 2014, 171, 1276–1288. [Google Scholar] [CrossRef]
- Kumar, S.; Stecher, G.; Suleski, M.; Sanderford, M.; Sharma, S.; Tamura, K. MEGA12: Molecular evolutionary genetic analysis version 12 for adaptive and green computing. Mol. Biol. Evol. 2024, 41, msae263. [Google Scholar] [CrossRef]
- Letunic, I.; Bork, P. Interactive Tree of Life (iTOL) v6: recent updates to the phylogenetic tree display and annotation tool. Nucleic Acids Res. 2024, 52, 78–82. [Google Scholar] [CrossRef]
- Wang, D.P.; Zhang, Y.B.; Zhang, Z.; Zhu, J.; Yu, J. KaKs Calculator 2.0: a toolkit incorporating gamma-series methods and sliding window strategies. Genomics Proteomics Bioinformatics 2010, 8, 77–80. [Google Scholar] [CrossRef]
- Chen, S.F.; Zhou, Y.Q.; Chen, Y.R.; Gu, J. Fastp: An ultra-fast all-in-one FASTQ preprocessor. Bioinformatics 2018, 34, 884–890. [Google Scholar] [CrossRef]
- Kim, D.; Langmead, B.; Salzberg, S.L. HISAT: a fast spliced aligner with low memory requirements. Nat. Methods 2015, 12, 357–360. [Google Scholar] [CrossRef] [PubMed]
- Love, M.I.; Huber, W.; Anders, S. Moderated estimation of fold change and dispersion for RNA-seq data with DESeq2. Genome Biol. 2014, 15, 550. [Google Scholar] [CrossRef] [PubMed]
- Varet, H.; Brillet-Guéguen, L.; Coppée, J.Y.; Dillies, M.A. SARTools: a DESeq2- and EdgeR-based r pipeline for comprehensive differential analysis of RNA-seq data. PLoS One 2016, 11, e0157022. [Google Scholar] [CrossRef]
- Zhao, P.; Liu, Z.H.; Shi, X.; Hou, W.Y.; Cheng, M.Z.; Liu, Y.X.; Simmonds, J.; Ji, W.Q.; Uauy, C.; Xu, S.B.; et al. Modern wheat breeding selection synergistically improves above- and belowground traits. Plant Physiol. 2024, 196, 47–50. [Google Scholar] [CrossRef]
- Sánchez-Fernández, R.; Davies, T.G.; Coleman, J.O.; Rea, P.A. The Arabidopsis thaliana ABC protein superfamily, a complete inventory. J. Biol. Chem. 2001, 276, 30231–30244. [Google Scholar] [CrossRef]
- Pang, K.Y.; Li, Y.J.; Liu, M.H.; Meng, Z.D.; Yu, Y.L. Inventory and general analysis of the ATP-binding cassette (ABC) gene superfamily in maize (Zea mays L.). Gene 2013, 526, 411–428. [Google Scholar] [CrossRef]
- Verrier, P.J.; Bird, D.; Burla, B.; Dassa, E.; Forestier, C.; Geisler, M.; Klein, M.; Kolukisaoglu, U.; Lee, Y.; Martinoia, E.; et al. Plant ABC proteins-a unified nomenclature and updated inventory. Trends Plant Sci. 2008, 13, 151–159. [Google Scholar] [CrossRef] [PubMed]
- Sasaki, T.; Ezaki, B.; Matsumoto, H. A gene encoding multidrug resistance (MDR)-like protein is induced by aluminum and inhibitors of calcium flux in wheat. Plant Cell Physiol. 2002, 43, 177–185. [Google Scholar] [CrossRef]
- Wu, G.S.; Cameron, J.N.; Ljung, K.; Spalding, E.P. A role for ABCB19-mediated polar auxin transport in seedling photomorphogenesis mediated by cryptochrome 1 and phytochrome B. Plant J. 2010, 62, 179–191. [Google Scholar] [CrossRef]
- Zhao, H.T.; Liu, L.; Mo, H.X.; Qian, L.T.; Cao, Y.; Cui, S.J.; Li, X.; Ma, L.G. The ATP-binding cassette transporter ABCB19 regulates postembryonic organ separation in Arabidopsis. PLoS One 2013, 8, e60809. [Google Scholar] [CrossRef] [PubMed]
- Sukumar, P.; Maloney, G.S.; Muday, G.K. Localized induction of the ATP-binding cassette B19 auxin trans-porter enhances adventitious root formation in Arabidopsis. Plant Physiol. 2013, 162, 1392–1405. [Google Scholar] [CrossRef]
- Lewis, D.R.; Miller, N.D.; Splitt, B.L.; Wu, G.S.; Spalding, E.P. Separating the roles of acropetal and basipetal auxin transport on gravitropism with mutations in two Arabidopsis multidrug resistance-like ABC transporter genes. Plant Cell 2007, 19, 1838–1850. [Google Scholar] [CrossRef]
- Saha, J.; Sengupta, A.; Gupta, K.; Gupta, B. Molecular phylogenetic study and expression analysis of ATP-binding cassette transporter gene family in Oryza sativa in response to salt stress. Comput. Biol. Chem. 2015, 54, 18–32. [Google Scholar] [CrossRef]
- McFarlane, H.E.; Shin, J.J.H.; Bird, D.A.; Samuels, A.L. Arabidopsis ABCG transporters, which are required for export of diverse cuticular lipids, dimerize in different combinations. Plant Cell 2010, 22, 3066–3075. [Google Scholar] [CrossRef] [PubMed]
- Velu, G.; Singh, R.P.; Huerta, J.; Guzmán, C. Genetic impact of Rht dwarfing genes on grain micronutrients concentration in wheat. Field Crops Res. 2017, 214, 373–377. [Google Scholar] [CrossRef] [PubMed]
- Goel, S.; Yadav, M.; Singh, K.; Jaat, R.S.; Singh, N.K. Exploring diverse wheat germplasm for novel alleles in HMW-GS for bread quality improvement. J. Food Sci. Technol. 2018, 55, 3257–3262. [Google Scholar] [CrossRef]
- Zaveri, E.; Lobell, D.B. The role of irrigation in changing wheat yields and heat sensitivity in India. Nat Commun. 2019, 10, 4144. [Google Scholar] [CrossRef]
Figure 1.
Phylogenetic analyses were conducted on ABCB proteins from Arabidopsis thaliana, rice (Oryza sativa Japonica), and wheat (Triticum aestivum). The phylogenetic tree was constructed using a maximum likelihood (ML) approach specifically optimized for evolutionary inference. To ensure statistical reliability, the analysis incorporated 1,000 bootstrap replicates. The Jones-Taylor-Thornton (JTT) substitution model was selected due to its appropriateness for the amino acid composition of transmembrane transporters. To address evolutionary rate variation, a uniform rate was enforced across all alignment positions, while gaps and missing data were retained in the dataset to maintain sequence integrity. The tree topology was optimized using the nearest-neighbor-interchange (NNI) heuristic algorithm, with parallel processing (8 threads) employed to improve computational efficiency. The resulting phylogenetic tree was visualized using the interactive iTOL platform, where distinct clade-specific color coding was applied to facilitate cross-species comparative analysis and subgroup identification. Abbreviations: PGP/MDR (P-glycoprotein multidrug resistance); TAP (Transporter associated with antigen processing); HMT/ATM (Heavy metal tolerance/ABC transporters of the mitochondrion); LLP (Prokaryotic lipid A-like exporters, putative).
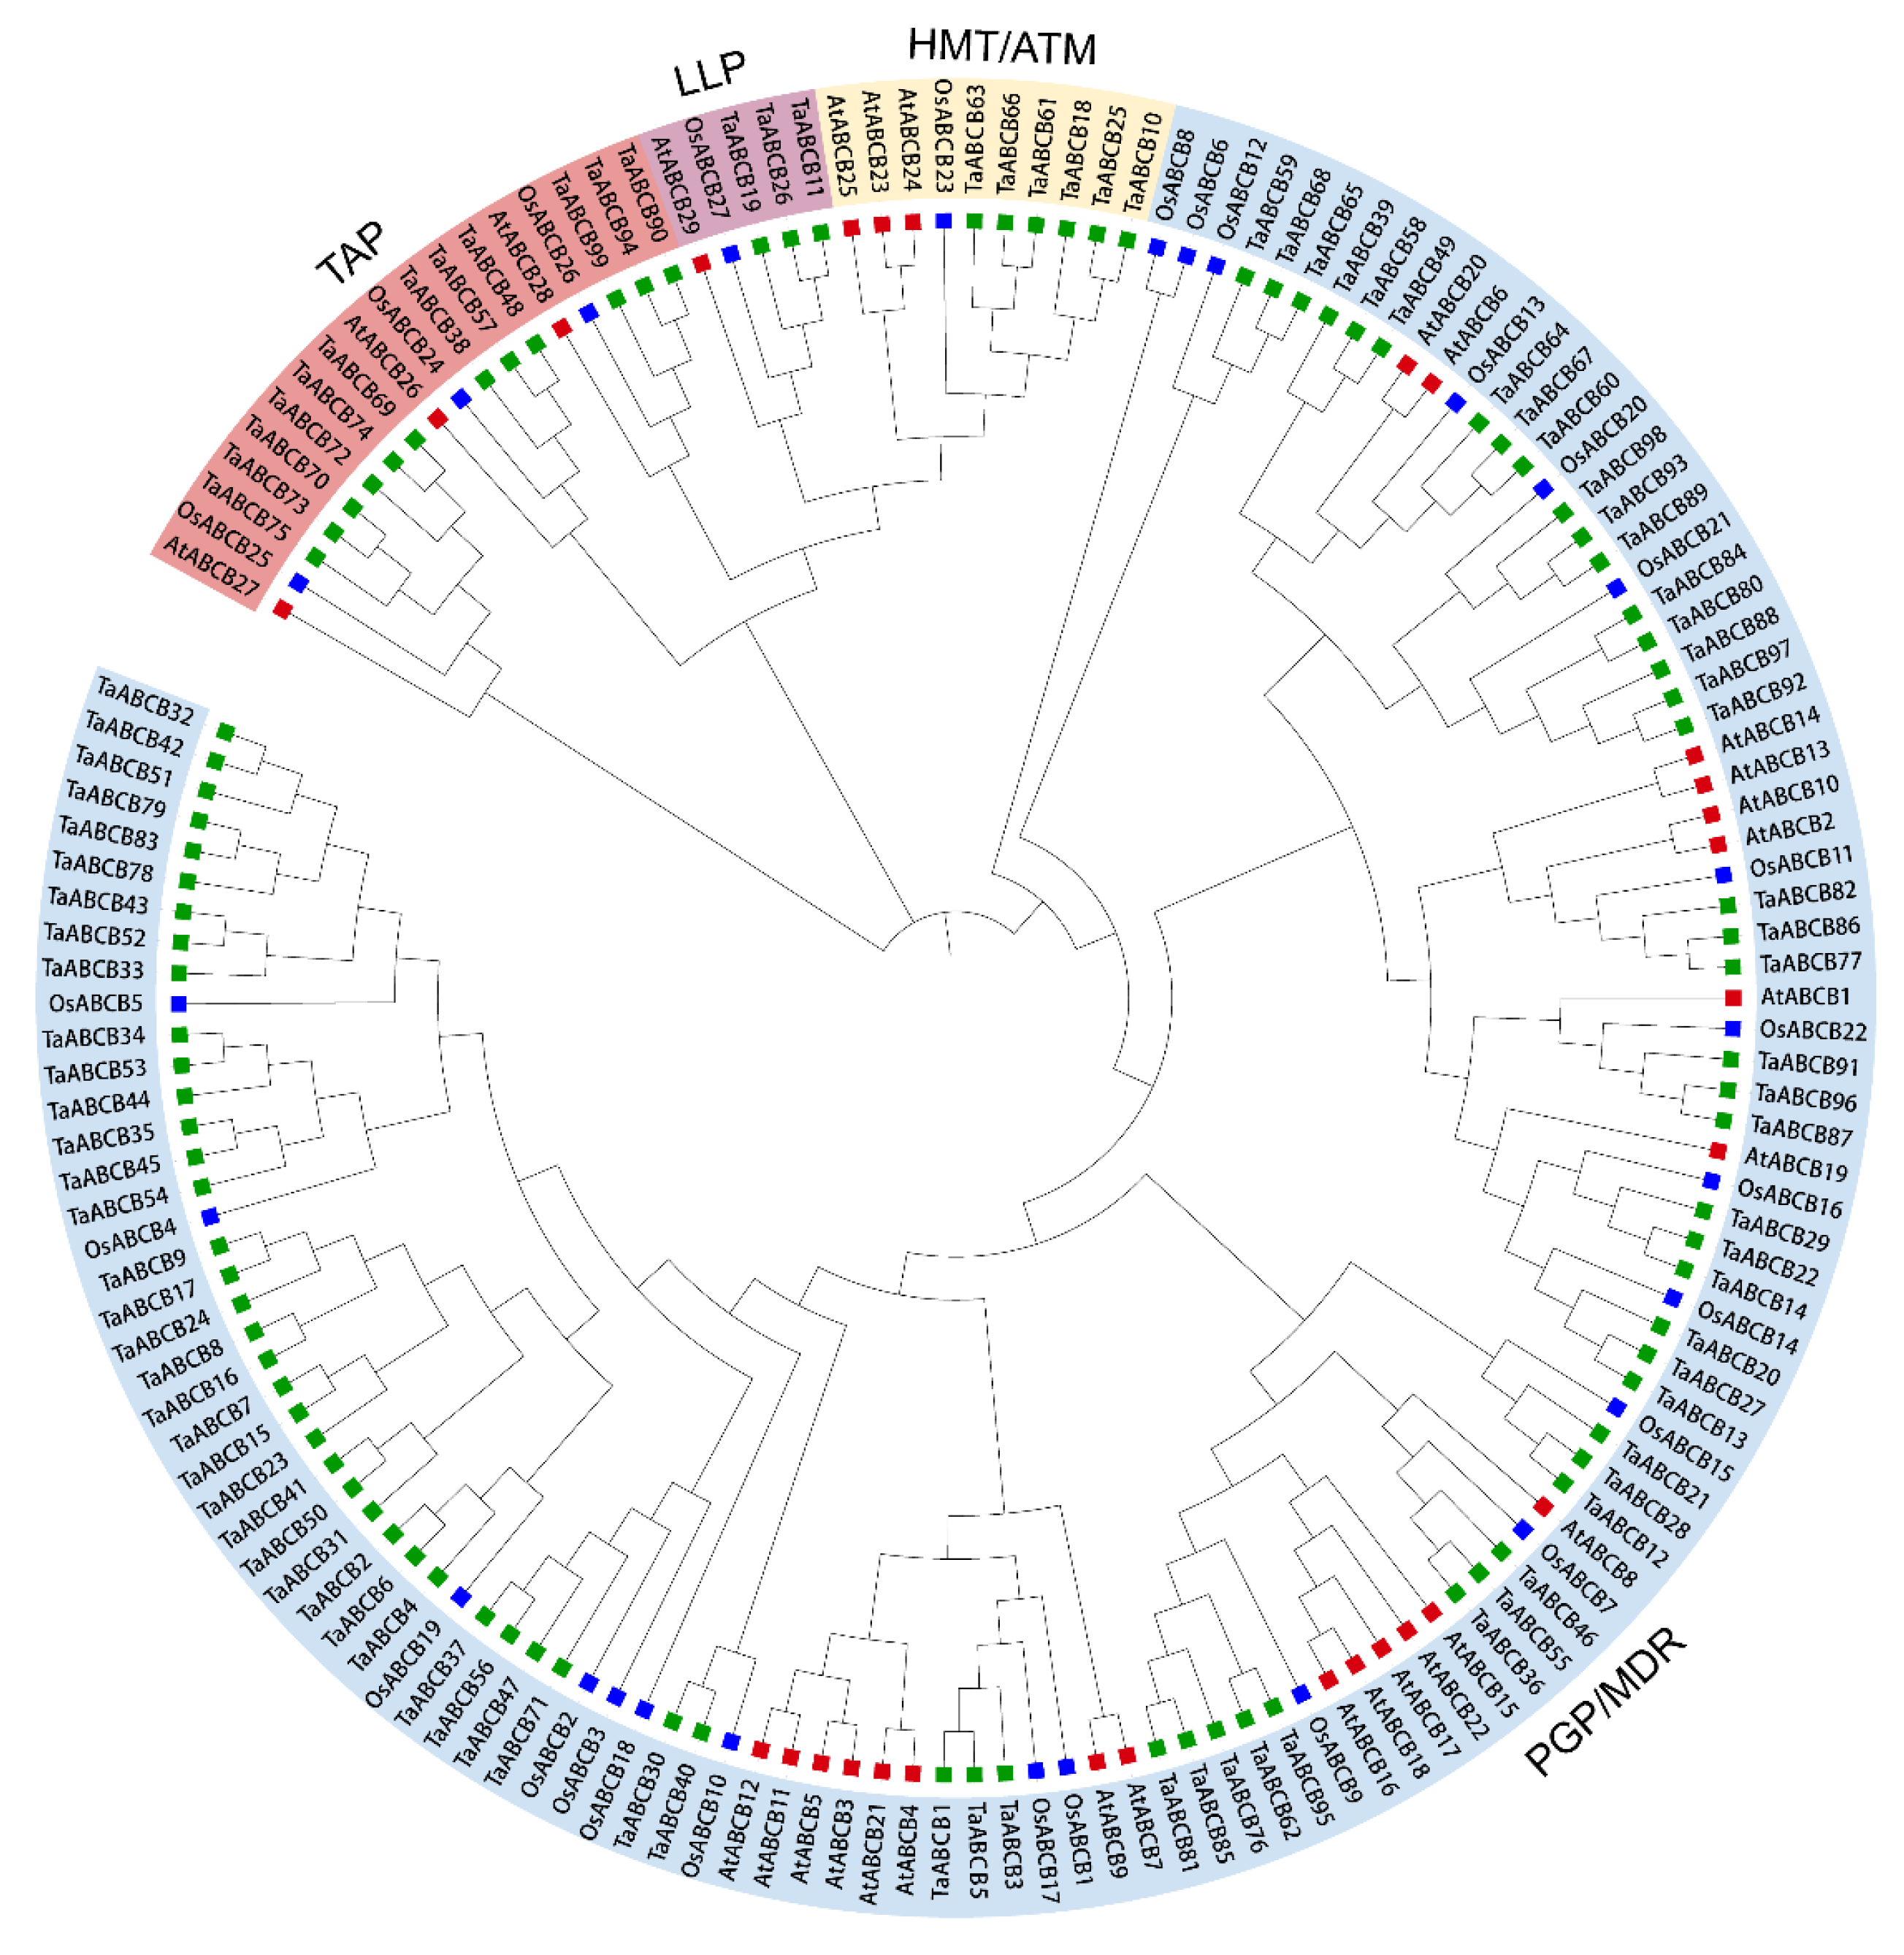
Figure 2.
Conservative motifs logo of TaABCBs members in wheat.
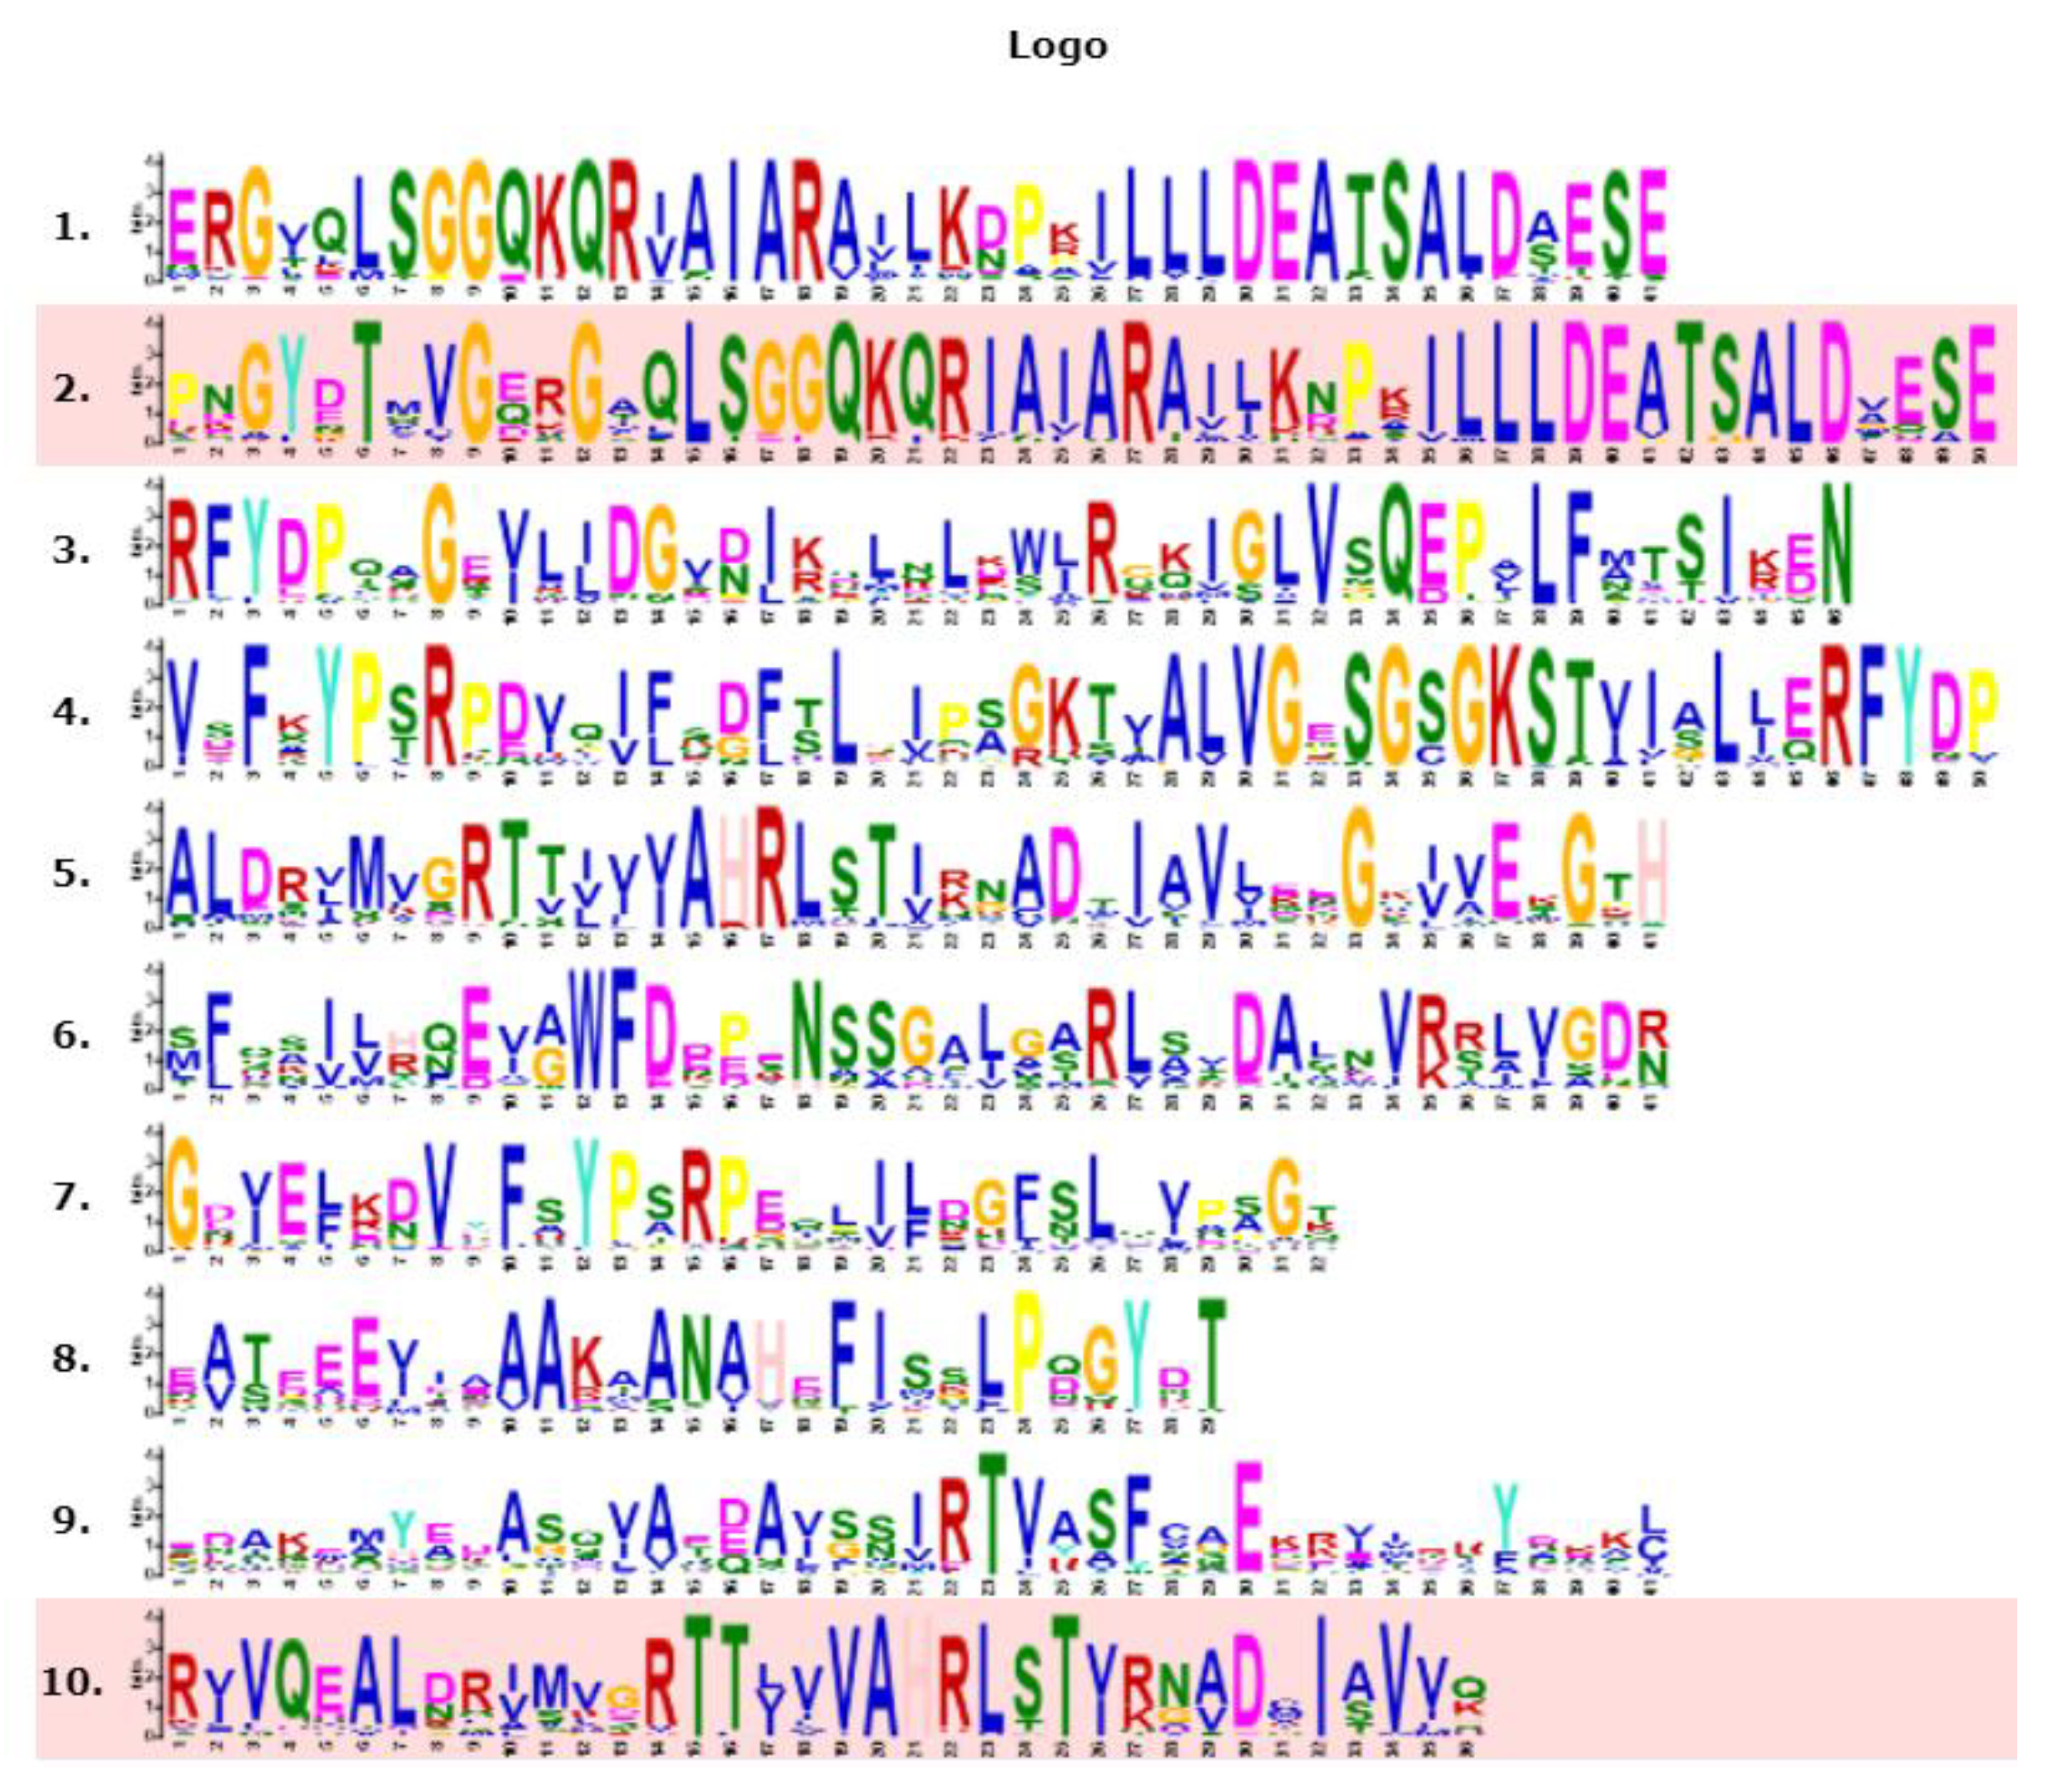
Figure 3.
Phylogenetic tree, conserved motifs, and domains analyses of TaABCBs members in wheat. (A) The phylogenetic tree of the 99 TaABCB members. (B) Conserved motifs distribution of TaABCB members. (C) Domains distribution of TaABCB members.
Figure 3.
Phylogenetic tree, conserved motifs, and domains analyses of TaABCBs members in wheat. (A) The phylogenetic tree of the 99 TaABCB members. (B) Conserved motifs distribution of TaABCB members. (C) Domains distribution of TaABCB members.
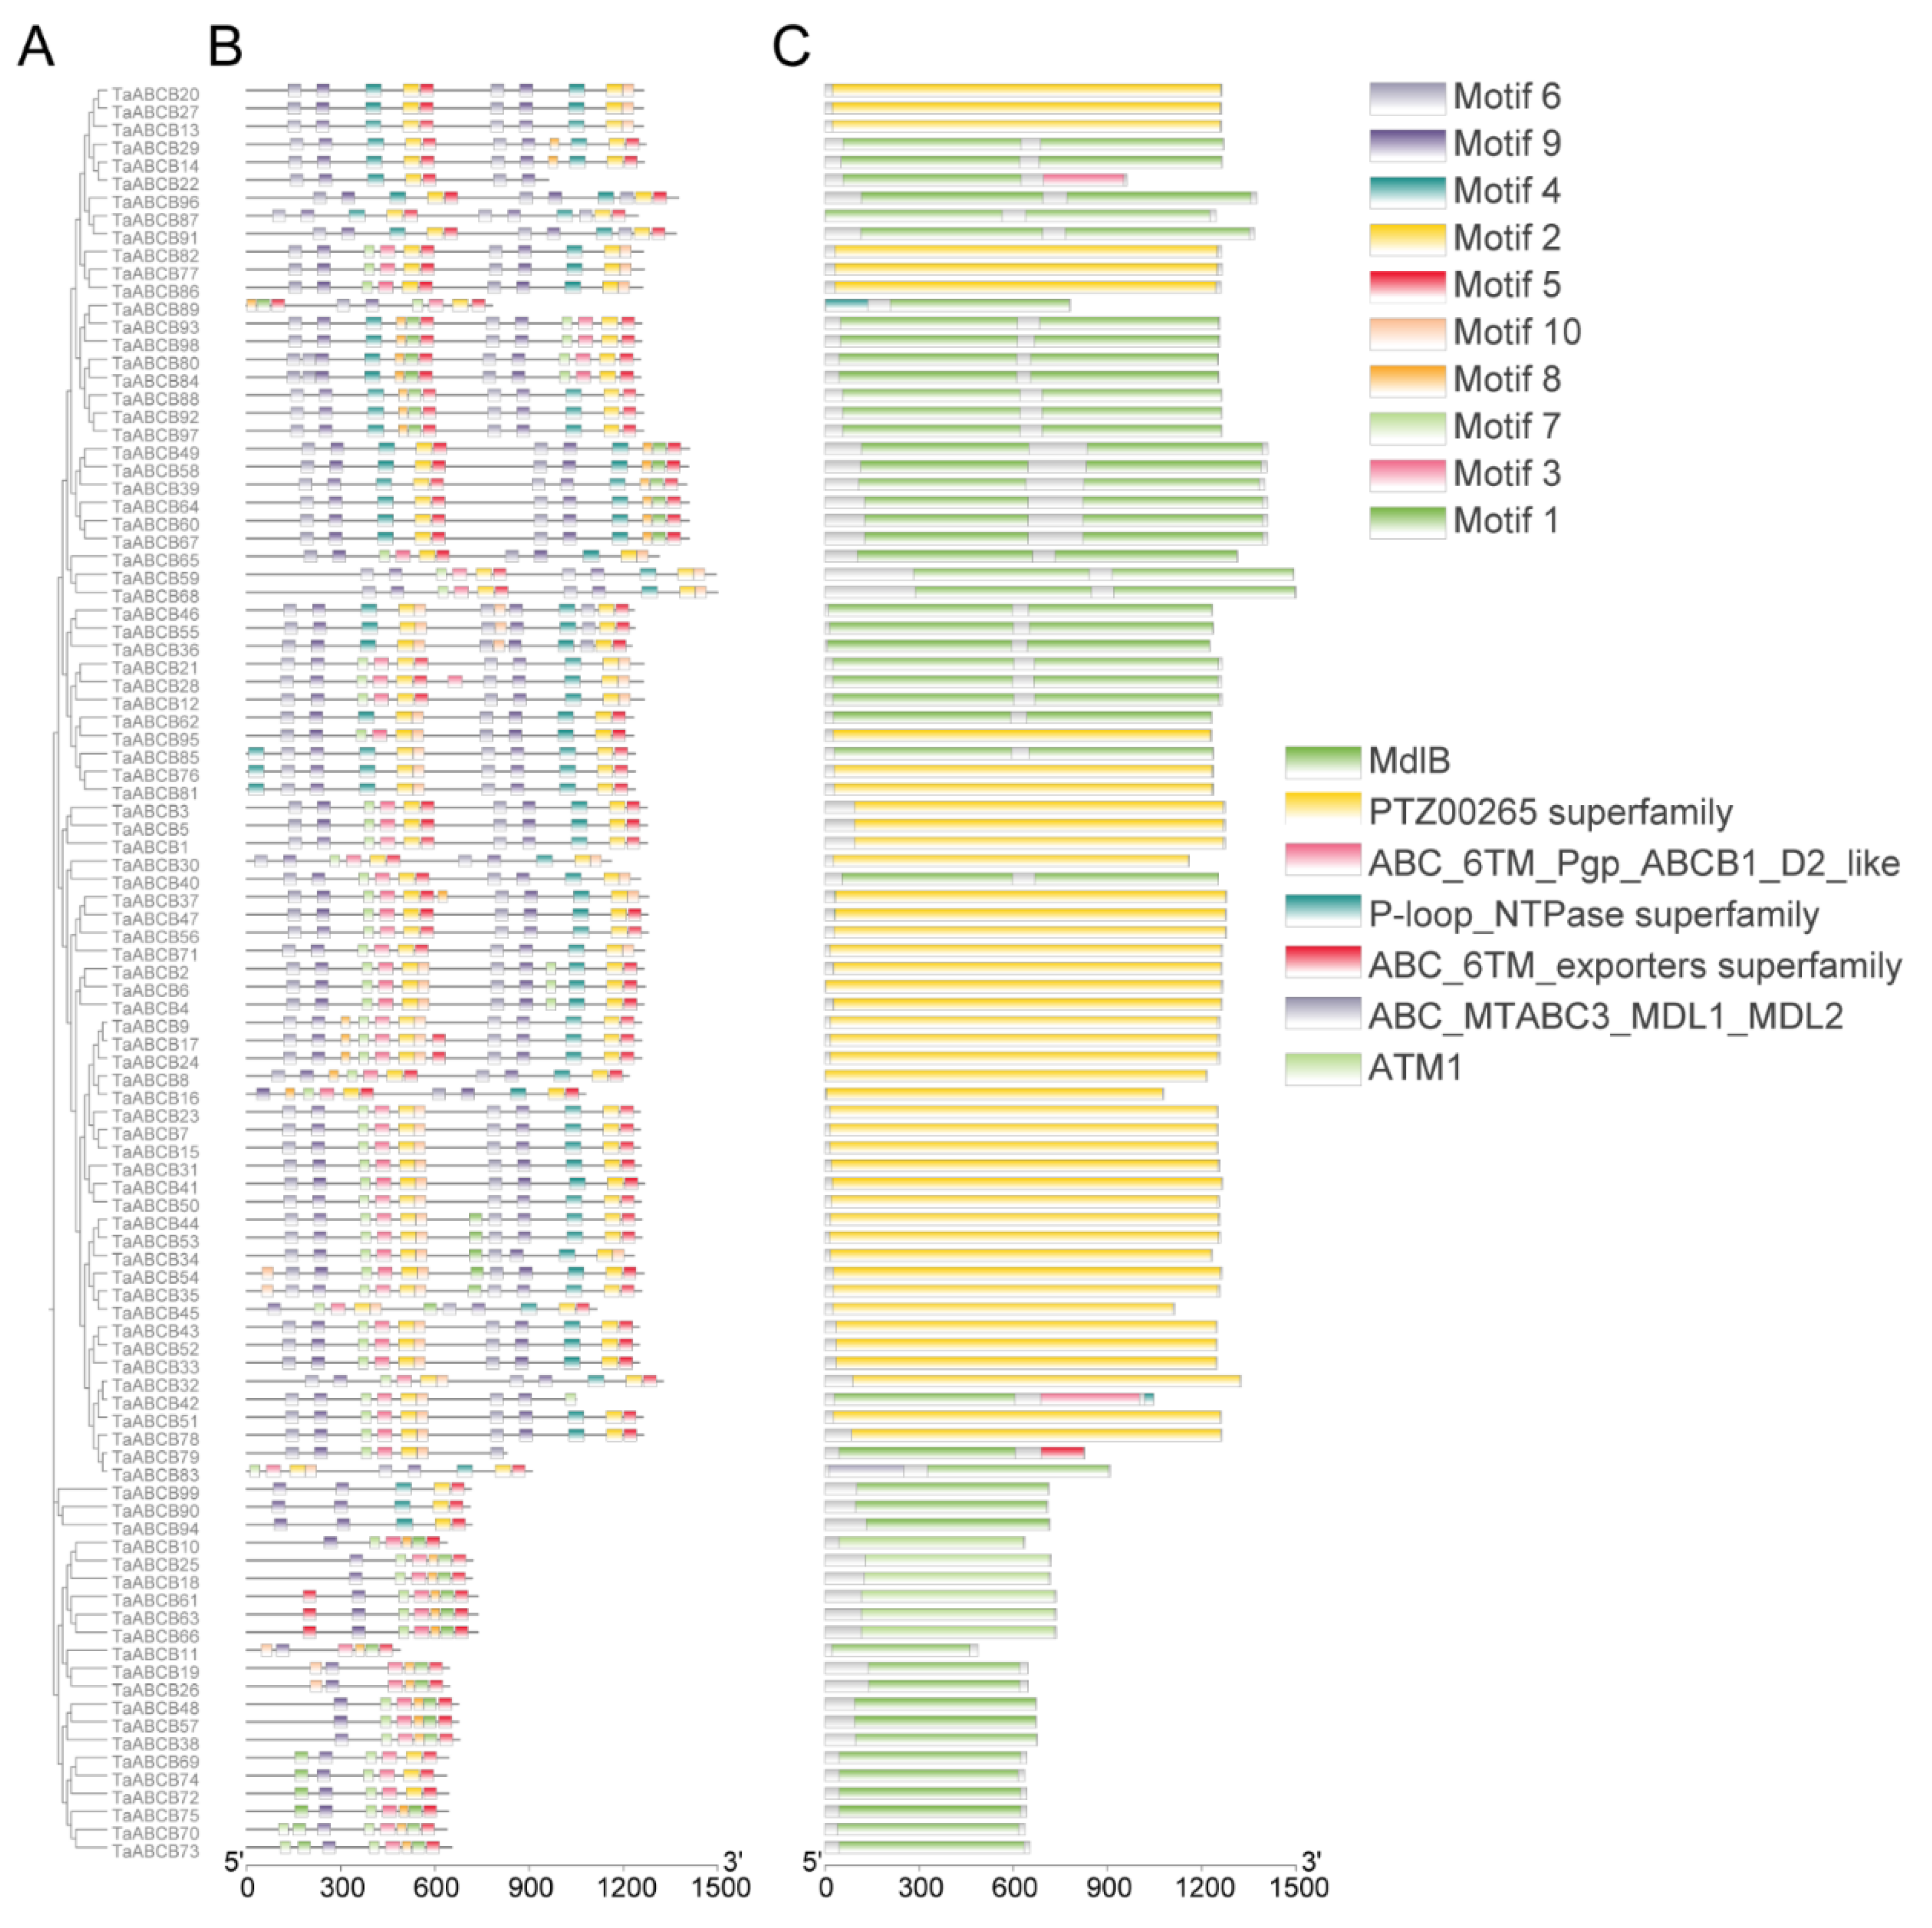
Figure 4.
Distribution of TaABCB genes across wheat chromosomes, with the left-hand scale in megabases (Mb).
Figure 4.
Distribution of TaABCB genes across wheat chromosomes, with the left-hand scale in megabases (Mb).
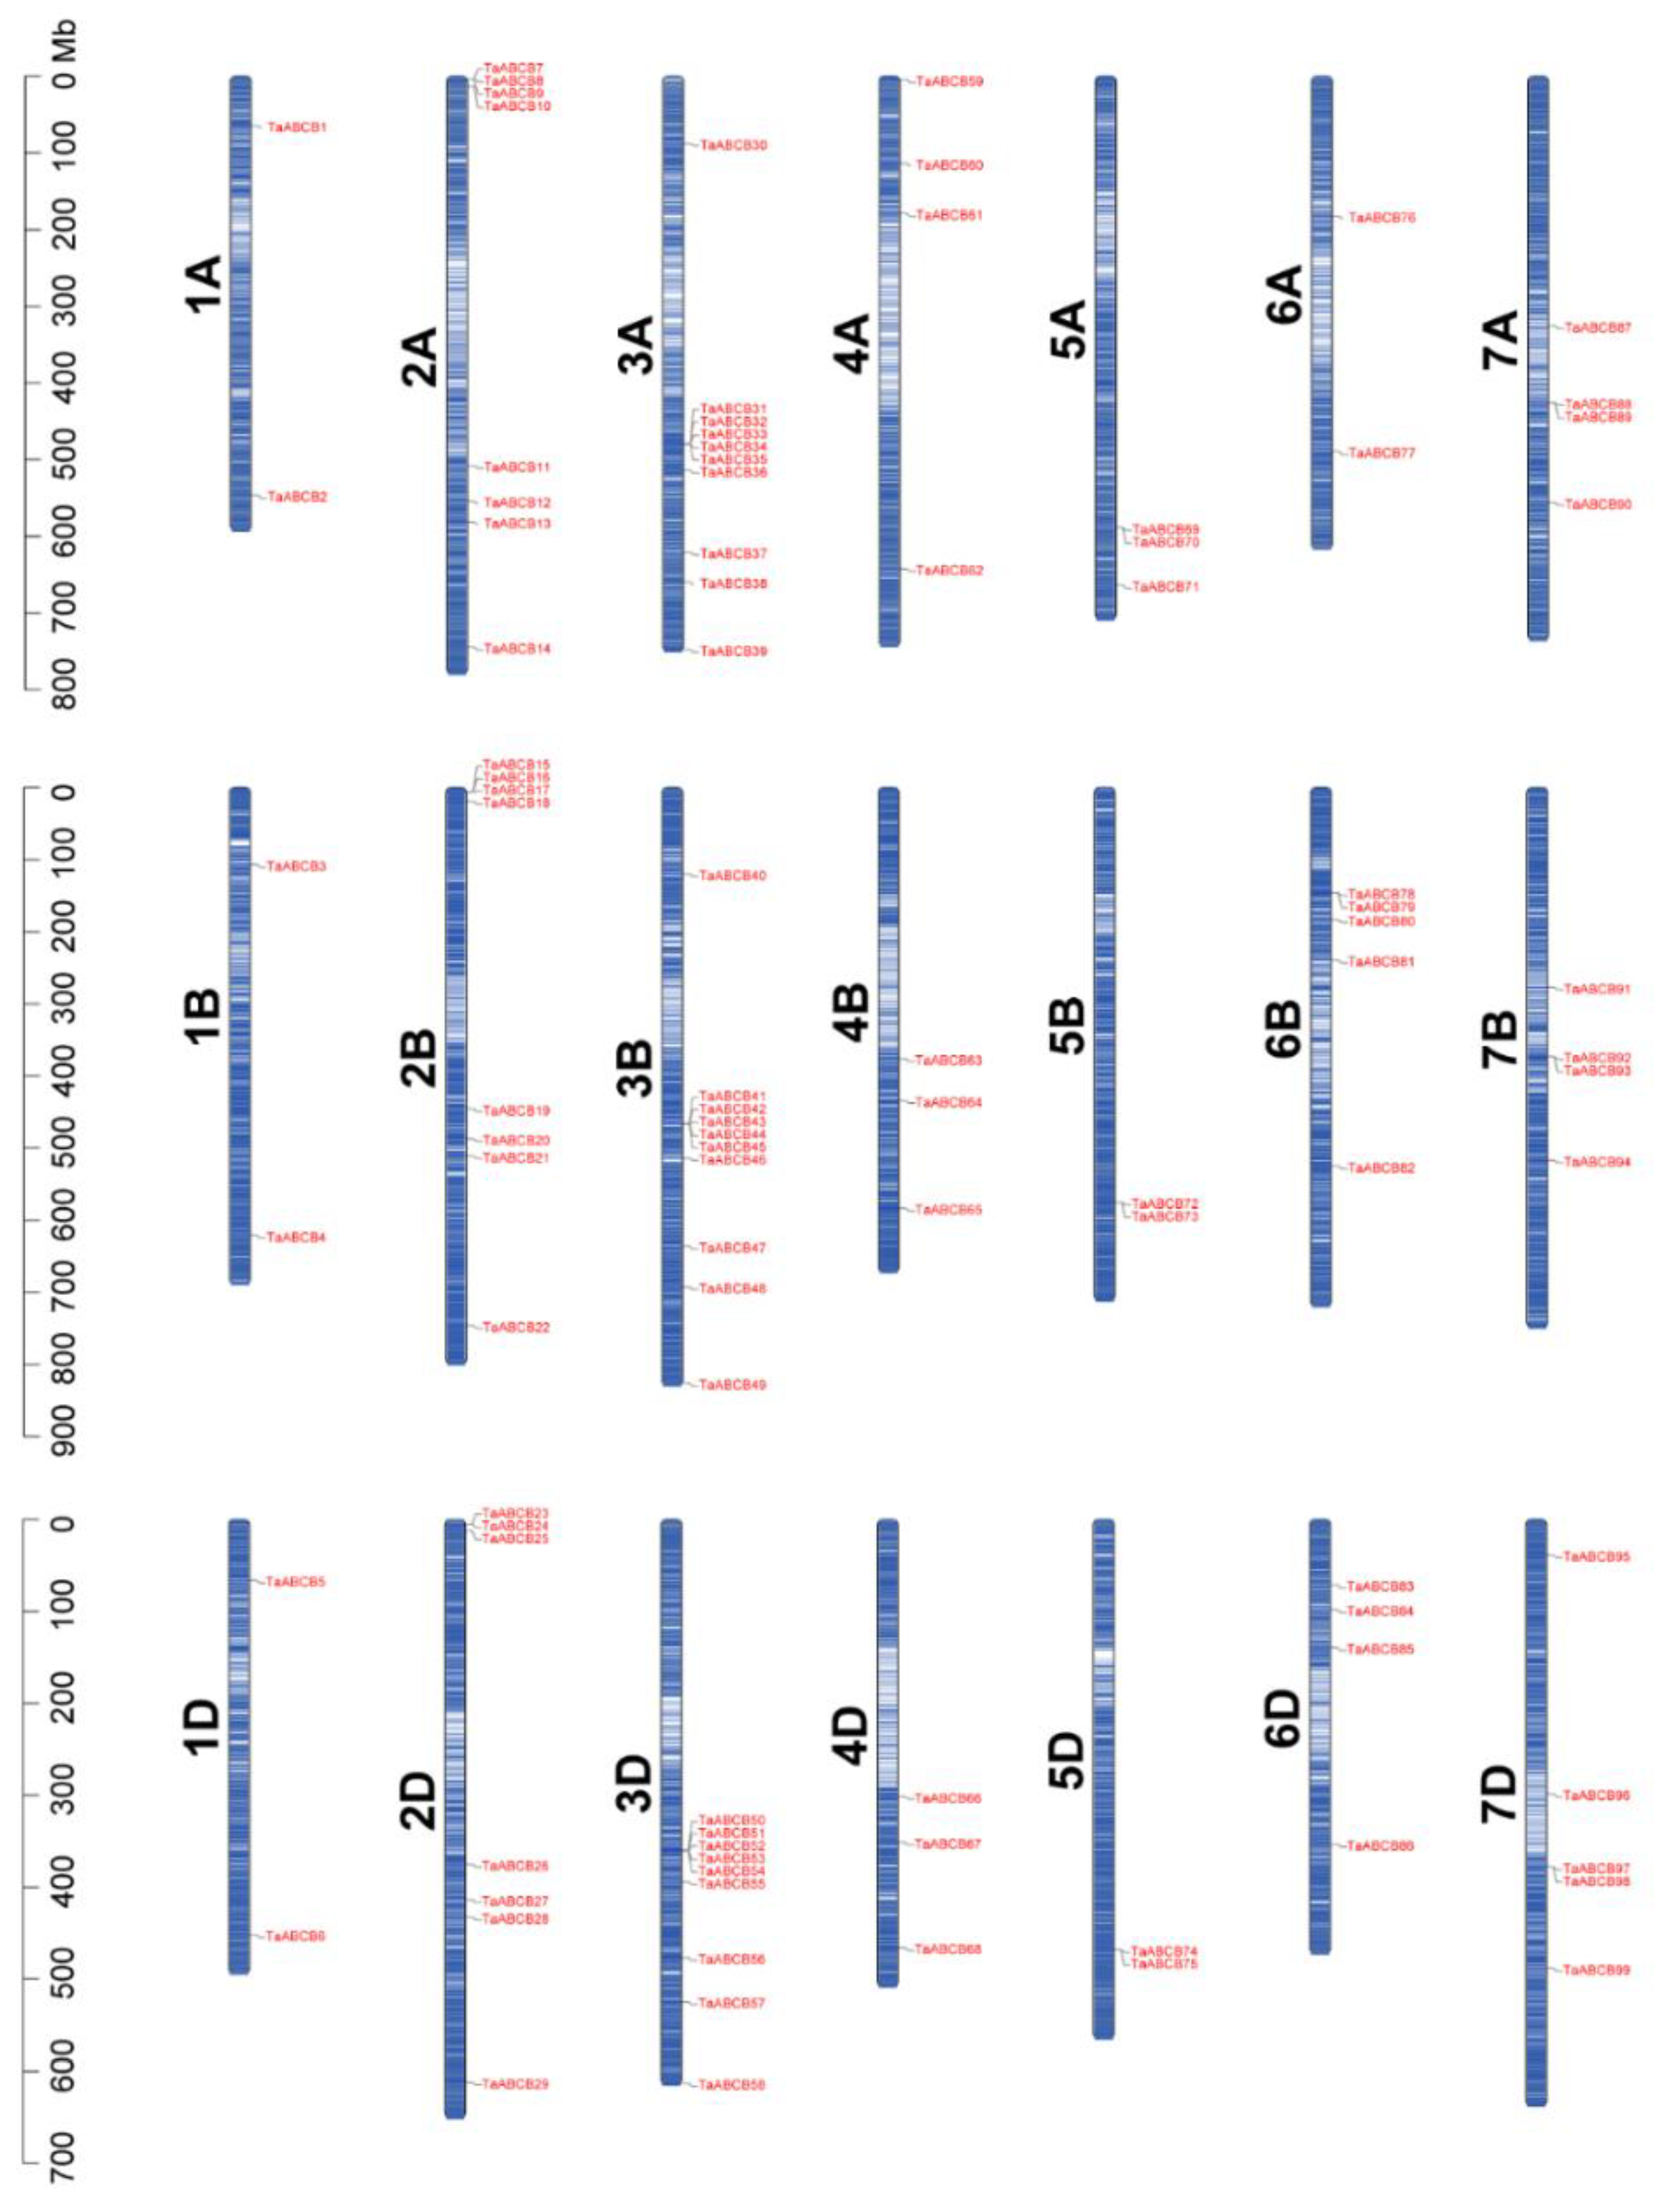
Figure 5.
Comparative collinearity analysis of TaABCB genes across wheat chromosomes. The collinear gene pairs are marked by red lines, chromosome identifiers are displayed in boxes, and gene density is represented by red (dense) and light blue (sparse) box shading.
Figure 5.
Comparative collinearity analysis of TaABCB genes across wheat chromosomes. The collinear gene pairs are marked by red lines, chromosome identifiers are displayed in boxes, and gene density is represented by red (dense) and light blue (sparse) box shading.
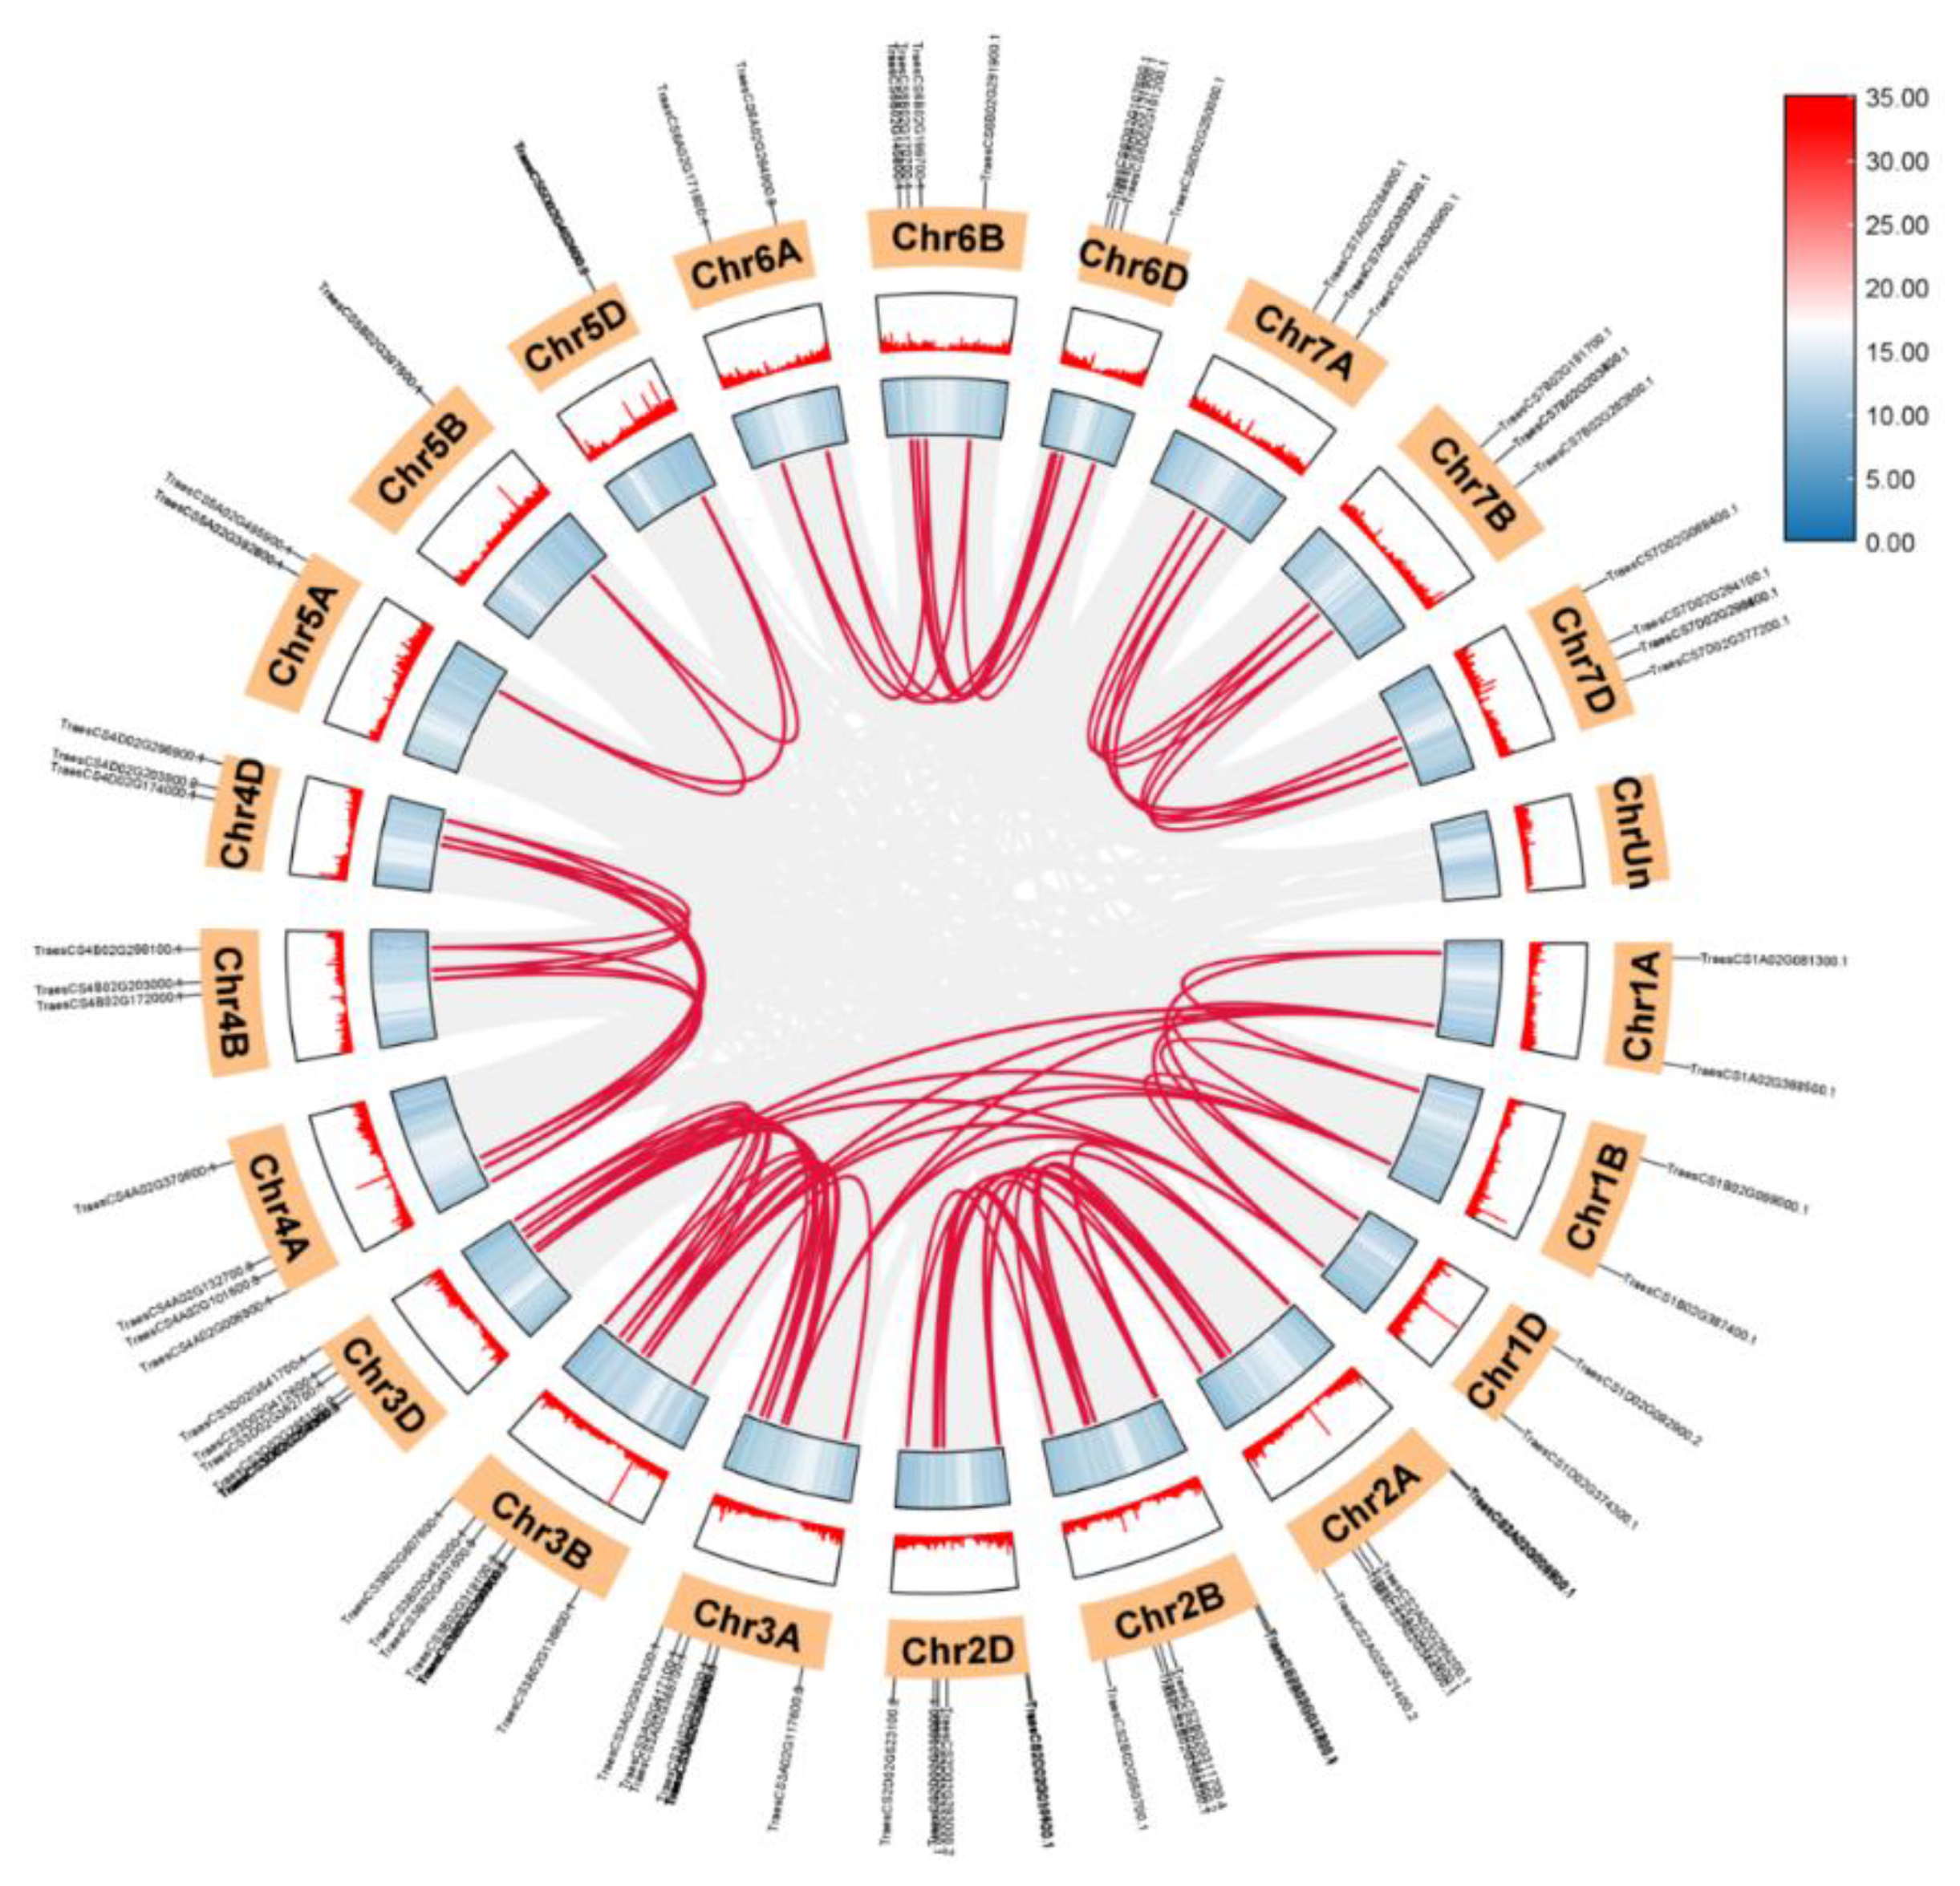
Figure 6.
Collinearity analyses of ABCB members between wheat and other species. The red lines represent collinear gene pairs between species, Ta represents wheat, At represents Arabidopsis thaliana, Os represents rice, and Zm represents maize.
Figure 6.
Collinearity analyses of ABCB members between wheat and other species. The red lines represent collinear gene pairs between species, Ta represents wheat, At represents Arabidopsis thaliana, Os represents rice, and Zm represents maize.
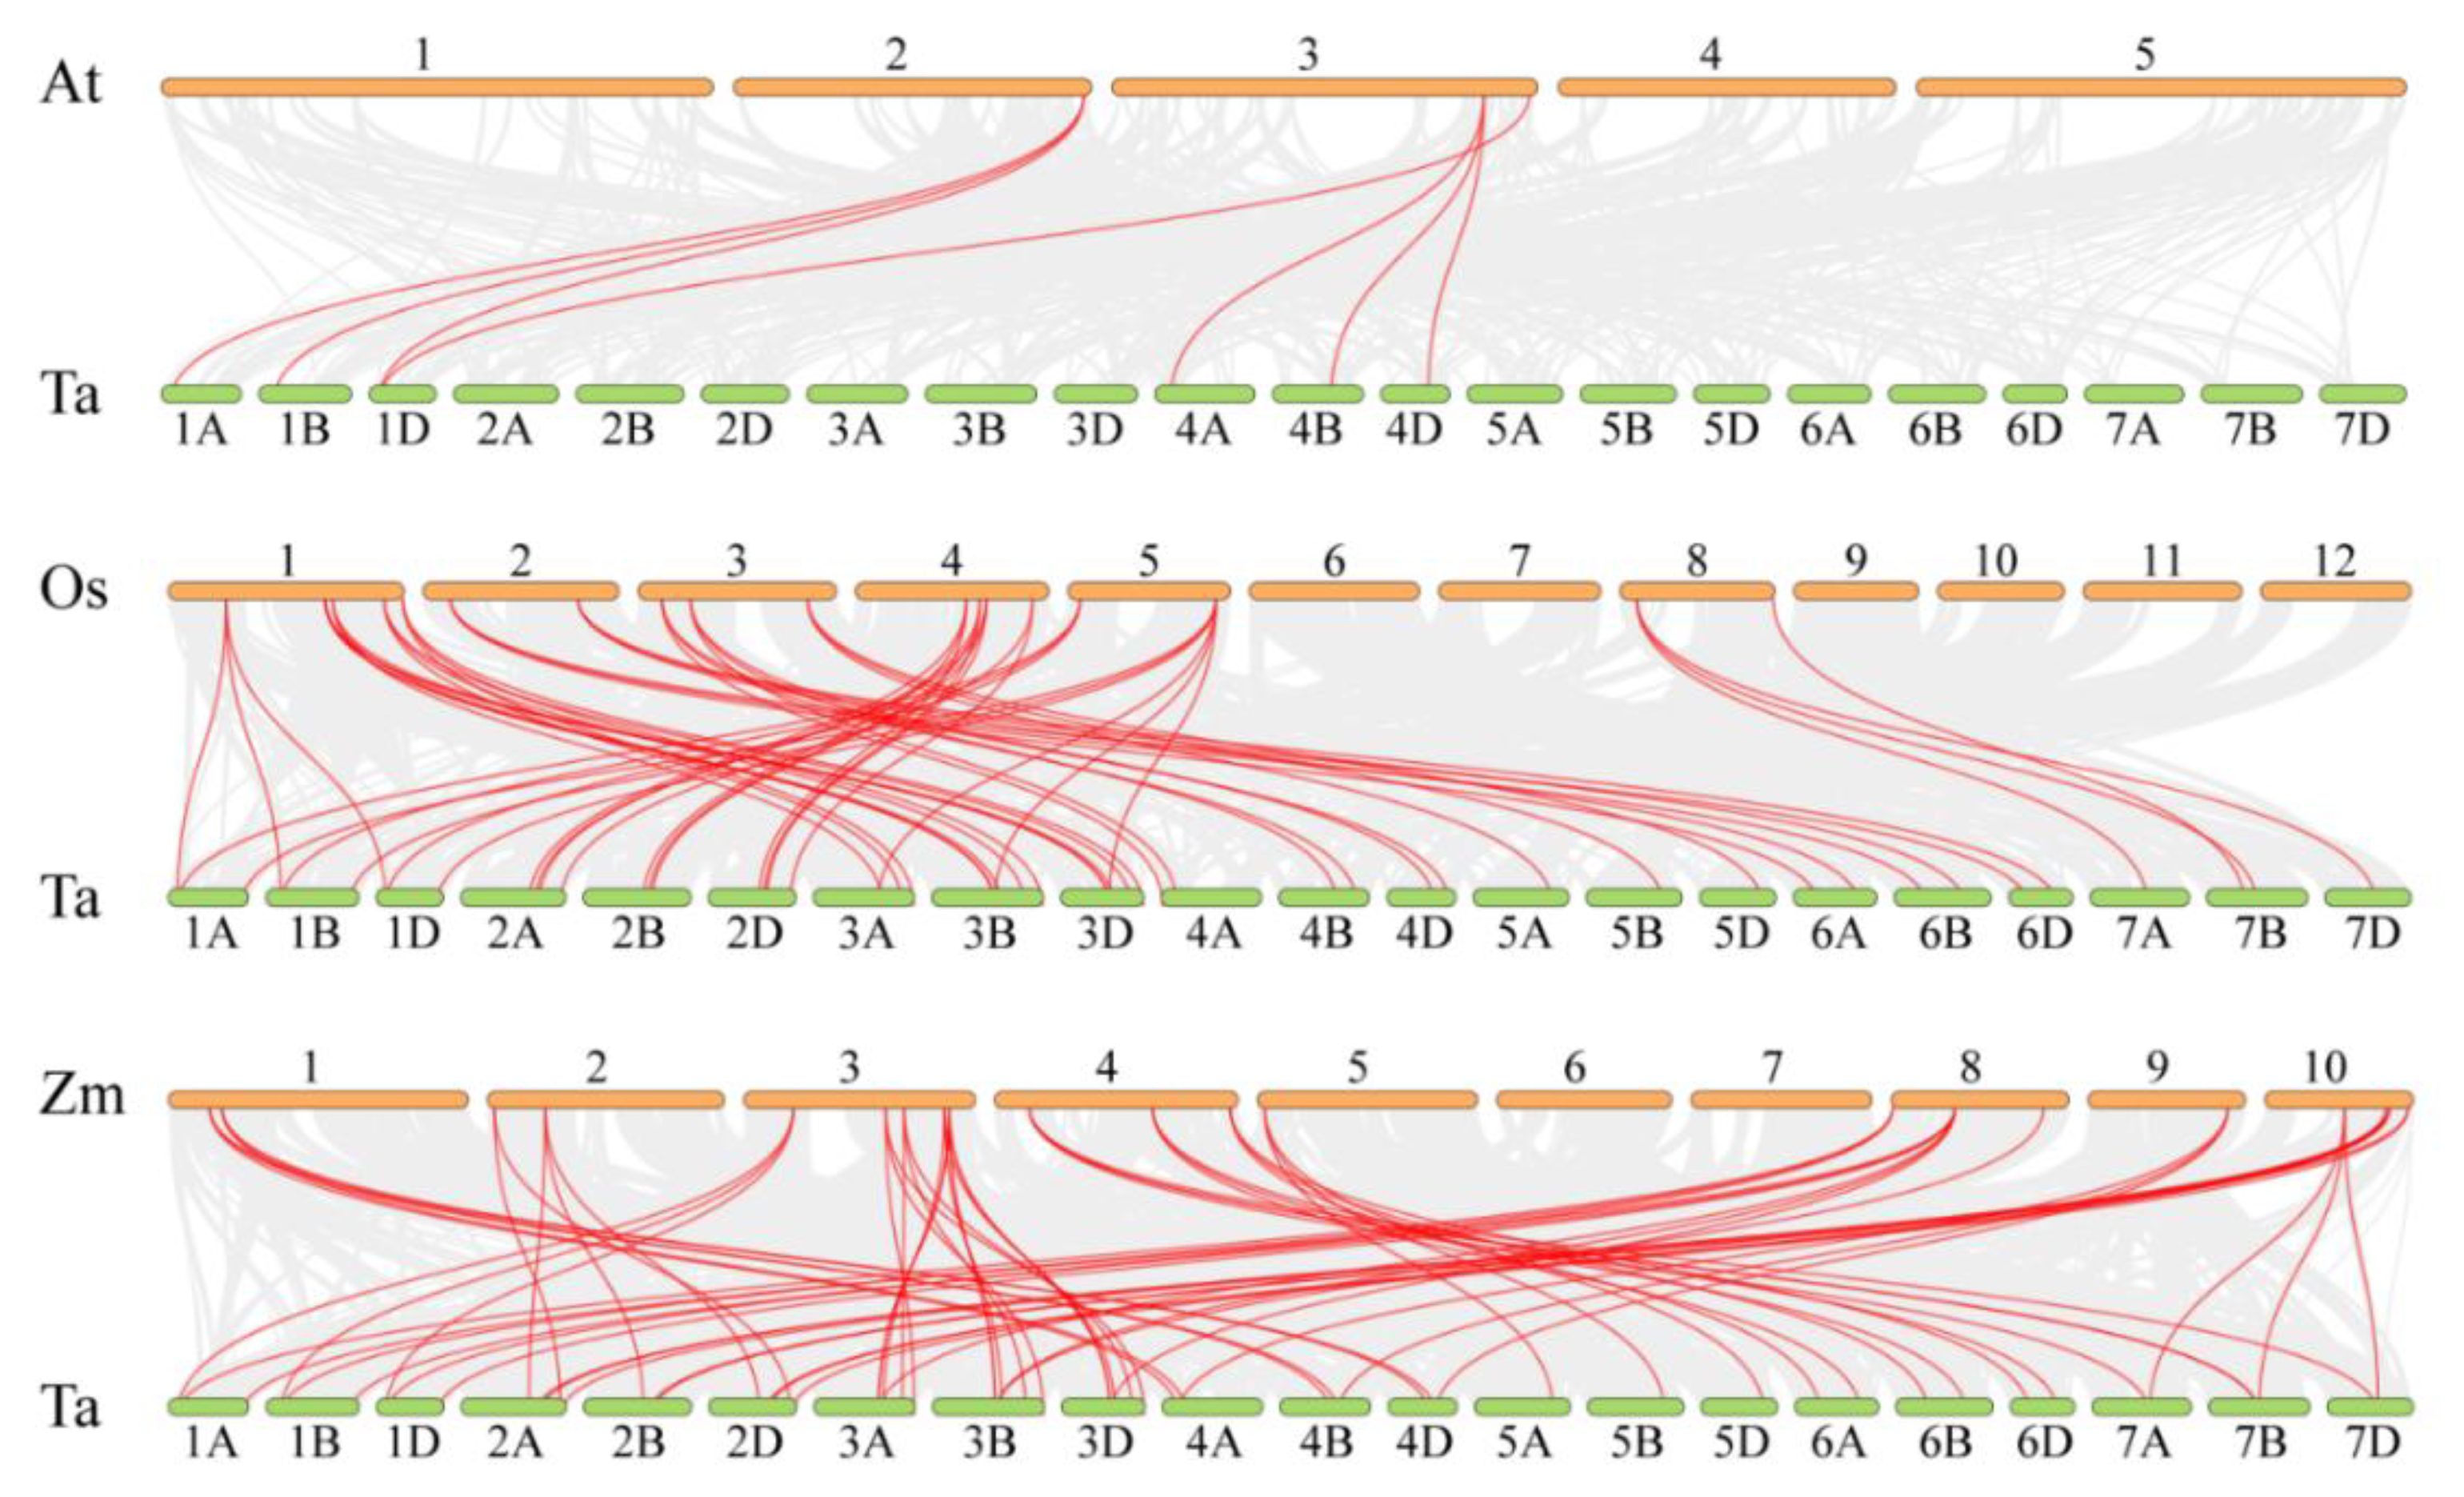
Figure 7.
Cis-acting elements and gene structure analysis of TaABCB members. (A) Evolutionary tree of TaABCBs. (B) Promoter cis-regulatory element distribution in TaABCB genes. (C) Gene structure analysis of TaABCBs members.
Figure 7.
Cis-acting elements and gene structure analysis of TaABCB members. (A) Evolutionary tree of TaABCBs. (B) Promoter cis-regulatory element distribution in TaABCB genes. (C) Gene structure analysis of TaABCBs members.
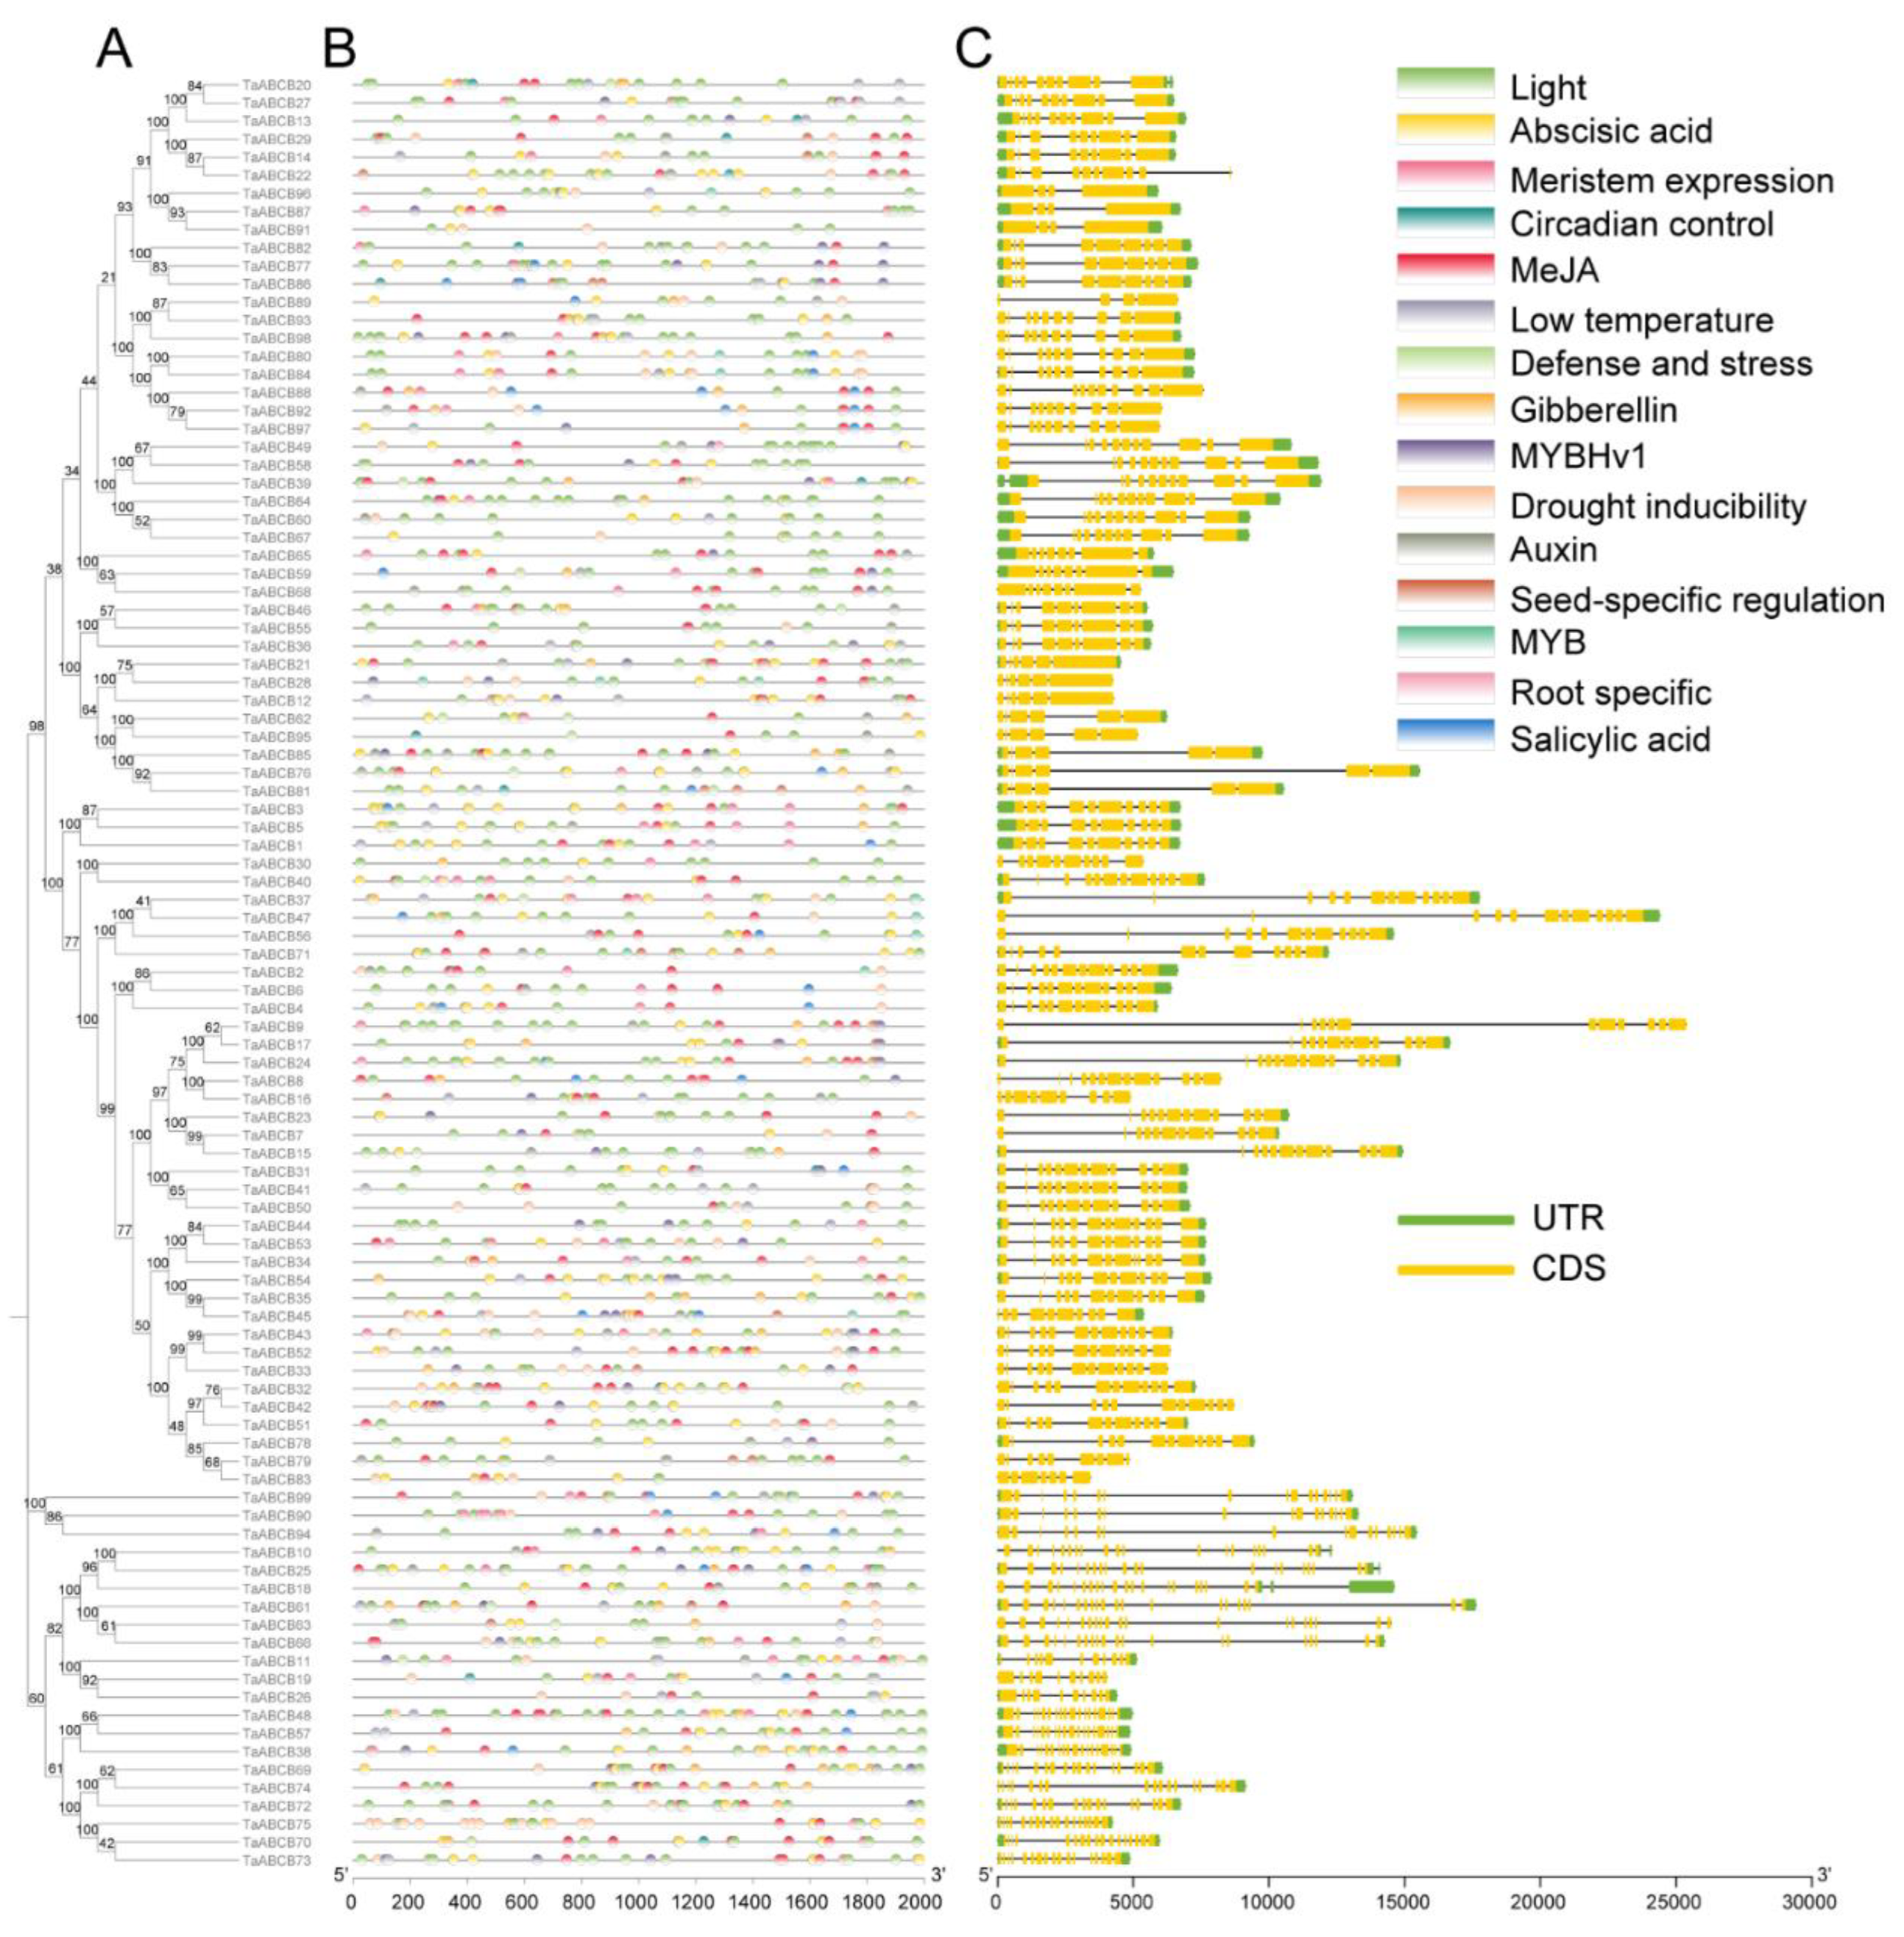
Figure 8.
Transcriptomic analysis of Kenong199 under low phosphorus conditions. (A) PCA analysis. (B) Volcano diagram of differentially expressed genes in low phosphorus transcriptome. (C) KEGG analysis of differentially expressed genes.
Figure 8.
Transcriptomic analysis of Kenong199 under low phosphorus conditions. (A) PCA analysis. (B) Volcano diagram of differentially expressed genes in low phosphorus transcriptome. (C) KEGG analysis of differentially expressed genes.
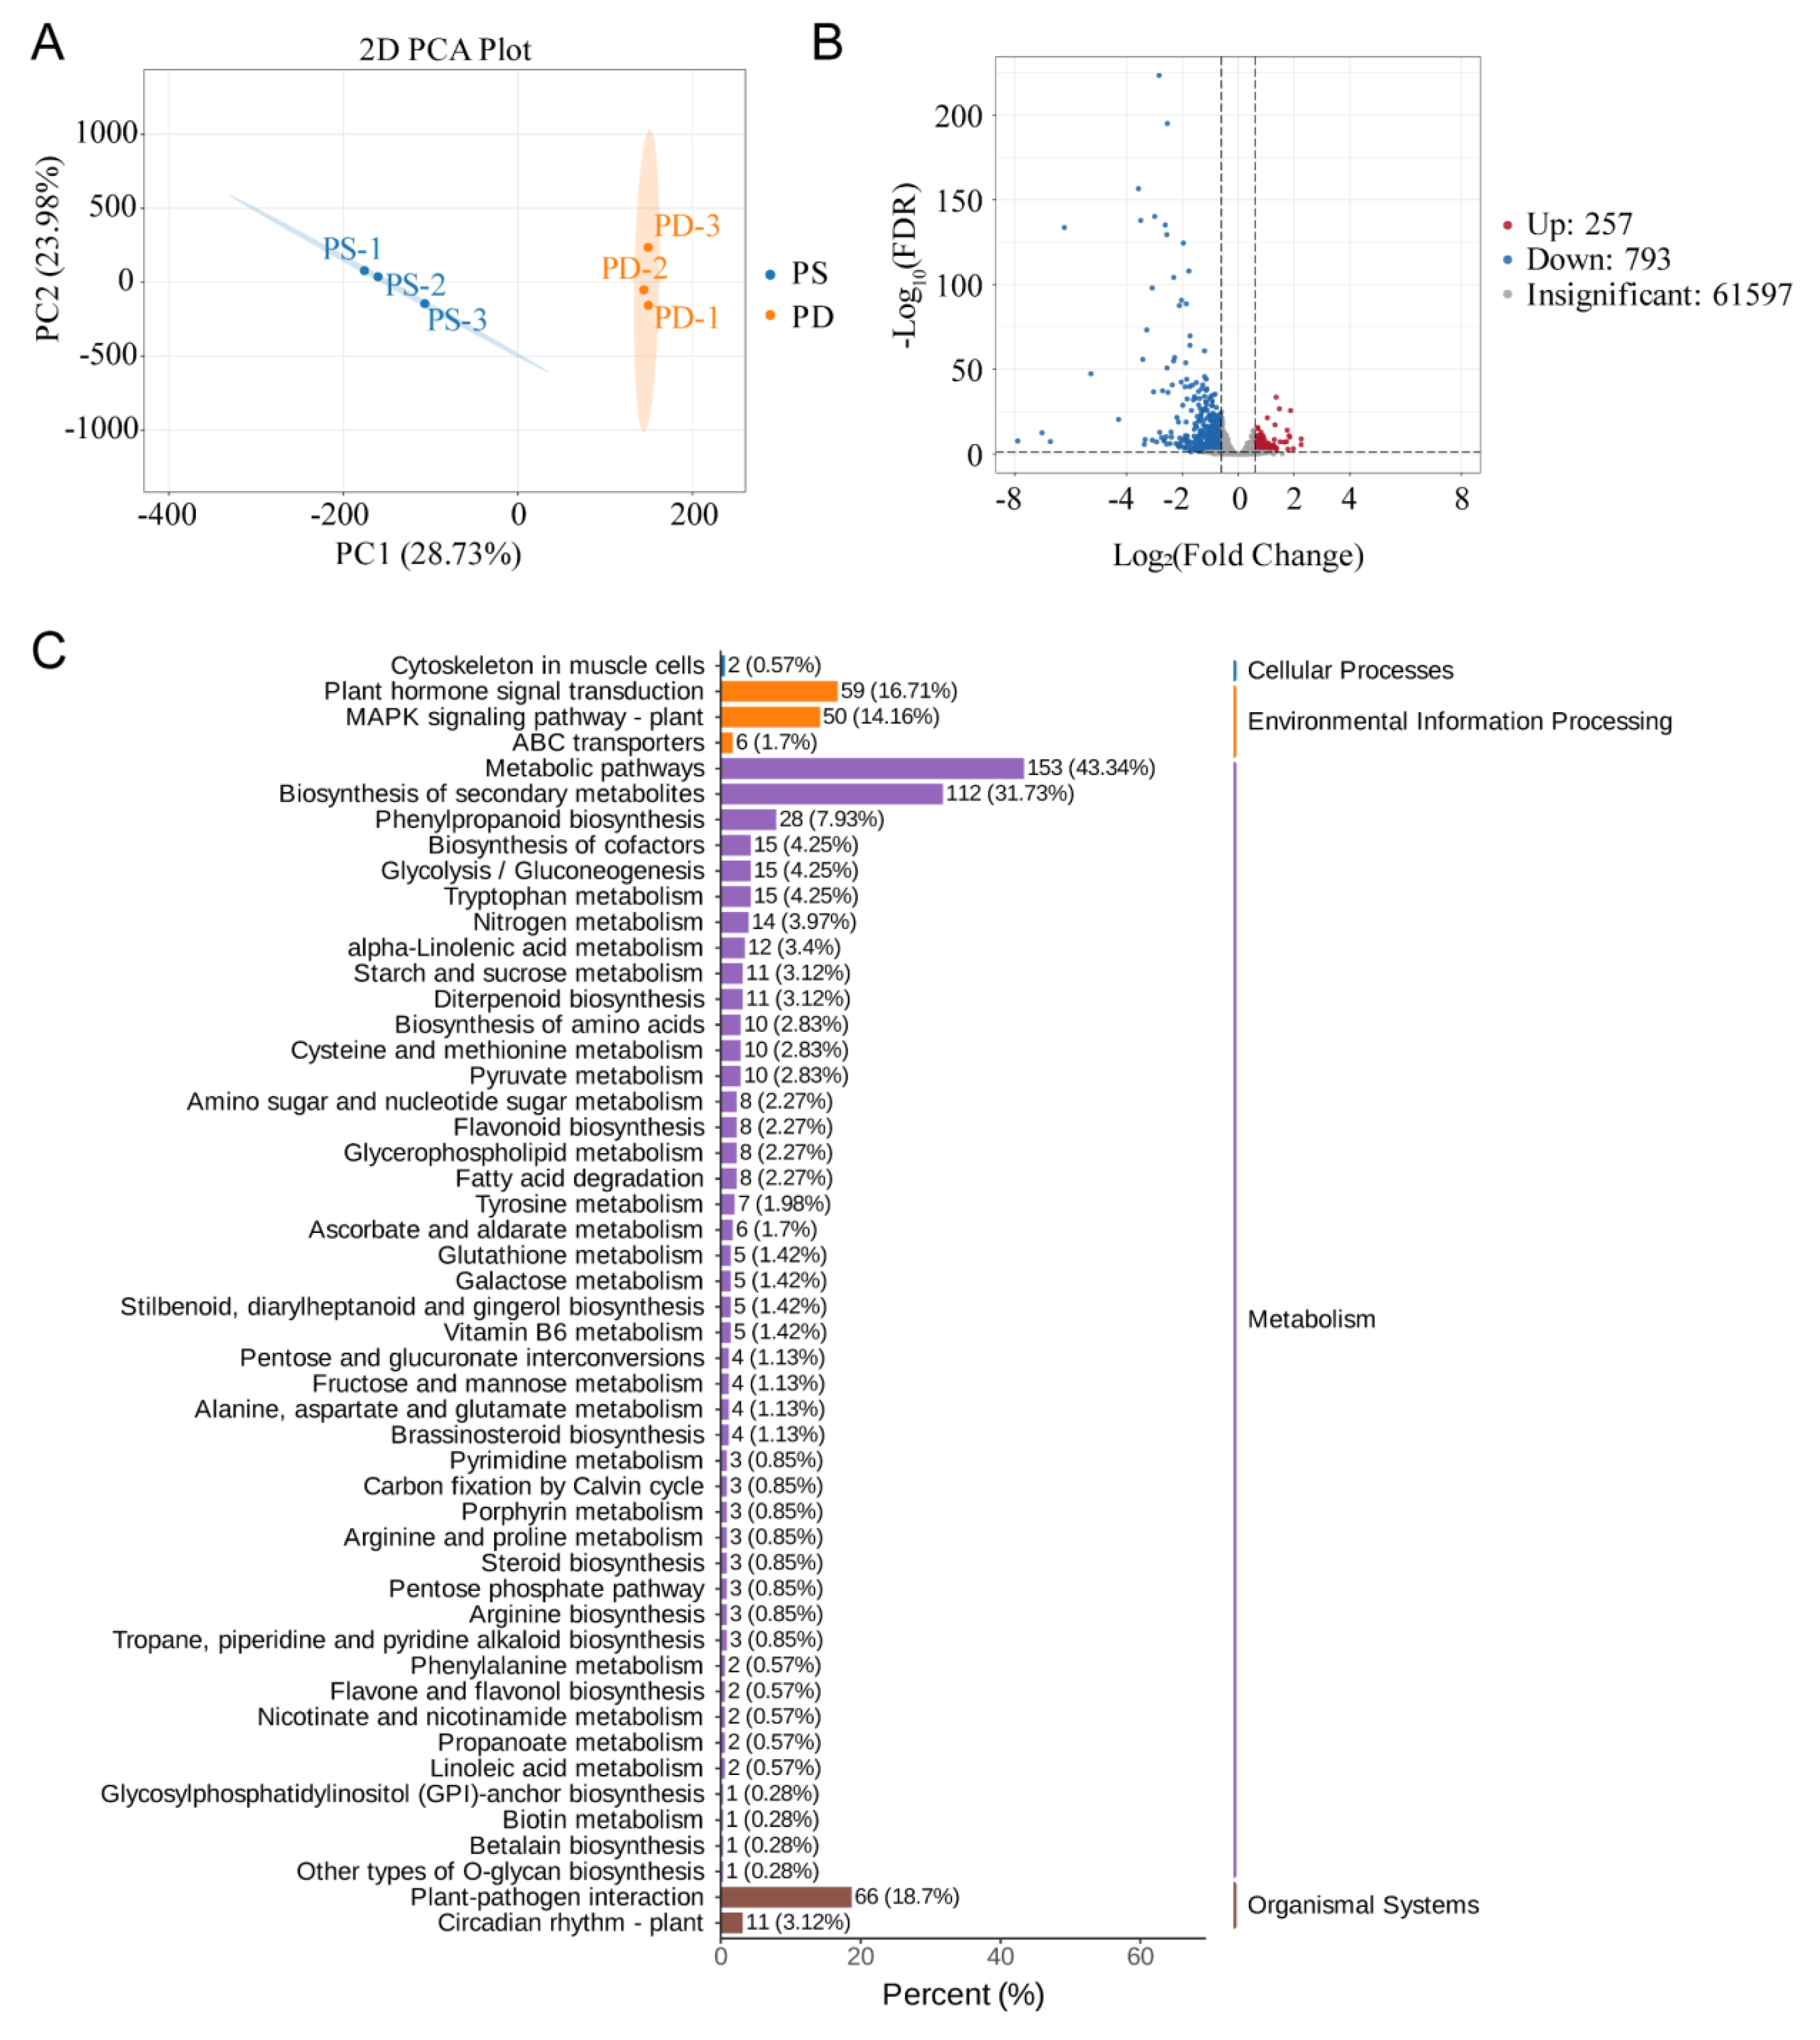
Figure 9.
Expression profiles and candidate gene correlation analysis of TaABCB members. (A) Expression profiles of TaABCB members under low phosphorus conditions. (B) Transcriptome differentially expressed genes and Venn diagram between TaABCB members. (C) Prediction of protein interactions between differentially expressed genes in TaABCB members. (D–H) Expression analysis of candidate genes in TaABCB members under normal and low phosphorus conditions. (I,J) Under low phosphorus stress treatment conditions, the expression profiles of TaIPS1 and TaABCB7 genes at different time points. (K) AlphaFold 3 predicted the conjunction of TaPHR2 and the promoter of TaABCB7. (L–M) Dual-Luciferase reporter assays. The Student’s t-test to was performed to analysis the significance between PS and PD, ** p-value ≤ 0.01, and *** p-value ≤ 0.001.
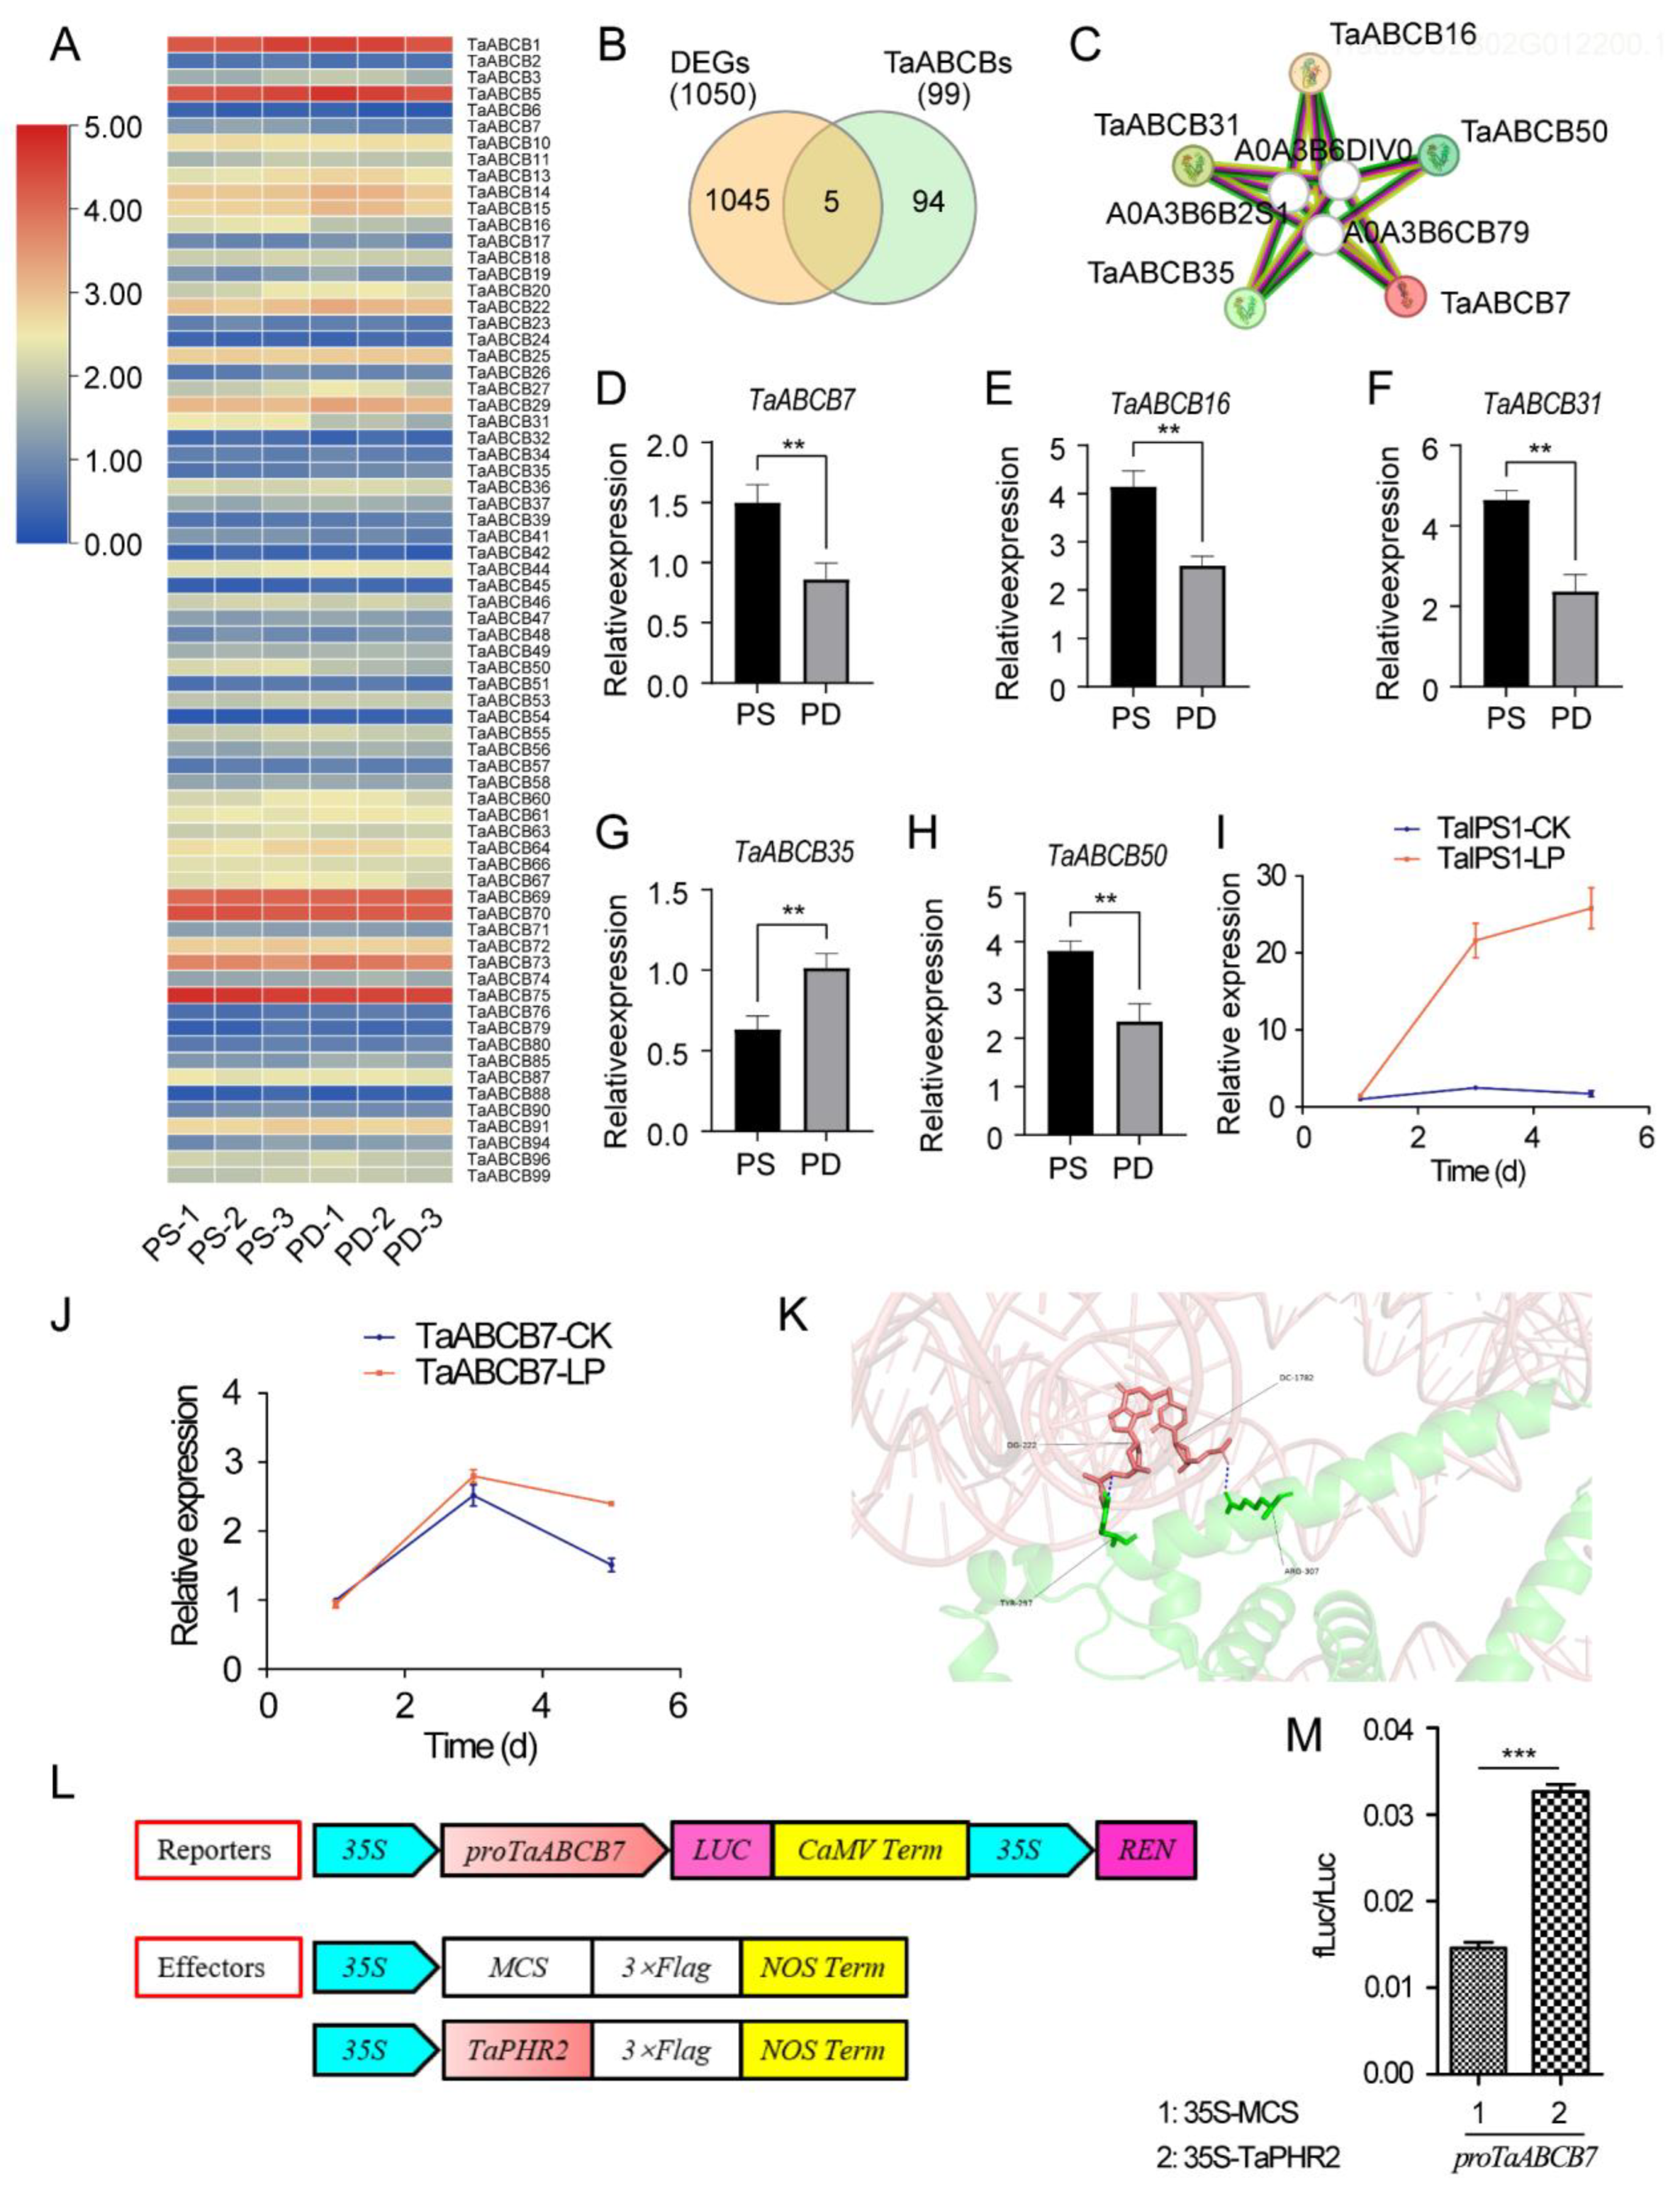
Figure 10.
Haplotype analysis of the candidate gene TaABCB7. (A) Haplotype network diagram of TaABCB7 in 406 wheat germplasms. H001-H007 represent different haplotypes, the size of the circle represents the amount of material contained in each haplotype, and different colors represent different varieties. (B) Table of haplotypes of TaABCB7 in 406 wheat germplasms. The top number represents different SNP markers, and the right number represents the number of material portions. (C) Significance analysis of different haplotypes in plant height (PH). (D) Significance analysis of different haplotypes in productive tiller number (PTN). (E) Significance analysis of different haplotypes in thousand kernel weight (TKW). (F) Significance analysis of different haplotypes in total root length (TRL). (G) The distribution of different haplotypes in the process of breeding improvement. (H) Significance analysis of the elite haplotype H001 in plant height among different subgroup materials. (I) Significance analysis of the elite haplotype H001 in thousand kernel weight among different subgroup materials. The Student’s t-test was performed to analysis the significance between different haplotypes, * represents p-value ≤ 0.05, ** p-value ≤ 0.01, and *** p-value ≤ 0.001.
Disclaimer/Publisher’s Note: The statements, opinions and data contained in all publications are solely those of the individual author(s) and contributor(s) and not of MDPI and/or the editor(s). MDPI and/or the editor(s) disclaim responsibility for any injury to people or property resulting from any ideas, methods, instructions or products referred to in the content. |
© 2025 by the authors. Licensee MDPI, Basel, Switzerland. This article is an open access article distributed under the terms and conditions of the Creative Commons Attribution (CC BY) license (http://creativecommons.org/licenses/by/4.0/).
Copyright: This open access article is published under a Creative Commons CC BY 4.0 license, which permit the free download, distribution, and reuse, provided that the author and preprint are cited in any reuse.


