Submitted:
05 October 2025
Posted:
06 October 2025
You are already at the latest version
Abstract
Proactive inhibition (PI), where previously learned information interferes with new memory formation, represents a fundamental challenge in cognitive control, yet its neural mechanisms remain poorly understood. We investigated how hippocampal memory activity and parvalbumin-positive (PV) interneurons coordinate to regulate PI using modified novel object recognition paradigms with systematic manipulation of inter-stimulus intervals (ISI) and cognitive load (1-4x). Immunofluorescence analysis examined cFos, Rac1-GTP and PAK1 expression in hippocampal CA1 and dentate gyrus (DG) regions, while optogenetic manipulation targeted PV interneurons during memory consolidation. Our results revealed that both ISI and cognitive load conditions led to decreased hippocampal cFos expression and increased Rac1-GTP and PAK1 expression. Short ISI conditions (1-30min) produced significantly stronger PI effects than long ISI (1-4hr), accompanied by elevated Rac1-GTP and PAK1 expression in both CA1 and DG regions. High cognitive load similarly enhanced PI and increased hippocampal Rac1 and PAK1 activation. Critically, optogenetic activation of DG PV interneurons during short ISI periods rescued memory performance by reducing Rac1 and PAK1 expression in the DG region. Furthermore, activation of PV interneurons in DG enhanced memory performance while inhibition of PV interneurons impaired it, effects that were mediated through modulation of cFos expression in CA1. These findings reveal a temporally coordinated regulatory network where PV interneurons maintain pattern separation through rapid inhibitory control while suppressing interference-related molecular cascades, enabling the hippocampus to preserve memory precision under competing information conditions and providing potential therapeutic targets for memory-related cognitive disorders.
Keywords:
proactive inhibition
; Rac1
; parvalbumin interneurons
; hippocampus
; memory interference
1. Introduction
Proactive inhibition (PI) refers to the interference effect that previously learned information exerts on the formation of new memories. As a core phenomenon in working memory and cognitive control research, PI is prevalent in daily learning and memory activities, directly affecting individual learning efficiency and memory accuracy[1,2,3,4,5].
Previous studies have demonstrated that the strength of PI is modulated by multiple factors. Among these, temporal proximity is one of the most critical regulatory variables. The time interval between two learning tasks (Inter Stimulus Interval, ISI) significantly affects the degree of memory interference: shorter ISIs typically lead to stronger PI effects, which may be related to the competitive nature of memory consolidation processes and the limited nature of attentional resources. Cognitive load is another important regulatory factor. When the information processing demands on an individual's working memory system exceed its capacity limits, attention becomes dispersed and information processing errors increase, thereby exacerbating memory interference phenomena. Additionally, individual differences in working memory capacity directly affect one's ability to cope with PI, with high-capacity individuals typically being better able to execute proactive control and effectively reduce interference[6,7].
The hippocampus plays an important role in preventing memory interference through its fine internal structure and unique information processing mechanisms. Among these, the DG is considered a key region for achieving pattern separation. Pattern separation refers to the process of transforming highly similar inputs into distinct, non-overlapping neural representations, a function that is crucial for reducing interference between similar memories[8,9]. The DG supports pattern separation function through sparse coding mechanisms: although granule cells are numerous, only a few cells respond to specific stimuli[8]. This sparsity helps enhance memory specificity and reduce representational overlap between similar information[10]. Studies have shown that when the pattern separation function of the DG is impaired, representations of similar memories tend to overlap, leading to enhanced PI effects[11].
Although the behavioral manifestations of PI have been extensively studied, its neural mechanisms remain to be elucidated in depth. The pattern separation function of the DG depends on its internal complex neural circuits, particularly the fine regulation by inhibitory interneurons. Among these, parvalbumin (PV)-expressing interneurons play a key role in maintaining sparse coding and pattern separation. PV interneurons ensure that only the most relevant granule cells are activated through rapid and precise inhibitory regulation, thereby maintaining the stability of DG sparse coding[12]. Previous studies have found that abnormal PV neuron activity is closely associated with working memory deficits and decreased cognitive flexibility[13,14,15,16].Beyond cellular and circuit mechanisms, molecular signaling pathways also participate in the regulation of memory interference. The small GTPase Rac1, as a key molecule regulating cytoskeletal dynamics and synaptic plasticity, has received attention in memory research in recent years[17,18,19]. Rac1 affects synaptic structure and function by regulating actin cytoskeleton remodeling. Studies have shown that Rac1 may lead to synaptic plasticity imbalance, increasing mutual interference between memories[18,20,21]. Conversely, inhibition of Rac1 is beneficial for weakening unnecessary synaptic connections and improving memory discrimination[19,22,23]. However, the specific action patterns of Rac1 in different hippocampal subregions and its interaction mechanisms with inhibitory neuron circuits still require further study.
Notably, there exists a functional coordination relationship between Rac1 and PV interneurons, revealing their complementary but temporally distinct roles in DG memory processing. The functional relationship between Rac1 and PV interneurons reveals their complementary but temporally distinct roles in DG memory processing. PV interneurons provide circuit-level structure for pattern separation through powerful lateral inhibition, operating on millisecond timescales to achieve "winner-take-all" mechanisms. Connectivity analysis shows that in the DG lateral inhibition is approximately 10 times more abundant than recurrent inhibition, with PV interneurons displaying localized excitatory connections but more extensive inhibitory connections[24]. In contrast, Rac1 signaling operates on timescales of minutes to hours to control memory consolidation and forgetting mechanisms. Rac1 activation regulates natural memory decay and interference-based forgetting, with Rac1 inhibition extending object recognition memory from less than 72 hours to over 72 hours[25,26]. The temporal dynamics indicate that PV interneurons shape immediate neural responses during memory encoding, while Rac1 controls long-term memory maintenance and interference. However, how the synergistic relationship between these two regulates memories affected by interference remains unclear.
Based on the theoretical background above and limitations of existing research, this study aims to systematically analyze the neural regulatory mechanisms of PI, focusing on the roles of PV interneurons and Rac1 signaling pathways in hippocampal DG and their interrelationships. We propose three interrelated scientific hypotheses to guide this research: First, we hypothesize that enhanced PI under short ISI conditions is temporally associated with abnormal activation of Rac1 signaling in hippocampal CA1 region, where excessive Rac1 activation disrupts the balance of memory consolidation within short time intervals, leading to increased interference between memories. Second, we hypothesize that activity regulation of PV interneurons in DG has circuit specificity, being able to specifically alleviate memory interference induced by short ISI or high cognitive load through enhanced pattern separation function. Finally, we hypothesize that Rac1 signaling pathways and PV neuron circuits have functional interactions, with both coordinately regulating PI strength on different timescales, forming a multi-level regulatory network. Through integrating behavioral, immunofluorescence, optogenetic, and other experimental methods, this study will provide new theoretical insights for understanding neural encoding rules of competitive memory and provide molecular and behavior-level scientific foundations for developing intervention strategies for cognitive disorders.
2. Materials and Methods
2.1. Animals
This study employed 2–3-month-old male C57BL/6J mice and PV-Cre transgenic mice as experimental animal models. All experimental animals shared the same genetic background with no significant individual differences observed between subjects. Male PV-Cre mice (B6; 129P2-Pvalbtm1(cre)Arbr/J; The Jackson Laboratory, Bar Harbor, Maine, USA) were used for targeted experiments requiring cell-type specific manipulation. Mice were purchased from Vital River Laboratory (Animal Technology, Beijing, China) and housed at the Tsinghua University Animal Facility and Beihang University under standard laboratory conditions. All animals were maintained in a controlled environment with constant temperature (22 ± 1°C) and humidity (50% ± 10%), under a 12-hour light-dark cycle (lights on at 8:00 AM), with ad libitum access to food and water. To minimize environmental stress and ensure experimental reliability, all mice underwent at least one week of adaptive housing prior to experimental procedures. During this adaptation period, animals were handled daily for 5 minutes to familiarize them with experimental personnel and the laboratory environment. All experimental procedures were conducted in accordance with the Guide for the Care and Use of Laboratory Animals and followed the ARRIVE guidelines for reporting animal research. All protocols were approved by the Biomedical Ethics Committee of Beihang University prior to study commencement (Protocol code: BM20200045).
2.2. Proactive Inhibition Paradigm
This study employed a modified version of the Novel Object Recognition Test (NORT) combined with a PI paradigm to assess mice's ability to actively inhibit retrieval of previous memory cues during continuous learning processes. This paradigm induces memory interference by introducing multiple training phases and measures whether animals can effectively inhibit retrieval of old memory cues during the test phase, thereby reflecting their cognitive control and memory updating abilities.
All behavioral experiments were conducted during the same time period (2:00-6:00 PM) to minimize circadian rhythm effects on performance. The experimental apparatus consisted of transparent acrylic test boxes (50 × 50 × 35 cm) placed in a dimly lit testing room. Objects used in the experiments differed in material, color, and shape but were matched for size and attractiveness to avoid inherent preference bias (Details see in Fig. S5 and Table S4). All objects were pretested to ensure no significant preference in naive animals. Between each animal testing session, test boxes and objects were thoroughly cleaned with 75% ethanol to eliminate olfactory cues that could influence subsequent behavioral responses.
2.3. Experiment 1: Investigating the Effect of Different ISI on PI Effects
The experimental procedure consisted of four distinct phases (Figure 1A). Adaptation Phase: Mice freely explored the empty test box for 10 minutes daily over 3 consecutive days to familiarize themselves with the experimental environment and minimize individual differences in exploratory motivation.
Learning Phase: Two interference objects (Object I) were placed symmetrically in the test box, and mice were allowed to freely explore for 10 minutes to ensure complete memory encoding of the initial object-location association.
Interference Phase: At predetermined time intervals following the learning phase (1 minute, 5 minutes, 10 minutes, 30 minutes, 1 hour, 2 hours, and 4 hours), one Object I was replaced with an aim object (Object A) while maintaining the same spatial location. Mice explored this new configuration for 10 minutes to establish competing memory traces and induce proactive interference.
Test Phase: Twenty-four hours after the initial learning phase, mice were presented with a novel test object (Object T) and the previously introduced aim object (Object A). The primary dependent measure was the exploration time ratio between the novel object T and the familiar object A, with successful PI indicated by preferential exploration of Object T.
For analytical purposes, ISI conditions were categorized into short-term ISI groups (1, 5, 10, and 30 minutes) and long-term ISI groups (1, 2, and 4 hours) to examine temporal dynamics of memory interference and inhibitory control mechanisms.
2.4. Experiment 2: Investigating the Effect of Cognitive Load on PI Effects
This experiment examined how varying levels of cognitive demand influence PI capacity (Figure 2A). Adaptation Phase: Identical to Experiment 1, mice underwent 3 days of environmental familiarization with 10-minute daily exposure to the empty test box. Cognitive Load Accumulation Phase: The learning phase was modified to include multiple sequential learning episodes to systematically increase cognitive load. Initially, two identical objects (Object Ia) were placed in the test box for 10 minutes of exploration. Subsequently, one Object Ia was replaced with a similar but distinguishable object (Object Ib), and mice explored this new configuration for an additional 10 minutes, constituting one cognitive load accumulation cycle. Based on experimental group assignment, mice completed 1-4 cognitive load accumulation cycles to establish different levels of memory burden prior to the interference manipulation. Interference Phase: Following completion of the assigned cognitive load accumulations and a standardized 1-hour retention interval, one object was replaced with target object A, and mice explored for 10 minutes to establish the competing memory trace. Test Phase: Twenty-four hours post-initial learning, mice were tested with novel object T and target object A to assess PI performance under varying cognitive load conditions.
2.5. Video Analysis and Behavioral Scoring
All behavioral data were collected using an automated video tracking system (Hikvision, China) and analyzed using TopScan motion analysis software (CleverSys, Inc., USA) with a sampling rate of 30 frames per second. The software automatically recorded and quantified exploration time, distance traveled, and spatial preferences throughout the testing sessions.
Animal exploratory behavior was analyzed post-hoc using TopScan software. Object exploration was operationally defined as the animal's nose approaching within 2 cm or less of the object, as determined by automated software detection algorithms. This proximity threshold ensured accurate discrimination between active exploration and incidental contact or proximity without investigative intent.
The object discrimination index calculation formula is as follows:
2.6. Immunofluorescence Staining and Imaging
Two hours following completion of behavioral testing (2 hours post-training phase), mice were deeply anesthetized with 3% pentobarbital sodium (2 ml, i.p.) and subjected to transcardiac perfusion fixation. The perfusion protocol consisted of initial rapid perfusion with phosphate-buffered saline (PBS, pH 7.4) for approximately 5 minutes to clear vascular blood, followed by perfusion fixation with 4% paraformaldehyde (PFA) in PBS (pH 7.4) for 10-15 minutes until complete limb rigidity indicated adequate tissue fixation.
Following perfusion, brains were rapidly extracted and post-fixed in 4% PFA for 2 hours at 4°C. Tissues were then subjected to gradient sucrose dehydration by sequential immersion in 10%, 20%, and 30% sucrose solutions until complete tissue sinking was achieved. Coronal sections (50 μm thickness) were prepared using a vibratome and stored in PBS until further processing (DTK1000N, Dosaka, Japan).
Brain sections were washed three times with PBS and blocked for 2 hours at room temperature in blocking solution containing 0.3% Triton X-100 and 5% bovine serum albumin (BSA) in PBS to minimize non-specific antibody binding. Primary antibody incubations were performed overnight at 4°C using the following antibodies and concentrations: c-Fos (9F6) Rabbit mAb (1:1000, Cell Signaling Technology, Cat: #2250), c-Fos Monoclonal antibody (1:1000, Proteintech, Cat: #66590-1-Ig), PAK1 Polyclonal antibody (1:1000, Proteintech, Cat: #21401-1-AP), Anti-Active Rac1 Mouse Monoclonal Antibody (1:1000, NewEast Biosciences, Cat: #26005),and Parvalbumin Polyclonal Antibody(1:1000, Invitrogen, Cat: # PA5-96209). To avoid species cross-reactivity, two distinct co-staining combinations were employed: (1) c-Fos (9F6) Rabbit mAb with Anti-Active Rac1 Mouse Monoclonal Antibody, and (2) c-Fos Monoclonal antibody with PAK1 Polyclonal antibody and (3) Parvalbumin Polyclonal Antibody with c-Fos (9F6) Rabbit mAb. Following 16-hour primary antibody incubation, sections were washed three times with PBS and incubated with fluorescent secondary antibodies for 2 hours at room temperature under dark conditions: Goat Anti-Rabbit IgG H&L (Alexa Fluor® 488) (1:1000) for c-Fos (9F6) and PAK1 detection, and Goat Anti-Mouse IgG H&L (Alexa Fluor® Cy3) (1:1000) for c-Fos Monoclonal antibody and Rac1-GTP visualization.
After completion of staining procedures, sections were thoroughly washed with PBS and mounted using DAPI-containing mounting medium for nuclear counterstaining. Images of hippocampal regions were acquired using an Andor Spinning Disk Confocal Microscope with a 20× objective lens. Z-stack images were processed using maximum intensity projection algorithms with accompanying software. Quantitative analysis of c-Fos positive cells, PAK1 and Rac1-GTP positive cells, and their colocalization ratios were performed using ImageJ software by investigators blinded to experimental conditions.
2.7. Viral Injection and Optogenetic Manipulation
For viral injection and fiber optic implantation procedures, animals were anesthetized via intraperitoneal injection of 1% pentobarbital sodium at a dose of 100mg/kg body weight. Anesthetic depth was confirmed by loss of toe-pinch reflex and reduced corneal reflex, ensuring appropriate surgical anesthesia levels. Respiratory rate and body temperature were continuously monitored during surgery, with supplemental anesthetic administered as necessary. All optogenetic experiments were performed in PV-Cre transgenic mice. The experimental design involved stereotaxic injection of three different viral vectors: AAV2/9-EF1α-DIO-ChR2-mCherry (titer: 1.05×10¹³ v.g./ml, Brain VTA, Wuhan, China; OBIO Technology Company, Shanghai, China) for blue light-mediated activation of PV neurons, AAV2/9-EF1α-DIO-ArchT-mCherry (titer: 1.15×10¹³ v.g./ml, Brain VTA, Wuhan, China; OBIO Technology Company, Shanghai, China) for green light-mediated inhibition of PV neurons, and AAV2/9-EF1α-DIO-mCherry (titer: 1.08×10¹³ v.g./ml, Brain VTA, Wuhan, China; OBIO Technology Company, Shanghai, China) as a control vector. Each animal received bilateral injections of 200 nL per hemisphere, delivered at a rate of 70 nL/min using a microsyringe pump (Shenzhen Ruiwode Lift Technology Co., Ltd, China). Following each injection, the needle was left in place for 10 minutes to minimize backflow, then slowly withdrawn. Fiber optic implanted immediately after viral injection.
Viral injection coordinates were determined according to the mouse brain atlas, targeting the dentate gyrus region at the following stereotaxic coordinates: 2.2 mm posterior to bregma (AP = -2.2 mm), ±1.3 mm mediolateral (ML = ±1.3 mm), and 2.0 mm below the dural surface (DV = -2.0 mm). Concurrently, optical fibers (200 μm diameter, Inper, Hangzhou, China) were implanted 0.5 mm above the target DG region (coordinates: AP = -2.2 mm, ML = ±1.3 mm, DV = -1.5 mm) to enable precise optogenetic modulation of the target brain region.
Following a two-week post-surgical recovery period to ensure adequate viral expression, behavioral experiments commenced. During the novel object recognition task, optogenetic stimulation was delivered during the ISI between the two learning phases. Specifically, light stimulation was applied at predetermined time points (1 min, 5 min, 10 min, 30 min, 1 h, 2 h, and 4 h) following completion of the first learning session and prior to the second learning phase.
Each optogenetic stimulation session lasted for the same duration as the ISI. with continuous pulsed light delivery at 8 Hz frequency and 5 ms pulse width. The ChR2 activation group received 473 nm blue light stimulation with an output power of 10 mW/mm². The ArchT inhibition group received continuous 532 nm green light activation with an output power of 15 mW/mm² throughout the inter-training interval. Control groups expressing empty vector (mCherry only) received identical light stimulation protocols as their respective experimental groups to control for non-specific light effects.
All optogenetic stimulations were precisely controlled using programmable laser controllers to ensure consistent stimulation parameters across experimental groups and sessions.
2.8. Statistical Analysis
All behavioral data and immunofluorescence staining results were analyzed using GraphPad Prism 9. Behavioral experiments and immunofluorescence data employed one-way ANOVA, with Tukey's multiple comparison correction when variance homogeneity was satisfied, to compare significance of differences between groups. Statistical significance was set at p < 0.05, with all data presented as mean ± standard error of the mean (Mean ± SEM). For data not conforming to normal distribution, non-parametric tests (such as Kruskal-Wallis test) were used for analysis. All inter-group comparisons employed two-tailed tests.
3. Results
3.1. Effects of Different ISI on PI
The temporal interval between learning episodes significantly influenced PI performance. For analytical purposes, ISI conditions were categorized into two groups: short-term ISI was operationally defined as intervals less than 1 hour (1, 5, 10, and 30 minutes), whereas long-term ISI encompassed intervals of 1 hour or greater (1, 2, and 4 hours).
Behavioral testing conducted 24 hours post-training revealed that mice in short-term ISI treatment groups exhibited significantly impaired memory performance compared to both control and long-term ISI groups, while long-term ISI groups showed no significant difference from control conditions (Figure 1C, D). Notably, no statistically significant differences were observed among the various short-term ISI groups, nor were there significant differences among the long-term ISI conditions (Figure 1B). Detailed behavioral results are presented in Table S2.
These findings demonstrate that the temporal proximity of learning events represents a critical determinant of PI strength, with closer temporal spacing between learning episodes resulting in enhanced memory interference and reduced recognition performance.
3.2. Effects of Different Cognitive Load on PI
Cognitive load was closely associated with animal memory performance. Experimental results showed that PI under low cognitive load conditions had less impact on memory performance in cognitive tests after 24 hours compared to PI under high cognitive load conditions (Figure 2A-C).
These findings demonstrate that cognitive load acts as a critical modulator of PI strength, with increasing task demands progressively compromising the brain's ability to form distinct memory representations. Detailed behavioral results are presented in Table S3.
3.3. Role of Hippocampal cFos and PAK1 Expression in ISI-Mediated PI
To evaluate memory strength for previously acquired memories, we performed immunofluorescence staining using cFos as a marker of memory-related neuronal activity. Given that Rac1 is closely associated with memory interference during memory processing, and the CA1 region of the hippocampus plays a crucial role in object recognition memory consolidation, we sacrificed animals 24 hours post-intervention without conducting behavioral tests to assess memory activity levels during the consolidation phase (Figure 3A).
PAK1, a downstream effector of Rac1, was examined alongside Rac1 expression in our experiments. Immunofluorescence staining revealed a strong correlation between PAK1 and Rac1 expression patterns (Fig. S1G). At 24 hours post-training, cFos expression in both the DG and CA1 regions of the hippocampus was significantly higher in control animals compared to both ISI-S and ISI-L groups, with no significant difference observed between the two ISI groups (Figure 3B-D). This suggests that both short and long ISI conditions suppress overall neuronal activity during memory consolidation.
We utilized PAK1 expression as an indicator of memory interference resulting from PI. Our results demonstrated that PAK1 expression in the ISI-S group was significantly elevated compared to both control and ISI-L groups, while there was no significant difference between control and ISI-L groups (Figure 3E-G). This result indicates that short ISI intervals specifically trigger molecular cascades associated with memory interference.
In the DG region, Rac1 expression in the ISI-S group was significantly higher than in both control and ISI-L groups (Fig. S1A). Similarly, in the CA1 region, Rac1 activation levels following short-term ISI exposure were significantly elevated compared to control and ISI-L conditions (Fig. S1A). These findings suggest that Rac1 signaling is preferentially activated under conditions of temporal proximity between learning events. We further examined the relationship between PAK1 activity and behavioral performance (Figure 3I). In the DG, PAK1 expression levels exhibited a modest negative correlation with object recognition memory performance in control animals (r = −0.295). In contrast, both the ISI-S (r = 0.766) and ISI-L (r = 0.396) groups displayed positive correlations between PAK1 expression and behavioral outcomes. Distinct patterns emerged in the CA1 region: PAK1 expression remained strongly negatively correlated with memory performance in both the control (r = −0.959) and ISI-L (r = −0.975) groups. Strikingly, this relationship was abolished in the ISI-S group, where no significant correlation was observed (Figure 3I–J). Consistent with these findings, analysis of Rac1-GTP levels yielded analogous correlation patterns, further supporting a functional link between these molecular markers and behavioral performance (Fig. S1B–C).
Collectively, these correlation profiles suggest that the functional role of the Rac1/PAK1 signaling pathway may undergo a contextual shift: under normal conditions, it may contribute to memory consolidation, whereas under temporally challenging conditions (particularly in the ISI-S paradigm), it may instead mediate memory interference or disruption.
3.4. Effects of Cognitive Load on Hippocampal cFos and PAK1 Expression and PI
We subsequently investigated the impact of cognitive workload on hippocampal memory consolidation processes during PI paradigms. Comparative analyses were conducted between 4× cognitive load (4× WL) experimental cohorts and control groups (Figure 4A).
Immunofluorescence analysis revealed that c-Fos expression levels in both DG and CA1 regions were significantly attenuated in the high cognitive load group compared to control conditions (Figure 4B-D). These findings suggest that excessive training demands resulting in elevated cognitive workload precipitate memory consolidation deficits.
Conversely, PAK1 expression levels in both DG and CA1 regions were substantially elevated in 4× WL groups relative to control cohorts (Figure 4E-G). Rac1 expression profiles demonstrated congruent patterns with PAK1 findings (Fig. S1D). These observations indicate that heightened cognitive load activates analogous molecular cascades to those observed under short ISI conditions, implying a convergent mechanistic pathway underlying diverse forms of memory interference.
Moreover, we explored the correlative relationship between these neurochemical markers and behavioral performance outcomes (Figure 4H). In control groups, DG PAK1 expression levels exhibited a robust negative correlation with cognitive memory performance (r = -0.84), whereas the 4× WL group demonstrated no significant correlation (r = 0.03). Within the CA1 region, control groups manifested a modest positive correlation (r = 0.34), while the 4× WL group displayed a pronounced positive correlation (r = 0.78).
Rac1 expression patterns paralleled PAK1 results across all experimental conditions (Fig. S1D-F). These findings collectively demonstrate that cognitive load fundamentally restructures the relationship between molecular signaling pathways and memory performance metrics.
3.5. Optogenetic Regulation of PV Interneurons in ISI-Induced PI
PV interneurons are known to be associated with cognitive activity. To further investigate the role of PV interneurons in ISI regulation of PI activity, we used optogenetic methods to regulate PV interneuron expression in PV-Cre mice (Figure 5A). We chose to activate PV interneurons with 1-minute activation, 1-minute intervals, at 8Hz frequency during the ISI period (Figure 5B). We selected ISI=10min conditions to regulate PV interneuron activity.
Results showed that activating PV interneurons during ISI inhibited PI's suppressive effect on new memory, while inhibiting PV interneurons did not affect behavioral performance compared to sham groups (Figure 5C, D).
Immunofluorescence results confirmed these findings. In the DG, cFos expression in Sham and Arch groups was significantly higher than in the ChR2 group. In CA1, cFos expression in the Sham group was significantly higher than in both ChR2 and Arch groups. These results indicate that PV activation modulates neuronal activity patterns during memory consolidation (Figure 5E-G).
In the DG region, PAK1 expression in the Arch group was significantly higher than in Sham and ChR2 groups, while in CA1, there were no significant differences between groups. This suggests that PV interneuron inhibition specifically affects molecular signaling in the DG but not CA1 (Figure 5H-J).
3.6. Optogenetic Regulation of PV Interneurons in Cognitive Load-Induced PI
To further investigate the role of PV interneurons in working load regulation of PI activity, we used optogenetic methods to regulate PV interneuron expression in PV-Cre mice. We selected ISI=10min conditions to manipulate working load effects on PI. We regulated PV interneurons through optogenetics between two training activities (Figure 6A).
Results showed that activating PV interneurons inhibited working load's suppressive effect on new memory, while inhibiting PV interneurons significantly reduced memory performance compared to sham groups (Figure 6B, C).
Further immunofluorescence results showed that after activating PV interneurons, there were no significant differences in cFos expression between groups in the DG, while in CA1, cFos expression in the Sham group was significantly higher than in ChR2 and Arch groups (Figure 6D-F).
In the DG region, PAK1 expression in the PV-ChR2 group was significantly lower than in Sham and Arch groups, but there was no significant difference between Sham and Arch groups. In the CA1 region, there were no significant differences in PAK1 expression between groups (Figure 6G-I).
4. Discussion
Our findings demonstrate that PI effects exhibit clear temporal specificity, with short time intervals (1-30 minutes) producing significantly stronger memory interference than long time intervals (1-4 hours). At the molecular level, excessive activation of Rac1 signaling pathways in hippocampal CA1 and DG regions underlies exacerbated memory interference under short time intervals and high cognitive load conditions. PV-positive interneurons in the DG play protective roles through enhanced pattern separation function, with optogenetic activation of these interneurons significantly improving memory performance under PI conditions. These results reveal that cognitive load fundamentally alters the relationship between molecular signaling and memory performance, suggesting coordinated regulatory mechanisms across different temporal scales.
4.1. Temporal Dynamic Characteristics of PI and Its Neural Basis
This study confirmed the time-dependent characteristics of PI effects through systematic behavioral experiments, finding that short time intervals (1-30 minutes) significantly enhance memory interference, while interference effects of long-time intervals (1-4 hours) are relatively weak. This finding provides important evidence for understanding competitive mechanisms during memory consolidation processes. The intense interference effects observed under short ISI conditions may reflect the intensity of resource competition in memory systems.
Within short time windows, previously encoded memory traces remain in active consolidation states, and encoding of new information needs to compete with these consolidating memories for limited neural resources, including protein synthesis mechanisms[27,28], synaptic plasticity-related signaling pathways[29], and attentional resources of neural networks[30]. This competition leads to decreased consolidation efficiency of new memories, manifesting as more severe PI effects.
In contrast, the reduction of PI effects under long ISI conditions is highly consistent with systems consolidation theory of memory[31,32,33]. As time progresses, early memories gradually transition from hippocampus-dependent to cortex-dependent storage, a process that releases hippocampal processing resources, creating more favorable conditions for encoding and consolidation of new memories. Our findings support the view of the hippocampus as a temporary memory store, i.e., the hippocampus plays a key role in early stages of memory formation, but its importance gradually decreases over time.
4.2. Hippocampal Regulatory Mechanisms of Rac1 Signaling Pathways in Memory Interference
Our molecular biological analysis revealed the key role of Rac1 signaling pathways in PI. The significant increase in Rac1-GTP expression in hippocampal CA1 and DG regions under short ISI and high cognitive load conditions provides important clues for understanding molecular mechanisms of memory interference.
Excessive Rac1 activation exacerbates PI through multiple mechanisms. In the CA1 region, excessive cytoskeletal remodeling leads to synaptic structural instability, preventing new information from forming lasting memory traces[34] ; Rac1-induced excessive actin polymerization causes abnormal dendritic spine changes, interfering with synaptic transmission and plasticity[35,36]; abnormal Rac1 elevation disrupts the LTP/LTD balance crucial for memory encoding and consolidation [26,37]. Excessively activated Rac1 enhances stability of certain synaptic connections, making previous memory representations more persistent and strengthening their interference with new memory formation. Under retroactive interference conditions, sustained Rac1 activation prevents normal updating and integration of new information by stabilizing established synaptic connections [38,39]. In the DG region, abnormal Rac1 activation particularly affects pattern separation function. Behavioral-molecular correlation analysis revealed complex correlation patterns between DG Rac1-GTP expression and memory performance under different conditions. When facing highly similar memory content, pattern separation function is suppressed due to excessive Rac1 activation, manifesting as disrupted sparse activation patterns of granule cells and overlapping memory representations that should remain independent[40,41,42,43].
4.3. Cumulative Effects of Cognitive Load on Memory Systems
This study confirmed significant effects of cognitive load on PI, with high load conditions (4 load accumulations) significantly exacerbating memory interference. Our results support the working memory resource depletion hypothesis. Under cumulative effects of multiple learning tasks, hippocampal information processing systems may reach their capacity limits, preventing new information from receiving adequate encoding and consolidation. This resource depletion is reflected not only at neural activity levels but also in activation states of molecular signaling pathways[44,45].
From neural network dynamics perspectives, cumulative effects of cognitive load may lead to significantly reduced information transmission efficiency in hippocampal-cortical circuits. As task complexity increases, associative networks in CA3 regions may exhibit over-connectivity, leading to abnormal enhancement of pattern completion function, making new information more likely to be incorrectly matched with existing memory patterns. Meanwhile, CA1 regions, as key nodes for hippocampal output, may face dual pressure under high load conditions: needing to process over-activated signals from CA3 while maintaining normal information exchange with entorhinal cortex[46,47,48]. The significant increase in Rac1 activity under high load conditions that we observed may reflect adaptive responses of memory systems when facing excessive cognitive demands, but this over-activation ultimately leads to exacerbated memory interference. Notably, these molecular-level changes exhibit clear regional specificity: in CA1 regions, Rac1-GTP expression shows near-linear positive correlation with task load, while in DG regions, this relationship exhibits threshold effects, i.e., Rac1 activity remains relatively stable under moderate load conditions but shows sharp increases under high load conditions.
Cumulative effects of cognitive load also exhibit unique temporal dynamic characteristics. Our data show that memory interference intensity does not have a simple linear relationship with cumulative load times, but rather exhibits staged changes. In initial 1-2 load accumulations, memory systems show certain adaptability with relatively mild interference effects; however, when load times reach 3-4, interference effects show significant enhancement, possibly reflecting critical points of memory system adaptive capacity. Molecular bases of these staged changes may relate to interactive effects of multiple intracellular signaling pathways.
4.4. Gating and Protective Mechanisms of PV Interneurons
Our optogenetic experiments revealed key protective roles of PV interneurons in DG during PI, demonstrating their adaptive gating function that adjusts inhibitory strength according to cognitive demands. The gating function of hippocampal PV interneurons exhibits high adaptability, representing a compensatory mechanism that counteracts interference effects by improving precision of inhibitory control. Activating PV interneurons significantly improved memory performance under short ISI and high cognitive load conditions through multiple mechanisms: enhancing lateral inhibition to ensure only the most relevant granule cells are activated, thereby improving neural representation specificity [24] ; implementing "winner-take-all" mechanisms to selectively inhibit weaker inputs based on minor differences in input strength, amplifying advantages of strongest inputs and helping select neuronal populations most suitable for encoding current information [61,62]; providing precise temporal coding foundations crucial for distinguishing temporally proximate memory events through rapid inhibitory dynamics[49].
Under short ISI conditions, PV interneurons serve as critical temporal gates, preventing PI occurrence when learning materials are temporally proximate. Through their rapid inhibitory kinetic characteristics, PV interneurons precisely regulate granule cell activation patterns on millisecond timescales [50], addressing the challenge of distinguishing temporally adjacent memory events [65]. When previously learned memory traces remain in active states, encoding of new information faces competition with existing activation patterns. PV interneurons effectively "clear" previously activated neuronal populations by providing precisely timed inhibitory signals, creating relatively clean neural environments for new information encoding [67]. This temporal gating mechanism depends on PV interneurons' ability to dynamically adjust strength and duration of inhibitory output based on temporal input characteristics [68]. Under short ISI conditions, inhibitory thresholds of PV interneurons may decrease, enabling significant inhibitory responses even to weak input signals.
Under high cognitive load conditions, PV interneuron mechanisms shift from temporal gating to capacity protection. When cognitive load increases and hippocampal DG information processing capacity approaches saturation[51], PV interneurons maintain network sparsity through enhanced lateral inhibition, preventing decreased processing efficiency due to over-activation [24,52]. PV interneuron activation under high cognitive load exhibits clear load-dependent characteristics: baseline activity levels gradually increase with task complexity, while responses to input signals become more sensitive [15,53]. Importantly, inhibitory output becomes not only stronger but also more selective [54,55], enabling selective inhibition of task-irrelevant neuronal populations through precise spatial inhibitory patterns, concentrating limited processing resources on the most important information encoding. This selective inhibitory mechanism may be achieved through differential connection strengths between PV interneurons and different granule cell subpopulations.
When short ISI and high cognitive load coexist, PV interneurons face dual challenges of temporal pressure and capacity limitations, requiring complex dynamic balance in functional regulation. Under these conditions, PV interneurons adopt adaptive staged regulatory strategies: prioritizing temporal gating functions through rapid and intense inhibitory pulses to clear previous activation patterns, then maintaining network sparsity via sustained lateral inhibition[24] [56]. This dual regulatory function involves differential activation of different GABA receptor types on PV interneurons - rapid GABAA receptor activation primarily responsible for temporal gating, while slower GABAB receptor activation participates in capacity protection mechanisms [57,58]. The precise spatial organization of PV interneurons in DG, forming highly ordered network structures with different positioned neurons regulating distinct granule cell populations, enables selective activation of relevant inhibitory networks to provide targeted control against PI threats [24,59,60].
4.5. Synergistic Regulatory Networks of Rac1 and PV Interneurons in Interference-Based Forgetting
Our research revealed functional interactions between Rac1 signaling pathways and PV interneurons, forming multi-level regulatory networks that coordinately regulate PI on different timescales. These synergistic regulatory mechanisms play key roles in interference-based forgetting processes, maintaining memory system stability and selectivity through precise spatiotemporal regulation. The temporal division between Rac1 and PV interneurons reflects fine regulatory strategies of memory systems. PV interneurons provide immediate inhibitory control on millisecond timescales, ensuring precision of memory encoding; while Rac1 signaling regulates memory consolidation and interference resolution on minute-to-hour timescales. This temporal separation enables memory systems to adopt different regulatory strategies at different stages, ensuring both encoding precision and long-term memory stability.
Under short ISI conditions, this temporal separation mechanism becomes particularly important. When time intervals between learning materials shorten, PV interneurons first clear previous activation patterns through rapid inhibitory pulses, creating suitable neural environments for new information encoding. Meanwhile, Rac1 signaling pathways maintain relatively stable baseline activity during this process, avoiding excessive cytoskeletal remodeling from interfering with rapid encoding processes. This temporal coordination ensures that even under temporal pressure, memory encoding can maintain high accuracy. Under high cognitive load conditions, coordination of temporal separation mechanisms becomes more complex. As cognitive load increases, rapid inhibitory function of PV interneurons may face capacity limitations. At this time, Rac1 signal activation may serve as a compensatory mechanism, supporting PV interneuron inhibitory function by regulating synaptic structural stability. This cross-timescale coordination provides memory systems with flexibility to cope with high load conditions.
Under different ISI and cognitive load conditions, Rac1-PV interneuron synergistic networks exhibit different dynamic characteristics that are closely related to degrees of interference-based forgetting. Rapid coordination under short ISI conditions: Under short ISI conditions, main characteristics of networks are rapid temporal coordination. Under these conditions, occurrence of interference-based forgetting may mainly be due to insufficient inhibitory function of PV interneurons, leading to increased crosstalk between similar memory representations.
4.6. Research Limitations and Improvement Directions
Although this study provides important new findings, some limitations exist that need improvement in future research. We primarily used novel object recognition tasks to assess PI. While this task has good repeatability and relatively simple implementation methods, it may not fully reflect memory interference mechanisms in complex human cognitive tasks. Human memory interference often involves multi-dimensional information processing including language, space, and emotion, complexities that are difficult to fully reproduce in current animal models. Our research mainly focused on hippocampal circuits, particularly DG and CA1 regions, but PI may involve broader brain networks, including prefrontal cortex, cingulate cortex, thalamus, and other regions. Interactions between these regions may play important roles in PI regulation, but were not fully explored in the current study.
5. Conclusions
This study systematically analyzed neural regulatory mechanisms of PI through integrating behavioral, molecular biological, and optogenetic methods, revealing differential regulatory roles of Rac1 signaling pathways and PV interneurons. Our main findings include: PI effects have clear time-dependent characteristics, with short time intervals and high cognitive load exacerbating memory interference through activation of hippocampal Rac1 signaling pathways, while PV interneurons in DG play protective roles through enhanced pattern separation function. These findings not only deepen our understanding of neural mechanisms of memory interference, but also provide new theoretical foundations and potential targets for treating related cognitive disorders.
More importantly, our research revealed fine regulatory strategies of memory systems on different timescales, demonstrating complex interactions between molecular signaling pathways and neural circuits. This multi-level regulatory network provides important safeguards for memory systems to maintain functional balance when facing competing information. Future research should further explore significance of these findings in more complex cognitive tasks and clinical applications to achieve effective translation from basic research to clinical treatment.
Author Contributions
Conceptualization, Y.W., C.X., J.J., and W.S.; Methodology, Y.W. and X.L.; Validation, Y.W., X.L. and Z.L.; Formal analysis, Y.W. and Z.L.; Investigation, X.L.; Resources, W.S.; Data curation, Y.W. and X.L.; Writing—original draft, Y.W. and X.L.; Writing—review & editing, X.L., Z.L. C.X., J.J., and W.S.; Visualization, Y.W.; Supervision, C.X. and W.S.; Project administration, C.X. and W.S. All authors have read and agreed to the published version of the manuscript.
Funding
This research was funded by the National Key R&D Program (2023YFC2510005) and Beijing Natural Science Foundation Key Research Project (Grant No. Z240011) and the Science and Technology Incubation Program of the 983rd Hospital of PLA (Grant Nos. 983YN23F006 and 983YN25F011).
Institutional Review Committee Statement
The animal study protocol was approved by the Biomedical Ethics Committee of Beihang University (Protocol code: BM20200045, Date of approval: April 5, 2020).
Data Availability Statement
The raw data supporting the conclusions of this article will be made available by the authors on request.
Conflicts of Interest
The authors declare no conflicts of interest.
Abbreviations
The following abbreviations are used in this manuscript:
| PI | Proactive inhibition |
| ISI | Inter-Stimulus Intervals |
| DG | dentate gyru |
| PV | parvalbumin |
| LTP | Long-term potentiation |
| LTD | Long-term depression |
References
- Schubert, T. Retroactive interference arises from semantic similarity. Nat Rev Psychol 2023, 2, 71–71. [Google Scholar] [CrossRef]
- Engle, R.W. Working Memory and Executive Attention: A Revisit. Perspect Psychol Sci 2018, 13, 190–193. [Google Scholar] [CrossRef]
- Engle, R.W. Working memory capacity as executive attention. Current Directions in Psychological Science 2002, 11, 19–23. [Google Scholar] [CrossRef]
- Son, J.J.; Killanin, A.D.; Schantell, M.; Arif, Y.; Ward, T.W.; Rempe, M.P.; Ende, G.C.; Okelberry, H.J.; Rice, D.L.; Coutant, A.T.; et al. Cognitive interference elicits developmental sex differences in inhibitory control. Dev Cogn Neurosci 2025, 74, 101590. [Google Scholar] [CrossRef]
- Paulus, M.P. Cognitive control in depression and anxiety: out of control? Curr Opin Behav Sci 2015, 1, 113–120. [Google Scholar] [CrossRef]
- Wolf, R.C.; Walter, H.; Vasic, N. Increasing Contextual Demand Modulates Anterior and Lateral Prefrontal Brain Regions Associated with Proactive Interference. Int J Neurosci 2010, 120, 40–50. [Google Scholar] [CrossRef]
- Yang, Z.; Izuma, K.; Cai, H. Nostalgia in the brain. Curr Opin Psychol 2023, 49, 101523. [Google Scholar] [CrossRef]
- Vouimba, R.-M.; Richter-Levin, G. Different patterns of amygdala priming differentially affect dentate gyrus plasticity and corticosterone, but not CA1 plasticity. Front Neural Circuits 2013, 7, 80. [Google Scholar] [CrossRef] [PubMed]
- Zandbelt, B.B.; van Buuren, M.; Kahn, R.S.; Vink, M. Reduced Proactive Inhibition in Schizophrenia Is Related to Corticostriatal Dysfunction and Poor Working Memory. Biol Psychiatry 2011, 70, 1151–1158. [Google Scholar] [CrossRef] [PubMed]
- Lashgari, R.; Motamedi, F.; Noorbakhsh, S.M.; Zahedi-Asl, S.; Komaki, A.; Shahidi, S.; Haghparast, A. Assessing the long-term role of L-type voltage dependent calcium channel blocker verapamil on short-term presynaptic plasticity at dentate gyrus of hippocampus. Neurosci Lett 2007, 415, 174–178. [Google Scholar] [CrossRef] [PubMed]
- Li, G.X.; Lv, J.; Wang, J.; Wan, P.; Li, Y.S.; Jiang, H.Y.; Jin, Q.H. GABAB receptors in the hippocampal dentate gyrus are involved in spatial learning and memory impairment in a rat model of vascular dementia. Brain Res Bull 2016, 124, 190–197. [Google Scholar] [CrossRef] [PubMed]
- Anacker, C.; Hen, R. Adult hippocampal neurogenesis and cognitive flexibility - linking memory and mood. Nat Rev Neurosci 2017, 18, 335–346. [Google Scholar] [CrossRef] [PubMed]
- Webler, R.D.; Fulton, S.; Perera, T.D.; Coplan, J.D. Maturational phase of hippocampal neurogenesis and cognitive flexibility. Neurosci Lett 2019, 711, 134414. [Google Scholar] [CrossRef] [PubMed]
- Berdugo-Vega, G.; Lee, C.C.; Garthe, A.; Kempermann, G.; Calegari, F. Adult-born neurons promote cognitive flexibility by improving memory precision and indexing. Hippocampus 2021, 31, 1068–1079. [Google Scholar] [CrossRef]
- Roux, L.; Buzsáki, G. Tasks for inhibitory interneurons in intact brain circuits. Neuropharmacology 2015, 88, 10–23. [Google Scholar] [CrossRef]
- Kepecs, A.; Fishell, G. Interneuron cell types are fit to function. Nature 2014, 505, 318–326. [Google Scholar] [CrossRef]
- Lv, L.; Liu, Y.L.; Xie, J.X.; Wu, Y.; Zhao, J.J.; Li, Q.; Zhong, Y. Interplay between α2-chimaerin and Rac1 activity determines dynamic maintenance of long-term memory. Nat Commun 2019, 10, 5313. [Google Scholar] [CrossRef]
- Kim, J.; Bustamante, E.; Sotonyi, P.; Maxwell, N.; Parameswaran, P.; Kent, J.K.; Wetsel, W.C.; Soderblom, E.J.; Rácz, B.; Soderling, S.H. Presynaptic Rac1 in the hippocampus selectively regulates working memory. Elife 2024, 13. [Google Scholar] [CrossRef]
- Costa, J.F.; Dines, M.; Lamprecht, R. The Role of Rac GTPase in Dendritic Spine Morphogenesis and Memory. Front Synaptic Neurosci 2020, 12, 12. [Google Scholar] [CrossRef]
- Zhang, H.R.; Ben Zablah, Y.; Zhang, H.W.; Jia, Z.P. Rho Signaling in Synaptic Plasticity, Memory, and Brain Disorders. Front Cell Dev Biol 2021, 9, 729076. [Google Scholar] [CrossRef]
- Guo, D.J.; Yang, X.M.; Shi, L. Rho GTPase Regulators and Effectors in Autism Spectrum Disorders: Animal Models and Insights for Therapeutics. Cells 2020, 9. [Google Scholar] [CrossRef] [PubMed]
- Wu, W.J.; Du, S.W.; Shi, W.; Liu, Y.L.; Hu, Y.; Xie, Z.L.; Yao, X.S.; Liu, Z.Y.; Ma, W.W.; Xu, L.; et al. Inhibition of Rac1-dependent forgetting alleviates memory deficits in animal models of Alzheimer's disease. Protein Cell 2019, 10, 745–759. [Google Scholar] [CrossRef] [PubMed]
- Dalto, J.F.; Medina, J.H. Time-dependent inhibition of Rac1 in the VTA enhances long-term aversive memory: implications in active forgetting mechanisms. Sci Rep 2023, 13, 13507. [Google Scholar] [CrossRef] [PubMed]
- Espinoza, C.; Guzman, S.J.; Zhang, X.M.; Jonas, P. Parvalbumin+ interneurons obey unique connectivity rules and establish a powerful lateral-inhibition microcircuit in dentate gyrus. Nat Commun 2018, 9, 4605. [Google Scholar] [CrossRef]
- Zhang, H.W.; Ben Zablah, Y.; Zhang, H.R.; Liu, A.; Gugustea, R.; Lee, D.J.; Luo, X.; Meng, Y.H.; Li, S.; Zhou, C.X.; et al. Inhibition of Rac1 in ventral hippocampal excitatory neurons improves social recognition memory and synaptic plasticity. Front Aging Neurosci 2022, 14, 914491. [Google Scholar] [CrossRef]
- Liu, Y.L.; Du, S.W.; Lv, L.; Lei, B.; Shi, W.; Tang, Y.K.; Wang, L.Z.; Zhong, Y. Hippocampal Activation of Rac1 Regulates the Forgetting of Object Recognition Memory. Curr Biol 2016, 26, 2351–2357. [Google Scholar] [CrossRef]
- Alberini, C.M. Mechanisms of memory stabilization: are consolidation and reconsolidation similar or distinct processes? Trends Neurosci 2005, 28, 51–56. [Google Scholar] [CrossRef]
- Sekeres, M.J.; Moscovitch, M.; Winocur, G. Mechanisms of Memory Consolidation and Transformation. In Cognitive Neuroscience of Memory Consolidation; Axmacher, N., Rasch, B., Eds.; Studies in Neuroscience, Psychology and Behavioral Economics; Springer International Publishing: Cham, Switzerland, 2017; pp. 17–44. [Google Scholar]
- Lamprecht, R.; LeDoux, J. Structural plasticity and memory. Nat Rev Neurosci 2004, 5, 45–54. [Google Scholar] [CrossRef]
- Carpenter, G.A.; Grossberg, S. Neural Dynamics of Category Learning and Recognition: Attention, Memory Consolidation, and Amnesia. In The Adaptive Brain I - Cognition, Learning, Reinforcement, and Rhythm, Grossberg, S., Ed.; Advances in Psychology; North-Holland: 1987; Volume 42, pp. 239-286.
- Tonegawa, S.; Morrissey, M.D.; Kitamura, T. The role of engram cells in the systems consolidation of memory. Nat Rev Neurosci 2018, 19, 485–498. [Google Scholar]
- Anderson, M.C. Rethinking interference theory: Executive control and the mechanisms of forgetting. J MEM LANG 2003, 49, 415–445. [Google Scholar] [CrossRef]
- Costanzi, M.; Saraulli, D.; Rossi-Arnaud, C.; Aceti, M.; Cestari, V. Memory Impairment Induced by an Interfering Task Is Reverted by Pre-Frontal Cortex Lesions: A Possible Role for an Inhibitory Process in Memory Suppression in Mice. Neuroscience 2009, 158, 503–513. [Google Scholar] [CrossRef] [PubMed]
- Mednick, S.C.; Cai, D.J.; Shuman, T.; Anagnostaras, S.; Wixted, J.T. An opportunistic theory of cellular and systems consolidation. Trends Neurosci 2011, 34, 504–514. [Google Scholar] [CrossRef] [PubMed]
- Frausto-Del-Río, D.; Soto-Cruz, I.; Garay-Canales, C.; Ambriz, X.; Soldevila, G.; Carretero-Ortega, J.; Vázquez-Prado, J.; Ortega, E. Interferon gamma induces actin polymerization, Rac1 activation and down regulates phagocytosis in human monocytic cells. Cytokine 2012, 57, 158–168. [Google Scholar] [CrossRef] [PubMed]
- Hanna, S.J.; McCoy-Simandle, K.; Miskolci, V.; Guo, P.; Cammer, M.; Hodgson, L.; Cox, D. The Role of Rho-GTPases and actin polymerization during Macrophage Tunneling Nanotube Biogenesis. Sci Rep 2017, 7, 8547. [Google Scholar] [CrossRef]
- Liu, Y.L.; Lv, L.; Wang, L.Z.; Zhong, Y. Social Isolation Induces Rac1-Dependent Forgetting of Social Memory. Cell Rep 2018, 25, 288–295. [Google Scholar] [CrossRef]
- Shuai, Y.C.; Lu, B.Y.; Hu, Y.; Wang, L.Z.; Sun, K.; Zhong, Y. Forgetting is regulated through Rac activity in Drosophila. Cell 2010, 140, 579–589. [Google Scholar] [CrossRef]
- Davis, R.L.; Zhong, Y. The Biology of Forgetting-A Perspective. Neuron 2017, 95, 490–503. [Google Scholar] [CrossRef]
- GoodSmith, D.; Chen, X.J.; Wang, C.; Kim, S.H.; Song, H.J.; Burgalossi, A.; Christian, K.M.; Knierim, J.J. Spatial Representations of Granule Cells and Mossy Cells of the Dentate Gyrus. Neuron 2017, 93, 677–690. [Google Scholar] [CrossRef]
- Lopez-Rojas, J.; Kreutz, M.R. Mature granule cells of the dentate gyrus-Passive bystanders or principal performers in hippocampal function? Neurosci Biobehav Rev 2016, 64, 167–174. [Google Scholar] [CrossRef]
- Santoro, A. Reassessing pattern separation in the dentate gyrus. Front Behav Neurosci 2013, 7, 96. [Google Scholar] [CrossRef]
- Schmidt, B.; Marrone, D.F.; Markus, E.J. Disambiguating the similar: The dentate gyrus and pattern separation. Behav Brain Res 2012, 226, 56–65. [Google Scholar] [CrossRef]
- Chen, O.H.; Castro-Alonso, J.C.; Paas, F.; Sweller, J. Extending Cognitive Load Theory to Incorporate Working Memory Resource Depletion: Evidence from the Spacing Effect. Educ Psychol Rev 2018, 30, 483–501. [Google Scholar] [CrossRef]
- Cheie, L.; MacLeod, C.; Miclea, M.; Visu-Petra, L. When children forget to remember: Effects of reduced working memory availability on prospective memory performance. Mem Cognit 2017, 45, 651–663. [Google Scholar] [CrossRef] [PubMed]
- Guzowski, J.F.; Knierim, J.J.; Moser, E.I. Ensemble dynamics of hippocampal regions CA3 and CA1. Neuron 2004, 44, 581–584. [Google Scholar] [CrossRef] [PubMed]
- Rebola, N.; Carta, M.; Mulle, C. Operation and plasticity of hippocampal CA3 circuits: implications for memory encoding. Nat Rev Neurosci 2017, 18, 209–221. [Google Scholar] [CrossRef]
- Soltesz, I.; Losonczy, A. CA1 pyramidal cell diversity enabling parallel information processing in the hippocampus. Nat Neurosci 2018, 21, 484–493. [Google Scholar] [CrossRef]
- Ognjanovski, N.; Schaeffer, S.; Wu, J.; Mofakham, S.; Maruyama, D.; Zochowski, M.; Aton, S.J. Parvalbumin-expressing interneurons coordinate hippocampal network dynamics required for memory consolidation. Nat Commun 2017, 8, 15039. [Google Scholar] [CrossRef]
- Eichenbaum, H.; Komorowski, R.; MacDonald, C.J.; Kraus, B.J.; Robitsek, J. How Does the Hippocampus Support the Spatial and Temporal Attributes of Memory? In The Neurobiological Basis of Memory; Jackson, P.A., Chiba, A.A., Berman, R.F., Ragozzino, M.E., Eds.; Springer International Publishing: Cham, Switzerland, 2016; pp. 39–57. [Google Scholar]
- Murray, A.J.; Woloszynowska-Fraser, M.U.; Ansel-Bollepalli, L.; Cole, K.L.H.; Foggetti, A.; Crouch, B.; Riedel, G.; Wulff, P. Parvalbumin-positive interneurons of the prefrontal cortex support working memory and cognitive flexibility. Sci Rep 2015, 5, 16778. [Google Scholar] [CrossRef]
- Buetfering, C.; Allen, K.; Monyer, H. Parvalbumin interneurons provide grid cell-driven recurrent inhibition in the medial entorhinal cortex. Nat Neurosci 2014, 17, 710–718. [Google Scholar] [CrossRef]
- Carlén M,; Meletis K,; Siegle JH,; et al. A critical role for NMDA receptors in parvalbumin interneurons for gamma rhythm induction and behavior. Mol Psychiatry 2012, 17, 537–548. [Google Scholar] [CrossRef]
- Lu, J.T.; Tucciarone, J.; Padilla-Coreano, N.; He, M.; Gordon, J.A.; Huang, Z.J. Selective inhibitory control of pyramidal neuron ensembles and cortical subnetworks by chandelier cells. Nat Neurosci 2017, 20, 1377–1383. [Google Scholar] [CrossRef] [PubMed]
- Chen, C.C.; Lu, J.; Yang, R.; Ding, J.B.; Zuo, Y. Selective activation of parvalbumin interneurons prevents stress-induced synapse loss and perceptual defects. Molecular Psychiatry 2018, 23, 1614–1625. [Google Scholar] [CrossRef] [PubMed]
- Cardin, J.A. Inhibitory Interneurons Regulate Temporal Precision and Correlations in Cortical Circuits. Trends Neurosci 2018, 41, 689–700. [Google Scholar] [CrossRef] [PubMed]
- Milenkovic, I.; Vasiljevic, M.; Maurer, D.; Höger, H.; Klausberger, T.; Sieghart, W. The parvalbumin-positive interneurons in the mouse dentate gyrus express GABAA receptor subunits alpha1, beta2, and delta along their extrasynaptic cell membrane. Neuroscience 2013, 254, 80–96. [Google Scholar] [CrossRef]
- Lafourcade CA,; Alger BE. Distinctions among GABAA and GABAB responses revealed by calcium channel antagonists, cannabinoids, opioids, and synaptic plasticity in rat hippocampus. Psychopharmacology (Berl) 2008, 198, 539–549. [CrossRef]
- Houser, C.R. Interneurons of the dentate gyrus: an overview of cell types, terminal fields and neurochemical identity. Prog Brain Res 2007, 163, 217–232. [Google Scholar]
- Wittner, L.; Maglóczky, Z.; Borhegyi, Z.; Halász, P.; Tóth, S.; Eröss, L.; Szabó, Z.; Freund, T.F. Preservation of perisomatic inhibitory input of granule cells in the epileptic human dentate gyrus. Neuroscience 2001, 108, 587–600. [Google Scholar] [CrossRef]
Figure 1.
Effects of different ISI on PI. (A) Schematic of ISI training protocol. Mice first explored two identical PI objects, followed by replacement of one PI object with a target object at different ISIs (1, 5, 10, 30 min or 1, 2, 4 h). After 24 h, mice were tested with the target object and a novel test object. Control group skipped the initial PI learning phase. (B) Discrimination indices across different ISI conditions. Short ISI groups (1-30 min) showed significantly reduced memory performance compared to control and long ISI groups (1-4 h). Mice = 12 for each group. (C) Summary comparison of ISI groups. Short ISI group (ISI-S, 1-30 min) showed significant memory impairment compared to control and long ISI (ISI-L, 1-4 h) groups. Control group mice = 12, Short ISI group mice = 36, Long ISI group mice = 36. One-Way ANOVE with Tukey’s multiple comparisons post hoc tests. Data are presented as ±SEM. Data presented as mean ± SEM; *P < 0.05, and ***P < 0.001, ns = not significant.
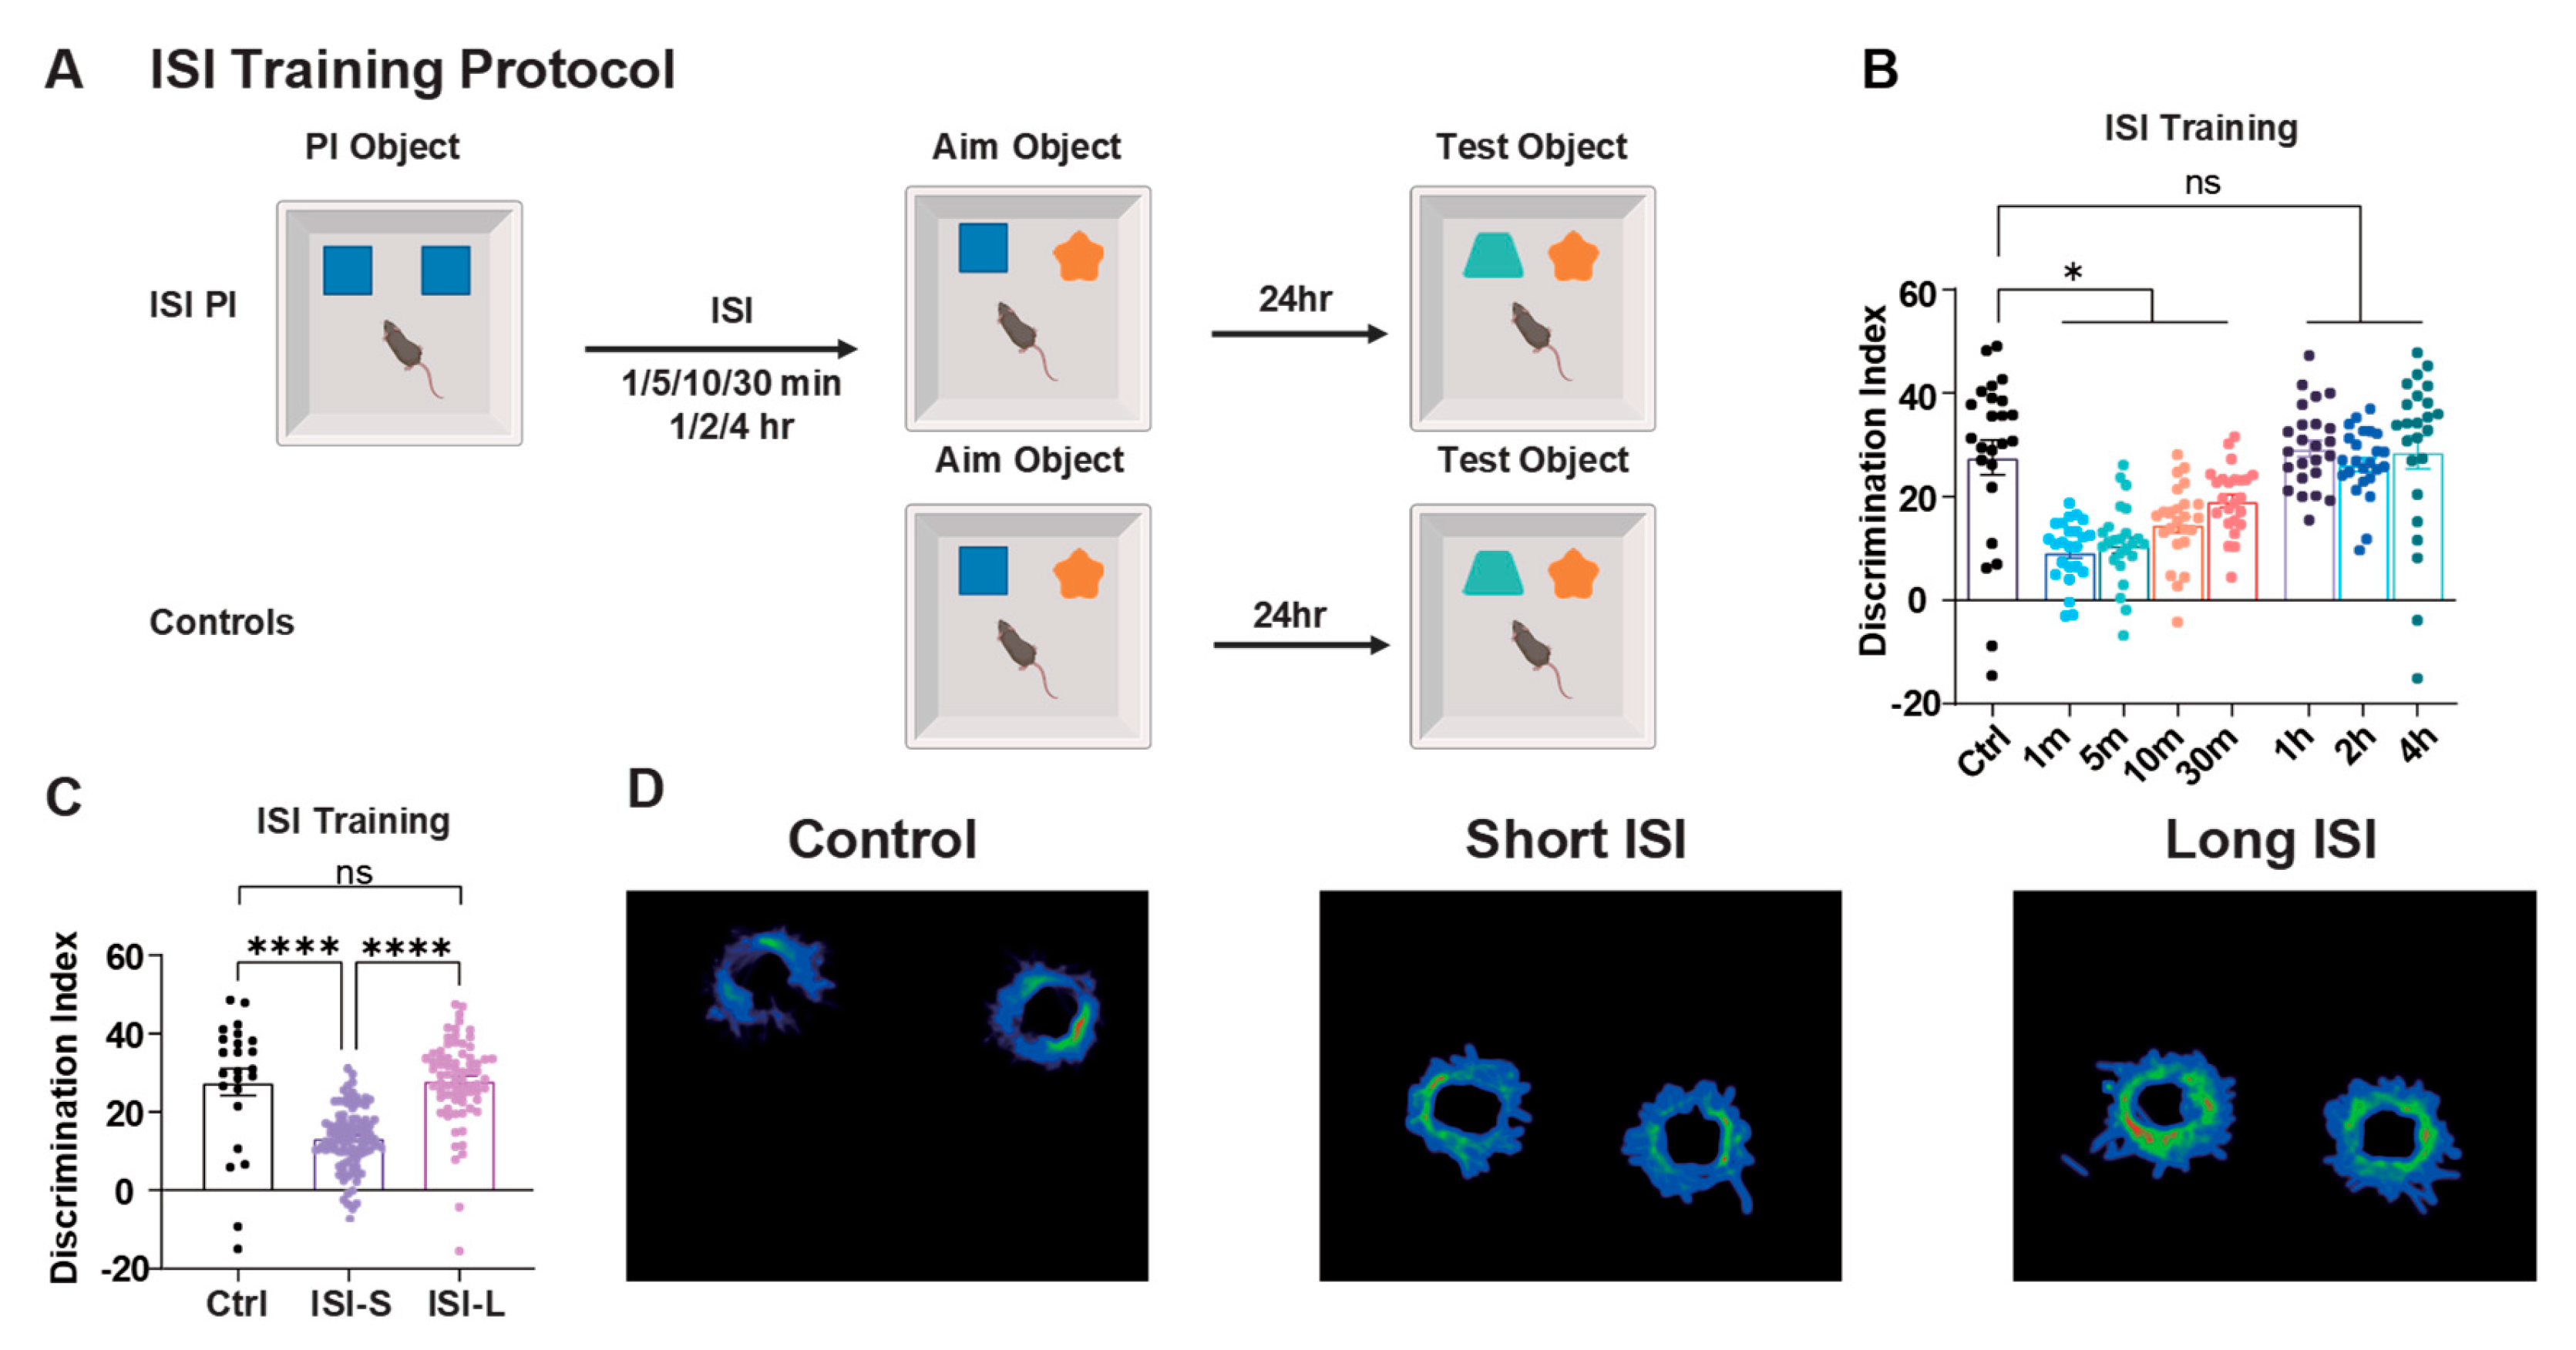
Figure 2.
Effects of different cognitive load on PI. (A) Representative movement tracking trajectories of animals under different ISI conditions showing exploration patterns of control, short ISI, and long ISI groups. (B) Cognitive load training protocol. Mice underwent 1-4 cognitive load accumulations (1x-4x Load), with object replacements every 10 min. Target object was introduced 1 h after final load, followed by testing at 24 h. (C) Discrimination indices under different cognitive loads. Memory performance decreased progressively with increasing load; 4x load group showed significant impairment. 12 mice for each group. (D) Representative movement tracking trajectories under different working load conditions showing exploration patterns across load groups. Mice = 12 for each group. One-Way ANOVE with Tukey’s multiple comparisons post hoc tests. Data are presented as ±SEM. Data presented as mean ± SEM; *P < 0.05, and ***P < 0.001, ns = not significant.
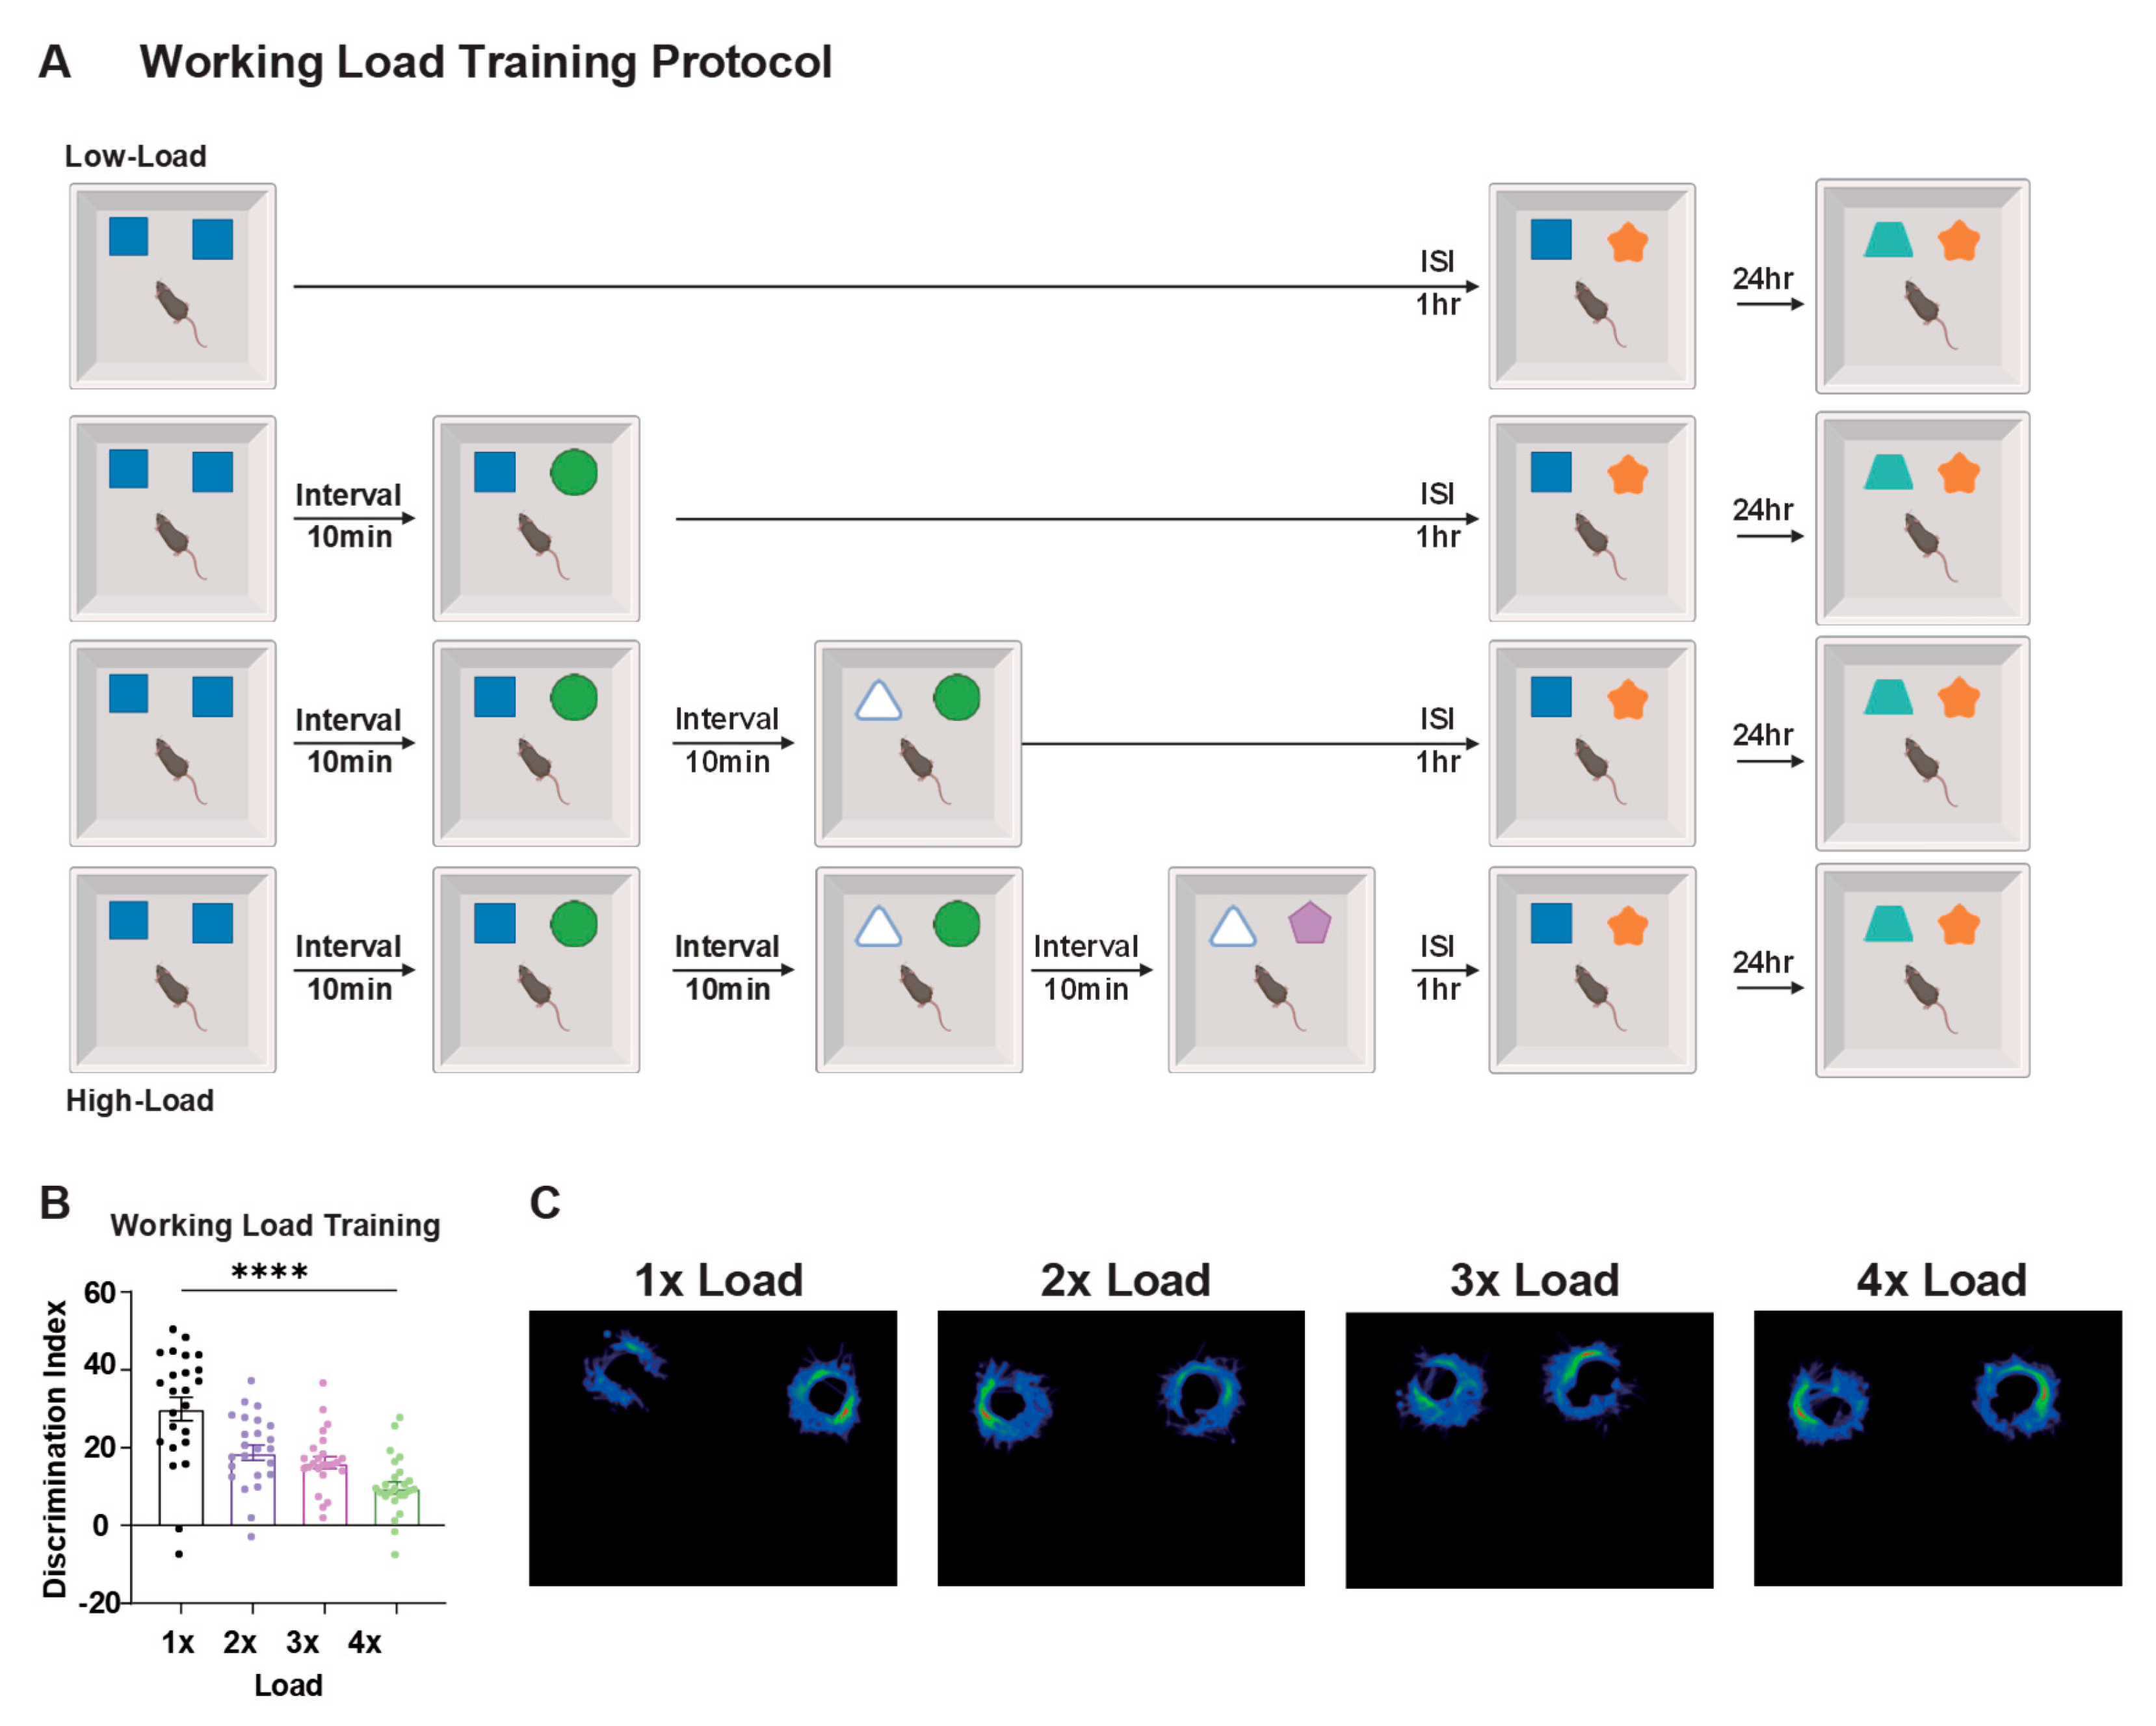
Figure 3.
Role of hippocampal cFos and PAK1 expression in ISI-mediated PI. (A) Experimental protocol for molecular marker detection. Mice underwent PI training and target object learning separated by designated ISI periods (10 min or 4 h), followed by perfusion at 24 h post-training for immunofluorescence analysis. (B) Representative immunofluorescence micrographs depicting c-Fos expression patterns in DG (left panel) and CA1 (right panel) subregions. Scale bar: 100 μm. (C) Quantitative analysis of DG c-Fos expression levels. Both short-term ISI (ISI-S) and long-term ISI (ISI-L) protocols resulted in markedly reduced c-Fos immunoreactivity within the DG region, with no statistically significant difference detected between ISI-S and ISI-L conditions, whereas untrained home cage control animals exhibited no significant alterations. (D) Quantitative assessment of CA1 c-Fos expression. Both ISI-S and ISI-L paradigms elicited diminished c-Fos expression in the CA1 region, demonstrating comparable reduction patterns between temporal conditions, while home cage controls remained unchanged relative to baseline levels. (E) Representative immunofluorescence images illustrating PAK1 expression distribution in DG (left panel) and CA1 (right panel) hippocampal subfields. Scale bar: 100 μm. (F) Quantitative evaluation of DG PAK1 expression. ISI-S conditions induced significant upregulation of PAK1 immunoreactivity in the DG region, whereas no substantial differences were detected between control and ISI-L experimental groups. Untrained home cage animals demonstrated no significant fluctuations from baseline expression levels. (G) Quantitative analysis of CA1 PAK1 expression patterns. ISI-S treatment resulted in enhanced PAK1 expression within the CA1 region, while control and ISI-L groups exhibited comparable expression profiles. Home cage controls maintained stable expression levels throughout the experimental timeline. (H) Experimental paradigm for behavior-molecular correlation analysis. Brain tissue specimens were harvested 2 h post-behavioral testing to establish correlations with memory performance indices. (I) Correlation analysis between DG PAK1 expression and discrimination index performance. Control groups demonstrated negative correlation patterns, whereas ISI treatment groups exhibited positive correlational relationships. (J) Correlation assessment between CA1 PAK1 expression and discrimination index, revealing ISI-dependent correlation dynamics. Sample sizes: (A)-(G): Home cage group n = 4, Control group n = 6, Short ISI group n = 6, Long ISI group n = 6. (H)-(J): Control group n = 6, Short ISI group n = 6, Long ISI group n = 6. Statistical analysis performed using One-Way ANOVA with Tukey’s multiple comparisons post hoc comparisons. Data are presented as mean ± SEM. Significance levels: *P < 0.05, **P < 0.01, ***P < 0.001, ns = not significant.
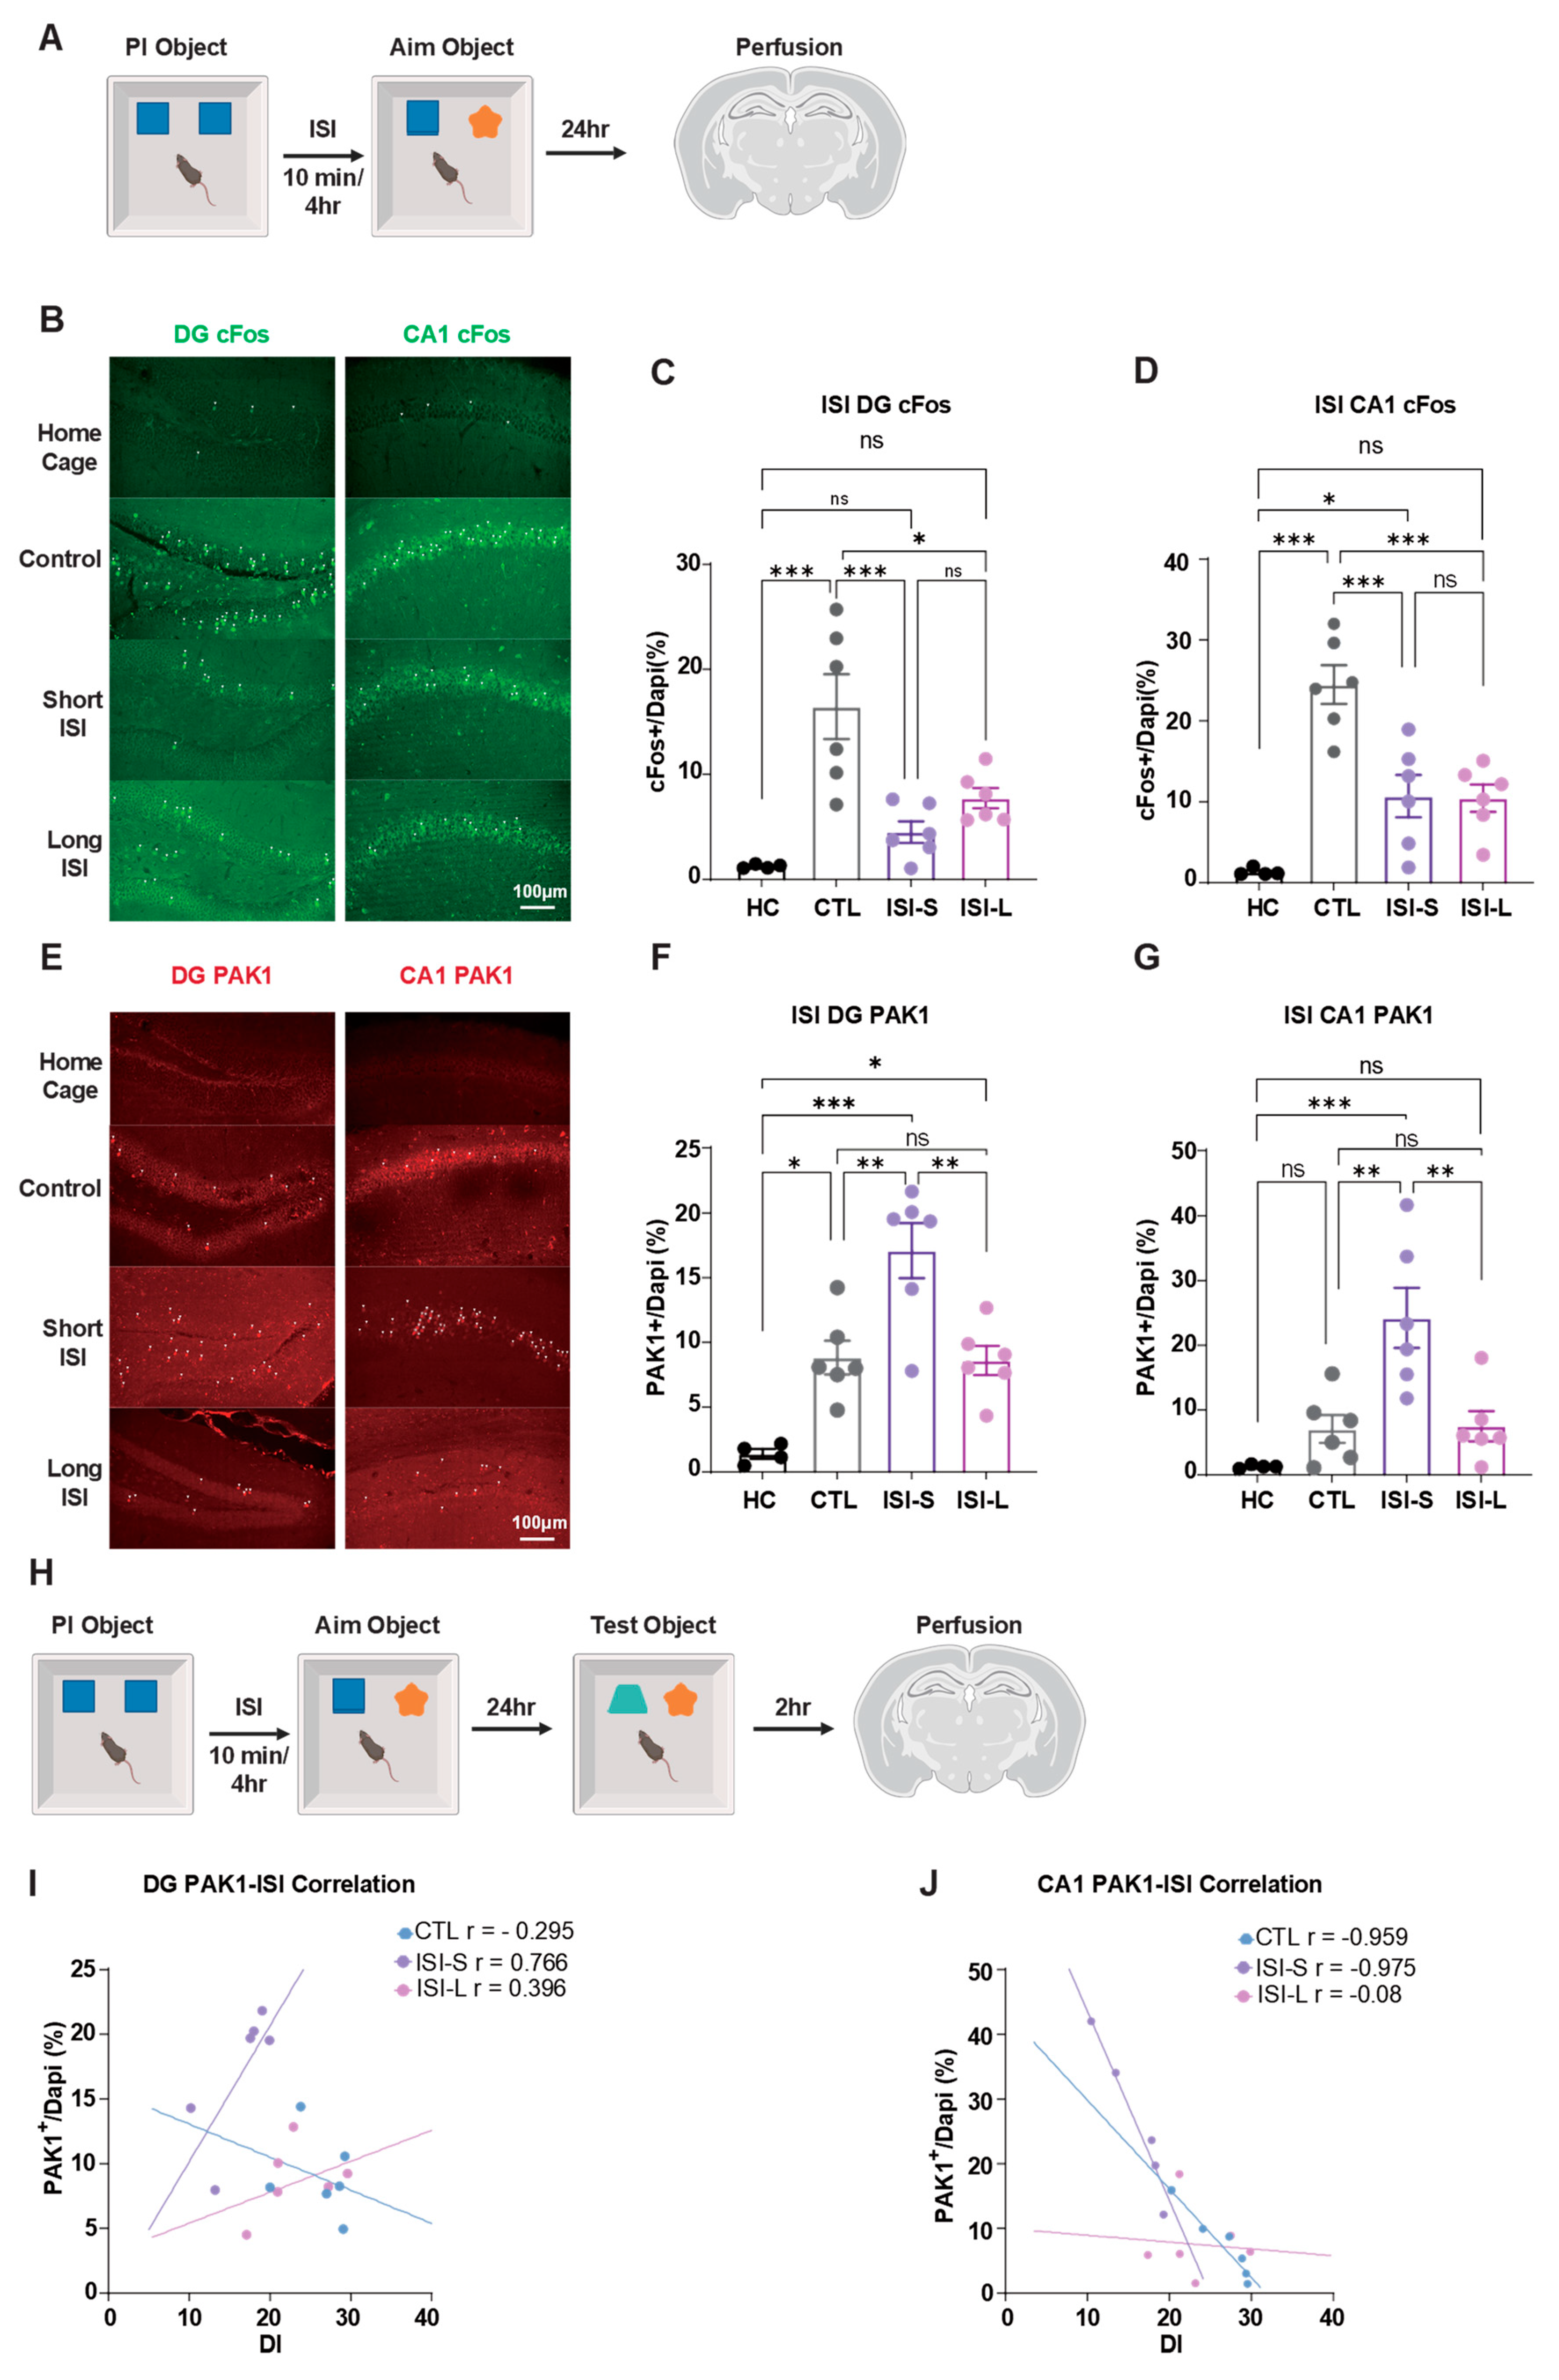
Figure 4.
Effects of cognitive load on hippocampal cFos and PAK1 expression and PI. (A) Quadruple cognitive load experimental paradigm. Sequential object replacement protocols established high cognitive workload conditions, followed by perfusion at 24 h post-training for molecular characterization. (B) Representative immunofluorescence micrographs of c-Fos expression distribution in DG (left panel) and CA1 (right panel) hippocampal subregions. Scale bar: 100 μm. (C) Quantitative assessment of DG c-Fos expression. Control cohorts demonstrated significantly elevated expression levels compared to cognitive workload groups, while untrained home cage animals exhibited no substantial alterations. (D) Quantitative evaluation of CA1 c-Fos expression. Control groups manifested significantly higher expression relative to workload conditions, whereas home cage controls showed no appreciable changes. (E) Representative immunofluorescence images depicting PAK1 expression patterns in DG (left panel) and CA1 (right panel) hippocampal regions. Scale bar: 100 μm. (F) Quantitative analysis of DG PAK1 expression. Cognitive workload groups exhibited markedly increased expression compared to control conditions, while home cage animals displayed no significant fluctuations. (G) Quantitative assessment of CA1 PAK1 expression. Workload groups demonstrated substantially elevated expression relative to control cohorts, whereas home cage controls remained unchanged. (H) Experimental protocol for behavior-molecular correlation analysis under cognitive load manipulations. (I) DG PAK1 expression exhibited negative correlation with memory performance in control conditions but demonstrated positive correlation under workload paradigms. (J) CA1 PAK1 expression showed negligible correlation in control groups but positive correlation under cognitive workload conditions. Sample sizes: Home cage group n = 4, Control group n = 6, Cognitive workload group n = 6. Statistical analysis conducted using One-Way ANOVA with Tukey’s multiple comparisons post hoc comparisons. Data are presented as mean ± SEM. Significance levels: *P < 0.05, **P < 0.01, ***P < 0.001, ns = not significant.
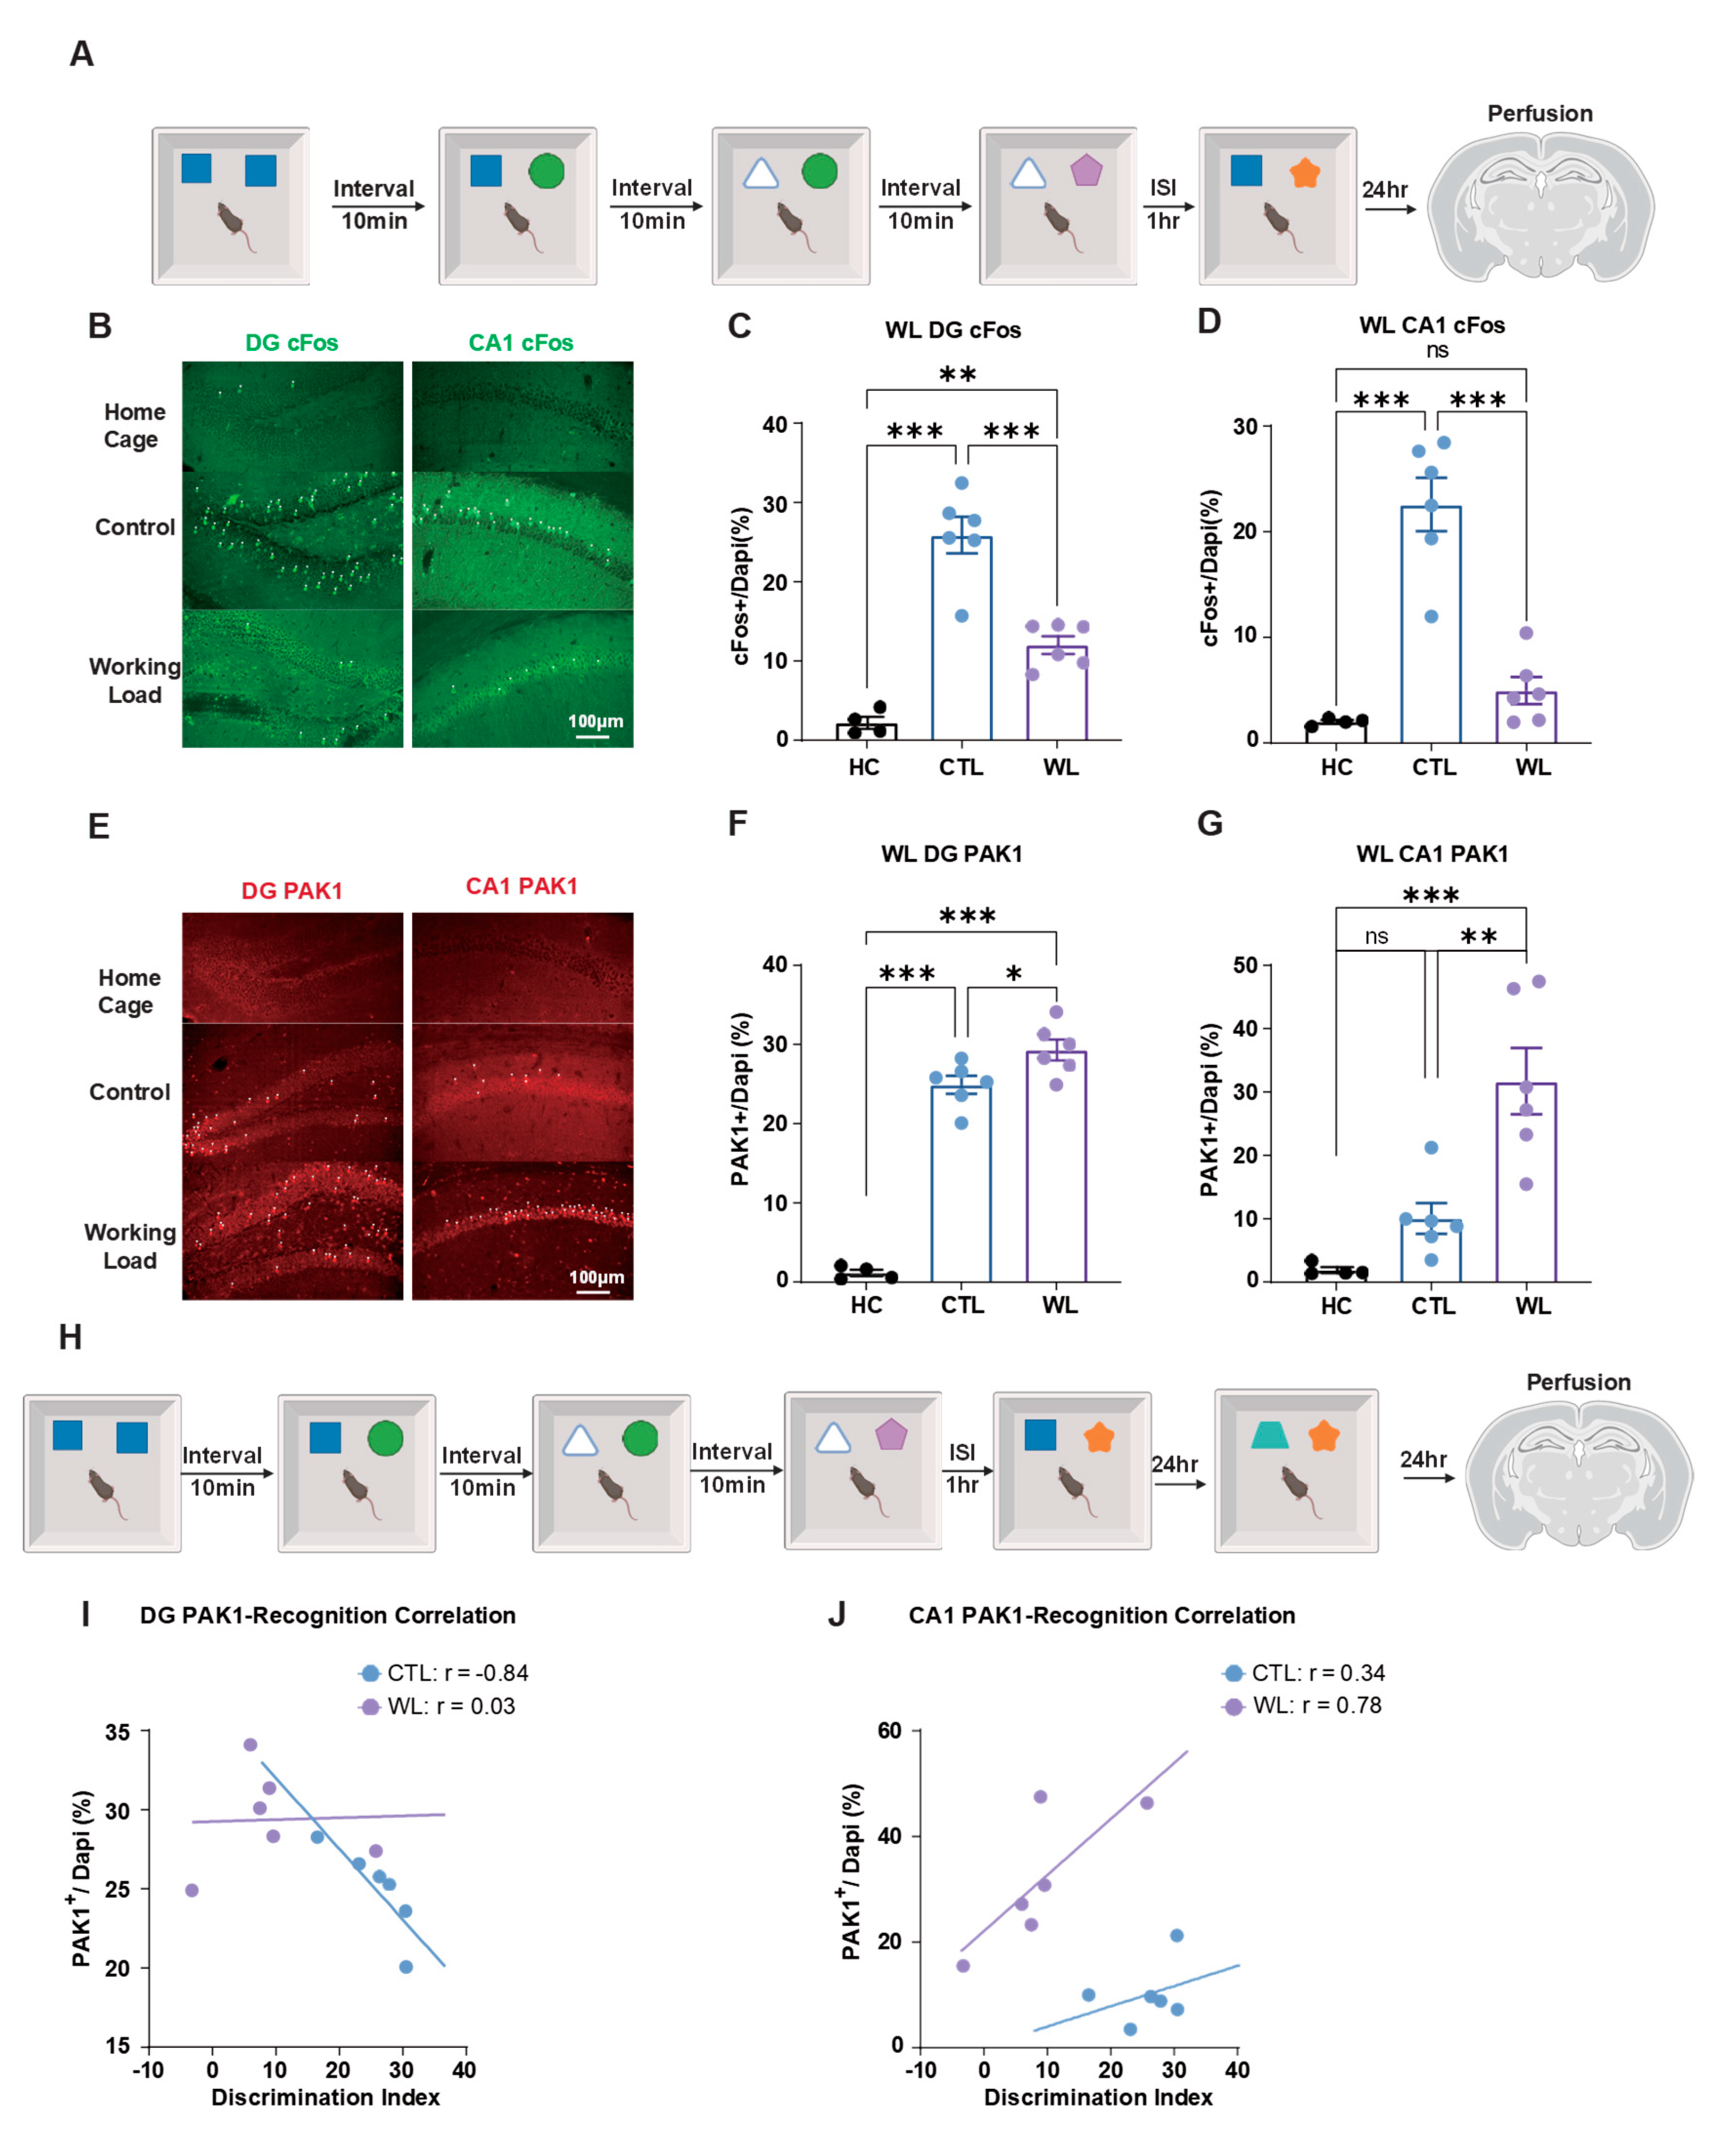
Figure 5.
Optogenetic regulation of PV interneurons in ISI-induced PI. (A) Viral constructs for optogenetic manipulation in PV-Cre mice. AAV2/9-DIO-ChR2-tdTomato for activation, AAV2/9-DIO-ArchT-EGFP for inhibition, and AAV2/9-DIO-tdTomato as control. (B) Optogenetic stimulation protocol. Light stimulation (473 nm for ChR2, 532 nm for ArchT) applied during 10 min ISI between learning phases, using 1-min 8Hz stimulation with 1-min intervals for 5 cycles. (C) Behavioral results. PV-ChR2 group showed improved memory performance compared to sham group, while PV-ArchT group showed no significant difference. (D) Representative movement tracking trajectories during test phase after PV modulation, showing exploration patterns of different treatment groups. (E) Representative immunofluorescence images of cFos expression in DG (left panel) and CA1 (right panel) regions. Scale bar: 100 μm. (F) Quantification of DG cFos expression. After activating PV interneurons in DG, ChR2 group showed significantly lower cFos expression than Sham and Arch groups, with no significant difference between Sham and Arch groups. (G) Quantification of CA1 cFos expression. After modulating PV interneurons in DG, Sham group showed significantly higher cFos expression than ChR2 and Arch groups, with no significant difference between ChR2 and Arch groups. (H) Representative immunofluorescence images of PAK1 expression in DG (left panel) and CA1 (right panel) regions. Scale bar: 100 μm. (I) Quantification of DG PAK1 expression. After inhibiting PV interneurons in DG, Arch group showed significantly higher PAK1 expression than Sham and ChR2 groups, with no significant difference between Sham and ChR2 groups. (J) Quantification of CA1 PAK1 expression. After modulating PV interneurons in DG, no significant differences in PAK1 expression were observed between groups in CA1. Sham group mice = 4, ChR2 group mice = 5, Arch group mice = 5. One-Way ANOVE with Tukey’s multiple comparisons post hoc tests. Data are presented as ±SEM. Data presented as mean ± SEM; *P < 0.05, **P < 0.01, and ***P < 0.001, ns = not significant. Scale bar: 100 μm.
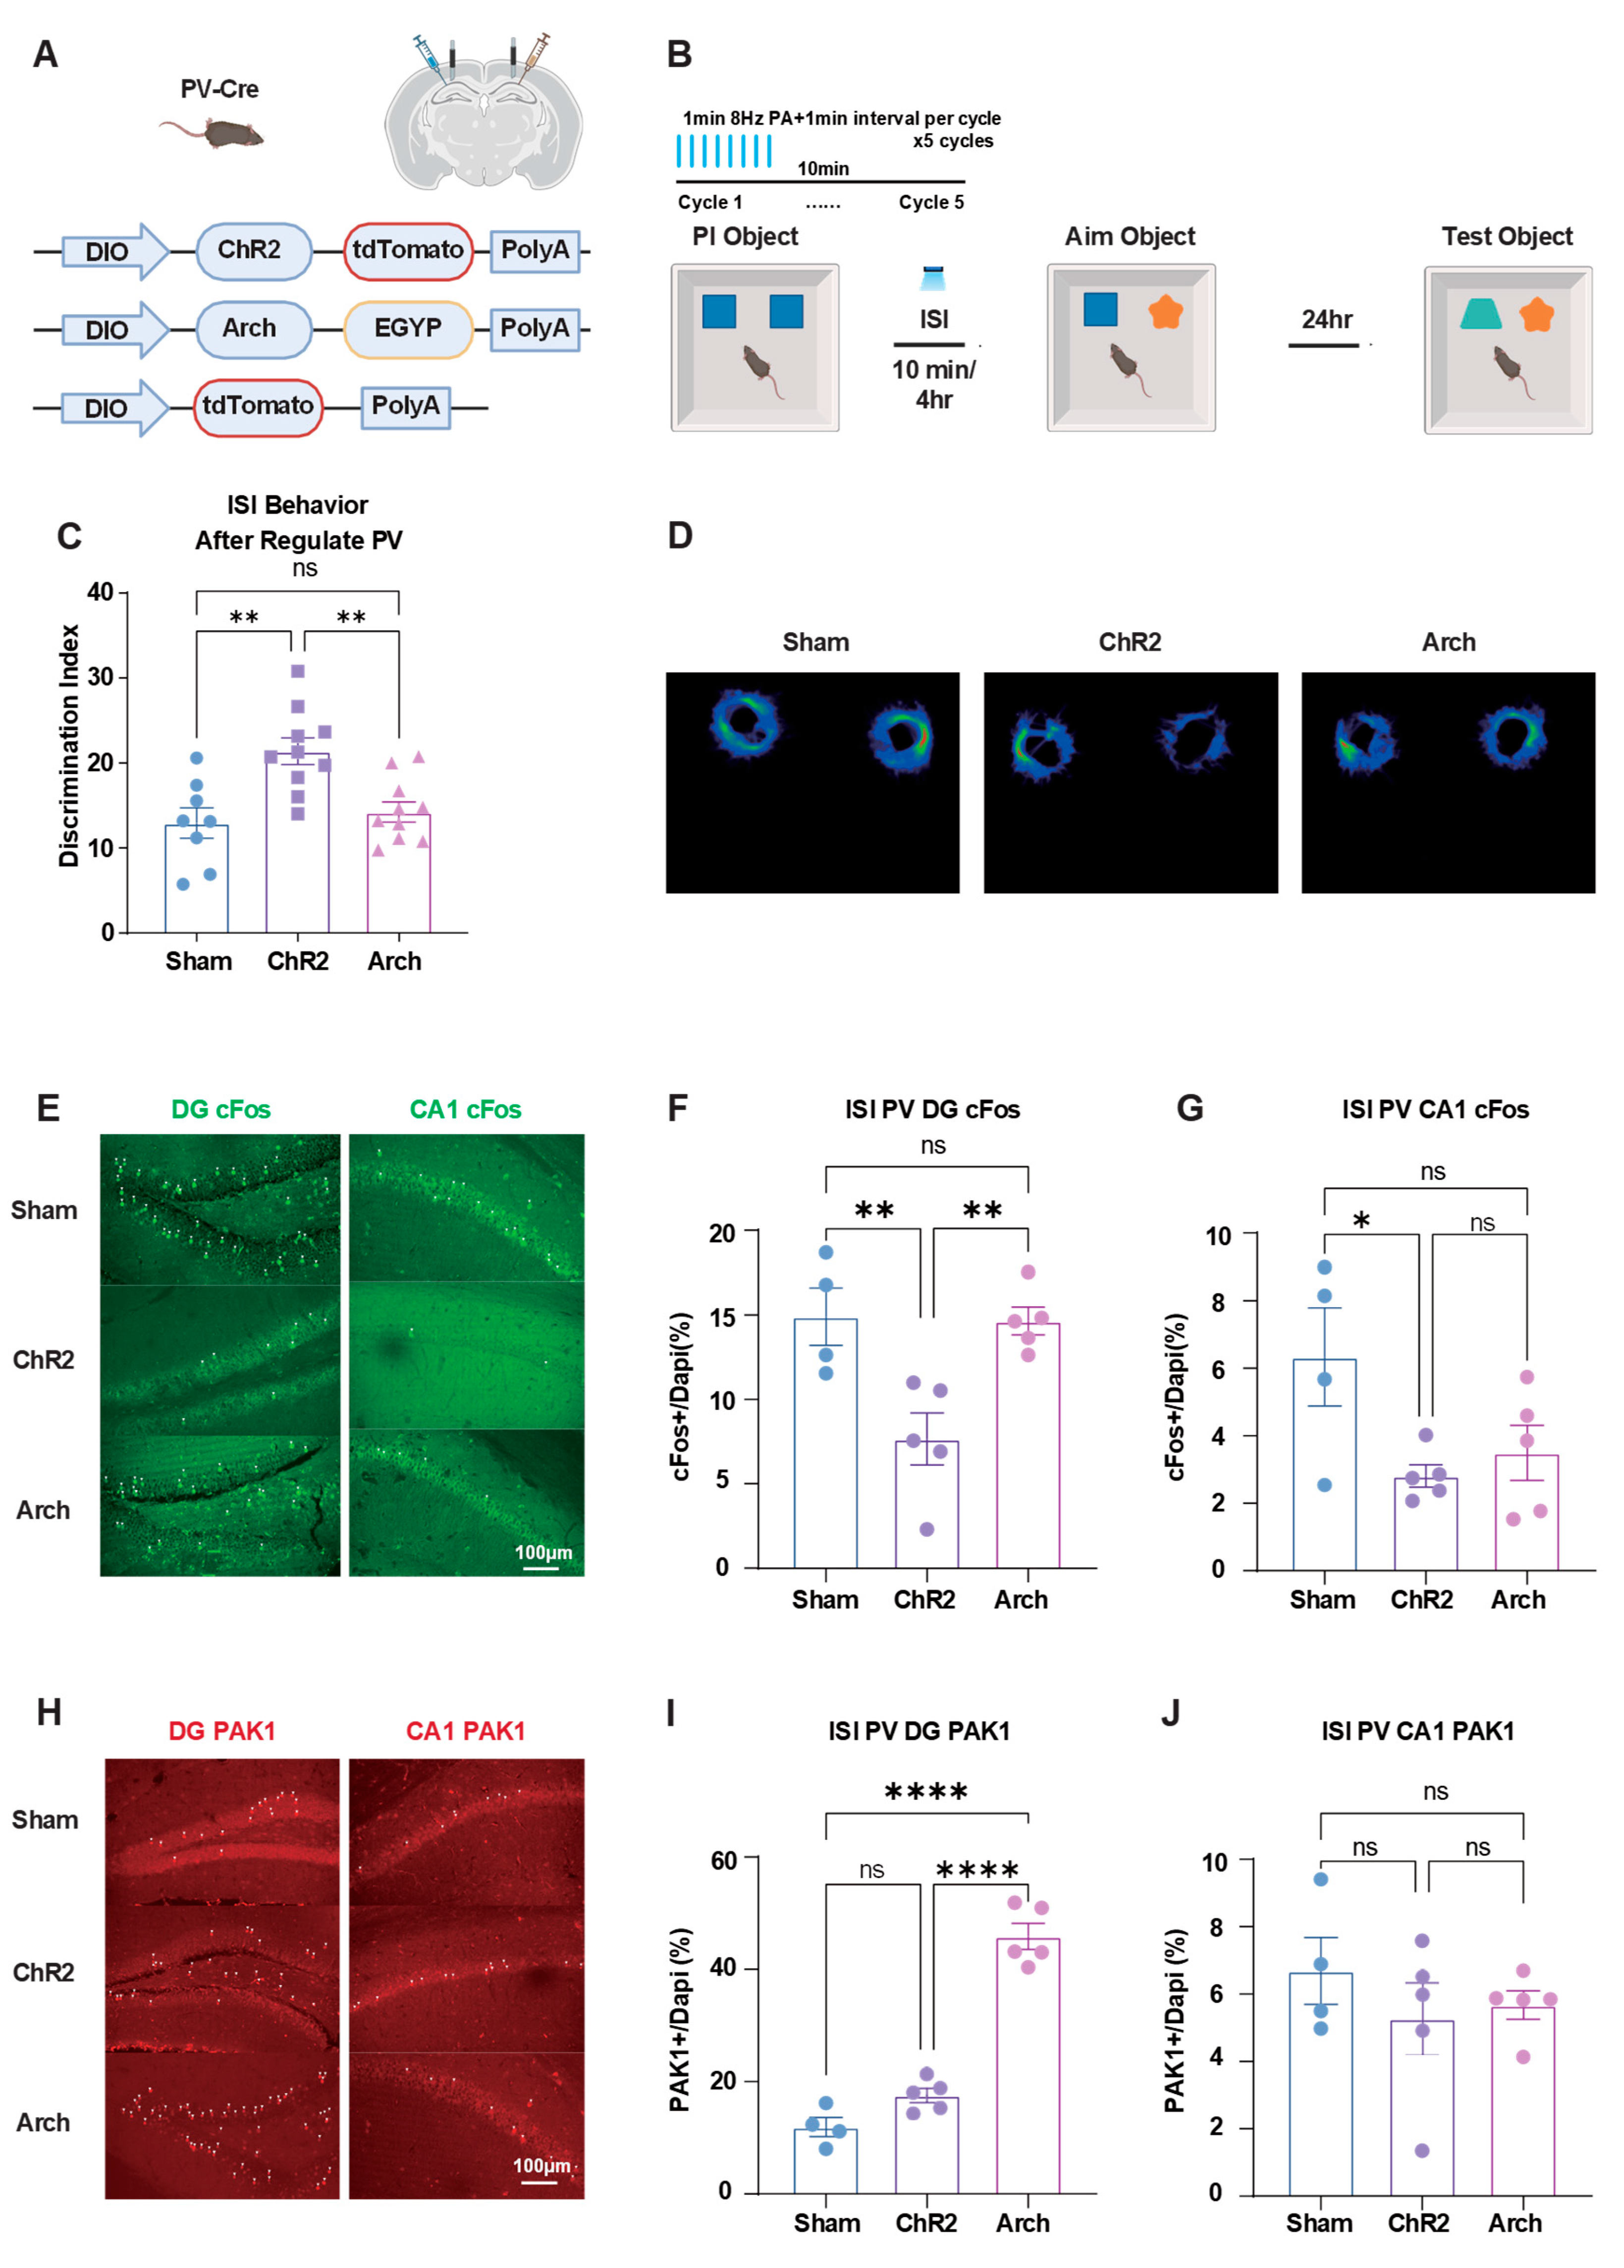
Figure 6.
Figure 6. Optogenetic regulation of PV interneurons in cognitive load-induced PI. (A) Optogenetic protocol under cognitive load conditions. Light stimulation applied between training sessions using 1-min 8Hz stimulation with 1-min intervals for 5 cycles, with ISI = 10 min between each load accumulation. (B) (C) Behavioral results. PV-ChR2 improved memory under 4x load condition, while PV-ArchT significantly impaired performance. (D) Representative movement tracking trajectories during test phase after PV modulation under working load conditions. (E) Representative immunofluorescence images of cFos expression in DG (left panel) and CA1 (right panel) regions. Scale bar: 100 μm. (F) Quantification of DG cFos expression. After modulating PV interneurons in DG, no significant differences in cFos expression were observed between groups. (G) Quantification of CA1 cFos expression. After modulating PV interneurons in DG, Sham group showed significantly higher cFos expression than ChR2 and Arch groups, with no significant difference between ChR2 and Arch groups. (H) Representative immunofluorescence images of PAK1 expression in DG (left panel) and CA1 (right panel) regions. Scale bar: 100 μm. (I) Quantification of DG PAK1 expression. After activating PV interneurons in DG, ChR2 group showed significantly lower PAK1 expression than Sham and Arch groups, with no significant difference between Sham and Arch groups. (J) Quantification of CA1 PAK1 expression. After modulating PV interneurons in DG, no significant differences in PAK1 expression were observed between groups in CA1. One-Way ANOVE with Tukey’s multiple comparisons post hoc tests. Sham group mice = 4, ChR2 group mice = 5, Arch group mice = 5. Data are presented as ±SEM. Data presented as mean ± SEM; *P < 0.05, **P < 0.01, ***P < 0.001, and ****P < 0.0001, ns = not significant. Scale bar: 100 μm.
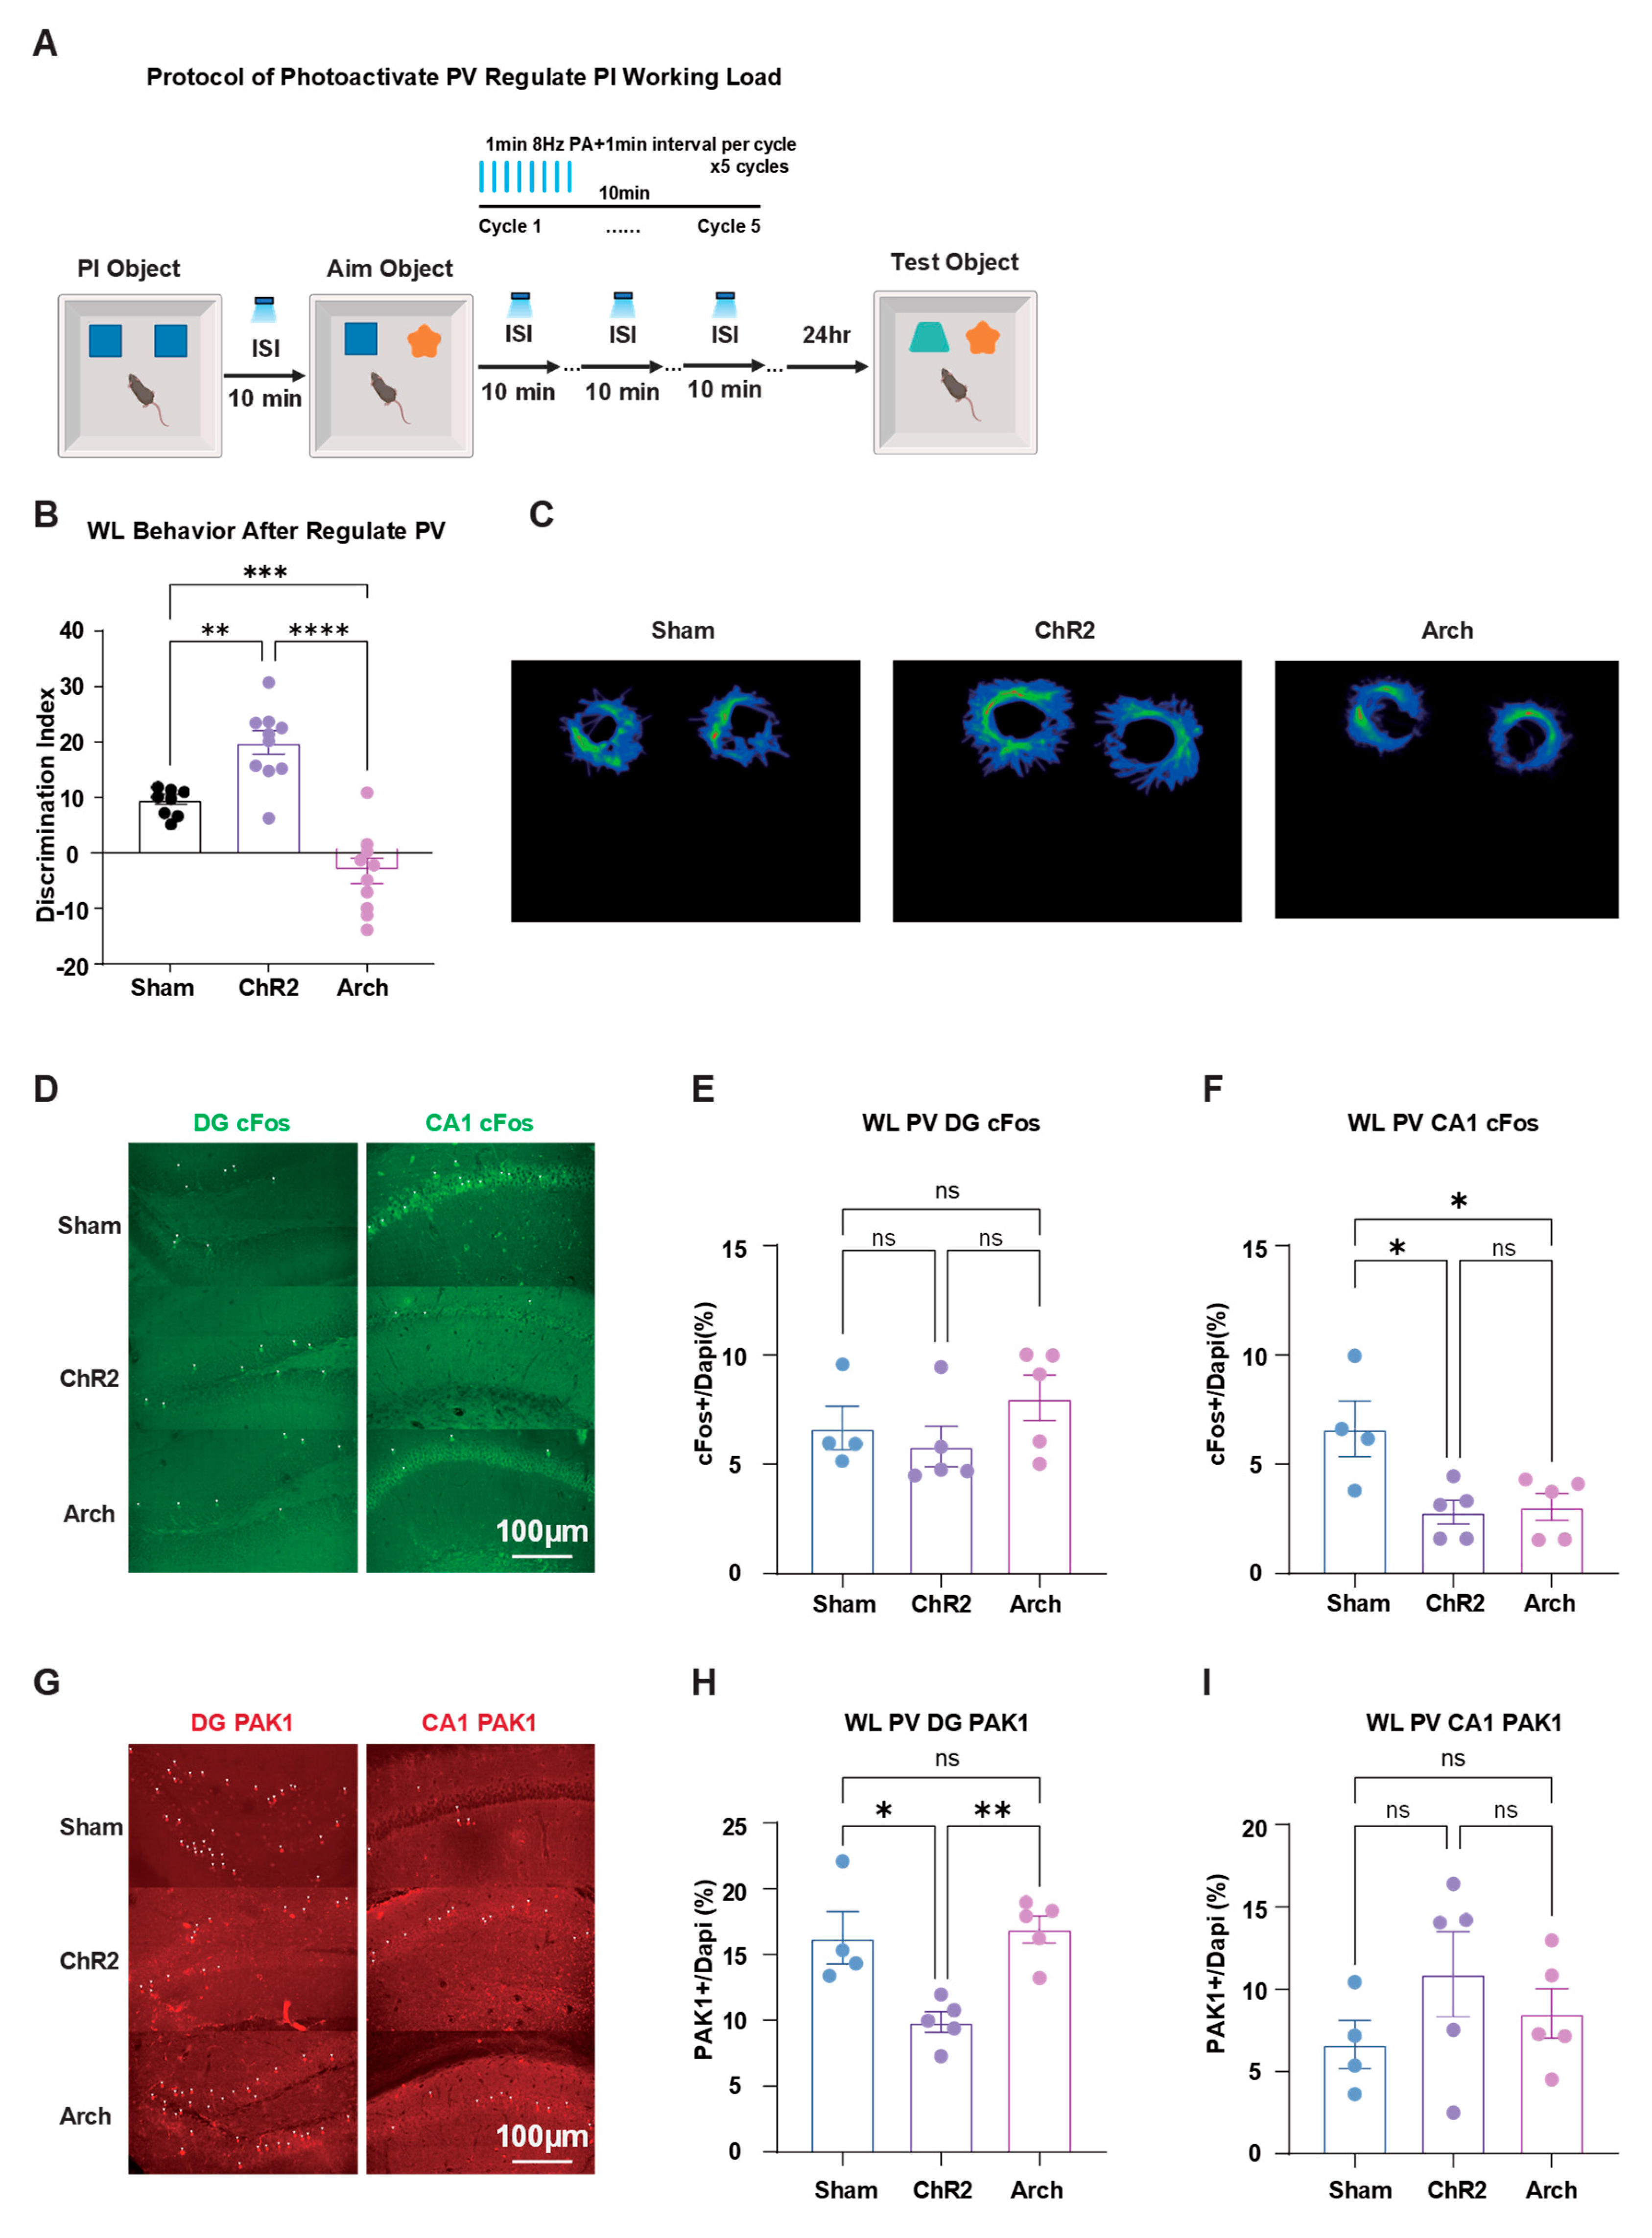
Disclaimer/Publisher’s Note: The statements, opinions and data contained in all publications are solely those of the individual author(s) and contributor(s) and not of MDPI and/or the editor(s). MDPI and/or the editor(s) disclaim responsibility for any injury to people or property resulting from any ideas, methods, instructions or products referred to in the content. |
© 2025 by the authors. Licensee MDPI, Basel, Switzerland. This article is an open access article distributed under the terms and conditions of the Creative Commons Attribution (CC BY) license (http://creativecommons.org/licenses/by/4.0/).
Copyright: This open access article is published under a Creative Commons CC BY 4.0 license, which permit the free download, distribution, and reuse, provided that the author and preprint are cited in any reuse.


