
Submitted:
05 September 2025
Posted:
01 October 2025
You are already at the latest version
Abstract
This study explores the photoprotective and antioxidant potential of cosmetic emulsions formulated with Alnus glutinosa (black alder) extracts. Extraction of bioactive compounds was performed using Soxhlet, ultrasound-assisted, and microwave-assisted techniques with ethanol and water as solvents. The phytochemical profiles of the resulting extracts were characterized via UV-Vis spectroscopy, Fourier-transform infrared spectroscopy (FTIR), and liquid chromatography–high-resolution mass spectrometry (LC-HRMS). The extracts were incorporated into oil-in-water emulsions and assessed for antioxidant activity using the DPPH radical scavenging assay, sun protection factor (SPF), pH and viscosity stability and color L*a*b* values . Among the extraction methods, ethanol-based Soxhlet extraction yielded the highest concentration of bioactive compounds and demonstrated superior antioxidant and photoprotective efficacy. Formulations containing the highest concentrations of extract exhibited SPF values up to 35 and radical scavenging activity exceeding 85%. This is the first report that evaluates the SPF and antioxidant properties of A. glutinosa-enriched emulsions, supporting their application as multifunctional, plant-derived cosmeceuticals for skin protection.
Keywords:
Alnus glutinosa
; extracts
; antioxidant
; sun protection
; cosmeceuticals
1. Introduction
Cosmeceuticals, a rapidly expanding sector within the natural personal care industry, represent a class of products that bridge the gap between cosmetics and pharmaceuticals. Natural ingredients have been utilized in dermatological applications for centuries, and their incorporation into contemporary skincare formulations is increasing. Botanical extracts possess a wide spectrum of antioxidant properties, primarily due to their rich content in phenolic compounds, flavonoids, and other secondary metabolites. Extensive screening of various plant extracts—such as Punica granatum (pomegranate), Syzygium aromaticum (clove), Mangifera indica (mango kernel), and Phyllanthus emblica (amla)—has confirmed potent ability to scavenge reactive oxygen species and free radicals using in vitro assays like DPPH and electron spin resonance (ESR). These antioxidants play a pivotal role in neutralizing oxidative stress, which is implicated in skin aging and various diseases [1,2,3]. These agents exert localized therapeutic effects, supplying essential nutrients that support skin homeostasis and contribute to the prevention of degenerative cutaneous disorders [4].
In response to growing consumer interest in plant-based, multifunctional ingredients, Alnus-derived extracts offer a sustainable and eco-conscious approach to enhancing the efficacy and commercial value of topical formulations. Alnus glutinosa (A.glutinosa), also known as black alder, is a natural antioxidant predominant in Europe, North Africa and Western Asia that can reduce oxidative stress on the skin or protect products from oxidative degradation [5,6]. The antioxidant activity of A. glutinosa extracts from leaves and bark is mainly attributed to its rich composition of polyphenolic compounds, including diarylheptanoids, tannins, and flavonoids. These compounds are not just free radical scavengers, but also modulators of cellular oxidative stress responses, making them efficient bioactives with therapeutic and preventative benefits against skin oxidative damage, inflammation and aging [7]. Evidence of antioxidant activity was reported by Dinić et al., who isolated two diarylheptanoids from the bark of A. glutinosa—platyphylloside and a coumaroyl derivative thereof. The results obtained showed that the substances drastically reduced reactive oxygen species (ROS) production both in cancer and healthy cells exposed to doxorubicin and cisplatin [8]. Similarly, Skrypnik et al., using water extracts of A. glutinosa reported a total phenolic content up to 29.0 ± 5.3 mg g⁻¹ and radical scavenging activity as high as 276 ± 29 mg g⁻¹, outperforming pine and oak extracts [9,10].
In addition to their notable antioxidant activity, A. glutinosa extracts demonstrate potential for photoprotection, attributed to their rich phenolic content. Compounds such as polyphenols, flavonoids, and tannins possess structural features—namely conjugated double bonds and aromatic rings—that enable absorption of UVA and UVB radiation, indicating their capacity to protect the skin against sun and UV-induced damage. Although the sun protection efficacy of A. glutinosa extracts in cosmetic emulsions has not yet been systematically evaluated, their compositional similarity to other polyphenol-rich botanical extracts—commonly utilized as natural SPF enhancers—suggests considerable potential for photoprotective applications. In the study of Skrypnik et al., the levels of total flavonoids (as much as 21.5 mg g⁻¹ in alder bark) and proanthocyanidins (3.8 mg g⁻¹) were compared to high radical scavenging activity, a secondary marker of photoprotective capacity. This is in accordance with more comprehensive research which has established that such compounds are able to block UV-induced oxidative stress in cultured skin cells [6]. Mechanistically, antioxidants cancel out the deleterious effects of UV radiation by quenching ROS produced in exposed skin. ROS are key mediators of UV-induced skin damage and contribute to collagen degradation, inflammation, and photoaging Antioxidants that reduce ROS can therefore significantly augment photoprotection of the skin and retard photoaging [11,12]. Furthermore, Dinić et al. [8], demonstrated that the diarylheptanoids of A. glutinosa not only suppressed ROS but also preserved mitochondrial integrity as well as prevented apoptosis in normal cells exposed to chemotherapeutic stress. The latter cytoprotective effect can also be extrapolated to protection from UV-induced damage in cells, further confirming the photoprotective effect of these compounds [13].
This study aimed to optimize the extraction conditions for Alnus glutinosa and evaluate the incorporation of its extracts into cosmetic emulsions. Given their phenolic profile, further investigation of the extracts’ role in antioxidant activity and UV protection in cosmetic formulations is justified. Both conventional (cold maceration and reflux boiling) and advanced (ultrasound-assisted and microwave-assisted) extraction techniques were assessed. The phytochemical profile of the extracts was analyzed using LC–HRMS for qualitative characterization of bioactive compounds. Spectroscopic methods, including UV-Vis and FTIR, were employed for further characterization. Antioxidant activity was evaluated via the DPPH assay, and sun protection potential was assessed through SPF determination. To the best of our knowledge, while A. glutinosa has been studied in the pharmacy field [14,15] no peer-reviewed publication to date investigates the use of isolated extract in cosmeceutical formulations.
2. Materials and Methods
2.1. Chemicals and Extract Isolation Methods
Foliage of Alnus Glutinosa were obtained commercially from a local supplier (Kilkis, Greece) and dried in the air (at 25 °C in the dark, using still air for 3 days). The materials were then pulverized into a fine powder using a mechanical grinder and stored in airtight bags for further analysis. The preparation of extracts from A. Glutinosa was performed using three different methods, and each test was carried out in triplicate. After optimizing each extraction process, isolated extracts were analyzed by UV-Vis spectroscopy. All the processes were performed using a quantity of powdered foliage at 5g per 100mL of solvent, while all other reagents employed were of analytical grade.
2.1.1. Ultrasound Assisted Extraction
5 g of the plant samples were taken and added to 100 ml EtOH taken in the beaker. The beaker was covered using aluminum foil to prevent loss of solvent by evaporation. The ultrasonic MS3 MicroTip3 probe (Maximum amplitude: 180, W/cm³: 460) of Ultrasonic Processor UP100H (Controla S.A, Greece) was positioned inside the beaker and the solution was subjected to ultrasound at a frequency of 30 kHz at 25 °C and 70 °C for a predetermined duration of 60 minutes. Once the extraction ended, ultrasonication was stopped, and the supernatant liquid was vacuum filtered to isolate the pure extract. The filtrate was tightly closed and stored at low temperature for future reference. The optical density was determined with the help of UV–VIS spectrophotometer.
2.1.2. Extraction in Soxhlet Extractor
For the reflux boiling method using Soxhlet extractor, 5 g of A.Glutinosa powder were placed in a round-bottomed flask, weighed, and reflux extraction was performed at three different conditions to optimize the process. The apparatus was heated on a laboratory electric heating mantle at ambient pressure. Specifically, deionized water (DI) was employed as solvent at 70 °C and 90 °C respectively for 3 hours, as well as pure ethanol at 70 °C for 1 hour (Table 1). Once the boiling ended, the supernatant liquid was vacuum filtered to isolate the pure extract.
2.1.3. Microwave Assisted Extraction
A domestic microwave oven (NN-S255W, Panasonic) was used in the current study with a total capacity of 1,100 W. Plant samples (5 g) were mixed with the DI (100 ml) and placed in a beaker, and then each beaker was inserted alone into the microwave oven.
The mixtures were subjected to microwave irradiation at 330 W, following the method described by Pan et al., [16] with slight modifications to reach a total irradiation time of 3 minutes: 45 seconds of power on, followed by 30 seconds off, and then an additional 15 seconds of power on. After every 60 seconds of irradiation, the sample was allowed to cool down to room temperature.
2.2. Characterization of Extracts
2.2.1. Gravimetric Analysis
At the end of each extraction process, the samples were filtered, and the solvent was evaporated using rotary evaporation. Purified extracts were placed into refrigeration overnight at − 80 °C, followed by freeze-drying with a lyophilizes, Crude extracts were stored at 4 °C. The yield of the extract was calculated by determining the weight of the dried extract per gram of plant material used, using the following equation:
2.2.2. UV-Vis Spectrometry
The quantitative evaluation of isolated extracts was executed through UV-Vis spectrometry. A Shimadzu UV-1800 spectrophotometer equipped with UV Probe ver. 2.61 software (Shimadzu, Kyoto, Japan) was used for obtaining the absorption spectra after suitably diluting the extracts. The UV–VIS spectra of the coloring compounds from each plant material were recorded in the visible range between 400 and 700 nm. The extracted solutions were then analyzed by measuring their absorbance values at either the wavelength corresponding to the maximum absorbance (λmax) or at a designated specific wavelength.
2.2.3. Fourier-Transform Infrared Spectroscopy (FTIR)
FTIR spectra were obtained using a Perkin-Elmer FTIR spectrometer (Perkin Elmer, Waltham, MA, USA), model SPECTRUM 1000, using KBr tablets. The spectra of the extracts were taken in the range 4000–500 cm−1, resolution 4 cm−1 and a number of 16 scans, were baseline corrected and converted to absorbance mode using the Spectrum v.5.3.1 (2004) software.
2.2.4. LC-Orbitrap-HRMS
Instrumental analysis was performed using a Q Exactive Focus Orbitrap LC-MS/MS system (Thermo Fisher Scientific, Bremen, Germany). The liquid chromatography (LC) setup included a Vanquish Flex ultra-high-performance liquid chromatography (UHPLC) system equipped with binary pumps, a temperature-controlled autosampler, and a column compartment. Separation was carried out on a Thermo Hypersil GOLD aQ column (50 × 2.1 mm, 1.9 μm) with a holder and cartridge pre-filter, maintained at a constant temperature of 40 °C throughout the analysis.
The mobile phases consisted of water (A) and methanol (B), both acidified with 0.1% (v/v) formic acid (FA). The gradient program began with 10% B, held for 1.5 minutes; then increased to 60% B over the next 2.5 minutes, followed by a rise to 70% B over 4 minutes, reaching 100% at 11 minutes, which was maintained for 1 minute. The mobile phase composition was then restored to the initial conditions within one minute and held for 2 minutes to allow re-equilibration. The total run time was 15 minutes at a constant flow rate of 200 µL/min. The injection volume was set to 5 µL, and the autosampler tray was maintained at 10 °C.
For mass spectrometry, ionization was achieved via a heated electrospray ionization (HESI-II) probe, Ion Max model, using polarity switching mode. Instrument settings followed the system’s default parameters optimized for an LC flow rate of 0.2 mL/min: tube lens voltage at 110 V; sheath, auxiliary, and sweep gas flow rates at 45, 10, and 2 arbitrary units (au), respectively, supplied by a high-purity nitrogen generator (Peak Scientific Genius 1022, Inchinnan, UK); spray voltages of 3.5 kV in positive mode and 2.7 kV in negative mode; and an S-lens RF level set at 50. Finally, the auxiliary gas heater temperature was 400 °C, the capillary temperature was set at 320 °C. Precursor ions (full scan, MS1) were scanned in the 100−1000 m/z range with a resolving power of 70,000 (at m/z 200). To facilitate structural elucidation, data-dependent acquisition (dd-MS2) was employed in parallel, operating in Discovery Mode to trigger MS2 events based on the intensity of precursor ions. Fragmentation of the selected ions was achieved using stepped normalized collision energies of 20, 35, and 50 eV, and MS2 spectra were recorded at a resolution of 35,000. Instrument control and initial qualitative analysis were carried out using Xcalibur software version 4.1.
2.2.5. Data Processing in Compound Discoverer
Non-target analysis was performed using the commercially available Compound Discoverer 3.3 software (Thermo Scientific). Multiple processing nodes were applied to develop a dedicated screening workflow for deconvoluting raw Orbitrap MS data (Figure S1). Sample files were imported and labeled as solvent blanks, samples, or quality controls (QC). The ready-to-use workflow titled “Food Research w Stats Unknown ID w Online and Local Database Searches” was selected with minor modifications. Spectra were filtered in the “Select Spectra” node based on criteria including total intensity above 1 × 10^6, signal-to-noise ratio greater than 10, and acquisition times between 0.5 and 14 minutes. Retention time (RT) alignment was performed using the adaptive curve algorithm, with a maximum allowed RT difference of 0.1 minutes between samples; fallback alignment was executed via a linear model. Mass features passing these parameters were introduced into the “Detect Compounds” node for ion and peak detection, followed by grouping across all samples with a retention time tolerance of 10 seconds and a composition match threshold of 25%. Background signals were minimized by filtering out peaks with a sample-to-blank intensity ratio below 5:1. Missing data points from misalignment were corrected automatically using the “Filling Gaps” node. For compound annotation, the “Search mzCloud,” “Search ChemSpider,” “Search Mass Lists,” and “Predict Compositions” nodes were applied. The “Search mzCloud” node compared MS and MS2 spectra against the online mzCloud database using the HighChem HighRes algorithm. The “Search ChemSpider” node searched selected libraries including ACToR (Aggregated Computational Toxicology Resource), FDA databases (Structured Product Labeling index and UNII - NLM), FooDB, and Phenol-Explorer. Elemental composition prediction was limited to a maximum of C200 H800 Br5 Cl4 F5 N5 O80 P5 Si in the “Predict Compositions” node. The mass tolerance for all searches was set to 5 ppm. Post-annotation, additional filtering retained only compounds with mzCloud matching scores greater than 70%, corresponding to a confidence identification level of 2a according to Schymanski et al. (2014) [17].
2.3. Emulsion Preparation
The O/W emulsions were prepared herein following a technique from previous works [18,19]which involved three stages: (1) preparation of the aqueous phase, (2) preparation of the oily phase and (3) mixing of the two phases until the formation of a stable emulsion. The procedure is illustrated in Figure 1. All ingredients used are listed from FDA as safe and have been approved for cosmetic applications. Each isolated extract was used for the preparation of the corresponding emulsion, while an additional cream was also prepared serving as reference sample, without extract. In total, 5 creams were prepared (200 g each) and investigated in the current study. Final volume/weight ratio of the produced emulsions was 75% (150 mL/ 200 g).
(1) Aqueous phase (75% of emulsion) consists of DI (70%), glycerin (3.5%), xanthan gum (1%) and tetrasodium EDTA (0.5%). In the case of the emulsions containing the isolated extracts of A.Glutinosa, the DI was replaced by the amount of extract added.
(2) Oil phase (23%) was prepared in a beaker with olive oil (11%), cetylstearyl alcohol (2%), cetyl alcohol (2%), polysorbate-60 (2%), stearic acid (2%), shea butter (2%) and finally the beeswax (2%).
(3) The two beakers were placed in a water bath with the temperature set at 80 °C until all ingredients were completely homogenized. The oil phase was slowly added to the aqueous phase while stirring at 600 rpm using a 2020 RZR (Heidolph, Schwabach, Germany) mechanical stirrer, with the temperature maintained at 80 °C. Once the oil phase was fully incorporated, the heating was stopped, but stirring continued in the water bath. Stirring lasted approximately 1.5 to 2 hours, until the emulsion (cream) was fully formed. Since phenoxyethanol (1%) and ethylhexylglycerin (1%) are volatile preservatives, they were added only after the temperature dropped below 40 °C. The resulting emulsions were then transferred into plastic containers and stored in a cool, dark environment.

Table 2.
summarizes the utilized substances for the emulsions’ fabrication.
| Sample name | Blank | Emulsion A | Emulsion B | Emulsion C | Emulsion D |
| Ingredients (%) | Water phase (75%) | ||||
| Water | 70 | 0 | 35 | 40 | 35 |
| Glycerin | 3,5 | 3,5 | 3,5 | 3,5 | 3,5 |
| Xanthan gum | 1,5 | 1,5 | 1,5 | 1,5 | 1,5 |
| EDTA | 0,5 | 0,5 | 0,5 | 0,5 | 0,5 |
| Reflux 1 | 0 | 70 | 35 | 30 | 0 |
| Reflux 3 | 0 | 0 | 0 | 0 | 35 |
| Oil Phase (25%) | |||||
| Olive oil | 13 | 13 | 13 | 13 | 13 |
| Cetyl alcohol | 2 | 2 | 2 | 2 | 2 |
| Cetearyl alcohol | 2 | 2 | 2 | 2 | 2 |
| Polysorbate 60 | 2 | 2 | 2 | 2 | 2 |
| Shea butter | 2 | 2 | 2 | 2 | 2 |
| Steatic acid | 2 | 2 | 2 | 2 | 2 |
| Beeswax | 2 | 2 | 2 | 2 | 2 |
2.4. Characterization of Emulsions
2.4.1. pH and Viscosity Stability
The stability of the prepared emulsions was evaluated by monitoring pH and viscosity over a period of 1, 7, 14, 30, 60 and 90 days following preparation. The pH was measured by immersing a microprocessor pH sensor (WTW pH 535, Gemini BV, Apeldoorn, The Netherlands) directly into the emulsions. For viscosity measurements, after testing various spindles, spindle R3 was selected as the most appropriate and was immersed to a consistent depth in the plastic containers during measurement [20].
2.4.2. Sun Protection Factor (SPF)
The SPF values were determined using the diluted solution transmittance method. Each sample was prepared by dissolving 1% w/v in ethanol, followed by sonication until fully homogenized and filtration through Whatman filters. Subsequently, 20% v/v of each filtered solution was diluted with ethanol. The absorbance of the resulting emulsions was measured at wavelengths ranging from 290 to 320 nm, at 5 nm intervals, using a UV-Vis spectrophotometer (Shimadzu, Tokyo, Japan). All measurements were performed in triplicate for each formulation. The use of the Mansur equation is necessary for the calculation of SPF index spectrophotometrically [21]:
where ΕΕ(λ) is the erythemal effect of the spectrum at wavelength λ, Ι(λ) is the solar intensity of the spectrum at wavelength λ, CF is the correction factor equal to 10, A(λ) is the absorption in 290–320 nm region (every 5 nm), while the values for the term “EE × I” are normalized constants determined by Sayre et al. [22]
2.4.3. Color Measurement
The samples were analyzed at room temperature for color variations using a portable MiniScan XE Plus spectrophotometer (HUNTERLAB, Washington, VA, USA). Color evaluation was conducted by measuring changes in the Commission Internationale de l’Éclairage (CIE) LabCh components. This five-dimensional color space includes L* (lightness), ranging from 0 (black) to 100 (white); a* representing redness (positive values) or greenness (negative values); b* representing yellowness (positive values) or blueness (negative values); as well as C* (chroma, indicating color saturation) and H* (hue angle) [23].
2.4.4. Antioxidant Study
The antioxidant capacity of the emulsions was evaluated using the DPPH (2,2-diphenyl-1-picrylhydrazyl) assay. A 50 mg/L DPPH solution in ethanol (Lot# STBH7297, Sigma Aldrich®, Burlington, MA, USA) was prepared, and emulsion solutions were made at 1% w/v in ethanol. Subsequently, 1 mL of each emulsion solution was mixed with 3 mL of the DPPH solution and sonicated for 30 minutes. To prevent light exposure during the reaction, all flasks were securely wrapped in aluminum foil. A blank control was prepared by mixing 1 mL of pure ethanol with 3 mL of DPPH solution. Absorbance measurements were conducted using a UV-Vis spectrophotometer equipped with a W-lamp, recording at the DPPH absorbance maximum of 517 nm. A decrease in absorbance indicated increased free radical scavenging activity of the emulsions. The antioxidant activity was calculated using the following equation:
where AS and AC represent the absorbance of each sample and of the control sample (no cream), respectively.
2.5. Statistical Analysis
SPF data were analysed using one-way ANOVA with the Tukey correction used for multi-comparison post hoc testing. Data of pH, viscosity and antioxidant activity data were analysed via repeated measures ANOVA using Greenhouse-Geisser correction to adjust for violations of the sphericity assumptions. Post hoc pairwise comparisons were adjusted by Bonferroni correction for multiple comparisons, whereas Tukey correction was used for group multi-comparison. All data are expressed as mean ± SD and p<0.05 was considered to be significant. All analyses were conducted using IBM SPSS Statistics v28.0.
3. Results
3.1. Characterization of Extracts
The extractive yield of Alnus glutinosa samples extracted using ethanol and water is presented in Table 3. The extractive yield varied significantly depending on both the extraction method and the solvent used. Among the methods tested, Soxhlet extraction with ethanol (Soxhlet 3) produced the highest extractive yield at 42,50 ± 1,10%, indicating the superior efficacy of ethanol under prolonged hot extraction conditions. In contrast, Soxhlet extractions with water yielded moderate extraction efficiency. Ultrasound-assisted extraction with ethanol at 25 °C and 70 °C yielded 8,20 ± 0,35% and 14,60 ± 0,50%, respectively. The increase with temperature suggests enhanced solvent penetration and solute diffusion at elevated temperatures. Microwave-assisted extraction with water produced the lowest yield at 4,80 ± 0,20%, possibly due to insufficient extraction time, lower solvent efficacy under the applied conditions, or degradation of thermolabile compounds.
The UV-Vis spectra of Alnus glutinosa extracts obtained through ultrasound, reflux boiling, and microwave-assisted methods were recorded in the wavelength range of 400–700 nm, as shown in Figure 2. This range covers the visible spectrum, which is particularly relevant for detecting chromophoric compounds. Among the evaluated methods, Soxhlet extraction yielded the highest overall absorbance values across the visible range, indicating greater extraction efficiency. Ultrasound-assisted extraction showed moderate absorbance, while microwave-assisted extraction resulted in the lowest absorbance intensity. Distinct absorption peaks near 665 nm were observed for all methods except microwave-assisted extraction.
LC–HRMS analysis was performed on two Alnus glutinosa Soxhlet extracts (Soxhlet 2 and 3) for qualitative characterization of their phytochemical composition, as presented in Table 4. Major compounds identified included quinic acid (C₇H₁₂O₆), 3,4,5-trihydroxycyclohex-1-ene-1-carboxylic acid (C₇H₁₀O₅), neochlorogenic acid (C₁₆H₁₈O₉), and docosahexaenoic acid ethyl ester (C₂₄H₃₆O₂). The extracts were also rich in natural antioxidants such as polyphenols, triterpenoids, and flavonoids. Notable compounds detected included miquelianin, gallic acid, cafestol, quercetin-3β-D-glucoside, and luteolin. Minor constituents like fatty acids and amino acids were also present, adding to the extracts’ chemical complexity. Among diarylheptanoids, only (1E)-1,7-bis(4-hydroxyphenyl)hept-1-en-3-one (C₁₉H₂₀O₃) was detected. Full compound data are listed in Table S1.
The impact of water and ethanol (EtOH) as solvents in reflux boiling was assessed using FTIR spectroscopy, with spectra presented in Figure 3. Both extracts displayed a characteristic broad band near 3430 cm⁻¹, corresponding to hydroxyl (–OH) group stretching, indicative of hydrogen bonding. The ethanol extract showed a sharper and more defined –OH stretching band, while the water extract exhibited a broader, less distinct peak. A triplet signal in the 3000–2800 cm⁻¹ region confirmed the presence of C–H stretching vibrations, suggesting methylene groups and minor carbonyl (C=O) contributions. Strong absorption in the 1620–1600 cm⁻¹ region and a weaker band at 1260 cm⁻¹ provided additional evidence of aromatic conjugated ketones. Further absorption bands at 1460, 1370, and within the 1200–900 cm⁻¹ range indicated C–H bending and stretching vibrations. Overall, FTIR confirmed the presence of saturated hydrocarbons, hydroxyl, methylene, and carbonyl functional groups in both extracts.
3.2. Characterization of Emulsions
For clarity and consistency, the formulations discussed herein will be referred as: Cream A, corresponds to the formulation containing 70% freeze-dried A. glutinosa extract, Cream B, contains 35% freeze-dried Alnus glutinosa extract, Cream C comprises 30% freeze-dried Alnus extract, and Cream D refers to the formulation incorporating the freeze-dried ethanolic extract of Alnus glutinosa. This standardized naming will be used throughout the text to facilitate discussion.
3.2.1. pH and Viscosity Stability
The pH values of the prepared creams were monitored over a 35-day period to assess formulation stability (Figure 4). An overall effect of time was observed (p=0.047), primarily due to the blank emulsion and all cream formulations becoming progressively more acidic. While the decreases in pH at days 7 and 14 were not significantly different compared to day 1, significant differences emerged from day 21 onward (p<0.001). However, the actual reductions in pH were relatively minor, indicating only slight acidification over time. This stability is likely due to the mildly acidic nature of formulation ingredients such as stearic acid, beeswax, shea butter, and xanthan gum. In contrast, all formulations containing Alnus glutinosa extracts exhibited a gradual decrease in pH over time.
The rheological behavior of the prepared emulsions was evaluated over a 35-day period at shear rates of 50 and 100 rpm (Figure 5). Both shear rates showed significant effects of time (p<0.001) and cream type (p<0.001). Specifically, the blank emulsion, cream A and cream B did not significantly differ from one another over time, whereas creams C and D did. At 50 rpm creams C and D already differed significantly from the blank emulsion and from creams A and B, with these differences becoming larger over time. Though cream C did have a significant higher viscosity than cream D measured at day 28 (p<0.001) and day 35 (p<0.001), no overall difference was observed between the two formulations across the entire study period (p=0.172). At 100 rpm, however, creams C and D differed significantly when examined over the entire timespan (p<0.001). The blank emulsion displayed consistently low viscosity throughout the study, with only a slight increase by day 28, reflecting a lack of structural complexity. Cream A showed a steady increase in viscosity from day 1 to day 21, followed by a plateau, suggesting network development within the emulsion matrix. Cream B, with a lower aqueous extract concentration, presented irregular viscosity values, particularly at higher shear rates, indicating weak structural formation. Cream C recorded the highest viscosity among all formulations, rising steadily until day 21 before stabilizing. Cream D followed a similar trend to Cream C but with slightly lower viscosity values. Both Cream C and D demonstrated consistent shear-thinning behavior, confirming pseudoplastic flow characteristics.
3.2.2. Determination of CIELAB Values
The colorimetric analysis of the emulsions revealed clear variations in CIELAB values (L*, a*, b*) and color strength (K/S), influenced by both solvent type and extract concentration. Creams A, B, and C, formulated with aqueous extracts at varying concentrations, displayed high L* values and low a* and b* values, resulting in pale beige to light yellow hues. In contrast, Cream D—formulated with ethanolic extract—exhibited the lowest L* value (48,63) and a higher a* (6,08) and b* (17,67) values, producing a darker yellow-brown color. It also recorded the highest K/S value (10,73), as shown in Table 5 and Figure 6.
3.2.3. Sun Protection Factor (SPF) Measurements
The in vitro SPF values of all emulsions containing Alnus glutinosa extracts were significantly higher than those of the blank emulsion (p<0.001, Figure 7). Among the formulations, creams A and C did not differ significantly, whereas cream B had a lower SPF than both afore mentioned creams. Cream D, which incorporated the ethanolic extract, had the highest SPF, indicating the best UV-blocking potential in comparison to the other formulations.
3.2.4. Antioxidant Properties
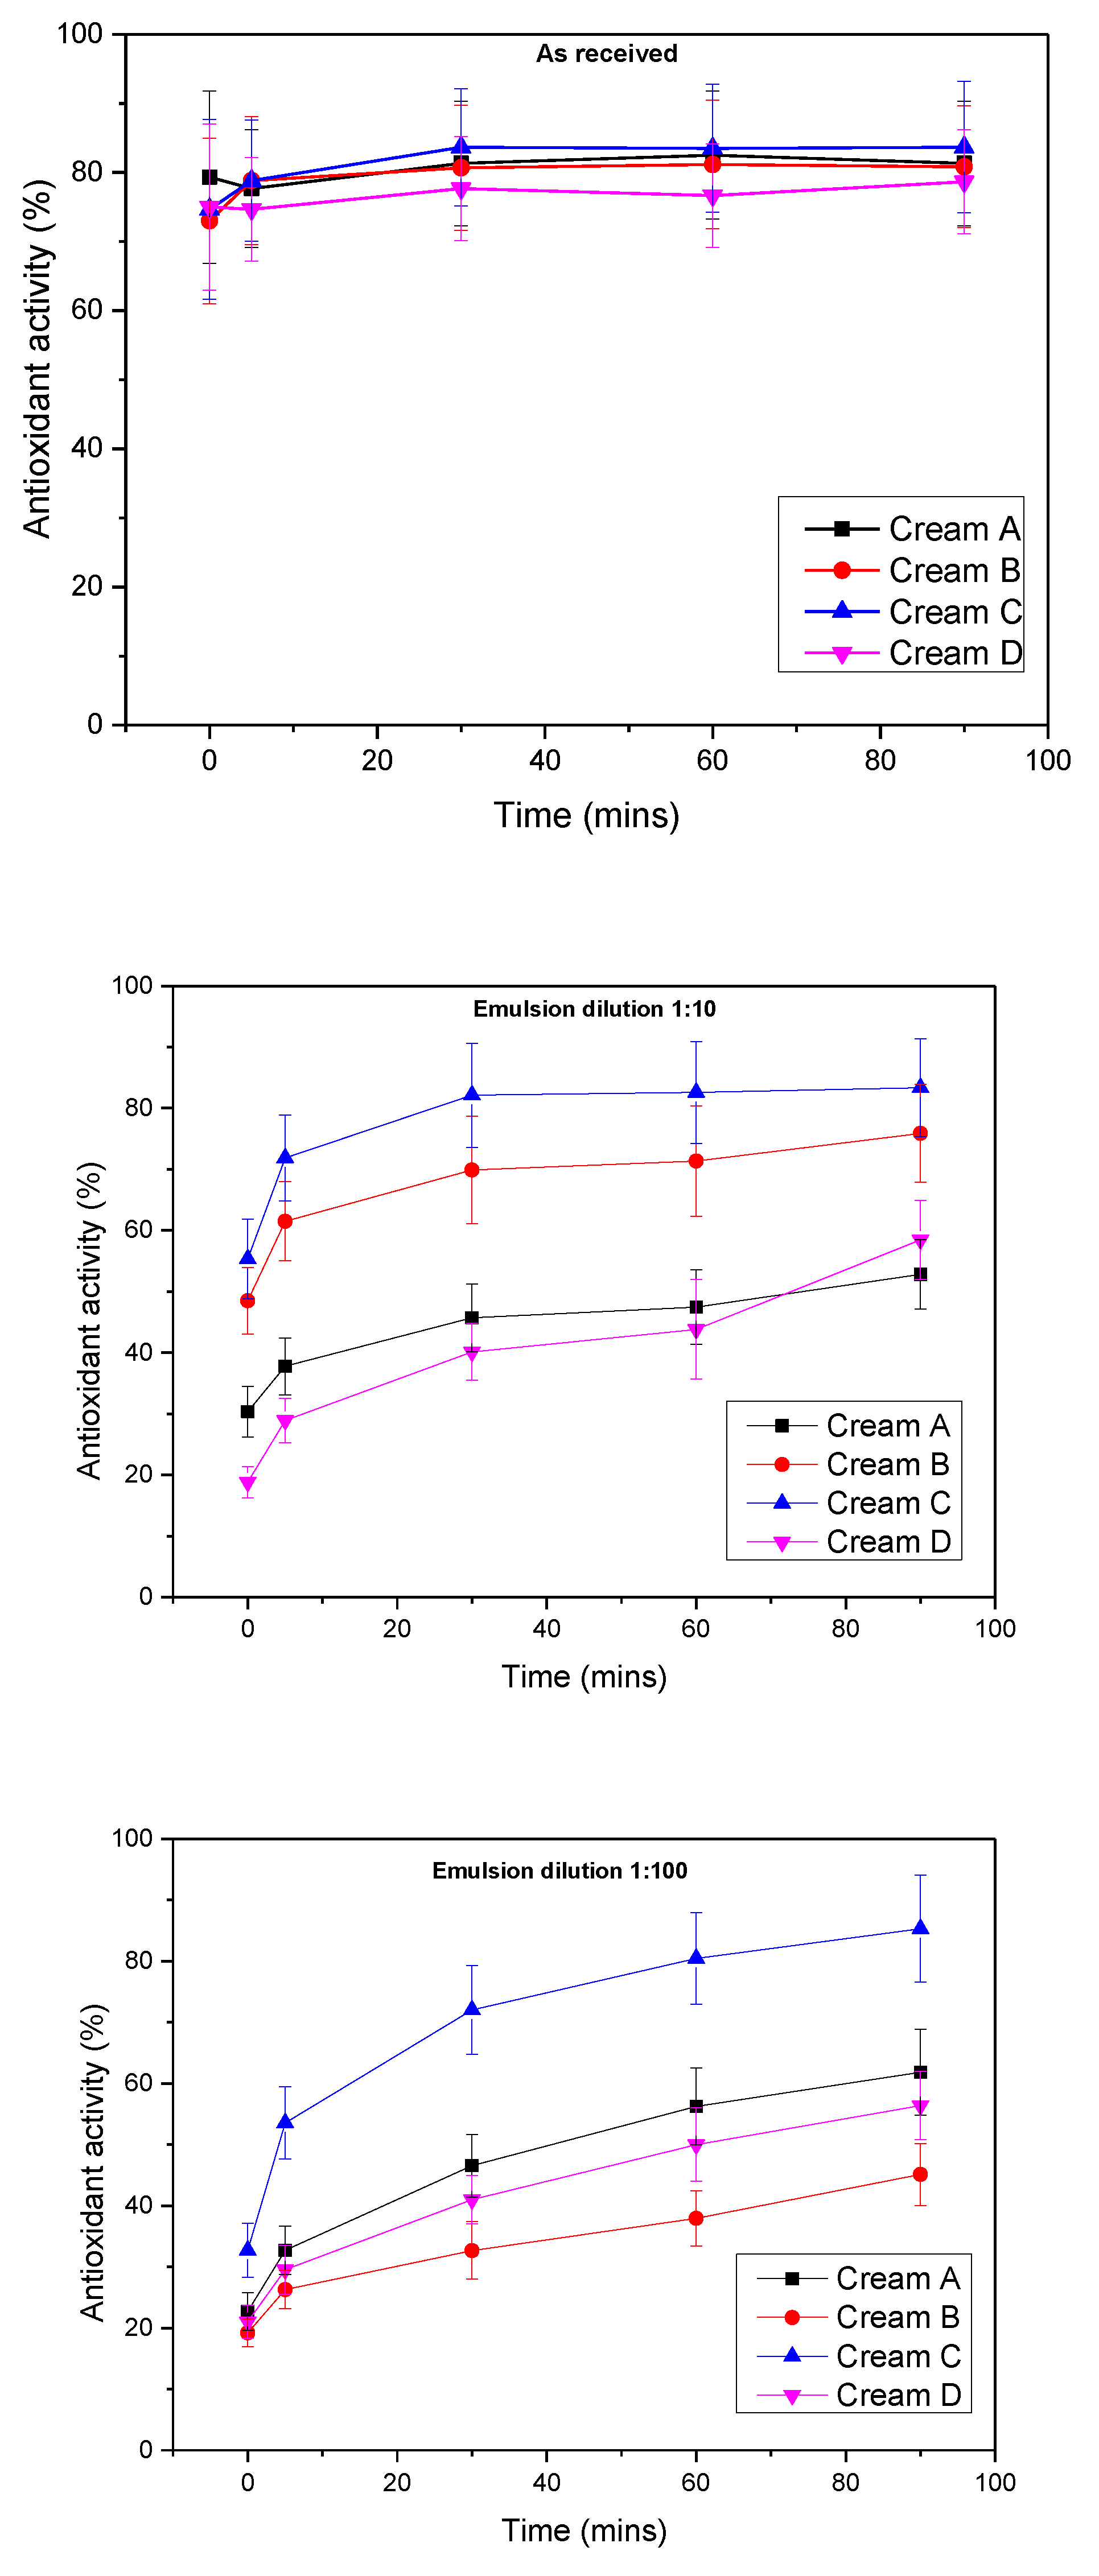
Antioxidant activity of the creams was assessed over a 90-minute period under three conditions: undiluted (as received), 1:10 diluted, and 1:100 diluted (Figure 8).
In the undiluted state, all extract-rich creams exhibited high initial DPPH scavenging activity, attributable to their elevated phenolic content. At t = 0, inhibition values ranged from approximately 73% to 79%. A significant effect of time was observed (p<0.001), though no group effect over time was detected. Antioxidant activity increased in all creams, with significant differences compared to t=0 emerging at 30 minutes (p<0.018) and beyond, indicating relatively rapid reaction kinetics.
For the 1:10 dilution, initial inhibition values ranged from 19% to 55%. Both a significant time effect (p<0.001) and a group effect over time (p<0.001) were observed. The time effect was consistent across all groups, while the group effect reflected creams B and C having significantly higher antioxidant activity than creams A and D (p<0.001). However, no significant difference was observed between creams A and B (p=0.332).
For the 1:100 dilution, initial inhibition values ranged from 19% to 33%. As with the 1:10 dilution, both a significant time effect (p<0.001) and group effect over time (p<0.001) were observed. While all groups showed increasing antioxidant activity over time, the group effect was attributable solely to cream C, which exhibited significantly higher activity than all other formulations (p<0.001).
4. Discussion
The extraction and purification of phytochemicals from plant materials are influenced by several factors, including extraction temperature, time, solvent concentration, and polarity. Due to the diverse chemical nature of phytochemicals, their solubility varies across solvents with different polarities. Consequently, no single solvent can effectively extract the full spectrum of phytochemical and antioxidant compounds present in plants [24]. According to various studies, the extractive yield and antioxidant activity of phenolic compounds in plant material are significantly affected by solvent polarity. The greater yield of ethanol extractives compared to water extractives observed in this study aligns with the relative polarities of the two solvents, suggesting that extraction efficiency increases with solvent polarity. Ghasemzadeh et al., [25] reported that water-ethanol (50:50 v/v) mixtures yielded higher total phenolics and flavonoids than absolute ethanol, regardless of extraction method. Similarly, Ghaffar and Perveen [26] found that methanol–water mixtures improved extraction yields, phenolic content, and free radical scavenging activity. These findings highlight the advantage of combining polar and less polar solvents to improve extraction efficiency. Overall, the results reinforce the importance of selecting appropriate solvents and techniques to maximize phytochemical recovery.
The visible spectral range (400–700 nm) is informative for identifying chromophoric compounds such as phenolics, flavonoids, and anthocyanins, which are prevalent in plant extracts. The stronger absorbance values in Soxhlet extracts suggest a more effective recovery of these compounds, consistent with its known exhaustive extraction capabilities. The peak near 665 nm in most extracts likely corresponds to chlorophyll A, indicating its co-extraction during the process. Additional peaks around 470 nm and 536 nm are associated with carotenoids and anthocyanins, respectively [27]. The reduced absorbance observed in microwave-assisted extraction may result from shorter exposure times or thermal degradation of sensitive compounds, highlighting the importance of optimizing conditions to preserve chromophores.
The phytochemical profile obtained through LC–HRMS reflects the complex and bioactive-rich nature of the A. glutinosa Soxhlet extracts. The identification of compounds such as gallic acid, quinic acid, and neochlorogenic acid highlights the high antioxidant potential of the extracts. These particular phenolic acids possess polar functional groups—multiple hydroxyl and carboxyl moieties—which enhance their solubility in water and explain their abundance in the aqueous extract [28]. The absence of most diarylheptanoids, previously reported in A. glutinosa bark, is likely due to the exclusive use of leaf material in this study, where these compounds may be naturally absent or fall below the detection threshold [29]. The presence of both major bioactive constituents and trace-level secondary metabolites demonstrates the value of detailed extraction and analytical techniques in mapping the full therapeutic potential of plant-derived ingredients.
The FTIR analysis of Alnus glutinosa extracts in both water and ethanol enabled the identification of saturated hydrocarbons, methylene groups, hydroxyl and carbonyl functional groups. The differences observed in FTIR spectra between water and ethanol extracts reflect the influence of solvent polarity on hydrogen bonding and spectral resolution. Water, a highly polar protic solvent, facilitates extensive and diverse hydrogen bonding, leading to broader and less defined O–H stretching bands in the 3700–3000 cm⁻¹ region. Ethanol, with a lower dielectric constant and reduced hydrogen-bonding capacity, produced sharper O–H bands at slightly higher wavenumbers, indicating a more uniform bonding environment [30]. Broadening of absorption bands and reduced peak resolution in aqueous extracts are also likely due to the poor solubility of certain compounds, such as anthranoids, in water. As extract concentration increases, hydroxyl bands become more intense and shift toward lower wavenumbers, consistent with increased hydrogen bonding. Conversely, ethanol enhances spectral clarity and peak separation due to its moderate polarity and better solubilizing capacity for a wider range of phytochemicals [31].
Maintaining pH stability in cosmetic emulsions is essential for product safety, efficacy, and skin compatibility, with the ideal topical range being 4.5 to 6.0 [19]. The slight acidification observed in extract-containing formulations is consistent with the chemical nature of plant-derived phenolic compounds, which can oxidatively degrade to release weak organic acids [32]. Such behavior is common in natural formulations rich in bioactive compounds like flavonoids, tannins, and diarylheptanoids, which are prone to hydrolytic and oxidative transformations over time [33]. The pH shift toward acidity aligns with literature reports on botanical emulsions [10,34], underscoring the dynamic interactions between extract components and emulsion matrices during storage. While these changes are expected in natural systems, monitoring them is crucial to ensure product performance and consumer safety. The statistical analysis revealed a significant effect of time on pH, as indicated by the Greenhouse-Geisser corrected p-value of 0.047, while no significant variations (p>0,05) were observed in the tested samples.
Viscosity stability is critical for the usability, shelf life, and performance of cosmetic emulsions, particularly in ensuring spreadability and consumer satisfaction [35]. Blank emulsion and Creams A and B did not yield any significant variations in 50 and 100 rpm (p=1). The observed shear-thinning response across formulations, especially in Creams C and D which significantly varied (p≤0,01) from the rest of the emulsions, is indicative of desirable pseudoplastic behavior common in well-structured, plant-based emulsions [36]. The variations in viscosity are closely linked to extract concentration and the solvent system used, where higher phenolic content likely contributes to stronger hydrogen-bonding networks and enhanced matrix integrity. Creams enriched with A. glutinosa extracts, particularly Cream C, maintained rheological consistency and demonstrated optimal structural performance over time. These findings align with previous research on botanical emulsions [37], supporting the potential of A. glutinosa extracts in creating stable, consumer-friendly cosmeceutical formulations.
The deeper coloration of Cream D is attributed to the superior solubility and extraction capability of ethanol for chromophoric polyphenols such as flavonoids, tannins, and diarylheptanoids [33]. These compounds possess conjugated systems that not only enhance pigmentation but also contribute significantly to antioxidant and photoprotective activity. Similar findings have been reported by Wathoni et al. [38], who observed a direct correlation between polyphenol content and visual intensity in plant-based emulsions. Furthermore, the consistent color trends observed—particularly the heightened pigment intensity in Cream C—highlight the dual role of color as both an aesthetic and functional indicator. Darker emulsions are typically richer in bioactive compounds and thus offer improved therapeutic potential, aligning with the overall goals of cosmeceutical formulation.
The scientific concern regarding artificial sunscreen chemicals and their side effects (skin irritation, hormonal disruption, and environmental toxicity) has driven science towards natural sunscreens [39]. Plant ingredients, particularly those rich in polyphenols such as flavonoids, tannins, and phenolic acids, have shown effective UV-absorbing activities and the ability to reduce ultraviolet (UV)-induced oxidative stress. Compared to the blank emulsion, all formulations containing Alnus glutinosa extract exhibited significantly (p<0,01) higher SPF values. In more detail, creams A and C exhibited moderate SPF values of 26 and 24 respectively with no variations (p=0,163),while Cream B exhibited a slightly lower value (SPF=19). The highest SPF was observed in the emulsion incorporating the ethanolic extract (Cream D) reaching 35 which is in accordance with scientific data previously reported for extract of plants used as UV filters [40,41]. These results also align with reported data for other plant-based photoprotective agents such as Camellia sinensis, Glycyrrhiza glabra, and Punica granatum, which have demonstrated SPF values in the range of 30–38 [42,43,44]. However, this formulation showed limited extract yield, making it less efficient in terms of product recovery. The obtained data strongly supports the photoprotective potential of Alnus glutinosa extracts in cosmetic formulations. Particularly, the significant performance of Cream D (p<0,01) positions it as a highly effective natural sunscreen candidate, potentially meeting or exceeding the efficacy of many commercial SPF products. Phenolic compounds found in A. glutinosa have been shown to act not only as UV absorbers but also as radical scavengers that mitigate photo-induced oxidative stress, enhancing the photostability and efficacy of sunscreen formulations [33]. In vitro cell assays play a crucial role in photoprotection research by providing controlled, reproducible systems to evaluate the cellular response to UV radiation and the efficacy of photoprotective agents. These assays allow for detailed assessment of cell viability, DNA damage, oxidative stress, and apoptosis in skin-related cells such as keratinocytes and fibroblasts. Incorporating such assays enables early, mechanistic screening of sunscreens and natural compounds, reducing reliance on in vivo testing and facilitating the development of more effective photoprotective formulations. For future work, integration of in vitro cellular photoprotection tests to evaluate the protective effects against UV-induced damage at the cellular levels, using endpoints such as reactive oxygen species generation and cell viability, will significantly enrich our understanding of photoprotective mechanisms and enhance the robustness of the antioxidant activity findings.
Free radicals are among the major skin aging factors and antioxidants are therefore common functional cosmetic ingredients [43]. Extracts of A.glutinosa contain phenolics that exhibit excellent free-radical scavenging activity A. glutinosa bark, indeed, possesses high total phenolic content (up to ~71% w/w as gallic acid equivalents) and exhibits high antioxidant activity [14]. The statistical analysis revealed a strong time effect in the antioxidant activity (%) in all cases as indicated by the Greenhouse-Geisser value (p<0,01). The strong initial DPPH inhibition observed in the undiluted samples confirms the high antioxidant capacity of A. glutinosa extract-enriched creams, in line with reported data on polyphenol-rich plant extracts [41,45,46]. The rapid radical quenching seen within the first few minutes suggests a high concentration of reactive antioxidant moieties, such as phenolic hydroxyl groups, capable of donating hydrogen atoms or electrons to stabilize DPPH radicals [9,47] .At 1:10 dilution, the marked differences in antioxidant performance between high-extract and low-extract formulations became more pronounced. Creams with higher extract concentrations (A and D) maintained substantial scavenging capacity, whereas Creams B and C showed significantly limited (p<0,05) radical neutralization. This suggests that extract concentration directly influences antioxidant efficiency, likely due to insufficient phenolic content in lower extract formulations to drive the DPPH reaction to completion. Possible interference from the cream matrix (e.g., emulsifiers, oils) at this dilution may also hinder reactivity [48]. At 1:100 dilution, antioxidant efficacy declined , as expected when the antioxidant dose falls below the threshold needed to fully quench the DPPH radicals [49]. The dual-phase kinetic pattern—rapid initial inhibition followed by a slower increase—matches prior models of phenolic radical scavenging observed by Angeli and coworkers [50]. These results also align with findings from Mishra et al.,[51] who reported that antioxidant effectiveness is concentration-dependent and influenced by the matrix environment. Overall, these findings reinforce the role of A. glutinosa extracts as potent antioxidant agents in topical formulations. Their activity not only supports claims of anti-aging and skin-protective effects but also suggests potential synergistic applications, such as enhancing SPF performance or improving long-term emulsion stability.
Future research should include detailed investigations of skin permeation and bioavailability of the active compounds from Alnus glutinosa emulsions using clinical studies, in vitro or ex vivo skin models or Strat-M® membranes to better understand their absorption and efficacy in topical applications. Additionally, comparative studies with other well-known natural antioxidants and UV-protective extracts would provide valuable insights into the relative effectiveness of A. glutinosa, helping to position it more clearly within the natural cosmeceutical market.
5. Conclusions
In this study, Alnus glutinosa extracts were, to the best of our knowledge, incorporated into cosmetic emulsions for the first time, with their physical stability, antioxidant capacity, and sun protection potential systematically evaluated. Through the comparison of various extraction methods, solvents, and their integration into cosmetic formulations, the research identified the most effective conditions for maximizing therapeutic benefits and ensuring formulation stability.
A variety of extraction procedures were implied, and among them Soxhlet extraction using ethanol—owing to its relatively lower polarity compared to water—proved to be the most effective solvent, with the highest extraction rate of phytochemicals (42.5%). LC-HRMS Orbitrap analysis confirmed the identification and quantification of several bioactive compounds of interest, which have been reported to possess strong antioxidant and photoprotective properties. As expected, emulsions with higher concentration of extracts exhibited greater antioxidant activity, with DPPH scavenging activity over 85% for diluted samples which also remained at high levels even for higher dilution. Moreover, emulsions containing A. glutinosa extracts exhibited enhanced SPF values up to 36, indicating thus its potential use as natural UV protective component. Stability studies ensured that all formulations were in the approved pH range (between 5–6) after 35-days-testing period and exhibited good rheological properties, such as pseudoplasticity and long-term viscosity. Finally, colorimetric analysis supported the efficacy of the extracts, showing that emulsions with more intense coloration—reflecting higher phenolic content—were associated with increased antioxidant activity and improved sun protection (SPF) values.
The findings of the current work suggest that the rich phytochemical content of Alnus glutinosa extracts support their potential as natural, multifunctional ingredients for the preparation of antioxidant and sun-protective cosmeceutical formulations. Overall, this study provides an adequate and meaningful assessment of alnus enriched cosmeceutical formulations through physicochemical characterization and in vitro SPF evaluation. Although natural extracts, such as A.Glutinosa are generally regarded as safe for dermal application, additional experiments—such as biocompatibility testing with human skin cell lines, three-dimensional skin models, and cellular assays for ROS scavenging and UV photoprotection—would further substantiate the current findings. Incorporating these experiments in future work will reinforce the safety and efficacy evidence, ultimately providing a more comprehensive and scientifically robust evaluation of the studied formulations.
Supplementary Materials
The following supporting information can be downloaded at website of this paper posted on Preprints.org, Figure S1: Compound Discoverer workflow of HPLC/MS analysis.
Author Contributions
N.D.B., E.B. formal analysis, investigation, writing—original draft preparation, D.V, L.K formal analysis, N.N visualization, supervision, review and editing. All authors have read and agreed to the published version of the manuscript. All authors have read and agreed to the published version of the manuscript.
Funding
This research received no external funding.
Institutional Review Board Statement
Not applicable
Informed Consent Statement
Not applicable.
Conflicts of Interest
The authors declare no conflicts of interest.
Abbreviations
The following abbreviations are used in this manuscript:
| A. glutinosa | Alnus Glutinosa |
| DPPH | (2,2-diphenyl-1-picryl-hydrazyl-hydrate) |
| SPF | Sun Protection Factor |
| EtOH | Ethanol |
| BS | Blank sample |
References
- V. Goodarzi, H. Zamani, L. Bajuli, and A. Moradshahi, “Evaluation of antioxidant potential and reduction capacity of some plant extracts in silver nanoparticles’ synthesis,” Mol Biol Res Commun, vol. 3, no. 3, pp. 165–174, 2014, [Online]. Available: http://mbrc.shirazu.ac.ir.
- Irshad, R. Jawad, Q. Mushtaq, A. Spalletta, P. Martin, and U. Ishtiaq, “Determination of antibacterial and antioxidant potential of organic crude extracts from Malus domestica, Cinnamomum verum and Trachyspermum ammi,” Sci Rep, vol. 15, no. 1, Dec. 2025. [CrossRef]
- D. M. Kasote, S. S. Katyare, M. V. Hegde, and H. Bae, “Significance of antioxidant potential of plants and its relevance to therapeutic applications,” Jun. 11, 2015, Ivyspring International Publisher. [CrossRef]
- H. T. Hoang, J. Y. Moon, and Y. C. Lee, “Natural antioxidants from plant extracts in skincare cosmetics: Recent applications, challenges and perspectives,” Dec. 01, 2021, MDPI. [CrossRef]
- Salmon, V. G., Breen, A. L., Kumar, J., Lara, M. J., Thornton, P. E., Wullschleger, S. D., & Iversen, C. M. (2019). Alder distribution and expansion across a tundra hillslope: implications for local N cycling. Frontiers in plant science, 10, 1099.
- L. Skrypnik, N. Grigorev, D. Michailov, M. Antipina, M. Danilova, and A. Pungin, “Comparative study on radical scavenging activity and phenolic compounds content in water bark extracts of alder (Alnus glutinosa (L.) Gaertn.), oak (Quercus robur L.) and pine (Pinus sylvestris L.),” European Journal of Wood and Wood Products, vol. 77, no. 5, pp. 879–890, Sep. 2019. [CrossRef]
- Ren, X., He, T., Chang, Y., Zhao, Y., Chen, X., Bai, S., Wang, L., Shen, M., & She, G. (2017). The genus Alnus, a comprehensive outline of its chemical constituents and biological activities. Molecules, 22(8), 1383.
- Dinić, J., Novaković, M., Podolski-Renić, A., Stojković, S., Mandić, B., Tešević, V., Vajs, V,. Isaković, A,. & Pešić, M. (2014). Antioxidative activity of diarylheptanoids from the bark of black alder (Alnus glutinosa) and their interaction with anticancer drugs. Planta medica, 80(13), 1088-1096.
- Sukhikh, S., Ivanova, S., Skrypnik, L., Bakhtiyarova, A., Larina, V., Krol, O., Prosekov, A., Frolov, A., Povydysh, M., & Babich, O. (2022). Study of the Antioxidant Properties of Filipendula ulmaria and Alnus glutinosa. Plants, 11(18), 2415.
- Ratz-Lyko, J. Arct, and K. Pytkowska, “Methods for evaluation of cosmetic antioxidant capacity,” Skin Research and Technology, vol. 18, no. 4, pp. 421–430, Nov. 2012. [CrossRef]
- T. Dinkova-Kostova, “Phytochemicals as protectors against ultraviolet radiation: Versatility of effects and mechanisms,” Oct. 2008. [CrossRef]
- K. B. Chakraborty and G. Scott, “MECHANISMS OF ANTIOXIDANT ACTION: SYNERGISM BETWEEN ANTIOXIDANTS AND ‘U.V. ABSORBERS,’” Pergamon Press, 1977.
- Schuster, N. Ortmayr, G. J. Oostingh, and B. Stelzhammer, “Compounds Extracted from Larch, Birch bark, Douglas Fir, and Alder Woods with Four Different Solvents: Effects on Five Skin-related Microbes.”.
- N. Tsouka, D. Lazari, N. Nikolaidis, K. Dimitriadis, E. Vouvoudi, and K. Theodoropoulos, “Dyeing of Cotton and Wool Fibers with the Aqueous Extract of Alnus glutinosa: Evaluation of Their Ultraviolet Protection Factor, Their Color fastness and the Antioxidant Activity of the Aqueous Extract,” Fibers and Polymers, vol. 25, no. 5, pp. 1825–1833, May 2024. [CrossRef]
- S. Dahija, S. Haverić, J. Čakar, and A. Parić, “Antimicrobial and cytotoxic activity of Alnus glutinosa (L.) Gaertn., A. incana (L.) Moench, and A. viridis (Chaix) DC. extracts,” Journal of Health Sciences, vol. 6, no. 2, pp. 100–104, Jul. 2016. [CrossRef]
- X. Pan, G. Niu, and H. Liu, “Microwave-assisted extraction of tea polyphenols and tea caffeine from green tea leaves.” [Online]. Available: www.elsevier.com/locate/cep.
- Schymanski, E. L., Jeon, J., Gulde, R., Fenner, K., Ruff, M., Singer, H. P., & Hollender, J. (2014). Identifying small molecules via high resolution mass spectrometry: communicating confidence.
- Bikiaris, N. D., Michailidou, G., Lazaridou, M., Christodoulou, E., Gounari, E., Ofrydopoulou, A., Lambropoulou, A., Vergkizi-Nikolakaki, S., Lykidou, S., & Nikolaidis, N. (2020). Innovative skin product emulsions with enhanced antioxidant, antimicrobial and UV protection properties containing nanoparticles of pure and modified chitosan with encapsulated fresh pomegranate juice. Polymers, 12(7), 1542.
- E. Dalla, I. Koumentakou, N. Bikiaris, E. Balla, S. Lykidou, and N. Nikolaidis, “Formulation, Characterization and Evaluation of Innovative O/W Emulsions Containing Curcumin Derivatives with Enhanced Antioxidant Properties,” Antioxidants, vol. 11, no. 11, Nov. 2022. [CrossRef]
- N. D. Bikiaris, I. Koumentakou, S. Lykidou, and N. Nikolaidis, “Innovative Skin Product O/W Emulsions Containing Lignin, Multiwall Carbon Nanotubes and Graphene Oxide Nanoadditives with Enhanced Sun Protection Factor and UV Stability Properties,” Applied Nano, vol. 3, no. 1, pp. 1–15, Jan. 2022. [CrossRef]
- Dutra, E. A., Oliveira, D. A. G. D. C., Kedor-Hackmann, E. R. M., & Santoro, M. I. R. M. (2004). Determination of sun protection factor (SPF) of sunscreens by ultraviolet spectrophotometry. Revista Brasileira de Ciências Farmacêuticas, 40, 381-385.
- R. M. Sayre, P. P. Agin, G. J. LeVee, and E. Marlowe, “A COMPARISON OF IN VIVO AND IN VITRO TESTING OF SUNSCREENING FORMULAS,” Photochem Photobiol, vol. 29, no. 3, pp. 559–566, 1979. [CrossRef]
- M. Šicklep and M. Čandek-Potokar, “Pork color measurement as affected by bloom time and measurement location,” Journal of Muscle Foods, vol. 18, no. 1, pp. 78–87, Jan. 2007. [CrossRef]
- H. Nawaz, M. A. Shad, N. Rehman, H. Andaleeb, and N. Ullah, “Effect of solvent polarity on extraction yield and antioxidant properties of phytochemicals from bean (Phaseolus vulgaris) seeds,” Brazilian Journal of Pharmaceutical Sciences, vol. 56, 2020. [CrossRef]
- Ghasemzadeh, H. Z. E. Jaafar, and A. Rahmat, “Effects of solvent type on phenolics and flavonoids content and antioxidant activities in two varieties of young ginger (Zingiber officinale Roscoe) extracts,” Journal of Medicinal Plants Research, vol. 5, no. 7, pp. 1147–1154, 2011, [Online]. Available: http://www.academicjournals.org/JMPR.
- N. Ghaffar and A. Perveen, “Solvent polarity effects on extraction yield, phenolic content, and antioxidant properties of Malvaceae family seeds: a comparative study,” N Z J Bot, 2024. [CrossRef]
- E. H. Anouar, J. Gierschner, J. L. Duroux, and P. Trouillas, “UV/Visible spectra of natural polyphenols: A time-dependent density functional theory study,” Food Chem, vol. 131, no. 1, pp. 79–89, Mar. 2012. [CrossRef]
- Felföldi-Gáva, S. Szarka, B. Simándi, B. Blazics, B. Simon, and Á. Kéry, “Supercritical fluid extraction of Alnus glutinosa (L.) Gaertn.,” Journal of Supercritical Fluids, vol. 61, pp. 55–61, Jan. 2012. [CrossRef]
- Daneshfar, H. S. Ghaziaskar, and N. Homayoun, “Solubility of gallic acid in methanol, ethanol, water, and ethyl acetate,” J Chem Eng Data, vol. 53, no. 3, pp. 776–778, Mar. 2008. [CrossRef]
- M. Fedor and M. J. Toda, “Investigating Hydrogen Bonding in Phenol Using Infrared Spectroscopy and Computational Chemistry,” J Chem Educ, vol. 91, no. 12, pp. 2191–2194, Dec. 2014. [CrossRef]
- Kledecka, A., Siejak, P., Pratap-Singh, A., Kowalczewski, P. Ł., Fathordoobady, F., Jarzębski, M., & Smułek, W. (2022). Extracts from Frangula alnus Mill. and Their Effects on Environmental and Probiotic Bacteria. Plants, 11(20), 2719.
- D. Sethi, N. Jada, A. Tiwari, S. Ramasamy, T. Dash, and S. Pandey, “Photocatalytic destruction of Escherichia coli in water by V2O5/TiO2,” J Photochem Photobiol B, vol. 144, pp. 68–74, 2015. [CrossRef]
- G. Telysheva, T. Dizhbite, O. Bikovens, J. Ponomarenko, S. Janceva, and J. Krasilnikova, “Structure and antioxidant activity of diarylheptanoids extracted from bark of grey alder (Alnus incana) and potential of biorefinery-based bark processing of European trees,” in Holzforschung, Jun. 2011, pp. 623–629. [CrossRef]
- F. Rippke, E. Berardesca, and T. M. Weber, “PH and Microbial Infections,” Current Problems in Dermatology (Switzerland), vol. 54, pp. 87–94, 2018. [CrossRef]
- M. Uyama, K. Ikuta, T. Teshigawara, K. Watanabe, and R. Miyahara, “The viscosity stability of O/W emulsion containing α-gel through an ionic-complex system,” 2013. [Online]. Available: http://www.jstage.jst.go.jp/browse/jos/http://mc.manusriptcentral.com/jjocs.
- Ali, N. Akhtar, and H. M. S. Khan, “Assessment of physical stability and antioxidant activity of polysiloxane polyalkyl polyether copolymer-based creams,” J Chem, 2013. [CrossRef]
- V. M. Di Mambro and M. J. V. Fonseca, “Assays of physical stability and antioxidant activity of a topical formulation added with different plant extracts,” J Pharm Biomed Anal, vol. 37, no. 2, pp. 287–295, Feb. 2005. [CrossRef]
- N. Wathoni, A. Haerani, N. Yuniarsih, and R. Haryanti, “A review on herbal cosmetics in Indonesia,” 2018, Innovare Academics Sciences Pvt. Ltd. [CrossRef]
- J. D’Orazio, S. Jarrett, A. Amaro-Ortiz, and T. Scott, “UV radiation and the skin,” 2013, MDPI AG. [CrossRef]
- L. Li, L. Chong, T. Huang, Y. Ma, Y. Li, and H. Ding, “Natural products and extracts from plants as natural UV filters for sunscreens: A review,” Jun. 01, 2023, John Wiley and Sons Inc. [CrossRef]
- E. M. Hussen and S. A. Endalew, “In vitro antioxidant and free-radical scavenging activities of polar leaf extracts of Vernonia amygdalina,” BMC Complement Med Ther, vol. 23, no. 1, Dec. 2023. [CrossRef]
- Rosado, C., Tokunaga, V. K., Sauce, R., De Oliveira, C. A., Sarruf, F. D., Parise-Filho, R., Elisabete, M., De Almeida, T.S., Robles Velasco, M, V,. & Baby, A. R. (2019). Another reason for using caffeine in dermocosmetics: Sunscreen adjuvant. Frontiers in physiology, 10, 519.
- S. Bhattacharya and A. P. Sherje, “Development of resveratrol and green tea sunscreen formulation for combined photoprotective and antioxidant properties,” J Drug Deliv Sci Technol, vol. 60, Dec. 2020. [CrossRef]
- M. Y. Park, H. J. Kwon, and M. K. Sung, “Dietary aloin, aloesin, or aloe-gel exerts anti-inflammatory activity in a rat colitis model,” Life Sci, vol. 88, no. 11–12, pp. 486–492, Mar. 2011. [CrossRef]
- Ayaz, M., Junaid, M., Ahmed, J., Ullah, F., Sadiq, A., Ahmad, S., & Imran, M. (2014). Phenolic contents, antioxidant and anticholinesterase potentials of crude extract, subsequent fractions and crude saponins from Polygonum hydropiper L. BMC complementary and alternative medicine, 14(1), 145.
- Baral, M., Biswas, S., Chakraborty, S., Ghosh, A. K., da Silva, J. A. T., Panda, S., & Chakraborty, P. (2010). In vitro antioxidant activity of the whole plant of Amaranthus spinosus Linn. International Journal of Biomedical and Pharmaceutical Sciences, 5(1), 75-78.
- Imamović, I. Ivazović, A. Alispahić, E. Bečić, M. Dedić, and A. Dacić, “Assessment of the suitability of methods for testing the antioxidant activity of anti-aging creams,” Applied Sciences (Switzerland), vol. 11, no. 4, pp. 1–14, Feb. 2021. [CrossRef]
- Ali, N. Akhtar, M. S. Khan, M. T. Khan, A. Ullah, and M. I. Shah, “Effect of Moringa oleifera on undesireble skin sebum secretions of sebaceous glands observed during winter season in humans,” 2013.
- Smeriglio, A., D’Angelo, V., Cacciola, A., Ingegneri, M., Raimondo, F. M., Trombetta, D., & Germanò, M. P. (2022). New insights on phytochemical features and biological properties of Alnus glutinosa stem bark. Plants, 11(19), 2499.
- L. Angeli, S. Imperiale, Y. Ding, M. Scampicchio, and K. Morozova, “A novel stoichio-kinetic model for the dpph• assay: The importance of the side reaction and application to complex mixtures,” Antioxidants, vol. 10, no. 7, Jul. 2021. [CrossRef]
- K. Mishra, H. Ojha, and N. K. Chaudhury, “Estimation of antiradical properties of antioxidants using DPPH- assay: A critical review and results,” Food Chem, vol. 130, no. 4, pp. 1036–1043, Feb. 2012. [CrossRef]
Figure 1.
Illustration of the experimental procedure for the preparation of blank emulsions and emulsions containing A.glutinosa extracts.
Figure 1.
Illustration of the experimental procedure for the preparation of blank emulsions and emulsions containing A.glutinosa extracts.
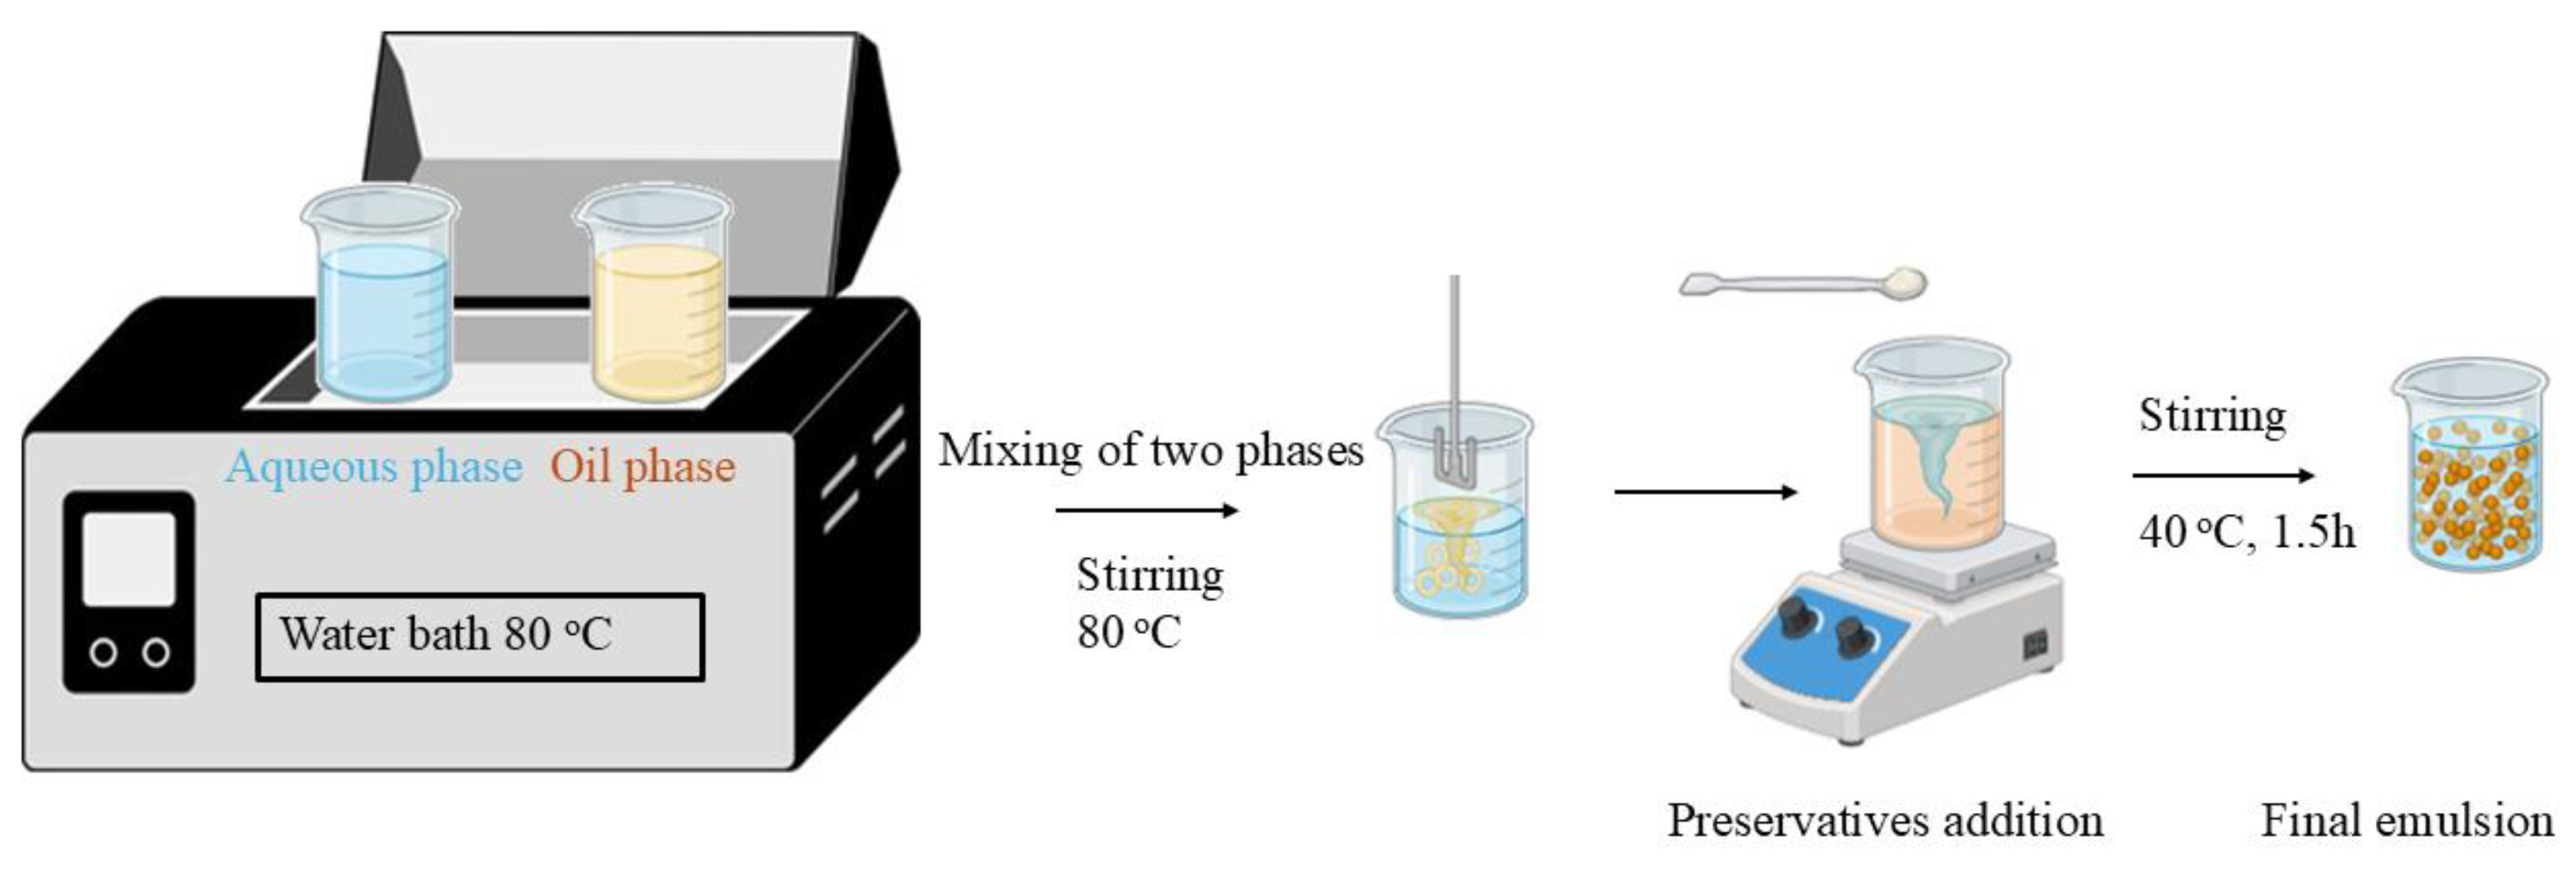
Figure 2.
UV–VIS spectrum for Alnus Glutinosa extracts via ultrasound at 25 and 70 °C, reflux boiling and microwave assisted extraction.
Figure 2.
UV–VIS spectrum for Alnus Glutinosa extracts via ultrasound at 25 and 70 °C, reflux boiling and microwave assisted extraction.
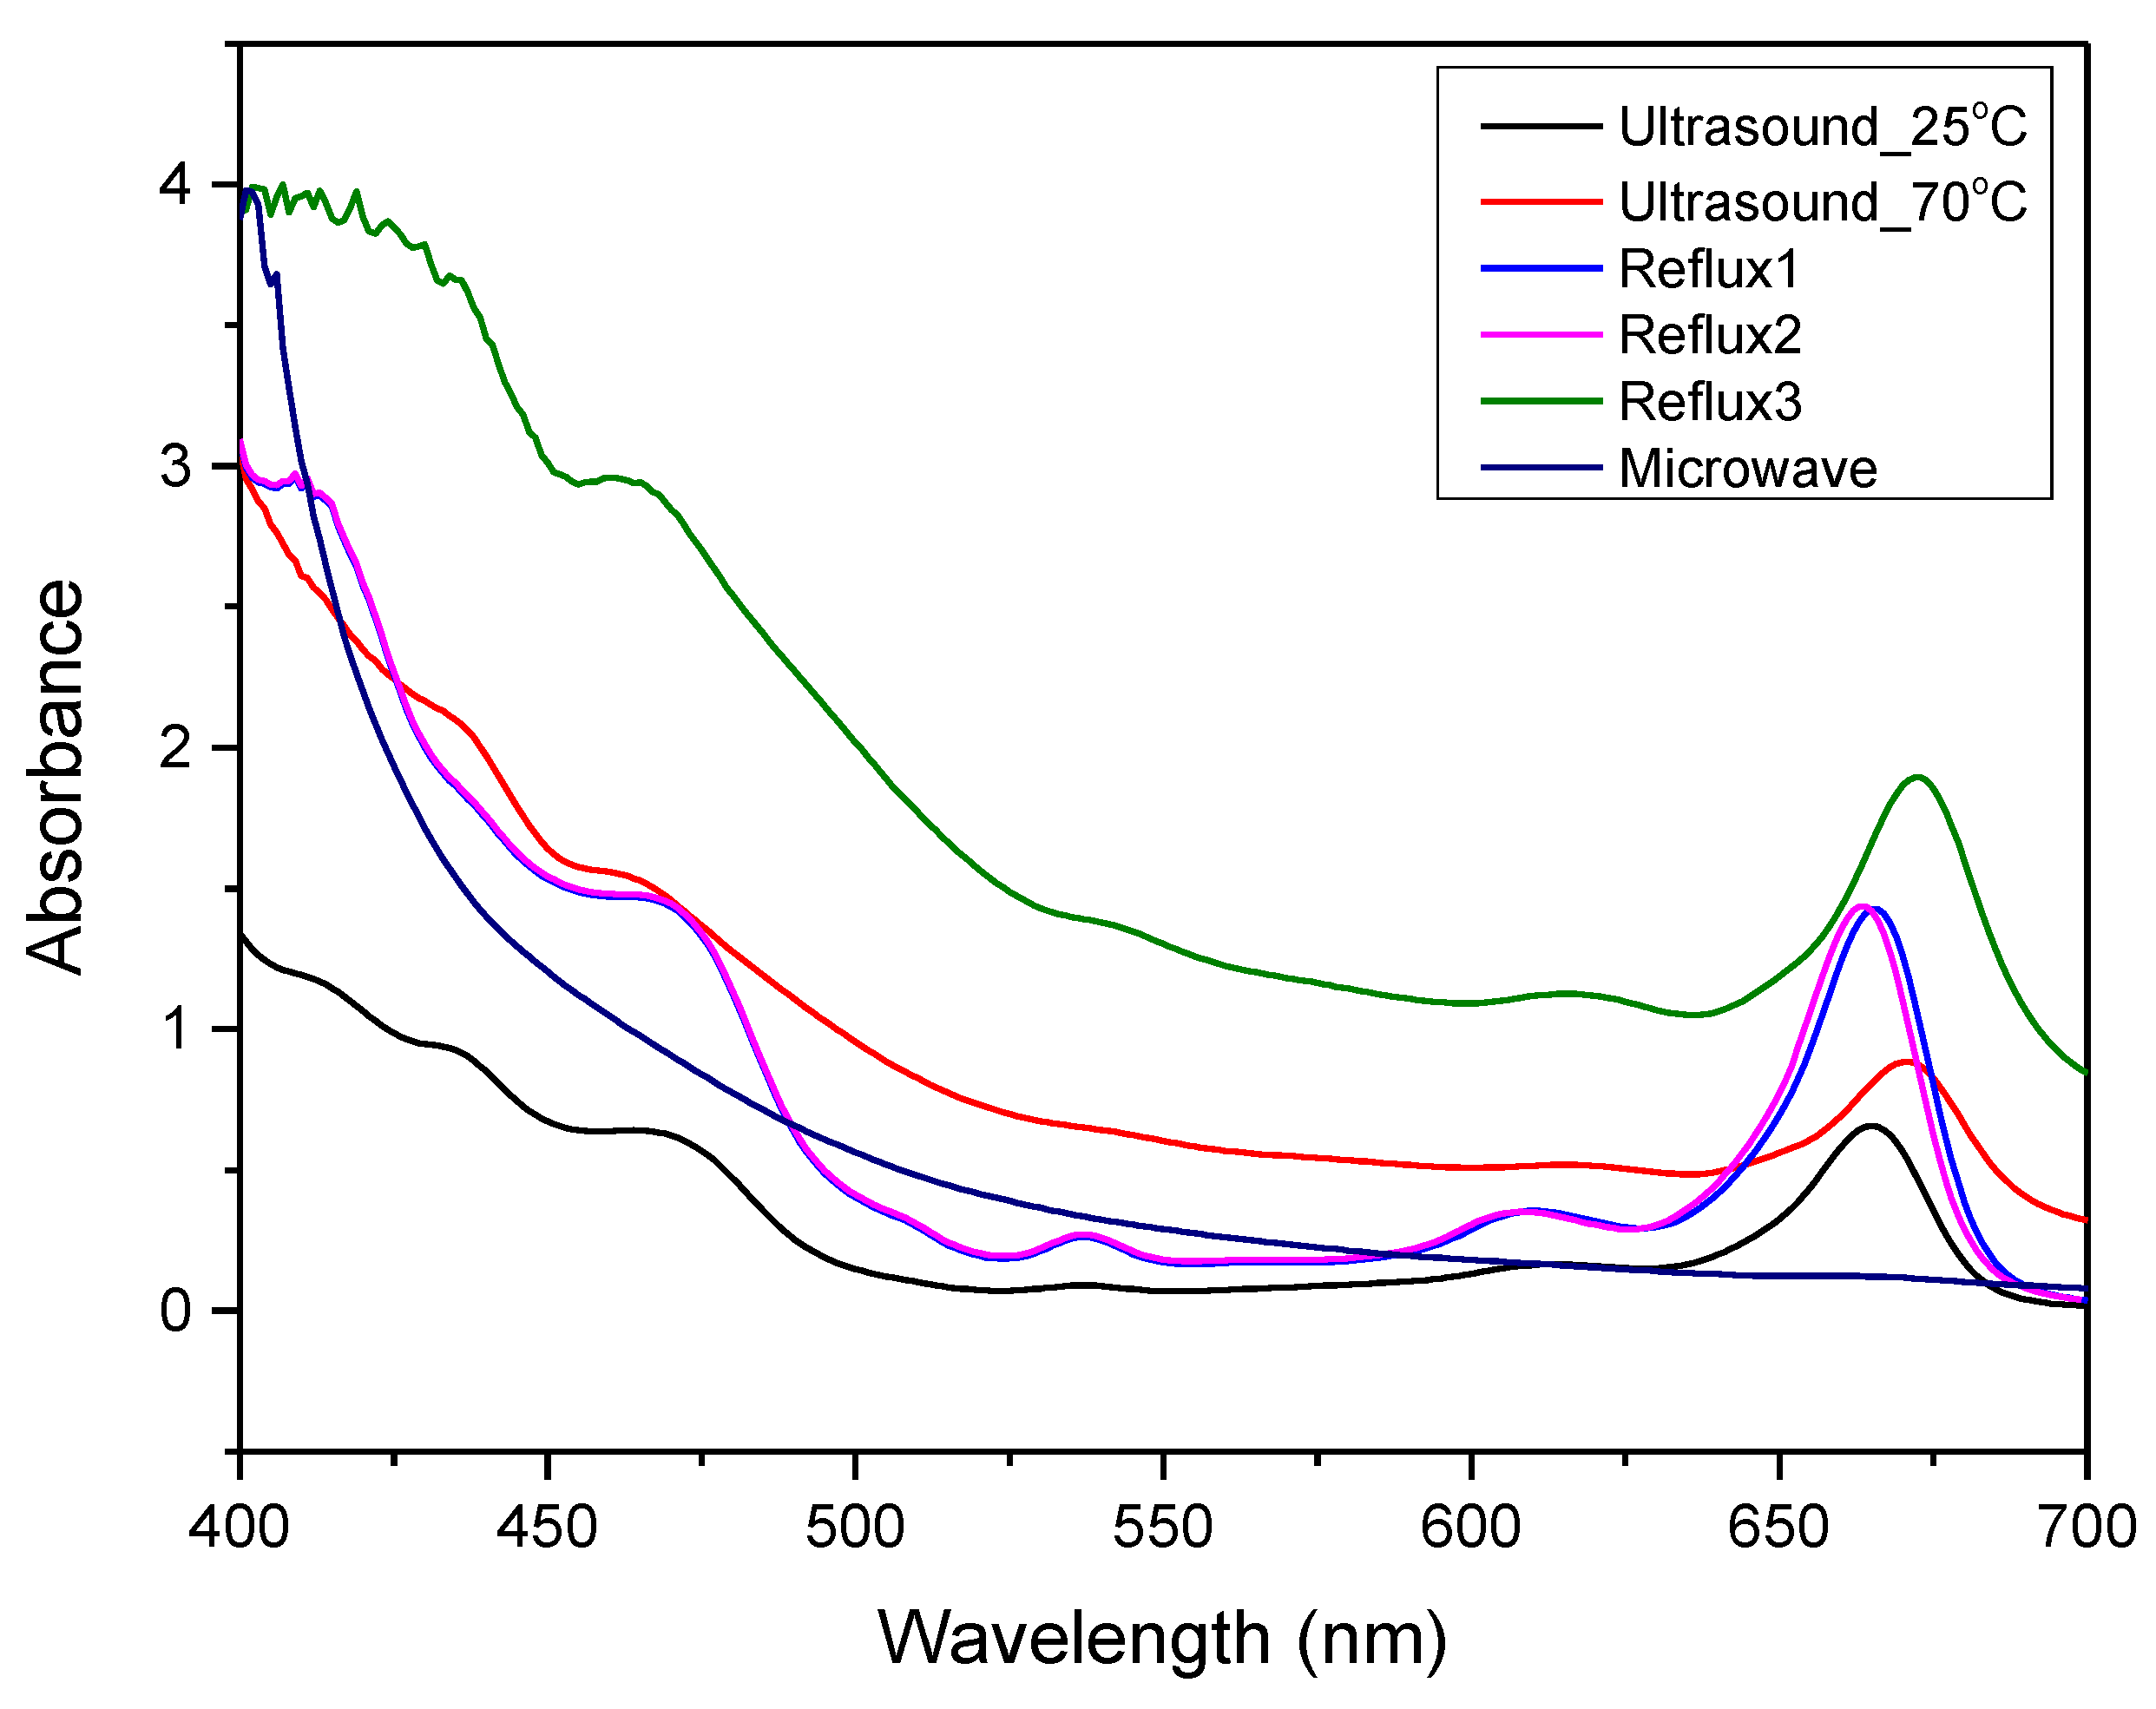
Figure 3.
FT-IR spectrum of Alnus Glutinosa reflux extracts in water and ethanol.
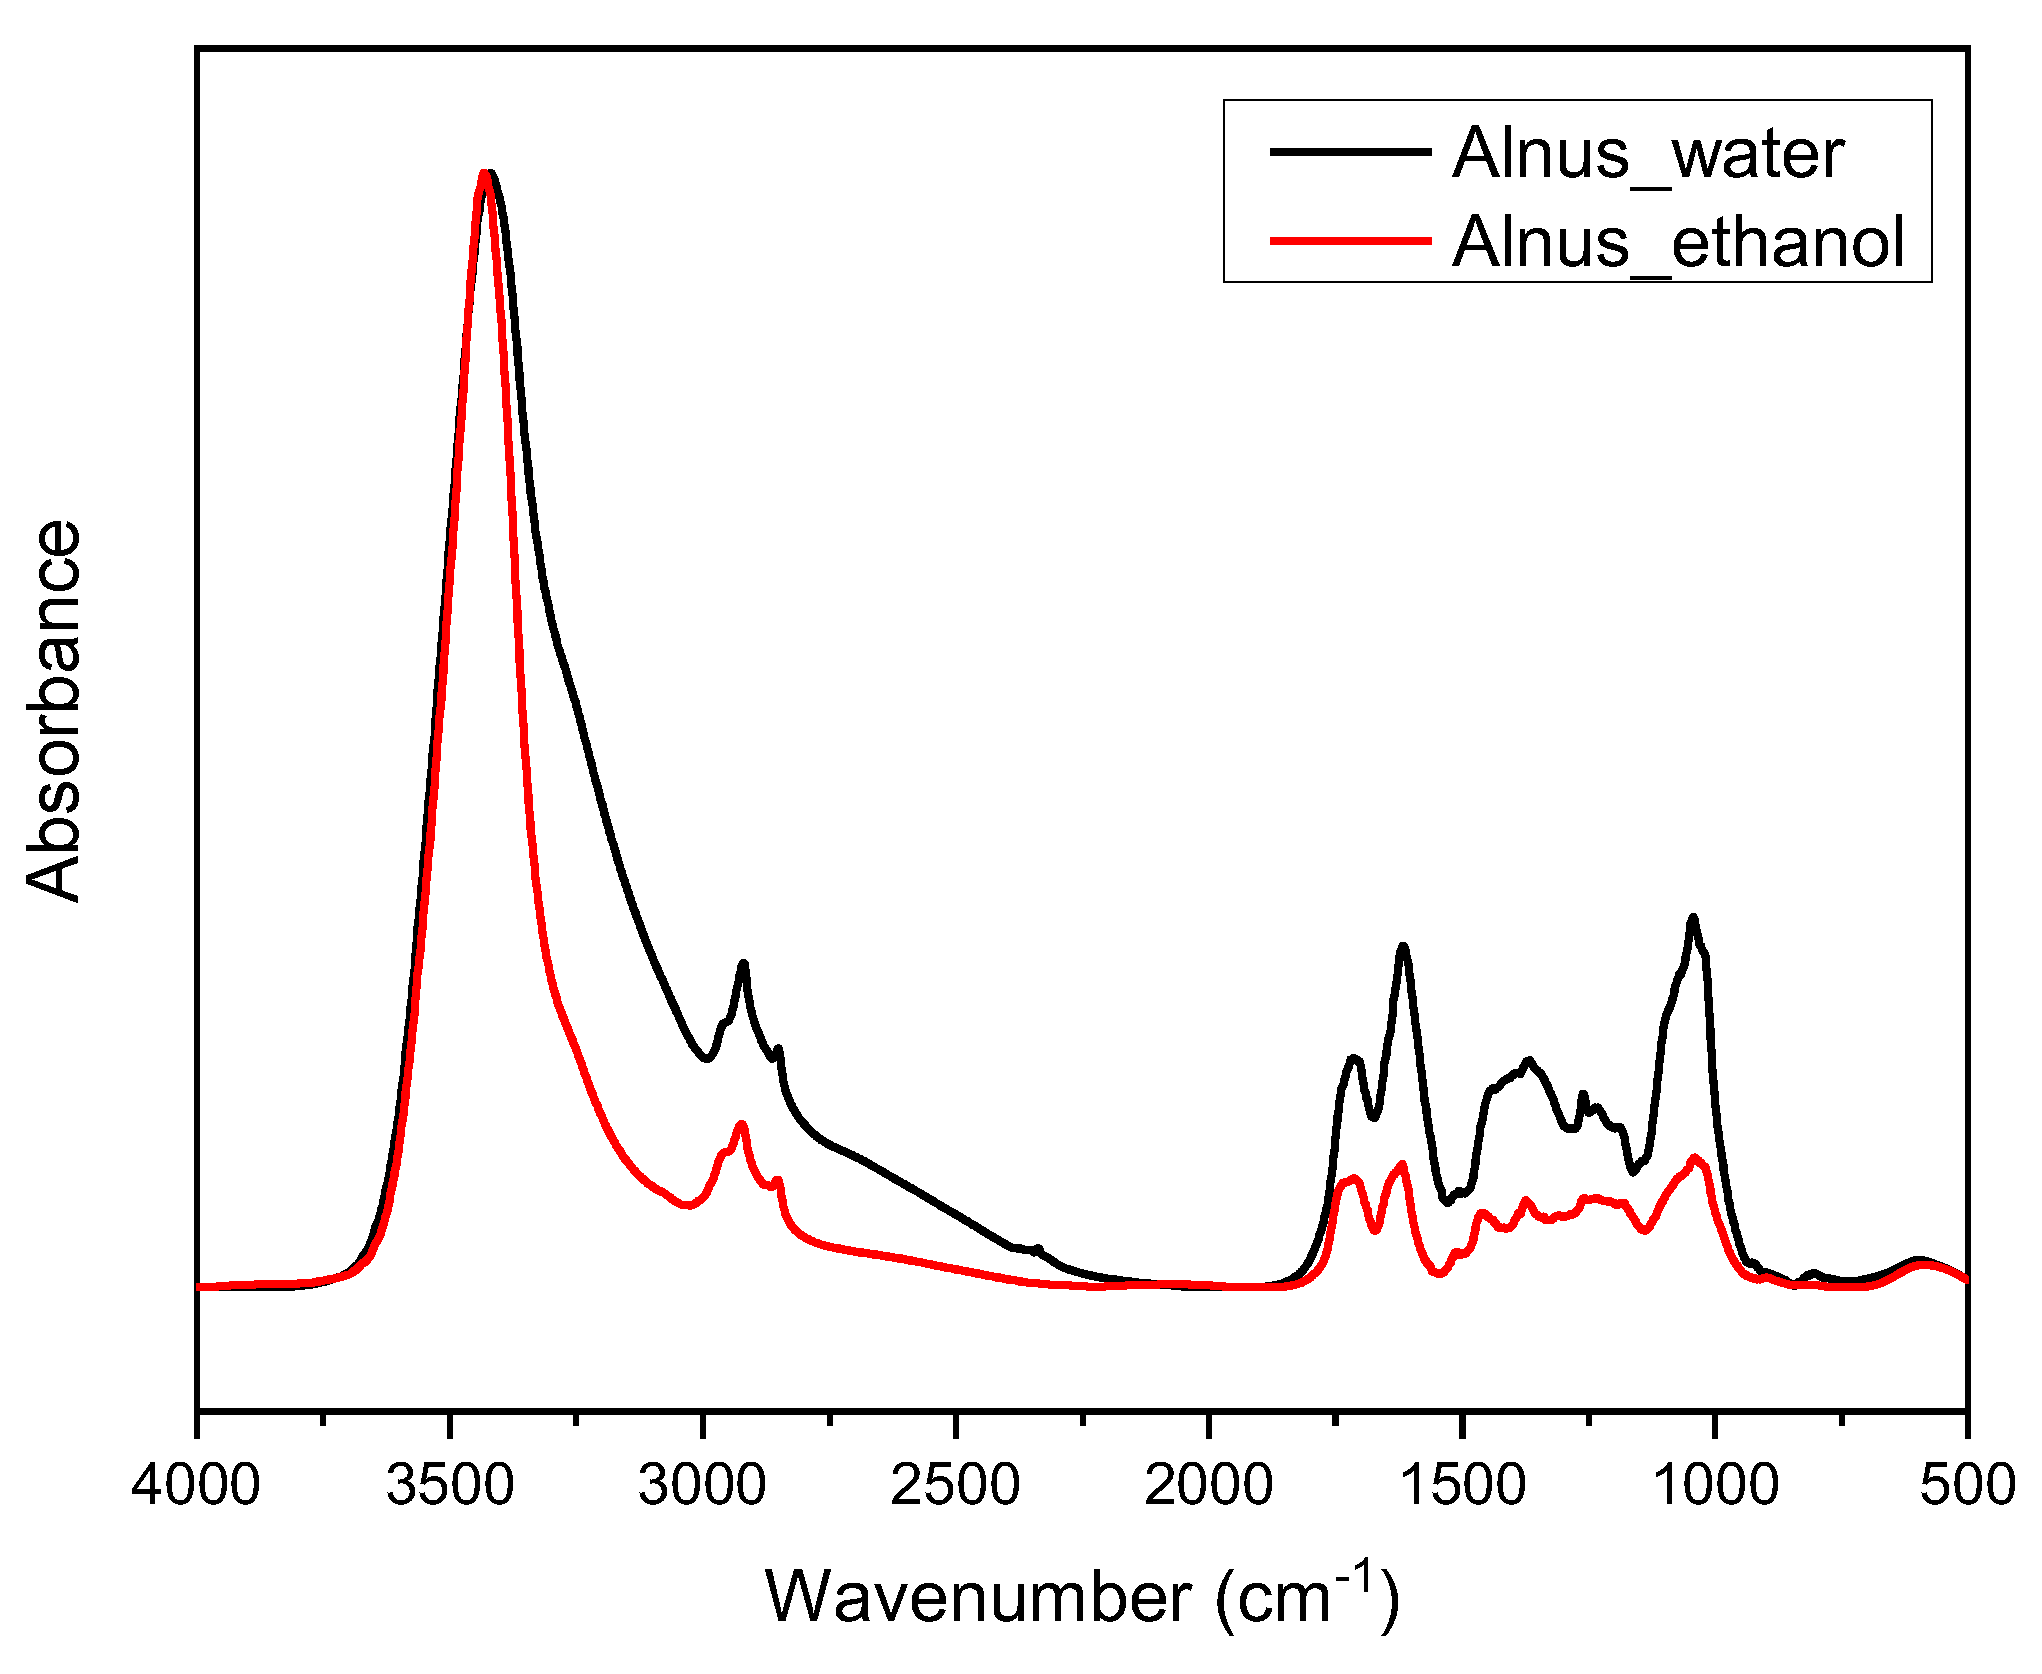
Figure 4.
pH measurements of the prepared creams over 35 days of storage.
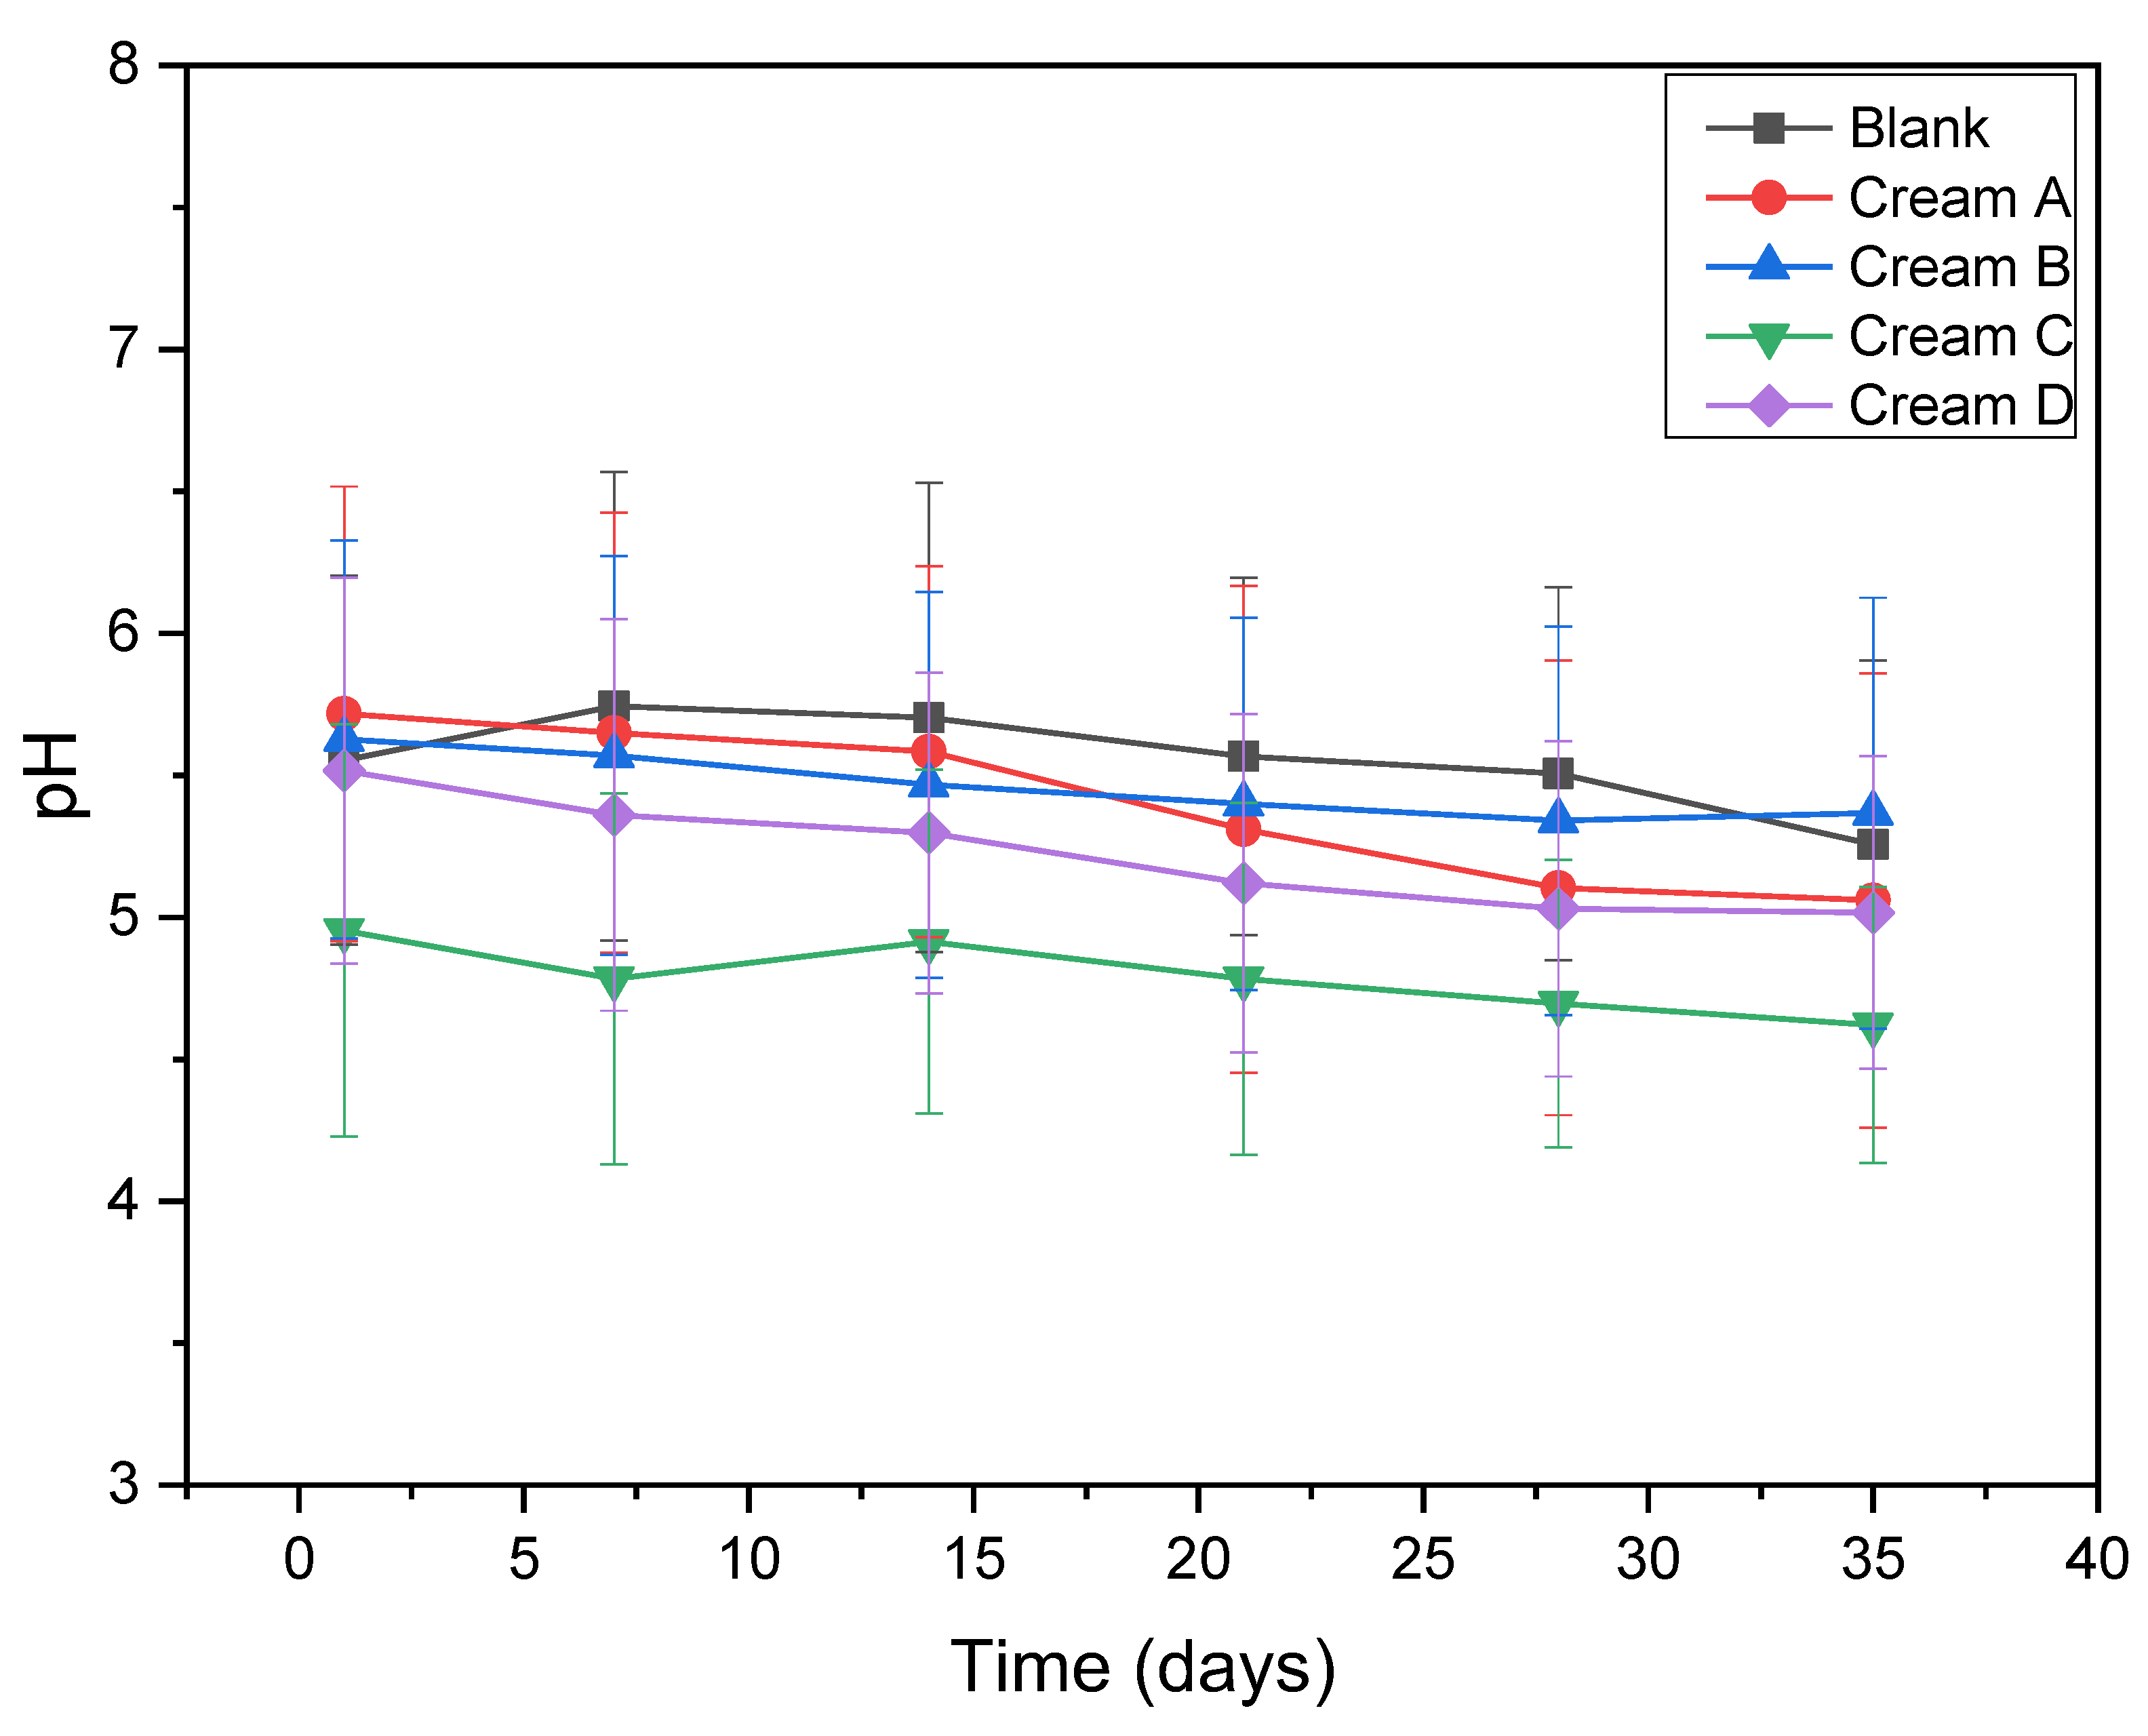
Figure 5.
Rheological profiles of the prepared emulsions measured at 50 and 100 rpm over 35 days.
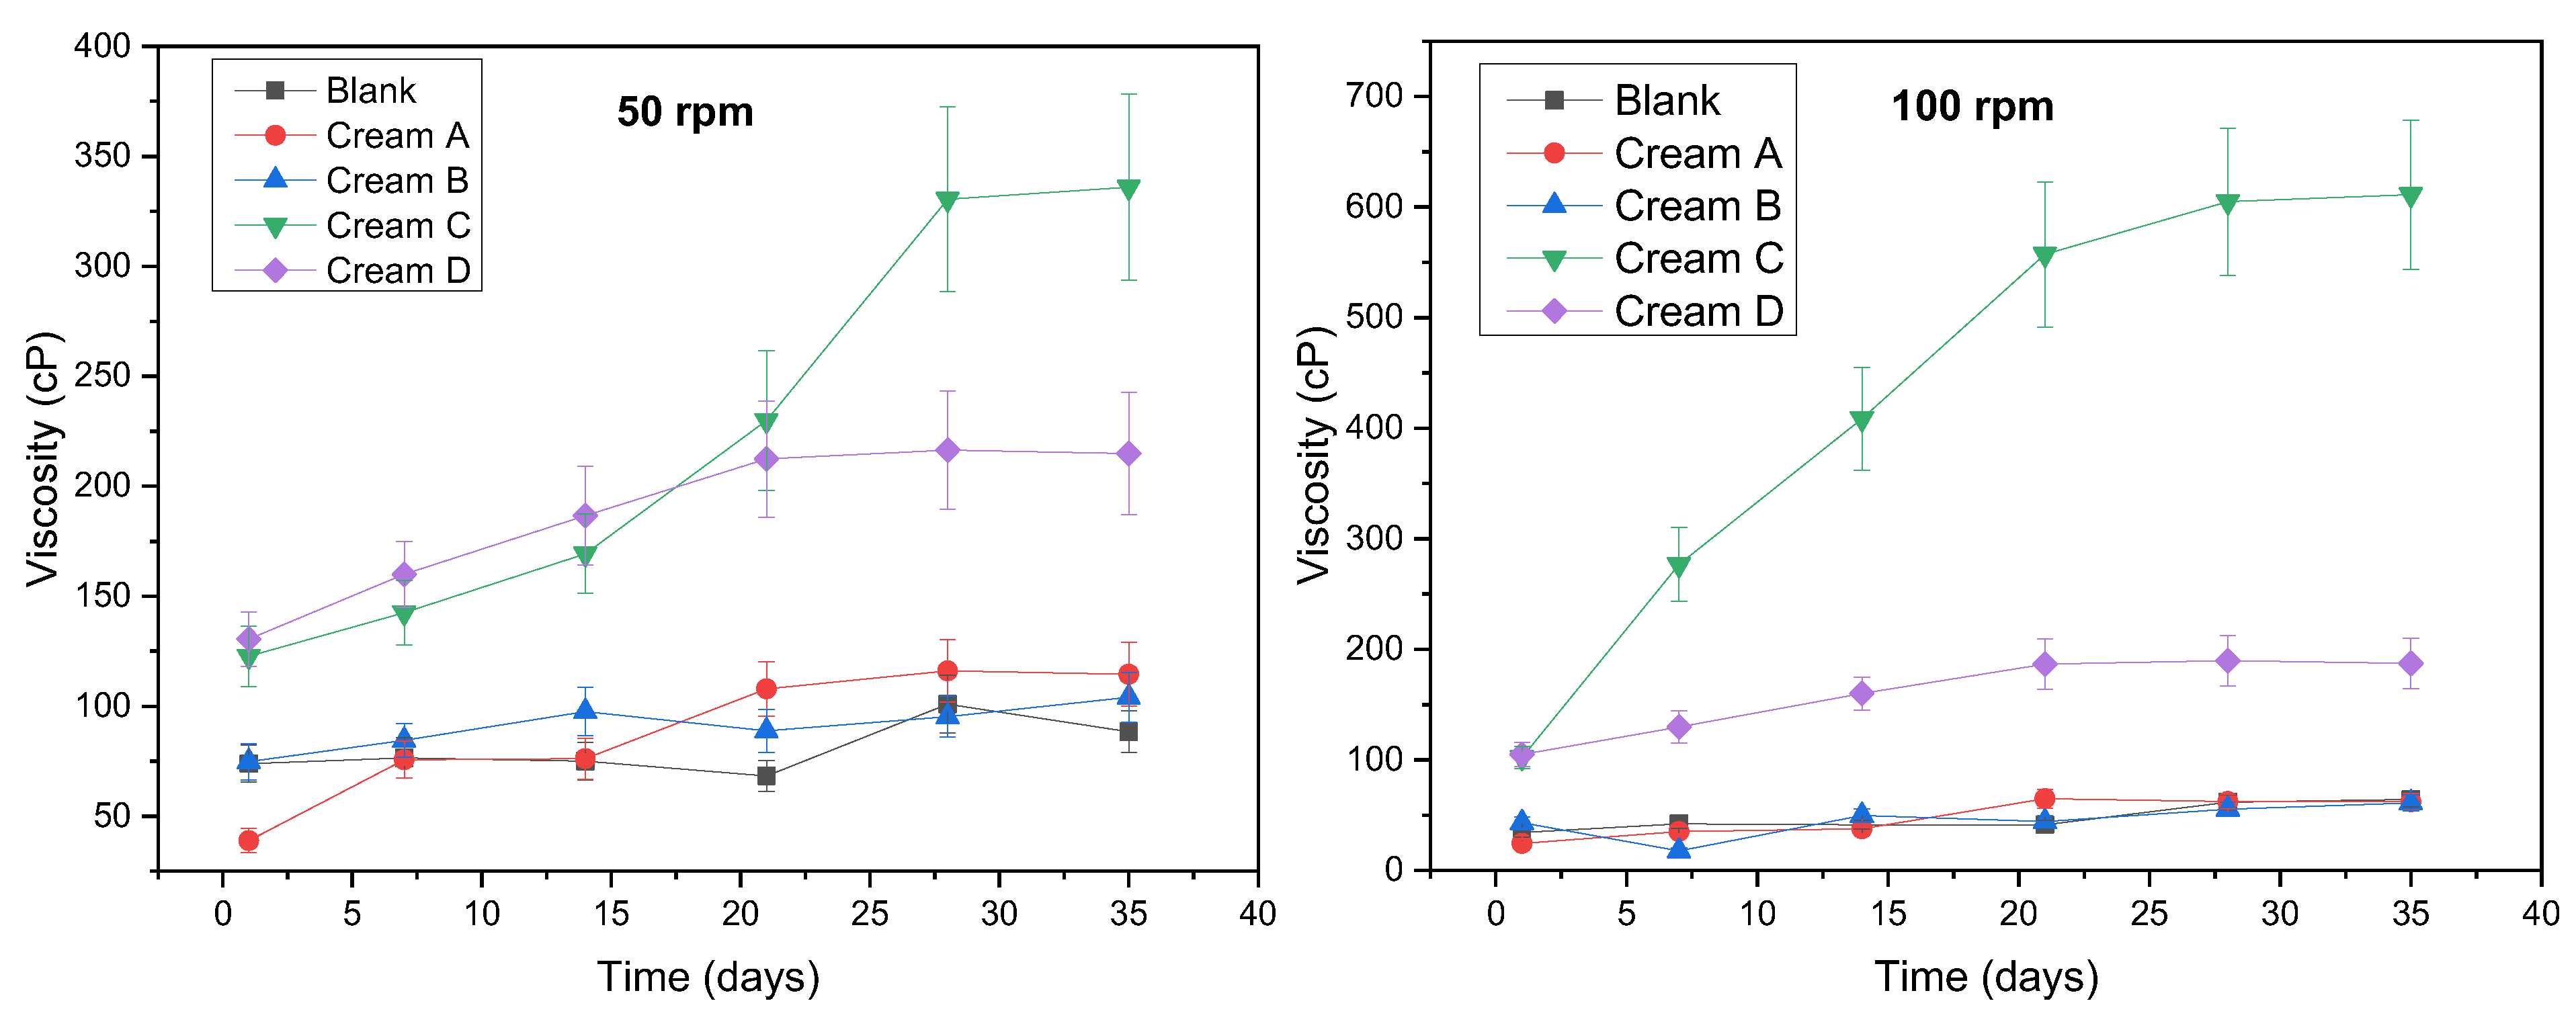
Figure 6.
Color observation of the prepared creams.
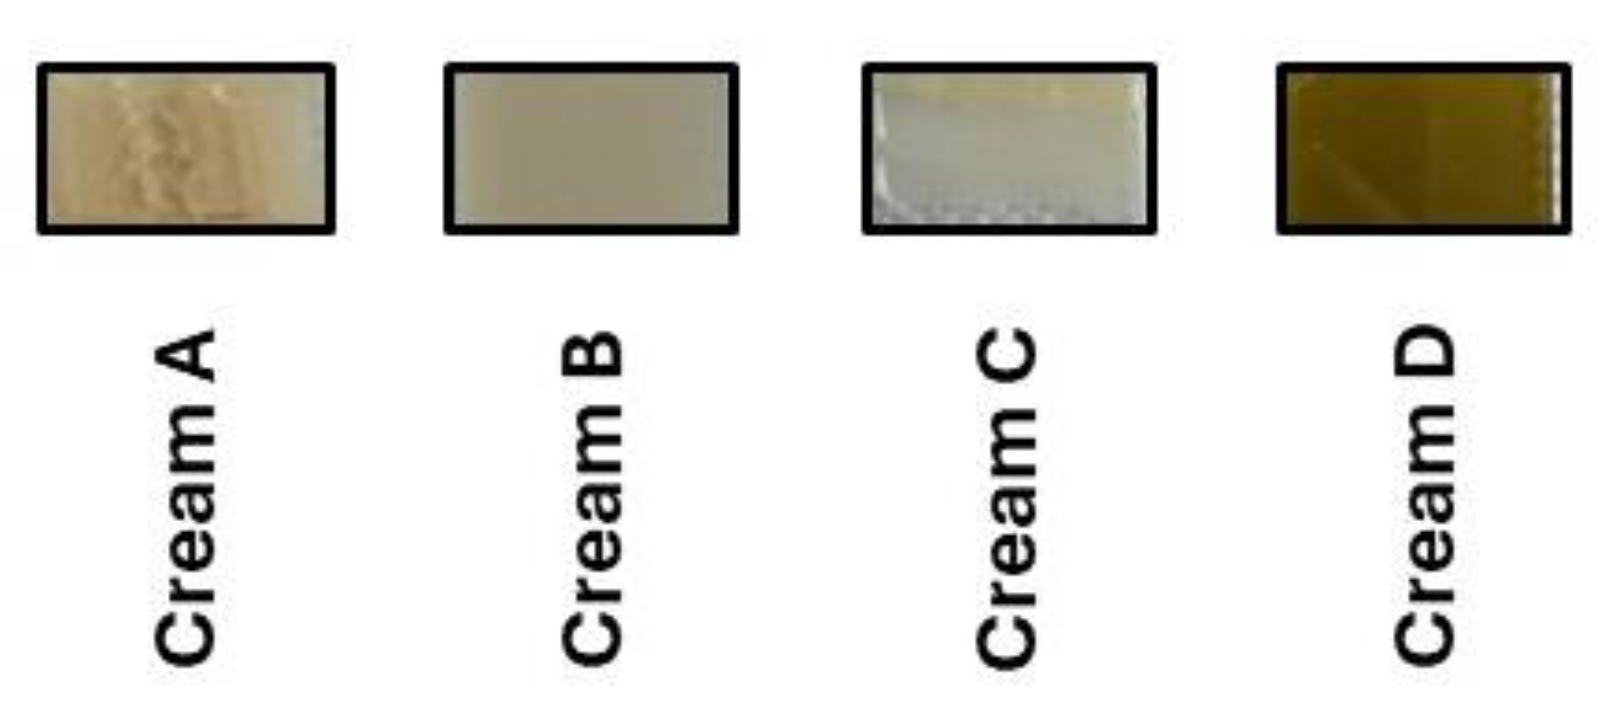
Figure 7.
SPF values of the blank emulsion, cream A, B, C and D. One-way ANOVA showed a significant effect of the different emulsions on SPF. *p<0.05, **p<0.01, ***p<0.001.
Figure 7.
SPF values of the blank emulsion, cream A, B, C and D. One-way ANOVA showed a significant effect of the different emulsions on SPF. *p<0.05, **p<0.01, ***p<0.001.
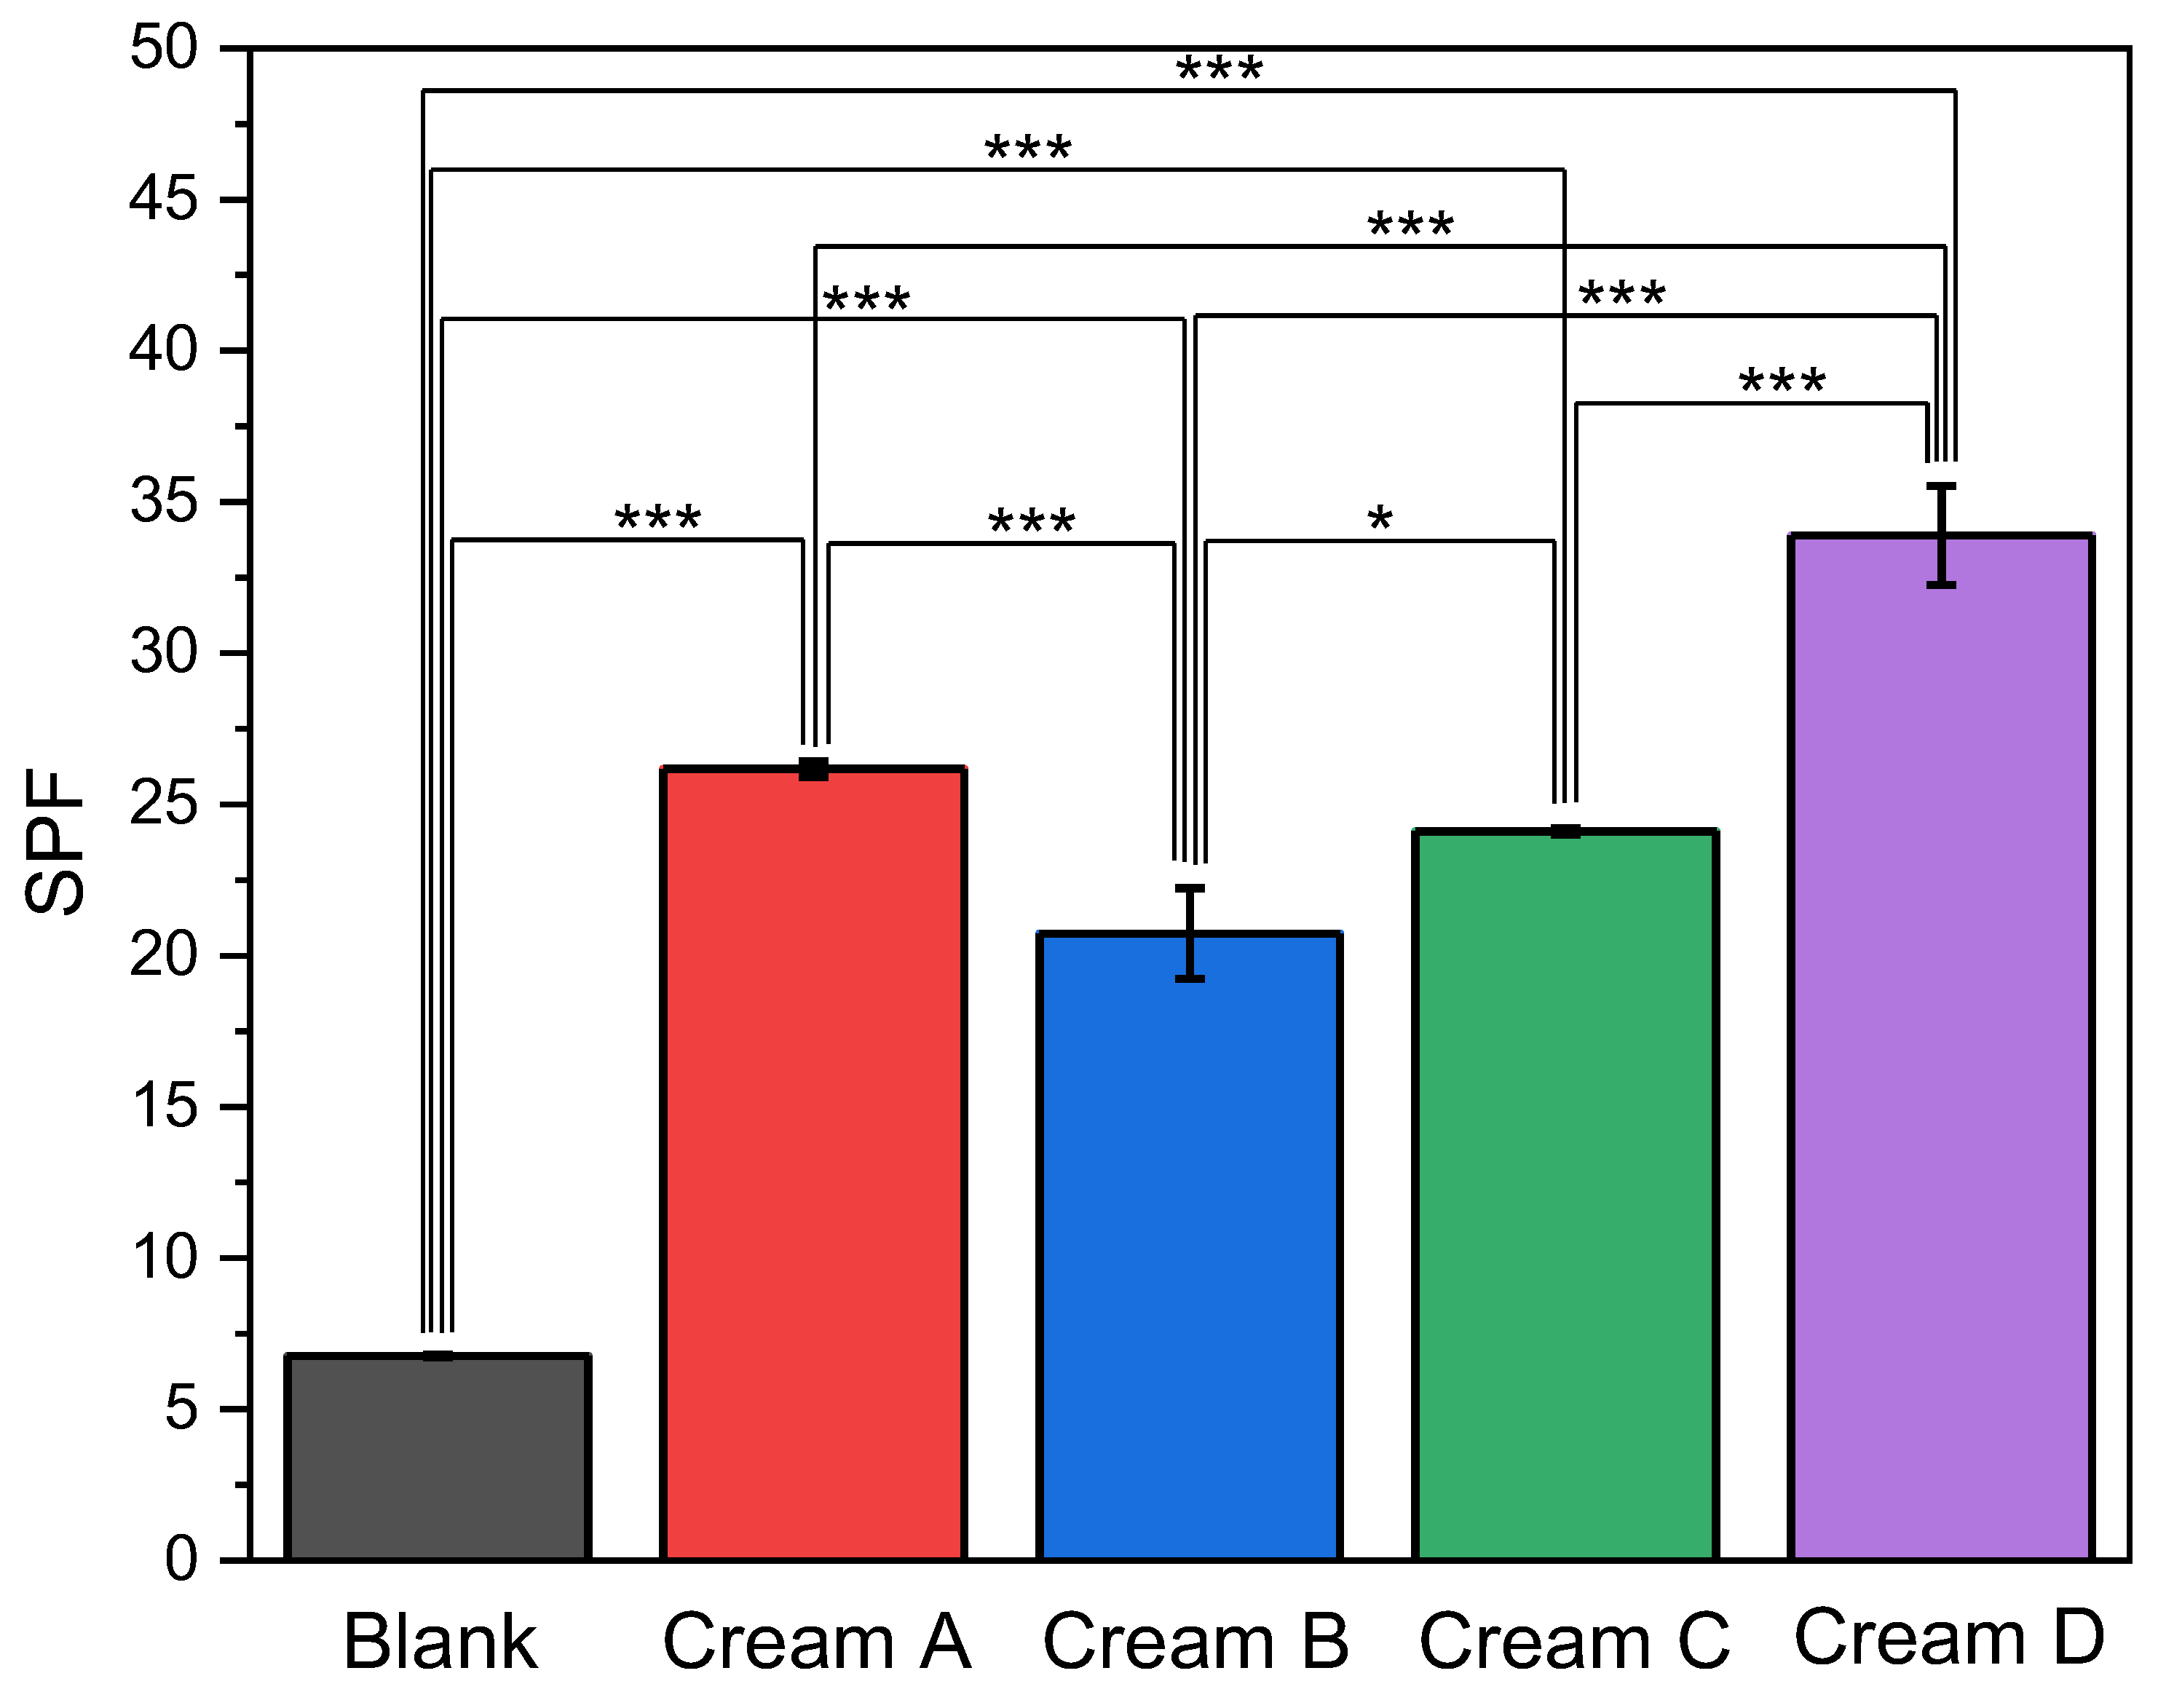
Figure 8.
Antioxidant activity of the prepared creams measured over 90 minutes under three conditions: undiluted (as received), 1:10 dilution, and 1:100 dilution.
Figure 8.
Antioxidant activity of the prepared creams measured over 90 minutes under three conditions: undiluted (as received), 1:10 dilution, and 1:100 dilution.
| Process | Temperature (oC) | Time (hours) | Solvent |
| Soxhlet 1 | 70 | 3 | Water |
| Soxhlet 2 | 90 | 3 | Water |
| Soxhlet 3 | 70 | 1 | Ethanol |
Table 3.
Extractive yield (%) of different extract methods.
| Extract | Extractive yield (%) |
| Ultrasound_25oC | 8,20 ± 0,35 |
| Ultrasound_70oC | 14,60 ± 0,50 |
| Soxhlet 1 | 18,40 ± 0,70 |
| Soxhlet 2 | 24,90 ± 0,60 |
| Soxhlet 3 | 42,50 ± 1,10 |
| Microwave | 4,80 ± 0,20 |
Table 4.
Qualitative and quantitative analysis of A. glutinosa Sohxlet extracts by LC—Orbitrap-HRMS analysis.
Table 4.
Qualitative and quantitative analysis of A. glutinosa Sohxlet extracts by LC—Orbitrap-HRMS analysis.
| Compound | Formula | Calc. MW | m/z | RT [min] |
| (1E)-1,7-bis(4-hydroxyphenyl)hept-1-en-3-one | C19H20O3 | 296,14198 | 295,13471 | 7,996 |
| 12-oxo Phytodienoic Acid | C18H28O3 | 292,20499 | 291,19752 | 11,331 |
| 15-Deoxy-Δ12,14-prostaglandin J2-2-glycerol ester | C23H34O5 | 390,23984 | 391,24712 | 10,836 |
| 3-(4-{[1,3-Dihydroxy-1-(4-hydroxy-3-methoxyphenyl)-2-propanyl]oxy}-3-methoxyphenyl)propyl 6-deoxy-alpha-L-mannopyranoside | C26H36O11 | 524,22731 | 523,22004 | 5,701 |
| 3,4,5-trihydroxycyclohex-1-ene-1-carboxylic acid | C7H10O5 | 174,0525 | 173,04517 | 0,843 |
| 3-Methoxy-5,7,3’,4’-tetrahydroxy-flavone | C16H12O7 | 316,0593 | 317,06685 | 7,304 |
| Adenosine | C10H13N5O4 | 267,0977 | 268,10498 | 0,814 |
| Asiatic acid | C30H48O5 | 488,35155 | 487,34427 | 12,551 |
| Azelaic acid | C9H16O4 | 188,10472 | 187,09744 | 6,111 |
| Cafestol | C20H28O3 | 316,20256 | 317,20984 | 11,684 |
| Caffeic acid | C9H8O4 | 180,04196 | 179,03468 | 4,541 |
| Citric acid | C6H8O7 | 192,02685 | 191,01957 | 0,825 |
| Corchorifatty acid F | C18H32O5 | 328,22593 | 327,21865 | 7,641 |
| D-(-)-Fructose | C6H12O6 | 180,0631 | 179,05575 | 0,769 |
| D-(-)-Quinic acid | C7H12O6 | 192,06315 | 191,05587 | 0,819 |
| D(+)-Phenyllactic acid | C9H10O3 | 166,0626 | 165,05533 | 4,999 |
| Docosahexaenoic acid ethyl ester | C24H36O2 | 356,27268 | 357,27996 | 12,17 |
| Gallic acid | C7H6O5 | 170,02114 | 169,01386 | 0,816 |
| Genistein | C15H10O5 | 270,05373 | 269,04629 | 7,428 |
| Gentisic acid | C7H6O4 | 154,02613 | 153,01878 | 0,858 |
| L-Phenylalanine | C9H11NO2 | 165,07974 | 166,08702 | 0,857 |
| L-Tyrosine | C9H11NO3 | 181,07474 | 182,08203 | 0,862 |
| Luteolin | C15H10O6 | 286,0486 | 285,04132 | 7,271 |
| Miquelianin | C21H18O13 | 478,07619 | 477,06891 | 5,675 |
| N-[4-cyano-1-(4-fluorophenyl)-1H-pyrazol-5-yl]cyclohexanecarboxamide | C17H17FN4 O | 312,13715 | 311,12988 | 6,301 |
| Naringenin | C15H12O5 | 272,06939 | 271,0621 | 6,599 |
| Neochlorogenic acid | C16H18O9 | 354,09627 | 353,08899 | 1,889 |
| Oleanolic acid | C30H48O3 | 456,36174 | 455,35446 | 13,408 |
| Pinolenic acid | C18 H30O2 | 278,22554 | 301,21483 | 12,729 |
| Quercetin-3β-D-glucoside | C21H20O12 | 464,09733 | 463,08966 | 5,794 |
| α-Linolenic acid | C18H30 O2 | 278,22546 | 279,23273 | 11,736 |
| (1E)-1,7-bis(4-hydroxyphenyl)hept-1-en-3-one | C19H20O3 | 296,14198 | 295,13471 | 7,996 |
| 12-oxo Phytodienoic Acid | C18H28O3 | 292,20499 | 291,19752 | 11,331 |
| 15-Deoxy-Δ12,14-prostaglandin J2-2-glycerol ester | C23H34O5 | 390,23984 | 391,24712 | 10,836 |
| 3-(4-{[1,3-Dihydroxy-1-(4-hydroxy-3-methoxyphenyl)-2-propanyl]oxy}-3-methoxyphenyl)propyl 6-deoxy-alpha-L-mannopyranoside | C26H36O11 | 524,22731 | 523,22004 | 5,701 |
Table 5.
Measurements obtained from the spectrophotometric color analysis.
| Sample | L* (Lightness) | a* (Red-Green) | b* (Yellow-Blue) | C (Chroma) | h° (Hue Angle) | R% (Reflectance) | K/S (Color Strength) |
| Cream A | 56,04 ± 0,23 | -4,14 ± 0,44 | 14,40 ± 0,30 | 14,88 ± 0,22 | 108,12° | 7,44 (400 nm) | 5,76 |
| Cream B | 48,03 ± 1,46 | -1,46 ± 1,68 | 11,91 ± 0,33 | 11,98 ± 0,32 | 96,13° | 10,84 (482 nm) | 2,05 |
| Cream C | 48,64 ± 1,28 | -0,28 ± 0,99 | 9,68 ± 1,11 | 11,72 ± 0,58 | 93,45° | 5,73 (409 nm) | 1,29 |
| Cream D | 48,63 ± 0,56 | 6,08 ± 0,17 | 17,67 ± 0,83 | 18,80 ± 0,74 | 71,46° | 4,27 (410 nm) | 10,73 |
Disclaimer/Publisher’s Note: The statements, opinions and data contained in all publications are solely those of the individual author(s) and contributor(s) and not of MDPI and/or the editor(s). MDPI and/or the editor(s) disclaim responsibility for any injury to people or property resulting from any ideas, methods, instructions or products referred to in the content. |
© 2025 by the authors. Licensee MDPI, Basel, Switzerland. This article is an open access article distributed under the terms and conditions of the Creative Commons Attribution (CC BY) license (http://creativecommons.org/licenses/by/4.0/).
Copyright: This open access article is published under a Creative Commons CC BY 4.0 license, which permit the free download, distribution, and reuse, provided that the author and preprint are cited in any reuse.


