Submitted:
12 November 2024
Posted:
13 November 2024
You are already at the latest version
Abstract
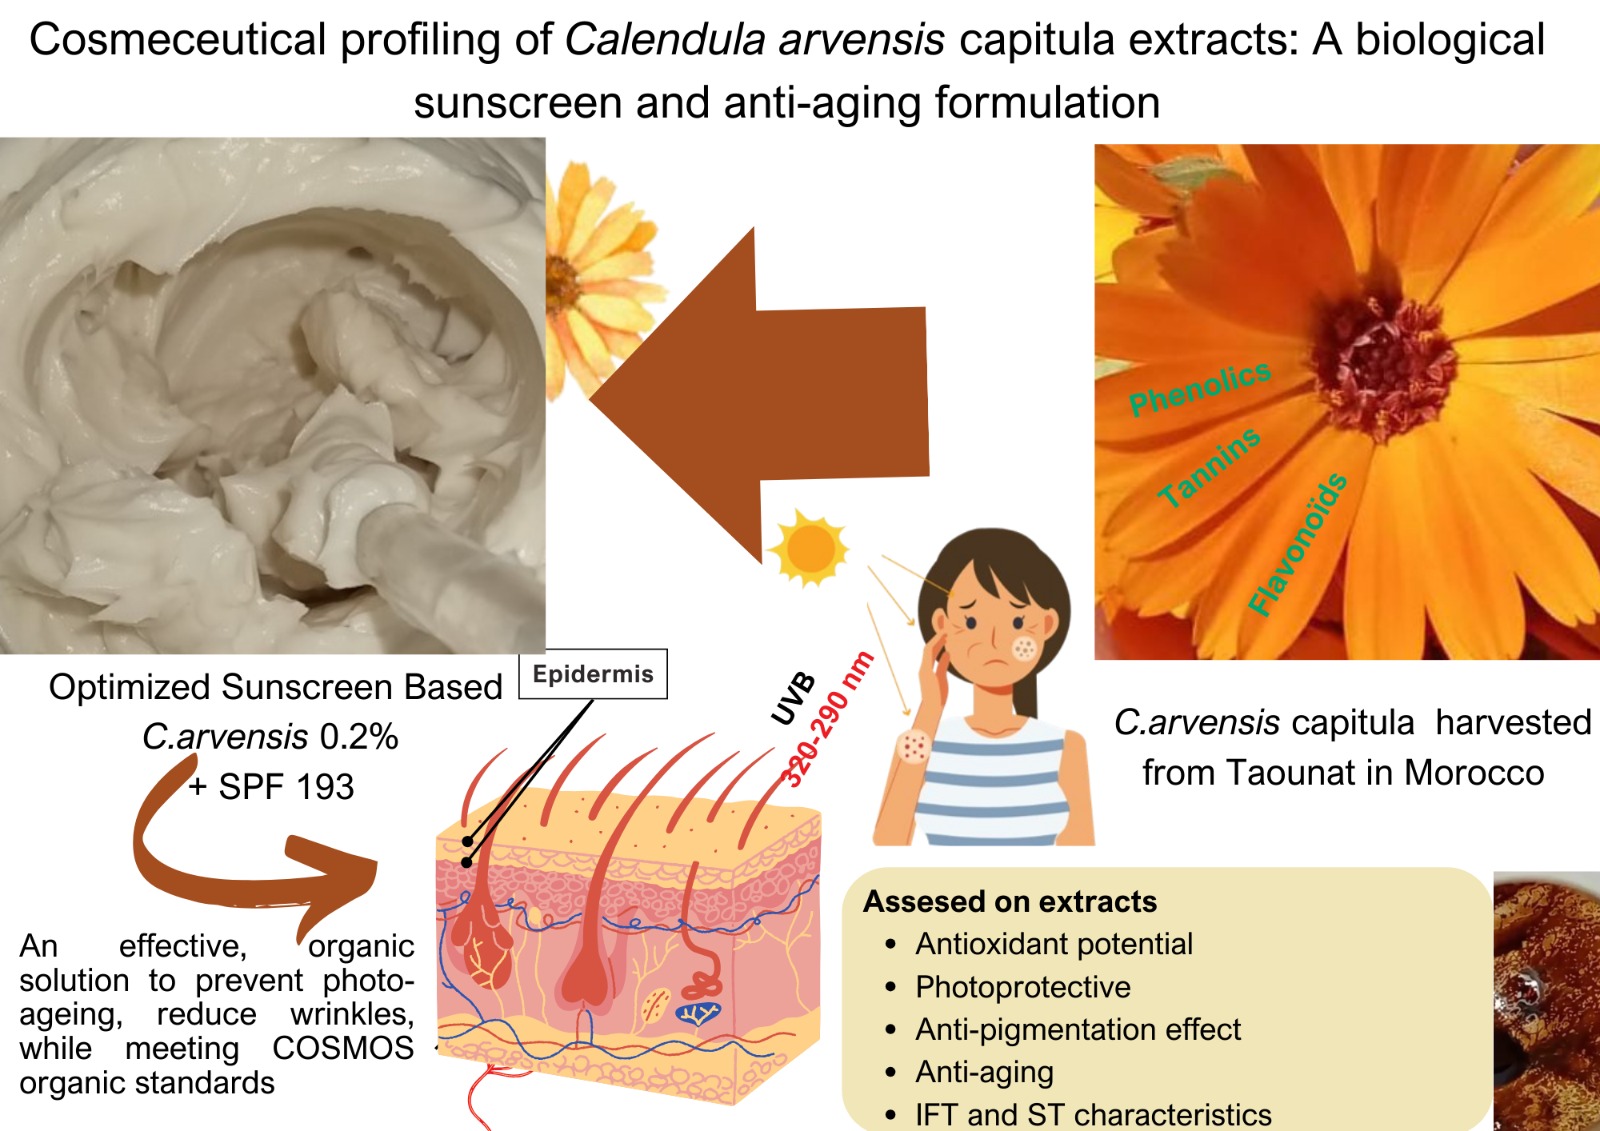
Skin protection against ultraviolet (UV) radiation has long been crucial due to its role in photoaging, sunburn, and wrinkles. This study focuses on developing a bio-based sunscreen from Calendula arvensis capitula extract. Various extraction methods (maceration, sonication, infusion) and solvents (EtOH, EtOH-H2O, H2O) were explored to identify the most effective extract for sunscreen formulation. Each extract was analyzed for phenolic content, with antioxidant activities assessed through DPPH, CAT, and FRAP assays. Enzyme inhibition assays on tyrosinase, elastase, and collagenase highlighted the hydroethanolic extract for its low IC50 values. Furthermore, the in vitro sun protection factor (SPF) against UVB radiation was measured using ultraviolet spectrophotometry. Phytochemical analysis showed phenolic levels between 8 and 27 mg GAE/g, flavonoid concentrations of 7-13 mg QE/g, and tannin levels of 1.15-1.68 mg/mL, alongside moderate antioxidant activity. The ethanol maceration extract reduced interfacial tension to 2.15 mN/m in 600 seconds, outperforming the conventional emulsifier polysorbate 20. The sonicated hydroethanolic extract demonstrated remarkable SPF efficacy (SPF = 193.65 ± 0.02), far exceeding standard zinc oxide (SPF = 11.88 ± 0.03). The formulations meet COSMOS standards, suggesting potential certification as a biological product. Further clinical and in vivo studies are necessary to confirm its safety and commercial viability.
Keywords:
Calendula arvensis
; phytochemical quantification
; interfacial tension
; UVB protection
; antioxidant
; anti-aging
; bio-formulation
; enzyme inhibition
; COSMOS standard
1. Introduction
Skin disorders, a major problem exacerbated by UV exposure, are a constant focus of dermatology research [1]. UVB radiation is associated with adverse effects such as sunburn, skin cancer, and melanoma, while UVA radiation is primarily involved in inducing skin tanning, and wrinkles [2]. This radiation stimulates cell surface receptors for cytokines and growth factors such as epidermal growth factor, tumor necrosis factor, interleukin-1, and keratinocyte growth factor. However, biological responses to UV exposure can be immediate and transient as inflammation, sunburn cell formation, pruritus or delayed and chronic including photoaging, immunosuppression and carcinogenesis [3].
In the field of cosmetics, progress is being made to develop products that not only improve appearance, but also protect against and mitigate the effects of ageing, merging scientific innovation with skincare solutions. Modern sunscreen products were first developed in the 1930s and have since introduced numerous UV filters with specific application characteristics. These filters are designated to protect against UV radiation from sunlight, mainly at short UVB wavelengths (290-320 nm). Considerable effort has been made in recent years to develop UV filters that are effective at absorbing the longer wavelengths of UVB or UVA (320-400 nm) [4]. In fact, the development of modern sunscreens has greatly improved the protection against the radiation of sunlight and its associated damaging effects on the skin [5].
Organic and natural cosmetics ECOCERT certification standards require formulations to provide not only effective protection, but also to adhere to the principles of sustainability and environmental responsibility in the production, by exploring botanical sources [6]. Furthermore, the growing public awareness has led several cosmetic companies to start effectively promoting green marketing strategies [7]. In an effort to meet market demands for fully green-labelled products, there has recently been growing interest in natural emulsifiers. Therefore, as surface-active agents, emulsifiers play a central role in stabilising emulsions by adsorbing to the interface between oil and water. Emulsifiers reduce interfacial tension, facilitating the formation of fine, uniformly dispersed droplets. However, the stability of emulsions is enhanced by steric and/or electrostatic repulsion mechanisms between droplets, limiting aggregation and coalescence, which contributes to the persistence and efficacy of emulsified formulations (1).
Calendula arvensis (C. arvensis), also known as "field marigold" [8], can be observed in various regions of Morocco, particularly in northern areas around Fes-Meknes, from early March onwards. Previous research indicated that only a limited number (1%) of herbal cosmetic’s cooperatives in this region are engaged in the extraction and valorization of this plant [9]. C. arvensis extracts have been reported to have antioxidant, antibacterial, enzyme-inhibiting and immunomodulating activities [10]. These pharmacological properties are probably due to the high content of phenolic compounds and flavonoids. Polyphenols, in particular, have great potential as photoprotective agents [11], capable of preventing or attenuating UV-induced photodamage [12]. However, to the best to our knowledge, no research has yet explored the photoprotective activities of C. arvensis flowers. This study aims to investigate the biological and phytochemical potential of C. arvensis flowers, focusing on their in vitro photoprotective activity, surface and interfacial activities and antioxidant capacity using various methods (DPPH, FRAP, CAT, ABTS). In addition, the study assesses the inhibitory activity of enzymes associated with skin aging, such as collagenase, elastase and tyrosinase. Quantification of phenolic compounds, flavonoids and tannins in ethanol, hydroethanolic and aqueous flower extracts was carried out using conventional extraction methods, including maceration, sonication and infusion. Furthermore, the study is seeking to identify the optimal dosage of C. arvensis capitula extract to boost photoprotection in an Ecocert- COSMOS compliant organic sunscreen formulation.
2. Materials and Methods
2.1. Plant Material
Capitula of the plant material were collected in Taounate, Morocco (N 34°29'54’, W 4°48'17’) in April 2023, during the flowering season. The identification of the species was confirmed as Calendula arvensis L. (Figure 1a) and catalogued under reference code (RAB 114641).
2.2. Extractions
The dried capitula were ground to a particle size of 300 µm using a mechanical grinder (Industriestrasse 855743 Idar-Oberstein, Germany). The resulting powder was subjected to extraction through three distinct methods, utilizing solvents of varying polarities. Maceration was performed over 24 hours with a solid-to-solvent ratio of 1:10 (w/v). Sonication was conducted for 45 minutes with the same ratio, using either absolute ethanol or a 70%-30% ethanol-water mixture. Additionally, an infusion method was applied, where 2.5 g of the powder was infused in 75 mL of water for 1 hour. The resulting organic entities were filtered on Whatman No. 1 filter paper, then centrifuged at 3,000 rpm over a 10-minute period. The crude extracts obtained were then stored in the refrigerator until further use. The percentage extraction yield (w/w) is shown in Table 1 (n=3).
2.3. Phenolic Compounds Quantification
2.3.1. Total phenolic contents (TFC)
The total polyphenol content of all extracts was investigated as described by Lister and Wilson [13]. Briefly, 450 μL of Folin-ciocalteu (10-fold diluted) and 450 μL of sodium carbonate (Na2CO3, 7.5%) were added to 50 μL of the studied extracts. After 2 hours of incubation in obscurity, absorbance was measured at 765 nm by a UV-VIS spectrometer, results are expressed in terms of gallic acid equivalents per gram of plant material. The test was performed in triplicate (n=3).
2.3.2. Total Flavonoïdes Contents (TFC)
Flavonoid content of crude extracts was assessed according to the aluminium trichloride method described by [14], with some modifications. A 500 μL of aluminum chloride solution (Alcl3, 10%) was added to 500 μL of diluted extract. After one hour of incubation in the dark, absorbances were measured at 420 nm using a UV-VIS spectrometer. A standard range based on quercetin was prepared according to the same conditions. The test was performed in triplicate.
2.3.3. Tannins Content (TC)
Condensed tannin was analyzed using the Bate-Smith reaction (Stonestreet, 1966) [15]. Technically, 1 mL of each extract (concentration of 1mg/mL) was combined with 0.5 ml of distilled water and 1.5 ml of 37% hydrochloric acid. the mixture was heated for 30 min in a water bath at 100°C. Absorbance was measured at 550 nm regarding the control test at room temperature. Thus, the difference in the absorbance between the hydrolyzed tube and the control is the amount of tannins contained in the extract using the following equation:
2.4. Antioxidant Capacity
The free radical scavenging effect of the different extracts towards DPPH° radical is based on the method described by Huang [16]. A 50 μl of the diluted extract added on 1.95 ml of the freshly prepared methanolic solution of DPPH (2.5mg dissolved in 100 ml methanol under stirring for 3 hours), Then the mixtures were incubated for 30 min in the dark. The absorbance was measured at 517 nm. Ascorbic acid was used as the standard antioxidant and was subject to the same operating conditions.
2.5. Anti-Free Radical Activity by DPPH
The free radical scavenging effect of the different extracts towards DPPH° radical is based on the method described by Huang [16]. A 50 μl of the diluted extract added on 1.95 ml of the freshly prepared methanolic solution of DPPH (2.5mg dissolved in 100 ml methanol under stirring for 3 hours), Then the mixtures were incubated for 30 min in the dark. The absorbance was measured at 517 nm. Ascorbic acid was used as the standard antioxidant and was subject to the same operating conditions.
2.6. Ferric Reducing Antioxidant Power (FRAP)
FRAP test is performed according to the method described by Oyaizu [15]. 0.25 ml of each diluted extract (6 sets of dilutions) were added to 1.25 ml of the phosphate buffer solution, = 1.25 ml and 1.25 ml of the aqueous solution of potassium ferricyanide (K3FeCN6, 1%). solutions were incubated for 20 min at 50°C in a water bath, after cooling to ambient temperature, 1.25 ml of 10% trichloroacetic acid was added to the reaction mixture, centrifuged at 3000 rpm for 10 min, then 1.25 ml of supernagent is added to 1.25 ml of distilled water and 0.25 ml of ferric chloride solution ( FeCl3, 0.01%). After 10 min of incubation, absorbance was measured at a wave length of 700 nm. The results are expressed in terms of equivalents of ascorbic acid per gram of plant material.
2.7. Total Antioxidant Capacity (TAC)
Total antioxidant capacity was estimated according to Prieto method [17], with slight modifications. It consists of adding 200 μl of each extract at different concentrations combined with 3000μl of a reagent composed of H2SO4 (60 M), Na2PO4 (280 mM) and ammonium molybdate (40 mM). An incubation at 95°C for 90 min. The mixture was then incubated at room temperature for 20-30 min, and the absorbance was measured at 695 nm. A control was made up of 200 μl of methanol and 3000 μl of the above reagent. results are expressed as mgGAE/g of dry extract.
2.8. Anti-Ageing Effect
In vitro anti-ageing assays were performed to assess anti-elastase, anti-tyrosinase and anti-collagenase activities, following published protocols [18,19]. Kojic acid and epigallocatechin gallate - EGCG, were used as reference standards, while controls without active samples were included for baseline comparison. Each assay was repeated in triplicate and enzyme inhibition percentages were calculated using the following formula:
: The measured absorbance of enzyme activity in the presence of samples.
: The measured absorbance of enzyme activity in the absence of samples.
2.9. Surface and Interfacial Activities
Interfacial and surface tensions of C.arvensis extracts were assessed using the hanging drop method with a fully automated tensiometer (DataPhysics Instruments GmbH, Filderstadt, Germany). Briefly, a 1% (w/w) extract solution was loaded into a glass syringe and dispensed via a 22-gauge stainless steel needle. The drop was introduced either into air to measure surface tension, or into soybean oil inside a glass cell to determine interfacial tension. The drop was allowed to equilibrate for approximately 10 minutes in the continuous phase, during which time a high-resolution camera recorded its shape. The interfacial or surface tension was then calculated using the Young-Laplace equation, with automatic processing by the dpiMAX software.
2.10. Photoprotective activity
Sun Protection Factor (SPF)
All extracts were investigated for their protective activity against UVB rays according to Mansur method [20], the absorbance of the extracts at a concentration of 2 mg/ml was measured at a range of wavelengths between 290 and 320 nm with 5 nm intervals using a UV-VIS spectrometer, each measurement was performed in triplicate and the SPF was calculated using the formula below: the SPF value is calculated applying the mathematical equation of Mansur:
EE x I values are constants. They were set by Sayre et al [21].
EE: erythemogenic effect
I: the radiation intensity
Abs: absorbance of extract
CF: correction factor
2.11. Sunscreen O/W Emulsions Formulas-Based C. arvensis Capitula Extracts
O/W emulsions were developed to optimise the photoprotective activity of C. arvensis extracts. The extracts IF-H2O, M-EtOH-H2O, S-EtOH, M-EtOH and S-EtOH-H20 were used at SPF ratios of 1:200 (0.05% w/w), 1:100 (0.1% w/w), and 1:50 (0.2% w/w), testing different concentrations to identify the concentration offering the best sun protection (Table 2). A low ratio of synthetic emulsifier to lipid phase was chosen in order to increase the biological percentage of the formulation and make the most of the potential emulsifying activity of C. arvensis extracts. Therefore, it hydrolat (73.95% w/w, 73.9% w/w or 73.8% w/w) was used as the main aqueous phase to increase the biological percentage.
The aqueous phase, in which the glycerine (3% w/w), and C. arvensis floral water are mixed in a pot and heated to a temperature of 75°C, with continuous stirring until completely homogenized. At the same time, the oil phase is prepared by combining cetearyl alcohol, stearic acid, ceteareth-20 and C. arvensis oil macerate in another pot. This mixture is also heated to 75°C, allowing the components to melt and mix completely. Emulsification was then carried out by gradually adding the oily phase to the aqueous phase under intense agitation for 10 minutes at 12,000 rpm using a rotor-stator homogenizer (T 25 digital ULTRA-TURRAX® - IKA). This process continues until a stable emulsion is obtained, characterized by a homogenous consistency. Once the emulsion has stabilized, the mixture is cooled to below 40°C before the cooling phase (Phase C) is incorporated. The organic extract of C. arvensis was added at the concentrations of 0.2%, 0.1% or 0.05%. P. graveolens essential oil (0.5% w/w), was then introduced for its antimicrobial and olfactory properties. The final formulations (Figure 1b) were subjected to efficacy tests to assess their sun protection factor (SPF) using the Mansur method in a similar way to crude extracts. Triplicate measurements were carried out to ensure reproducibility of results.
The biological percentage of the sunscreen formulation has been determined in accordance with COSMOS standards version 3.0 (September 1, 2018). According to the principles of natural and organic cosmetics certification, this method calculates the percentage of organic ingredients in the final product. Each ingredient was examined to identify those certified as organic, and their organic content percentages were obtained from supplier certifications. Water and minerals were excluded when developing the formulas, as they are not considered organic according to COSMOS standards. The organic content of dried extracts was calculated by measuring the quantity of each extract used, excluding the weight of the solvent, and applying the COSMOS formula (1) and (2). The final organic percentage was then calculated using the COSMOS equation (3), ensuring compliance with COSMOS requirements: at least 20% organic content for for leave-on products.
2.12. Stability Tests and Characterization of the Formulas
Following formulation of the sunscreens, pH, conductivity, peroxide value and viscosity were assessed firstly at the production stage and secondly after 30, 60 and 90 days storage at room temperature to confirm stability over time. pH and conductivity were measured and recorded directly from each sample using a BOECO Bench-CT-676 pH meter and conductivity meter (BOECO, Germany). peroxide value was also quantified using a CDR FoodLab® Junior (Perugia, Italy), the results are expressed in meqO2/kg.
Under accelerated conditions, physical stability was assessed using a 3000 rpm centrifuge for 30 minutes (Sigma 2-16P, Osterode am Harz, Germany). Stability to heating and freeze-thaw cycling was assessed by four cycles of 24 hours each, alternating between freezing (4 ± 3°C), room temperature (20-25°C), heating (40 ± 0.5°C) and return to room temperature.
The dynamic viscosity was measured using a Brookfield DV2T viscometer (Brookfield Ametek, Middleboro, MA, USA). All samples (80 g) underwent equilibration at 25°C prior to testing. A Helipath T-Bar spindle was immersed in a glass vessel containing the sunscreen products at a speed of 20 rpm. The viscosity was recorded in centipoise (cP).
All measurements were carried out in triplicate and mean values were calculated for each sample.
2.13. Statistical Analysis
Data were calculated using Microsoft Excel, each experiment was performed in triplicate. Data are presented as mean values with corresponding standard deviations (SDs). Statistical analysis involved ANOVA analysis using Origin Pro 2024, with significance determined at p<0.05.
3. Results and Discussion
Currently, numerous cosmetic and pharmaceutical products based on Calendula species, in particular C. officinalis, have been introduced to the market in a wide range of formulations and applications. In this context, our study focuses on the development of an innovative, biological anti-ageing sunscreen based on C. arvensis capitula extracts. This approach targets the bioactive properties of C. arvensis to provide effective sun protection while targeting skin ageing concerns.
3.1. Phenolic Compounds
Table 3 summarizes the content of C. arvensis extracts in terms of TPC, TFC and TC. Statistically, there was no significant difference in total phenolic content (TPC) between extracts S-EtOH-H2O, S-EtOH, M-EtOH-H2O, and IF-H2O (p > 0.05). Meanwhile, the M-EtOH extract showed the lowest TPC (8.24 ± 1.17 mg GAE/g) and TFC (6.47 ± 0.49 mg QE/g), implying that maceration in ethanol alone is less efficient for the extraction of these compounds. However, the IF-H2O extract, with a TPC of 16.91 ± 1.11 mg GAE/g and a TFC of 10.69 ± 0.68 mg QE/g, suggests that water-based infusion can also extract a substantial amount of phenolic compounds, albeit slightly less efficiently than mixed solvent systems. Regarding HTC, there was no significant difference between those extracts obtained by maceration with either 100% ethanol or 70% ethanol, yielding values of TC = 1.13 ± 0.01 mg/mL and HTC = 1.10 ± 0.06 mg/mL, respectively, for M-EtOH-H2O and M-EtOH. However, the highest concentration of tannins was detected in the S-EtOH-H2O extract, with an TC of 1.66 ± 0.02 mg/mL. Previous studies, as reported by Abudunia et al, revealed significantly higher flavonoid contents in their methanolic and aqueous extracts (174.93 ± 5.21 mg RE/g dry extract and 74.93 ± 1.50 mg RE/g dry extract, respectively) [20]. The disparity of these values from our results could be attributed to differences in extraction conditions; for instance, a plant material-solvent ratio of 0.4 g dw/ml was used in their study, whereas a much lower ratio of 0.003 g dw/ml was used in our infusion. Furthermore, Ercetin et al. reported even higher phenolic (118.18 ± 10.29 mg/g extract) and flavonoid (74.14 ± 3.09 mg/g extract) concentrations in methanolic extracts of C. arvensis flowers. These variations highlight the significant impact of extraction methods, raw material sources and other biotic and abiotic factors on the phytochemical composition observed in the various studies [21].
3.2. Antioxidant Activity
The antioxidant activity of C. arvensis capitula extracts was assessed in vitro, using four methods: DPPH, ABTS, FRAP, and TAC assays (Table 4). The findings revealed that the antioxidant capacity varied significantly depending on the extraction method and solvent used.
The S-EtOH-H2O extract demonstrated the highest overall antioxidant potential. In the DPPH assay, it exhibited a remarkably low IC50 value of 3.77 ± 0.44 mg/mL, indicating strong free radical scavenging activity. Similarly, in the ABTS assay, it maintained its superiority with an IC50 of 3.21 ± 0.08 mg/mL. These results suggest that the hydroethanolic solvent combination is particularly effective at extracting bioactive compounds, likely phenolics and flavonoids, responsible for these activities. The M-EtOH-H2O extract also showed promising antioxidant capacity, especially in the ABTS assay, where it recorded an IC50 of 2.71 ± 0.05 mg/mL. Moreover, this extract achieved the highest reducing power as determined by the FRAP assay, with a value of 21.90 ± 1.63 mg AAE/g pm. These observations highlight the beneficial role of water in the solvent mixture, which enhances the extraction of polar compounds contributing to antioxidant activity. On the other hand, extracts like IF-H2O and M-EtOH displayed relatively weaker antioxidant effects. The IF-H2O extract had the poorest performance in both DPPH and ABTS assays (IC50 values of 26.98 ± 0.93 mg/mL and 8.55 ± 0.02 mg/mL, respectively), reflecting the limited efficacy of aqueous infusion in extracting potent antioxidants. The M-EtOH extract also showed less significant activity in the DPPH (15.27 ± 0.09 mg/mL) and ABTS (15.22 ± 0.01 mg/mL) assays, indicating that pure ethanol might not be optimal for extracting the most effective phenolic compounds from C. arvensis. Regarding total antioxidant capacity (TAC), both S-EtOH-H2O (12.46 ± 0.61 mg AAE/g pm) and S-EtOH (12.34 ± 0.82 mg AAE/g pm) extracts displayed high and comparable capacities. These findings suggest a well-rounded presence of antioxidant compounds in these extracts, contributing to their overall potential. These results revealed considerably higher values than those reported by Abudunia et al [22], with IC50 values of 20.9 mg/mL and 33.2 mg/mL respectively in the methanolic and aqueous extracts, showing a radical scavenging effect. The variations observed between the different extracts can be attributed to the phenolic compound content, extraction efficiency and the polarities of the used solvents, which influence the bioavailability and stability of the antioxidant compounds. However, the structural characteristics of phenolic compounds are characterized by the presence of one or more hydroxyl groups (-OH) bonded directly to an aromatic benzene ring [23]. The arrangement and number of these hydroxyl groups play an essential role in determining the reactivity, stability and overall biological activity of the compound. Hydroxyl groups enable hydrogen bonding and electron-donating interactions, which further enhance the antioxidant capacity of the compound by scavenging free radicals [23]. In fact, -OH groups contribute to the phenol compounds ability to chelate metal ions and modulate enzymatic activity, which are crucial mechanisms in their antioxidant, anti-ageing and photoprotective effects. The diversity of substitution patterns on the aromatic ring also characterizes various subclasses of phenolic compounds, influencing their polarity, solubility and interactions with biological targets.
3.3. Effect of C. arvensis on cell aging-inducing enzymes
The inhibitory effect of C. arvensis extracts against enzymes involved in cell aging namely elastase, tyrosinase, and collagenase, was evaluated in vitro at various concentrations, with positive standards used as comparisons. The inhibition capacity was observed to be dose-dependent (Table 5). The S-EtOH-H2O and M-EtOH-H2O extracts exhibited maximum inhibition rates of 82.91% and 77.72%, respectively, with relatively low IC50 values of 3.58 mg/mL and 3.89 mg/mL, indicating potent anti-tyrosinase activity. These inhibition percentages were comparable to those achieved by the standard kojic acid at a concentration of 1 mg/mL (p >0.05), which outperformed all C. arvensis extracts obtained through different extraction methods (Table 5).
Conversely, the extracts demonstrated relatively low inhibition against both elastase and collagenase. The S-EtOH-H2O extracts showed significant elastase inhibition at 70.40% with an IC50 of 5.93 mg/mL, while the M-EtOH-H2O extracts achieved 64.47% inhibition with an IC50 of 6.87 mg/mL. At a concentration of 10 mg/mL, the S-EtOH-H2O extract exhibited the highest collagenase inhibition among the tested extracts (41.13 ± 2.02%) (p < 0.05), followed by the S-EtOH (41.13 ± 2.02%) and M-EtOH extracts (36.84 ± 5.54%). However, collagenase inhibition by the extracts was generally moderate, with the S-EtOH-H2O extract showing the highest activity at 41.13% inhibition. The absence of IC50 values within the tested concentration range suggests lower efficacy compared to the elastase and tyrosinase enzymes. Furthermore, C. arvensis extracts were also investigated for their inhibitory properties against enzymes associated with skin ageing. The C. arvensis capitula extracts demonstrated notable inhibitory effects against tyrosinase and elastase, with moderate activity against collagenase. Elastase is a target for anti-ageing formulations, a serine protease responsible for the breakdown of elastin in skin and connective tissue [24]. The S-EtOH-H2O extract showed the most potent inhibition against elastase (70.40% inhibition, IC50: 5.93 mg/mL), followed by the M-EtOH-H2O extract (64.47% inhibition, IC50: 6.87 mg/mL) (p < 0.05). Meanwhile, the extracts demonstrated promising inhibition levels of the enzyme tyrosinase, crucial for regulating melanin synthesis and treating hyperpigmentation. These findings highlight the potential of C. arvensis extracts for cosmetics and pharmaceutical applications targeting skin aging and pigmentation issues. Previous studies, reported that C. arvensis aerial part extracted with 80% ethanol showed a 51.66 ± 0.57% inhibition rate at 0.666 mg/mL, with an IC50 of 0.621 ± 3.47 mg/mL [25]. In comparison, our research showed that the S-EtOH-H2O capitula extract exhibited a lower inhibition rate of 27.40 ± 1.18% at a similar concentration (0.625 mg/mL). This discrepancy may be linked to the synergistic effects of bioactive compounds in the aerial parts, which may provide stronger tyrosinase inhibition than those present in the capitula. However, the findings on collagenase inhibition are in line with the previous work of Deniz et al [25], who reported no inhibitory activity in the hydroethanol extract of the aerial parts of C. arvensis at 0.666 mg/mL. Previous evidence has demonstrated that phenolic compounds, such as flavonoids and tannins, are key factors in modulating the enzymes responsible for the degradation of skin structures [26].
3.4. Interfacial and Surface Tension Characteristics
C. arvensis capitula extracts 1% (w/w) were evaluated for their ability to reduce surface tension (ST) and interfacial tension (IT) over a time frame of 600 seconds (Figure 2). The results show a varied activity compared to that of Polysorbate 20, a commonly used synthetic emulsifier. Initially (0 seconds), the surface tensions of the extracts varied considerably, with values ranging from 38.63 mN/m for the methanol-water extract (M-EtOH-H2O) to 55.79 mN/m for the aqueous infusion (IF-H2O). These initial differences suggest that the methanol and ethanol extracts have a higher affinity for the air-water interface than the aqueous infusion.
Following 600 seconds, a significant decrease in TS was observed for all extracts. M-EtOH-H2O showed a notable drop, from 38.63 mN/m to 31.14 mN/m, reflecting rapid and efficient adsorption of active compounds to the interface. The S-EtOH-H2O extract followed a similar trend, dropping from 52.38 mN/m to 41.08 mN/m. Pure methanolic (M-EtOH) and pure ethanolic (S-EtOH) extracts also show significant reductions in ST, reaching 34.647 mN/m and 31.64 mN/m respectively. Comparatively, Polysorbate 20, although having an initial TS of 47.65 mN/m, shows only a slight reduction to 43.96 mN/m after 600 seconds. This indicates that, although Polysorbate 20 is effective in reducing ST, Calendula arvensis extracts, particularly those containing ethanol or methanol, are more effective in this regard.
Interfacial tension measurements also revealed considerable activity of the extracts. At 0 seconds, M-EtOH (2.46 mN/m) already exhibited a remarkably low IFT, indicating a high affinity of the compounds for the water-oil interface. After 600 seconds, the IFT for M-EtOH decreased again slightly to 2.16 mN/m, confirming its exceptional efficiency. The other extracts also showed a substantial reduction in IFT, notably M-EtOH-H2O (from 9.22 mN/m to 4.11 mN/m) and S-EtOH-H2O (from 8.99 mN/m to 3.82 mN/m), suggesting that these extracts have a good ability to interact with the water-oil interface. Polysorbate 20, in contrast, shows an initial IFT of 8.93 mN/m, which decreases to 7.14 mN/m after 600 seconds. Although Polysorbate 20 is effective, methanolic and ethanolic extracts of Calendula arvensis outperform this synthetic emulsifier in terms of IFT reduction. These results indicate that C. arvensis extracts, in particular those obtained with ethanol, have a superior ability to reduce surface and interfacial tension compared with Polysorbate 20. These extracts could therefore represent an interesting natural alternative to synthetic emulsifiers in formulations where an effective reduction in surface tension is required.
The interfacial tension of surfactants plays a crucial role in determining their effectiveness in stabilizing emulsions. Generally, surfactants exhibit stronger emulsifying properties when they achieve lower interfacial tension at the boundary between two immiscible liquids, such as oil and water [27]. This reduction in interfacial tension facilitates the formation and stabilization of smaller droplets, leading to more stable and homogeneous emulsions [28]. Consequently, the ability of a surfactant to lower interfacial tension directly influences its capacity to enhance emulsion stability. Interstely, M-EtOH (2.46 mN/m) already exhibited a remarkably low IFT, indicating a high affinity of the compounds for the water-oil interface. After 600 seconds, the TI for M-EtOH decreased again slightly to 2.16 mN/m, confirming its exceptional efficiency. This relatively high interfacial tension increase could be assigned to their higher flavonoid content could also increase the interfacial tension. Nonetheless, flavonoids could improve simultaneously, the physical stability of O/W emulsions. In fact Jafari et al [29], reported that some flavonoids could act as stabilizers of oil-in-water emulsions through their adsorption as water insoluble particles to the surface of oil droplets, i.e., Pickering emulsions are formed.
3.5. Sun protection factor (SPF-UVB)
C. arvensis extracts have been evaluated for their protective properties (Table 6), The results suggest that at a concentration of 2 mg/mL, all the tested extracts display extremely high SPF-UVB values, ranging from 193.67 ± 0.04 to 192.19 ± 0.08 respectively for S-EtOH-H20 and IF-H2O extracts, as no significant difference was observed between the different extraction methods (p>0.05). Significantly, ZnO, a commonly used ingredient in sunscreen formulations, at the same concentration of 2 mg/mL has an SPF of 11.88 ± 0.03 (p < 0.05). However, the UV-B absorbance measurements (290-320 nm) (Figure x) reveal distinct absorbance profiles for each extract. The aqueous infusion (IF-H2O) shows a relatively stable absorbance across the UVB range, with values fluctuating around 20.09, suggesting a low capacity for UVB absorption by the hydrophilic compounds present in this extract. This trend is similar to that observed for the methanol-water extract (M-EtOH-H2O), although the latter shows a slight increase in absorbance around 300 nm, reaching a maximum value of 20.22, which could indicate the presence of ethanol-soluble compounds with a better interaction with UVB. The S-EtOH-H2O extract showed an overall higher absorbance profile than the other water-soluble extracts, with values close to 20.20 at 320 nm, indicating greater UVB absorption efficiency. This observation is supported by the chart, shown as an upward trend for this extract at higher UVB wavelengths. The M-EtOH and S-EtOH extracts show more complex absorbance profiles, with significant fluctuations in the UVB range (Figure 3B). M-EtOH shows a peak absorbance at around 300 nm, reaching 20.15, followed by a slight decrease, which could be attributed to a higher concentration of specific ethanolic compounds absorbing in this region. S-EtOH showed similar behaviour with a slight depression in absorbance at 295 nm, followed by a recovery, suggesting variability in the concentration or activity of ethanolic compounds in the extract. Alternatively, plant extracts rich in tannins have been demonstrated to provide UV protection by scavenging free radicals and preventing oxidative damage [30]. UVB rays (320-290) activate melanocytes and increase melanin production. Receptors on the surface of melanocytes are activated by UVB rays. An increase in melanin in the skin is the body's protective response against the damaging effects of UVB, such as sunburn. However, excessive exposure to UVB can also lead to damage such as accelerated photo-ageing and skin cancer [31]. The SPF ingredient may involve direct blocking of UV photons, or neutralizing the direct or indirect effects of UV radiation by DNA repair systems and antioxidants [32].
Figure 3A highlight the results of SPF values in various cream formulation-based C. arvensis extracts at different concentrations (0.05%, 0.10%, and 0.20%). The data suggest that A dose-dependent pattern is observed for all the formulas, the sunscreen-based S-EtOH-H2O extract standing out as the most promising candidate for further development in photoprotective skincare products, for instance, no statistically significant difference was found between the formulations at a concentration of 0.1%. However, at 0.2%, the formula based on the S-EtOH-H2O extract had a significantly higher SPF value (SPF = 194.49 ± 0.18) (p < 0.05). At a lower concentration of 0.05%, there was no significant difference between those with IF-H2O extract (SPF = 33.40 ± 4.25) and S-EtOH extract (SPF = 32.93 ± 2.65) (p > 0.05). Both of these formulations achieved significantly higher SPF values than those based on M-EtOH (SPF = 26.33 ± 5.35) and S-EtOH-H2O (SPF = 20.38 ± 0.66). Previously, Mishra et al. conducted an assessment of the sun protection factor (SPF) value for a cream formulated with C. officinalis oil, resulting in a value of 14.84 ± 0.16 [33]. In contrast, Lohani et al [34] reported a significantly lower SPF value of 8.36 for C. officinalis essential oil.
COSMOS offers several important criteria for the certification of organic cosmetics. Organic ingredients must be grown without the use of synthetic pesticides or fertilizers. Additionally, the formulation must strictly exclude certain contentious substances such as parabens, silicones, GMOs, synthetic colorants, nanoparticles, and other potentially harmful ingredients to both the environment and human health. The production methods should prioritize ecological and sustainable practices to minimize the overall impact on the environment. Moreover, processes that operate at lower temperatures and provide optimal yields to minimize waste and rejection are recommended by COSMOS. Based on this, the Sonication method is identified as a suitable method since it requires minimal time and no temperature and offers a the highest % yield of extraction. Additionally, the fact that the plant is wild and has not been subjected to pesticides further supports the possibility of certifying this ingredient as organic by COSMOS.
Following the method of calculation mentioned in point (6.2) "to calculate the percentage of organic ingredients" in Cosmos Standards Version 3.0 -1st September 2018, we were able to determine the percentage of organic ingredient (2) of the dried extract (without solvent) used in the formulation. As the ratio (1) is greater than 1, it is considered equal to 1 according to the standards.
The results indicate an organic percentage of 100% of C. arvensis active ingredient. The steps of extract preparation to calculate the organic percentage of the extract are defined in Figure 4.
In the present formulation, the ingredients have been selected to conform the strict standards defined by COSMOS certification [35]. By applying the equation defined in the COSMOS standard (4), we have determined that the formula is based on 87.5% biological ingredients. This percentage exceeds the minimum threshold of 20% required for organic certification.
In view of consumers growing awareness of the risks associated with the synthetic products [36,37,38], demand for biological sunscreens has increased [37], due to their ability to offer effective UV protection while protecting the skin from potential damage [39]. Organic labels awarded by Ecocert and Cosmos to ensure the natural originality of products respecting their standards. EcoCert is widely recognized for its rigorous criteria and commitment to promoting ecologically sound and sustainable practices in the production of cosmetics. However, even if natural ingredients are considered to be safe, they may cause skin reactions, meaning that skin toxicity tests of the product are essential. In our formulation, every ingredient has been selected to conform the strict standards defined by COSMOS certification [35].
3.6. Sunscreens Charachteristics and Stability
In order to assess the stability of sunscreen, formulations based on C. arvensis extracts, the pH, conductivity, viscosity and peroxide value were analyzed each month over a period of 90 days.
Conductivity
Conductivity measurements provide a characterization of microemulsion systems. In systems containing ionic surfactants or salts, variations in conductivity serve as indicators of structural differences [40]. For instance, among the produced W/O emulsions, the 0.05% S-EtOH-H₂O sunscreen, recorded an initial conductivity of 251.67± 1.53 µS/cm, which decreased slightly to 235 ± 2 µS/cm by day 90. Conversely, the 0.05% S-EtOH formulation showed a progressive increase from 117 ± 3.60 µS/cm to 139.67 ± 2.08 µS/cm. This slight increase could be attributed to an increase in free ions, possibly due to interactions between the components. Furthermore, the ethanolic extracts based formulations (0.05% M-EtOH-H₂O and 0.05% M-EtOH) also showed slight fluctuations, suggesting reasonable stability over time. However, at concentrations of 0.1% and 0.2%, formulations based on aqueous and ethanolic extracts of C. arvensis showed good stability over the storage period. Among microemulsion types, W/O structures exhibit the lowest conductivity, which gradually increases with rising water content. As water content reaches a critical point, interactions between water droplets via charge hopping or transient droplet aggregation can result in a continuous water network within the oil phase, forming a bicontinuous phase that enhances conductivity [41].
pH stability
All sunscreens based C. arvensis extracts exhibit minimal pH changes over time. For instance, the pH of the 0.05% S-EtOH-H₂O formula decreased slightly between day 1 and day 90 from 5.15 ± 0.03 to 5.03 ± 0.01 respectively. In contrast, at a concentration of 0.2%, the formulations are shown to be particularly stable, especially in the ethanolic extract which achieved a pH value of 6.00 ± 0.13 on the first day of production, 6.53 ± 0.16 after 30 days, 6.24 ± 0.01 after 60 days and then 6.24 ± 0.03 after a total of 90 days.
However, it has been as demonstrated previously that higher pH promotes smaller droplet formation and enhances stability. This is attributed to increased surfactant aggregation at high pH. Carboxylic acids in crude oil, which ionize at higher pH, contribute to emulsion stability by forming micelles that reduce droplet size. However, effects vary by system composition [42].
Dynamic viscosity
Over time variations in viscosity may indicate structural degradation or aggregation of the ingredients. Based on the formulation trends observed, the concentration of C. arvensis extract and the type of solvent have a significant influence on viscosity stability. Remarkably, formulations with 0.05% C. arvensis recorded lower initial viscosities. For instance, the formula based on 0.05% S-EtOH recorded a value of 11254 ± 4.36 cP initially, with minimal variations over the 90 days. In contrast, formulations containing 0.2% C. arvensis extract exhibited higher initial viscosities, as measured by 17183.67 ± 2.08 cP for the 0.2% S-EtOH formulation, and outstanding stability for 90 days. This finding confirms that C. arvensis is a highly effective stabilizer and reducer of surface and interfacial tension. Nevertheless, low emulsifier content leads to larger droplets due to insufficient surface coverage, promoting droplet coalescence. Increased surfactant concentration, reduces droplet size by enhancing interfacial coverage, thus improving stability. nonionic surfactants required higher concentrations for stability compared to anionic surfactants, which maintained stability even at lower concentrations [42].
Peroxide Value (PV)
One of the most important characteristics of emulsions is their oxidation stability. The peroxide value (PV) in an emulsion reflects the oxidation of the lipids; high levels of PV mean increased oxidative degradation, which adversely affects the stability of the emulsion [23]. The formulated sunscreen based on 0.05% M-EtOH, exhibited a slight increase of PV, from 0.83 ± 0.02 meq O₂/kg at day 1 to 0.85 ± 0.03 meq O₂/kg at day 60, followed by a slight increase to 0.68 ± 0.04 meq O₂/kg at day 90. These fluctuations suggest minor oxidation without major instability.
However, at 0.1% and 0.2%, a stable range of values were found among the formulations. For example, the S-EtOH-H₂O formula at 0.1% showed consistent values from day 1 (0.41 ± 0.01 meq O₂/kg) to 0.65 ± 0.03 meq O₂/kg at day 60, and 0.76 ± 1.33 meq O₂/kg at day 90. The 0.2% formulations show better PV stability, particularly in ethanolic extracts. This suggests that the antioxidant components of C. arvensis may provide enhanced protection against oxidation at higher concentrations.
4. Conclusions
Based on the results of the present study, C. arvensis flower extracts demonstrated significant potential as biological sunscreen, targeting both UVB protection and skin ageing. Furthermore, the M-EtOH extract showed significant surface and interfacial tension lowering activity. This property improves the stability of oil-in-water emulsions, enhancing their application in biological formulations. The combined effects of UV protection, enzyme inhibition and emulsion stability underline the multifunctional potential of C. arvensis extracts in the development of advanced, bio-based products that meet growing consumer demand for natural, eco-certified ingredients.
However, Future research should focus on identifying and characterizing the specific active compounds involved in these activities.
Data Availability Statement
The project provides the following underlying datasets: Raw_Material_C_Arvensis.xlsx DOI: 1010.6084/m9.figshare.27643428 [43], and Sunscreen-characterisation.xlsx DOI: 1010.6084/m9.figshare.27643425 [44]. Data are available under the terms of the Creative Commons Zero "No rights reserved" data waiver (CC0 1.0 Public domain dedication).
Acknowledgments
The authors extend their heartfelt appreciation to Pr. Benkhnigue Ouafae and Pr. Zineelabidine Triqui for their crucial support in identifying Calendula arvensis L.
Conflicts of Interest
The authors declare that there are no conflicts of interest.
References
- Passeron T, Krutmann J, Andersen M, Katta R, Zouboulis C. Clinical and biological impact of the exposome on the skin. Journal of the European Academy of Dermatology and Venereology. 2020;34:4-25.
- Diffey B. Solar ultraviolet radiation effects on biological systems. Physics in medicine & biology. 1991;36(3):299. [CrossRef]
- Muthusamy V, Piva TJ. The UV response of the skin: a review of the MAPK, NFκB and TNFα signal transduction pathways. Archives of dermatological research. 2010;302:5-17. [CrossRef]
- Gasparro FP, Mitchnick M, Nash JF. A review of sunscreen safety and efficacy. Photochemistry and photobiology. 1998;68(3):243-56.
- Nash J. Human safety and efficacy of ultraviolet filters and sunscreen products. Dermatologic Clinics. 2006;24(1):35-51. [CrossRef]
- Bozza A, Campi C, Garelli S, Ugazio E, Battaglia L. Current regulatory and market frameworks in green cosmetics: The role of certification. Sustainable Chemistry and Pharmacy. 2022;30:100851. [CrossRef]
- Ottman J. The new rules of green marketing: Strategies, tools, and inspiration for sustainable branding: Routledge; 2017.
- Arora D, Rani A, Sharma A. A review on phytochemistry and ethnopharmacological aspects of genus Calendula. Pharmacognosy reviews. 2013;7(14):179. [CrossRef]
- El-Otmani N, Zeouk I, Hammani O, Zahidi A. Analysis and Quality Control of Bio-actives and Herbal Cosmetics: The Case of Traditional Cooperatives from Fes-Meknes Region. Tropical Journal of Natural Product Research (TJNPR). 2024;8(5):7181-95. [CrossRef]
- Khouchlaa A, El Baaboua A, El Moudden H, Lakhdar F, Bakrim S, El Menyiy N, et al. Traditional uses, bioactive compounds, and pharmacological investigations of Calendula arvensis L.: A Comprehensive review. Advances in Pharmacological and Pharmaceutical Sciences. 2023;2023(1):2482544. [CrossRef]
- Nichols JA, Katiyar SK. Skin photoprotection by natural polyphenols: anti-inflammatory, antioxidant and DNA repair mechanisms. Archives of dermatological research. 2010;302:71-83. [CrossRef]
- de Lima Cherubim DJ, Buzanello Martins CV, Oliveira Fariña L, da Silva de Lucca RA. Polyphenols as natural antioxidants in cosmetics applications. Journal of cosmetic dermatology. 2020;19(1):33-7.
- Lister E, Wilson P. Measurement of total phenolics and ABTS assay for antioxidant activity (personal communication). Crop Research Institute, Lincoln, New Zealand. 2001;7:235-9.
- Djeridane A, Yousfi M, Nadjemi B, Boutassouna D, Stocker P, Vidal N. Antioxidant activity of some Algerian medicinal plants extracts containing phenolic compounds. Food chemistry. 2006;97(4):654-60. [CrossRef]
- RibéreauGayon P, Stonestreet E. Dosage des tanins du vin rouge et détermination de leur structure. Chimie analytique. 1966;48(4):188-+.
- Topçu G, Ay M, Bilici A, Sarıkürkcü C, Öztürk M, Ulubelen A. A new flavone from antioxidant extracts of Pistacia terebinthus. Food chemistry. 2007;103(3):816-22. [CrossRef]
- Prieto P, Pineda M, Aguilar M. Spectrophotometric quantitation of antioxidant capacity through the formation of a phosphomolybdenum complex: specific application to the determination of vitamin E. Analytical biochemistry. 1999;269(2):337-41. [CrossRef]
- Kim Y-J, Uyama H, Kobayashi S. Inhibition effects of (+)-catechin–aldehyde polycondensates on proteinases causing proteolytic degradation of extracellular matrix. Biochemical and biophysical research communications. 2004;320(1):256-61. [CrossRef]
- Khatib S, Mahdi I, Drissi B, Fahsi N, Bouissane L, Sobeh M. Tetraclinis articulata (Vahl) Mast.: Volatile constituents, antioxidant, antidiabetic and wound healing activities of its essential oil. Heliyon. 2024;10(3). [CrossRef]
- Mansur JdS, Breder MNR, Mansur MCdA, Azulay RD. Determinaçäo do fator de proteçäo solar por espectrofotometria. An Bras Dermatol. 1986:121-4.
- Sayre RM, Agin PP, LeVee GJ, Marlowe E. A comparison of in vivo and in vitro testing of sunscreening formulas. Photochemistry and Photobiology. 1979;29(3):559-66. [CrossRef]
- Abudunia A-M, Marmouzi I, Faouzi M, Ramli Y, Taoufik J, El Madani N, et al. Anticandidal, antibacterial, cytotoxic and antioxidant activities of Calendula arvensis flowers. Journal de mycologie medicale. 2017;27(1):90-7. [CrossRef]
- Ghelichi S, Hajfathalian M, Yesiltas B, Sørensen ADM, García-Moreno PJ, Jacobsen C. Oxidation and oxidative stability in emulsions. Comprehensive Reviews in Food Science and Food Safety. 2023;22(3):1864-901.
- Porwal M, Rastogi V, Chandra P, Shukla S. An Updated Review on the Role of Phytoconstituents in Modulating Signalling Pathways to Combat Skin Ageing: Nature’s Own Weapons and Approaches. The Natural Products Journal. 2024;14(8):55-71. [CrossRef]
- Deniz FSS, Orhan IE, Duman H. Profiling cosmeceutical effects of various herbal extracts through elastase, collagenase, tyrosinase inhibitory and antioxidant assays. Phytochemistry Letters. 2021;45:171-83. [CrossRef]
- Działo M, Mierziak J, Korzun U, Preisner M, Szopa J, Kulma A. The potential of plant phenolics in prevention and therapy of skin disorders. International journal of molecular sciences. 2016;17(2):160. [CrossRef]
- Ravera F, Dziza K, Santini E, Cristofolini L, Liggieri L. Emulsification and emulsion stability: The role of the interfacial properties. Advances in Colloid and Interface Science. 2021;288:102344. [CrossRef]
- Ho TM, Razzaghi A, Ramachandran A, Mikkonen KS. Emulsion characterization via microfluidic devices: A review on interfacial tension and stability to coalescence. Advances in Colloid and Interface Science. 2022;299:102541. [CrossRef]
- Jafari SM, Doost AS, Nasrabadi MN, Boostani S, Van der Meeren P. Phytoparticles for the stabilization of Pickering emulsions in the formulation of novel food colloidal dispersions. Trends in Food Science & Technology. 2020;98:117-28. [CrossRef]
- Fraga-Corral M, Otero P, Echave J, Garcia-Oliveira P, Carpena M, Jarboui A, et al. By-products of agri-food industry as tannin-rich sources: A review of tannins’ biological activities and their potential for valorization. Foods. 2021;10(1):137. [CrossRef]
- Rouzaud F, Kadekaro AL, Abdel-Malek ZA, Hearing VJ. MC1R and the response of melanocytes to ultraviolet radiation. Mutation Research/Fundamental and Molecular Mechanisms of Mutagenesis. 2005;571(1-2):133-52.
- Wang T, Zhao J, Yang Z, Xiong L, Li L, Gu Z, et al. Polyphenolic sunscreens for photoprotection. Green Chemistry. 2022;24(9):3605-22. [CrossRef]
- Mishra A, Mishra A, Chattopadhyay P. Assessment of in vitro sun protection factor of Calendula officinalis L.(asteraceae) essential oil formulation. Journal of Young Pharmacists. 2012;4(1):17-21. [CrossRef]
- Lohani A, Mishra AK, Verma A. Cosmeceutical potential of geranium and calendula essential oil: Determination of antioxidant activity and in vitro sun protection factor. Journal of cosmetic dermatology. 2019;18(2):550-7. [CrossRef]
- AISBL C-s. COSMOS-standard. Haettu osoitteesta: https://cosmosstandard. files. wordpress. com/2014/08 …; 2013.
- MITTERER-DALTOÉ M, BORDIM J, LISE C, BREDA L, CASAGRANDE M, LIMA V. Consumer awareness of food antioxidants. Synthetic vs. Natural. Food Science and Technology. 2020;41:208-12. [CrossRef]
- Sajinčič N, Gordobil O, Simmons A, Sandak A. An Exploratory Study of Consumers’ Knowledge and Attitudes about Lignin-Based Sunscreens and Bio-Based Skincare Products. Cosmetics. 2021;8(3):78. [CrossRef]
- Reis-Mansur MCPP, da Luz BG, dos Santos EP. Consumer Behavior, Skin Phototype, Sunscreens, and Tools for Photoprotection: A Review. Cosmetics. 2023;10(2):39.
- Fonseca-Santos B, Corrêa MA, Chorilli M. Sustainability, natural and organic cosmetics: consumer, products, efficacy, toxicological and regulatory considerations. Brazilian Journal of Pharmaceutical Sciences. 2015;51:17-26.
- JA SM, Khalid RM, Othaman R. Coconut oil based microemulsion formulations for hair care product application. Sains Malaysiana. 2019;48(3):599-605. [CrossRef]
- Li L, Qu J, Liu W, Peng B, Cong S, Yu H, et al. Advancements in Characterization Techniques for Microemulsions: From Molecular Insights to Macroscopic Phenomena. Molecules. 2024;29(12):2901. [CrossRef]
- Al-Sakkaf MK, Onaizi SA. Effects of emulsification factors on the characteristics of crude oil emulsions stabilized by chemical and Biosurfactants: A review. Fuel. 2024;361:130604. [CrossRef]
- EL-OTMANI, Najlae (2024). Raw_Material_C_Arvensis.xlsx. figshare. Dataset. [CrossRef]
- EL-OTMANI, Najlae (2024). Sunscreen- characterisation.xlsx. figshare. Dataset. [CrossRef]
Figure 1.
Development of an anti-ageing sun cream based on Calendula arvensis capitula (a): Field Collection of wild C. arvensis L in full bloom in Taounate, Morocco, 2023. (b): Anti-ageing sunscreen based on 0.2% C. arvensis capitula extract.
Figure 1.
Development of an anti-ageing sun cream based on Calendula arvensis capitula (a): Field Collection of wild C. arvensis L in full bloom in Taounate, Morocco, 2023. (b): Anti-ageing sunscreen based on 0.2% C. arvensis capitula extract.
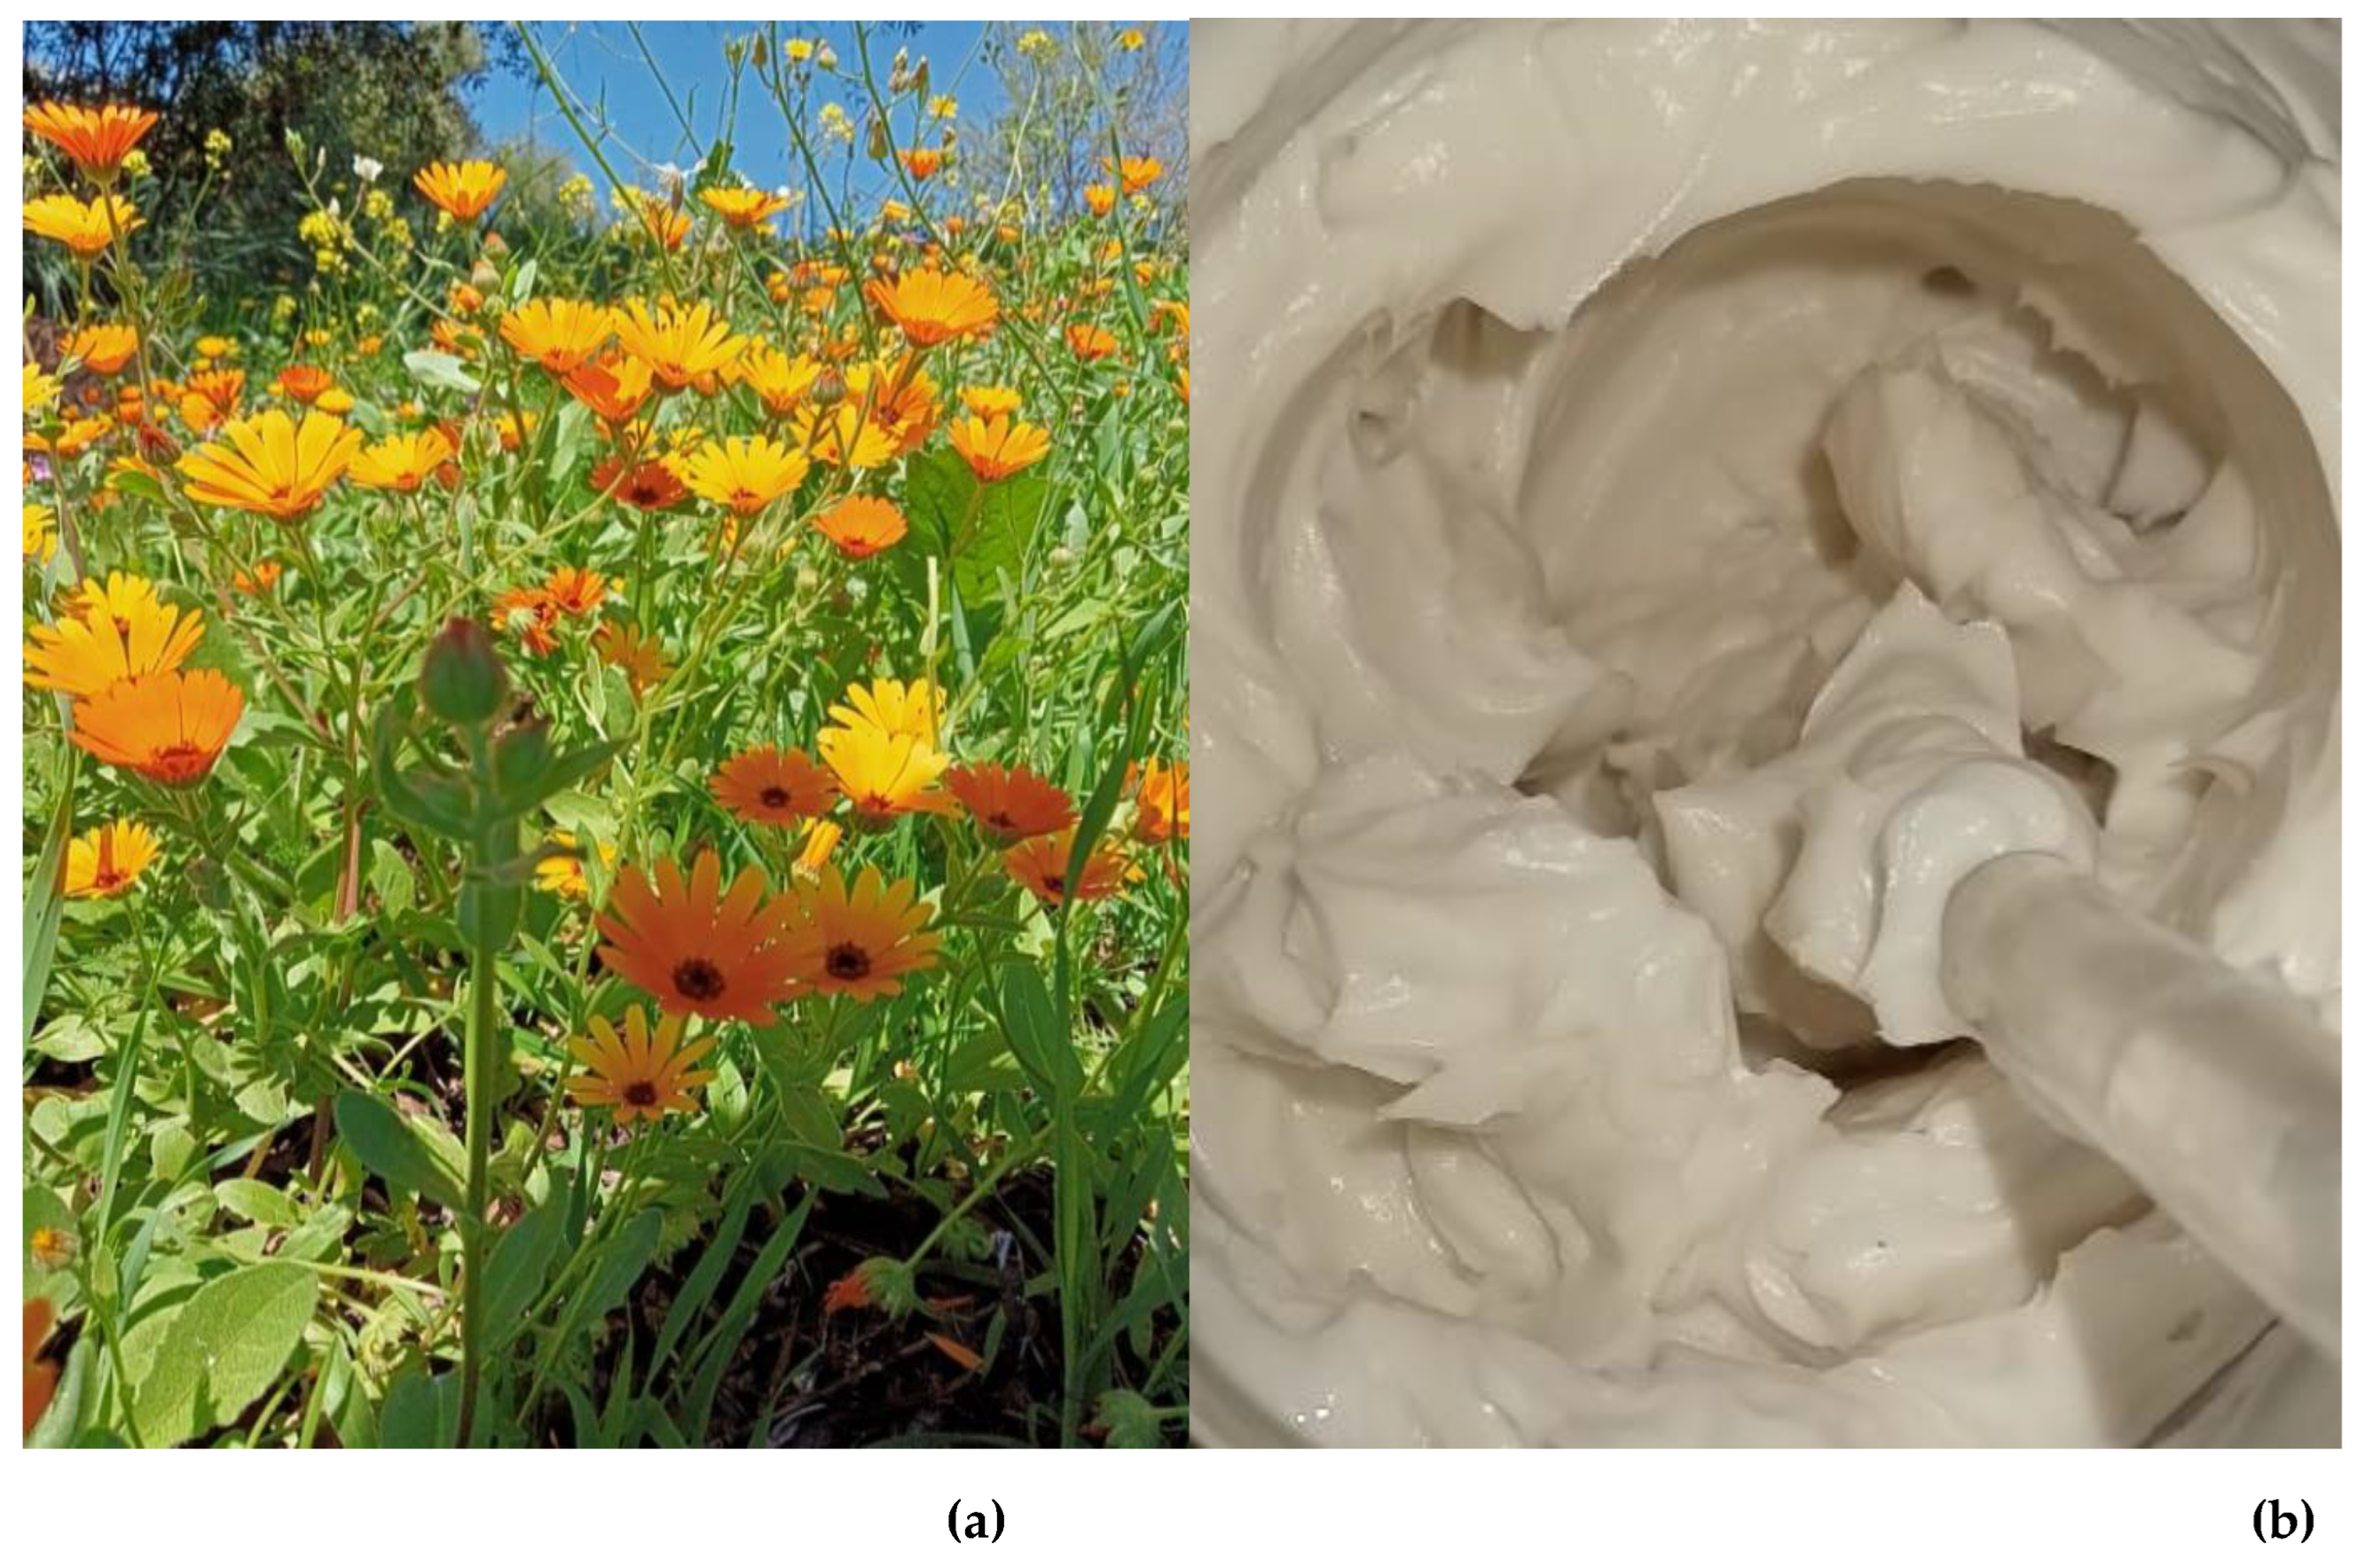
Figure 2.
surface tension (ST) and interfacial tension (IFT) profiles of C. arvensis extracts as a function of time and solvent conditions.
Figure 2.
surface tension (ST) and interfacial tension (IFT) profiles of C. arvensis extracts as a function of time and solvent conditions.

Figure 3.
SPF screening of sunscreens based on C. arvensis extracts (A), analysis of the UVB absorbance spectra of the various C. arvensis extracts (B).
Figure 3.
SPF screening of sunscreens based on C. arvensis extracts (A), analysis of the UVB absorbance spectra of the various C. arvensis extracts (B).

Figure 4.
A guideline illustration inspired from COSMOS technical referential, for calculating the biological percentage of plant extracts through an extraction process.
Figure 4.
A guideline illustration inspired from COSMOS technical referential, for calculating the biological percentage of plant extracts through an extraction process.
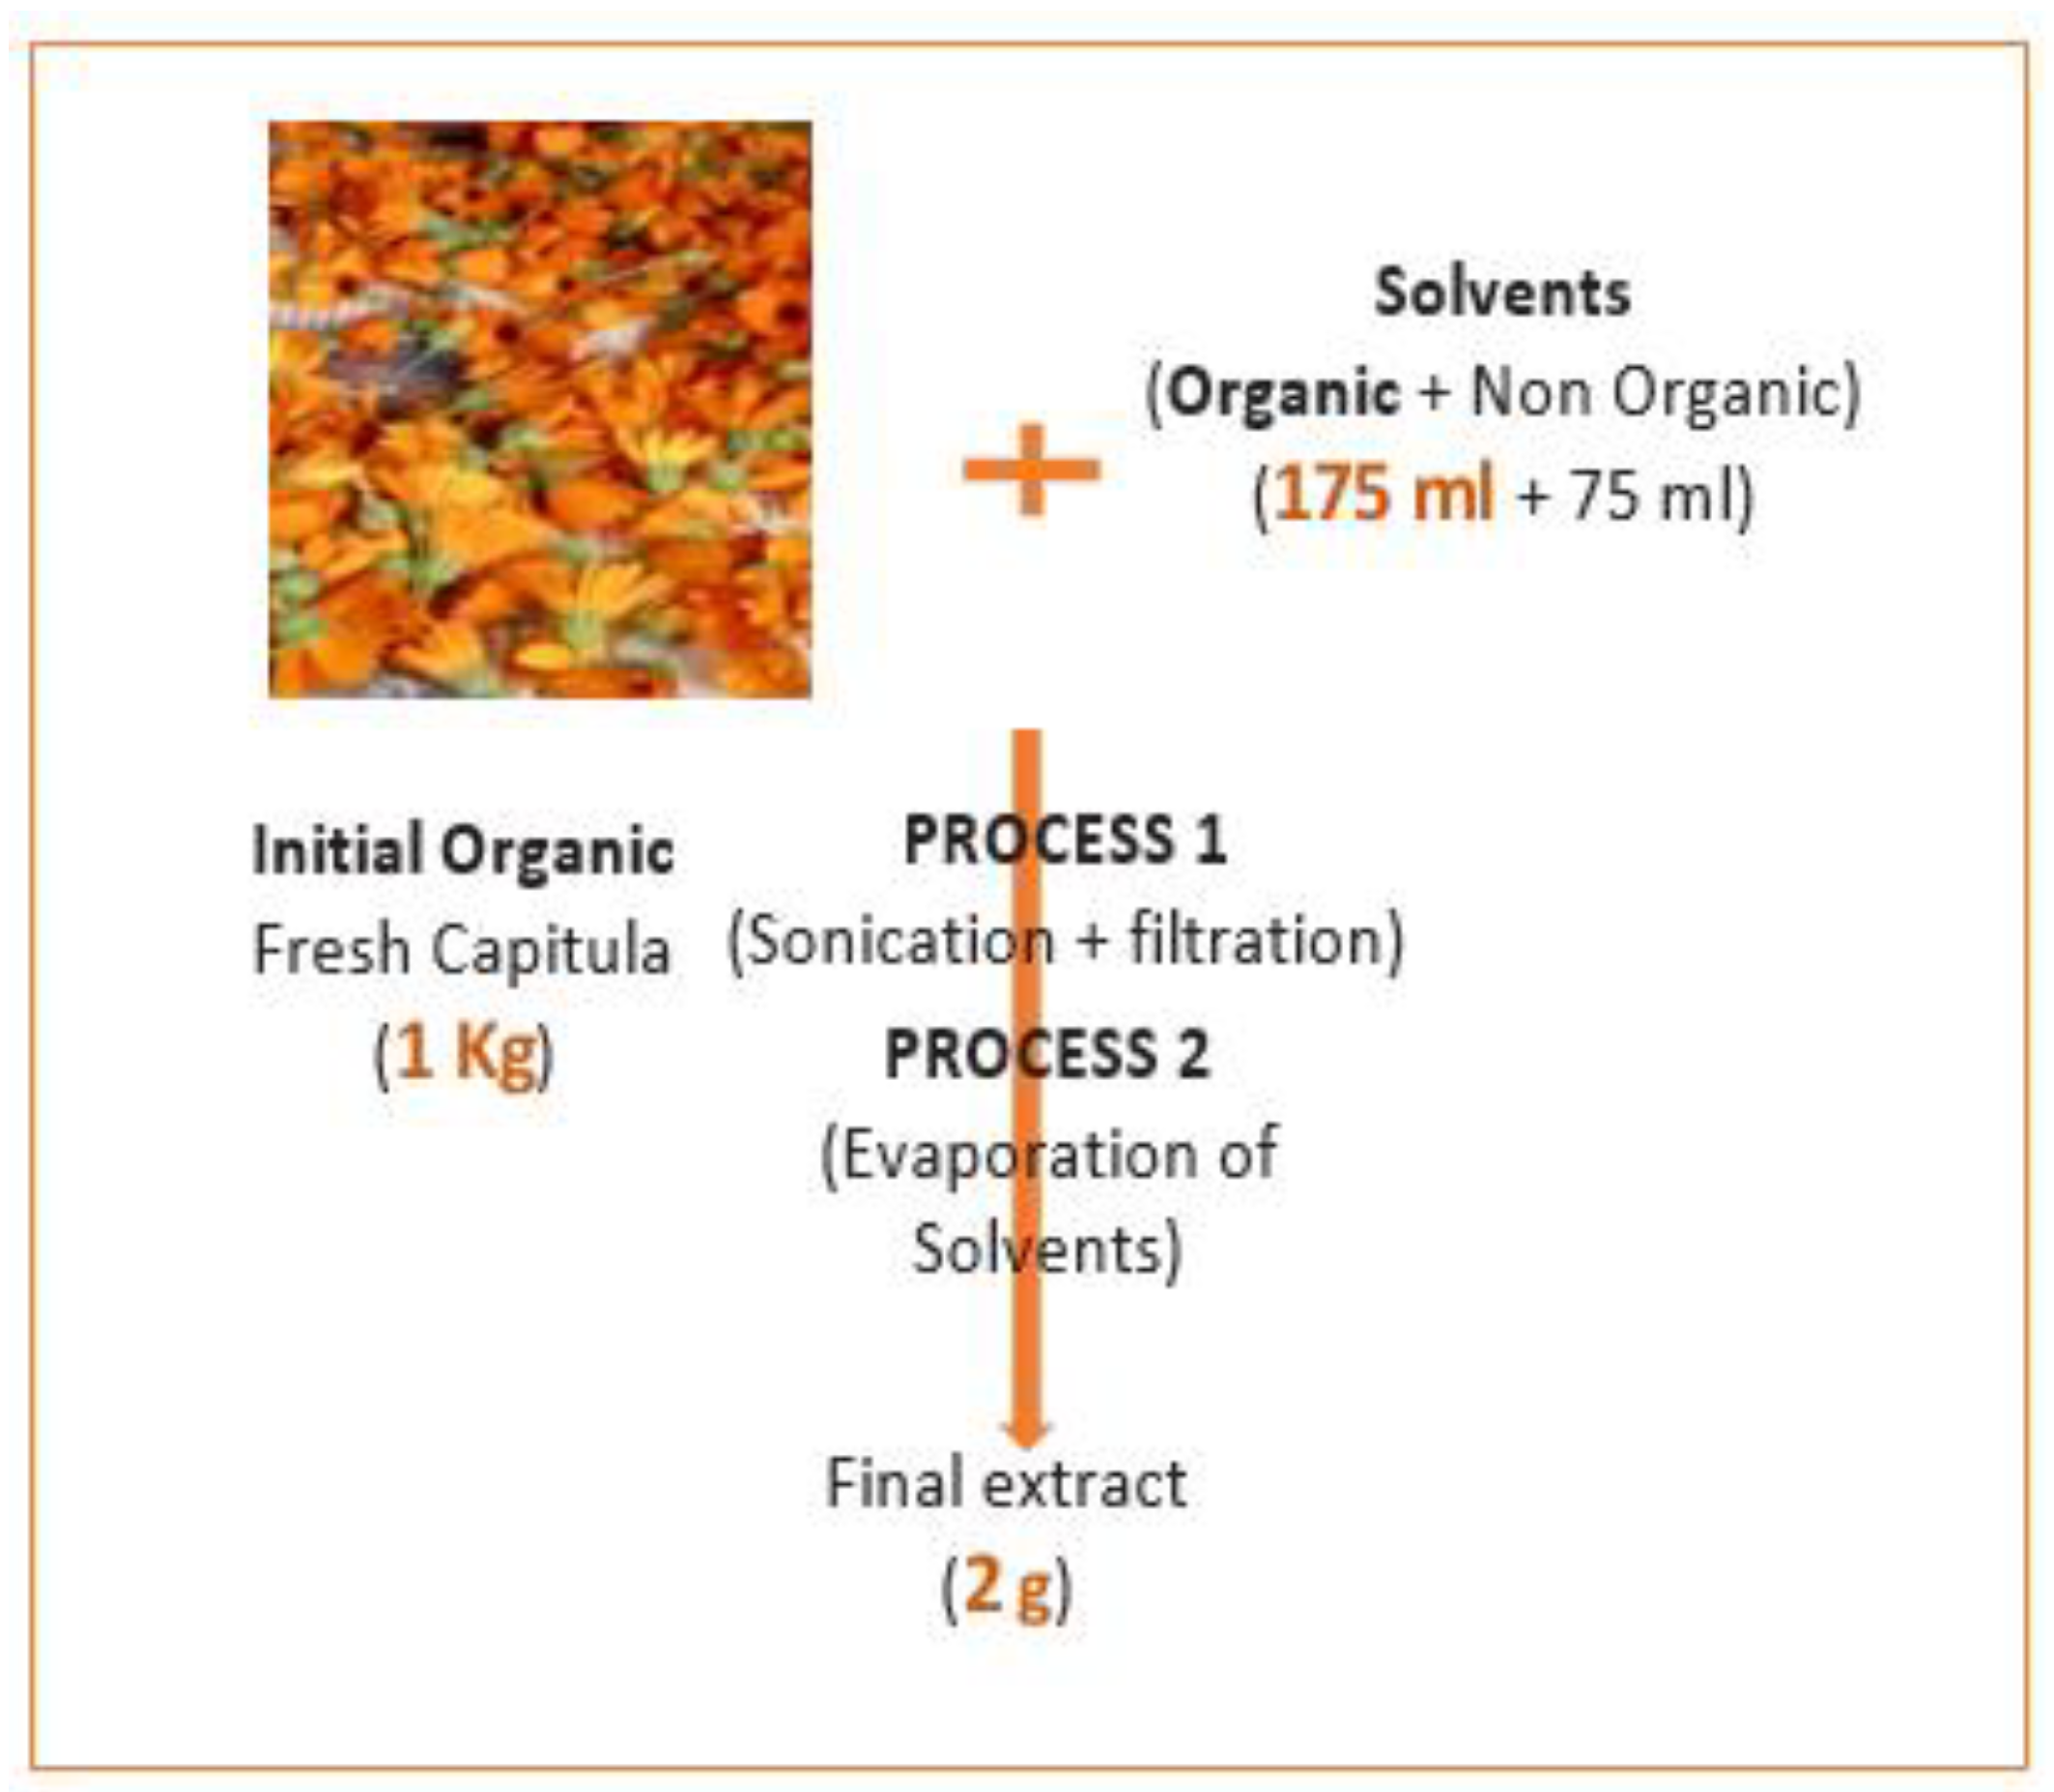
Figure 5.
Characterization of sunscreen formulation parameters at different time intervals (day 1, day 30, day 60 and day 90) for stability over time (n=3): (A) pH values, (B) Peroxide value, (C) Conductivity, and (D) Viscosity analysis.
Figure 5.
Characterization of sunscreen formulation parameters at different time intervals (day 1, day 30, day 60 and day 90) for stability over time (n=3): (A) pH values, (B) Peroxide value, (C) Conductivity, and (D) Viscosity analysis.
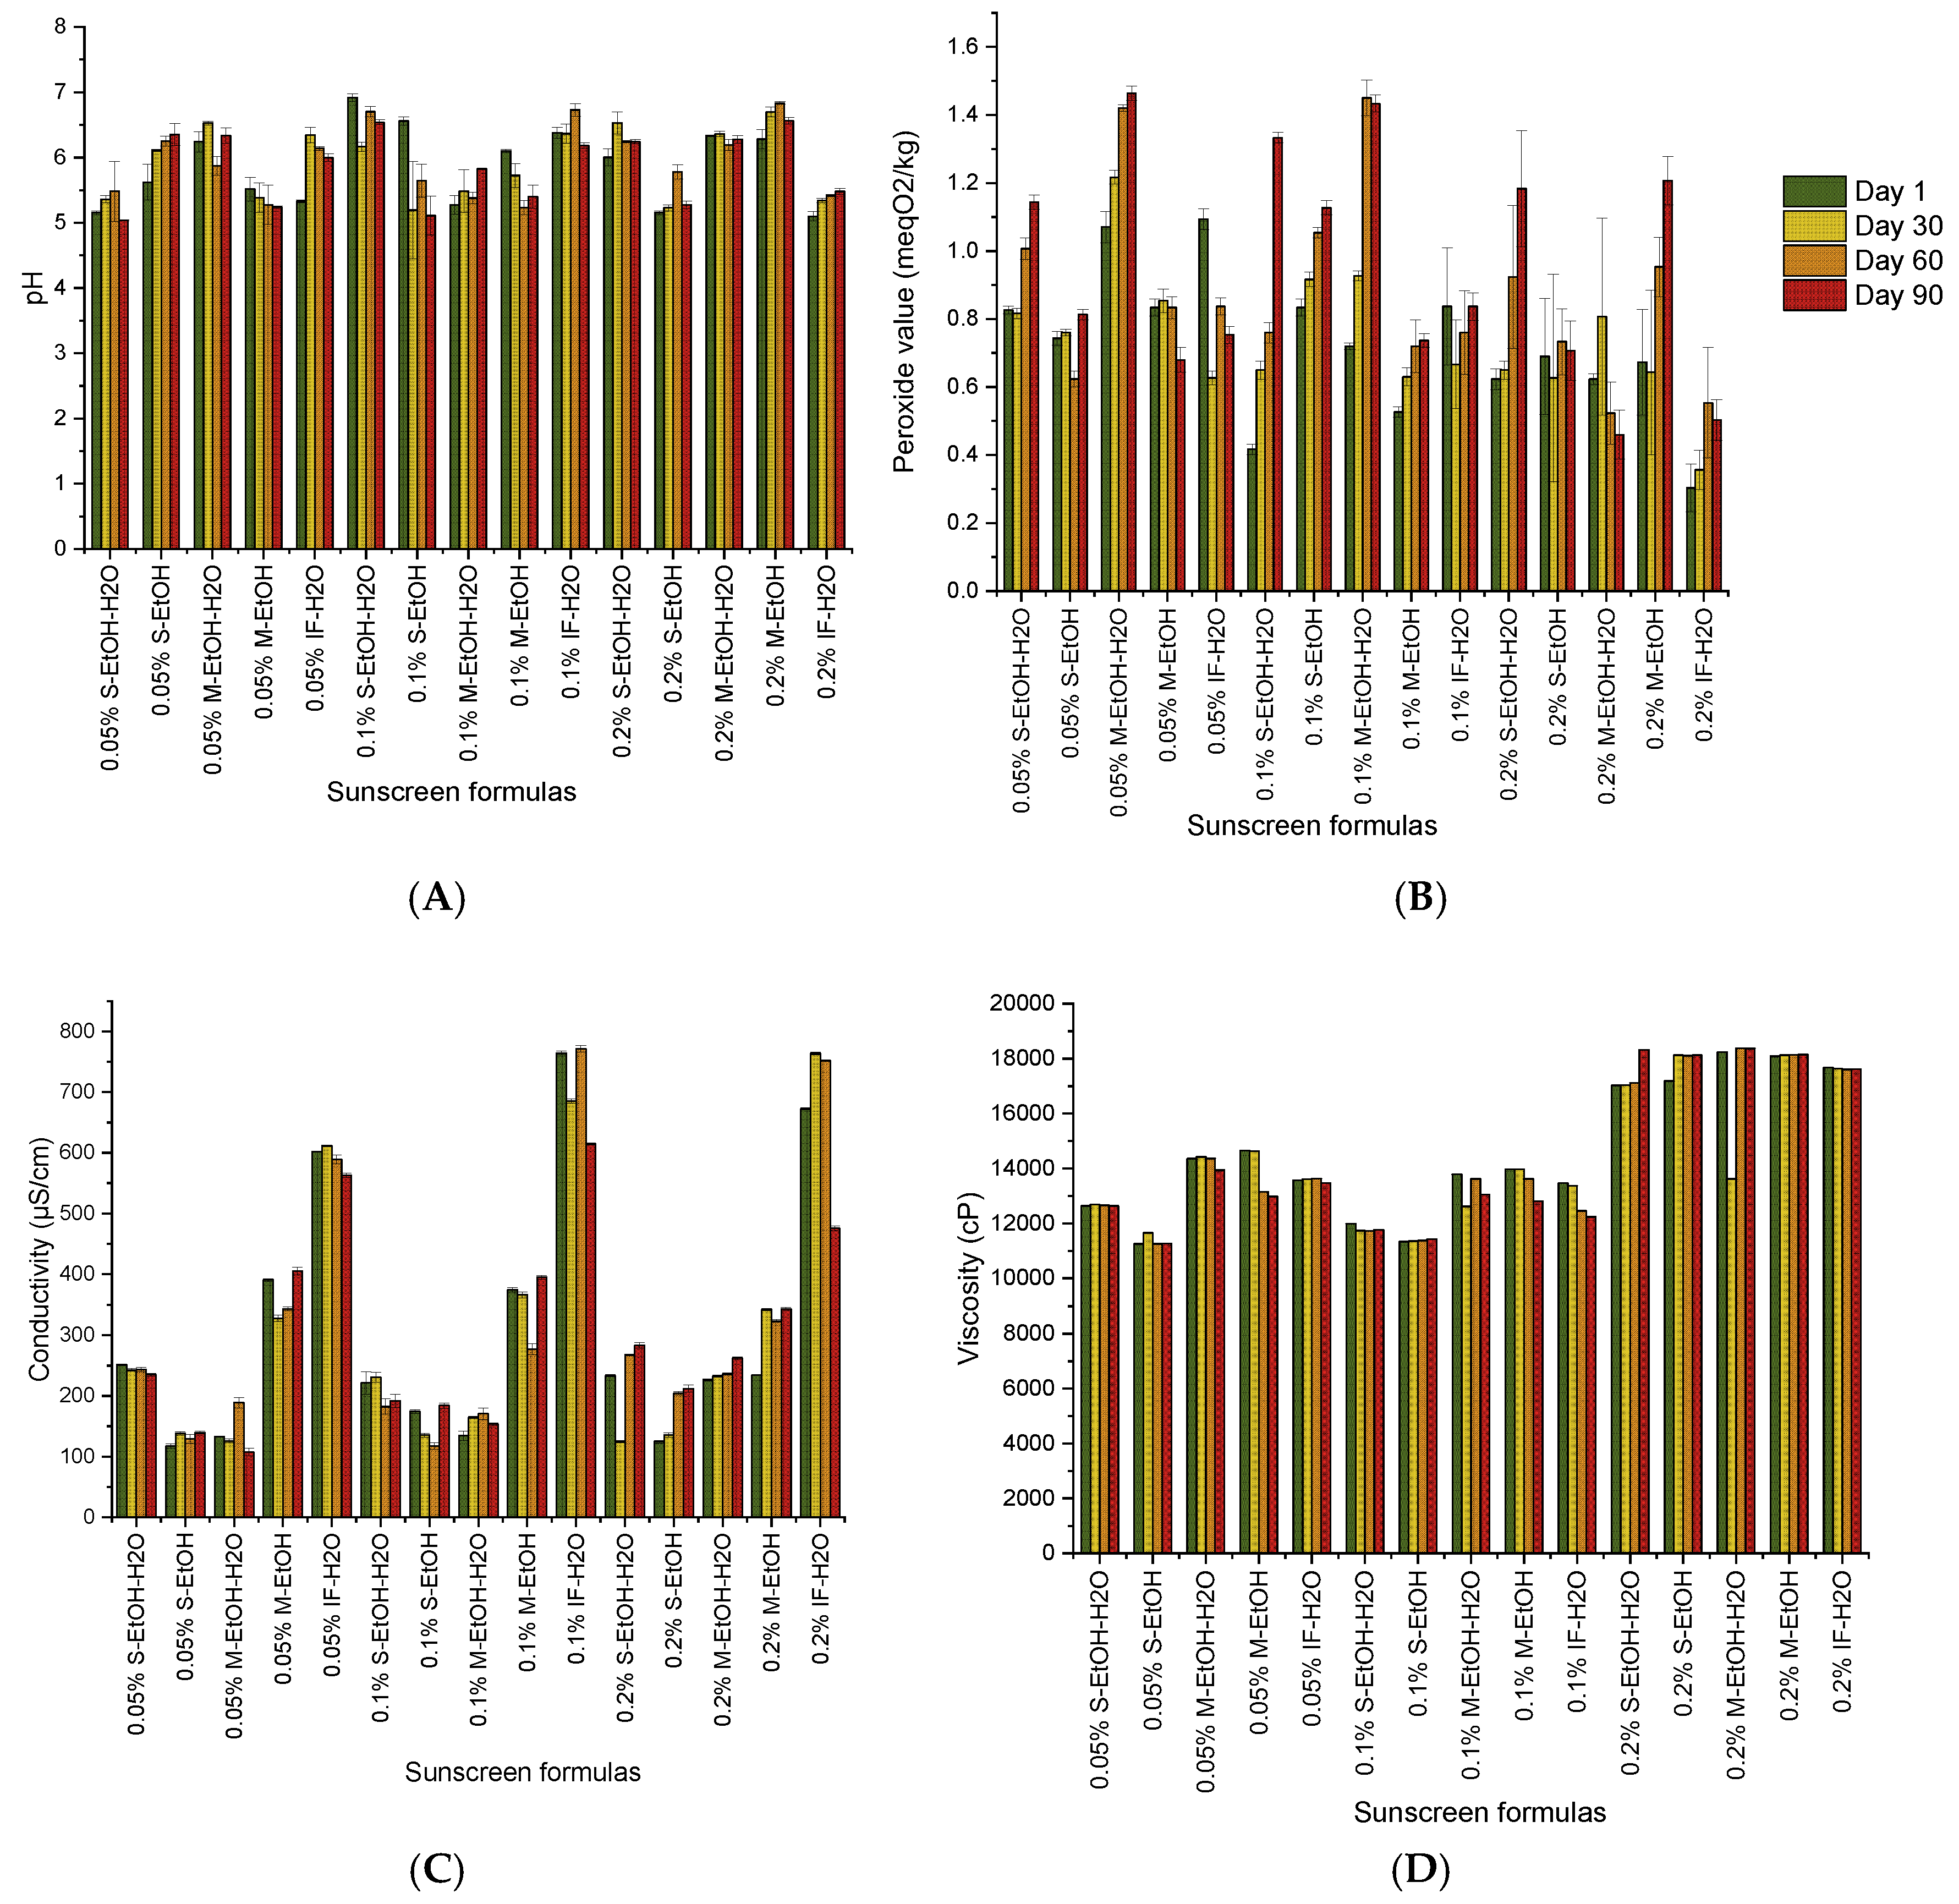

Table 1.
Yield percentage of extraction methods.
| Extracts | Designations | Yield % |
|---|---|---|
| S-EtOH-H20 | Sonication ethanol 70% | 34.78 ± 2.01 |
| S-EtOH | Sonication ethanol 100% | 24.76 ± 2.23 |
| M-EtOH-H2O | Maceration ethanol 70% | 22.44 ± 0.57 |
| M-EtOH | Maceration ethanol 100% | 21.36 ± 1.34 |
| IF-H2O | Infusion in water | 31.96 ± 1.74 |
Table 2.
Sunscreen O/W emulsion formula.
| Phase | INCI | Fonction | Weight (%, w/w) |
|---|---|---|---|
| Phase A | GLYCERIN | Humectant | 3 |
| C. ARVENSIS FW* | Dispersion agent | Qsp 100 | |
| Phase B | CETEARYL ALCOHOL | Emulsifier, thickening agent, stabilizer | 5 |
| STEARIC ACID | Emulsifier, thickener, consistency enhancer | 2 | |
| CETEARETH-20 | surfactant | 5.5 | |
| C. ARVENSIS OIL MACERATE | Dispersed agent | 10 | |
| Phase C | C. ARVENSIS ORGANIC EXTRACTS | SPF, antioxidant, anti-age, stabilizer | 0.2, 0.1, 0.05 |
| P. GRAVEOLENS EO** | Antimicrobial, fragrance | 0.5 |
Phase A: Aqueous Phase, Phase B: Oil Phase, Phase C: Cooling Phase, INCI: International Nomenclature Cosmetic Ingredient, Qsp 100: quantum satis pro 100%. *C. arvensis floral water, **Pelargonium graveolens essential oil.
Table 3.
Contents of total phenolic, flavonoids and condensed tannins.
| Extracts |
Phenolic compounds | ||
|---|---|---|---|
| TPC (mgGAE/g) | TFC (mgQE/g) | TC (mg/mL) | |
| S-EtOH-H20 | 27.20 ± 2.76 a | 13.37 ± 1.04 a | 1.66 ± 0.02 a |
| S-EtOH | 14.96 ± 1.65 b | 11.40 ± 0.32 ab | 1.32 ± 0.04 bc |
| M-EtOH-H2O | 16.38 ± 1.15 b | 7.72 ± 1.40 c | 1.13 ± 0.01 cd |
| M-EtOH | 8.24 ± 1.17 c | 6.47 ± 0.49 c | 1.10 ± 0.06 d |
| IF-H2O | 16.91 ± 1.11 b | 10.69 ± 0.68 b | 1.46 ± 0.12 b |
TPC-Total polyphenols content; TFC-Total flavonoids content; TC- tannins content; GAE-gallic acid equivalent; QE-quercetin equivalent. The letters a-d are used to indicate a statistically significant difference (p<0.05) between the samples that were tested.
Table 4.
In Vitro antioxidant activity of C. arvensis capitula extracts using DPPH, ABTS, TAC and FRAP methods.
Table 4.
In Vitro antioxidant activity of C. arvensis capitula extracts using DPPH, ABTS, TAC and FRAP methods.
| Extracts | Antioxidant activity | |||
|---|---|---|---|---|
| DPPH IC50 mg/mL |
ABTS IC50 mg/mL |
FRAP mg AAE/g pm |
TAC mg AAE/g pm |
|
| S-EtOH-H20 | 3.77 ± 0.44 a | 3.21 ± 0.08 a | 18.69 ± 0.46 ab | 12.46 ± 0.61 a |
| S-EtOH | 13.57 ± 0.41 b | 6.84 ± 0.03 b | 14.67 ± 0.55 b | 12.34 ± 0.82 a |
| M-EtOH-H2O | 7.33 ± 0.33 c | 2.71 ± 0.05 c | 21.90 ± 1.63 a | 8.99 ± 0.85 b |
| M-EtOH | 15.27 ± 0.90 d | 15.22 ± 0.01 d | 16.95 ± 0.84 b | 10.66 ± 0.84 ab |
| IF-H2O | 26.98 ± 0.93 e | 8.55 ± 0.02 e | 15.58 ± 3.15 b | 9.72 ± 0.45 b |
| Vit-C | 0.14 ± 0.03 f | 0.004 ± 0.001 f | - | - |
pm: plant material, the letters a-f are used to indicate a statistically significant difference (p<0.05) between the samples that were tested. Values are presented as means ± standard error (n = 3). Different letters in the same row indicate statistical significance at p < 0.05. DPPH refers to DPPH Free Radical-Scavenging Activity; FRAP denotes Ferric Reducing Antioxidant Power assay; ABTS stands for ABTS Radical Scavenging Assay; TAC represents Total Antioxidant Capacity. mg GAE/g pm: mg Gallic Acid Equivalent per gram of plant material. Vit-C: Vitamin c.
Table 5.
Inhibitory activity of C. arvensis capitula against tyrosinase, elastase and collagenase.
| Extracts | Concentrationmg/mL | Tyrosinase | Elastase | Collagenase | |||
|---|---|---|---|---|---|---|---|
| I% ± SD | CI50 ± SD mg/mL | I% ± SD | CI50 ± SD mg/mL | I% ± SD | CI50 ± SD mg/mL | ||
| M-EtOH | 10 | 68.04 ± 3.09 bc | 6.71 ± 0.06 a | 57.95 ± 1.75 cd | 7.56 ± 0.19 b | 36.84 ± 5.54 bc | - |
| 5 | 46.79 ± 8.64bc | 48.95 ± 0.44 b | 30.00 ± 2.78 bc | ||||
| 2.5 | 21.76 ± 1.88c | 29.15 ± 0.94 c | 25.26 ± 2.41 b | ||||
| 1.25 | 9.37 ± 2.06 c | 14.97 ± 0.69 d | - | ||||
| 0.625 | - | 3.02 ± 0.64 e |
- | ||||
| M-EtOH-H2O | 10 | 77.72 ± 0.65ab | 3.89 ± 0.76 bc | 64.47 ± 4.95 bc | 6.87 ± 0.38 b | 35.51 ± 3.66 bc | - |
| 5 | 58.12 ± 4.20 b | 43.94 ± 0.97 cd | 30.71 ± 2.80 b | ||||
| 2.5 | 45.47 ± 2.88 b | 30.07 ± 1.16 c | 11.49 ± 2.48 c | ||||
| 1.25 | 32.32 ± 4.30 b | 21.37 ± 2.33 c | 8.00 ± 5.96 b | ||||
| 0.625 | 20.75 ± 4.96 a | 8.20 ± 2.25 cd | - | ||||
| S-EtOH | 10 | 57.31 ± 3.64 cd | 7.91 ± 0.50 a | 57.54 ± 1.03 cd | 7.45 ± 0.06 b | 36.90 ± 1.57 bc | - |
| 5 | 40.63 ± 3.28 c | 42.84 ± 1.95 d | 24.80 ± 1.91 c | ||||
| 2.5 | 29.14 ± 2.16 c | 36.07 ± 1.67 b | 14.68 ± 3.27 c | ||||
| 1.25 | 14.87 ± 1.82 c | 28.62 ± 0.44 b | - | ||||
| 0.625 | - | 12.15 ± 1.22 bc | - | ||||
| S-EtOH-H20 | 10 | 82.91 ± 4.74 a | 3.58 ± 0.56 c | 70.40 ± 1.06b | 5.93 ± 0.13 c | 41.13 ± 2.02 b | - |
| 5 | 59.12 ± 7.71 b | 47.63 ± 1.69 bc | 28.08 ± 1.94 bc | ||||
| 2.5 | 51.80 ± 5.57 b | 38.28 ± 2.81b | 14.79 ± 2.59 c | ||||
| 1.25 | 38.42 ± 2.56 b | 21.78 ± 2.61 c | - | ||||
| 0.625 | 27.40 ± 1.18 a | 12.87 ± 0.99 b | - | ||||
| IF-H2O | 10 | 56.78 ± 7.06 d | 6.62 ± 2.24 ab | 55.90 ± 3.49 d | 8.30 ± 0.34 a | 31.16 ± 6.27 c | - |
| 5 | 47.67 ± 3.18 bc | 36.19 ± 2.56 e | 25.13 ± 1.11 c | ||||
| 2.5 | 43.60 ± 3.88 b | 28.38 ± 0.68 c | 14.76 ± 2.24 c | ||||
| 1.25 | 12.24 ± 7.95 c | 21.70 ± 1.17 c | - | ||||
| 0.625 | - | 5.03 ± 1.91 de | - | ||||
| Standards* | 1 | 86.94 ± 1.50 a | 0.071 ± 0.01 d | 78.39 ± 1.39 a | 0.11 ± 0.00 d | 81.82 ± 1.87 a | 0.08 ± 0.00 |
| 0.25 | 81.90 ± 1.57 a | 66.75 ± 0.63 a | 75.22 ± 0.26 a | ||||
| 0.125 | 64.00 ± 3.14 a | 52.94 ± 1.39 a | 60.37 ± 0.88 a | ||||
| 0.06 | 51.53 ± 3.07 a | 46.12 ± 0.65 a | 51.86 ± 1.02 a | ||||
| 0.03 | 25.05 ± 1.91 a | 32.82 ± 1.54 a | 31.47 ± 0.83 a | ||||
Similar letters in the same column and row indicate that there is no significant difference, with a p<0.05 threshold (n=3). * Kojic acid is used as a standard for the tyrosinase enzyme, while epigallocatechin gallate is used as a standard for elastase and collagenase.
Table 6.
SPF values of C. arvensis extracts against UVB.
| Extracts | SPF-UVB |
|---|---|
| S-EtOH-H20 | 193.67 ± 0.04 a |
| S-EtOH | 193.46 ± 0.19 a |
| M-EtOH-H2O | 193.49 ± 0.24 a |
| M-EtOH | 193.60 ± 0.11 a |
| IF-H2O | 192.19 ± 0.08 a |
| ZnO | 11.88 ± 0.03 b |
Values are presented as means ± standard error (n = 3). Different letters in the same row indicate statistical significance at p < 0.05.
Disclaimer/Publisher’s Note: The statements, opinions and data contained in all publications are solely those of the individual author(s) and contributor(s) and not of MDPI and/or the editor(s). MDPI and/or the editor(s) disclaim responsibility for any injury to people or property resulting from any ideas, methods, instructions or products referred to in the content. |
© 2024 by the authors. Licensee MDPI, Basel, Switzerland. This article is an open access article distributed under the terms and conditions of the Creative Commons Attribution (CC BY) license (https://creativecommons.org/licenses/by/4.0/).
Copyright: This open access article is published under a Creative Commons CC BY 4.0 license, which permit the free download, distribution, and reuse, provided that the author and preprint are cited in any reuse.


