Submitted:
16 September 2025
Posted:
30 September 2025
You are already at the latest version
Abstract
Life emerged from non-living matter through energy-driven, self-organizing processes constrained by thermodynamics, stabilized by dissipative structures, and coordinated by cybernetic feedback. We present a staged mathematical framework—Bioevo-Cybernetics I—that formalizes this progression from protocells to unicellular and multicellular systems. The model integrates entropy dissipation, free-energy throughput, and hierarchical feedback regulation, showing how organisms sustain order by channeling metabolic flows into dissipative pathways. Evolution is thus reframed as an active, self-regulating process in which variation, selection, and feedback interact under entropy–dissipative constraints, progressively transforming stochastic mutation into directed pathways of complexity.
As a case study, we apply the framework to the evolutionary transition from heterotrophic flagellates to photosynthetic dinoflagellates. The model captures key drivers—environmental energy flow, cellular asymmetry, population processes, and internal integration—while explicitly incorporating thermodynamic gating functions that determine whether complexity is maintained or lost. Simulations reproduce major thresholds of evolutionary innovation, including plastid acquisition, nuclear dualism, and stable flagellar reconfiguration, with results aligning with fossil and geobiological records. The framework quantifies the trade-off between increasing complexity and decreasing adaptability, also predicts contingent outcomes such as bistability, hysteresis and environmental dependence, providing an explanation for both the early origin and later fossil appearance of dinoflagellates.
By uniting entropy dissipation, cybernetic control, and evolutionary transitions in a single quantitative framework, Bioevo-Cybernetics I offers a predictive approach to reconstructing the origins and long-term dynamics of biological complexity. This work establishes a foundation for testing how thermodynamic and regulatory constraints interact to shape major evolutionary innovations, from the origin of life to the rise of eukaryotic complexity.
Keywords:
bioevo-cybernetic model
; entropy
; dissipative structure
; multicellular organisms
; proto-life
; single-cellular life
; stage-based evolutionary progression
Introduction
The origin of life remains one of science’s most profound and unresolved questions. The leap in complexity from the primordial ocean to the first cellular organisms challenges both “chemistry-forward” approaches, which focus on prebiotic synthesis, and “biology-backwards” approaches, which trace complexity from modern cells to their simplest forms. Bridging this gap requires understanding the physical, chemical, and informational processes that drove the earliest evolutionary transitions.
Modeling the origin of life and subsequent evolution has long drawn on a combination of chemical kinetics, thermodynamics, systems theory, and information theory. Key contributions include: the hypercycle theory of autocatalytic networks (Eigen & Schuster 1977, 1979; Hordijk 2013, Huson et al. 2024; Williamson 2024; Despons 2025), self-organization via network dynamics (Kauffman 1993, Zorc & Roy 2024), the role of alkaline hydrothermal vents and the acetyl-CoA pathway in early metabolism (Martin & Russell 2007), models linking bioenergetics to genome complexity (Lane & Martin 2010), classical quantitative evolutionary models (Fisher 1930), eco-evolutionary dynamics (Kalambokidis & Travisano 2024), free-energy principle (Ramstead 2018, 2019; Badcock et al. 2022, Fields 2024), phenomenological thermodynamic and multilevel learning frameworks (Vanchurin et al. 2022), and model or laboratory-based protocell studies (Szostak et al. 2001, Villani et al. 2024, Zimmermann et al. 2024, Kicsiny et al. 2025, Tang & Gao 2025). These studies collectively suggest that the abiogenesis-to-biogenesis transition emerged naturally from energy flows in open thermodynamic systems, coupled to their environments (Moldavanov 2021).
Life’s origin and evolution can be conceptualized as stage-based progressions, where each stage introduces new forms of sensing, modeling, action, and inheritance—yet all operate under the same core cybernetic principle: systems evolve by reducing uncertainty and increasing environmental control through feedback and variation. This process is recursive, with each stage instantiating the cybernetic equation in a more complex substrate and achieving higher adaptive capacity (Wiener 1948; Miller 1978; Maturana & Varela 1980; Brooks & Wiley 1986; Kauffman 1993; Maynard Smith & Szathmáry 1995; Heylighen & Joslyn 2001; Deacon 2011; Capra 2014; Szathmáry 2015; Pei 2025).

Table 1.
Stage-Based Evolutionary Progression.
| Stage | Transition | Unit of Evolution | Feedback Medium |
| 0 | Pre-life chemistry | Molecular replicators | Chemical autocatalysis |
| 1 | Life emerges (protocells) | Metabolic gene networks | Environmental coupling |
| 2 | DNA + natural selection | Genes & genotypes | Reproductive fitness |
| 3 | Multicellularity | Cells and cell groups | Developmental programs |
| 4 | Nervous systems | Behaviors / neural circuits | Sensorimotor learning |
| 5 | Symbolic communication | Cognitive strategies | Language/memory feedback |
| 6 | Culture & institutions | Ideas / memes / cultures | Social interaction |
| 7 | Scientific civilization | Knowledge systems | Technological & symbolic |
| 8 | Post-human intelligence/ AI | Self-evolving intelligences | Recursive cybernetic loops |
Table 2.
Layers of Increasing Cybernetic Sophistication.
| Stage | Trait ϕ | Fitness Function W | Feedback Type | Info Gain Medium |
| 1 | Membrane structure | Chemical stability + replication rate | Autocatalysis, environment | Molecular interactions |
| 2 | Genetic sequences | Reproductive fitness in given environment | Natural selection | DNA mutations |
| 3 | Cell adhesion, division | Organismal viability | Developmental signaling | Epigenetic programs |
| 4 | Neural patterns | Behavior success / survival | Neural feedback from actions | Synaptic plasticity |
| 5 | Mental models | Prediction accuracy / communication | Social feedback, language | Memory, culture |
| 6 | Institutions, norms | Collective survival / cohesion | Governance, media, economy | Cultural inheritance |
| 7 | Scientific theories | Predictive power, problem-solving | Peer review, data feedback | Symbolic language + tech |
| 8 | Code, algorithms | Performance + self-improvement | Real-time evaluation loops | Machine learning systems |
The evolutionary history of life is closely linked to Earth’s geologic and climatic evolution. Before the Cambrian explosion, life likely passed through at least three major stages:
- 1)
- Transition from non-living microscopic particles to metabolically active, self-renewing protocells.
- 2)
- Transition from non-cellular living matter to single-celled organisms with defined cellular structures.
- 3)
- Evolution from unicellular to multicellular organisms with cellular differentiation.
Geological evidence suggests that two major crustal reorganizations before the Paleozoic corresponded with the completion of the non-cellular–to–cellular transition. As the temperature of the primordial ocean cooled below 100 °C, conditions became favorable for life-like particles—capable of metabolism, self-maintenance, and reproduction—to form and float near the ocean surface, marking Stage 1. Over long timescales, these protocells evolved into single-celled organisms (Stage 2). Under environmental stress, daughter cells sometimes remained attached after division, eventually forming stable multicellular aggregates. With repeated cycles, these aggregates began cellular differentiation, initiating Stage 3 of life’s development (Pei 2025).
Stage 1 – From Abiotic Chemistry to Life-like Particles (Table 3)
Early studies identified surface hydrothermal vents as promising settings for prebiotic synthesis, where geochemical processes could bridge the gap to protocell formation (Ferris, 1984; Pleasant & Ponnamperuma, 1984; Rimmer & Shorttle, 2019). Experiments have shown that polymeric droplets—formed before lipid membranes existed—can act as primitive compartments capable of retaining catalytic molecules, proteins, and RNA. These findings underscore the feasibility of polyester-based droplets as protocell analogues, marking a key step from abiotic chemistry toward organized, life-like compartmentalization (Gilbert, 1986; Abigail et al., 2006; Koonin, 2007; Allwood et al., 2009; Lincoln & Joyce, 2009; Wacey et al., 2011; Bontognali et al., 2012; Michael et al., 2012; Pressman et al., 2015; Becker et al., 2019; Vay & Mutschler, 2019).
Sharma et al. (2022) reviewed both historical and modern approaches to generating proteinoid microspheres—protein-like particles from amino acids with cell-like features. Research on non-living active matter, such as self-propelled colloids, has revealed that physical processes can drive self-organization into protocellular structures. Theoretical work further suggests that nonequilibrium “active droplets” can spontaneously grow and divide without membranes (Mann, 2012; Zwicker et al., 2016; Hagan & Baskaran, 2016; Hansma, 2014, 2017; Gözen, 2022).
Recent Miller–Urey-type experiments show that silica surfaces can catalyze the simultaneous formation of hollow organic vesicles and prebiotic compounds (Jenewein et al., 2024). Geological evidence indicates that between ~2.8 and 1.9 Ga, Earth transitioned from an anoxic, iron-rich state to one with oxygenated air, evolving life, and major climate shifts—conditions that paved the way for complexity. Proxies including zircons, isotopes, BIFs, carbonates, and impact records underpin current reconstructions of surface, ocean, and atmospheric evolution from Earth’s infancy through the Great Oxidation Event (Farquhar et al., 2000; Mojzsis et al., 2001; Sleep et al., 2001; Valley et al., 2002; Hayashi et al., 2008; Abramov & Mojzsis, 2009; Crowe et al., 2013; Planavsky, 2014; Robbins et al., 2019; Mänd et al., 2021; Hodgskiss et al., 2023).
Stage 2 – From Proto-life to Cellular Life (Table 4)
The earliest fossil evidence of life includes stromatolites and microbial mats dated to ~3.5–3.8 Ga, representing prokaryotic single-celled organisms such as bacteria, archaea, and cyanobacteria. Fossils—cellular filaments, biofilm textures, and stromatolite laminae—occur as early as 3.4–3.7 Ga, while stable isotope biosignatures (e.g., strongly13C-enriched organic carbon and large δ¹³C offsets) extend back to ≥3.95 Ga. Carbon preserved in robust minerals (apatite, graphite, zircon) has even pushed tentative biogenic signals into the Hadean (>4 Ga). Collectively, these fossil and geochemical records establish the multidisciplinary evidence base for Stage 2, when single-celled life first emerged and persisted (Schopf, 1993; Mojzsis et al., 1996; Rosing, 1999; Tice & Lowe, 2004; Wacey et al., 2011; Ohtomo et al., 2014; Beli et al., 2015; Nutman et al., 2016; Tashiro et al., 2017).
Stage 3 – From Single-celled to Multicellular Life (Table 5)
The Proterozoic Eon (2.5 Ga–541 Ma) saw sweeping changes in Earth’s atmosphere, oceans, biosphere, and energy systems, setting the stage for complex organisms. The earliest transition to multicellularity likely occurred between ~2.0 and 1.6 Ga, in relatively stable, low-oxygen conditions. These pioneering multicellular forms—often simple filaments or colonies—are exemplified by Grypania (~2.1 Ga) (Han & Runnegar, 1992; Butterfield, 2000; Canfield et al., 2007; Bamforth & Narbonne, 2009; Love et al., 2009; El Albani et al., 2010; Strother et al., 2011; Yuan et al., 2011).
Material and Method
Figure 1.
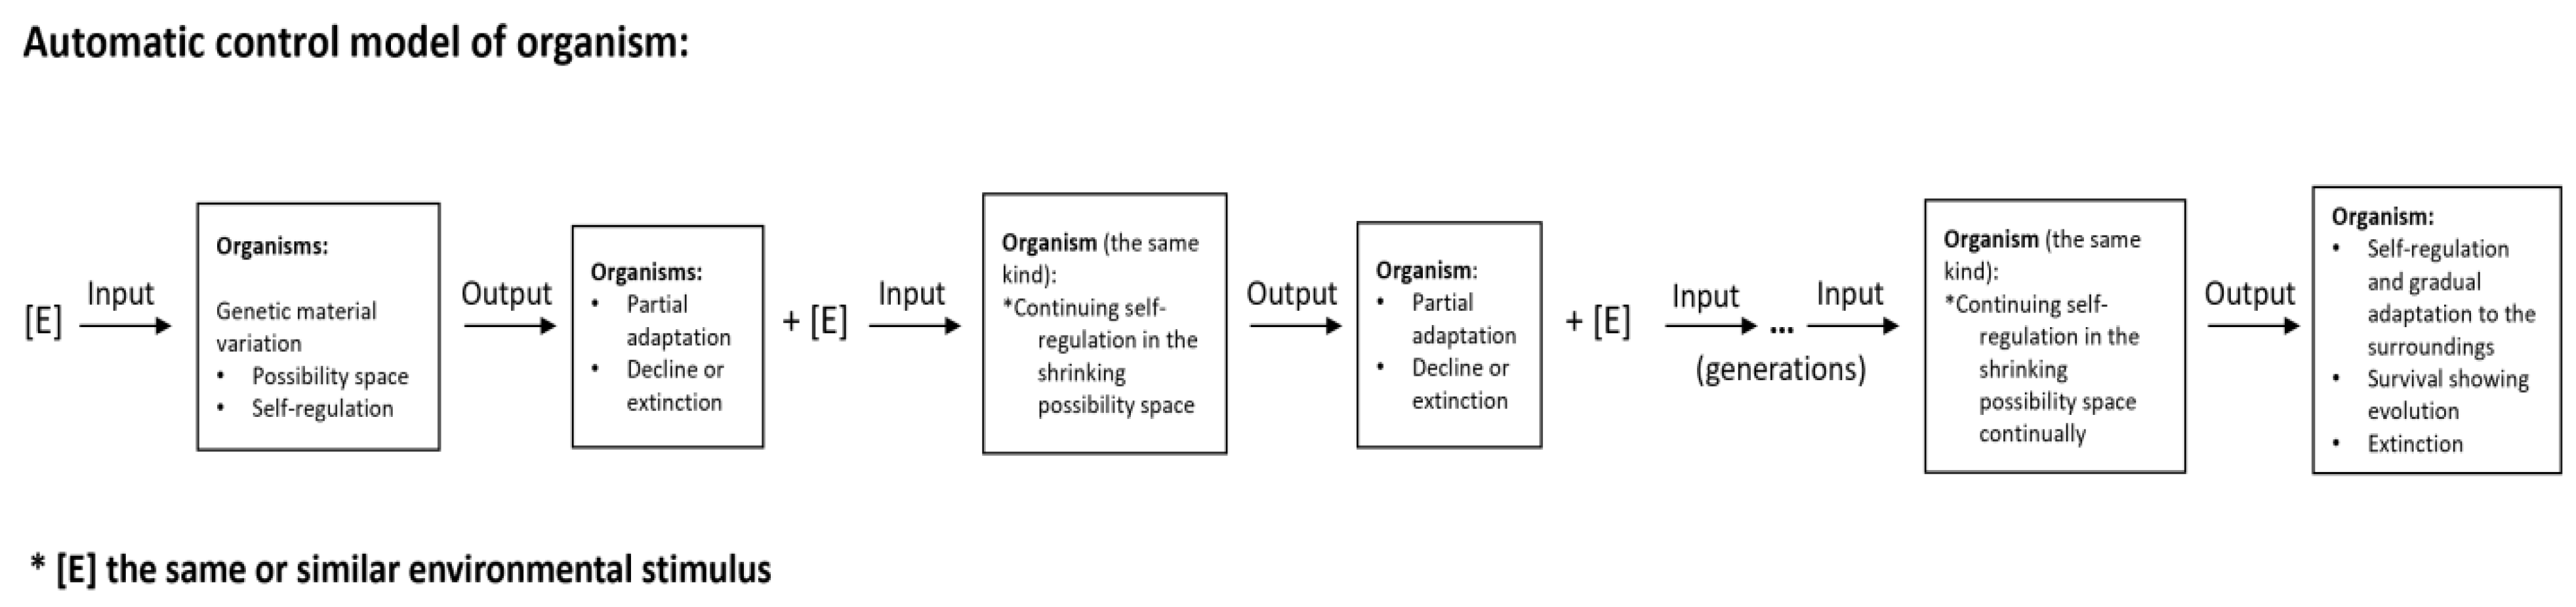
Bioevo-Cybernetics Model: Environmental stimuli (input) trigger self-regulation and changes in physiological/genetic states. Each generation feeds the previous output back into a reduced possibility space, moving from temporary adaptation (conditioned reflexes) toward permanent adaptation (unconditioned reflexes). Outcomes are survival/evolution or extinction.
Figure 1.
Bioevo-Cybernetics Model: Environmental stimuli (input) trigger self-regulation and changes in physiological/genetic states. Each generation feeds the previous output back into a reduced possibility space, moving from temporary adaptation (conditioned reflexes) toward permanent adaptation (unconditioned reflexes). Outcomes are survival/evolution or extinction.
Result and Discussion
- 1.
- Evolutionary Model Stage 1: From Abiotic Matter to Life-like Particles
Input: primordial environment (Hadean–early Archean, ~4.6–4.0 Ga) (Table 3)
where T=temperature; P=pressure; Ci=concentrations of chemical species (e.g., H2O,CH4,NH3,Fe2+,CO,PO 43−); E=energy flux (e.g., hydrothermal, lightning, UV); pH= acidity; t=time (Ga)
X⃗(t) = [T(t),P(t),C1(t),C2(t),…,E(t),pH(t)]
Output: Emergence of proto-life particles (4.0–2.5 Ga).
Life potential function:
L(t)=∫0t[Chemistry, autocatalysis, fidelity, energy] dτ
L(τ) = ∫0t[α⋅C(X⃗(τ))⋅A(τ)⋅e−ΔG(τ)/RT(τ)R(SL(t),EL(t))] dτ
Here, C(X⃗)=chemical complexity potential, A(τ)=autocatalytic network rate, ΔG=free energy change for life-like structures, R(SL(t),EL(t)) = compatibility with environmental limits.
Weighted form for simulation:
L(τ) = ∫0t[(∑ikiCi(τ))⋅a0e−b/T(τ)⋅e−ΔG(τ)/RT(τ) ⋅R(SL(t),EL(t))]dτ
Equation (2) accumulates the probability of life-like particle formation over time by integrating (summing up) all the chemical, physical, and energetic and regulatory factors. Life emerges when L(t)≥Lc, estimated from geological evidence at ~4.0–3.8 Ga, representing the minimum threshold for stable autocatalysis and proto-life formation.
1.1 Formation of the First Life-Like Systems
From Eq.(2), life emerges when L(t)≥Lc. The model predicts this threshold around 4.1–4.0 Ga, consistent with early Archean conditions and predating the oldest clear fossil evidence (~3.5 Ga stromatolites). Thus, the model suggests life arose before the fossil record confirms it.
1.2 The RNA World Hypothesis
Extending L(t) to include RNA information content (Eq. 3):
with I(τ)=γ⋅Pseq(t)⋅Pfunc(t), where Pseq = probability of RNA chain formation, and Pfunc = probability of catalytic function. Functional RNA is rare, delaying emergence relative to Eq. (2).
L(τ) = ∫0tC(X(τ))⋅A(τ)⋅I(τ)⋅ P(τ) dτ −d(t)L(t)
As replication fidelity improves, RNA sequences carried genetic information and catalyzed chemical reactions and evolved toward self-replication (Joyce 1989, Ricardo et al 2004). Transition to DNA introduces greater stability and separation of storage vs catalytic roles. The updated model (Eq. 4) incorporates decay reduction, error correction ϵ(t), and dual information systems (RNA vs DNA), reflecting this structural and functional shift.
Because functional RNA is very rare, life emergence is delayed slightly compared to the previous model. When further modelling with mutation and replication fidelity: early on, high mutation rates reduce fidelity and hinder reliable replication; as Earth cools and chemistry matures, replication fidelity improves, and a few sequences can self-replicate and evolve; then life is predicted to emerge under these extended constraints — slightly later than in simpler models.
When RNA evolves into DNA during stage 1, it marks a major structural and functional shift. Equation (4) reflects this by modeling dual-information systems: RNA provides early catalytic activity, while DNA offers more stable, accurate replication and storage. The two bracketed terms weight RNA vs DNA information systems around the transition point τc(with steepness β), while decay/error δ, mutation pressure μ, and error correction ϵ control effective fidelity. I0scales nucleotide availability, and P(τ) applies thermodynamic and selection constraints, capturing the biological shift from unstable proto-life to robust genetic systems.
L(τ) = ∫0tC(X(τ))⋅A(τ)⋅ I0[e−(δRNA+μ(τ)(1−ϵRNA(τ)))τ / (1+eβ(τ− τc) ) + e−(δDNA+μ(τ)(1−ϵDNA(τ)))τ / (1+e−β(τ− τc))] ⋅ P(τ) dτ −d(t)L(t)
- 2.
- Evolutionary Model Stage 2: From Proto-life to Single-cellular Life
The Archean Eon (4.0–2.5 Ga) marks the transition from proto-life (protocells, replicating molecules) to true single-celled organisms such as bacteria and cyanobacteria.
Input: Archean conditions with protocells and replicators (Table 4).Output: Stable, self-sustaining cells with membranes, metabolism, genetic control, and reproduction.
This shift (~3.8–3.5 Ga) involved compartmentalization (lipid membranes), metabolic networks, RNA/DNA control, homeostasis, and higher-fidelity replication. We define the function of cellular formation as:
where the integrand captures biological and environmental drivers (replication fidelity, membranes, energy, selective pressures).
M(τ) = ∫0t[L(τ)⋅R(τ)⋅S(τ)⋅ P(τ) dτ −d(t)M(t)
Table 6.
Meaning of Symbols in Cellular Life MormationM(τ).
| Symbol | Meaning |
| M(τ) | Membrane integrity factor — cumulative probability of true single-celled organisms Emergence of lipid-like membrane-bound, single-celled life (bacteria, cyanobacteria) |
| L(τ) | Life potential from earlier model-- assumed as input (amount of replicating proto-life) Formation of proto-life particles (e.g., self-replicating molecules) |
| R(τ) | Replication fidelity — higher fidelity enables stable genome maintenance |
| S(τ) | Selective pressure — advantage of stable cells under early Earth stress |
| ΔGm(τ) | Free energy for cellular organization (formation of cytoplasm, membranes, etc.) |
| T(τ) | Temperature over time |
| R | Gas constant |
When M(t)≥Mc, cellular complexity crosses the threshold for sustained life. Fossil and geochemical evidence (~3.8–3.5 Ga) supports that once proto-life density, temperature stability, membrane formation and mutation rates aligned, single-celled prokaryotes emerged. Thus, Mcrepresents the minimum integrated conditions needed for stable cells, roughly reached by 3.5–2.0 Ga.
The equation (5) models the cumulative likelihood over time that proto-life (early replicating molecules or protocells) will evolve into fully cellular organisms—specifically, bacteria-like life with membranes, metabolism, and genetic continuity, and helps us understand why life didn't just stop at simple molecules, but instead evolved into organized, cellular life — like bacteria and cyanobacteria — within the Archean Eon. It also incorporates key scientific ideas: RNA world → information and catalysis; lipid world → compartmentalization; selective environments → hydrothermal vents, UV radiation, etc.; thermodynamics → energy costs of organizing complexity. Each part of the integrand (what's inside the integral) represents a key biological or environmental factor that enables that transition.
Life did not emerge at once but in stages. We divide the model into Stage 1: chemical life formation L(t) and Stage 2: cellular life formation M(t) to capture this stepwise process.
- Stage 1: Prebiotic chemistry produced proto-life — organic molecules (amino acids, nucleotides), self-replicating RNA, autocatalytic networks, and protocells lacking stable membranes.
- Stage 2: Transition to true cells with lipid membranes, internal metabolism, and higher replication fidelity. Cell division and clustering under harsh conditions led to early multicellularity, initiating Stage 3: differentiation.
The Archean Eon (4.0–2.5 Ga) provided the setting: hot oceans, anoxic atmosphere (CO₂, H₂, N₂, CH₄, NH₃, H₂S), no ozone (intense UV), and abundant metals/sulfides. These conditions supported membrane formation, abiotic RNA/peptides, and energy-harvesting cycles — enabling replicators to evolve into stable, membrane-bound cells.
Thus, the Archean is modeled by L(t) and M(t) as the key eon for life’s origin.
The Archean Eon (about 4.0 to 2.5 billion years ago) is one of the most critical windows in Earth's history — it's when life first emerged and began to evolve. As showing in Table 4, it was hot but cooling; most of Earth's surface was ocean (anoxic, dominated by CO₂, H₂, N₂, and possibly CH₄, NH₃ and H₂S; no ozone layer (intense UV radiation at the surface); rich in dissolved metals like Fe²⁺; sulfur compounds (e.g., sulfides) and extraterrestrial delivery (e.g., meteorites). These conditions favored the formation of lipid-like molecules (early membranes), abiotic RNA or peptide, and autocatalytic cycles (e.g., formose reaction, iron-sulfur metabolism). So, it promotes complex organic chemistry and allows formation of energy-harvesting gradients; Encourage the evolution of membrane-bound replicating molecules, which is ideal for forming life’s building blocks without oxygen. That’s why the Archean is the key eon for the emergence of life — and why we modeled it with the functions L(t) and M(t).
- 3
- Evolutionary Model Stage 3: From the Single-cellular Life to Multicellular Life
The Proterozoic Eon (2.5–0.54 Ga) saw the rise of multicellularity, with first evidence between ~2.1–1.6 Ga (e.g., Grypania). This required genetic and metabolic complexity, stable cell adhesion, cooperation, division of labor, and environmental triggers such as oxygenation, nutrients, and predation.
Output: U(t) — multicellular organisms with adhesion, cooperation, and differentiation (~2.1–0.6 Ga).
We define multicellularity as:
U(τ) = ∫0t[M(τ)⋅Φ(τ)⋅Λ(τ)⋅Ξ(τ)⋅e−ΔGu(τ)/RT(τ)]dτ −d(t)U(t)
where terms represent biological cooperation, intercellular communication, and environmental energy balance.
When U(t)≥Uc, multicellular life emerges and persists (Han & Runnegar 1992, Butterfield 2000, Bamforth & Narbonne 2009, EI Albani et al. 2010, Strother et al. 2011, Yuan et al. 2011) . Fossil, geochemical, and biomarker records (~1.6–1.0 Ga) confirm this threshold—showing repeated independent origins of colonies, tissues, and coordinated growth, alongside redox evidence for rising O₂ to fuel complex metabolism (Canfield et al. 2007, Love et al. 2009). Thus, these studies provide converging fossil morphology, biomolecular, and environmental proxies supporting the model’s prediction that multicellularity arose once energy and genetic systems enabled stable cooperation, diversifying into algae, proto-animals and the enigmatic Ediacaran macrobiota
Table 7.
Meaning of Symbols in Cellular Life Formation U(τ).
| Symbol | Name | Meaning | Why it matters |
| U(τ) | Multicellular Life Potential | Total probability that multicellular life has emerged by time t | Output of this model |
| M(τ) | Morphological Cell Potential | Availability of viable single-celled organisms (from previous layer) | Multicellular life can’t form without cells |
| Φ(τ) | Adhesion and Signaling Factor | Measures whether cells can stick together and communicate (e.g. proteins for binding, signaling molecules) | Essential for tissue formation and coordination |
| Λ(τ) | Metabolic Complementarity | Benefit from dividing metabolic roles among cells (e.g., some cells digest, others reproduce) | Drives cooperation and specialization |
| Ξ(τ) | Selective Pressure for Multicellularity | Evolutionary advantage of being multicellular (e.g., size for protection, division of labor) | Gives natural selection reason to favor multicellularity |
| e−ΔGu(τ)/RT(τ) | Energetic Feasibility | Thermodynamic likelihood of supporting multicellular structures | High energy costs make it harder to stay multicellularity |
4.1 Feedback Regulation in Stage-Based Evolutionary Progression
Evolution advances in stages of rising complexity, regulated by feedback. Based on it, we model cybernetic control as:
 where C(t) is structural control, r(t) is regulatory responsiveness, and ωc, ωr are their weights.
- L(t): cumulative structural/functional complexity.
- Λ(t): real-time adaptive control.
Together, L(t) and Λ(t) describe self-regulated, logistic evolutionary growth, constrained by energy and information limits, with decay (−d(t)L(t)) representing entropy and loss.
Stage 1— Origin of Life (Abiotic → Protocells)

Life-like complexity L(t) grows from interactions of molecular information(I(τ)), environment(A(τ)), and control signals (Λ(τ)), weighted by survival probability P(τ). This models the gradual accumulation of life-like complexity from abiotic precursors, shaped by catalytic efficiency, molecular availability, and thermodynamic favorability
A molecular form includes RNA/DNA stability:

showing DNA’s stability accelerates complexity.
This blends RNA-based andDNA-based information storage, showing how the transition to more stable DNA systems accelerates growth in L(t).
Stage 2 — Origin of Unicellular Life
SL(t+Δt)=SL(t)+g(t)∫tt+Δtauni⋅ Λ(τ)⋅C(X(τ))⋅Adev(τ)⋅P(τ)dτ−d(t)⋅SL(t)
Here, SL(t) (selected complexity) grows once chemical systems (L≥Lc) cross the threshold into cells (M≥Mc) with replication, membranes, and self-organization.
Stage 3 — Origin of Multicellularity
SL(t+Δt)=SL(t)+g(t)∫tt+Δt amulti⋅ Λ(τ)⋅C(X(τ))⋅Adev(τ)⋅P(τ)dτ−d(t)⋅SL(t)
Multicellularity arises when cells cooperate via adhesion, signaling, differentiation, and coordinated growth and development due to factors of genetic regulation (gene networks), environmental pressures (oxygenation, nutrients), thermodynamic feasibility (energy to build complexity) and cybernetic feedback (intercellular communication and organization). Meanwhile, energy cost (e−ΔG/RT) and Reduction or recalibration of possibility space (EL(τ)−SL(τ)) constrain adaptation, reflecting both rising complexity (cell differentiation) and shrinking adaptability.
4.2 Dynamic Feedback and the Complexity–Adaptability Trade-off
Organisms adapt through feedback loops of regulation, genetic adjustment, and development. Each feedback cycle reduces future adaptability, turning contingency into necessity (Fig. 1).
To capture this, adaptability is modeled as
Adev(t) = Aopt(t)⋅[1−h(Cdiff(t))]
where Cdiff(t) is tissue/organ differentiation, h(⋅) is a penalty for specialization, and the Λ(τ) role got folded into the optimization/energetic weighting.
The updated equation is:
SL(t+Δt)=SL(t)+g(t)∫tt+Δtamulti C(X(τ)) Aopt(τ)[1−h(Cdiff(τ))] e−ΔG(t)/RT(t) ⋅R(SL(t),EL(t))dt−d(t) SL(t)
Interpretation:
- 1)
- SL(t) grows when environmental demand (EL−SL) drives adaptation, constrained by energy (ΔG) and complexity(Cdiff).
- 2)
- 2) Specialization (Cdiff) increases efficiency but reduces adaptability via h(·).
- 3)
- Decay term −d(t)SL(t) reflects entropy and irreversibility.
This equation shows that the rise of multicellularity is driven by inherent advantages (amulti), environmental conditions, optimized cooperation among cells, energetic feasibility, and feedback between system and environment, while being limited by cell conflict, decay, and resource constraints. As the organism becomes more complex and specialized (more differentiated), its ability to adapt decreases due to limitations on entropy, structure or energy.
4.3 Stability Threshold for Multicellularity
From Eq. (11):
θ(t) = ΔSmulti(t) = g(t) ∫tt+ΔtamultiC(X(t))⋅Adev(t)⋅P(t)dt −d(t) SL(t)
If θ<0.05, decay dominates and proto-multicellular systems collapse; if θ 0.05, cooperative complexity stabilizes multicellularity. This threshold is analogous to percolation or epidemiological R0 limits and aligns with the Mesoproterozoic “boring billion” (~1.6–1.0 Ga) as a pivotal era for stable multicellular evolution (Han & Runnegar 1992; Butterfield 2000; Anbar & Knoll 2002; King et al. 2008; de Mendoza et al. 2013; Lyons et al. 2014; Planavsky et al. 2014; Bengtson et al. 2017; Javaux & Lepot 2017; Gibson et al. 2018).
4.4 Entropy and Dissipative Structure in Organisms
Organisms are inherently dissipative structures: they maintain order through cellular differentiation and depend on irreversible thermodynamic processes to sustain functional and structural complexity. This is achieved by importing negative entropy from the environment via metabolism. The complex behaviors of such systems suggest that they tend to evolve toward states of higher entropy production over time.
We define Θ(τ) as a new multiplicative dissipative–thermodynamic coupling factor that encodes entropy production, free-energy throughput, and the system’s tendency to form and maintain dissipative structures.
SL(t+Δt)=SL(t)+g(t)∫tt+Δtamulti C(X(τ)) Aopt(τ)[1−h(Cdiff(τ))] e−ΔG(t)/RT(t) ⋅R(SL(t),EL(t)) Θ(τ)dt−d(t) SL(t)
Or equivalently,
dSL/dt=g(t)amultiC(X(t))Aopt(t)[1−h(Cdiff(t))]e−ΔG(t)/[RT(t)]R(SL,EL)Θ(t)−d(t)SL(t).
Definitions:
- Φ(τ) = available free-energy throughput (power input) to the subsystem (Js −1 or similar),
- φ(τ) = local entropy-production rate (e.g. J K−1 s−1),
- κ = coupling constant (dimensionless) controlling how strongly dissipative structuring amplifies growth,
- Ψ(Φ,σ) = structural amplification function (dimensionless), and
- Sds(σ) = a sigmoid gating function (0..1) that turns on dissipative-structure enhancement only when entropy production crosses a window appropriate for self-organization
5. The Formation of Autotrophic Plants: Flagellates to Dinoflagellates under Cybernetic Evolution
Autotrophic dinoflagellates likely arose when ancestral flagellates acquired chloroplasts through multiple endosymbiotic events. Early marine bacteria exploited geothermal energy to assimilate nitrogen and generate metabolic energy. With the acquisition of chlorophyll, they became capable of photosynthesizing carbohydrates, evolving into algae such as the blue-green algae (Cyunophyceae).
Our stage-based model (Eq. 11) captures Stage 3 dynamics — cooperative, feedback-driven complexity — and extends it to Stage 4 with the equation:
Lcyb(t+Δt)=Lcyb(t)+g(t)∫tt+ΔtΛ(τ)⋅C(X(τ))⋅Asym(τ)⋅P(τ)⋅Φint(τ)dτ−d(t)⋅Lcyb(t) (15)
Here, Asym(t) represents cellular asymmetry (e.g., anterior-posterior polarity, nuclear dimorphism), and Φint(t) measures internal integration and cooperation (e.g., plastid retention, nuclear-cytoskeletal coupling).
- 1)
- Low asymmetry/integration → flat Lcyb(t), representing stagnant evolution;
- 2)
- Strong cybernetic control with rising integration → accelerated growth in Lcyb, crossing thresholds (e.g., Lcyb>2.0) for the emergence of dinoflagellate-grade complexity, consistent with fossil and geobiological records.
- 3)
- 3) Environmental noise → delayed or destabilized transitions.
Inflection points in Lcyb align with evolutionary traits such as nuclear dualism, stable plastid retention and permanent flagellar reconfiguration. The model (15) suggests dinoflagellates originated in the late Neoproterozoic–early Paleozoic (~650 Ma), predating the Triassic fossil cyst record (~240 Ma), with acritarchs as possible relatives. This inference is consistent with multiple geobiological, molecular, and paleontological studies of plastid acquisition and multiple endosymbioses in dinoflagellates (Butterfield 2000; Keeling 2004; Riding et al. 2010; Fensome et al. 2016; Gibson et al. 2018; Riding and Head 2018; Lin 2024).
This framework shows how macro-level complexity emerges from coding, feedback and integration, allowing traits to self-generate (e.g. Λ(τ)=r(t), Φint(τ) =p(t)), rather than being externally imposed parameters. It captures both gradual evolutionary transitions (flagellate → dinoflagellate) and fast regulatory dynamics (coding, regulation, cooperation), regulated by the feedback loops. Higher-level feedback can modify Asym(τ) or enhance C(X(τ)) via metabolic payoffs, showing how evolutionary pressures reshape internal dynamics and, in turn, structural evolution.
When incorporating entropy and dissipative structure, we extend the model with entropy–dissipative constraints:
This equation indicates that the evolutionary transition from flagellates to dinoflagellates was driven by environmental energy flow, resource conditions, structural asymmetry, population-level processes, and internal integration, while limited by natural decay. Cybernetic feedback (self-regulation) ensures that these forces are coordinated over time. The model captures growth driven by the product of coupling terms and internal flux Φint, but does not yet incorporate constraints from entropy production and dissipative-structure modulation—factors central to cybernetic evolution.
Lcyb(t+Δt)=Lcyb(t)+g(t)∫tt+ΔtΛ(τ)C(X(τ))Asym(τ)P(τ)Φint(τ)×Ξ(Φint(τ),σ(τ),T(τ))dτ−deff(t)Lcyb(t)
or equivalently,
dLcyb/dt=g(t)Λ(t)C(X(t))Asym(t)P(t)Φint(t)Ξ(Φint(t),σ(t),T(t))−deff(t)Lcyb(t).
with Ξ(Φ,σ,T)=(1+κ[Φ/(Φ+Φ0)] exp(−[ΔSbuild(Φ,σ)]/kB) W(σ)
- σ(τ): local entropy-production rate (e.g., J K−1 s−1 or nondimensionalized).
- Ξ(Φint,σ,T): dissipative-structure coupling factor (dimensionless), modulating growth by thermodynamic favorability of maintaining low-entropy organization.
- deff(t): effective decay/loss rate, potentially dependent on entropy-production and energy availability (so disorder can increase loss).
- ι(τ): external driver (raw input --environmental throughput of energy, matter, or information: ι = 0 → no growth, ι is large → potential for growth).
Under the bioevo-cybernetics framework, this formulation explicitly captures how internal regulatory states, environmental drivers, and mortality/turnover interact to shape lineage-level complexity. The dynamics naturally exhibit hysteresis, bistability, triggered transitions, and relaxation oscillations—phenomena consistent with major evolutionary transitions.
The growth of complexity depends on energy flow, environmental conditions, structural asymmetry, population dynamics, and internal integration, but it is sustainable only if entropy dissipation (Ξ) maintains order. Otherwise, effective decay erodes cybernetic organization.
Bioevo-cybernetics emphasizes adaptive regulation through feedback loops, sensing, and environment-responsive processes. The factor Ξ(Φint,σ,T) allows internal readiness (Φint) to interact with environmental conditions (σ, T), producing threshold-dependent transitions. This helps explain how contingent environmental stresses (e.g., nutrient pulses, temperature shifts) enabled events like plastid endosymbiosis and flagellar innovation.
Because Ξ introduces conditional activation, the model accounts for why complex traits sometimes arise transiently in the fossil record: traits stabilize only when environmental and internal conditions remain supportive.
A detailed experimental validation strategy based on this framework will be presented in a subsequent manuscript.
Concluson
Control and communication in living systems are fundamentally mediated by feedback loops, where outputs modify subsequent inputs, enabling continuous adjustment and regulation. The principles of bioevo-cybernetics illuminate how variation and selection, when embedded within feedback control architectures, generate and sustain increasing levels of organization and complexity. Crucially, these dynamics operate under entropy–dissipative constraints: organisms must continuously export entropy to maintain order, with feedback regulation ensuring that metabolic throughput and structural organization remain thermodynamically viable.
Environmental stimuli act as initiating signals, triggering adaptive responses that not only enhance organismal fitness but also channel energy and matter into dissipative pathways capable of sustaining low-entropy structure. The effectiveness of such responses depends on whether internal regulatory states can couple with external energy flows to form stable dissipative structures; otherwise, disorder and decay dominate.
Through the dynamic interplay of variation, selection, feedback, and entropy dissipation, evolution emerges as an active, self-regulating process rather than a purely passive outcome of environmental filtering. Developmental transitions—from single-cell states to differentiated multicellular organisms—are likewise governed by hierarchical feedback mechanisms that coordinate cell differentiation, tissue integration, and functional specialization, but their success depends on maintaining thermodynamic feasibility. While genetic mutations arise stochastically, the overarching evolutionary process is shaped by regulatory networks that both sense environmental pressures and enforce entropy-balancing constraints.
From the Bioevo-Cybernetic perspective, life emerges not as a passive outcome of natural selection, but as an active, self-organizing system navigating between order and disorder; evolution is reframed as a transformation from contingency to necessity: adaptive control progressively channels random variation into directed pathways of complexity, but only those pathways that respect entropy–dissipative constraints are stabilized and propagated across generations.
Conflicts of Interest
The author has not declared any conflict of interests.
Author contributions statement
Zuchang Pei is the sole author who involved in the conception and design, analysis and interpretation of the data; the drafting of the paper, revising it critically for intellectual content; and the final approval of the version to be published; and agree to be accountable for all aspects of the work.
Declaration of funding
No funding was received.
References
- Abigail C, Allwood MR, Walter BS, Kamber CP, Marshall, Burch IW (2006). Stromatolite reef from the Early Archaean era of Australia. Nature 441: 714–717.
- Abramov O, Mojzsis SJ (2009). Microbial habitability of the Hadean Earth during the late heavy bombardment. Nature 459 (7245):419-422. https://doi.org/10.1038/nature08015.
- Allwood AC, GrotzingerJP, Knoll AH, Burch IW, Anderson MS, Coleman ML, I (2009). Controls on development and diversity of Early Archean stromatolites. PNAS 106(24): 9548–9555.
- Anbar AD, Knoll AH (2002). Proterozoic ocean chemistry and evolution: A bioinorganic bridge? Science 297(5584), 1137–1142. [CrossRef]
- Badcock PB, Friston KJ, Ramstead MJD (2022). Applying the Free Energy Principle to Complex Adaptive Systems. Entropy 24(5):689. [CrossRef]
- Bamforth EL, Narbonne GM (2009) New Ediacaran rangeomorphs from Mistaken Point, Newfoundland, Canada. Journal of Paleontology 83 (6):897-913. [CrossRef]
- Becker S, Feldmann J, Wiedemann S, Okamura H, Schneider C, Iwan K, Crisp A, Rossa M, Amatov T, Carell T(2019). Unified prebiotically plausible synthesis of pyrimidine and purine RNA ribonucleotides. Science 366(6461):76–82. [CrossRef]
- Bell EA, Boehnke P, Harrison TM, Mao WL (2015). Potentially biogenic carbon preserved in a 4.1 billion-year-old zircon. PNAS 112 (47): 14518–14521. [CrossRef]
- Bengtson S, Sallstedt T, Belivanova, V, Whitehouse M (2017). Three-dimensional preservation of cellular and subcellular structures suggests 1.6 billion-year-old crown-group red algae. PLoS Biology 15(3): e2000735. [CrossRef]
- Bontognali TRR, Sessions AL, Allwood AC, Fischer WW, Grotzinger JP, Summons RE, Eiler JM (2012). Sulfur isotopes of organic matter preserved in 3.45-billion-year-old stromatolites reveal microbial metabolism. PNAS 109(38): 15146–15151. [CrossRef]
- Brooks DR, Wiley EO (1986). Evolution as Entropy: Toward a Unified Theory of Biology. University of Chicago Press.
- Butterfield NJ (2000) Bangiomorpha pubescens n. gen., n.sp.: implications for the evolution of sex, multicellularity and the Mesoproterozoic–Neoproterozoic radiation of eukaryotes. Paleobiology 26 (3): 386–404.
- Canfield DE, Poulton SW, Narbonne GM (2007). Late-Neoproterozoic deep-ocean oxygenation and the rise of animal life. Science 315 (5808):92-95. [CrossRef]
- Capra F (2014). The Systems View of Life: A Unifying Vision (co-authored with Pier Luigi Luisi) Cambridge University Press.
- Crowe SA, Døssing LN, Beukes NJ, Bau M, Kruger SJ (2013). Atmospheric oxygenation three billion years ago. Nature 501(7468): 535-538. [CrossRef]
- de Mendoza A, Sebé-Pedrós A, Šestak MS, Matejčić M, Torruella G, Domazet-Lošo, T, Ruiz-Trillo I (2013). Transcription factor evolution in eukaryotes and the assembly of the regulatory toolkit in multicellular lineages. PNAS 110(50):e4858–4866. [CrossRef]
- Deacon TW (2011). Incomplete nature: how mind emerged from matter. W.W. Norton.
- Despons A (2025). Nonequilibrium properties of autocatalytic networks.Physical Review E 111: 014414. [CrossRef]
- El Albani A, Stefan Bengtson S, Meunier A (2010). Large colonial organisms with coordinated growth in oxygenated environments 2.1 Gyr ago. Nature 466(7302): 100-104. [CrossRef]
- Eigen M, Schuster P (1977). The hypercycle: A principle of natural self-organization. Part A: Emergence of the hypercycle. Die Naturwissenschaften 64(11): 541–565.
- Eigen M, Schuster P (1979). The Hypercycle: A Principle of Natural Self-Organization. Springer-Verlag. (Book; Springer).
- Farquhar J, Bao H, Thiemens MH (2000). Atmospheric influence of Earth’s earliest sulfur cycle. Science 289(5480): 756-758. [CrossRef]
- Hayashi K, Naraoka H, Ohmoto H (2008). Oxygen isotope study of Paleoproterozoic banded iron formation, Hamersley Basin, Western Australia. Resource Geology 58 (1): 43-51. [CrossRef]
- Fensome RA, MacRae RA, Moldowan JM, Taylor FJR, Williams GL (2016).The early Mesozoic radiation of dinoflagellates. Paleobiology 22(3):329–338. [CrossRef]
- Ferris JP (1984). The chemistry of life's origin. Chem Eng News 62:22-35.
- Fields C (2024). The free energy principle induces intracellular compartmentalization. Biochemical and biophysical research communicatios 723:150070. [CrossRef]
- Fisher, R. A. (1930). The Genetical Theory of Natural Selection. Clarendon Press (Oxford).
- Gibson TM, Shih PM, Cumming VM, Fischer WW, Crockford PW, Hodgskiss MSW, … Rainbird RH (2018). Precise age of Bangiomorpha pubescens dates the origin of eukaryotic photosynthesis. Geology 46(2):135–138. [CrossRef]
- Gilbert W (1986). Origin of life: The RNA world. Nature, 319: 618. [CrossRef]
- Gözen I (2022). Protocells: Milestones and Recent Advances. Small 18(16): e2106624 Hagan MF, Baskaran A (2016). Emergent Self-organization in Active Materials. Current Opinion in Cell Biology 38:74–80. [CrossRef]
- Han TM, Runnegar B (1992). Megascopic eukaryotic algae from the 2.1 billion-year-old Negaunee Iron-Formation, Michigan. Science 257 (5067):232-235.
- Hansma HG (2010). Possible origin of life between mica sheets. Journal of Theoretical Biology 266(1): 175–188. [CrossRef]
- Hansma HG (2014). The power of crowding for the origins of Life. Origins of Life and Evolution of Biospheres 44: 307–311. [CrossRef]
- Hansma HG (2017). Better than Membranes at the Origin of Life? Life 7(2): 28. [CrossRef]
- Hayashi K, Naraoka H, Ohmoto H (2008). Oxygen isotope study of Paleoproterozoic banded iron formation, Hamersley Basin, Western Australia. Resource Geology 58 (1):43-51. [CrossRef]
- Heylighen F, Joslyn C (2001). Cybernetics and Second-Order Cybernetics In: Encyclopedia of Physical Science and Technology (3rd ed.), Vol. 4: 155–170. Academic Press.
- Hodgskiss MSW, Crockford PW, Turchyn AV (2023). Deconstructing the lomagundi–jatuli carbon isotope excursion. Annual Review of Earth and Planetary Sciences 51:301-330. [CrossRef]
- Hordijk W (2013). Autocatalytic sets: from the origin of life to the economy. BioScience 63(11):877-881.
- Huson D, Xavier JC, Steel M (2024). Self-generating autocatalytic networks: structural results, algorithms and their relevance to early biochemistry. Journal of the Royal Society Interface 21(214):20230732. [CrossRef]
- Huson DH., Xavier JC, Steel MA (2024). CatReNet: interactive analysis of (auto-)catalytic reaction networks. Bioinformatics 40(8), btae515. [CrossRef]
- Javaux EJ, Lepot K (2017). The Paleoproterozoic fossil record: Implications for the evolution of the biosphere during Earth’s middle-age. Earth-Science Reviews 176:68–86. [CrossRef]
- Jenewein C, Maíz-Sicilia A, Rull F, González-Souto L, García-Ruiz JM (2024). Concomitant formation of protocells and prebiotic compounds under a plausible early Earth atmosphere. PNAS 122(2): e2413816122. [CrossRef]
- Jia TZ, Chandru K, Hongo Y, Afrin R, Usui T, Myojo K, Cleaves II HJ (2019). Membraneless polyester microdroplets as primordial compartments at the origins of life. PNAS 116(32): 15830–15835.
- Joyce GF (1989). RNA evolution and the origins of life. Nature 338(6212):217–224. [CrossRef]
- Kalambokidis M, Travisano M (2024). The eco-evolutionary origins of life. Evolution 78(1):1-12. [CrossRef]
- Kauffman, S. A. (1993). The Origins of Order: Self-Organization and Selection in Evolution. Oxford University Press.
- Kicsiny R, Bódai A, Székely L, Varga Z (2025). Extended discrete-time population model to describe the competition of nutrient-producing protocells. Bulletin of Mathematical Biology 87(8):111. [CrossRef]
- Krishnamurthy R, Hud N (2020) Introduction: Chemical Evolution and the Origins of Life. Chem Rev.120(11):4613-4615. [CrossRef]
- Kauffman SA (1993). The Origins of Order: Self-Organization and Selection in Evolution Oxford University Press.
- Keeling PJ (2004). Diversity and evolutionary history of plastids and their hosts. American Journal of Botany 91(10), 1481–1493. [CrossRef]
- Eugene V. Koonin (2007). An RNA-making reactor for the origin of life. Proceedings of the National Academy of Sciences USA, 104(22):9101–9106. [CrossRef]
- King N, Westbrook MJ, Rokhsar D(2008). The genome of the choanoflagellate Monosiga brevicollis and the origin of metazoans. Nature 451(7180):783–788. [CrossRef]
- Lane N, Martin W (2010). The energetics of genome complexity. Nature, 467(7318):929–934.
- Lin S (2024). A decade of dinoflagellate genomics illuminating an enigmatic eukaryote cell. BMC Genomics 25:932. [CrossRef]
- Lincoln TA, Joyce GF (2009). Self-Sustained Replication of an RNA Enzyme. Science 323(5918):1229–1232. [CrossRef]
- Love GD, Grosjean E, Stalvies C, Fike DA, Grotzinger JP, Bradley, Kelly AE, Bhatia M,, Meredith W, Snape CE, Bowring SA, Condon DJ, Summons RE (2009). Fossil steroids record the appearance of Demospongiae during the Cryogenian period. Nature 457(7230):718-721.
- Lyons TW, Reinhard CT, Planavsky NJ (2014). The rise of oxygen in Earth’s early ocean and atmosphere. Nature 506(7488):307–315. [CrossRef]
- Lyons TW, Diamond CW, Planavsky NJ, Reinhard CT, Li C (2021) Oxygenation, Life, and the Planetary System during Earth’s Middle History: An Overview. Astrobiology 21(8): 906–923. [CrossRef]
- Mänd K, Robbins LJ, Planavsky NJ, Bekker A, Konhauser KO (2021). Iron Formations as Palaeoenvironmental Archives, part of Elements in Geochemical Tracers in Earth System Science. Cambridge University Press Element, pp. 1-94.
- Mann S (2012). Review: Systems of Creation: The Emergence of Life from Nonliving Matter. Accounts of Chemical Research 45(12):2131-2141. [CrossRef]
- Martin W, Russell MJ (2007). On the origin of biochemistry at an alkaline hydrothermal vent. Philosophical Transactions of the Royal Society B: Biological Sciences 362(1486):1887–1925. [CrossRef]
- Maturana HR, Varela FJ (1980). Autopoiesis and Cognition: The Realization of the Living. D. Reidel Publishing Company.
- Maynard Smith J, Szathmáry E (1995). The Major Transitions in Evolution. Oxford University Press.
- Miller JG (1978). Living Systems. McGraw-Hill. pp. 1102.
- Mojzsis SJ, Arrhenius G, McKeegan KD, Harrison TM, Nutman AP, Friend CRL (1996). Evidence for life on Earth before 3,800 million years ago. Nature 384 (6604):55–59.
- Mojzsis SJ, Harrison TM, Pidgeon RT (2001). Oxygen-isotope evidence from ancient zircons for liquid water at the Earth's surface 4,300 Myr ago. Nature 409 (6817):178-181. [CrossRef]
- Moldavanov A (2021). Abiogenesis-Biogenesis Transition in Evolutionary Cybernetic System. Cybernetics and systems 53(2):1-8. [CrossRef]
- Nutman AP, Bennett VC, Friend CRL, Kranendonk MJV, Chivas AR (2016). Rapid emergence of life shown by discovery of 3,700-million-year-old microbial structures. Nature 537(7621):535–538. [CrossRef]
- Ohtomo Y, Kakegawa T, Ishida A, Nagase T, Rosing MT (2014). Evidence for biogenic graphite in early Archaean Isua metasedimentary rocks. Nature Geoscience 7(1):25–28. [CrossRef]
- Pei ZC (2025). Biological evolution cybernetics. Journal of evolutionary biology research 9(1):12-31.
- Planavsky NJ, Asael D, Hofmann A, Reinhard CT, Lalonde SV, Knudsen A, Wang XL, Ossa FO, Pecoits E, Smith AJB, Beukes NJ, Bekker A, Johnson TM, Konhauser KO, Lyons TW, Rouxel OJ (2014). Evidence for oxygenic photosynthesis half a billion years before the Great Oxidation Event. Nature Geoscience 7 (4): 283-286. [CrossRef]
- Planavsky NJ, Reinhard CT, Wang XL,Thomson D, McGoldrick P, Rainbird RH, Thomas Johnson T, Fischer WW, Lyons TW (2014). Low Mid-Proterozoic atmospheric oxygen levels and the delayed rise of animals. Nature 506:307-315. [CrossRef]
- Pleasant LG, Ponnamperuma C (1984). Chemical evolution and the origin of life: bibliography supplement. Orig Life Evol Biosph 15:55-69.
- Pressman A, Blanco C, Chen IA (2015). The RNA World as a Model System to Study the Origin of Life. Current Biology 25(19): R953–R963. [CrossRef]
- Ramstead MJD, Badcock PB, Friston KJ (2018). Answering Schrödinger’s question: A free-energy formulation. Physics of Life Reviews 24: 1–16.
- Ramstead MJD, Constant A, Badcock PB, Friston KJ (2019). Variational ecology and the physics of sentient systems. Physics of Life Reviews 31: 188–205. [CrossRef]
- Ricardo A, Carrigan MA, Olcott AN, Benner SA (2004). Borate minerals stabilize ribose. Science 303(5655):196. [CrossRef]
- Riding JB, Mantle DJ, Backhouse J (2010). A review of the chronostratigraphical ages of Middle Triassic to Late Jurassic dinoflagellate cyst biozones of the North West Shelf of Australia. Review of Palaeobotany and Palynology 162:543–575. [CrossRef]
- Riding JB, Head MJ (2018). Preparing photographic plates of palynomorphs in the digital age. Palynology 42(3):354–365. [CrossRef]
- Rimmer PB, Shorttle O (2019). Origin of life's building blocks in Carbon and Nitrogen rich surface hydrothermal vents. Life 9(1): 12. https://doi.org/10.3390/life9010012.
- Robbins LJ, Funk SP, Flynn SL, Warchola TJ, Li ZQ, Lalonde SV, Rostron BJ, Smith AJB, Beukes NJ, de Kock MO, Heaman LM, Alessi DS, Konhauser KO (2019). Hydrogeological constraints on the formation of Palaeoproterozoic banded iron formations. Nature Geoscience 12 (7):558-563. [CrossRef]
- Robertson MP, Joyce GF (2012). The Origins of the RNA World. Cold Spring Harbor Perspectives in Biology 4(5): a003608, pp. 1–23. [CrossRef]
- Rosing MT (1999). 13C-depleted carbon microparticles in >3700-Ma sea-floor sedimentary rocks from West Greenland. Science 283 (5402):674–676.
- Schopf JW (1993). Microfossils of the Early Archean Apex chert: new evidence of the antiquity of life. Science 260 (5108):640–646. [CrossRef]
- Sharma S, Mougoyannis P, Tarabella G, Adamatzky A (2022). A review on the protocols for the synthesis of proteinoids. [arXiv preprint]. [CrossRef]
- Sleep NH, Zahnle K, Neuhoff PS (2001). Initiation of clement surface conditions on the earliest Earth. PNAS 98 (7):3666-3672. [CrossRef]
- Strother PK, Battison L, Brasier MD, Wellman CH (2011). Earth’s earliest non-marine eukaryotes. Nature 473(7348):505-509.
- Szathmáry E (2015). Toward major evolutionary transitions theory 2.0. PNAS 112(33): 10104–10111. [CrossRef]
- Szostak JW, Bartel DP, Luisi PL (2001). Synthesizing life. Nature 409(6818):387–390. [CrossRef]
- Tang S, Gao M (2025). The Origin(s) of LUCA: Computer Simulation of a New Theory. Life 15(1). [CrossRef]
- Tashiro T, Ishida A, Hori M, Igisu M, Koike M, Méjean P, Takahata N, Sano Y, Komiya T (2017). Early trace of life from 3.95 Ga sedimentary rocks in Labrador, Canada. Nature 549(7673):516–518. [CrossRef]
- Tice MM, Lowe DR (2004).Photosynthetic microbial mats in the 3,416-Myr-old ocean. Nature 431 (7008): 549–552. [CrossRef]
- Valley JW, Peck WH, King EM, Wilde SA (2002). A cool early Earth. Geology 30 (4):351-354. [CrossRef]
- Vanchurin V, Wolf YI, Katsnelson MI, Koonin EV (2022). Toward a theory of evolution as multilevel learning. PNAS 119(6): e2120037119. Vanchurin V, Wolf YI, Koonin EV, Katsnelson MI (2022). Thermodynamics of evolution and the origin of life. PNAS 119(6), e2120042119. Vay KL, Mutschler H (2019). The difficult case of an RNA-only origin of life. Emerging Topics in Life Sciences 3(5):469–475. [CrossRef]
- Villani M, Alboresi E, Serra R (2024). Models of Protocells Undergoing Asymmetrical Division. Entropy 26(4):281. [CrossRef]
- Wacey D, Kilburn MR, Saunders M, Cliff J, Brasier M (2011). Microfossils of sulphur-metabolizing cells in 3.4-billion-year-old rocks of Western Australia. Nature Geoscience 4(10): 698–702. [CrossRef]
- Wiener N (1948). Cybernetics: or control and communication in the animal and the machine. MIT Press.
- Williamson MP (2024). Autocatalytic selection as a driver for the origin of life. Life 14(5):590. [CrossRef]
- Yuan XL,Chen Z, Xiao SH, Zhou C, Hua H (2011). An early Ediacaran assemblage of macroscopic and morphologically differentiated eukaryotes. Nature 470 (7334): 390-393. [CrossRef]
- Zimmermann J, Werner E, Sodei S, Moran J (2024). Pinpointing conditions for a metabolic origin of life: underlying mechanisms and the role of coenzymes.Accounts of Chemical Research 57(20), 3032–3043. [CrossRef]
- Zorc SA, Roy RN (2024). Origin & influence of autocatalytic reaction networks at the origin of life. RNA Biology 21(1):1023-1037.
- Zwicker D, Seyboldt R, Weber CA, Hyman AA, Jülicher F (2016). Growth and division of active droplets: a model for protocells. Physical Review Letters 116(9): e098102. [CrossRef]
Table 3.
Environmental Conditions and Geological Evidence before Life (Prebiotic Earth, ~4.4–4.0 Ga; Hadean to Early Archean, >4.0 Ga).
Table 3.
Environmental Conditions and Geological Evidence before Life (Prebiotic Earth, ~4.4–4.0 Ga; Hadean to Early Archean, >4.0 Ga).
| Feature | Value / Description | Geological Evidence |
| Ocean Temperature | ~90–120°C | |
| Ocean Oxygen | None | Zircon crystals (4.4 Ga): |
| pH | Acidic (~5 or lower) | Suggest liquid water was present soon after Earth’s formation. |
| Iron (Fe²⁺) | High | |
| Atmospheric CO₂ | Very high | |
| Atmosphere | Anoxic; mostly CO₂, N₂, H₂, H₂O vapor | Isotopic ratios in ancient rocks: Suggest early oceans were warm and reducing |
| Life | Absent | |
| Continents | None or proto-crus | No fossil evidence of life until ~3.5–3.8 Ga → supports that life hadn’t yet arisen when ocean was ~100°C. |
| Volcanic Activity | Intense | |
| Hydrothermal Systems | Active, possibly key for early chemistry |
Table 4.
Environmental Condition and Geological Evidence When the Formation of Particles with Life Characteristics (Photo-life: 4.0 to 2.5 billion years ago).
Table 4.
Environmental Condition and Geological Evidence When the Formation of Particles with Life Characteristics (Photo-life: 4.0 to 2.5 billion years ago).
| Parameter | Condition ca. 2 Ga | Geological Evidence |
| Oxygen (O₂) | Low, localized | Oxygen Rise (Great Oxidation Event, ~2.4–2.3 Ga): |
| Iron (Fe²⁺) | High | Banded Iron Formations (BIFs), Sulfur Isotopes (MIF-S) Disappear, Detrital Pyrite/Uraninite destroyed by O₂, Red Beds & Paleosols appeared. |
| Sulfate (SO₄²⁻) | Low | |
|
Methane (CH₄) |
High | |
| pH | ~6.5 (acidic) | Global Glaciations (Huronian & Makganyene, ~2.4–2.2 Ga): Glacial Deposits at Low Latitudes |
| Temperature | ~40–60°C | Early Life Expansion |
| Ocean Redox | Stratified: oxic surface, anoxic deep | Stromatolites: Common after ~2.7 Ga → microbial mats, including oxygenic phototrophs; Redox-stratified Oceans: Shallow O₂-rich zones, deeper anoxic waters |
| Banded Iron Formations | Still forming or waning | Crustal & Magmatic Activity: Large Igneous Provinces (~2.45 Ga): Supplied Fe²⁺ to oceans; drove massive BIF formation and nutrient cycling. |
| Nutrients | Low (especially nitrate, phosphate) | |
| Carbon Dioxide (CO₂) |
High levels of CO₂ in both atmosphere and ocean |
Carbon Cycle Shift (Lomagundi Event, ~2.3–2.1 Ga): High δ¹³C in Carbonates |
Table 5.
Environmental Condition and Geological Evidence When the Formation Single-cell Life (late Archean to early Proterozoic (~2.0 -1.6 Ga).
Table 5.
Environmental Condition and Geological Evidence When the Formation Single-cell Life (late Archean to early Proterozoic (~2.0 -1.6 Ga).
| Parameter |
Condition (~2.0 Ga) | Geological Evidence |
| Atmospheric Oxygen | Rising O₂ levels after the Great Oxidation Event (~2.4–2.0 Ga); not yet modern levels | Banded Iron Formations (BIFs) decrease; Red Beds appear; Sulfur isotope fractionation (Δ³³S) declines |
| Ocean Chemistry | Stratified oceans: surface oxygenated, deep anoxic and sulfidic (euxinic) | BIFs, Fe-rich shales, and S-rich black shales in sedimentary records |
| Temperature | Likely warm but gradually cooling; some periods of glaciation may have begun earlier (~2.3 Ga) | Glacial deposits (Huronian glaciation), isotopic data from carbonates |
| UV Radiation | High UV levels due to lack of an ozone layer (low atmospheric O₂); early life likely lived underwater or in microbial mats | Stromatolite structures in shallow water environments (UV protection by mats) |
| Nutrient Availability | Increasing availability of nutrients (Fe²⁺, P) in oceans; biological productivity rising slowly | Isotopic signatures (δ¹³C), presence of trace metals in sedimentary rocks |
| Sulfur Cycle | Active sulfur cycling, possibly with sulfate-reducing bacteria | Sulfur isotope records (including mass-independent fractionation) |
| Methane Levels | Declining atmospheric CH₄ due to increased O₂ and lower methanogen activity | Carbon isotope excursions; drop in greenhouse warming potential |
| Tectonic Activity | Continents forming/supercontinent cycles starting (e.g., Columbia/Nuna); influencing ocean basins and nutrient input |
Zircon dating, sedimentary basins, supercontinent reconstructions |
| Biological Innovation | Rise of oxygen-using prokaryotes and possibly early eukaryotes; microbial mats and biofilms prevalent | Fossil evidence: microfossils (e.g., Grypania spiralis), biomarkers (steranes), stromatolites |
| Redox State of Oceans | Development of redox-stratified oceans; oxic-anoxic interfaces crucial for early metabolism evolution | Iron speciation studies in shales; presence of euxinic indicators like molybdenum and uranium enrichment |
Disclaimer/Publisher’s Note: The statements, opinions and data contained in all publications are solely those of the individual author(s) and contributor(s) and not of MDPI and/or the editor(s). MDPI and/or the editor(s) disclaim responsibility for any injury to people or property resulting from any ideas, methods, instructions or products referred to in the content. |
© 2025 by the authors. Licensee MDPI, Basel, Switzerland. This article is an open access article distributed under the terms and conditions of the Creative Commons Attribution (CC BY) license (http://creativecommons.org/licenses/by/4.0/).
Copyright: This open access article is published under a Creative Commons CC BY 4.0 license, which permit the free download, distribution, and reuse, provided that the author and preprint are cited in any reuse.


