Submitted:
29 September 2025
Posted:
30 September 2025
You are already at the latest version
Abstract
Fuel efficiency is a key topic in the modern aviation industry, becoming more important because of rising fuel costs, environmental concerns, and international carbon reduction commitments. This study evaluates the operational fuel efficiency of Ethiopian Airlines’ long-haul fleet by analyzing aircraft performance across selected intercontinental routes. I quantify the amount of fuel burn, fuel cost and carbon dioxide emissions that can be saved by switching between three aircraft (B787-9, B777-200LR, and A350-900) on three different routes: Addis Ababa - London, Addis Ababa - São Paulo, and Addis Ababa - Bangkok. I also show the amount of CO2 emissions that can be saved by using blends of SAF.
Keywords:
fuel efficiency
; Ethiopian airlines
; long-haul flights
; sustainable aviation fuel
; lifecycle analysis
; aviation sustainability
I. Introduction
Aviation is one of the highest fuel-consuming industries, and it not only accounts for high operating costs (≈28.7%) for airlines but also for global greenhouse gas emissions (2.5%) [1,2]. With rising international fuel prices and increasing regulatory and environmental pressures, fuel efficiency has assumed central importance in airline competitiveness and sustainability. Long-haul flights, while comprising just 5% of all flights, contribute about 38% of CO2 emissions due to a high percentage of fuel burn, lengthy stage lengths, and widebody airplane use, and therefore are a primary focus of research into efficiency [3].
Although there has been a great deal of analysis and study of North American and European airline fuel efficiency, relatively few studies have addressed African airlines, despite their phenomenal growth. Mostly flying from and to the second most populous continent, they are a critical bridge connecting the developing world to the rest of the world. The reason I have chosen Ethiopian Airlines as the focalpoint of this research is because of its supreme status in the African airline industry; it has been the largest airline in Africa for years running and competes at a global scale. Other African airlines can learn much from Ethiopian Airlines, as it can be considered Africa’s representative airline. And though it is generally accepted that newer aircraft technologies are more fuel efficient, the extent of such benefits for specific operating conditions has not been empirically quantified for African airlines yet.
Although there has been a great deal of analysis and study of North American and European airline fuel efficiency, relatively few studies have addressed African airlines, despite their phenomenal growth. Mostly flying from and to the second most populous continent, they are a critical bridge connecting the developing world to the rest of the world. The reason I have chosen Ethiopian Airlines as the focalpoint of this research is because of its supreme status in the African airline industry; it has been the largest airline in Africa for years running and competes at a global scale. Other African airlines can learn much from Ethiopian Airlines, as it can be considered Africa’s representative airline. And though it is generally accepted that newer aircraft technologies are more fuel efficient, the extent of such benefits for specific operating conditions has not been empirically quantified for African airlines yet.
In addition, efficiency is not only a function of aircraft design but also of route decisions, passenger demand, as well as new alternatives such as sustainable aviation fuels, required to curtail CO2 emissions. These factors being known in an Ethiopian context, have significant implications for both cost and emissions saving for Ethiopian Airlines, Africa, and the world in general. The study discusses the fuel efficiency of Ethiopian Airlines' long-haul operations by comparing aircraft types on selected intercontinental routes, calculating fuel burn and passenger cost, and modeling potential savings from optimal fleet deployment and partial SAF introduction.
By quantifying these impacts, the research provides route-specific, actionable intelligence that can guide Ethiopian Airlines in optimizing its operations for both economic competitiveness and sustainability goals, and inform the broader literature on aviation efficiency in the developing world.
II. Methodology
A. Study Design and Overview
This study is a route-level benchmarking analysis for selected Ethiopian Airlines long-haul flights. I compiled a structured dataset from publicly available online sources (airline schedules, aircraft characteristics, and fuel price information) and calculated derived efficiency and cost metrics per route–aircraft observation. I then compared routes and aircraft types on a per-kilometer, per-passenger, and per-flight basis, and explored SAF blending scenarios using well-to-wake (WTW) lifecycle emission factors – instead of linear – scaling.
B. Data Collection and Fields
For each each observed flight/route on a specific date, I recorded or derived the following fields:
- Flight, Date Used, Route on Date, Aircraft (identifier, yyyy-mm-dd, origin–destination, aircraft type).
- Distance (km): great-circle distance between origin and destination.
- Range (km): nominal aircraft range from public specifications (used only as a feasibility check).
- Seats: standard two-class seating for the aircraft subtype.
- Fuel Burn (kg): Aircraft subtype published fuel usage in flight
- Fuel Cost (USD): Fuel Burn × assumed unit price (USD/kg), using a single price per analysis period.
- Est. Load Factor (LF): assumed percentage of seats sold for that leg.
- Est. PAX: Seats × LF.
- Fuel Burn (kg/km), Fuel Burn (kg/PAX), and Est. Cost (USD/PAX): computed as defined below.
All inputs were entered into a tabular dataset (Excel). When an input was missing (e.g., exact load factor), we applied conservative assumptions (see Section F).
C. Derived Metrics and Formulas
Per-kilometer fuel:FuelBurn / Distance [kg/km]
Estimated passengers:Seats * LoadFactor
- Fuel per passenger:FuelBurn / Est. PAX [kg/pax]
- Fuel cost per passenger:FuelCost / Est. PAX [USD/pax]
- Lifecycle CO2 (WTW) without SAF:FuelBurn * JetA EF [kg]
- Blended lifecycle emission factor:(1 - s) * JetA EF + s * SAF EF, where s is total fraction of SAF and 0 ≤ s ≤ 1 [kg]
- Lifecycle CO2 (WTW) with SAF blend:FuelBurn/kg * SAF Blend EF [kg]
- Percentage reduction vs baseline:100 * (WTW CO2 baseline - WTW CO2 blend) / WTW CO2 baseline [%]
D. Analysis Steps
Feasibility filter: excluded observations where stage length exceeded nominal range after reserves (fortunately, none for these flights).
Normalization: expressed all fuel and cost metrics on a per-km and per-passenger basis to compare dissimilar routes and aircraft.
Ranking and benchmarking:
Ranked aircraft on the same route by FB/PAX and Cost/PAX.
Ranked routes for the same aircraft by FB/km and FB/PAX to identify inefficient pairings.
Recommendations: identified “swap” opportunities (i.e., assigning the more efficient aircraft to the route with higher FB/PAX), subject to simple seat-count adequacy (PAX not exceeding seats) and range feasibility.
SAF scenarios: evaluated s ∈ {0.1,0.2,0.5} blends and reported route-level and study-level percentage CO₂ reductions using lifecycle emission factors. Results are presented both as absolute (kg CO₂e) and percentage changes relative to baseline Jet A operations.
E. Implementation
All calculations and analyses were performed using a spreadsheet software, allowing structured processing of route–aircraft data and scenario modeling. The implementation steps are as follows:
Data entry and cleaning
All raw flight, aircraft, and fuel data were entered into a structured spreadsheet, with one row per route–aircraft observation.
Missing values (e.g., load factors, fuel burn) were handled using conservative estimates as described in Section F.
Derived metrics calculation
Fuel efficiency (FB/km, FB/PAX), cost per passenger (Cost/PAX), and WTW lifecycle CO₂ for baseline and SAF blends were calculated using spreadsheet formulas based on Section C.
SAF blends of 10%, 20%, and 50% were modeled using mass-weighted emission factor calculations.
Ranking and benchmarking
Aircraft were ranked by per-kilometer fuel burn and cost for each route.
Routes were ranked per aircraft to identify inefficient pairings.
“Swap” opportunities were identified.
Scenario summaries and outputs
Route-level and study-level fuel burn, cost, and WTW CO₂ were tabulated for baseline and SAF scenarios.
Percent reduction in WTW CO₂ relative to baseline was calculated for each SAF blend.
All outputs were maintained in separate sheets within the master workbook for clarity and reproducibility.
F. Assumptions and Limitations
- Load factors: Since flight-specific data is not public, I had to assume an Ethiopian Airlines average of 73.4% for each flight [4].
- Fuel burn data: Per-flight fuel burn is not published, and so fuel burn values were sourced from manufacturer performance data and published aircraft characteristics (fuel burn references). These values were then matched to the observed stage lengths. While they represent standardized performance, they may not fully capture operational variations such as weather, payload, or ATC delays.
- Fuel price: a single average unit price was applied to compute Fuel Cost, from August 20, 2025; real operations face time-varying procurement prices. U.S. Gulf Coast kerosene/jet fuel spot prices were used since I couldn’t find an accurate East African fuel price provider.
- SAF lifecycle factors: published averages were applied per pathway; real-world values vary by feedstock, geography, and allocation assumptions. Results should be interpreted as indicative, not exact.
- Operational constraints: recommendations consider range and seat capacity but do not explicitly model crew, maintenance, curfews, ATC constraints, or connection banks.
G. Outputs
We report, for each route–aircraft observation and for proposed aircraft swaps:
- FB/PAX, FB/km, Cost/PAX, Cost/km (baseline).
- Lifecycle CO₂ under SAF blend s.
- Route-level percent changes versus baseline and the aggregate (study-level) change in fuel cost and CO₂.
Note: Aircraft performance values, including seating capacity, range, and fuel-burn assumptions, were obtained from Ethiopian Airlines’ fleet publications and fact sheets [5], Airbus A350-900 product information and aircraft characteristics [7,8], and Boeing aircraft documentation for the 787 and 777 families [9,10,11]. Route distances (Addis Ababa–London, Addis Ababa–Bangkok, Addis Ababa–São Paulo) were calculated using great-circle distances and cross-checked with route databases [12,13,14]. Fuel-burn per kilometer and per-passenger calculations follow ICAO carbon-accounting methodology and ICEC conventions [15]; lifecycle CO₂ conversion factors and SAF lifecycle inputs follow ICAO CORSIA default values and DOE GREET guidance [15,16]. Fuel-cost benchmarks used to derive per-passenger fuel cost estimates were taken from U.S. Gulf Coast kerosene/jet fuel spot prices and series data [17,18].
III. Results
A. Fuel Burn per Kilometer
Fuel burn per kilometer varied substantially across aircraft types. The Boeing 787-9 records the lowest specific consumption at 5.6 kg/km, reflecting its next-generation engines and composite structure. The Airbus A350-900 follows at 6.03 kg/km, remaining within global benchmarks for long-haul efficiency. The Boeing 777-200LR is the least efficient, consuming 7.1 kg/km, reflecting its design prioritization of capacity and range over efficiency, as well as the fact that it’s the oldest aircraft of the three. These results highlight the technical efficiency advantage of new-generation airframes.
B. Fuel Burn per Passenger
Adjusting for passenger load (73.4% estimated across all routes) revealed more pronounced efficiency differences. The A350-900 achieved the lowest per-passenger fuel burn at 139.6 kg/pax, followed by the 787-9 at 163.9 kg/pax. The 777-200LR required 299.1 kg/pax, more than double that of the A350-900. These results confirm that while the 787-9 excels on a per-kilometer basis, the A350’s larger seating capacity gives it a superior per-passenger performance. By contrast, the 777-200LR demonstrates a significant penalty on its flight, consistent with its optimization for range rather than efficiency.
C. Fuel Cost per Passenger
Fuel costs mirrored the efficiency rankings. On their respective flight, the A350-900 incurred the lowest per-passenger fuel cost at USD 92.1, while the 787-9 cost USD 108.1 and the 777-200LR USD 197.3. The difference between the A350-900 and the 777-200LR exceeds 100%, underscoring the financial disadvantage of deploying older long-range aircraft. These results indicate that Ethiopian Airlines’ cost competitiveness is strongly tied to the deployment of efficient widebodies such as the A350 and 787.
D. Route-Level Implications
Efficiency outcomes also varied by route characteristics. On the London service (5,913 km), the A350-900 balanced distance, payload, and capacity most effectively. On the Bangkok service (6,766 km), the 787-9 demonstrated strong per-kilometer efficiency but was less competitive on a per-passenger basis due to smaller seating capacity. On the São Paulo service (9,927 km), the 777-200LR performed poorly on both metrics, with nearly 300 kg of fuel and close to USD 200 consumed per passenger. These findings suggest that while fleet assignment is generally rational, ultra-long-haul missions using the 777-200LR impose significant penalties in both cost and emissions.
E. Sustainable Aviation Fuel Integration
The application of SAF blends reduced lifecycle CO₂ emissions across all aircraft. Using a UCO-HEFA pathway, the 100% SAF carbon intensity (0.60 kg CO₂/kg fuel) represented an 84% reduction relative to fossil Jet A-1 (3.83 kg CO₂/kg fuel) [4]. For blends, the reductions were proportional: 10% SAF achieved an 8.4% reduction, 20% achieved 16.8%, and 50% achieved 42.1%.
On the London route with the A350-900 (139.6 kg/pax fuel burn), emissions fell from 534.3 kg CO₂/pax with Jet A-1 to 489.3 kg (10%), 444.4 kg (20%), and 309.1 kg (50%). On the Bangkok route with the 787-9, the baseline of 627.5 kg CO₂/pax decreased to 574.4 kg, 521.4 kg, and 362.6 kg under the same blending ratios. On the São Paulo service with the 777-200LR, emissions declined from 1,144.0 kg CO₂/pax to 1,048.6 kg, 953.3 kg, and 662.7 kg. Absolute reductions were largest for the 777-200LR due to its high baseline consumption, whereas relative reductions were consistent across aircraft. These results show that SAF adoption provides substantial emissions benefits, though its economic implications depend on market fuel prices.
F. Aircraft Switching Scenarios
Aircraft substitution scenarios quantified efficiency trade-offs across Ethiopian Airlines’ long-haul network. On the Addis Ababa–London route (5,913 km), the baseline A350-900 consumes about 139.6 kg of fuel per passenger at a cost of USD 92.1, corresponding to 534 kg CO₂/pax. Switching to the 787-9 would raise these values to 143.4 kg/pax, USD 94.5, and 549 kg CO₂/pax, a modest +2.7% increase. By contrast, using the 777-200LR would increase consumption to 177.8 kg/pax, USD 117.4, and 681 kg CO₂/pax, equating to a 27% penalty.
On the Addis Ababa–Bangkok sector (6,766 km), the 787-9 baseline registers 163.9 kg/pax, USD 108.1/pax, and 628 kg CO₂/pax. Substituting the A350-900 reduces these values to 160.0 kg/pax, USD 105.5/pax, and 612 kg CO₂/pax, a −2.4% improvement. However, replacing it with the 777-200LR would increase fuel burn to 203.5 kg/pax, USD 134.2/pax, and 780 kg CO₂/pax, a 24% deterioration.
The Addis Ababa–São Paulo service (9,927 km) illustrates the greatest disparities. The baseline 777-200LR requires 299.1 kg/pax, USD 197.3/pax, and 1,144 kg CO₂/pax. Substitution with the A350-900 reduces the figures to 234.8 kg/pax, USD 154.8/pax, and 900 kg CO₂/pax, a 21.5% reduction. Deployment of the 787-9 yields a comparable outcome at 240.6 kg/pax, USD 158.6/pax, and 921 kg CO₂/pax, for a 19.5% saving.
IV. Discussion
A. Aircraft Selection and Efficiency
The analysis demonstrates that aircraft type is the dominant driver of fuel efficiency outcomes. On a normalized basis, the Boeing 787-9 exhibited the lowest fuel burn at 5.6 kg/km, followed by the Airbus A350-900 at 6.03 kg/km, and the Boeing 777-200LR at 7.1 kg/km. This establishes a clear hierarchy: the 787-9 outperforms the A350-900 by approximately 8%, while the 777-200LR imposes a 27% penalty relative to the 787-9 and a 17% penalty relative to the A350.
These results confirm that the A350-900 and 787-9 represent Ethiopian Airlines’ most efficient long-haul aircraft, with performance differences between them relatively small. By contrast, the 777-200LR consistently emerges as the least efficient option, underscoring its role as an aircraft of last resort, primarily suitable for ultra-long-haul missions beyond the A350’s and 787-9’s effective range.
B. Route-Level Assignment and Optimization
While normalized values establish baseline efficiency, route-level deployment illustrates the interaction between aircraft performance and sector length. On Addis–London (5,913 km), the A350-900 demonstrated favorable performance due to its larger seating capacity (348 seats) and moderate stage length, achieving a per-passenger fuel burn of 139.6 kg/pax. On Addis–Bangkok (6,766 km), the 787-9 achieved the lowest per-kilometer burn but higher per-passenger consumption (163.9 kg/pax) due to smaller seating capacity (315 seats).
The most significant inefficiency was observed on Addis–São Paulo (9,927 km), where the 777-200LR consumed 7.1 kg/km, resulting in nearly 300 kg/pax of fuel burn. In substitution scenarios, replacing the 777-200LR with the A350-900 would reduce fuel burn by 21.5% per kilometer, translating to 244 kg CO₂ savings per passenger and approximately USD 42 lower fuel cost per passenger. Replacing it with the 787-9 would yield a 19% per-kilometer improvement, though the smaller capacity limits cost competitiveness compared to the A350.
C. Cost Implications
Fuel cost outcomes strongly correlate with normalized fuel burn. On Addis–London, the A350-900’s per-passenger cost of USD 92.1 establishes a benchmark for efficient intercontinental operations. On Addis–Bangkok, the 787-9’s cost of USD 108.1 reflects a 17% increase relative to the A350, while the 777-200LR’s USD 197.3 represents a 114% increase, albeit, with longer range considered.
Switching scenarios highlight the magnitude of potential savings. On Addis–São Paulo, replacing the 777-200LR with the A350-900 would reduce per-passenger fuel costs by USD 42, generating savings of more than USD 10,000 per full flight (at a 73.4% load factor). At a frequency of 150 flights annually, this corresponds to USD 1.5 million in reduced fuel expenditure on that single route.
D. Environmental Impact and SAF Adoption
Sustainable Aviation Fuel (SAF) offers a complementary emissions reduction pathway, independent of aircraft type. Substituting fossil Jet A-1 (carbon intensity: 3.83 kg CO₂/kg fuel) with UCO-HEFA SAF blends reduced lifecycle intensity to 3.51, 3.18, and 2.22 kg CO₂/kg fuel at 10%, 20%, and 50% SAF, representing 8.4%, 16.8%, and 42.1% reductions.
When applied to route-level fuel burn, these reductions were significant. On Addis–London, the A350-900’s baseline emissions of 534 kg CO₂/pax fell to 489, 444, and 309 kg CO₂/pax across the three SAF blends. On Addis–Bangkok, the 787-9’s baseline of 627 kg CO₂/pax declined to 574, 521, and 363 kg CO₂/pax. On Addis–São Paulo, the 777-200LR’s emissions of 1,144 kg CO₂/pax dropped by nearly 500 kg per passenger at 50% SAF, the largest absolute reduction among the fleet.
These results suggest that while SAF adoption provides proportional benefits across all aircraft, its absolute impact is maximized on high-consumption aircraft and long sectors, particularly where alternatives to the 777-200LR are unavailable.
E. Integrated Strategy for Ethiopian Airlines
The combined findings indicate that Ethiopian Airlines can reduce both operating costs and emissions through a multi-pronged approach:
- Fleet Prioritization: Deploy A350-900 and 787-9 on intercontinental services, with minimal use of the 777-200LR except for missions exceeding 14,000 km.
- Route Optimization: Reassign A350 capacity to São Paulo to realize 21.5% reductions in per-kilometer fuel burn and USD 42 per-passenger cost savings, equivalent to millions of dollars annually.
- SAF Integration: Introduce SAF blends of 10–50% on high-visibility intercontinental routes, cutting emissions by 8–42% per passenger while advancing compliance with ICAO CORSIA.
- Cost–Emission Balance: Fleet optimization delivers the largest cost savings (up to USD 105 per passenger on ultra-long-haul routes), while SAF provides the largest proportional emissions reductions. Together, they form a balanced strategy.
This integrated approach provides Ethiopian Airlines with a pathway to strengthen financial resilience while positioning itself as a regional leader in sustainable intercontinental aviation.
V. Conclusion
This study assessed the operational fuel efficiency of Ethiopian Airlines’ long-haul fleet using representative flights by the Airbus A350-900, Boeing 787-9, and Boeing 777-200LR. The analysis confirms that aircraft type is the strongest driver of efficiency outcomes. The A350-900 achieved the lowest per-passenger fuel burn (139.6 kg/pax) and cost (USD 92.1/pax), followed by the 787-9 (163.9 kg/pax, USD 108.1/pax). The 777-200LR was markedly less efficient at 299.1 kg/pax and USD 197.3/pax, showing a large difference on each different flight, even after considering the range difference.
Route-level findings emphasize the importance of aligning aircraft deployment with sector characteristics. On Addis–London (5,913 km), the A350 balanced low per-kilometer burn (6.03 kg/km) with high seating capacity (348 seats), achieving optimal efficiency. On Addis–Bangkok (6,766 km), the 787-9 achieved the lowest per-kilometer burn (5.6 kg/km) but underperformed on a per-passenger basis due to smaller capacity. On Addis–São Paulo (9,927 km), the 777-200LR’s high burn (7.1 kg/km) and nearly 300 kg/pax consumption highlighted its inefficiency. Substitution scenarios showed that replacing the 777-200LR with the A350-900 would cut per-passenger fuel burn and cost by ~21.5%, and reduce emissions by 244 kg CO₂/pax, equivalent to over 100 metric tons per flight at full load.
Sustainable Aviation Fuel (SAF) integration provided a complementary emissions reduction pathway. Lifecycle modeling demonstrated that blending UCO-HEFA SAF with Jet A-1 reduced carbon intensity from 3.83 kg CO₂/kg fuel (baseline) to 3.51, 3.18, and 2.22 kg CO₂/kg fuel at 10%, 20%, and 50% blends, corresponding to 8.4%, 16.8%, and 42.1% reductions. Applied to route-level data, the A350’s emissions fell from 534 kg CO₂/pax (baseline) to 489, 444, and 309 kg CO₂/pax, while the 777-200LR achieved reductions of up to 481 kg CO₂/pax at 50% SAF. Although SAF adoption entails higher direct fuel costs, it enables compliance with ICAO CORSIA and contributes to international net-zero aviation targets.
In conclusion, Ethiopian Airlines can enhance both economic and environmental performance through an integrated three-part strategy:
- Fleet Prioritization: Deploy A350-900 and 787-9 on intercontinental services while limiting 777-200LR use to missions beyond their effective range.
- Route Optimization: Match aircraft to sector length and demand, with emphasis on reallocating A350 capacity to São Paulo, where savings exceed USD 42/pax and 244 kg CO₂/pax.
- SAF Adoption: Implement SAF blends of 10–50% on flagship intercontinental routes to achieve per-passenger reductions of 45–480 kg CO₂, enhancing regulatory compliance and sustainability branding.
This combined approach balances financial resilience, operational efficiency, and emissions reduction, positioning Ethiopian Airlines as a regional leader in sustainable long-haul aviation while reinforcing its competitiveness in a fuel-volatile global market.
Appendix
References
- Flight Center Architects, “Aviation Factsheet Sources,” FCA. [Online]. Available: https://fcarchitects.org/aviation-factsheet-sources Accessed: Aug. 2025.
- International Energy Agency (IEA), “Transport CO₂ Emissions,” IEA. [Online]. Available: https://www.iea.org/energy-system/transport Accessed: Aug. 2025.
- International Air Transport Association (IATA), “Unveiling the Biggest Airline Costs,” IATA Knowledge Hub. [Online]. Available: https://www.iata.org/en/publications/newsletters/iata-knowledge-hub/unveiling-the-biggest-airline-costs/ Accessed: Aug. 2025.
- Ethiopian Airlines, “Annual Performance Report 2023–24,” Ethiopian Airlines (Corporate). [Online]. Available: https://corporate.ethiopianairlines.com/docs/default-source/annual-performance-reports/et-annual-report-2023-24.pdf?sfvrsn=1786168e_2 Accessed: Aug. 2025.
- Ethiopian Airlines, “Our Fleets.” [Online]. Available: https://corporate.ethiopianairlines.com/AboutEthiopian/OurFleets Accessed: Aug. 2025.
- Ethiopian Airlines, “Fact Sheet – February 2025.” [Online]. Available: https://corporate.ethiopianairlines.com/docs/default-source/ethiopian-factsheet/ethiopian-fact-sheet-february-2025.pdf.
- Airbus, “A350-900,” Airbus Commercial Aircraft. [Online]. Available: https://aircraft.airbus.com/en/aircraft/a350/a350-900 Accessed: Aug. 2025.
- Airbus, “A350-900 / A350-1000 — Aircraft Characteristics,” Airbus Commercial Aircraft, Feb. 2023. [Online]. Available: https://aircraft.airbus.com/sites/g/files/jlcbta126/files/2023-02/Airbus-Commercial-Aircraft-AC-A350-900-1000.
- Boeing, “777 Family Overview,” Boeing Commercial Airplanes. [Online]. Available: https://www.boeing.com/commercial/777 Accessed: Aug. 2025.
- Boeing Commercial Airplanes, “777-200LR / 777-300ER — Airport Characteristics (ACAP).” [Online]. Available: https://www.boeing.com/content/dam/boeing/boeingdotcom/commercial/airports/acaps/777_2lr_3er_f.
- Boeing Commercial Airplanes, “787 Airplane Characteristics for Airport Planning (ACAP),” Mar. 2018. [Online]. Available: https://www.boeing.com/content/dam/boeing/boeingdotcom/commercial/airports/acaps/787.pdf Accessed: Aug. 2025.
- AirmilesCalculator, “Distance from Addis Ababa to London Heathrow (ADD–LHR).” [Online]. Available: https://www.airmilescalculator.
- AirmilesCalculator, “Distance from Addis Ababa to Bangkok Don Mueang (ADD–DMK).” [Online]. Available: https://www.airmilescalculator.
- AirmilesCalculator, “Distance from Addis Ababa to São Paulo GRU (ADD–GRU).” [Online]. Available: https://www.airmilescalculator.
- International Civil Aviation Organization (ICAO), “CORSIA Default Life Cycle Emissions Values for Eligible Fuels,” Jun. 2025. [Online]. Available: https://www.icao.int/sites/default/files/environmental-protection/CORSIA/Documents/CORSIA%20Eligible%20Fuels/ICAO%20document-06-Default-Life-Cycle-Emissions-June-2025.pdf Accessed: Sep. 2025.
- U.S. Department of Energy, “GREET Model Guidance for SAF Lifecycle Calculations,” GREET/DOE, 2024. [Online]. Available: https://www.energy.gov/ Accessed: Sep. 2025.
- U.S. Energy Information Administration (EIA), “Kerosene-Type Jet Fuel Spot Price (U.S. Gulf Coast),” EIA. [Online]. Available: https://www.eia.gov/dnav/pet/hist/eer_epjk_pf4_rgc_dpgD.html Accessed: Aug. 2025.
- Federal Reserve Bank of, St. Louis (FRED), “Kerosene-Type Jet Fuel Prices (AJFUELUSGULF).” [Online]. Available: https://fred.stlouisfed.org/series/AJFUELUSGULF Accessed: Aug. 2025. [Google Scholar]
Figure 1.
Fuel burn per kilometer.
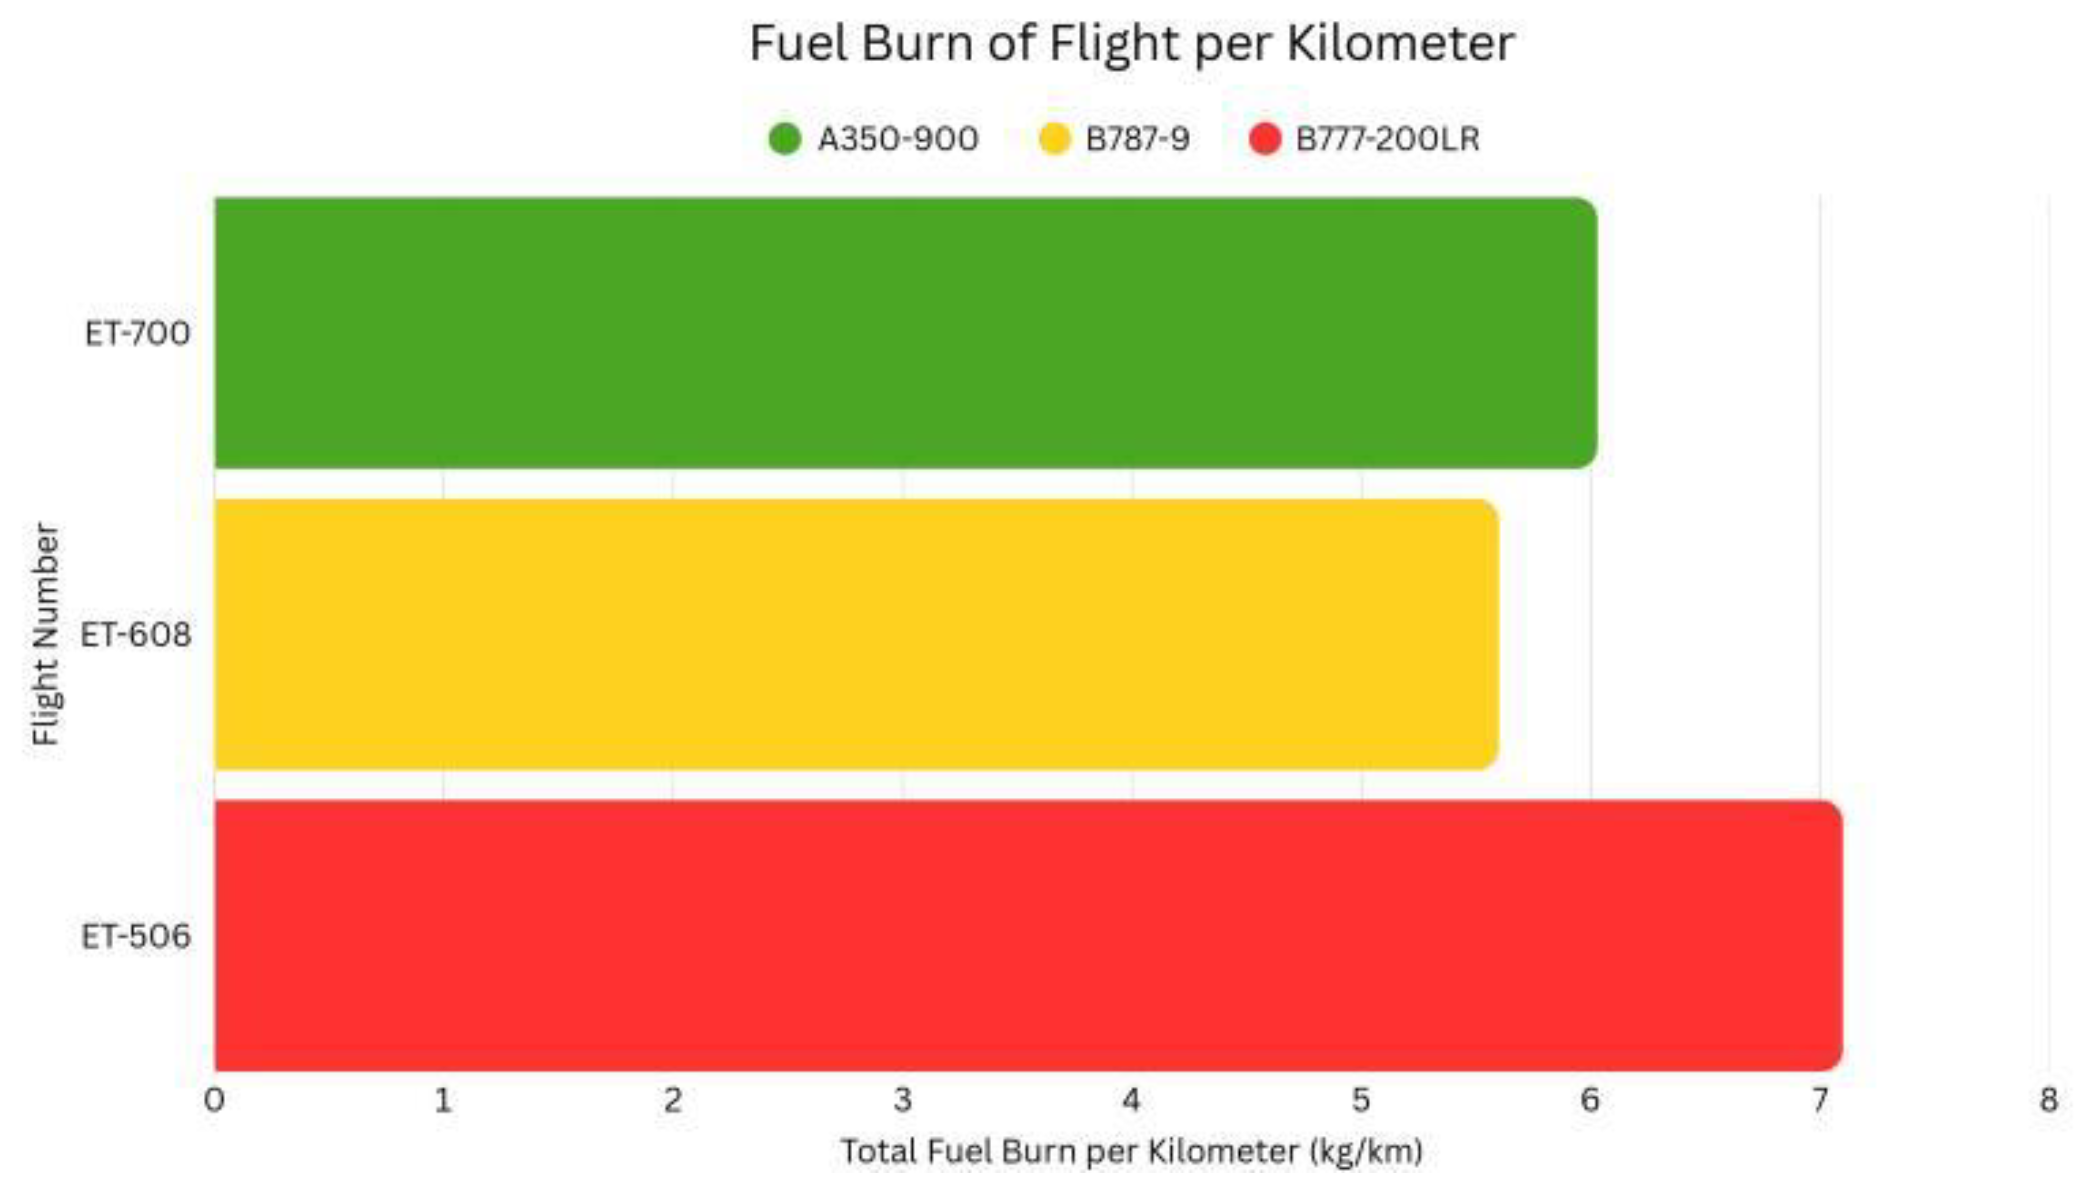
Figure 2.
Fuel burn per passenger.
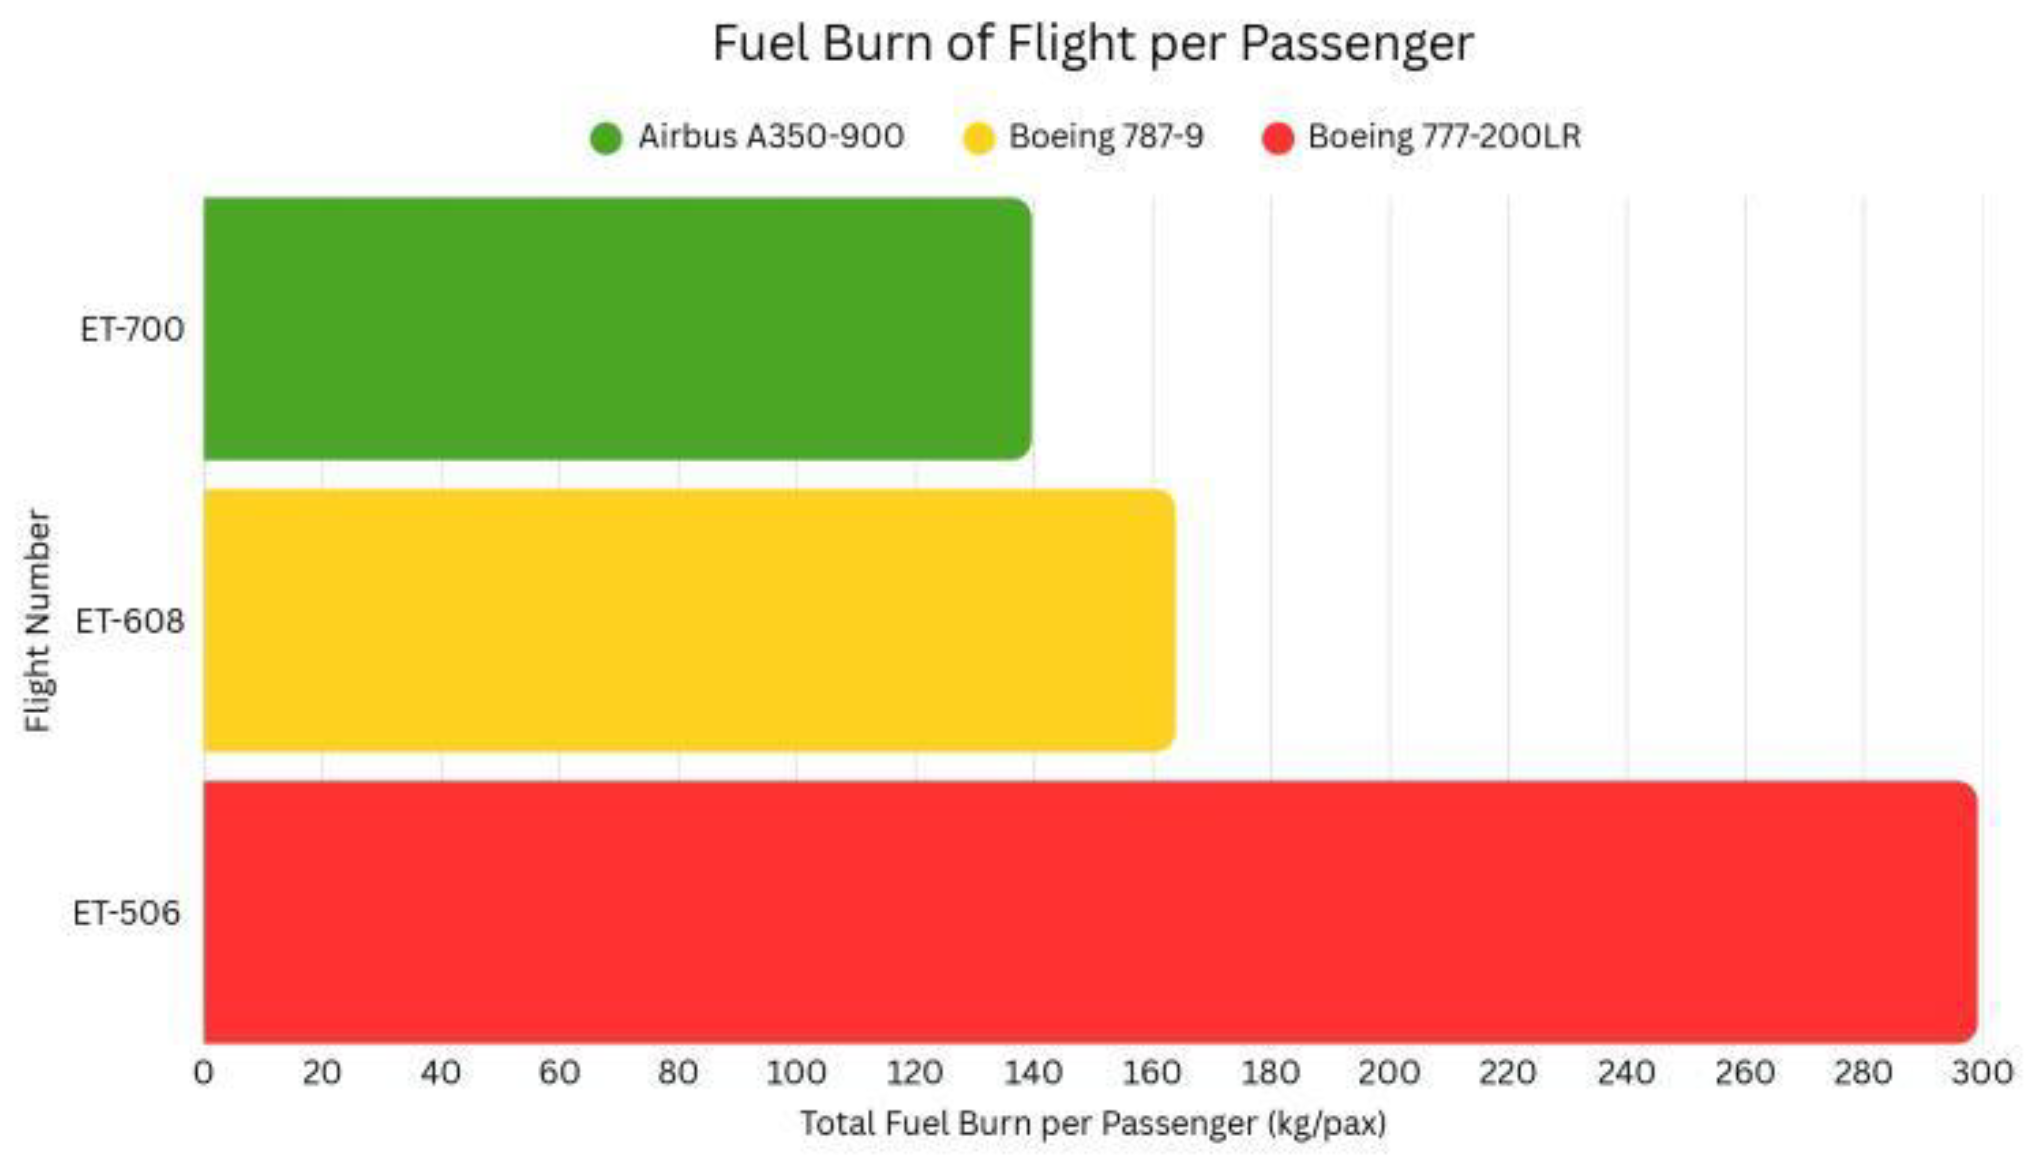
Figure 3.
Fuel cost per passenger.
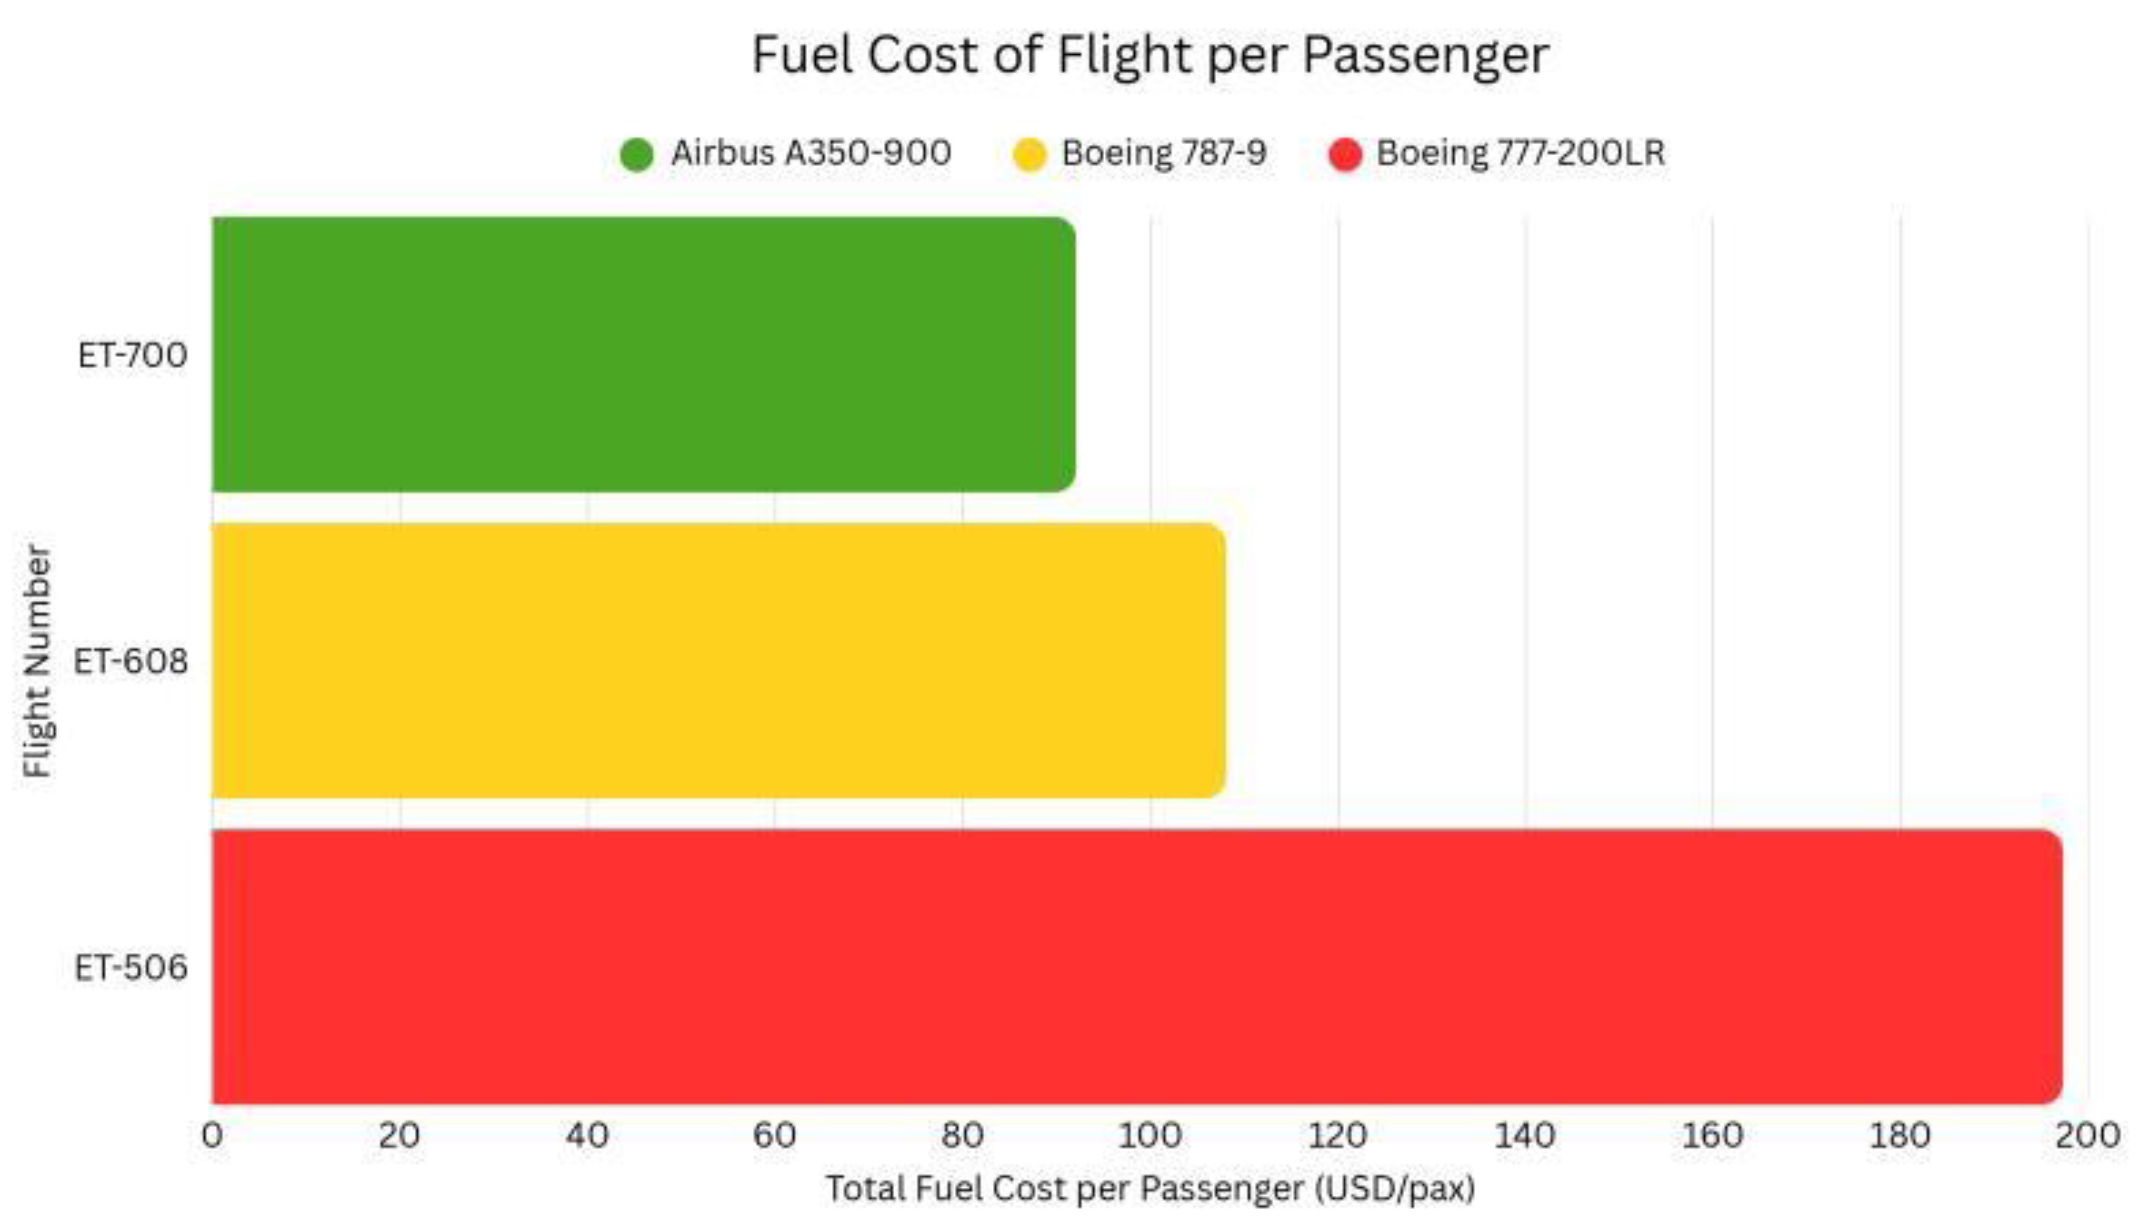
Figure 4.
CO₂ per passenger with SAF.
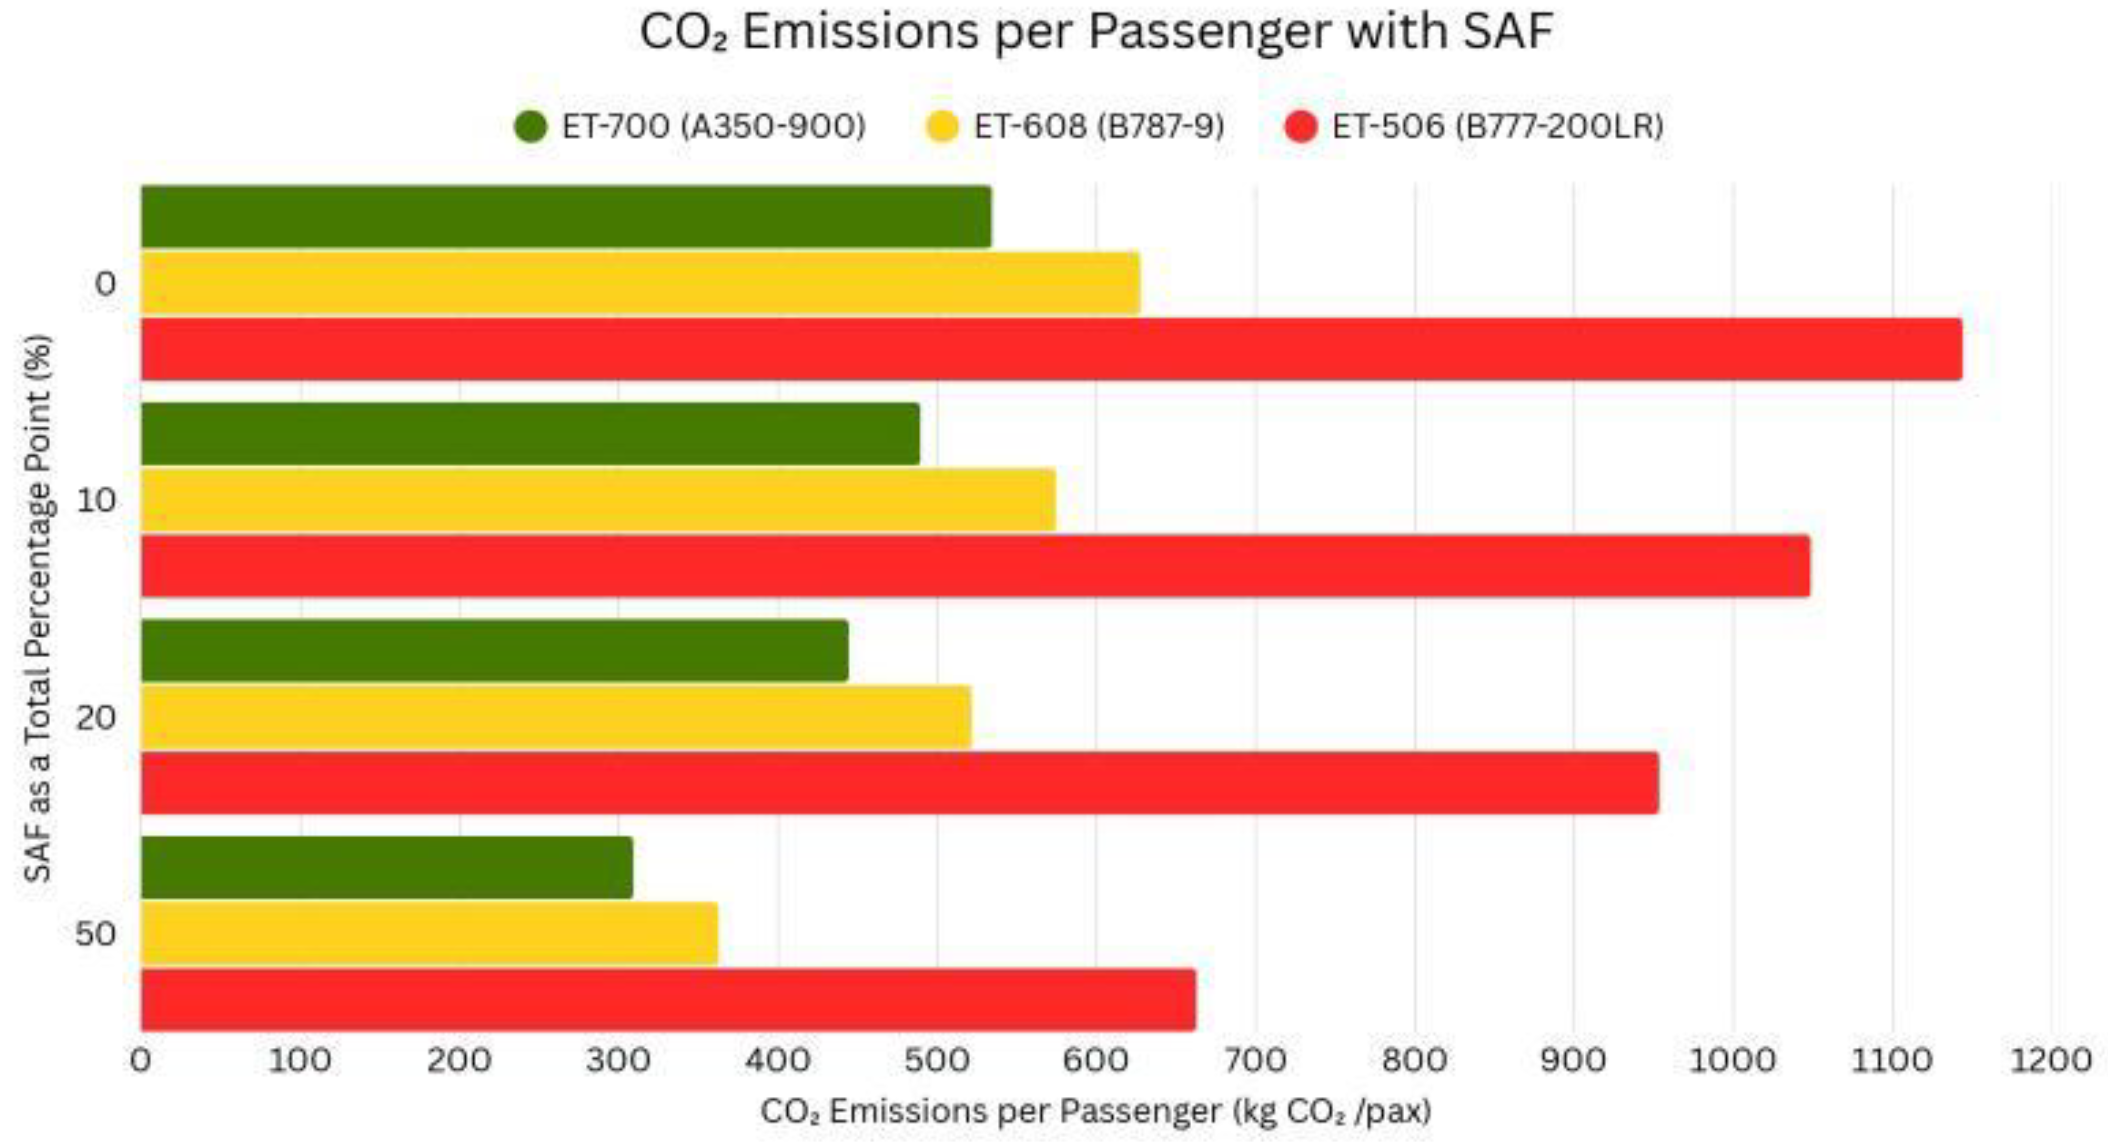

Table 1.
Fuel burn and cost performance of selected Ethiopian Airlines long-haul flights.
| Flight | Date Used | Route on Date | Aircraft | Distance (km) | Fuel Burn (kg) | Fuel Cost (USD) | Seats | Range (km) | Fuel Burn (kg/km) | Est. Load Factor (%) | Est. PAX | Fuel Burn (kg / PAX) | Est. Cost (USD / PAX) | |
| ET-700 | 8/20/2025 | ADD → LHR | Airbus A350-900 | 5,913.50 | 35,658.4 | 23,514.6 | 348 | 15,327 | 6.03 | 73.4 | 255 | 139.6 | 92.06 | |
| ET-608 | 8/20/2025 | ADD → BKK | Boeing 787-9 | 6,766.00 | 37,889.6 | 24,985.9 | 315 | 14,140 | 5.6 | 73.4 | 231 | 163.9 | 108.07 | |
| ET-506 | 8/20/2025 | ADD → GRU | Boeing 777-200LR | 9,927.00 | 70,481.7 | 46,478.4 | 321 | 15,743 | 7.1 | 73.4 | 236 | 299.1 | 197.27 | |
Table 2.
Aircraft switch scenarios and their respective perfomance.
| Aircraft / Route | Fuel Burn per PAX (kg) | Baseline (Jet A-1, 3.827 kg CO₂/kg) | 10% SAF Blend (3.505 kg CO₂/kg) | 20% SAF Blend (3.182 kg CO₂/kg) | 50% SAF Blend (2.215 kg CO₂/kg) |
| A350-900 (ADD → LHR) | 139.6 | 534.3 kg CO₂ | 489.3 kg CO₂ (−8.4%) | 444.4 kg CO₂ (−16.8%) | 309.1 kg CO₂ (−42.1%) |
| B787-9 (ADD → BKK) | 163.9 | 627.5 kg CO₂ | 574.4 kg CO₂ (−8.4%) | 521.4 kg CO₂ (−16.8%) | 362.6 kg CO₂ (−42.2%) |
| B777-200LR (ADD → GRU) | 299.1 | 1,144.0 kg CO₂ | 1,048.6 kg CO₂ (−8.4%) | 953.3 kg CO₂ (−16.8%) | 662.7 kg CO₂ (−42.1%) |
Table 3.
Per-Passenger CO₂ emissions under different SAF blend scenarios.
| Route (km) | Baseline AC | Baseline Fuel/PAX (kg) | Baseline Cost/PAX (USD) | Alternative AC | Alt AC Fuel Burn per Kilometer (kg/km) | New Fuel (kg) | Est. PAX | New Fuel/PAX (kg) | New Cost/PAX (USD) | Δ Fuel & Cost/PAX (%) |
| ADD–LHR (5913.5) | A350-900 | 139.6 | 92.06 | B787-9 | 5.6 | 33,115.60 | 231 | 143.4 | 94.53 | 2.70% |
| ADD–LHR (5913.5) | A350-900 | 139.6 | 92.06 | B777-200LR | 7.1 | 41,985.90 | 236 | 177.8 | 117.4 | 27.40% |
| ADD–BKK (6766) | B787-9 | 163.9 | 108.07 | A350-900 | 6.03 | 40,799.00 | 255 | 160 | 105.52 | −2.4% |
| ADD–BKK (6766) | B787-9 | 163.9 | 108.07 | B777-200LR | 7.1 | 48,038.60 | 236 | 203.5 | 134.21 | 24.20% |
| ADD–GRU (9927) | B777-200LR | 299.1 | 197.27 | A350-900 | 6.03 | 59,859.80 | 255 | 234.8 | 154.84 | −21.5% |
| ADD–GRU (9927) | B777-200LR | 299.1 | 197.27 | B787-9 | 5.6 | 55,591.20 | 231 | 240.6 | 158.55 | −19.5% |
Disclaimer/Publisher’s Note: The statements, opinions and data contained in all publications are solely those of the individual author(s) and contributor(s) and not of MDPI and/or the editor(s). MDPI and/or the editor(s) disclaim responsibility for any injury to people or property resulting from any ideas, methods, instructions or products referred to in the content. |
© 2025 by the authors. Licensee MDPI, Basel, Switzerland. This article is an open access article distributed under the terms and conditions of the Creative Commons Attribution (CC BY) license (http://creativecommons.org/licenses/by/4.0/).
Copyright: This open access article is published under a Creative Commons CC BY 4.0 license, which permit the free download, distribution, and reuse, provided that the author and preprint are cited in any reuse.


